mine detection using swath bathymetric sonars: tools and techniques · · 2014-04-25mine...
TRANSCRIPT

© Mosaic Hydrographic 1 of 14 Presented at Services (Canada) Ltd 2006 UDT-Pacific 2006
Mine Detection Using Swath Bathymetric Sonars: Tools and Techniques
LCdr (Ret’d) Mike B. Brissette
Mosaic Hydrographic Services (Canada) Ltd Victoria, BC, Canada V8Z 7A2 [email protected]
Abstract Swath bathymetric sonars such as multibeam echosounders and interferometric sidescan sonars are used primarily to produce bathymetric products such as charts and 3D modelled surfaces. The latest generations of these sonars have yet to realize their full potentials when it comes to detecting small objects such as mine like objects. This paper will first review the characteristics and capabilities of interferometric sidescan sonars and multibeam echosounders in order to highlight their strengths and weaknesses with respect to small object detection, and secondly, data from actual field surveys using each of each of these sonars will be examined in order to illustrate their small object detection efficacy. Next, this paper will present recommended techniques to optimize the probability of detection using each of these systems. These techniques include pre-survey preparations, survey execution, and post processing techniques such as mosaicking, co-registered imagery with bathymetry, and temporal imagery comparison. Finally conceptual 2D and 3D “Gapless” sidescan mine hunting sonars will be introduced, based on currently available technology, in order to illustrate that significant improvements in the Mine Hunting process are available.
I. Introduction Naval Mine Counter Measures (MCM), more specifically Mine Hunting (MH), have failed to capitalize on some of the dramatic technological advances that seafloor mapping sonars have achieved in the last five to ten years. This failure has kept the process of running sidescan sonar surveys inefficient, wasting the time of both personnel and platform resources. The reasons for this oversight are varied, but one predominant factor is the very nature of the sonars themselves. The advanced capabilities and sophistication of modern seafloor mapping sonars has resulted in the need for highly trained and specialized operators, normally hydrographers, which is incompatible with the modern Mine Warfare (MW) personnel (operator) model. Although today’s sailors are motivated and intelligent, the amount of time and resources required to make an operator proficient on modern seafloor mapping sonars is measured in years which, by far, exceeds the time a specific operator is usually performing the MH function. In order for new, more capable technology to be successfully assimilated and fully exploited in a MH role, the Human-Machine Interface (HMI) must be straightforward and intuitive.

© Mosaic Hydrographic 2 of 14 Presented at Services (Canada) Ltd 2006 UDT-Pacific 2006
Interferometric and Multibeam Echosounders (MBES) are two such seafloor mapping sonars whose capabilities are vast, yet underutilized in mine hunting due to the lack of development of a workable configuration and HMI that meets the needs of the mine hunting task while not overwhelming the operator. This paper will first discuss modern Interferometric and MBES sonar technologies in order to highlight their capabilities, limitations and perceived potentials in the field of MH. General guidelines and techniques will be discussed highlighting how these technologies can be better utilized in order to be more effective MH sonars. Finally this paper will discuss 2D and 3D conceptual sonar configurations that would increase the likelihood of detection and decrease the time required to search a given threat area, all while making minimal changes to the currently accepted mine hunting HMI thus requiring little or no additional operator training. Further, these configurations would record volumes of data in the background, untouched by the operator that could then be fully exploited by off-line post-processing facilities employing specially trained personnel such as hydrographers and oceanographers. These conceptual configurations can be put into practice today using Commercial Off-The-Shelf (COTS) technology and integrated into a variety of platforms including surface vessels and Autonomous Underwater Vehicles (AUVs).
II. Sidescan Sonars Overview: Sidescan sonar technology is mature, proven and effective in the MH field. The most modern and efficacious sidescan sonars in use by MH organizations today take advantage of using multiple focussed beams. Multiple beams allow for a greater distance travelled between successive pings and hence a greater overall survey speed. The beam focussing results in a fixed resolution cell, in both the across-track and along-track directions, giving the operator a much greater probability of detecting a Mine Like Object (MLO).
Figure 1a L3-Klein 5500 Sidescan Sonar Figure 1b Manta and RockAn Mine Shapes
Illuminated by an L-3 Klein 5500
Strengths: Sidescan sonars’ strengths in MH operations are primarily those of resolution and geometry. A modern sidescan sonar such as the Klein 5500 has focussed resolution cells of 20 cm by 10 cm, thereby clearly illuminating small targets such as the Manta and

© Mosaic Hydrographic 3 of 14 Presented at Services (Canada) Ltd 2006 UDT-Pacific 2006
RockAn mines (Figure 1). A sidescan sonar’s ability to illuminate a target is complemented by the geometry of the sonar transducer relative to the seafloor and the target itself. Due the relative altitude of the sonar over the seafloor (10%-15% of sonar range), targets standing proud of the seafloor cause a shadow zone on the side away from the transducer. This shadow is easily notice by the MH operator, leading to a greater probability of detection of a MLO. However, this advantageous geometry only starts from a range roughly equal to the altitude and continues to the maximum range. Inside this minimum range we see a significant limitation. Limitations: All sidescan sonars, regardless of their technological sophistication, suffer from an inability to sufficiently illuminate targets within the “nadir-gap” area. This is the part of the seafloor directly below the transducers that, due to the geometry of the sonar configuration, is under sampled. This under sampling normally extends on either side of the sonar to a distance roughly equal to the altitude of the sonar above the seafloor. The circled areas in the two sidescan images in Figure 2 represent the same geographic position. The 3m by 1m by 0.8m object is clearly seen in the far range of Line 1 but entirely obscured in Line 2.
Figure 2 – Nadir-Gap Example

© Mosaic Hydrographic 4 of 14 Presented at Services (Canada) Ltd 2006 UDT-Pacific 2006
Where detecting MLOs is the aim of the mission, the nadir-gap in one survey line must be illuminated by the adjacent survey line such that no small objects are lost in either line’s nadir-gap. The overlap generally required is 60% to 75% between adjacent lines. Figure 3 shows an “efficient” survey pattern where lines are run in pairs by a sidescan sonar in order to achieve full illumination of an area including all nadir-gaps. Were it not for the nadir-gaps the six survey lines in Figure 3 could
be reduced to four. Any sidescan sonar would significantly benefit from eliminating the nadir-gap both in terms of time savings and the reduction of the number of passes a sensor must make over a potentially destructive target. The time savings benefit is especially poignant in time-critical operations and also AUV operations where battery capacity frequently determines mission length. A second limitation of (conventional) sidescan sonars is their inability to determine the bathymetry of the seafloor they illuminate. Conventional sidescan sonars make a “flat earth” assumption and as such, valuable information about the nature (morphology) of the seafloor is unavailable to the operator performing mine detection. This incomplete picture forces the operator to rely on experience, intuition, and/or luck to speculate whether the targets presented on-screen are of interest.
III. Multibeam Echosounders Overview: Multibeam Echosounders (MBES), also known as Multibeam Bathymetric Sonars, have revolutionized the field of hydrography in the last ten years. MBES’ generate multiple soundings for every ping rather than the single sounding of traditional echosounders. Figures 4a and 4b illustrate the difference between the two sonars. MBES’ use two or more perpendicular transducer arrays: the first to transmit a narrow along-track and broad across-track beam and the second to form narrow across-track and broad along-track beams. The intersection of the single transmit beam with the multiple receive beams forms discrete “footprints” on the seafloor, each with their own sounding and amplitude backscatter values.
Figure 3 – Efficient Survey Pattern Covering Nadir-Gaps Image courtesy Chesapeake Technologies, Inc

© Mosaic Hydrographic 5 of 14 Presented at Services (Canada) Ltd 2006 UDT-Pacific 2006
Figure 4a – Single Beam Echosounder Coverage Figure 4b – Multibeam Echosounder Coverage Images Courtesy of Ocean Mapping Group, University of New Brunswick
Strengths: High resolution MBES’ (beamwidths of 1 degree or less), are very capable of repeatable MLO detection. A recent survey off of the coast of Martha’s vineyard found that the Reson 8125 “… combined with 3D visualization techniques provided realistic looking images of both the instrumented mines and mine shapes (including a Manta and a RockAn shape) that were dimensionally correct and enabled unambiguous identification of the mine type.”[1]. A survey in 2001 off of Whidbey Island, WA also illustrated the efficacy of the Reson 8125 in illuminating MLOs and actual Manta and RockAn mine shapes. Figures 5a (rotated 3D image) and 5b (sun-illuminated bathymetry) show that the resolution of the sonar (for that depth) allows the mine shapes to be easily delineated.
Figure 5a – 3D Manta Mine Shape illuminated by
Reson 8125 Image courtesy Reson, Inc.
Figure 5b – RockAn Mine Shape in a boulder field illuminated by Reson 8125
Limitations: Directly comparing amplitude backscatter imagery from a MBES with that of a sidescan sonar shows that MLOs are not illuminated sufficiently to be able to detect

© Mosaic Hydrographic 6 of 14 Presented at Services (Canada) Ltd 2006 UDT-Pacific 2006
a mine-like object using the MBES amplitude backscatter imagery alone[2]. Secondly, the angular resolution of a MBES decreases the further off nadir the receive beam is steered resulting in decreased resolution in the outer swath. A third and more significant limitation of a MBES is the swath width of the system in very shallow water (less the 5m). MBES’ can only illuminate an overall swath three times the depth of water below the sonar head whereas sidescan sonars typically can illuminate a 12 times altitude swath[3]. Naval Very Shallow Water (VSW) Operations using a MBES are very time consuming if 100 percent coverage is desired. The final limitation discussed here is the “operator friendliness” of MBES’. In short, these sonars with the currently available operator interfaces require highly trained and experienced personnel. The standard Navy training model for MH operators does not allow for the depth of training and experience required to maximize the MH capabilities of these sonars.
IV. Interferometric Sidescan Sonars Overview: Interferometric sonars can be simplistically described as sidescan sonars with the added ability to measure bathymetry. Like conventional sidescan sonars, interferometric sonars measure the intensity of the reflected acoustic pulse at a large number of range intervals; however, interferometric sonars also estimate the arrival angle of returning signals by measuring the differential phase in multi-element arrays[4]. This ability to estimate the arrival angle gives interferometric sonars the ability to determine depths (bathymetry) positioned simultaneously with the corresponding intensity value.
Figure 6a – Conventional Sidescan Image of Oil Rig Scours

© Mosaic Hydrographic 7 of 14 Presented at Services (Canada) Ltd 2006 UDT-Pacific 2006
Figure 6b – Interferometric Bathymetry of same Oil Rig Scours
Figure 6c – Conventional Sidescan Overlaid on Bathymetry Images Courtesy of Teledyne-Benthos
The images in Figure 6 are the footprints of an oil rig that was previously resting on the seafloor and illuminated using a Teledyne-Benthos C3D Interferometric Sidescan Sonar. Figure 6a is a conventional sidescan sonar image where the bathymetry of the seafloor is unknown; however, the information about the objects and geology can be inferred by the intensity of the returns, patterns and shadows. Figure 6b is the co-registered bathymetry that was collected by the C3D using the same acoustic pulses that created the
© Mosaic Hydrographic 8 of 14 Presented at Services (Canada) Ltd 2006 UDT-Pacific 2006
conventional 2D image. Figure 6c marries the two previous images with the sidescan imagery draped over the bathymetry and then the entire image is rotated and tilted such that the relief of the footprints may be seen.
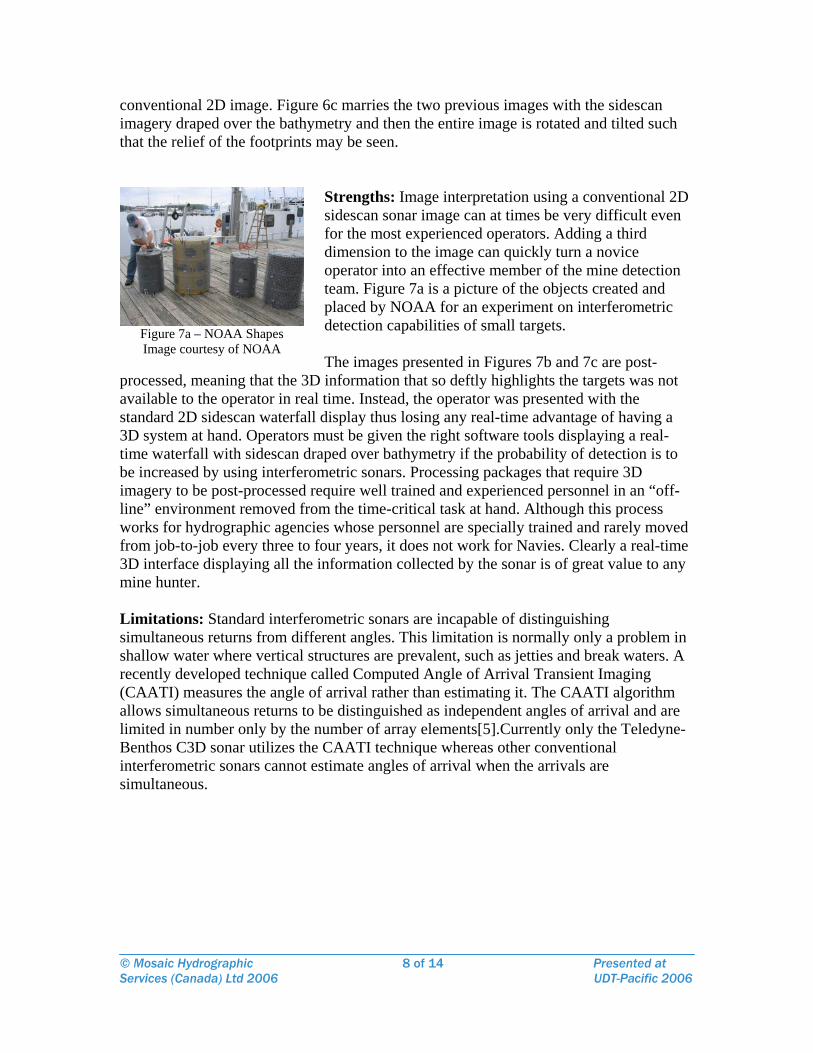
Strengths: Image interpretation using a conventional 2D sidescan sonar image can at times be very difficult even for the most experienced operators. Adding a third dimension to the image can quickly turn a novice operator into an effective member of the mine detection team. Figure 7a is a picture of the objects created and placed by NOAA for an experiment on interferometric detection capabilities of small targets. The images presented in Figures 7b and 7c are post-
processed, meaning that the 3D information that so deftly highlights the targets was not available to the operator in real time. Instead, the operator was presented with the standard 2D sidescan waterfall display thus losing any real-time advantage of having a 3D system at hand. Operators must be given the right software tools displaying a real-time waterfall with sidescan draped over bathymetry if the probability of detection is to be increased by using interferometric sonars. Processing packages that require 3D imagery to be post-processed require well trained and experienced personnel in an “off-line” environment removed from the time-critical task at hand. Although this process works for hydrographic agencies whose personnel are specially trained and rarely moved from job-to-job every three to four years, it does not work for Navies. Clearly a real-time 3D interface displaying all the information collected by the sonar is of great value to any mine hunter. Limitations: Standard interferometric sonars are incapable of distinguishing simultaneous returns from different angles. This limitation is normally only a problem in shallow water where vertical structures are prevalent, such as jetties and break waters. A recently developed technique called Computed Angle of Arrival Transient Imaging (CAATI) measures the angle of arrival rather than estimating it. The CAATI algorithm allows simultaneous returns to be distinguished as independent angles of arrival and are limited in number only by the number of array elements[5].Currently only the Teledyne-Benthos C3D sonar utilizes the CAATI technique whereas other conventional interferometric sonars cannot estimate angles of arrival when the arrivals are simultaneous.
Figure 7a – NOAA Shapes Image courtesy of NOAA

© Mosaic Hydrographic 9 of 14 Presented at Services (Canada) Ltd 2006 UDT-Pacific 2006
Finally, interferometric sidescan sonars suffer from the same geometric limitation as conventional sidescan sonars, specifically the “nadir-gap”. A nadir-gap also exists in the bathymetry from interferometric sidescan sonars but to a lesser extent than the sidescan image. Similar to sidescan sonars, a 60%-75% overlap is required between adjacent lines. If the nadir-gap could be eliminated then the efficiency of the entire operation would increase drastically. The interferometric sidescan sonar has the potential to revolutionize real-time sidescan image interpretation from a “black art” to a straightforward and unsophisticated function.
V. Optimizing Detection Using Swath Bathymetry
When dealing with swath bathymetric sonars and MH there are some techniques that can be used to aid in optimizing MLO detection which are briefly discussed below. Pre-survey: Sonar Resolution: The maximum range of the MLOs of interest from the sonar face and the minimum target size must be determined so that the beam footprint of the sonar may be assessed. The sonar footprint should fit within the footprint of the smallest target at the maximum range in order for any chance of detection to exist. The smaller the footprint of the sonar beam, as compared to the object, the greater the probability of detection. Decreased beamwidths allow for either deeper detection of the same object or detection of smaller objects at the same depth[6]. Post-processing: Gridding: The standard hydrographic practice in post-processing a survey consisting of multiple overlapping lines of data is to clean the data for anomalies, apply tides, and then take the individual soundings from each ping and combine them with other soundings by either averaging or taking the shoallest sounding of all soundings falling in a particular grid cell. The resultant product is a 2D matrix with Z (depth) values
Figure 7b – C3D Bathymetry of NOAA Targets
Figure 7c – Conventional Sidescan of NOAA Targets Overlaid on C3D Bathymetry
Images Courtesy of Teledyne-Benthos

© Mosaic Hydrographic 10 of 14 Presented at Services (Canada) Ltd 2006 UDT-Pacific 2006
populating the cells. This grid may then be used to create 2D maps or 3D surfaces (Digital Terrain Models (DTM)) which represent the seafloor. When attempting object detection with post-processed bathymetry, gridding more than one line per individual mapsheet should be avoided. Small errors in horizontal and vertical position can cause the same object detected on different passes to fall into different grid cells. The result is that the gridded Z value for the true position of the object does not reflect the calculated value. If the soundings from different passes were averaged, then a smaller Z value spread over multiple cells may occur or multiple cells may have the actual Z value thereby making the object appear bigger than it really is; possibly resulting in an object being dismissed as an MLO due to its size being too large. Figure 8 shows sun-illuminated bathymetry of two sets of objects ensonified by a Kongsberg EM3000 MBES at a distance of 23 meters from the transducer face. The larger objects are a set of three identical steel rings that are 5 meters in diameter, 0.9 meters proud of the seafloor, hollow in the centre with a hex-shaped “skirt” around the outside of the rings extending a maximum of 0.5 meters from the outside of the rings themselves. The smaller objects are a set of 3 steel drums 1.2 meters in diameter and averaging 0.7 meters proud of the seafloor.
Figure 8: EM3000 Target Averaging (Sun-illuminated bathymetry) Line 1 of Figure 8 shows a clear picture of the rings with the drums appearing as bumps, which would likely be ignored by an operator. The rings in Line 2 are less defined but the drums are more prominent than in Line 1. When the two lines are combined by averaging the bathymetric heights, the rings are less defined than in Line 1 and the drums are not detectable. If a single combined image was presented to an MH operator, then the drums would be lost. If the individual lines were examined by the operator, the drums would likely be identified (in Line 2). To guarantee that the “loss” of an object, due to averaging does not occur (such as the drums in Figure 8) the method of selecting the shoallest sounding within each grid cell can be employed. The potential for the creation of a false object exaggerated in size however exists. If the horizontal positioning accuracy is near or greater than the desired grid resolution then it is likely that an object ensonfied in multiple passes will appear in more than one grid cell. This effect causes an object to appear greater in size than the

© Mosaic Hydrographic 11 of 14 Presented at Services (Canada) Ltd 2006 UDT-Pacific 2006
object being hunted and may cause the MH operator to dismiss it if it falls outside the parameters of the object of interest. Regardless of whether averaging or shoalling is selected, it is the author’s opinion that gridding should not be undertaken when performing MH. Multiple, non-gridded, lines give multiple opportunities for single MLOs to be detected at their original size. Subtractive (Temporal) Differencing: Temporal differencing may be performed on 2D imagery (sun-illuminated bathymetry) or on 3D surfaces (DTMs). Quickly flashing a 2D “after” picture on top of a “before” picture (intervals from 0.1sec to 1sec) of sun illuminated bathymetry allows the human eye to pick up anomalies such as the addition of an MLO to the “after” picture. The Canadian Navy has had great success using this flashing technique with sidescan imagery. Figure 9a shows “before” and “after” images of the same area where a RockAn mine was introduced in the “after” image. Small misalignments in the positioning resulted in anomalies in the final image that were not the RockAn mine, but objects that had been detected in both passes. Regardless, using the “flashing” technique an operator is able to identify the newly introduced object and dismiss baseline objects not eliminated in the differencing process. The 3D resultant images in Figure 9b have four objects proud of the seafloor, any one of which may be RockAn. As well, heave errors in the motion sensing unit contributed to the large “dip” seen in the resultant surface. Despite using an extra dimension the 3D image is not as effective as the 2D images being “flashed”. The author has animated GIF images demonstrating the flashing technique available on request.
Figure 9a – 8125 sun-illuminated bathymetry of before, after the introduction of a RockAn mine and the
resultant difference of the two surfaces.

© Mosaic Hydrographic 12 of 14 Presented at Services (Canada) Ltd 2006 UDT-Pacific 2006
Figure 9b – Two different 3D rotations of the resultant differenced surface in 9a above
VI. Conceptual “Gapless” MH Sidescan Sonars The synergy of sidescan sonars (conventional or interferometric) combined with MBES is not a new idea[7]. The ability to fill the gap thus saving significant time in achieving 100 percent full resolution coverage is highly desirable in MH operations both ship-borne and especially in AUV operations. L3-Klein has developed the System 7180 sonar that uses a MBES to “fill the gap”. This sonar is not suitable for MH operations due to the overall resolution of the system which was designed for fisheries research work and its complexity. This system is intended for use by highly trained hydrographic personnel with many years of education and training; asking an MH operator to run a sonar this complex is not a reasonable expectation. Two conceptual Gapless MH sidescan sonars are discussed below. There are many design and engineering considerations to building such units however it is not the purpose of this paper to attempt to present these complex issues. Instead it is the intention of the author to suggest operating considerations of these conceptual sonars such that the intended users, the MH operators, are given a tool whose net training differential over conventional sidescan sonars is minimal with a maximum return on effectiveness. The tool that requires the greatest consideration is the operator interface. Suggestions for 2D and 3D interfaces are presented below. 2D Gapless MH Sidescan Sonar: If a high resolution sidescan sonar, such as the L3-Klein 5500, were combined with a high resolution MBES, such as the Reson 7125, to form one unit where the 7125 filled the nadir-gap then the MH operator could have a reasonable expectation of identifying an MLO through the entire range of the swath. The 3D nature of the MBES could be optimized for real-time target detection in 2D and presented to the operator in a format very similar to standard sidescan imagery, simultaneously, and near seamlessly. Figure 10 is a conceptual interface improvement of a sidescan sonar acquisition system (SonarWiz.Map) that has overlaid the nadir-gap with sun-illuminated bathymetry from the onboard MBES. The operator is presented with a third data channel,

© Mosaic Hydrographic 13 of 14 Presented at Services (Canada) Ltd 2006 UDT-Pacific 2006
between the original two, where the interpretation techniques are the same as the sidescan; bright returns and shadows highlight objects standing proud of the seafloor.
Figure 10 – Conceptual Sidescan Acquisition Interface: Waterfall display with nadir MBES channel added Background Image courtesy of Chesapeake Technologies, Inc
Although the 3D nature of the MBES is hidden from the operator, the data derived from it is still recorded. Specially trained hydrographic personnel can then use this data off-line to its fullest extent including but not limited to contour plots, bathymetric charts, amplitude backscatter maps, and 3D DTMs. 3D Bathymetric Gapless MH Sidescan Sonar: If sidescan MH is to take advantage of the already available third dimension and a gapless sonar is also desired, the combination of a high-resolution interferometric sonar with a high resolution MBES is required. In the same manner as the conceptual 2D gapless sonar above, extant COTS technology can be combined into one system. The key to the successful employment of this improved and more efficient sonar is an interface that has little or no training differential above current sonar acquisition interfaces. Despite such a conceptual interface being possible to achieve with existing COTS software, it has not been refined due to the lack of demand.
VII. Conclusion Sidescan sonars used for MH operations are at a performance level that has undergone a steady improvement in resolution and operational tow speed. Mature hydrographic technologies such as Multibeam Echosounders and Interferometric sidescan sonars are ready to be ported into MH applications. The 3D nature of these two sonars allows for

© Mosaic Hydrographic 14 of 14 Presented at Services (Canada) Ltd 2006 UDT-Pacific 2006
tools and techniques to be used such that the MH process may be greatly improved. If these technologies were to be combined into one system, the bottleneck problems of nadir-gaps and 2D surfaces may be shattered. Towed sidescan operations will require less passes in a potentially dangerous environment thus reducing the overall time taken to complete the survey and reducing risk of danger to lives and platforms. In AUV operations, less passes over an area of interest may result in greater aerial coverage per mission after the net cost of operating the MBES is factored into the battery life estimate. It is now time for the MH community to take advantage of the existing technology and work with manufacturers to integrate their systems into an extremely capable and resource saving gapless (2D or 3D) MH sidescan sonar.
VII. References [1] Mayer, L. 2005, “Site Surveys of the Mine Burial/Coastal Processes Experiment Site at the WHOI Coastal Observatory, Martha’s Vineyard”, 7pp. http://www.onr.navy.mil/obs/reports/docs/05/cgmayer1.pdf [2] Brissette, M.B., J.E. Hughes Clarke, J.R. Bradford, and B. MacGowan, 1997, Detecting Small Seabed Targets Using A High Frequency Multibeam Sonar: Geometric Models and Test Results. Proceedings of the MTS IEEE Oceans 97 Conference, 6-9 October, Halifax, Nova Scotia, Canada, 8pp. [3] Gostnell, C. 2004, “Efficacy of an interferometric sonar for hydrographic surveying: Do interferometers warrant an in depth examination? A Preliminary Study”, Proceedings of the Canadian Hydrographic Conference 2004, 25-27 May 2004, Ottawa, Canada, 35pp. [4] Kraeutner, P.H. 1998, “Small Aperture Acoustic Imaging using Model Based Array Signal Processing”, Ph D Thesis, School of Engineering Sciences, Simon Fraser University, 224pp. [5] op. cit. [6] Brissette, M.B. 1997, “The Application Of Multibeam Sonars In Route Survey”, Masters of Engineering Report, Geodesy and Geomatics Engineering Department, The University Of New Brunswick, 112pp. [7] op. cit.