aquatic resources valuation and policies for poverty ... · navigation and trans-boundary wetland...
TRANSCRIPT

Aquatic Resources Valuation and Policies for Poverty Elimination in the Lower Mekong Basin: Review of the Project and Economic Valuation Methods *
by
Danilo C. Israel**
1. Objectives of the Paper
This paper presents a brief of the Aquatic Resources Valuation and Policies for poverty Elimination in the Lower Mekong Basin or the Mekong Valuation Project (MVP) for short; background of the Lower Mekong Basin (LMB), Cambodia and the provincial sites covered by the project; review of the theoretical aspects of economic valuation methods and the empirical economic valuation literature in the LMB; and a discussion of the valuation methods to be used in the project. The objective of the paper is to introduce the project to this current forum and contribute to the discussion on economic valuation methods among its participants. 2. Background of the Project The MVP is implemented in Cambodia by the WorldFish Center, a CGIAR-member international research organization based in Penang, Malaysia. The project has a two-year duration, January 2003-Dcember 2004, and is being funded by the Department for International Development (DFID) of the United Kingdom (UK). The project is a partnership effort of the WorldFish Center and the Department of Fisheries (DOF) of the Kingdom of Cambodia, in collaboration with various international and national non-government organizations (NGOs) and other entities.
The overall goal of the MVP is to help reduce poverty and improve livelihoods of the poor people dependent on aquatic resources in the LMB. This will be achieved by conducting an action research that will look into the value of resources to the poor and the constraints they face in accessing these resources and then by using the results of this research to develop and implement stakeholder-based aquatic resource management policies for the management of local aquatic resources. The three main outputs of the project are the generation of a) social and economic values of aquatic resources for stakeholders at different levels of society; b) baseline information on existing constraints
* Paper Presented at the Workshop on Integrating Environmental Impacts into Water Allocation Models of the Mekong River Basin Held on December 15, 2003 at the University of Economics, Ho Chi Minh City, Vietnam. ** Ph.D. and Project Scientist, WorldFish Center-Cambodia, Department of Fisheries, P.O. Box 582, 186 Norodom Boulevard, Phnom Penh, Cambodia. The author expresses his gratitude to the MVP staff for the assistance but takes full responsibility for errors.

2
to access of resources by stakeholders, particularly the poor; and c) new approaches for enabling the greater uptake of knowledge generated by research for policy implementation. The MVP has three provincial project sites in Cambodia: Stung Treng in the north near the Lao PDR border, Takeo in the south near the Vietnam border and Siem Reap in the west near the Thailand border. Stung Treng was selected because of the important biodiversity and tourism issues in the area, Takeo due to transportation, navigation and trans-boundary wetland management issues and Siem Reap because of multiple-use and fishing issues. In each of the provincial sites, two to three communes were selected from which a total of 18 villages, 6 from each province, were used as village sites. 3. Background of the Lower Mekong Basin 3.1 The Lower Mekong Basin
The entire Mekong River Basin has an area of approximately 795,000 square kilometers, which includes all the land surrounding and the water bodies that drain into the Mekong River (MRC 2003). The area encompasses parts of China and Myanmar, known as the Upper Mekong Basin, and a portion of Vietnam, about one-third of Thailand and most of Cambodia and Lao PDR, known as the LMB. As of 2000, about 56 million people lived in the LMB (MRC 2002). The weighted average of the annual population growth of the four covered countries was at 1.4 percent while population density varied greatly between countries and areas. Of the total population, about 19 percent were in Cambodia, 9 percent were in Lao PDR, 40 percent were in Thailand and 32 percent were in Vietnam. The most important economic sectors in the LMB have been agriculture and fisheries, with more than three fourths of the people dependent on combined agricultural and fisheries activities. Fish and other aquatic species are the main source of animal protein among the population. In addition to their contribution to fish production, water resources in the basin also provide various other services including transportation, irrigation, power generation, biodiversity and other important uses to the economic and social life of the people. Of the four LMB countries, Thailand has the largest population and land area, Vietnam is the most densely populated, while Cambodia has the highest average annual population growth (Appendix Table 1). Thailand has the largest GDP, per capita GDP and growth rate in GDP as well as highest adult literacy rate. Vietnam has the largest percentage of the population below the national poverty line. Some of the most important social indicators in the LMB are the following (Hook et al. 2003): a) The population are predominantly rural and young and the percentage below the age of 15 is high; b) In general, more than 70 percent of the labor force are employed in the

3
agricultural sector. Furthermore, while unemployment in the rural areas is low, that in urban areas is much higher. Underemployment is also a major problem; c) While poverty indicators differ between countries and difficult to compare, in general, the poor make up a considerable proportion of the population; d) Public health indicators are worse in Cambodia and Lao PDR than in Thailand and Vietnam while HIV prevalence is a major problem in the urban areas of Cambodia and Thailand; and e) the educational situation is worse in Cambodia and Lao PDR than in Thailand and Vietnam with the former countries having enrollment and education attainment rates that are among the lowest in Asia. 3.2 Cambodia
Geography, Race and Religion Cambodia is in the lower middle region of the LMB. It is bordered in the West by Thailand, in the East by Vietnam, in the North by Lao PDR and in the South by the Gulf of Thailand. Most of the country is composed of low and flat plains with mountains in the southwest and north regions. Its climate is tropical with the wet season from May to November and the dry season from December to April. As of 1998, Cambodia had 24 provinces, 183 districts, 1,609 communes, and 13,406 villages (NIS 1999). About 90 percent of the general population are Khmer, 5 percent are Vietnamese, one percent are Chinese, and 4 percent belong to other races. Approximately 95 percent of the people are Theravada Buddhists.
Natural Resources
Water resources are one of the greatest assets of Cambodia. Across the country runs the Mekong River that is the longest in Southeast Asia. Other important rivers are the Tonle Sap and Bassac rivers that both meet the Mekong river in the capital city. Cambodia also has the Tonle Sap lake that is again the largest in Southeast Asia and one of the richest sources of freshwater fish and aquatic resources in the world. In addition to these aforementioned inland water bodies, Cambodia has numerous floodplains, rivers, lakes, canals, channels, streams and other waterways that produce substantial amounts of fish and other aquatic food. In addition to freshwater resources, the country has a coastline of about 443 kilometers that support marine capture fisheries and other coastal economic activities. Forests, which cover 53 percent of the total land, are another important resources of Cambodia (Encarta 2003). These forests are located in the mountain areas and along the southwestern coasts. Within these forests live wildlife including elephants, deer, panthers, bears, tigers and other animals some of which are already endangered. The forests and mountain areas also contribute to the economy through logging and hunting activities. Added to forests, mineral resources are also among the natural assets of the country. Commercial deposits of salt, manganese and phosphate exist in the central part of the country while limited quantities of zircons, sapphires and rubies are found in the northwestern section.

4
Economy
The Gross Domestic Product (GDP) of Cambodia has been growing steadily in recent years (Table 2). At constant prices, the average GDP was 8.2 billion riels on average annually for the 1993 to 2001 period while the average annual growth rate of the GDP was 5.7 percent. The growth of the economy slowed down in 1997 to 1998 due to the Asian regional economic crisis but recovered since 1999. The GDP per capita was at 715,000 riels from the 1993 to 2001 period while the average annual growth rate of the GDP per capita was at 1.5 percent. The low annual rate of growth is to a large extent due to the negative growth from 1996 to 1998, the years of and immediately preceding the regional economic crisis. By sector, the Cambodian economy is dominated by agriculture, fisheries and forestry, which contributed an annual average of 3.7 billion riels to the GDP for the period 1993 to 2001, or 45 percent (Table 3). This sector is followed by services that registered an annual average of 2.8 billion riels or 34 percent. The third largest contribution comes from the industry sector that added 1.4 billion riels to the GDP, or 17 percent. Socioeconomics Latest available official figures indicate that a predominant portion of the population of Cambodia, 9.4 million people or about 81.6 percent, lived in the rural areas (Table 4). The average household size was 5.3 persons overall and in the rural areas, with a slightly higher figure in the urban areas. There were slightly more females than males in the population. The age dependency ratio was high at 76.8 percent indicating that many in the population were not actively involved in the labor force and just dependent on other members of the household. The adult literacy rate was only at 71.2 percent indicating that a significant portion of the adult population, about 30 percent, could not read or write.
The official unemployment rate in Cambodia was low at only 0.6 percent while data on underemployment among the labor force, which could be significant, were unavailable. The average monthly income was $79,355 for the entire country with much less income in the rural areas and higher income in the urban areas, particularly the capital city. When converted to dollar figures at the current exchange rate, the monthly income overall was just approximately 20 dollars. Among the most important issues facing Cambodia today are the following (Hook et al. 2003): a) Approximate one of every three Cambodians live in poverty and the poorest of the population also have the worst outcomes for a wide range of social indicators including gender equality, literacy, educational attainment, life expectancy, malnutrition and disease; b) majority of the population live in the rural areas and highly dependent on subsistence agriculture made worse by occasional flooding and droughts. Landlessness is a further problem that complicates the poor in the urban areas; and c) The physical and human resources of the country is still suffering from the lingering effects of the decimation through the years of

5
the Khmer Rouge and the overall civil strife and political instability. Too much of the infrastructure have been ruined and the process of rebuilding for the poor country has been slow.
Fisheries Sector of Cambodia The fisheries sub-sector of Cambodia is second only to crops in terms of contribution to the GDP of the entire agriculture, fisheries and forestry sector (Table 5). For the 1993 to 2001 period, fisheries generated an annual average output amounting to about 2.8 trillion riels, or 34 percent, of the total sectoral GDP. Among the sub-sectors, however, fisheries were the least growing (Table 6). For the 1994 to 2001 period, the average annual growth rate of fisheries was 3.0 percent, lower than those of all the other sub-sectors. Furthermore, fisheries experienced negative growth in 1994 and 1997 but otherwise registered positive growth during the period. The inland fisheries have been the biggest contributor to overall fisheries production in Cambodia (Table 7). For the 1990 to 2001 period, it registered an average annual production of 123,993 tons that comprised 73 percent of total fisheries production. Marine fisheries and aquaculture lagged behind and contributed only 20 percent and 6 percent annually on average to total fisheries production. Inland fisheries have been the fastest growing component of the fisheries sub-sector also (Table 8). For the 1991 to 2001 period, it had an average annual growth rate of 26 percent. Growth was negative for the most part of the nineties but was positive in the latter part of the decade until 2001. Among the most important bio-physical problems facing the inland fisheries in Cambodia are the following (MRC 200): a) Destruction of spawning grounds or dry season refuges by man-made habitat alterations; b) Local changes in the quantity and quality of water available for sensitive habitats and the timing of hydrological events, and pollution from agricultural and urban development; c) Construction of dams, weirs or diversions which act as physical barriers to fish migration; and d) Increased sediment load due to deforestation. On the other hand, the most important management problems of inland fisheries are the following (e.g. Ahmed et al. 1988): a) Over-fishing and destructive fishing by various fisher groups; b) Poor monitoring, enforcement and overall capacity of government fisheries agencies; and c) Poor resource information base with which to make decisions on resource issues as well as poor social information base on some sectors, particularly on small-scale family fishing operations, with which to make decisions on social issues. 3.3 Provinces Covered by the MVP Demography and Socioeconomics Of the three provinces covered by the project, Takeo has the largest population, population density, dependency ratio, and agricultural employment; Stung Treng has the largest area, average household size, percentage of migrant population, and labor force

6
participation rate; while Siem Reap has the largest percentage of female household heads and unemployment rate (Table 9). The poverty rate in Siem Reap is highest in the three provinces and higher than the national rate. Access to safe water, sanitation and electricity is low in all the provinces and worst in Takeo. Infant mortality and child malnutrition is worst in Stung Treng. Male literacy rate is lowest in Stung Treng while female literacy rate is lowest in Siem Reap. In general, the three provinces covered by the project may be among the worst in Cambodia in terms of economic and social indicators. Inland Fisheries Among the provinces that are covered by the project, Siem Reap contributes most to national inland fisheries production, followed by Takeo and Stung Treng (Table 10). During the 1991 to 2001 period, annually and on average, Siem Reap registed 8,630 tons of inland fish production, Take produced 2,077 tons and Stung Treng registered 748 tons. Of the provinces, Stung Treng had the highest average annual growth rate in inland fisheries production in Cambodia, followed by Takeo and Siem Reap. During the 1991 to 2001 period, Stung Treng registered a growth rate of 24 percent, while Takeo had 13 percent and Sime Reap has 9 percent (Table 11). Socio-economically, there are no data specific for inland fishing households in Cambodia. For overall fisheries, the average household size of households in fishing districts was 6 in 1995 to 1996 period (Table 12). There were slightly more female than male members in these households. Women headed a substantial percentage of the households. The literacy rate of the household heads was at 80 percent. More than a third, 68 percent, of the household heads had fishing as primary education. Most of the households, 92 percent, depended on common property or publicly owned resources for their livelihood. 4. Framework of Analysis and Review of Valuation Methods
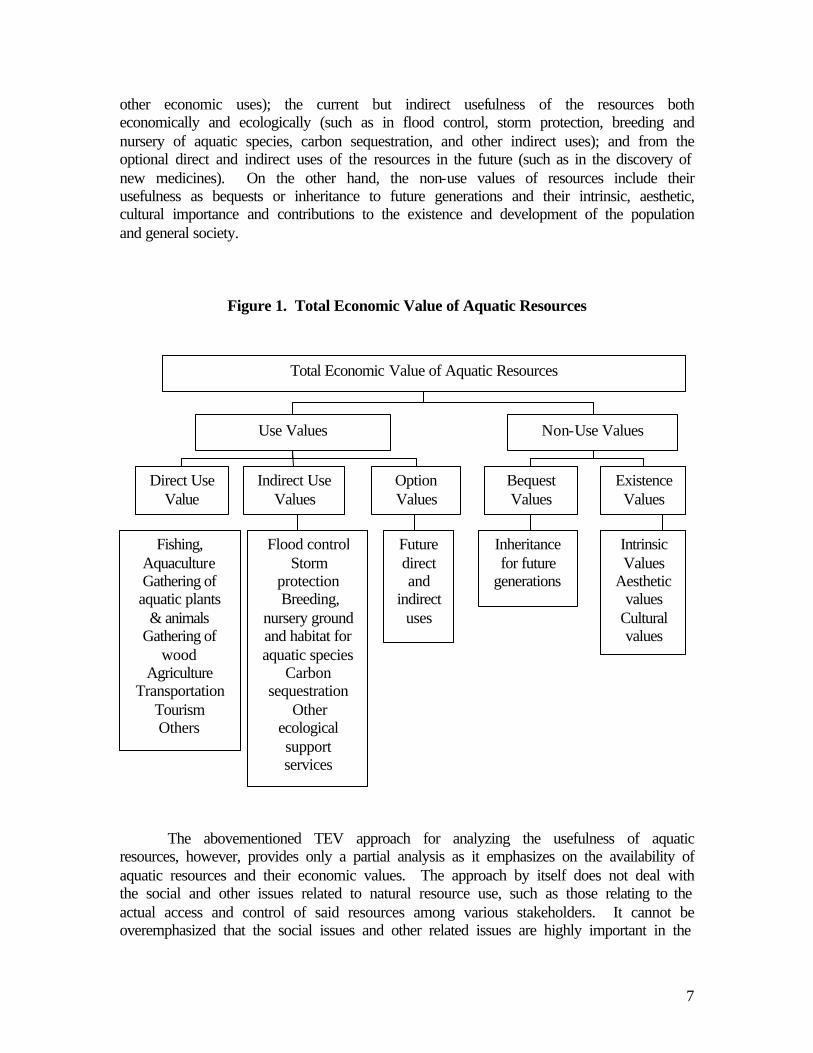
This section discusses the framework of analysis of the MVP, summaries of the theoretical aspects behind different economic valuation methods, and the empirical research in the LMB using economic valuation methods. Toward the end of the section, the valuation methods to be used in the project are discussed. 4.1 The Overall Value of Aquatic Resources As in the case of natural resources as a whole, the usefulness of aquatic resources in the LMB may be seen traditionally in terms of the total economic value (TEV) that said resources provide to the people living in the area and society in general (Figure 1). Overall, these resources have use and non-use values both at present and in the future. On the one hand, the use values include those generated from the direct use of resources for present economic activities (such as fishing and fishing-related activities, aquaculture, gathering of aquatic plants, animals, and wood, agriculture, transportation, tourism, and
7
other economic uses); the current but indirect usefulness of the resources both economically and ecologically (such as in flood control, storm protection, breeding and nursery of aquatic species, carbon sequestration, and other indirect uses); and from the optional direct and indirect uses of the resources in the future (such as in the discovery of new medicines). On the other hand, the non-use values of resources include their usefulness as bequests or inheritance to future generations and their intrinsic, aesthetic, cultural importance and contributions to the existence and development of the population and general society.
Figure 1. Total Economic Value of Aquatic Resources
The abovementioned TEV approach for analyzing the usefulness of aquatic
resources, however, provides only a partial analysis as it emphasizes on the availability of aquatic resources and their economic values. The approach by itself does not deal with the social and other issues related to natural resource use, such as those relating to the actual access and control of said resources among various stakeholders. It cannot be overemphasized that the social issues and other related issues are highly important in the
Total Economic Value of Aquatic Resources
Non-Use Values
Bequest Values
Inheritance for future
generations
Intrinsic Values
Aesthetic values
Cultural values
Use Values
Fishing, Aquaculture Gathering of aquatic plants
& animals Gathering of
wood Agriculture
Transportation Tourism Others
Flood control Storm
protection Breeding,
nursery ground and habitat for aquatic species
Carbon sequestration
Other ecological support services
Future direct and
indirect uses
Existence Values
Direct Use Value
Indirect Use Values
Option Values

8
analysis of natural resource use particularly where many of the stakeholders are poor, they are critically dependent on the resources for their livelihood, and where there are other stakeholders from other economic classes with different and sometimes conflicting objectives. Given these conditions, an extension beyond the TEV analysis of the valuation of the usefulness of aquatic resources provided above is needed and necessarily must include not only the purely economic concerns but also cover social and other aspects, as illustrated in Figure 2 (This paper skips a detailed discussion of socioeconomic and livelihood analysis since this is not part of the objective of the current forum).
Figure 2. Extended Valuation of Aquatic Resources
+
4.2 Economic Valuation Methods: Theory Theoretical discussions on the merits of economic valuation applied to the natural resources and environment already abound (e.g. Dorfman and Dorfman 1993, Bojo et al. 1992, Braden and Kolstad 1991, Folmer and Ierland 1989, Dixon et al. 1986, Dixon and Hufschmidt 1986, Hufschmidt et al. 1983, Freeman 1979). Some examples of more recent theoretical and empirical works with explanations of the different economic valuation methods applicable in water-based natural resource environments are CEMARE and SIFAR (2002), De Lopez et al. (2001), IIED (1997) and Barbier et al. (1996). In general, economic valuation methods can be classified into a) those that directly use data from actual markets; b) those that indirectly utilize data from actual markets or the so-called “surrogate markets,” c) contingent valuation methods (CVM) and d) other valuation methods. 4.2.1 Methods Using Actual Markets
The valuation methods using actual markets may be applied when the goods and services resulting from the exploitation of the natural resources and environment (NRE), or outputs, and the goods and services needed to exploit them, or inputs, are or can be traded in actual markets. In this case, the volumes and prices of both the outputs and inputs are known and can be generated. The following are the economic valuation methods that use data from actual markets.
TEV Analysis
Socioeconomic and Livelihood Analysis

9
a) Net Economic Value Method
The Net Economic Value (NEC) from an economic activity, such as the exploitation of an aquatic resource, is defined as NEC = TR – TC (1) where TR is the total revenue, or the quantity of output generated from the exploitation of the resource multiplied by its market price, and TC is the total costs that include both the financial (quantity multiplied by the market price of the purchased material inputs, hired labor, paid for transportation, and other purchased cost items) and the non-financial costs (quantity and market price of the un-purchased material inputs, household-labor, unpaid-for transportation, and other un-purchased cost items). The term “economic” in equation (1) is used to make a distinction from the term “financial” which purely means the accounting of the money costs and returns to production. There are some important constraints to the application of the NEC method. The prices of the outputs or inputs involved can be underestimated when they are home consumed or provided. Underestimation can likewise occur even when outputs and inputs are traded in formal markets but monopolies, subsidies, poor information and other market distortions exist. It is therefore important that the gathering of price data for purposes of valuation using this method would device a way to eliminate the constraints and distortions and come up with a set of shadow or true prices for the goods and services that are valued.
The NEC technique can be applied in the valuation of aquatic resources in the LMB particularly in the aspects of fishing and fishing-related activities, aquaculture, gathering of aquatic animals and wood, agriculture transportation, tourism and other activities with direct uses of the resources and with existing markets. b) Productivity Change Method
In general, the productivity change method measures the NRE impact of a project by looking into its on-site and off-site effects on the productivity of man-made or natural production systems. Theoretically, the method assumes that NRE quality is another input in the entire production process. Therefore the production function can be presented as: X = f (L, N, K, E) (2) where X is the output, L, N, and K are the usual production inputs land, labor and capital and E stands for NRE quality. In the production function of equation (2), a change in E will change the costs of production which, in turn, either change the quantity and price of the output or the returns to the other inputs or both.

10
The general steps followed in quantifying the productivity gains or losses from
NRE changes using the productivity change method are the following: a) measurement of the production response to the NRE quality change and then quantification of the gains or losses of producers in terms of increases or decreases in profits; b) measurement of the consumption response to the production changes and then quantification of the gains or losses of consumers in terms of changes in consumer surplus; c) measurement of the gains or losses of owners of factors of production in terms of increases or decreases in factor returns; and finally d) measurement of the total benefits or losses from NRE quality changes by aggregation of the different values attained in the previous computations. Where efficient markets exist, the valuation of productivity gains or losses from NRE quality changes in each of these steps is based on actual market prices. When markets are distorted, adjustments are done so that the prices used reflect true market levels. For the economic valuation of aquatic resources in the LMB, the productivity change may be used to measure the effects of development projects that have impact on the environment, such as dams and irrigation systems. This method will be useful in assessing the net impact of irrigated farming, such as rice, vis a vis rainfed farming. Since it uses actual market data, the problem related to the prices of home consumed or provided goods and services and market distortions is relevant and must be addressed by generating shadow prices. c) Human Capital Method
The human capital method is used to assess the impact of NRE changes on the health of the affected population. It is founded on the general notion that NRE damages can have significant adverse effects on human health. The method measures the human cost of NRE damage by valuing the foregone opportunities of people resulting from NRE-induced health problems. In the case of premature death of an individual, the formula that may be used is: ∞
L1 = Σ Yt PtT (1+rt)-(t-T) (3)
t=T
where L1 is the discounted value of the labor of individual 1; Yt is his expected gross earnings, or value added, in the t-th year outside of returns from the non-human resources he owns; Pt
T is the current year (T) likelihood that he will be alive in yeat t; and rt is the social discount rate in year t. The sum of the cost of the individual is L1 in equation (3) plus the medical costs. These costs can be expanded further to include the money value of the disutility, or psychic and emotional costs, related to the suffering of the family and friends of the individual. The Human Capital Method will require personal background and forecast data on the individuals affected by the NRE damage and the data requirement will be detailed

11
and immense in the case where many of the population are affected. It will be good to use to estimate the human cost of environmental disasters, for instance toxic water pollution from mining or industry, dam failures and breakups, or flooding that cost lives. In the case of the LMB, the Human Capital Method may be used also to estimate the costs of human disasters related to destructive floods that have been occurring from time to time. d) Opportunity Cost Method
The opportunity cost method is based on the opportunity cost concept, which, for a given natural resource, is defined as the value of the benefit that accrues from the best alternative use of the resource. In economic valuation, there are basically two kinds of opportunity costs: the opportunity cost of development, which is measured as the present value of the benefits from preservation, and the opportunity cost of preservation, which is estimated as the present value of the benefits from development. However, the opportunity cost method is more often used to measure the opportunity cost of preservation than that of development. This is because the opportunity cost of preservation, or the benefits from development, can easily be quantified from existing markets. The general formula for the computation of the opportunity cost of preservation is
n
NPV0 = Σ (Bt – Ct) / (1+t)n (4) t=0
where NPV0 is the net present value of the net benefits of development in year 0, Bt and Ct are the total benefits and total costs of development in year t, r is the discount rate, and n is the number of years of project life. If the NPV of the project is small relative to some estimated value of preservation, the project is rejected. The opportunity cost method in equation (4) is straightforward to use assuming that the costs and benefits of a development projects over the course of its lifetime can be ascertained with a reasonable level of accuracy. Since the resulting calculations of the NPV is sensitive to the assumed value of the discount rate, then the choice of the number to use has an important effect on the valuation of the project NPV. In the LMB, the opportunity cost method can be used for instance to determine the cost of the preservation of flooded forests when the option is to convert them for agriculture or for the harvesting of trees for the lumber industry. The method can be utilized also to value the conservation of fisheries resources through the establishment of fish sanctuaries through the foregone benefits from fish harvests. e) Cost Effectiveness Method
The cost effectiveness method is another criterion useful for comparing projects that have NRE impacts and comparative outputs. This method selects among projects the one that either minimizes costs given a fixed output or maximizes output with a fixed

12
cost. For instance, the output may be some kind of environmental quality level, like water pollution standard, while the projects to compare may include one that use command and control methods and another that use market-based instruments to attain the standard.
Given the nature of its objective, the cost effectiveness method empirically can be
applied by employing mathematical optimization and programming models that generate optimal solutions that lead to the solution of the optimal project. This would mean technical knowledge on the part of those using the method in quantitative modeling. The method, however, can also be applied using the traditional approach of simply comparing financial estimates between competing projects and thus it becomes in a way less difficult to apply.
There are many potential areas of application of the cost effectiveness method for
valuation in the LMB. Examples would be in comparing several flood control or irrigation projects and other infrastructure projects related to water control or use. The method can also be potentially used to compare different management systems for freshwater fisheries, e.g. community-based fisheries as opposed to centrally controlled fisheries. f) Preventive Expenditures Method
The preventive expenditures method measures the value that people attach to NRE quality through the expenditures they incur to prevent the quality decline. It assumes that when faced with a decline, e.g. water pollution, the individual affected has the choice of ignoring the problem, moving to another area, or spending on measures to mitigate the problem. The amount spent by the individual to prevent the quality decline is taken as his personal valuation of the NRE quality before the decline occurred. The total of the expenses of all the affected individuals for preventive measured is used as the substitute demand curve for NRE quality.
The preventive expenditures method is straightforward to use since the amount of
spending that an individual puts to mitigate NRE damage can be determined using market-based data. In the LMB, this method can be used to value the expenses of people and communities in putting up high stilt houses, floating houses instead of fixed ones, building of dikes and canals and other means to prevent or mitigate the effects of flooding. g) Replacement Cost Method
Like the preventive expenditures method, the replacement cost method generates a value of NRE quality, by taking it as the cost of replacing productive assets destroyed or rendered unproductive by the deterioration in the NRE quality. The cost of replacement is usually counted in terms of market values of physical replacements. Thus, the method is relatively straightforward to apply, assuming that it is technically feasible to replace damaged systems.

13
For economic valuation in the LMB, the replacement cost method can find some
important applications. For instance, soil erosion in the uplands of the region over many years may be estimated in terms of the amount of fertilizer needed by farmers to return the productivity of the soil to its original state. The loss in fishery productivity in particular water bodies of the region may also be measured in terms of the cost of a government program to stock these with fish fingerlings to return the diversity and size of the stock to some desired level. h) Shadow Project Method
The shadow project method is a special type of the replacement cost method which uses the cost of putting up a hypothetical shadow project which provides an alternative source of the NRE goods and services lost to development as the substitute estimate of the value of the NRE goods and services. Assuming technical feasibility of a shadow project, the method is straightforward to apply. However, understatement of costs can likely occur in using the method since the total value of the lost NRE goods may actually significantly outweigh the cost of the shadow project.
For economic valuation in the LMB, the shadow project method can be used for
instance to estimate the costs of water pollution coming from the Mekong river and other inland water bodies in certain coastal areas. These costs may be taken as the amount needed to put up hypothetical swimming pools in these areas to replace the beaches made unfit for swimming by the pollution. i) Relocation Cost Method
The relocation cost method is similar to the preventive expenditures method but instead of estimating expenditures on prevention, it uses the cost of relocation from the area where there is an NRE problem to another area where there is no such problem as a proxy measure for NRE quality. The amount that the individual spends for relocation is taken as his personal valuation of the benefits of an improved NRE quality in the new area or the cost of the dis-amenity in his old location. The total of all the individual relocation costs is taken as the overall costs of the population affected by the NRE problem.
Since it is based on market data, the relocation cost is straightforward to use in
cases where relocation is actually possible. For economic valuation in the LMB, the cost of seasonal flooding to some of the population may be the cost of seasonally moving from one place to another to evade the flood. In a similar same vein, the cost of water pollution to the people residing in the coastal areas affected by the Mekong River may be the cost of relocating to cleaner areas.

14
4.2.2 Methods Using Surrogate Markets
In contrast to the valuation methods that directly use existing markets, the next group of valuation methods use substitute markets because the NRE goods and services they value are non-marketed. The valuation approach using surrogate markets is also known as the hedonic pricing approach and has the following specific valuation techniques classified under it. a) Marketed Goods as Surrogate Goods Method
This method is used for measuring the benefits of resource improvement when there is a privately marketed good that is a perfect substitute for the NRE good. In this case, the value of the costs or benefits from the fall or rise in the supply in the non-marketed resource good is approximated by the value of the increase in the decrease in the demand of the marketed private good. If applicable, this method is easy to use since the demand of the substitute good that is marketed is usually known or can be measured. A constraint of the method is that isolating the change of the demand for the marketed substitute good specifically induced by the change in the supply of the un-marketed NRE good can be difficult. An application of the method for economic valuation in the LMB can be in the area of recreation and tourism. For instance, the method may be used by assuming that the decrease or increase in the quality of lake, river or coastal water for recreation purposes is measured by the subsequent increase or decrease in the demand for privately owned resorts that provide the same kind of water recreation, e.g. for swimming, fishing, or boating. b) Property Value Method
The property value method estimates the value that people attach to an NRE change by studying the actual market for real property, such as housing, that are affected by the change. For instance, water pollution in a certain river affects the market for residential housing along the same river. The property value method first assumes that the affected area analyzed, the residential area along the river, is a single, well-functioning and competitive market for housing. With this, the following relationship is defined: Ri = (Pi, Ai, Ni, Ei) (5) Where Ri is the price of housing usually measured as rent per unit of time; Pi is the physical characteristics of housing such as house size, lot size, number of rooms, age of house, type of construction materials, etc.; Ai is the accessibility characteristics such as distance to market, school, church, place of employment, etc.; Ni is the neighborhood characteristics such as average income of neighborhood residents, crime rate of

15
neighborhood, etc.; and Ei is the water quality or pollution level in the river beside the neighborhood.
Computationally, the method then proceeds by assuming a functional form for the
relationship stipulated in equation (5). Assuming a linear function, the following equation is estimated:
Ri = a0 + a1 C1i + a2 C2i + … + an Cni + ae Ei + ei (6) where a0 is the intercept, ais are the coefficients; Cis are the housing characteristics, ae is the coefficient for the water quality or pollution variable Ei and ei is the error term. With the linear relationship in equation (6), the marginal willingness-to-pay (WTP) for an additional unit of improvement in the water quality is measured by the coefficient ae. The total incremental benefits of a water pollution program that improves water quality is estimated by n
V = Σ ani (Q2-Q1) (7) i=1
where V is the total incremental benefits, Q2-Q1 is the improvement in air quality and s is the number of housing in the site under consideration. The property value method requires a survey of the households and property affected by the environmental change but assuming that the required data are generated, is relatively straightforward to apply. Potentially, in the LMB, the method can be used to assess the effects of water pollution in rivers, lakes and coastal areas to the property values situated along the affected areas. c) Wage Differential Method
The wage differential method is similar to the property value method but in this case, instead of the market for real property, the market for labor is used as the surrogate market for NRE quality. An example of this type of labor market is the market for divers to assist tourist diving enthusiasts. The wage differential method starts by assuming a competitive labor market situation where the main motivation of workers for accepting diving jobs is higher remuneration. Then, the following wage equation is further assumed: Wi = (Ji, Li) (8)

16
where Wi is the wage level i; Ji is the non-resource related job attributes such as distance from residence, etc.; and Li is the resource-related job attributes such as exposure to water pollution, etc.
The above equation (8) is again estimated assuming a specific functional form. If the functional form is linear and the NRE factor considered is water pollution at the job site, then the estimated equation is Wi = b0 + b1 D1i + b2 D2i + … + bn D ni + be Ai + ui (9) Where b0 is the intercept, bis are the coefficients; Dis are the job characteristics, ae is the coefficient for the water quality or pollution variable Ai and ei is the error term. Again, the marginal WTP for an additional unit of improvement in the water quality is measured by the coefficient be. The total incremental benefits of a water pollution program that improves water quality is estimated by s B = Σ bni (W2-W1) (10) i=1
where B is the total change in the wage and W2-W1 is the improvement in air quality and s is the number of divers.
The wage differential approach can be used to study environmental changes, e.g. water quality, in the different areas of the LMB and its impacts on the market for labor affected by such changes, e.g. diving instructors. This depends on the condition that such a market exists and is actually responsive to changes in the water quality levels in the job site. d) Travel Cost Method
The travel cost method is used for measuring the value of public recreational services such as water parks, amusement centers and similar amenities. The method was developed because directly estimating the value attached to these places by users based on subsidized admission fees will grossly underestimate true values. For the analysis of a water tourist area, for instance, the following procedures of the travel cost method is followed.
a) zoning of surrounding areas of the recreation site where visitor comes from based on distance from the site;
b) surveying the site users to get information on zones of origin, visitation rates,
travel costs, and socioeconomic characteristics; and
c) estimating the following visitation rate function of each zone:

17
Vi = (TC, X1, …,Xn) (11) where Vi is the visitation rate computed as the number of visitors from zone i divided by the population of the zone; TC is the travel cost in time and resources of each visitor from the residence to the site; and X1 to Xn is the socioeconomic variables associated to each visitor. .
d) using the information from step c to create a demand curve for each zone
related to travel cost and visitation; e) computing the consumer surplus from each zone assuming an actual user
admission fee; and
f) summing the consumer surpluses for all zones to arrive at a total consumer surplus which estimates the gains for all users from the use of the tourist site.
For economic valuation in the LMB, the potential applications of the travel cost
method are many, particularly in the analysis of the value of current recreational and tourist sites, e.g. irrawady dolphin. .
4.2.3 Contingent Valuation Methods
CVM is a valuation technique employed to analyze the value people attach to the changes in the natural resource, not by using actual or surrogate markets, but hypothetical markets. The main source of data of CVM is the survey that uses questionnaires asking preferences of respondents representing the population who are potentially going to be affected by the resource change. The name “contingent valuation” means that the choices people reveal, assuming a hypothetical market, is contingent on the actual occurrence of said market. The following are the specific CVM economic valuation techniques. a) Bidding Game Method
The bidding game directly asks respondents their willingness to pay (WTP) for a specific improvement or willingness to accept (WTA) compensation for specific damage to a natural resource. There are basically two bidding game techniques, the single-bid and the converting bid.
The procedure in the bidding game is as follows. First, the interviewer describes accurately to the respondent the specific features of the improvement or damage to the resource in question, including its quantity, quality, location and the access rights of the respondent. Then, the respondent is asked about his WTP or WTA associated to the improvement or damage. In the single bid system, the respondent is asked only once about his WTP or WTA. In the converging-bid system, he is given a starting bid which he is asked to accept or reject. Once a starting bid is accepted, higher or lower bids are provide until the maximum WTP or minimum WTA of the respondent is ascertained.

18
Once the WTP or WTA of all respondents of the survey are known, these are summed up vertically to come up with the aggregate bid curve. This bid curve serves as estimate of the total value attached by the population to the project causing the improvement of damage to the resource. b) Tradeoff Approach
The tradeoff game gives the respondent a choice between a base option of having a lower or higher level of a natural resource good at no expense made or compensation received or an alternative option of a higher or lower level of the good but with some level of expenses made or compensation. Once he chooses the alternative option, higher levels of expenses or lower levels of compensation are set in the alternative option until the respondent is indifferent between the based option and the alternative option. The final amount of money in the alternative option is then taken as the maximum WTP or minimum WTA for the difference in the levels of the resource between the two options. As in the bidding game, the individual WTPs and WTAs are added to generate the bid curve for the change in the resource. c) Costless Choice Approach
The costless choice approach provides the respondent an option to decide between quantities of goods that are desirable to him and provided free of charge, therefore costless. In the two-alternative case, he is given a choice between a natural resource good and an economic good. If the resource good is selected, the value of the economic good is taken as a measure of the minimum value that the respondent attaches to the resource good since by choosing it, he must have valued it as much as the economic good. On the other hand, if the economic good is chosen, its quantity will be reduced until the respondent chooses the resource good over it. The value of the final quantity of the economic good serves as the minimum approximation of the value of the resource good. The vertical sum of this minimum across all respondents serves as an estimate of the aggregate demand curve for the resource good.
The main difference between the costless choice approach and the other approaches is that in the former, the respondent has his choice free of charge, that is, he will not have to pay anything for the resource good if he will pick it or he will not have to lose any existing resource good if he chooses the economic good instead. d) Priority Evaluator Technique
The priority evaluator technique is similar to the costless choice approach as it also makes respondents choose between goods among which is a resource good. It is unique, however, for 3 reasons. First, it allows adjustment of the prices of the goods from initially set levels to encourage convergence to a set of equilibrium values. Second, it considers only goods that meet conditions that simulate perfectly competitive markets or that the goods must be independent in production, continuously variable in production and consumption and their consumption utilities must be independent of any other

19
consumption. Third, the technique allows respondents to make choices between goods given constrained income. The specific steps to be followed in the application of the priority evaluator technique are lengthy and are explained for instance in Hufschmidt et al. (1993). d) Delphi Techniques
Delphi techniques are different from other CVM methods in that instead of interviewing representatives of the affected population, they generate the opinion of experts on the natural resource good in question. The experts, usually residing in different areas, are independently asked through written communication about their valuation of a specific resource good. The initial values gathered from the experts are tabulated and sent back to them for further examination. Continuous evaluation by the expert is conducted until the valuation organizers are satisfied that an average value of the resource good considered is derived. The Delphi approach is highly useful for checking results of valuation studies using other CVM techniques. e) Constraints and Usefulness of the CVM Method The CVM technique has many shortcomings. Among others, it has limited validity in subsistence economies, for instance in many parts of the rural Lower Mekong Basin, where poor people have very low levels of WTP or WTA for NRA changes. Furthermore, the technique does not analyze actual behavior but only simulates it in a hypothetical way and thus is less reliable. Also, the technique is difficult to apply among people who have little or no experience in making clear decisions about the value of NRE goods, such as those living in rural communities. Despite the limitations, the CVM technique can be applied in cases where the level of knowledge of the people about the value of NRE goods are high, for instance in the urban areas of the LMB. The results of the application of CVM can also serve to validate the findings using other valuation methods. 4.2.4 Other Methods
Aside from the market and non-market based techniques mentioned so far, there are still other techniques already developed or in development that are useful for the economic valuation of NRE goods and services. Some of the important are the following: a) Benefits Transfer The benefits transfer approach simply applies the results of valuation studies already done in other similar sites and situations to the particular site and situation under consideration. For instance, valuation studies already conducted in some wetlands in the LMB will be utilized to value the other wetlands in the same region. This approach is relatively less costly and straightforward to implement assuming that the similarities between the already studied sites and the site under current study are strong and the

20
differences left can be addressed by adjusting in an appropriate manner the secondary data gathered in the earlier studies. There may be limited application of this approach in the LMB currently since economic valuation in the area is still in the early stages of development and many of the NRE sites of interest, while similar in terms of classification, may have their own important peculiarities that require separate and independent study. b) Conjoint Analysis and Choice Modelling Like the CVM, conjoint analysis is a survey-based valuation technique that elicits the preferences of people about NRE issues. Basically, the individual respondent is provided through a questionnaire a set of NRE-related alternatives that are pre-specified in terms of the levels of attributes. The method assumes that the total utility that the individual derives from each alternative is determined by the utilities that he derives from each attribute. It therefore aims to estimate the relative importance of each of the attributes, the trade-offs that individuals are willing to make between these set of attributes, and the total satisfaction or utility scores for each of the combination of attributes (Ryan 1996). Another method that is closely similar to conjoint analysis is choice modelling, also known as choice experiments or choice-based conjoint analysis (Bennett et al. 2002). In this approach, the number of alternatives are presented to the individual holding the attribute levels associated with each alternative constant, or by varying them, thus producing choice sets (CEMARE and SIFAR 2002). While conjoint analysis and choice modeling has not been widely applied in fisheries management yet, its use will likely increase in the future. Like the CVM, a potential constraint to their application in the LMB is the low level of information, education and exposure among people in the rural and subsistence areas to make informed and preferences decisions about NRE alternatives and specific attributes. On the other hand, the technique should be applicable in more urban areas where the opposite conditions may exist. 4.3 Economic Valuation Methods: Empirical Research
In the Lower Mekong Region, empirical studies have been conducted using specific valuation methods applied in various natural resource environments in different countries, some of which are briefly reviewed below.
In Vietnam, Nguyen et al. (1999) estimated using survey data the WTP of
Vietnamese farmers and consumers for environmental quality. They found that farmers were willing to pay an average of 250,000 Vietnamese dongs (VND) to avoid being ill from insecticide exposure while consumers were willing to pay 2,000 VND more for a kilo of safe cabbage and 3,000 dong more for a kilo of safe tomatoes. Using the travel cost method and CVM, Nguyen and Tran (1999) measured the demand of tourists to visit the Cuc Phuong National Park and their willingness to pay for improvements. Their results showed that the total recreation benefit or domestic visitors to the park was 1,502 million VND per annum. They further found that visitors were willing to pay for

21
improvements in the road network in the area and in the establishment of a confinement space for wildlife in the amount of 288.47 million VND for domestic visitors and 215.57 million VND for foreign visitors.
Using the net economic value method, Pham et al. (1999) valued the non-timber
net values of these in three standard plots were between approximately 300,000 to 600,000 VND/hectare. Using standard economic analysis, Tran and Lai (1999) compared agro-forestry systems and traditional cropping systems in Central Vietnam and found that the former are more profitable and feasible than latter, both financially and in environmental terms. Again employing the net economic value method, To and Nguyen (1999) studied the Can Gio mangrove scheme in Ho Chi Minh City and found that the scheme promoted sustainable development and derived a net benefit of $14.50 per hectare based on direct values alone. Finally, using the net economic value method, Tran and Le (1999) studied rice-shrimp farming systems in the Mekong Delta and found that if rice farmers would be compensated for losses caused by salinisation from nearby shrimp farms, all rice systems would show positive benefits. However, many of the shrimp farms in the area were uneconomic even without internalizing the costs of salinisation.
In Cambodia, some studies have also been done in recent years using economic
valuation techniques applied in various environments. Bann (1997a) conducted an economic valuation analysis of the alternative mangrove management strategies in Koh Kong Province, Cambodia using mainly the net economic value method. The study found that local fishing benefits per hectare of mangrove area was at about $84 while benefit in terms of fuelwood was at $3.50 per hectare. The study further found that shrimp farming in the area was not only environmentally unsustainable but also financially unprofitable with farms typically being abandoned after 5 years of operation. Bann (1997b) conducted another economic valuation study using similar methods, this time on tropical forest land use options in Ratanakiri Province. The study found that the benefits from the traditional sustainable use of forest resources exceed the benefits from commercial timber extraction in the study area by at least $200 per hectrare, indicating that said areas, especially those with high cultural value and environmental significance, might best be managed by local communities. Hap, et al. (2001) also employed the net economic value method to assess the value of flooded forests in Kandal Province. The results indicated that flooded forest resources have significant benefits in terms of fishing, fuel wood and vegetable production and were more profitable as they were to the local population as compared to when they are converted for other uses such as for agriculture.
Sy et al. (2002) conducted a valuation study on forest use in Chumkiri District,
Kampot Province again using the net economic value method and found that the net income from forest dependent activities of local households was significant and formed about 38 percent of the total income.Chamroeun et al. (2002) assessed the environmental and health effects of agrochemical use in rice production in Takeo Province using the productivity change approach and human capital approach. Although the costs were not quantified, the study found that agrochemical use resulted to negative health effects on the part of the farmers and lower fish productivity in the rice paddies, not to mention that

22
they entail higher production costs in rice farming. De Lopez et al (2002) used CVM techniques to analyze policy options for the Ream National Park and found that the park is critical to the livelihood of local communities there, the existence of trawlers and illegal fishing operators threaten the livelihood of local communities, and that the WTA particularly of foreign tourists for a boat ride in the park is high, indicating the great potential of the park as a tourist destination. Finally, Roudy (2002) conducted a study on the natural resource use and livelihood trends in the Tonle Sap floodplains mainly using the net economic value method and found that the area significantly contributes to the livelihood of the communities there in addition to the contributions of the area to the national economy.
4.4 Valuation Methods for the MVP
The above review shows that in general the different categories of economic valuation and the specific economic valuation methods under them can find potential application in the analysis of the usefulness of aquatic resources to the people in the LMB. The MVP project, however, decides only on the use of valuation methods that require data from actual markets for the following reasons:
a. The project covers rural villages, within which many of the households belong
to low-income groups. Due to the constraints stated beforehand, the WTP and WTA of these households are low and not reflective of what it would be if the constraints do not exist.
b. The project uses economic valuation in tandem with socioeconomic and
livelihood analysis as the tools of analysis. In general, socioeconomic and livelihood analysis requires the use of data of economic activities of households based on actual markets.
c. The study uses one generic questionnaire for the survey to gather the main
data needed for economic valuation and livelihood analysis (The other way of data gathering to be used by the project is PRA and similar methods). The development of specialized questionnaires to address non-market based valuation for specialized issues is beyond the financial and time resources of the project.
d. Economic valuation is new in the sites covered by the MVP. Since part of the
intention of the project is capacity building by way of training local government and NGO counterparts in economic valuation and livelihood analysis, market-based approaches that are relatively more straightforward is given emphasis.
23
5. Conclusions
In future efforts, economic valuation in the LMB should begin to use non-actual market based valuation since there are several valuation-related issues in the area that can be addressed using it. Many of activities of households and communities now and in the future do not go through formal markets but must be investigated because of their significant NRE impacts.
The MVP project in the LMB, particularly Cambodia, aims to understand the value of aquatic resources and the constraints to their access by using economic valuation and socioeconomic and livelihood analysis. It is a unique process in that those involved in the action research are not only researchers but also non-research oriented government and NGO personnel. This is done partly to instill research knowledge and promote capacity building among the different personnel and institutions working in research and development in the region.
References Ahmed, M., H. Navy, Ly Vuthy and M. Tiongco (1998). Socio-economic assessment of
freshwater capture fisheries of Cambodia report of a household survey. Mekong River Commission, Phnom Penh, Cambodia.186 p.
Bennett, J., M. Morrison and R. Harvey (2000). A river somewhere – valuing the
environmental attributes of rivers. Paper Presented to the Conference of the International Society of Ecological Economics, Canberra, Australia, July 2000.
Bann, C. (1997a). An economic analysis of tropical forest land use options, Ratanakiri
Province, Cambodia. Research Reports. Economy and Environment Program for Southeast Asia, Singapore. 73 p.
_____________(1997b). An economic analysis of alternative mangrove management
strategies in Koh Kong Province, Cambodia. Research Reports. Economy and Environment Program for Southeast Asia, Singapore. 58 p.
Barbier, B., M. Acreman, and D. Knowler (1996). Economic valuation of wetlands: a
guide to policy makers and planners. Ramsar Convention Bureau, Gland, Switzerland.
Bojo, J., K. Maler, and L. Unemo (1992). Environment and development: an economic
approach. Economy and Environment, Volume 6. Published by Kluwer Academic Publishers, the Netherlands. 211 p.

24
Braden, J. B. and C. D. Kolstad, Eds. (1991). Measuring the demands for environmental quality, Contributions to Economic Analysis 198, Elsevier Science Publishers B. V. 369 p.
Center for the Economics and Management of Aquatic Resources and Support Unit for
International Fisheries and Aquatic Research (2002). Design of a research programme for the social and economic valuation of the aquatic resources of the lower Mekong Basin. Report Prepared for the United Kingdom Department for International Development. 89 p.
Chamroeum, M. K. Vann and V. Sun (2002). “Survey on environmental and health
effects of agrochemical use in rice production in Takeo Province, Cambodia.” in McKennney, B. (ed.) Economy and Environment Case Studies in Cambodia. Research Report No. 2002-RR4. Economy and Environment Program for Southeast Asia, Singapore. pp. 8-16.
De Lopez, T. T., Kan Vibol, Som Proeung, Pol Dareth, Sing Thea, Cheiv Sarena, Sim
Song, Veoun Chantha, Nget Vandy, Leng Bunly, and Choeun Sinoeun (2001). Policy options for Cambodia’s Ream National Park: A Stakeholder and Economic Analysis. Research Report No. 2001-RR5. Economy and Environment Program for Southeast Asia, Singapore. 74 p.
Department of Fisheries (2002). Annual report of Department of Fisheries on fishery
2002 and planning for 2003. _____________ (2000). Fisheries Data Collection 1980-99. Dixon, J. A., R. A. Carpenter, L. A. Fallon, P. B. Sherman and S. Manopimoke (1986).
Economic analysis of the environmental impacts of development projects. Asian Development Bank. Published by Earthscan Publications Limited, London. 134 p.
Dixon, J. A. and M. M. Hufschmidt (1986). Economic valuation techniques for the
environment. East-West Center. Published by the John Hopkins University Press, Baltimore and London. 203 p.
Dorfman, R. and N. S. Dorfman (1993). Economics of the environment selected
readings. Published by the W. W. Norton and Company, Inc., New York and London. 437 p.
Encarta (2003). Cambodia. Encylopedia article from Encarta. In
http://www.encarta.msn.com. Folmer, H. and E. Van Ierland, Eds. (1989). Valuation methods and policy making in
environmental economics. Elsevier Science Publishers B. V. 259 p.

25
Freeman, A. M. III (1979). The benefits of environmental improvement theory and practice. Published by Resources for the Future by the John Hopkins University Press, Baltimore and London. 272 p.
Hap, N., S. Thay and V. Hav (2001). Valuation of flooded forests in Kandal Province.
Economy and Environment Program for Southeast Asia, Singapore. 31 p. Hook, J., S. Novak and R. Johnston (2003). Social atlas of the Lower Mekong Basin.
Mekong River Commission, Phnom Penh, Cambodia. 154 p. Hufschmidt, M. M., D. E. James, A. D. Meister, B. T. Bowler and J. A. Dixon (1983).
Environment, natural systems, and development: an economic valuation guide. The John Hopkins University Press. 337 p.
International Institute for Environment and Development (1997). Valuing the hidden
forest: methodological approaches for local-level economic analysis of wild resources. Research Series Volume 3 Number 4, Sustainable Agriculture Programme, IIED, London. 71 p.
Mekong River Commission (2003). About the Mekong. In
http://www.mrcmekong_org/about_mekong. _____________ (2002). Fisheries in the Lower Mekong Basin. MRC Technical Paer
No. 6. 95 p. McKenny, B. (2001). Economic valuation of livelihood income losses and other tangible
downstream impacts from the Yali Falls Dam to the Se San River Basin in Ratanakiri Province, Cambodia. Prepared for Oxfam America, Southeast Asia Regional Office, Phnom Penh, Cambodia. 110 p.
National Institute of Statistics (2002). National Accounts of Cambodia 1993-2001. _____________ (2000). Report on the Cambodia socio-economic survey 1999. _____________ (1999). 1998 population census of Cambodia. Nguyen, T. H. and D. T. Tran (1999). “Using travel cost method to evaluate the tourism
benefits of Cuc Phuong National Park.” in Francisco, H. and D. Glover (eds.) Economy and Environment Case Studies in Vietnam. Economy and Environment Program for Southeast Asia, Singapore. pp. 121-49
Nguyen, H. D., C. T, Tran, V. H. Nguyen, T. L. Nguyen, V. M. Dang, D. T. Trinh, T. L.
N. Huynh, Nguyen T. P. and T. S. Thai (1999). “Impact of agrochemical use on productivity and health” in Francisco, H. and D. Glover (eds.) Economy and Environment Case Studies in Vietnam. Economy and Environment Program for Southeast Asia, Singapore. pp. 57-120.

26
Pham, T. X. M. Q. H. Truong, and V. T. Kieu (1999). “Valuation of non-timber products
in Luong Son District, Hoa Binh Province.” in Francisco, H. and D. Glover (eds.) Economy and Environment Case Studies in Vietnam. Economy and Environment Program for Southeast Asia, Singapore. pp. 121-49
Roudy, G. (2002). Natural resource use and livelihood trends in the Tonle Sap
floodplain, Cambodia. A report submitted in partial fulfillment of the requirement for the MSc in Environmental Technology. Imperial College of Science, Technology and Medicine, University of London. 88 p.
Ryan, M. (1996). Using consumer preferences in health care decision making: the
application of conjoint analysis. Office of Health Economics, London, UK. Sy, R. K. Hou, C. Chay, and S. Meas (2002). “Forest use and product flow in Chumkiri
District, Kampot Province, Cambodia.” in McKennney, B. (ed.) Economy and Environment Case Studies in Cambodia. Research Report No. 2002-RR4. Economy and Environment Program for Southeast Asia, Singapore. pp. 1-7.
To, T. T. H. and T. N. A. Nguyen (1999). “An economic analysis of Can Gio mangrove
scheme in Ho Chi Minh City” in Francisco, H. and D. Glover (eds.) Economy and Environment Case Studies in Vietnam. Economy and Environment Program for Southeast Asia, Singapore. pp. 204-220.
Tran, N. K. and X. T. Lai (1999). “An economic analysis of agroforestry systems in
Central Vietnam” in Francisco, H. and D. Glover (eds.) Economy and Environment Case Studies in Vietnam. Economy and Environment Program for Southeast Asia, Singapore. pp. 173-201.
Tran, T. B. and C. D. Le (1999). “Economic and environmental impacts of rice-shrimp
farming in the Mekong Delta” in Francisco, H. and D. Glover (eds.) Economy and Environment Case Studies in Vietnam. Economy and Environment Program for Southeast Asia, Singapore. pp. 221-251.
United Nations Development Program (2002). Human Development Report 2002.
Oxford University Press. 277 p.

27
Appendix Tables Table 1. Selected Indicators for LMB Countries
Indicator Cambodia Thailand Lao PDR Vietnam
Population in 2000 (Millions) 13.1 62.8 5.3 78.1 Land Area (Sq. Km.) 176,520 511,770 230,800 325,360
Population Density (P/Sq. Km.) 74.2 122.7 22.9 240.0 Annual Population Growth 2.5 1.7 2.2 2.0
Rate (1975-2000 in %) GDP in 2000 (US $Billions) 3.2 122.2 1.7 31.3
GDP Per Capita (US$) 244.3 1,945.9 320.8 400.8 GDP Per Capita Annual 1.9 5.5 3.2 4.8
Growth Rate (1975-2000 in %) Adult Literacy Rate (2000 in %) 67.8 95.5 48.7 93.4
National Poverty Line 36.1 13.1 46.1 50.9 (1983-2000 in %)
Source: UNDP (2002) Table 2. Gross Domestic Product (GDP) and Per Capita GDP of Cambodia, at Constant 1993 Prices, 1993-2001
GDP Annual Growth Per Capita GDP Annual Growth
Years (Billion Riels) Rate (%) (Thousand Riels) Rate
1993 6,545 691 1994 7,047 7.7 708 2.5 1995 7,464 5.9 713 0.7 1996 7,808 4.6 708 -0.7 1997 8,143 4.3 700 -1.1 1998 8,318 2.1 683 -2.4 1999 8,889 6.9 711 4.2 2000 9,570 7.7 746 5.0 2001* 10,171 6.3 774 3.7
Average 8,217 5.7 715 1.5
Source: National Institute of Statistics (2002) * Preliminary estimates

28
Table 3. Gross Domestic Product (GDP) of Cambodia, by Sector, at Constant 1993 Prices, in Million Riels, 1993-2001
Agri., Fisheries,
Years & Forestry Industry Services Others Total
1993 3,034,330 756,350 2,574,399 179,556 6,544,635 1994 3,350,608 801,962 2,560,895 333,498 7,046,963 1995 3,498,061 969,426 2,707,460 289,304 7,464,251 1996 3,578,662 1,065,243 2,805,028 358,717 7,807,650 1997 3,774,109 1,291,684 2,733,412 344,117 8,143,322 1998 3,887,772 1,385,861 2,751,544 293,153 8,318,330 1999 3,888,311 1,569,109 2,945,966 485,706 8,889,092 2000 3,876,073 2,111,628 3,115,730 466,238 9,569,669 2001* 4,025,664 2,439,389 3,205,187 505,975 10,176,215
Average 3,657,065.56 1,376,739.11 2,822,180.11 361,807.11 8,217,791.89
% to Total 0.45 0.17 0.34 0.04 1.00
Source: National Institute of Statistics (2002) * Preliminary estimates. Table 4. Selected Socioeconomic Indicators of Cambodia, 1999
Phnom Other
Indicator Penh Urban Rural Cambodia
Population (Millions) 0.958 1.172 9.431 11.561 Number of Households ('000) 174 215 1,776 2,165
Household Size 5.5 5.4 5.3 5.3 % Female Population 51.9 51.8 51.6 51.6
Age Dependency Ratio 57.0 77.1 79.1 76.8 Adult Literacy Rate 87.3 72.0 69.2 71.2 Unemployment Rate 0.5 0.4 0.6 0.6
Monthly Income Per Person 219,771 98,506 62,635 79,355 (in Riel)
Source: National Institute of Statistics (2000)

29
Table 5. Gross Domestic Product (GDP) of Agriculture, Fisheries & Forestry of Cambodia, at Constant 1993 Prices, in Million Riels, 1993-2001
Livestock & Forestry %
Years Crops Poultry Fisheries Logging Total
1993 3,034,330 756,350 2,574,399 179,556 6,544,635 1994 3,350,608 801,962 2,560,895 333,498 7,046,963 1995 3,498,061 969,426 2,707,460 289,304 7,464,251 1996 3,578,662 1,065,243 2,805,028 358,717 7,807,650 1997 3,774,109 1,291,684 2,733,412 344,117 8,143,322 1998 3,887,772 1,385,861 2,751,544 293,153 8,318,330 1999 3,888,311 1,569,109 2,945,966 485,706 8,889,092 2000 3,876,073 2,111,628 3,115,730 466,238 9,569,669 2001* 4,025,664 2,439,389 3,205,187 505,975 10,176,215
Average 3,657,066 1,376,739 2,822,180 361,807 8,217,792
% to total 0.45 0.17 0.34 0.04 1.00
Source: National Institute of Statistics (2002) * Preliminary estimates.
Table 6. Annual Rate of Growth (%) of Gross Domestic Product (GDP) of Agriculture, Fisheries & Forestry of Cambodia, at Constant 1993 Prices, in Million Riels, 1990-2001
Livestock & Forestry %
Years Crops Poultry Fisheries Logging Total
1994 0.10 0.06 -0.01 0.86 0.08 1995 0.04 0.21 0.06 -0.13 0.06 1996 0.02 0.10 0.04 0.24 0.05 1997 0.05 0.21 -0.03 -0.04 0.04 1998 0.03 0.07 0.01 -0.15 0.02 1999 0.00 0.13 0.07 0.66 0.07 2000 0.00 0.35 0.06 -0.04 0.08 2001* 0.04 0.16 0.03 0.09 0.06
Average 0.04 0.16 0.03 0.18 0.06
Source: National Institute of Statistics (2002) * Preliminary estimates.

30
Table 7. Fisheries Production, Cambodia, by Subsector, in Tons, 1990-2001
Years Inland Marine Aquaculture Total
1990 65,100 39,900 6,400 111,400 1991 74,700 36,400 6,700 117,800 1992 68,900 33,700 8,550 111,150 1993 67,900 33,100 7,900 108,900 1994 65,000 30,000 8,200 103,200 1995 72,500 30,500 9,510 112,510 1996 63,510 31,200 9,600 104,310 1997 73,000 29,800 11,800 114,600 1998 75,700 32,200 14,100 122,000 1999 231,000 38,100 15,000 284,100 2000 245,600 36,000 14,430 296,030 2001 385,000 42,000 17,500 444,500
Average 123,993 34,408 10,808 169,208
% to Total 0.73 0.20 0.06 1.00
Source: Department of Fisheries (2000, 2002) Table 8. Annual Rate of Growth (%) of Fisheries Production, Cambodia, by Subsector, 1991-2001
Years Inland Marine Aquaculture Total
1991 0.15 -0.09 0.05 0.06 1992 -0.08 -0.07 0.28 -0.06 1993 -0.01 -0.02 -0.08 -0.02 1994 -0.04 -0.09 0.04 -0.05 1995 0.12 0.02 0.16 0.09 1996 -0.12 0.02 0.01 -0.07 1997 0.15 -0.04 0.23 0.10 1998 0.04 0.08 0.19 0.06 1999 2.05 0.18 0.06 1.33 2000 0.06 -0.06 -0.04 0.04 2001 0.57 0.17 0.21 0.50
Average 0.26 0.01 0.10 0.18
Source: Department of Fisheries (2000, 2002)

31
Table 9. Socioeconomic Indicators of Provinces Covered by the MVP
Indicator Siem Reap Takeo Stung Treng
Population in 1998 ('000) 696.2 790.2 81.1 Land Area (Sq. Km.) 10,298.8 3,562.7 11,109.6
Population Density (P/Sq. Km.) 67.6 221.8 7.3 Dependency Ratio (%) 91.7 92.8 87.9
Household Size (Persons/HH) 5.4 5.1 5.6 Female Household Heads (%) 27.6 26.5 16.8
Migrant Population (%) 1.8 1.4 4.4 Labor Force Participation Rate (%) 76.0 73.3 79.7
Agricultural Employment (%) 82.4 90.1 79.4 Unemployment (%) 4.6 3.5 2.7
Poverty Rate in 2002 (%) 53.7 15.2 16.4 Access to Safe Water (%) 13.4 13.0 19.3 Access to Sanitation (%) 10.7 8.3 18.4 Access to Electricity (%) 9.4 4.6 14.1
Infant Mortality Rate (Per 1,000) 76 66 122 Child Malnutrition (%) 47.2 43.4 47.8
Male Literacy Rate (%) 63.9 81.8 54.0 Female Literacy Rate (%) 43.1 65.4 44.5
Source: Hook et al. (2003)
Table 10. Inland Fisheries Production of Cambodia, by Province, in Tons, 1990-2002
Years Siem Reap Takeo Stung Treng Others Total
1990 9,000 1,900 680 53,520 65,100 1991 9,000 2,000 700 63,000 74,700 1992 9,760 2,133 500 56,507 68,900 1993 8,800 1,800 600 56,700 67,900 1994 8,500 1,850 500 54,150 65,000 1995 8,000 1,760 515 62,225 72,500 1996 7,500 1,400 460 54,150 63,510 1997 7,100 1,345 455 64,100 73,000 1998 7,300 1,360 620 66,420 75,700 1999 7,000 1,500 700 61,800 71,000 2000 6,600 2,870 750 75,380 85,600 2001 15,000 5,000 2,500 112,500 135,000
Average 8,630 2,077 748 65,038 76,493
% to Total 0.11 0.03 0.01 0.85 1.00
Source: Department of Fisheries (2000, 2002)

32
Table 11. Rate of Growth (%) in Inland Fisheries Production of Cambodia, by Province, in Tons, 1991-2001
Years Siem Reap Takeo Stung Treng Others Total
1991 0.00 0.05 0.03 0.18 0.15 1992 0.08 0.07 -0.29 -0.10 -0.08 1993 -0.10 -0.16 0.20 0.00 -0.01 1994 -0.03 0.03 -0.17 -0.04 -0.04 1995 -0.06 -0.05 0.03 0.15 0.12 1996 -0.06 -0.20 -0.11 -0.13 -0.12 1997 -0.05 -0.04 -0.01 0.18 0.15 1998 0.03 0.01 0.36 0.04 0.04 1999 -0.04 0.10 0.13 -0.07 -0.06 2000 -0.06 0.91 0.07 0.22 0.21 2001 1.27 0.74 2.33 0.49 0.58
Average 0.09 0.13 0.24 0.08 0.08
Source: Department of Fisheries (2000, 2002) Table 12. Socioeconomic Profile of Households in Fishing Districts in Cambodia, 1995-96
Indicator Statistic
Average Household Size 6 Male to Female Ratio in Household 49:51 Households Headed by Women (%) 19 Literacy Rate of Household Head (%) 80
Household Heads with Fishing as Primary Occupation (%) 68 Households Dependent on Common Property or Publicly
Owned Resources (%) 92
Source: Ahmed et al. (1998)

33