ar '2001 mech fi - mtaweb.mta.info/mta/investor/pdf/annualreport2001.pdf · mta long island...
TRANSCRIPT

Printed on recycled paper
State of New York
347 Madison AvenueNew York, NY 10017-3739
www.mta.info
© 2002 Metropolitan Transportation Authority
ANNUAL REPORTCom
prehensive Annual Financial R
eport for the Year Ended D
ecember 3
1, 2
00
1
Comprehensive Annual Financial Report for the Year Ended December 31, 2001
2001

contentsThe MTA Agencies
MTA New York City Transit 26
MTA Long Island Rail Road 30
MTA Long Island Bus 32
MTA Metro-North Railroad 34
MTA Bridges and Tunnels 36
Chairman’s Letter 2
MTA Leadership 4
2001 Consolidated Financial Highlights 6
Capital Program Progress 7
The MTA in 2001 8
Ridership 16
Financial Performance 18
Customer Enhancements 20
The MTA
M E T R O P O L I T A N T R A N S P O R T A T I O N A U T H O R I T Y
Cover photos: After the September 11 attacks thousands of MTA volunteersspearheaded the rescue effort using MTA equipment; thousands moreworked behind the scenes at the myriad tasks that keep mass transit running safely and reliably.
WTC image: Alan Chin/Gamma

MTA Employees
1991
1992
1993
1994
1995
1996
1997
1998
1999
2000
Comprehensive Annual Financial Report
Introductory Section
Letter of Transmittal 1
Certificate of Achievementfor Excellence in Financial Reporting 8
MTA Organizational Structure 9
Financial Section
Report of Independent Accountants 11
Combined Financial Statements 12
Notes to Combined Financial Statements 18
Required Supplementary Information 44
Combining Financial Statements 46
Statistical Section
10-Year Statistical Tables 59
2001 Operating Statistics 64
Subway in four boroughs, buses andparatransit in five boroughs, and theStaten Island Railway.
Rail lines in Nassau and Suffolkcounties and in New York City; thelargest commuter railroad in theUnited States.
Buses and paratransit in Nassau, western Suffolk, and eastern Queens counties; funded through Nassau County.
Rail lines in Westchester, Putnam,Dutchess, Orange, and Rockland counties and in Connecticut and New York City.
Seven bridges and two tunnels in New York City; toll revenues help subsidize mass transit.
1

Chairman’s Letter
M E T R O P O L I T A N T R A N S P O R T A T I O N A U T H O R I T Y2
and open up new alternatives. East Side Access willgive the hundreds of thousands of people who useMTA Long Island Rail Road every day the option ofgetting directly into the West Side’s Penn Station orthe East Side’s Grand Central Terminal. The SecondAvenue subway will give the 1.2 million people whowork on the East Side — more people than live inBoston, Seattle, or Washington, D.C. — an effectivealternative to the nation’s busiest subway, theLexington Avenue line, and relieve congestion. Theextension of the 7 line west from Times Square willprovide service to a fast-growing business districtand enhance the region’s mobility.
Our system is a gateway to opportunity and a driverof the metropolitan area’s vitality. It affords peoplethe means to get to and from work, fuels the con-struction industry, enhances economic activity, andattracts investment.
The expansion projects will attract additional busi-ness and tourists into the region. In the coming yearwe will particularly focus on the reauthorization ofcritical federal transit legislation, which plays suchan essential role in helping maintain and expand oursystem. The federal government must continue to bea partner in promoting and expanding public transitin our region.
Before 9/11, ridership had been growing. Immediatelyafter 9/11, it fell dramatically. But customers quicklybegan returning, and the MTA family’s commitmentto quality has brought ridership essentially back upto pre-9/11 levels. Despite all our agencies’ deepinvolvement with 9/11 recovery, the focus on safety,
September 11 put every New Yorker, every American,to the test. It is with great pride that I report that,under Governor George E. Pataki’s strong and deci-sive leadership, the MTA family came through withremarkable effectiveness and resolve: not oneemployee, not one customer, was lost or seriouslyinjured. Several thousand MTA volunteers with MTAequipment headed the very first rescue operations atGround Zero, and MTA personnel took on a leader-ship role at the site. Working around the clock torestore and maintain service so that more than sevenmillion people could return home safely, every one ofthe MTA’s 65,000 employees played an importantrole: some wielded torches and cut metal in theruins, some kept the system running, and otherssupported the effort from their desks, carrying outthe countless tasks it takes to keep an organizationfunctioning. I have always believed that the MTA’sstrength is its people; in the wake of 9/11, I sawthat strength firsthand in countless examples ofcommitment and heroism.
We are now channeling that commitment to longer-term efforts. We restored service on the N/R linesand will do the same for the 1/9 by the last quarterof 2002, well ahead of original estimates. Our2000–2004 Capital Program plans — maintainingthe system in a state of good repair and expanding itfor the first time in 60 years — remain at the top ofmy agenda.
September 11 very powerfully demonstrated that thesystem’s capacity and flexibility are crucial to ourregion. Maintaining a state of good repair preservesthe system; expansion will enhance service quality
April 8, 2002

3
reliability, and customer satisfaction has producedmany improvements. Governor Pataki’s vision of anintegrated transit system and fare policy has broughtdown the average fare to $1.06, making a subway orbus ride a genuine bargain — even more attractivewhen inflation is factored in. Governor Pataki hascontinued to support this effort with a pledge of$245 million in additional operating funds that willenable us to maintain this fare through 2002. Andwith almost 700 new high-tech subway cars, customers are finding that a subway ride can be genuinely comfortable.
We have learned many lessons from 9/11 and we arewell positioned for the tasks ahead. Our new execu-tive director, Katherine N. Lapp, formerly the state’sdirector of Criminal Justice, has a proven record ofreducing crime in New York State and has the kind of management expertise we need to further ourefforts. Protecting our customers and our human andmaterial assets has always been the MTA’s firstorder of business. Since 9/11 security has taken onnew dimensions. Toward that end, I have appointedLouis R. Anemone deputy executive director anddirector of security responsible for security through-out the system. He was previously deputy director of Governor Pataki’s Office of Public Security, andbefore that the four-star chief of department at theNew York City Police Department.
This is an exciting and challenging time, and I believethe dedicated people of the MTA are up to the chal-lenge. Working together, we will rebuild and expandthe system. I have been proud to be associated with
the MTA for many years, as a board member, as vicechairman, and now as chairman. Yet with each newday, I am even more impressed with this vast organi-zation. We have a $7 billion budget. We providesome eight million rides daily. In three days, the MTAmoves more people than Amtrak does in a year. In11 weeks, more people ride with the MTA than flywith the nation’s airlines in an entire year. In twoand a half years, we move the equivalent of everyman, woman, and child on the planet.
And ridership is growing again: clear proof that thepeople of the New York region need the system, anda strong indication that their confidence and spiritare reviving. At the MTA, we feed this resurgence:the 2000–04 Capital Program is our blueprint forbuilding a secure, reliable, and flexible system — onethat will make the region a richer, more productiveplace for people to live and work and a prime touristdestination.
I am grateful to E. Virgil Conway and Marc V. Shawfor the legacy of their achievement, and I intend tocontinue the momentum of their energetic leadership.Though the coming years will never erase the terriblememories of 9/11, they will be a time of growth,expansion, and renewal.
Peter S. KalikowChairman

M E T R O P O L I T A N T R A N S P O R T A T I O N A U T H O R I T Y4
row 1 Peter S. Kalikow, Chairman; David S. Mack, Vice Chairman; Ronnie P. Ackman, Nancy Shevell Blakeman, Anthony J. Bottalico, Kenneth A. Caruso
row 2 Thomas J. Cassano, Beverly L. Dolinsky, Edward B. Dunn, Barry Feinstein, Alan B. Friedberg, Lawrence W. Gamache
row 3 James H. Harding Jr., Robert M. Harding, James L. McGovern, Ernest J. Salerno, Andrew M. Saul, James L. Sedore Jr.
row 4 Larry Silverman (resigned November 2001), James S. Simpson, Edward A. Vrooman, Rudy Washington, Alfred E. Werner
Not shown: Joseph Rutigliano
MTA Board (left to right)

MTA Leadership
5
Agency Presidents (left to right)
MTA Management (left to right)
row 1 Peter S. Kalikow, Chairman
Katherine N. Lapp, Executive Director and Chief Operating Officer
Louis R. Anemone, Deputy Executive Director/Director of Security
Maureen E. Boll, Chief of Staff
Christopher P. Boylan, Deputy Executive Director/Corporate Affairs & Communications
row 2 Gary G. Caplan, Director of Budgets & Financial Management
Mary J. Mahon, Deputy Executive Director/General Counsel & Secretary
Paul Spinelli, Auditor General
Michael C. Ascher, MTA Bridges and Tunnels; Kenneth J. Bauer, MTA Long Island Rail Road;
Peter A. Cannito, MTA Metro-North Railroad; Lawrence G. Reuter, MTA New York City Transit;
Neil S. Yellin, MTA Long Island Bus

M E T R O P O L I T A N T R A N S P O R T A T I O N A U T H O R I T Y6
2001 Consolidated Financial Highlights$ millions
Financing MTA Operations Where the Money Came From
Fares and operating revenues, $3,137 42.01%except tolls
Tolls 915 12.25
State subsidies 217 2.90
Local subsidies 324 4.34
Other subsidies 39 0.52
State/regional taxes 1,630 21.83
Other* 1,206 16.15
Federal subsidies 0 0.00
Total $7,468 100.00%
Where the Money Goes
NYC buses and subways $4,487 60.08%
Commuter rail, suburban 1,976 26.46buses, Staten Island Railway,and MTA headquarters
Bridges and tunnels 288 3.86
Debt service and other 717 9.60
Total $7,468 100.00%
�
�
�
�
�
�
�
�
�
�
�
*Includes decrease in accumulated surplus.
2001 MTA Totals
Assets $37,415 100.00%
Properties and equipment $26,186 69.99%
All other 11,229 30.01
�
�
�
�
�
Liabilities $37,415 100.00%
Long-term debt $15,293 40.87%
Contributed capital and 16,502 44.11 accumulated surplus
All other 5,620 15.02

77
Capital Program Progress$ millions
Capital Program Funding (Received through December 31, 2001)*
1982–01 2001
MTA federal grants $ 12,288 $ 919State appropriations 621 –City appropriations 3,201 42 MAC surplus 925 –Port Authority 175 –Coliseum and East Side Airlines Terminal 122 –Capital-operating transfer 489 –Lessor equity 515 –MTA bonds 11,327 1,390Pay-as-you-go 670 –State service contracts 1,869 –Beneficial interest certificates 80 –Investment income 1,797 175Other 997 29
Total $35,076 $ 2,555
Capital Program Commitments, Expenditures, Completions Progress, 2001
CommitmentsExpendituresCompletions
3,4162,9992,788
2,1912,1432,299
466387248
33019998
154180144
MTA New YorkCity Transit
MTA Long IslandRail Road
MTA Metro-NorthRailroad
MTA Bridges and Tunnels
MTA Total*
Notes: Because of rounding, totals may not add exactly. Commitments may be more than receipts since bonds aresold as cash is needed.
* In 2000 the MTA consolidated a number of categories that were reported separately in prior years. Programincome and TBTA investment income were combined into Investment Income, and Developer Contributions wereadded to Other.
Capital Program Progress, 1982–2001*
Commitments Expenditures Completions
MTA Total** $ 39,258 $ 31,951 $27,503MTA New York City Transit 27,897 23,031 19,405MTA Long Island Rail Road 5,272 4,310 4,198MTA Metro-North Railroad 3,793 3,300 3,052MTA Bridges and Tunnels† 1,582 1,119 848
* Table does not include $92 million of commuter rail project commitments made in the 1982–1991 Capital Program for commuter rail projects that could not be assigned to any agency since they benefited severalagencies.
** MTA totals include the following amounts attributable to East Side Access: total commitments, $422 million;total expenditures, $187 million; commitments in 2001, $275 million; and expenditures in 2001, $86 million;and the following amounts attributable to other expansion projects: total commitments, $292 million; totalexpenditures, $4 million; commitments in 2001, $291 million; and expenditures in 2001, $4 million.
† Participation in the MTA Capital Program began in 1992. Before consolidating its capital program with theMTA’s, MTA Bridges and Tunnels self-funded and maintained a separate capital budget for five decades, allo-cating millions of dollars in expenditures annually for capital improvements to its bridges, tunnels, and otherfacilities. Its funding is not included in the Capital Program Funding table above.
M E T R O P O L I T A N T R A N S P O R T A T I O N A U T H O R I T Y8
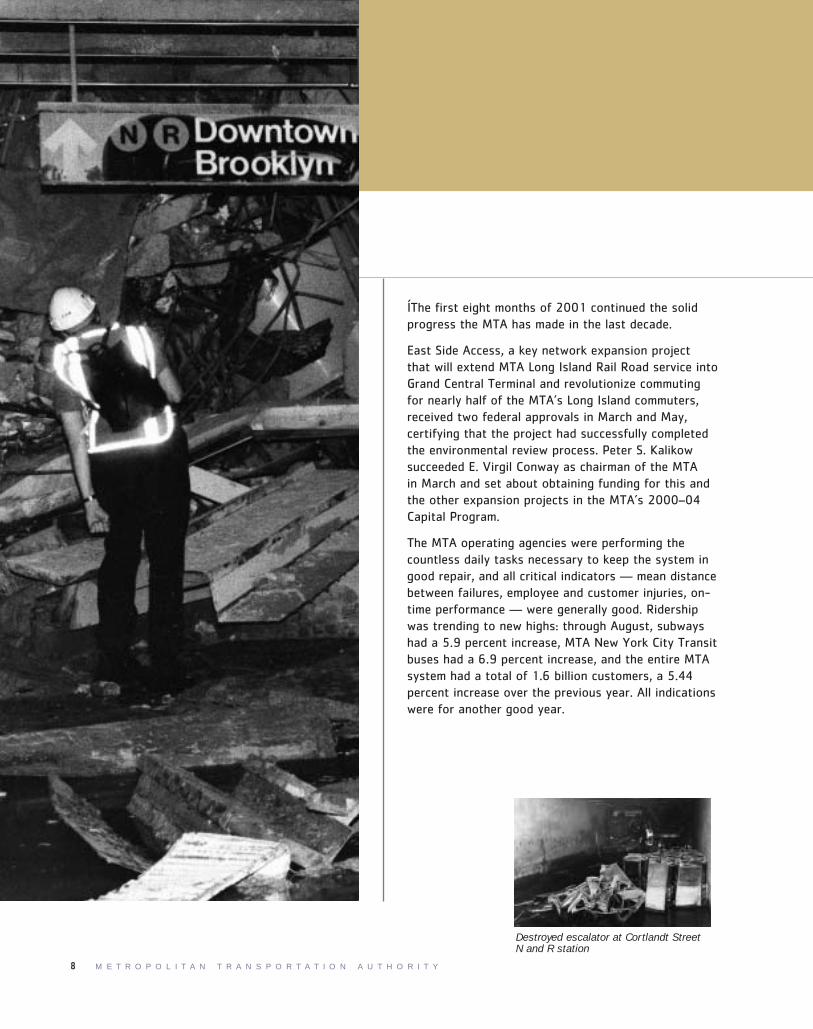
ÍThe first eight months of 2001 continued the solidprogress the MTA has made in the last decade.
East Side Access, a key network expansion project that will extend MTA Long Island Rail Road service intoGrand Central Terminal and revolutionize commutingfor nearly half of the MTA’s Long Island commuters,received two federal approvals in March and May, certifying that the project had successfully completedthe environmental review process. Peter S. Kalikowsucceeded E. Virgil Conway as chairman of the MTA in March and set about obtaining funding for this and the other expansion projects in the MTA’s 2000–04Capital Program.
The MTA operating agencies were performing thecountless daily tasks necessary to keep the system ingood repair, and all critical indicators — mean distancebetween failures, employee and customer injuries, on-time performance — were generally good. Ridershipwas trending to new highs: through August, subwayshad a 5.9 percent increase, MTA New York City Transitbuses had a 6.9 percent increase, and the entire MTAsystem had a total of 1.6 billion customers, a 5.44percent increase over the previous year. All indicationswere for another good year.
Destroyed escalator at Cortlandt StreetN and R station

The MTA in 2001
9
September 11, 2001
The terrorist attack on the World Trade Center tookalmost 3,000 lives, obliterated two of New York’ssignature landmarks, seriously damaged two subwaystations and a length of subway tunnel, and createdimmediate crises in evacuation and security as wellas long-term challenges for public transportation inthe metropolitan area. The MTA’s response wasimmediate, orderly, and effective, in large partbecause MTA personnel had been trained to takeappropriate action in accord with Emergency Plans.As a result of disciplined response, teamwork, andcooperation among agencies, no customer, employee,or subway train was lost. Service was largelyrestored within hours, enabling more than seven million New Yorkers and commuters all over theregion to return home safely despite the shock anduncertainty of the situation.
Immediate Response
At 8:47 a.m. a northbound R train had just pulledinto the Cortlandt Street station east of the WorldTrade Center when the train operator heard anexplosion and felt the train rock. Seeing debris andsmoke pouring into the station, he directed the conductor to hold the doors open and announce thatpassengers should get back on the train. He walkedthe platform, made sure all passengers were onboard, rushed back to the controls, and drove thetrain to City Hall station. It was the last subway toleave the area under Ground Zero before the TwinTowers collapsed.
Subways in lower Manhattan were immediatelyordered to bypass all stations near the World TradeCenter, and Transit personnel helped customers instations get to safe locations. An estimated 60,000customers and 300 employees in the immediate areawere evacuated. Managers and supervisors walkedtracks to manually flag trains through areas wheresignals were not working because of power failures.At 10:20, on word of the attack on the Pentagon, all service — including commuter trains — was suspended. Supervisors checked subway tunnels andstations to be sure no passengers were stranded andthat all equipment was safe, secure, and operationalso that service could be restored at a moment’snotice. At 12:48 service began to be restored; A linetrains skipped Chambers Street and Broadway/Nassaunear the site of the attack. By midafternoon subwayservice was available at many stations; by day’s end65 percent of service was running, bypassing stations near Ground Zero. MTA Metro-North andLong Island Rail Road suspended service into NewYork City. There were two evacuations of GrandCentral Terminal and one of Penn Station, andinspections of suspicious packages. Outbound trainsfollowed a “load-and-go” procedure and made alllocal stops to the end of the lines. The LIRR accom-modated large numbers of extra customers atFlatbush Avenue and Jamaica, and resumed normalservice at 7 p.m.

M E T R O P O L I T A N T R A N S P O R T A T I O N A U T H O R I T Y10

11
Above ground, bus operators near Ground Zero gotas many passengers as they could into ash-coveredNYC Transit buses and drove them out of danger.Buses provided the bulk of emergency responsetransportation for weeks, including an emergencyshuttle system, bringing firefighters, police, EMS, the military, and many others to Ground Zero. Transitprovided over 225 buses during the first week of theemergency, over 150 buses a day in the secondweek, and at least 50 buses a day through December.A total of 5,965 buses and operators were provided.MTA Long Island Bus diverted 20 buses to assist thecity’s Office of Emergency Management.
MTA Bridges and Tunnels officers at the Brooklyn-Battery Tunnel on both sides of the river saw thefirst explosion and immediately opened the HOV laneon the Brooklyn side for use by emergency vehiclesas the quickest access into Manhattan. Bridges andTunnels then advised the New York City PoliceDepartment to send all emergency vehicles intoManhattan through the lane — a timely responsethat enabled hundreds of rescue workers to rush tothe scene of the disaster. All Manhattan-bound traffic was stopped and diverted: the tubes becamean emergency response gateway to lower Manhattan.But the collapse of the second tower sent an enor-mous volume of debris into both tubes of the tunnel.
A volunteer Bridges and Tunnels search-and-rescueteam evacuated over 500 customers from their cars;287 vehicles abandoned in the Manhattan-boundtube were cleared out. Three inches of gray powdercovered the tunnel’s walls, ceiling, and roadway,causing hazardous conditions for emergency vehicles.Power on the Manhattan side was lost, so hand-heldfloodlights were used for the cleanup, which tookthree full days. As many as 30 dump trucks an hourpassed through the tunnel, including large truckscarrying wreckage and crushed vehicles. TheBrooklyn-Battery Tunnel remained closed to all butemergency traffic until mid-October.
NYC Transit’s equipment and the expertise of itsironworkers and construction crews were quicklymobilized to help with the rescue and recoveryeffort. Within hours of the attack, a two-mile convoy— NYC Transit equipment including cranes, front-end loaders, dump trucks, construction containers,backhoes, metal saws, emergency lighting, and truck-sized mobile generators and pump trucks as well as3,500 Transit steelworkers, welders, masons, andheavy equipment operators — was heading toGround Zero. Most of the ironworkers cutting steelatop the unstable rubble to clear the way for fire-fighters searching for victims were Transit employees.Other personnel with skills in infrastructure,

M E T R O P O L I T A N T R A N S P O R T A T I O N A U T H O R I T Y12
hydraulics, and electrical areas were working in theheart of the financial district to remove debris andassess subway damage, pump water, provide elec-tricity — and do whatever else was needed. LIRRalso provided employees, equipment, and materialsfor the rescue effort. MTA Police escorted suppliesand emergency equipment to Ground Zero and maintained full alert and mobilization, providing the highest level of security for the transportation network with assistance from State Police and theNational Guard.
Impact and Recovery
Damage to the MTA system was severe but concen-trated. The 1/9 subway tunnel south of ChambersStreet directly below the World Trade Center complexcollapsed between Barclay and Liberty Streets; steelbeams from the towers’ upper floors had pierced thetunnel roof and the track bed; tracks were flooded.Line equipment, signals, communications, tunnellighting, power facilities, fan plants, and theCortlandt Street station were destroyed. The RectorStreet station was damaged. The Cortlandt Streetstation on the N/R line was damaged and 10 subwaycars were damaged. There was no interruption in theMetroCard fare collection system, but fare collectionwas suspended on 9/11. Near the World TradeCenter one bus burned to the frame; three receivedsignificant body damage; several received engine andair system damage from exposure to ash and soot.No customers were injured, but a few operatorswere: one was hit by debris and evacuated to a New Jersey hospital by tugboat.
To improve capacity by using parts of the systemthat were left unharmed, plans for four new subwayreroutings were drawn up in just days. On the day of
the attacks, extra buses were provided in Brooklynto accommodate people who walked across theBrooklyn and Manhattan bridges.
Transit pressed its capacities to the limit to open uplower Manhattan to business before the opening bellof the New York Stock Exchange on September 17.Limited bus service was restored to the Lower EastSide of Manhattan, two bus routes provided serviceinto the Financial District, and subway serviceresumed to four key stations near Wall Street. In thefollowing weeks additional express and local busservice to Battery Park City was arranged on theM20, M22, M9, X90, and X25 routes. Full service onthe N/R lines was restored on October 28, thoughthe Cortlandt Street station remained closed.
There were some 40 service changes in the threedays following the attacks alone. Automated information services were augmented to handle 50 percent (rather than the usual 20 percent) of thetelephone call volume in the days immediately follow-ing the attacks. The MTA Web site, continuouslyupdated to reflect the latest changes in service, registered over 7 million hits on 9/11 and 9/12, andpeaked at 9.8 million hits on 9/14 — four times theaverage before 9/11. Service notices and emergencysubway maps were produced in hours, and five million copies were distributed, as was a specialguide to getting into and around downtown for resi-dents of lower Manhattan and inbound commuters.
The work of rebuilding will be completed in far lesstime than estimated in the weeks following theattacks: restoration of service on the 1/9 line southto Rector Street is now envisioned for the end of2002, fully two years sooner than original estimates.

13
Financial Challenges
While the MTA preserved most of its revenue base andquickly returned to business, it did suffer financiallosses. The precipitous drop in ridership, especially onsubways immediately after the attacks and on bridgesand tunnels due to emergency and rescue needs,squeezed revenue. At the same time, rebuilding costsadded to normal operating expenses. The MTA’s finan-cial condition remains sound, but the impact of theattack and its aftermath on state subsidies generatedby regional business taxes, as well as on security-related costs, will continue to affect the MTA over thelonger term.
In December, the MTA estimated property damage at$855 million. Lost revenue and additional expenses —service, equipment, and overtime costs for rescue anddebris removal; additional security; emergency electri-cal generation; and other costs — were estimated at$482 million. Nearly all property damage and expensecosts and much of the lost revenue are expected tobe reimbursed by the MTA’s insurance.
On September 19 and October 10 statements wereissued informing the financial community that theattacks had no impact on the MTA’s ability to meet itsobligations to bondholders.
Emergency Planning
No one could have predicted the attacks and theiraftermath; nevertheless, the MTA and its agencieswere well prepared.
MTA operations are based on prudent planning to protect customers and material assets and to providesafe transportation and speedy restoration of serviceafter disruptions. For over 20 years, the MTA has
Opposite page: NYC Transit volunteer using MTA equipment in therecovery effort; Congressional delegation entering the CortlandtStreet station, being briefed, and inspecting a steel beam from the WTC that pierced the 1/9 tunnel. This page: Looking towardsGround Zero; Transit bus burned to the frame; MTA volunteers aiding the rescue effort; firemen boarding a special Transit bus to the rescue and recovery operations.

M E T R O P O L I T A N T R A N S P O R T A T I O N A U T H O R I T Y14
carried out annual live interagency drills simulatingemergencies and evacuations and applying emergencyprocedures. This planning, combined with training,enabled the MTA’s 65,000 personnel to carry out theirresponsibilities with focus and effectiveness, quicklyrestoring service to all but certain Bridges and Tunnelsfacilities and damaged subway stations after securityconcerns were dealt with. This experience also enabledMTA employees to make important — even heroic —contributions beyond the call of duty to the rescue andrecovery operations at Ground Zero and other key areas.
Securing insurance coverage for property damageinsurance and terrorist coverage, including businessinterruption insurance to help cover lost revenues, waspart of the MTA’s prudent planning. The MTA expectsto file claims with the Federal Emergency ManagementAgency (FEMA) and the State Emergency ManagementOffice (SEMO) for some damages not covered by insurance policies.
The 9/11 attacks demonstrated that a system thatcarries the equivalent of the world’s entire populationevery two and a half years — over bridges, throughtunnels, on thousands of miles of track — requiresconsistent review and scrutiny and security planning.The system is receiving systematic and strategic“hardening” to minimize vulnerabilities and maximizeresistance to attacks and their aftermath; emergencyplans and procedures are being reviewed andenhanced. Louis R. Anemone, formerly chief of depart-ment in the NYPD and deputy director of GovernorGeorge E. Pataki’s Office of Public Security, has beenappointed to the new position of MTA deputy execu-tive director and director of security.

15
Moving Toward a Seamless Transportation Network
By the end of 2001 ridership was heading back topre-9/11 levels and growing at the rate of 3 percenta year, rather than the 5 percent originally projected.And 2001 remains a year of accomplishment.
Governor Pataki’s Master Links vision of a seamlesstransportation network came a step closer torealization with the opening of the 63rd StreetConnector and the V line in December, making itpossible to add up to 15 trains an hour betweenQueens and Manhattan on one of the city’s mostcrowded subway lines and to improve quality ofservice. Among the nation’s largest municipal construction jobs, the $645 million project spannedseven and a half years and was completed on timeand within budget. It will save riders 7.2 millionhours of travel time lost each year in bottlenecks at the 53rd Street tunnel and cut carbon monoxidefrom motor vehicle traffic by some 200 tons a year.The Court Square moving walkway was also opened.Connecting the Court Square and 23rd Street-ElyAvenue stations, it makes transferring among the G, E, and V lines easier.
The discounts made possible through MetroCardbrought average fares down to $1.06 by the end of2001. Almost 700 new high-tech R142 and R142Asubway cars increased rider comfort. And the intenseinvolvement of all the agencies with 9/11 recoverydid not prevent them from making gains in key performance indicators such as reliability, reducedcustomer and employee accidents, and mean distancebetween failures.
The MTA made solid progress on its CapitalProgram: $3.4 billion in commitments were made tothe program, the highest level since 1997 and 94percent of goal. East Side Access, a full-lengthSecond Avenue subway, and other expansion projects in the 2000–04 Capital Program will provide additional flexibility to the regional networkand bolster the MTA’s ability to respond to emer-gencies as well as improve service; the MTA there-fore remains committed not merely to rebuildingdamaged stations and tunnels and maintaining thesystem in a state of good repair, but also to aggres-sively pursuing expansion.
The Federal Transit Administration approved theaward of a design/build contract for construction of replacement storage and maintenance facilities atMetro-North’s Highbridge Yard in the Bronx, an earlycomponent of the East Side Access project, and con-struction began in September. The yard will replacefacilities in Grand Central that will be used by EastSide Access. The Federal Fiscal Year (FFY) 2002budget, signed into law by President Bush inDecember 2001, includes a $14.6 million appropria-tion for East Side Access.*
A $255 million contract for preliminary engineeringfor the Second Avenue subway was awarded inDecember. The project received an additional federalappropriation of $2.0 million in the FFY 2002 budg-et. This new line, the system’s first major expansionin 60 years, will run from 125th Street to LowerManhattan, relieving overcrowding on the LexingtonAvenue line and providing nearly 550,000 ridesevery weekday.
*In February 2002 the project received FTA approval to begin the finaldesign phase.

M E T R O P O L I T A N T R A N S P O R T A T I O N A U T H O R I T Y16
Mass Transit Total ridership in 2001 throughout theMTA network was 2.34 billion, up from 2.27 billion in2000. Average weekday ridership in 2001 was 7.64million, a record high; in May, average weekday rider-ship reached 8.0 million.
MTA New York City Transit ridership totaled 2.14 billion in 2001, the highest level since 1970. Subwayscarried 1.41 billion passengers, buses 739.5 million.Paratransit services provided 2.02 million trips in2001, up from 1.70 million in 2000, an increase of18.9 percent.
Ridership on the MTA Long Island Rail Road grew forthe ninth consecutive year, reaching 85.6 million, upfrom 84.7 million in 2000. Most of the growth was inoff-peak and noncommutation travel.
MTA Long Island Bus also had record ridership in2001. Total ridership was 30.7 million, an increasefrom 30.1 million in 2000. Paratransit services carried 240,732 riders in 2001, up from 219,684, an increase of 9.6 percent.
MTA Metro-North Railroad ridership was 73.1 million,up from 71.8 million a year ago. The largest gainswere in off-peak ridership, which grew 4.8 percent,and in travel within the system that did not begin orend in Manhattan, which grew 5.1 percent.
MetroCard MetroCard® market share continued togrow during 2001; 82.4 percent of nonstudent tripson NYC Transit were made using MetroCard, up from80.0 percent in 2000.

Ridership
17
MetroCard’s benefits to customers — fare discounts;free bus-to-bus, subway-to-bus, and bus-to-subwaytransfers; ease of use; and convenience — havemade it an overwhelmingly popular choice for bothsubway and bus riders and have led to a transporta-tion revolution in the region. Ridership has grownsubstantially since its introduction, while the averagepaid fare has dropped to $1.06.
Part of the MetroCard success story is ease of purchase. By year-end, 1,561 MetroCard VendingMachines (MVMs) were in service in 458 stations,and 13 MVMs were in service at out-of-systemlocations, nearly completing the planned network. Atequipped stations, MVMs account for 53 percent ofall transactions. NYC Transit completed in-servicetesting of a smaller machine that will accept onlycredit and debit cards, and will install the balance of600 units during 2002 at its busiest stations.MetroCard is also sold through a network of 3,053retail locations, by a mobile sales fleet, and atselected automated teller machines.
WebTicket In 2001, Metro-North introducedWebTicket, an Internet-based sales mechanism thatallows customers to purchase any type of ticket,including monthly or weekly tickets and tickets formany of the railroad’s special getaway trips. In addi-tion, Metro-North introduced Mail&Ride on the Webto serve its commuter population. Both proved immediately popular, generating total sales revenueof $1 million in their first 11 months of service. The Long Island Rail Road offers Mail&Ride accountmaintenance on the Internet and is preparing tomake WebTicket available in 2002.
Bridges and Tunnels Traffic restrictions put inplace after the attack on the World Trade Center ledto fewer vehicles using MTA Bridges and Tunnelscrossings in 2001.
Vehicle crossings in 2001 were 293.2 million, adecrease of just 1.2 percent from last year’s record296.6 million vehicles. Before September 11 cross-ings had been ahead of the record level set in 2000.
The Brooklyn-Battery Tunnel, which was closed to all but emergency vehicles for a time, reopened toBrooklyn-bound traffic in mid-October. The tunnelwas open Manhattan-bound only on weekends, holidays, and nights. Passenger cars using theQueens Midtown Tunnel during the morning rushhour were required to carry a minimum of two people, a restriction at all New York City crossingsbelow 63rd Street in Manhattan.
E-ZPass Despite the decrease in vehicle crossings,E-ZPassSM usage continued to grow in 2001, with197.7 million crossings at Bridges and Tunnels facili-ties. E-ZPass market share grew to 67.4 percent ofall vehicle crossings, up from 63.7 percent in 2000.E-ZPass is now accepted for payments on highways,bridges, and tunnels in seven states fromMassachusetts to West Virginia.

M E T R O P O L I T A N T R A N S P O R T A T I O N A U T H O R I T Y18
FEMA is expected to reimburse the portion of costsnot covered by the insurance policies, including policydeductibles and the costs of replacing or repairingsome damaged buses; the MTA does not insureagainst physical damage to the bus fleet. Over thelong term, however, insurance will not coverincreased security costs.
2000–04 Capital Program As part of its 2000–04Capital Program for mass transit and the commuterrail lines — which totals $17.22 billion — the MTAmade new commitments of $3.26 billion in 2001,bringing total commitments under the five-year planto $6.12 billion. Funding for the Capital Programcomes from a combination of bond sales; moneyfreed up through debt restructuring; earned interestincome; proceeds from selling or leasing assets; and federal, state, and local allocations.
The Bridges and Tunnels 2000–04 Capital Programtotals $1 billion. Bridges and Tunnels made commit-ments of $154 million in 2001, bringing its total to$444 million over the first two years of the program.Bridges and Tunnels funds its program with TBTAbonds and pay-as-you-go funding.
Debt Restructuring In 2001 the MTA continued to work on its plan to restructure its debt. Therestructuring is the largest in the history of themunicipal bond market and is now expected to provide $4.5 billion to finance portions of the MTA’s 2000–04 Capital Program. Of these funds,$1.5 billion will close a gap created when thestatewide Transportation Infrastructure Bond Actwas defeated in 2000.*
*The New York State Capital Program Review Board approved the debtrestructuring plan in February 2002.
Revenue from fares and tolls was $3.81 billion in2001, an increase of 1.37 percent from the prioryear. Revenue from mass transit operationsincreased 2.74 percent; toll revenue at MTA Bridgesand Tunnels crossings decreased 2.73 percent due toclosings and traffic restrictions following the attackon the World Trade Center. Both the Brooklyn-Battery Tunnel and the Queens Midtown Tunnel wereaffected, although traffic increased at the Verrazano-Narrows Bridge due to a ban on commercial vehiclesat the Holland Tunnel.
The strong financial performance of the past fiveyears enabled the MTA to maintain a balanced budget in 2001.
Insurance Coverage The MTA expects to recover a significant portion of the costs relating to 9/11 from insurance policies and the Federal EmergencyManagement Agency (FEMA).
The MTA has had systemwide all-risk insurance since 1992. The policy will cover the costs to repair damaged tunnels and the expenses of additional andrerouted bus, subway, and commuter rail service.
In addition, the policy provided business interruptioninsurance. The MTA is working with its insurancecarriers to determine the amount of revenue andsubsidies lost. This will take into account decreasesin ridership, temporary subway station and line clos-ings and reroutings, bus reroutings, and toll revenuelost due to traffic reductions and travel restrictions.

Financial Performance
19
In anticipation of the refinancing, the MTA submittedits plans to the key bond rating agencies. The agencies endorsed the plans and, recognizing thestrength and stability of the MTA’s credit structure,gave indications that the bonds will receive the sameor higher ratings than those being replaced. Theseratings should improve the MTA’s access to capitalwhile lowering the cost of borrowing.
The program will streamline the MTA’s credit profileby consolidating 13 of 16 existing credits into fournew principal credits.
The MTA accessed the capital markets during 2001using innovative “springing liens” on $2.5 billion innew debt. The structure will allow the bonds to automatically spring into the new resolutions withouthaving to be refunded.
Risk and Insurance Management First MutualTransportation Assurance Company (FMTAC), theMTA’s insurance subsidiary, continued to be prof-itable, with earnings of $1.33 million in 2001.Through Owner-Controlled Insurance Programs
(OCIPs), the MTA exercises greater control over thecosts of construction-related insurance. In 2001OCIPs saved the MTA more than $10 million in construction-related insurance costs.
Real Estate The real estate operation of theMetropolitan Transportation Authority is responsiblefor advertising within the system and management ofMTA-owned property.
Advertising revenue was $64.9 million in 2001, downfrom the record $67.9 million in 2000. Since 1997,advertising revenue has increased from $37.4 million.
Real estate management operations were also strong.At year-end, the MTA had leases on nearly all retailspace at Grand Central Terminal and leased a 6,000-square-foot retail space to an anchor tenant at 2Broadway, a property the MTA manages under a long-term lease agreement. Revenue from real estate oper-ations was $63 million, up from $58 million in 2000.
0 500 1000 1500 2000 2500 3000 3500 4000
97
98
99
00
01
Fare and Toll Revenue*$ millions
MTA New York City Transit
MTA Long Island Rail Road
MTA Long Island Bus
MTA Metro-North Railroad
MTA Bridges and Tunnels
* Figures exclude pupil transportation subsidy.

Customer Enhancements
in system safety management, and expanded itsinitial safety training from a half-day to two days.
Long Island Bus was recognized nationally when itreceived the 2001 APTA Improvement Award for thebest safety record improvement over the past twoyears among agencies that provide four to 30 millionunlinked trips annually. A new program during theyear involved bus operators directly in accident pre-vention. By having operators notify LI Bus about roadhazards and unsafe conditions, the agency was ableto work to correct the problems and alert all of itsoperators to changing road conditions.
To improve the riding experience, the MTA and itsoperating agencies address rider and employee safety, personal security, and environmentalaccountability; the needs of customers with disabili-ties; and the protection and augmentation of the art and history of the network.
Safety The MTA all-agency safety initiative,launched in 1996, made safety programs for bothcustomers and employees a key component of normaloperations. Since that time, all agencies have record-ed consistently lower accident rates for customersand employees (see charts).
In 2001 the American Public TransportationAssociation (APTA) honored the NYC TransitDepartment of Buses with its Gold Award for thebest overall safety record among large transit agencies with more than 30 million customers annually. Injuries to customers, including injuries due to collisions, have declined to just 1.67 for every 1 million customer trips.
Through 2001, NYC Transit upgraded more than 160station signals to enhance safety and greatly reducethe risk of collisions. A total of 800 signals will beupgraded.
By focusing on high-frequency accidents, Transitreduced its employee lost-time and restricted-dutyinjury rate by 26 percent. The program includedsupervisory observation of work habits, enhancedaccident investigation, safety training, and an aware-ness campaign on performing work safely.
LIRR enhanced its new employee safety orientationprogram in 2001, created a core curriculum course
M E T R O P O L I T A N T R A N S P O R T A T I O N A U T H O R I T Y20
Lost-Time and Restricted Duty Injury Rate*Per 200,000 work hours
Customer Injuries*Per million customers
97 98 99 00 01
NYC TransitSubway 3.61 3.37 3.37 3.24 2.89Bus 2.16 2.22 2.03 1.79 1.67
Long Island Rail Road 8.87 5.95 4.42 3.97 3.80Long Island Bus** 3.80 3.76 4.72 2.84 1.60Metro-North Railroad 6.79 5.57 5.95 5.85 4.70Bridges and Tunnels** 1.84 1.67 1.87 1.95 1.62
* Some numbers have been restated from 2000 Annual Report based on additional information from operating agencies.
** Incidents with injuries per million vehicle miles.
97 98 99 00 01
NYC Transit** 5.41 4.96 4.57 3.82 2.83
Long Island Rail Road 7.21 6.66 6.51 5.26 5.06
Long Island Bus† 6.50 4.30 5.50 5.20 4.10
Metro-North Railroad 7.19 5.24 5.68 5.97 5.16
Bridges and Tunnels† 9.70 6.01 3.10 3.10 3.70
* Some numbers have been restated from the 2000 Annual Report based on additional information from operating agencies.
** NYC Transit measures lost-time and restricted duty injury rates on an equivalent “per 100 employees” basis. Operating figures from 1997–2000 have been recomputed to exclude cases that are controverted by NYC Transit Law Department.
† Figures reflect lost-time injuries only.

21
The safety team at Metro-North Railroad developedcustomized safety programs for each operating unit.The railroad also strengthened its injury reportingmechanism to quickly address unsafe work conditionsor behaviors.
Both the Long Island Rail Road and Metro-North useIntranet Web sites to reinforce their safety messagesand provide comprehensive information to theiremployees. The heightened awareness has meantthat unsafe conditions are avoided or more quicklyreported and remedied, leading to fewer employeeand customer accidents.
Bridges and Tunnels monitors two key factors on itsroadways — traffic flow and unsafe driving — to helpprevent accidents. The agency examines its roadwaysand toll plazas continuously, especially when con-struction work changes traffic flow, to be sure thatunsafe conditions have not been inadvertently created.
Bridges and Tunnels created safety committees ateach of its nine facilities to foster a high level ofawareness among its employees — who are in thebest position to identify dangerous conditions. Eachcommittee examined the particular safety issues thatemployees confronted and developed site-specificprograms. Direct communication links to senior man-agement ensure that safety-related proposals can beevaluated and implemented quickly.
The presence of the MTA Police Highway Unit atcrossings to enforce speeding and reckless drivingtraffic regulations has led to significant decreases in accidents at Bridges and Tunnels’ crossings.

M E T R O P O L I T A N T R A N S P O R T A T I O N A U T H O R I T Y22
Personal Security Crime continued to dropthroughout the MTA network in 2001, the result ofcontinued close enforcement of quality of life crimesby the New York City Police Department TransitBureau on the subway system and the MTA Police onthe commuter rail lines.
Felonies on the subways decreased by 11.9 percentin 2001, continuing a decline that began in 1990.Felonies are at the lowest level since 1969.
In the annual citywide survey conducted in April, thecustomer rating for personal security in the subwaysystem was 6.2 on a scale of 0 to 10. Ratings roseor remained the same during all time periods, withthe sense of security improving by 0.2 over lastyear’s rating during both rush hours and after 7 p.m.on weekdays. Bus riders gave safety and security thehighest ranking among all attributes of a citywidesurvey with a rating of 7.3 on a scale of 0 to 10.
On the commuter rail lines, felonies decreased by 21 percent, misdemeanors by 23 percent, andcrimes against customers by 25 percent. Adultarrests increased by 12 percent and juvenile arrestsby 48 percent.
In the annual regional survey conducted in April, customers gave high marks to personal security. On a rating scale of 0 to 10, LIRR customers rated overall personal security at 6.7 and security in PennStation at 7.2, and Metro-North customers ratedoverall personal security at 7.5 and security in Grand Central Terminal at 7.8.
Environment The MTA is committed to protectingthe environment, and operating agencies use newtechnologies and careful site management to cleanup environmental hazards or reduce pollution.
To lower the particulate emissions of its bus fleets,NYC Transit and LI Bus purchased additional com-pressed natural gas (CNG) buses in 2001. NYCTransit ordered 130 new CNG buses, while LI Busaccepted delivery of four buses and ordered 37.Seventy-five percent of the 399-bus fleet of LI Busis CNG, and it expects to have its entire fleet usingCNG by the end of 2003.
On older buses, NYC Transit continued to install special particulate filters that allow its buses to runon ultra-low-sulfur fuel, retrofitting nearly 900buses since the program began in 2000. In addition,it replaced two-stroke diesel engines with cleanerfour-stroke engines on 382 buses. Transit expectsthat particulate emissions from its diesel buses willreach levels virtually equivalent to those of CNGbuses by year-end 2003.
In order to prevent spills of hydraulic, motor, ortransmission oils, in 2001 the Long Island Rail Roadbegan a reclamation and recycling program thatidentifies and removes drums quickly. It also com-pleted cleanups at a former painting site at MorrisPark and at a Queens freight yard that had beenused to illegally dump construction and demolitiondebris by a company that had leased the site.
The LIRR has also completed surface cleaning ofheavy metal contamination at 20 substations and will begin complete cleanups in 2002. All of the substations are inaccessible to the public, minimizingthe potential for contamination.
Long Island Bus Braille route map

23
Metro-North Railroad enhanced its hazardous wasteand spill response training to ensure that spills arequickly halted, contained, and cleaned up, minimizingpotential environmental damage. The agency alsobegan using portable drum equipment to preventstorm water pollution in its yards and along itsright-of-way and instituted a color-coded identifica-tion system for catch basins and manholes to preventinadvertent discharge of contaminants into stormwater drains.
At the Henry Hudson Bridge, Bridges and Tunnelsbegan construction of an oil recovery manifold sys-tem that will recover oil-contaminated runoff water, providing protection for Inwood Hill Park, which isunder the bridge. The system will be completed early in 2002.
To extend its own energy-savings mandate, the MTA is supporting the use of clean energy technology forautomobiles. In a joint project with the New YorkPower Authority and the Th!nk division of the FordMotor Company, the MTA is participating in a pilot
program of electric “station cars.” Approximately100 commuters in New York City, Long Island, andWestchester, Rockland, and Orange counties weregiven subsidized leases for nonpolluting all-electricTh!nk cars and fare discounts on the commuter raillines. At Long Island Rail Road and Metro-North stations, the MTA has installed dedicated chargingstations for each of the cars.
People with Disabilities At the 161st Street-Yankee Stadium station complex, serving the B, D,and 4 lines, and at the 14th Street-8th Avenue station complex, serving the A, C, E, and L lines, NYCTransit completed the installation of new signageand telephones, making both stations fully compliantwith the Americans with Disabilities Act (ADA).
For its hearing-impaired Reduced-Fare MetroCardcustomers, Transit initiated new voice recognitiontechnology that provides automated telephoneMetroCard balance information.
At the Long Island Rail Road, the Hicksville, Babylon,and Port Jefferson stations were brought into com-pliance with the ADA as part of the railroad’s capitalconstruction program.
In a pilot program, Long Island Bus worked withBaruch College to produce a Braille guide to theHempstead Transit Center and a Braille bus line map(for the N35 running between Hempstead andWestbury) with tactile indications of turns and majorlandmarks. If these guides are successful, LI Bus willcreate maps for additional lines.
Chairman Kalikow in the nonpolluting all-electric Th!nk car

M E T R O P O L I T A N T R A N S P O R T A T I O N A U T H O R I T Y24
Metro-North Railroad made accessibility improve-ments at a number of stations, including MountVernon East, where elevators and a text telephone(TTY) were installed; Spring Valley, where a partial-length, high-level platform to accommodate mobility-impaired people was built and new tactile signagewas installed; and Grand Central Terminal, whereadditional TTY telephones and tactile accessible-route signage were installed. Work continues tomake Grand Central Terminal fully ADA-accessible.
To help people with disabilities become more familiarwith their local mass transit travel options, the MTApublished A Guide to Accessible Services, explainingthe programs of NYC Transit, the LIRR, LI Bus, andMetro-North. The guide, which is available on theMTA Web site, and in Braille, audiotape, and large-print formats, contains lists of all accessible stations,tips for riders who have disabilities, and informationabout regional paratransit operators.
Arts for Transit The MTA commissions and installsartwork as it renovates the stations of the subwaysystem and commuter rail lines. Research shows thatthe art makes the system more inviting and makescustomers feel safer. In addition, stations that havehad artworks installed are cleaner and have signifi-cantly less graffiti, lowering maintenance costs.
A highlight of 2001 was the dedication at 42nd St-Times Square of “New York in Transit” by JacobLawrence, the artist’s last public commission. MTA Arts for Transit worked closely with his widow, artistGwendolyn Knight Lawrence, and a fabricator toensure the integrity of his vision.
Other important projects were completed at the station complex at 23rd Street-Ely Avenue/LongIsland City-Court Square in Queens serving the E, V,and G lines; the Church Avenue station in Brooklynon the 2 and 5 lines; and the Hicksville Station of the Long Island Rail Road.
The Arts for Transit program received 10 awards in2001, including recognition by the Municipal ArtSociety, American Institute of Architects, New YorkLandmarks Conservancy, and Preservation League ofNew York State.
Transit Museum The New York Transit Museumbegan a long-anticipated renovation project at itsmain facility in Brooklyn in 2001. The Museum con-tinued to present shows at its Grand Central Gallery.The Museum’s exhibits — including “Moving London,1901–2001,” a history of the London Underground;“Take Me Out to the Ballgame,” highlighting theSubway Series and its significance in New York’s baseball history; and “All Aboard,” an exhibit of classic model trains — brought record numbers ofvisitors. The Museum commemorated its 25thanniversary on July 4, drawing a record 4,000 visitors to its Ninth Annual Bus Festival. It also participated in the annual Folklore Festival of theSmithsonian Institution, coordinating transport of aclassic Redbird subway car and a hybrid electric busthat were displayed on the Washington Mall in June.
To help ensure its long-term financial stability, theMuseum established a new endowment fund with$1.5 million raised by Friends of the New York TransitMuseum, the Museum’s not-for-profit affiliate.
“New York in Transit” by Jacob Lawrence, 42nd Street-Times Square subway station

25
The MTA Agencies2001

26
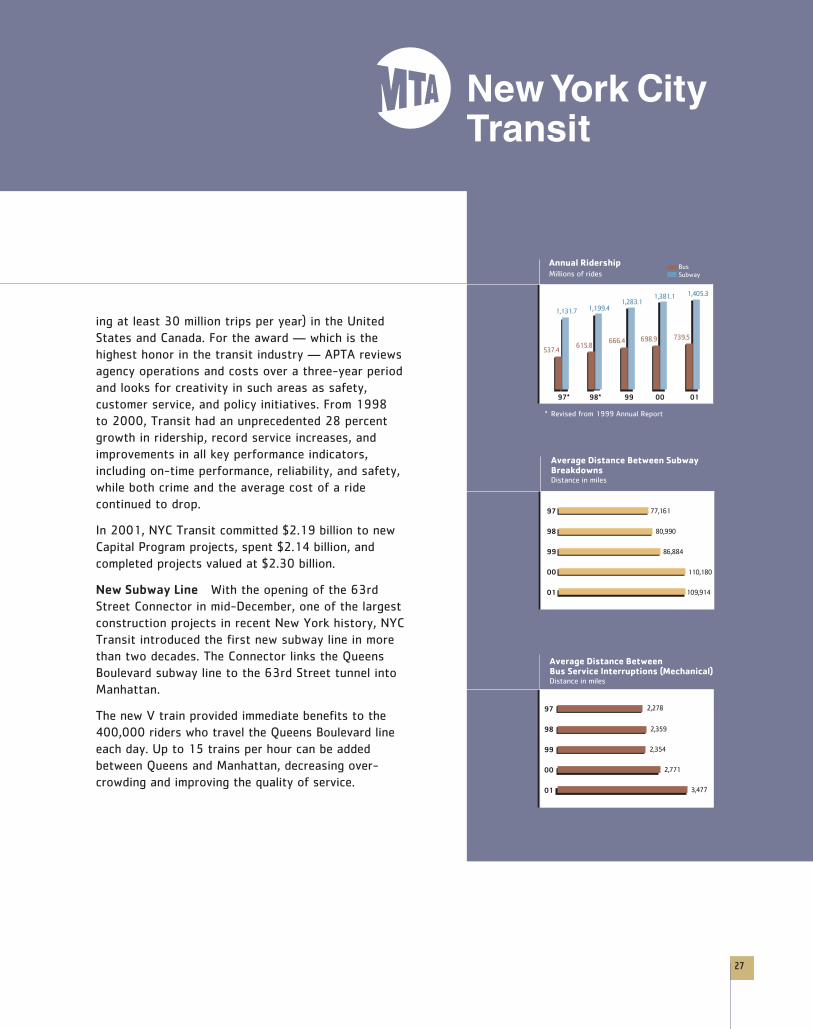
Ridership on MTA New York City Transit continued togrow in 2001, with subways and buses serving morethan 2.14 billion customers, an increase of 3.1 percentover the prior year. Subway ridership grew 1.8 percentto 1.41 billion, while bus ridership was up 5.8 percentto 739.5 million. Paratransit operations grew by18.9 percent to 2.02 million trips in 2001.
To meet the growing demand, NYC Transit increasedsubway service by 1 percent and bus service by 4 percent in 2001, the fifth consecutive year ofincreases. Service was increased on five subwaylines, and the V, the first new line in more than 20years, was introduced. There were service increaseson 126 local bus routes and 28 express bus routes,and six new express routes and two new limited-stop routes serving Staten Island commuters wereinaugurated.
Better maintenance and new equipment continued tomake the system more reliable. For subway cars, themean distance between failures was 109,914 milesin 2001, nearly equal to the record 110,180 miles ayear ago, while for buses the mean distance betweenmechanical service interruptions was 3,477 miles,compared with 2,771 miles in 2000, an improve-ment of 25.5 percent.
Service reliability continued to be strong. “Waitassessment” measures the intervals between subways and buses during daytime hours. In 2001,
M E T R O P O L I T A N T R A N S P O R T A T I O N A U T H O R I T Y
87.0 percent of subways arrived within two minutesof the scheduled interval during rush hours and with-in four minutes during non-rush hour periods, downslightly from the 87.4 percent recorded in 2000; 81.9 percent of buses arrived within three minutes ofthe scheduled interval during rush hour periods andwithin five minutes during non-rush hour periods, up from 81.1 percent the year before.
During night hours (between 9 p.m. and 6 a.m. onsubways and 7 p.m. and 7 a.m. on buses), NYCTransit tracks the percentage of subways and busesthat depart from scheduled timepoints between oneminute before and five minutes after their scheduleddeparture times. In 2001, 78.6 percent of night subways were on time, down slightly from 79.6 percent in 2000; 73.2 percent of buses were ontime, compared with 70.0 percent in 2000.
Wait assessment and on-time figures for 2000 arebased on the final six months of the year, when thenew measures were introduced.
The success of NYC Transit in rebuilding its systemand improving service received national recognitionin 2001 when the American Public TransportationAssociation (APTA) — the nation’s most importantindependent public transportation organization —presented it with the Outstanding AchievementAward as the “most efficient and effective transitsystem” among large transit agencies (those provid-
27
ing at least 30 million trips per year) in the UnitedStates and Canada. For the award — which is thehighest honor in the transit industry — APTA reviewsagency operations and costs over a three-year periodand looks for creativity in such areas as safety, customer service, and policy initiatives. From 1998 to 2000, Transit had an unprecedented 28 percentgrowth in ridership, record service increases, andimprovements in all key performance indicators,including on-time performance, reliability, and safety,while both crime and the average cost of a ride continued to drop.
In 2001, NYC Transit committed $2.19 billion to newCapital Program projects, spent $2.14 billion, andcompleted projects valued at $2.30 billion.
New Subway Line With the opening of the 63rdStreet Connector in mid-December, one of the largestconstruction projects in recent New York history, NYCTransit introduced the first new subway line in morethan two decades. The Connector links the QueensBoulevard subway line to the 63rd Street tunnel intoManhattan.
The new V train provided immediate benefits to the400,000 riders who travel the Queens Boulevard lineeach day. Up to 15 trains per hour can be addedbetween Queens and Manhattan, decreasing over-crowding and improving the quality of service.

M E T R O P O L I T A N T R A N S P O R T A T I O N A U T H O R I T Y28
To fully integrate the new service, Transit installed amoving sidewalk to link the Long Island City-CourtSquare G to the 23rd Avenue-Ely Avenue E and Vstation and created subway-to-subway MetroCardtransfers between the Long Island City-Court SquareG and 45th Road-Court House Square 7 stations andthe Lexington Avenue F and the 59th Street 4, 5,and 6 stations.
Manhattan Bridge Service Changes To facilitatethe New York City Department of Transportation’sreconstruction of the Manhattan Bridge, NYC Transitinstituted major service changes along the Broadwayand Sixth Avenue lines. More than 600,000 daily riders were affected.
NYC Transit instituted significant service changes inorder to provide alternate service to affected sta-tions. It restarted express service along Broadway,ran two shuttle trains on the Sixth Avenue line (laterreplacing one of the shuttles with the V line), andbegan a special shuttle bus from Canal Street toGrand Street. NYC Transit created a comprehensivecampaign to prepare riders for the shifts in serviceand implemented the changes with no significantproblems. Repairs to the bridge are scheduled forcompletion in 2004.
New Rolling Stock NYC Transit put into service570 high-tech subway cars during the year, bringingthe total to 670 cars in operation on the A division(numbered lines). In addition, the first 12 cars for the B division (lettered lines) were received andbegan in-service testing at year-end. Continuing itsprogram to modernize and upgrade the fleet, NYCTransit ordered an additional 470 new cars. To date,1,762 new cars have been received or are on order,including 362 that will be used to expand service.
Transit placed 90 new express coach buses in serviceduring 2001 and ordered 130 compressed naturalgas buses and 20 express coaches to upgrade andexpand the fleet.
Technology Transit moved forward with its signaland communications modernization program, includ-ing the first phase of a multiyear effort to install ahigh-capacity, high-speed multimedia networkthroughout the system. The Synchronous OpticalNetwork (SONET) will transmit voice, data, and videoto subway stations for vastly improved customercommunications, including real-time operations management, and incident response.
Work also progressed on the state-of-the-art com-munication-based train control (CBTC) project. CBTCis an electronic signal system for managing trainspeeds and maintaining safe distances betweentrains. CBTC allows trains to run closer together,increasing the capacity of existing subway lines tocarry more trains and passengers. Installation beganin the Canarsie Yard in 2001, the first step in rollingit out on the L line.
Maintenance and Normal Replacement NYC Transitcontinued its program to bring its entire system intoa state of good repair.
Station renovations at Canal Street, Whitehall Street,14th Street-8th Avenue, 161st St-Yankee Stadium,Queensboro Plaza, and Tremont Avenue were com-pleted during the year, while major work continuedon Atlantic Avenue-Pacific Street, Times Square-42nd Street, and 72nd Street. Work also began onthe complete reconstruction of the Stillwell Avenuestation in Coney Island, and rehabilitation began atDeKalb Avenue in downtown Brooklyn, LexingtonAvenue-53rd Street, and four Manhattan stationsbetween 77th and 116th streets on the LexingtonAvenue line.

29
Paratransit Operations Access-a-Ride, which ismanaged by NYC Transit with service provided byeight vendors, grew substantially in 2001 to 2.02million trips, up from 1.70 million trips in 2000. Thenumber of average weekday trips was 6,697, upfrom 5,663 in 2000, and the percentage of interbor-ough trips grew to 33.4 percent, up from 31.3 percent a year ago.
The denial rate — the measure of requested tripsthat could not be provided — remained under 1 per-cent for the second consecutive year.
Responding to increased demand, Transit ordered250 new paratransit vehicles, taking delivery of 190 in 2001, with the remaining 60 scheduled fordelivery in 2002.
Because its office in lower Manhattan was inaccessi-ble for two weeks after September 11, theParatransit Division set up a remote command centerin Jamaica, Queens, in order to continue serving itscustomers.
Customer Satisfaction Ratings for customer satis-faction remained at historic highs, with nearly allattributes rising or remaining steady.
Overall satisfaction on subways rose from 6.1 to 6.2on a scale of 0 to 10. Most attributes remained thesame as in 2000. Agreement with the statement thatsubways are a fast way to travel rose from 6.7 to7.2. Ratings for safety, courtesy of conductors, andcomfort remained high. Among bus riders, overallsatisfaction rose from 5.9 to 6.0 on a scale of 0 to10. Satisfaction with the cost of the bus fare rosefrom 6.3 to 6.7. Riders continued to give high marksto safety, comfort, and cleanliness.

M E T R O P O L I T A N T R A N S P O R T A T I O N A U T H O R I T Y30
Work was begun on rehabilitating the JamaicaStation to provide an intermodal transportation center linking the Long Island Rail Road, the JFKAirport AirTrain, and New York City subways andlocal buses. Rehabilitation of seven other stationswas also begun.
On four Main Line tracks between Jamaica andQueens Village, 33,000 new concrete ties, 154,000feet of continuous welded rail, and third rail and protection boards were installed to make the commuter’s ride safer and more comfortable.
Outdated components in 132 M-1 electric cars were replaced with technologically advanced HVAC,motor control panels, brakes, door operators, modu-lar vacuum toilets, and microcab automatic traincontrol, extending their service life and increasingsystem reliability.
Technology A new Travel Information CenterInteractive Voice Response System replaced the pre-vious 10-year-old system and speeds and simplifiesinformation requests through its natural voiceresponse capability.
Wireless local area networks installed in the supportshop areas of the Hillside Maintenance Facility allowimmediate transfer of data between portable termi-nals at the mechanics’ workstations and the centralcomputer, improving productivity by boosting timeactually spent on repair. This technology will beimplemented in all the maintenance facilities and willbe key to the maintenance of LIRR’s M-7 fleet.
At 93.1 percent, the railroad’s on-time performancefor 2001 was its best since 1992. Mean distancebetween failures averaged 30,660 miles, up from28,405 miles last year, even though 75 percent of thefleet is nearing the end of its useful life. Ridership, inits ninth consecutive year of growth, rose 1 percentfrom last year to 85.6 million customers.
Capital Improvements MTA Long Island Rail Roadcommitted $466 million to Capital Program projectsin 2001 and spent $387 million; project completionstotaled $248 million.
At Hicksville, Babylon, Freeport, and Baldwin, the old station buildings were rebuilt with improvedfacilities that include such features as ADA-compli-ant restrooms and ramps to platforms; improved heating, ventilation, and air conditioning; and newplazas, sidewalks, and retail space. The PortJefferson station was completely rehabilitated andrestored to its classic 1903 appearance. At Babylon,which serves 6,000 riders on a typical weekday, the ticket office and waiting area were enlarged by25 percent, a new bus staging area was added, and10 parking lots were rehabilitated, adding 32 newspaces, including 10 new ADA spaces. Parking facili-ties at Port Jefferson, Woodmere, and Speonk werealso rehabilitated, and facility improvement initia-tives began at Copiague and King’s Park. The addition of a new parking deck over the existing lotat the Long Beach Station will add 200 new spacesand provide a direct connection between the newlevel and the railroad platform.

31
Customer Satisfaction Overall, customers rated LIRRservice 7.3 on a scale of 0 to 10, up significantly from7.0 for the past four years; 39 percent of customersrated the railroad as excellent or very good; this wasup 15 percent from 2000 and the highest percentageever achieved by the railroad.
The LIRR has a low spare-car ratio (10 percent ratherthan the industry norm of 15 to 20 percent), butthrough careful monitoring of spare cars the railroadhas provided full morning peak car availability on 81 percent of all weekdays, up from about 46 percenttwo years ago. Once on their trains, customers experi-enced cooler, more comfortable cars. During the veryhot summer of 2001, twice as many temperaturereadings were taken in three locations in the cars toensure they were between 64 and 78 degrees. Proactiverepair of cars with readings in the high 70s kept tem-peratures in that target range 98 percent of the time.
New M-7 train cars began testing, preparatory tobeing put into service in the fall of 2002. The carsfeature larger doors, more passenger room (includingmore legroom because seats have molded backs withrecessed panels), and lumbar support and firmer cush-ions for a more comfortable seat. Technical advanceswill reduce engine failures that stall current trains inwinter storms.
In 2001, a climate-controlled waiting area, a new rest-room facility, and improved ticket/information windowswere installed at the Flatbush Avenue Terminal — allarose from President Ken Bauer’s RailTalk program inwhich customers make suggestions directly to LIRR’spresident. Other suggestions resulted in improvementsthroughout the railroad.
* Figures for 1998-2000 have been restated
97 98 99 00 01
84.7 85.678.6 79.8 81.6
Annual Ridership*Millions of rides
* Arrival within 5 minutes 59 seconds of schedule
On-time Performance*Percent of time
97 98 99 00 01
92.7 93.192.2 90.5 91.0
Average Distance Between Train BreakdownsDistance in miles
97
98
99
00
01
28,405
28,159
28,945
27,758
30,660

M E T R O P O L I T A N T R A N S P O R T A T I O N A U T H O R I T Y32
Ridership on MTA Long Island Bus totaled 30.7 million,up from 30.1 million in 2000. Average weekday ridership rose to 103,492 from 101,762, up 1.7 percent. The increases were recorded in all service periods, with new single-day records set forweekday, Saturday, and Sunday ridership, making2001 the best in the agency’s history.
LI Bus Able-Ride paratransit services provided240,732 rides, up from 219,684 in 2000. The service has more than 13,000 registered customers,an increase of nearly 19 percent over the prior year,and averages 728 trips each weekday. The agencyalso reached an agreement with Nassau County fora permanent home for paratransit operations, amove that will allow the service to continue itsstrong growth.
While the demand for bus service continued to rise,the financial constraints of Nassau County preclud-ed a budget increase for LI Bus. However, LI Buswas able to increase service on its most heavilytraveled routes by using funds from special grantsand shifting available resources. By continually monitoring ridership, LI Bus has adjusted schedulesto the needs of riders and facilitated bus-to-busand bus-to-Long Island Rail Road transfers to thegreatest extent possible.
Fleet modernization continued in 2001. The lastfour of 71 compressed natural gas buses ordered in2000 were delivered and put into service by year-end, and an additional 37 CNG buses were orderedfor delivery in 2002. The buses bring the fleet closer to full CNG-service, which Long Island Busexpects to reach in 2003.
Preventive maintenance programs helped keep opera-tions running smoothly and enabled LI Bus to meet itscommitments to its customers. Bus pullouts — thenumber of scheduled buses to leave their depots —stood at 99.9 percent for the year, and completedtrips totaled 99.6 percent. The mean distance betweenbus failures rose from 1,815 miles to 2,067 miles.
Paratransit Operations Able-Ride, the paratransitservice of LI Bus, continued to grow in 2001, reflect-ing both the demographics of Nassau County and theefforts of LI Bus to promote the service to individu-als who cannot be accommodated by other modes ofpublic transportation.
Taking advantage of a new data communicationsand real-time vehicle locator system installed in late2000, LI Bus was able to increase the number ofrides provided while decreasing the waiting time forcustomers. To keep pace with the growth, LI Busordered seven light duty buses to expand its fleet of70 as well as 13 buses to replace vehicles that areat the end of their useful lives. Delivery of all 20 isscheduled for the first quarter of 2002.
Since 1995, Able-Ride has operated in a temporaryfacility in Garden City while LI Bus and NassauCounty worked toward providing a permanent homefor the operation. In 2001, LI Bus and NassauCounty agreed on a plan to turn over the entireGarden City building to LI Bus, and other countyoffices in the building were relocated by December.With grants from the federal, state, and county governments, LI Bus began to modernize the spaceand upgrade the computer system it uses to trackparatransit requests and create routings.

33
When completed in 2003, the building will provideadequate space for all paratransit operations includingcertifying registrants, scheduling trips, and en-routesupervision. The adjoining yard, which will also be renovated, will be used for storing and cleaning thefleet of 70 paratransit buses and for a new drivertraining facility.
Customer Service In addition to adjusting schedulesand routes to meet the needs of its customers, LI Busworked to make MetroCard purchases more conven-ient, installing MetroCard vending machines at theHempstead Transit Center, a major transfer point thatserves 25,000 customers daily.
A new employee training program is helping improvecustomer service with better communications, new joband maintenance skills, and enhanced computer skills.LI Bus also initiated a “We Care About Our Customers”information campaign that highlighted the agency’ssafety programs, service enhancements, and TravelInformation Center.
In its annual customer survey, the overall satisfactionrate was 7.4 on a scale of 0 to 10, up from 7.2 in2000. More than half of those surveyed rated theirsatisfaction as very good or excellent, and more than80 percent rated it good or better. The largestincreases were in the ratings for convenience andservice reliability, each of which scored 7.6, increasing0.5 over the prior year. LI Bus conducted its firstparatransit customer satisfaction survey and receivedan overall rating of 3.4 on a scale of 0 to 4.

M E T R O P O L I T A N T R A N S P O R T A T I O N A U T H O R I T Y34
MTA Metro-North’s annual ridership increased forthe ninth consecutive year to 73.1 million in 2001, a 1.7 percent rise from 71.8 million in 2000. Anaging fleet contributed to a slight decline in meandistance between failures: 50,390 miles, comparedto 54,355 last year. On-time performance, however,remained high. East-of-Hudson routes, with 96.6percent on-time performance, continued a five-yeartrend of operating above 96 percent. West-of-Hudsonroutes achieved a 95.7 percent on-time rate.
Technology Two new systems are improving therailroad’s ability to manage critical information. TheIncident Management System, developed to complywith Federal Railroad Administration requirements,centralizes and organizes equipment information tohelp track train equipment and incidents. It facili-tates the monitoring and updating of fleet availabilityinformation. Another system developed by Metro-North enables customer service personnel to usehand-held computers to enter findings made duringtheir daily inspections of rolling stock into a data-base for review and tracking.
Capital Improvements In 2001, Metro-North made Capital Program commitments for $330 million,91 percent of its plan, and expended $199 million.Project completions totaled $98 million, 94 percentof the plan.
Metro-North opened a new three-story 540-spaceparking garage at Poughkeepsie as well as the eastparking lot and associated staircases at Goldens
Bridge. A total of 936 new and 427 improved spaceswere constructed in 2001. Contracts were let for thedesign and construction work in the rehabilitation ofnine stations on the Hudson Line (Morris Heights,University Heights, Marble Hill, Spuyten Duyvil,Riverdale, Ludlow, Yonkers, Glenwood, andGreystone) and for the restoration of the YonkersStation building’s historic interior as well as its support structure. Almost 1,600 new or improvedparking spaces were added at various stations in2001, and planning and design work is underway for parking projects at nine other stations.
In Grand Central Terminal the upper loop track, which enables inbound trains to move from the westside of the Terminal’s upper level behind the DiningConcourse to east-side outbound tracks, wasreplaced and put in service in June. The projectincluded installation of six turnouts, the loop trackthird rail, and a signal system. Final plans were alsocompleted for rehabilitation of the Terminal’s train-shed, and construction commenced.
The new east yard of Woodbine Yard in SpringValley, New York, was put into service, and the rehabilitation project continues with the expansionof the west yard, which is scheduled for completionin March 2002. The first phase of reconstruction ofthe Harmon Shop and Yard began; it includes con-struction of a new yard to accommodate diesel trainservicing and car cleaning, modernization of signalingand power equipment, and construction of a newemployee overpass to the existing passenger station.

35
Work on the Mid-Harlem Third Track Project began inJune. It will upgrade an existing track between MountVernon West and Fleetwood and construct a new trackbetween Fleetwood and Crestwood, a total projectlength of 3.2 miles. Included are: signal system reloca-tion; bridge, retaining wall, and roadbed and track construction; and reconfiguration of the interlockingsat each end of the project limits.
Customer Satisfaction Customers rated Metro-North’s overall service in 2001 at 7.8 on a scale of 0 to 10; 57 percent of customers rated Metro-North’sservice excellent or very good, up 6 percent from 2000.
In 2001 Metro-North linked the database for Grand Central Terminal’s schedule board to the “GCTDeparture Info” link on its Web page, enabling customers to access the latest track and scheduleinformation in real time from their computers.
Computerization of the Customer Information Center(CIC), completed in 2001, enabled representatives toaccess information and answer customer questionsmore quickly than by checking paper timetables, faretables, station guides, and special promotionbrochures. An extensive new CIC Intranet site givesrepresentatives updated information instantly, furtherimproving response time as well as accuracy.
Thirteen Genesis Dual Mode locomotives delivered in2001 will enable Metro-North to improve service byretiring its overage FL-9 and F-10 locomotives. Anagreement between Metro-North and New JerseyTransit to purchase 65 Comet V coaches (20 cab carsand 45 trailers) for delivery in late 2002 and early2003 will enable Metro-North to expand West-of-Hudson service and accommodate expected ridershipgrowth by transferring 24 Comet II/Shoreliner cars toEast-of-Hudson service.
97 98 99 00 01
71.8 73.1
63.9 66.4 68.5
Annual RidershipMillions of rides
* Arrival within 5 minutes 59 seconds of schedule;measures East-of-Hudson service only
On-time Performance*Percent of time
97 98 99 00 01
96.7 96.696.5 96.6 96.3
Average Distance Between Train BreakdownsDistance in miles
97
98
99
00
01
54,355
70,328
62,785
59,672
50,390

M E T R O P O L I T A N T R A N S P O R T A T I O N A U T H O R I T Y36
September 11 did not interrupt the E-ZPass system,but it has had substantial impact on MTA Bridgesand Tunnels and its revenues. For months after9/11, rescue efforts and security measures severelyrestricted the use of Bridges and Tunnels facilities.The Brooklyn-Battery Tunnel became the gateway to Ground Zero and was almost entirely closed to all but emergency vehicles. Restrictions on trucks,on time of use, and on single occupancy vehicles onall bridges and tunnels below 63rd Street reduced traffic. Some restrictions continued through year-end, including a ban on commercial vehicles in thePort Authority’s Holland Tunnel — which has, however, increased traffic on the Verrazano-Narrows Bridge. Toll traffic was down to 293.2 million vehicles from 296.6 million in 2000. Revenueis projected at $914.9 million, down 2.7 percentfrom $940.6 million last year, and generating$581.8 million in support for mass transit, downfrom $642.9 million in 2000.
In its first year, ACROBAT (Achieving CollisionReduction on Bridges and Tunnels) has reduced customer injury collisions on Bridges and Tunnelsfacilities to 1.62 per million miles in 2001, down 16.9 percent from 1.95 in 2000. The program uses aGeographic Information System that has beenenhanced to enable the identification and analysis of collision locations to expedite remedial action.
E-ZPass During a typical month MTA Bridges andTunnels facilities process some 16 million E-ZPasstransactions, over 14 million of which are fromBridges and Tunnels customers. Weekday E-ZPass
use averages 70 percent (77 percent for commercialvehicles). Convenience and quick toll transactions arethe likely causes of this high market share. Eachspring and fall since 1992, Skycomp Survey andWaiting Time Statistics has tracked waiting time datafor Bridges and Tunnels facilities. Its 2001 surveyshows that since E-ZPass was implemented in1995–96, waiting time for MTA E-ZPass customershas fallen more than 50 percent. Bridges andTunnels’ all-cash customers (20 to 30 percent oftotal customers) experienced most of the delays —one to six minutes per vehicle.
The Maryland Transportation Authority has made its M-Toll system interoperable with E-ZPass.Customers can now use E-ZPass on any operationaltoll facility in seven states operated by 15 membersof the E-ZPass Interagency Group (IAG). Bridges andTunnels customers took more than 12 million trips amonth on the facilities of other IAG members. ClearlyE-ZPass has made major progress in integratingmotor vehicle traffic into the seamless regionaltransportation network that is the goal of GovernorGeorge Pataki’s Master Links vision. In a more inno-vative extension, E-ZPass Plus was implemented withMcDonald’s Corporation in a pilot program thatenables McDonald’s drive-in customers to use theirE-ZPass tags to purchase food.
Capital Improvement In 2001 Bridges and Tunnelscommitted 100 percent of its planned $154 millionto the 2000–04 Capital Program. To date, it hascommitted $443.8 million toward its $1.03 billiontotal. Including projects from previous programs,

37
projects totaling nearly $820 million — 26 in capitalconstruction, 17 in major maintenance constructionprojects, and seven painting contracts — are under-way, all with minimal impact on traffic.
The three-and-a-half-year rehabilitation of the 60-year-old Queens Midtown Tunnel was completed andreceived the NY Construction News Award of Merit.Safety and customer service have been improved withbrighter lighting, a new ceiling, and improved fire-fighting capabilities and traffic control systems. Thework was completed almost entirely at night duringoff-peak hours when traffic is lightest and on selectedweekends, resulting in minimal disruption for customersand local communities on either side of the tunnel.
On the Marine Parkway-Gil Hodges Memorial Bridge,two rehabilitated roadway lanes and a newly con-structed sidewalk, part of a deck replacement projectthat will be completed in spring 2002, were openedahead of schedule. Based on input from the Rockawaycommunity, the bridge has been redesigned to use precast rather than the original cast-in-place technology,which would have constricted bus and other traffic.
In an unprecedented collaboration, Bridges andTunnels and the New York City Department of Parksand Recreation (DPR) have reached an agreement thatwill enable Bridges and Tunnels to undertake a 10- to12-year rehabilitation of the Triborough Bridge bywidening the Bronx toll plaza to accommodateManhattan traffic, constructing new access ramps toRandall’s Island to significantly improve interboroughtraffic through the bridge’s junction structure, andredecking the entire bridge. The agreement providesfor the transfer to the MTA of land necessary for thenew ramps and widened toll plaza and the temporaryacquisition of staging areas necessary to the project.
Use of FacilitiesMillions of vehicles
VehiclesE-ZPassTransactions
97 98 99 00 01
188.9 197.6
117.4
160.1 172.4
296.6 293.2288.7266.5 279.5
Support to Mass Transit$ millions
97
98
99
00
01
642.9
623.0
613.0
645.0
581.8
Annual Revenue from Tolls$ millions
97 98 99 00 01
940.6 914.9852.0 884.4 912.8

Comprehensive Annual Financial Reportfor the years ending December 31, 2001 and 2000
Metropolitan Transportation Authority,
a component unit of the State of New York
Prepared by Department of Budgets and Financial Management

M E T R O P O L I T A N T R A N S P O R T A T I O N A U T H O R I T Y
Introductory SectionLetter of Transmittal 1
Certificate of Achievement for Excellence in Financial Reporting 8
MTA Organizational Structure 9
Financial SectionGeneral Purpose Financial Statements
Report of Independent Accountants 11
Combined Balance Sheets 12
Combined Statements of Operations and Changes in Equity 14
Combined Statements of Cash Flows 16
Notes to Combined Financial Statements 18
Required Supplementary Information (Unaudited) 44
Supplementary InformationCombining Balance Sheets, 2001 46
Combining Statements of Operations and Changes in Equity, 2001 48
Combining Statements of Cash Flows, 2001 50
Combining Balance Sheets, 2000 52
Combining Statements of Operations and Changes in Equity, 2000 54
Combining Statements of Cash Flows, 2000 56
Statistical Section10-Year Statistical Tables 59
2001 Operating Statistics 64
Table of Contents

Introductory Section


347 Madison AvenueNew York, NY 10017-3739212 878-7130 Tel212 878-0186 Fax
Gary G. CaplanDirector of Budgets andFinancial Management
State of New York
April 8, 2002
Chairman and Members of the BoardMetropolitan Transportation Authority
I hereby submit the Comprehensive Annual Financial Report (“CAFR”) of the MetropolitanTransportation Authority (“MTA,” the “Authority”) for the year ended December 31, 2001, pre-pared by the Comptroller’s Office. Responsibility for both the accuracy of the enclosed dataand the completeness and fairness of the presentation, including all disclosures, rests with theAuthority. I believe that the data as presented are accurate in all material respects and thatthe information is presented in a manner designed to set forth fairly the financial position andresults of operations of the Authority in accordance with generally accepted accounting princi-ples. To the best of my knowledge, all disclosures necessary to enable the reader to gain anunderstanding of the Authority’s financial affairs have been included.
The CAFR is presented in three parts:
Introductory Section, including a copy of the 2000 Certificate of Achievement forExcellence in Financial Reporting, this Letter of Transmittal, and the MTA OrganizationalStructure.
Financial Section, including the Report of the Independent Accountants, financial state-ments, and accompanying notes to the financial statements.
Statistical Section, including a number of tables and graphs of unaudited data for the past10 years and other information.
The Reporting Entity
MTA is the largest public transportation provider in the Western Hemisphere. Its agenciesserve 14.5 million people spread over 5,000 square miles from New York City through LongIsland, southeastern New York State, and Connecticut. MTA services now move more than 2.3 billion rail and bus customers a year.
A public benefit corporation chartered by the New York State Legislature in 1965, the MTAis governed by a 17-member Board.* Members are nominated by the Governor, with four rec-ommended by New York City’s mayor and one each by the county executives of Nassau,Suffolk, Westchester, Dutchess, Orange, Rockland, and Putnam counties (the members repre-senting the last four cast one collective vote). The Board also has six rotating non-voting seatsheld by representatives of organized labor and the Permanent Citizens Advisory Committee(“PCAC”), which serves as a voice for users of MTA transit and commuter facilities. All Boardmembers are confirmed by the New York State Senate.
* The current Board is made up of 17 voting members and 6 non-voting members.
Letter of Transmittal
1

2 M E T R O P O L I T A N T R A N S P O R T A T I O N A U T H O R I T Y
The wholly owned subsidiary units and component units of the Metropolitan TransportationAuthority are:
Metropolitan Transportation Authority and Wholly Owned Subsidiary Units
• Metropolitan Transportation Authority Headquarters (“MTAHQ”) provides general over-
sight, planning, and administration, including budget, cash management, finance, legal, real
estate, treasury, risk management, and other functions to the agencies listed below.
• The Long Island Rail Road Company (“LIRR”) provides passenger transportation between
New York City and Long Island.
• Metro-North Commuter Railroad Company (“MNCR”) provides passenger transportation
between New York City and the suburban communities in Westchester, Dutchess, Putnam,
Orange, and Rockland counties in New York State and New Haven and Fairfield counties in
Connecticut.
• Staten Island Rapid Transit Operating Authority (“SIRTOA”) provides passenger rail trans-
portation on Staten Island.
• Metropolitan Suburban Bus Authority (“MSBA”) provides public bus service in Nassau and
Queens counties.
• MTA Excess Loss Trust Fund (“ELF”) provides coverage against losses from catastrophic
events and provides budget stability in the event annual aggregate losses impact negatively
upon the operating budgets of its participants.
• First Mutual Transportation Assurance Company (“FMTAC”) operates as a captive insurance
company to provide insurance coverage for property and primary liability.
Component Units
• New York City Transit Authority (“NYCTA”) and its blended component unit, Manhattan and
Bronx Surface Transit Operating Authority (“MaBSTOA”), provide subway and public bus
service within five boroughs of New York City.
• Triborough Bridge and Tunnel Authority (“TBTA”) operates seven toll bridges, two toll
tunnels, and the Battery Parking Garage.
The following table shows the agencies’ legal and popular names:Legal Name: Popular Name:New York City Transit Authority MTA New York City TransitStaten Island Rapid Transit Operating Authority MTA Staten Island RailwayThe Long Island Rail Road Company MTA Long Island Rail RoadMetropolitan Suburban Bus Authority MTA Long Island BusMetro-North Commuter Railroad Company MTA Metro-North RailroadTriborough Bridge and Tunnel Authority MTA Bridges and Tunnels
For financial reporting purposes, the above agencies are blended with MTAHQ for thecombined financial statements because the oversight boards of each agency consist of thesame members.

3
Major Initiatives, Service Efforts, and Accomplishments
MTA exhibited solid continuous growth during the first eight months of 2001. It continued itsprogram to bring the system into a state of good repair, with all critical components of themass transit system now on cycles of normal replacement. The Authority completed the secondyear of its 2000-2004 Capital Program, a vigorous long-range plan to maintain, improve, andexpand the public transportation system of the region.
The events of September 11, 2001, while not crippling to the transportation system, didhave an effect on the MTA. As a result of MTA’s emergency plans, no employee, customer, orsubway train was lost, and service was largely restored within hours. But the attack on andsubsequent collapse of the World Trade Center seriously damaged a subway tunnel, two sub-way stations, and related facilities.
MTA estimated that there was approximately $855 million in property damage to the tran-sit system. Rebuilding is in progress and restoration of the “1” and “9” train service will becompleted in less time than expected. Lost revenue and additional expenses are estimated atapproximately $488 million.
MTA expects be reimbursed for nearly all property damage, additional expenses, and lostrevenue from insurance policies, along with a smaller amount from the Federal EmergencyManagement Agency (“FEMA”) and the State Emergency Management Office (“SEMO”).
New Capital Projects The 2000–04 Capital Program continues to bring the MTA closer toGovernor George E. Pataki’s goal of a seamless transportation network that better integratesand expands the existing network and ties the region together in more productive ways.
East Side Access Project The 2000–04 Capital Program allocates $1.5 billion to the engi-neering and construction of two new tunnels that will bring MTA Long Island Rail Road directlyinto Grand Central Terminal. The Federal Transit Administration approved the award of adesign/build contract for construction of replacement storage and maintenance facilities atMTA Metro-North Railroad’s Highbridge Yard in the Bronx, an early component of the East SideAccess project, and construction began in September. The yard will replace facilities in GrandCentral Terminal that will be used by East Side Access.
Second Avenue Subway The Capital Program allocates $1.05 billion to plan and begin con-struction of a new Second Avenue subway that will run from 125th Street to lower Manhattan.A $256 million contract for preliminary engineering for the two-track Second Avenue subwaywas awarded. This new line, the system’s first in 70 years, will relieve overcrowding on theLexington Avenue line and provide nearly 550,000 rides a day, including a projected 17,000new transit trips.
Other Service Extensions Other initiatives in the 2000–04 Capital Program include anexamination of routes to extend MTA New York City Transit’s “7” line west from Times Squareand preliminary engineering for an extension of Metro-North Railroad to Penn Station. In addi-tion, MTA continues its support of AirTrain, the Port Authority of New York and New Jersey’strain shuttle service to John F. Kennedy International Airport.
63rd Street Connector and “V ” Line The 63rd Street Connector opened in December andNew York City Transit inaugurated the “V” line, improving the quality of service along QueensBoulevard, one of the city’s most crowded subway lines. The $645 million project spannedseven and a half years and was completed on time and within budget.

4 M E T R O P O L I T A N T R A N S P O R T A T I O N A U T H O R I T Y
Five-Year Financial Plan
The $18.2 billion 2000–04 Capital Program supports three key imperatives: completion of therestoration of the system begun in 1982; preservation of the investments already madethrough timely replacement of assets; and expansion of the MTA transportation network tobetter serve the vibrant economy of the New York City region.
As part of its 2000–04 Capital Program for mass transit, which totals $17.22 billion, MTAmade new commitments of $3.42 billion in 2001. Funding for the Capital Program comes from acombination of bond sales; money freed up through debt restructuring; earned interest income;proceeds from selling or leasing assets; and federal, state, and local allocations.
The 2000–04 Capital Program for MTA Bridges and Tunnels, which totals $1.0 billion, madenew commitments of $154 million in 2001. Bridges and Tunnels funds its program with TBTAbonds and pay-as-you-go funding.
Debt Restructuring In 2001 MTA continued to work on its plan to restructure its debt.The restructuring is the largest in the history of the municipal bond market and will provideapproximately $4.5 billion in new capital resources. The additional funds will finance portions ofMTA’s 2000-04 Capital Program, closing a gap created when the statewide TransportationInfrastructure Bond Act was defeated in 2000. The restructuring will streamline MTA’s creditprofile by consolidating 13 of 16 existing credits into four new principal credits.
Local Economy
Metropolitan New York is the most transit-intensive region in the United States. A financiallysound and reliable transportation system is critical to the region’s economic well-being.
Although a national recession began in March, ridership and revenue remained strongthrough August. The September 11 attack on the World Trade Center had an immediate andnegative impact on the local economy and on MTA ridership and vehicle crossings. By year-end,however, ridership on mass transit recovered substantially. Vehicle crossings on bridges andtunnels were slightly lower than in 2000 because of traffic restrictions on some bridges andtunnels.
The Authority expects that federal and state economic stimulus measures and the rebuildingof the downtown infrastructure will improve the New York City economy. In addition, the MTAsystem provides economic stimulus to the region through its capital investments, which createan annual average of 21,000 private sector jobs, $1.1 billion in wages, $100 million in stateand local tax revenues, and $2.5 billion in economic activity.
Results of Operations
Ridership In the year 2001, New York City Transit carried a total of 2.14 billion customers, upfrom 2.08 billion in 2000 and the highest level since 1970. Ridership on the Long Island RailRoad grew for the ninth consecutive year, reaching 85.6 million, up from 84.7 million in 2000.Total ridership on Long Island Bus was 30.7 million, an increase from 30.1 million in 2000.Metro-North ridership was 73.1 million, up from 71.8 million a year ago, also the ninth consec-utive year of growth.

5
MetroCard market share continued to grow during 2001. Ridership has grown by 34 percentsince its introduction, while the average paid fare has dropped to $1.06. Nearly all subway stations have MetroCard Vending Machines.
Traffic restrictions put in place after the attack on the World Trade Center led to fewervehicles using Bridges and Tunnels crossings in 2001. Crossings had been ahead of the recordlevel set in 2000 before September 11. Vehicle crossings in 2001 were 293.2 million, downfrom 296.6 million in 2000.
Despite the decrease, E-ZPass usage continued to grow. There were 197.6 million E-ZPasstransactions in 2001, a market share of 67.4 percent. E-ZPass is now accepted for paymentson highways, bridges, and tunnels in seven states from Massachusetts to West Virginia.
Operating Revenues
Budget Performance Revenues from fares and tolls were $3.90 billion in 2001, an increase ofslightly less than 1 percent from the prior year. The strong financial performance of the pastfive years enabled the MTA to maintain a balanced budget in 2001. The MTA expects to recoverthe revenue loss relating to the events of September 11 from insurance policies.
Operating Expenses
Salaries and wages and retirement and other employee benefits expenses increased across allreporting groups. The principal reasons were additional service frequency, more staff, higherlevels of overtime, and wage increases associated with labor contracts for many of the MTA’srepresented staff. Benefit expenses increased commensurate with the higher salaries andwages and were affected by the nationwide increase in health benefit costs and recalculatedpension contributions necessitated by stock market losses.
Operating Revenues
2001 Percent of 2000 DollarTotal Change
Passengers $2,987 74% $2,943 $44
Tolls 915 23% 940 (25)
Rent, freight, and sundry 150 3% 150 —
Total $4,052 100% $4,033 $19
Operating Expenses
2001 Percent of 2000 DollarTotal Change
Salaries and Wages $3,294 49% $3,091 $203
Retirement and Other Employee Benefits 992 15% 915 77
Materials and Supplies 445 7% 403 42
Fuel and Power 279 4% 281 (2)
Computer, Engineering, and Other Consulting Services 388 5% 340 48
Public Liability and Claims 106 2% 140 (34)
Depreciation and Amortization 1,067 16% 982 85
Other Expenses 147 2% 98 49
Total $6,718 100% $6,250 $468

6 M E T R O P O L I T A N T R A N S P O R T A T I O N A U T H O R I T Y
Non-Operating Revenues (Expenses)
Risk Management
The Authority has an extensive risk management program, including its own insurance-company“captive.” After September 11, insurance carriers notified the MTA that renewal property poli-cies would have higher costs, higher deductibles, and restrictions on antiterrorism coverage.The MTA does not expect these changes to have a significant adverse effect on its operationsor financial management.
Accounting and Budgetary Control
Management of the Authority is responsible for establishing and maintaining an internal controlstructure to ensure that the assets of the Authority are protected from loss, theft, or misuseand to ensure that adequate accounting data are compiled to allow for the preparation offinancial statements in conformity with generally accepted accounting principles.
Basis of Accounting The Authority prepares its financial statements using the accrual basisof accounting. The activities of the Authority are similar to those of proprietary funds of localjurisdictions and are therefore reported in conformity with governmental accounting and finan-cial reporting principles issued by the Governmental Accounting Standards Board (“GASB”).
Budgetary Controls The Authority maintains budgetary procedures in order to ensure com-pliance with the annual operating budgets approved by the Authority’s Board. It is the respon-sibility of each office to administer its operation in such a manner as to ensure that the use offunds is consistent with the goals and programs authorized by the Board and that approvedlevels are not exceeded.
Debt Administration The MTA’s current statutory bonding cap is $16.5 billion, of whichapproximately $5.4 billion has been issued. The MTA raised $1.5 billion of bond and note pro-ceeds in 2001 to fund Capital Program projects.
Cash Management The Authority’s investment policies comply with the New York StateComptroller’s guidelines. These polices permit investments in, among others, obligations of theU.S. Treasury and its agencies and instrumentalities, and repurchase agreements secured bysuch obligations.
Non-Operating Revenues (Expenses)
2001 Percent of 2000 Dollar Total Change
Tax-Supported Subsidies:New York State $1,151 74% $1,108 43New York City and Local 479 31% 354 125
Operating Subsidies:New York State 217 14% 216 1New York City and Local 204 13% 197 7
Elimination of NYCERS Long-Term Pension Liability — — 237 (237)
Interest on Long-Term Debt (509) -32% (434) (75)
Station Maintenance, Operation, and Use Assessments 120 8% 110 10
Impairment/Loss of Capital Assets at World Trade Center (173) -11% — (173)
Loss on Disposal of Subway Cars (58) -4% — (58)
Others, Net 115 7% 97 18
Total $1,546 100% $1,885 (339)

7
Independent Audit
The accounting firm of PricewaterhouseCoopers LLP performed the annual audit of the financialrecords of the Authority in accordance with generally accepted auditing standards. The reportof the independent accountants on the financial statements of the Authority is included in theFinancial Section of this CAFR.
Awards
The Government Finance Officers Association (“GFOA”) awarded a Certificate of Achievement forExcellence in Financial Reporting to the MTA for the 2000 annual report. This was the sixthconsecutive year the MTA received this prestigious award. In order to be eligible for aCertificate of Achievement, the MTA published an easily readable and efficiently organized com-prehensive annual financial report. This report satisfied both generally accepted accountingprinciples and applicable legal requirements. A Certificate of Achievement is valid for a period ofone year only. We believe that our current comprehensive annual financial report continues tomeet the Certificate of Achievement Program’s requirements and we are submitting it to theGFOA to determine its eligibility for another certificate.
Acknowledgments
The preparation of the comprehensive annual financial report on a timely basis was made possible by the dedicated service of the entire staff of the Comptroller’s Office. Each member of the office has our sincere appreciation for the contributions made in the preparation of this report.
Sincerely,
Gary G. CaplanDirector of Budgets and Financial Management

Certificate of Achievement
8 M E T R O P O L I T A N T R A N S P O R T A T I O N A U T H O R I T Y
Certif icate of Achievementfor Excellence
in Financial Reporting
Presented to
Metropolitan Transportation Authority,
New York
For its Comprehensive Annual Financial Report
for the Fiscal Year EndedDecember 31, 2000
A Certificate of Achievement for Excellence in Financial Reporting is pre-sented by the Government Finance Officers Association of the UnitedStates and Canada to government units and public employee retirementsystems whose comprehensive annual financial reports (CAFRs) achievethe highest standards in government accounting and financial reporting.
President Executive Director

Katherine N. Lapp
Paul Spinelli
Neil S. YellinPeter A. Cannito Kenneth J. Bauer
Lawrence G. Reuter
Auditor General
Executive Director and Chief Operating Officer
PresidentMTA Metro-North Railroad
PresidentMTA Long Island Rail Road
PresidentMTA Long Island Bus
PresidentMTA New York City Transit
Chairman
Peter S. Kalikow
PresidentMTA Bridges and Tunnels
Michael C. Ascher
MTA Organizational Structure
9

This page is intentionally left blank

Financial Section


Report of Independent Accountants
11
Report of Independent Accountants
To Members of the Board of theMetropolitan Transportation Authority:
IIn our opinion, based on our audits and the reports of other auditors, the accompanying combined balance sheet andthe related combined statements of operations and changes in equity and cash flows (“general-purpose financial statements”) present fairly, in all material respects, the financial position of the Metropolitan Transportation Authority(“MTA”) and its subsidiaries and component units, a component unit of the State of New York, at December 31, 2001and 2000, and the results of their operations and their cash flows for the years then ended in conformity with account-ing principles generally accepted in the United States of America. These general-purpose financial statements are theresponsibility of the MTA’s management; our responsibility is to express an opinion on these general-purpose finan-cial statements based on our audits. We did not audit the financial statements of the New York City Transit Authority(“NYCTA”) and the Triborough Bridge and Tunnel Authority (“TBTA”), component units of the MTA, or the StatenIsland Rapid Transit Operating Authority (“SIRTOA”) and the Metropolitan Suburban Bus Authority (“MSBA”),wholly-owned subsidiary units of the MTA, which statements reflect total assets and total revenues constituting $23.4 billion and $4.4 billion, respectively, of the related combined totals for 2001, and $20.0 billion and $4.6 billion,respectively, of the combined totals for 2000. Those statements were audited by other auditors whose reports thereonhave been furnished to us, and our opinion expressed herein, insofar as it relates to the amounts included for NYCTA,TBTA, SIRTOA and MSBA, is based solely on the reports of the other auditors. We conducted our audits of thesestatements in accordance with auditing standards generally accepted in the United States of America, which requirethat we plan and perform the audit to obtain reasonable assurance about whether the financial statements are free ofmaterial misstatement. An audit includes examining, on a test basis, evidence supporting the amounts and disclosuresin the financial statements, assessing the accounting principles used and significant estimates made by management,and evaluating the overall financial statement presentation. We believe that our audits and the report of other auditorsprovide a reasonable basis for our opinion.
As described in the notes to the general-purpose financial statements, MTA and its component units are public benefitcorporations that receive a significant portion of their operating and capital financing requirements from New YorkState, federal and regional governmental units and from the sale of bonds to the public.
As described in Note 2 to the general-purpose financial statements, the MTA adopted Governmental AccountingStandards Board (“GASB”) Statement No. 33, Accounting and Financial Reporting for Nonexchange Transactions,and GASB Statement No. 36, Recipient Reporting for Certain Shared Nonexchange Revenues.
Our audits were made for the purpose of forming an opinion on the general-purpose financial statements taken as awhole, in which we indicated the extent of our reliance on the reports of other independent accountants. The combin-ing financial statements are presented for purposes of additional analysis and are not a required part of the general-purpose financial statements of MTA. Such information has been subjected to the auditing procedures applied in theaudits of the general-purpose financial statements and, in our opinion, based upon our audits and the reports of theother auditors, is fairly stated in all material respects in relation to the general-purpose financial statements taken as a whole.
The required supplementary information on page 44 is required by the Governmental Accounting Standards Boardand is not a required part of the general-purpose financial statements. The required supplementary information hasnot been subjected to the auditing procedures applied in our audits of the general-purpose financial statements takenas a whole and, accordingly, we express no opinion on such information.
April 8, 2002
PricewaterhouseCoopers LLP1301 Avenue of the AmericasNew York NY 10019-6013Telephone (646) 471-4000Facsimile (646) 394-1301

2001 2000
AssetsCash (note 3) $ 78 $ 66
Investments (note 3) 1,887 2,001
Receivables:
Station maintenance, operation, and use assessments 89 85
State and regional mass transit taxes 5 4
Interest 24 45
Due from New York City 340 –
Other 706 1,121
Less allowance for doubtful accounts (30) (30)
Total receivables 1,134 1,225
Materials and supplies 241 213
Prepaid expenses and other current assets (notes 2 and 4) 133 224
Total current assets 3,473 3,729
Properties and equipment, net (note 5) 26,186 24,376
Assets held under capital leases, net (note 7) 460 459
Noncurrent investments (note 3) 4,219 3,236
Recoverable from NYS to service long-term debt 1,393 1,536
Due from NYC 18 385
Deferred expenses related to issuance of debt 259 231
Other noncurrent assets 1,407 779
Total assets $37,415 $34,731
The accompanying notes are an integral part of these combined financial statements. Continued
Combined Balance SheetsDecember 31, 2001 and 2000($ millions)
12 M E T R O P O L I T A N T R A N S P O R T A T I O N A U T H O R I T Y

2001 2000
Liabilities and EquityAccounts payable $ 521 $ 438
Accrued expenses:
Interest 409 441
Salaries, wages, and payroll taxes 189 189
Vacation and sick pay benefits (note 4) 485 433
Current portion–retirement and death benefits 19 12
Current portion–estimated liability from injuries to persons (note 8) 148 146
Other 78 48
Total accrued expenses 1,328 1,269
Current portion–Iong-term debt (note 6) 409 358
Short-term note 300 –
Current portion–obligations under capital leases (note 7) 7 6
Deferred subsidy revenue 33 29
Other deferred revenue 202 188
Total current liabilities 2,800 2,288
Retirement and death benefits (note 4) 64 65
Estimated liability arising from injuries to persons (note 8) 742 740
Long-term debt (note 6) 15,293 13,995
Obligations under capital leases (note 7) 605 583
Other long-term liabilities 1,409 948
Total liabilities 20,913 18,619
Contributed capital 12,053 12,053
Accumulated surplus 4,449 4,059
Total equity 16,502 16,112
Total liabilities and equity $37,415 $34,731
The accompanying notes are an integral part of these combined financial statements.
Combined Balance SheetsDecember 31, 2001 and 2000
($ millions)
13

2001 2000
Operating RevenuesPassenger and tolls $(3,902 $(3,883
Rents, freight, and sundry 150 150
Total operating revenues 4,052 4,033
Operating ExpensesSalaries and wages 3,294 3,091
Retirement and other employee benefits 992 915
Materials and supplies 445 403
Fuel and power 279 281
Computer, engineering, and other consulting services 388 340
Public liability and claims 106 140
Depreciation and amortization 1,067 982
Other expenses 147 98
Total operating expenses 6,718 6,250
Operating (deficit) (2,666) (2,217)
The accompanying notes are an integral part of these combined financial statements. Continued
Combined Statements of Operations and Changes in EquityFor the Years Ended December 31, 2000 and 1999($ millions)
Combined Statements of Operations and Changes in EquityFor the Years Ended December 31, 2001 and 2000($ millions)
14 M E T R O P O L I T A N T R A N S P O R T A T I O N A U T H O R I T Y

Combined Statements of Operations and Changes in Equity(continued)
For the Years Ended December 31, 2000 and 1999($ millions)
Combined Statements of Operations and Changes in EquityFor the Years Ended December 31, 2001 and 2000
($ millions)
15
2001 2000
Nonoperating Revenues (Expenses)
Grants, appropriations, and taxes:
Tax supported subsidies–NYS 1,151 1,108
Tax supported subsidies–NYC and Local 479 354
Operating subsidies–NYS 217 216
Operating subsidies–NYC and Local 204 197
Total grants, appropriations, and taxes 2,051 1,875
Operating subsidies recoverable from CDOT
related to MNCR’s New Haven Line 39 32
Suburban Highway Transportation Fund subsidy – (7)
Subsidies to Dutchess, Orange, and
Rockland counties (10) (5)
Gain from sale of New York Coliseum – 340
Transfer of proceeds of New York Coliseum
sale to City of New York – (340)
Interest on long-term debt (509) (434)
Elimination of NYCERS long-term pension liability – 237
Station maintenance, operation, and
use assessments 120 110
Impairment/loss of capital assets at
World Trade Center (173) –
Loss on disposal of subway cars (58) –
Special expense reimbursement subsidies 1 4
Appropriations, grants, and other receipts externally
restricted for capital projects 1,510 –
Other nonoperating income 85 73
Net nonoperating revenues 3,056 1,885
Net surplus (deficit) 390 (332)
Cumulative effect of change in accounting principle – 263
Appropriations, grants and other receipts externally
restricted for capital projects – 1,675
Equity at the beginning of the year 16,112 14,506
Equity at end of year $16,502 $16,112
The accompanying notes are an integral part of these combined financial statements.

2001 2000
Cash Flows from Operating ActivitiesPassenger receipts/tolls $ 3,906 $ 3,863
Rents and other receipts 234 257
Payroll and related fringe benefits (4,320) (4,074)
Other operating expenses (1,210) (1,265)
Net cash used in operating activities (1,390) (1,219)
Cash Flows from Noncapital Financing ActivitiesGrants, appropriations, and taxes 2,092 1,966
Operating subsidies from CDOT 39 34
Suburban Transportation Fund subsidy – (6)
Subsidies to Dutchess, Orange, and Rockland counties (7) (8)
Net cash provided by noncapital and financing activities 2,124 1,986
Cash Flows from Capital and Related Financing ActivitiesDedicated tax fund bonds proceeds 563 342
Certificates of Participation – 120
Commuter facilities revenue bonds proceeds – 17
General purpose revenue bond anticipation notes 1,020 853
TBTA general purpose revenue bond proceeds 1,119 –
TBTA general purpose revenue bonds refunded (1,050) –
TBTA general purpose variable rate revenue bond proceeds 296 –
TBTA general purpose variable rate revenue bonds refunded (295) –
TBTA mortgage recording tax bond proceeds – 525
TBTA mortgage recording tax bonds refunded – (545)
Proceeds from JP Morgan Chase Loan 300 –
Grants and appropriations 2,010 1,546
Proceeds from sale of New York Coliseum – 361
Transfer of proceeds of New York Coliseum sale to New York City – (344)
CDOT capital contributions 2 1
Capital expenditures (3,240) (2,777)
Debt service payments (1,123) (1,003)
Subsidies designated for debt service payments 6 12
Net cash used in capital and related financing activities (392) (892)
The accompanying notes are an integral part of these combined financial statements. Continued
Combined Statements of Cash FlowsFor the Years Ended December 31, 2000 and 1999($ millions)
Combined Statements of Cash FlowsFor the Years Ended December 31, 2001 and 2000($ millions)
16 M E T R O P O L I T A N T R A N S P O R T A T I O N A U T H O R I T Y

2001 2000
Cash Flows from Investment ActivitiesPurchases of securities–Iong-term (4,567) (3,596)
Sales or maturities of securities–long-term 5,443 3,465
Net short-term (purchases) sales of securities (1,393) 91
Earnings on investments 187 174
Net cash (used in) provided by investment activities (330) 134
Net increase in cash 12 9
Cash at beginning of year 66 57
Cash at end of year $ 78 $ 66
Reconciliation of operating deficit to net cash used in operating activities
Operating (deficit) $(2,666) $(2,217)
Adjustments to reconcile to net cash used in operating activities:
Depreciation and amortization 1,067 982
Elimination of NYCERS long-term pension liability – 237
Net decrease (increase) in payables, accrued
expenses and other liabilities 705 (179)
Net (increase) in receivables (646) (14)
Net decrease (increase) in materials and supplies and prepaid expenses 150 (28)
Net cash used in operating activities $(1,390) $(1,219)
The accompanying notes are an integral part of these combined financial statements.
Combined Statements of Cash Flows(continued)
For the Years Ended December 31, 2000 and 1999($ millions)
Combined Statements of Cash FlowsFor the Years Ended December 31, 2001 and 2000
($ millions)
17

Notes to Combined Financial StatementsDecember 31, 2001 and 2000($ millions)
18 M E T R O P O L I T A N T R A N S P O R T A T I O N A U T H O R I T Y
Note 1—Organization and Basis of Presentation
The Metropolitan Transportation Authority was established in 1965, under Section 1263 of the New York StatePublic Authorities Law, and is a public benefit corporation and a component unit of the State of New York(“NYS”) whose mission is to continue, develop, and improve public transportation and to develop and implementa unified public transportation policy in the New York Metropolitan area.
These combined financial statements are of the Metropolitan Transportation Authority, including its subsidiaryunits and its legally separate component units (collectively, the “Authority”), as follows:
Metropolitan Transportation Authority and Wholly Owned Subsidiary Units
• Metropolitan Transportation Authority Headquarters (“MTAHQ”) provides support in budget,cash management, finance, legal, real estate, treasury, risk and insurance management, andother services, to the subsidiary and component units listed below.
• The Long Island Rail Road Company (“LIRR”) provides passenger transportation betweenNew York City (“NYC”) and Long Island.
• Metro-North Commuter Railroad Company (“MNCR”) provides passenger transportationbetween NYC and the suburban communities in Westchester, Dutchess, Putnam, Orange,and Rockland counties in NYS and New Haven and Fairfield counties in Connecticut.
• Staten Island Rapid Transit Operating Authority (“SIRTOA”) provides passenger transporta-tion on Staten Island.
• Metropolitan Suburban Bus Authority (“MSBA”) provides public bus service in NYC andNassau County.
• MTA Excess Loss Trust Fund (“ELF”) provides coverage against losses from events such as,but not limited to, personal injury, libel, false arrest, damage to real or personal property orenvironmental damage and provides budget stability in the event annual aggregate lossesimpact negatively upon the operating budgets of its participants.
• First Mutual Transportation Assurance Company (“FMTAC”) provides primary insurancecoverage for property losses, which are reinsured, and assumes reinsurance coverage forstation liability and force account liability.
MTAHQ, LIRR, MNCR, SIRTOA, MSBA, ELF, and FMTAC collectively are referred to herein as “MTA”; LIRR andMNCR are referred to collectively as the “Commuter Railroads.”
Component Units
• New York City Transit Authority (“NYCTA”) and its blended component unit, Manhattan andBronx Surface Transit Operating Authority (“MaBSTOA”), provide subway and public busservice within the five boroughs of New York City.
• Triborough Bridge and Tunnel Authority (“TBTA”) operates seven toll bridges, two tunnelsand the Battery Parking Garage, all within the five boroughs of New York City.
The above component units are operationally and legally independent of MTAHQ. These component units enjoycertain rights typically associated with separate legal status including, in some cases, the ability to issue debt.However, they are included in the Authority’s financial statements because of MTAHQ’s financial accountabilityfor these entities. Under Generally Accepted Accounting Principles (“GAAP”), the Authority is required to includethese component units in its financial statements.

Notes to Combined Financial StatementsDecember 31, 2001 and 2000
($ millions)
19
Because the Board members of each of the component units are also the Board members of MTAHQ and itssubsidiary units, the financial statements of the component units have been blended with those of MTAHQ andits subsidiary units for the combined financial statements. Under generally accepted accounting principles forenterprise funds, all significant inter-unit transactions, including receivables, payables, revenues, expenses, andcapital transactions have been eliminated. Except for MTAHQ, financial statements of the individual subsidiaryand component units can be obtained from their respective administrative offices.
Operating Deficits
Substantial operating deficits (the difference between operating revenues and expenses) result from the essen-tial services provided by certain subsidiary and component units of the Authority, and such operating deficitsare expected to continue in the foreseeable future. To fund these operating deficits, the Authority receivessubsidies, as described in Note 2.
Capital Program
The Authority, excluding TBTA, has ongoing capital programs, subject to the approval of the NYS MetropolitanTransportation Authority Capital Program Review Board (“CPRB”), designed to improve public transportation inthe New York Metropolitan area.
1992–1999 Capital ProgramIn November 1995, the MTA Board approved a proposed 1995-1999 Capital Program exclusive of TBTA total-ing $11,929, which was increased in July 1997 to $12,169, when it was first approved by the CPRB. This planincludes the last two years of the 1992-1996 Capital Program and provides funding for three additional years.In September 1996, the Governor signed legislation to increase the current bonding authority for capital proj-ects and approved additional changes to the provisions governing capital programs. In February 1999, the MTABoard approved certain changes to the 1995-1999 Capital Program, raising the amount to $12,553. The March1999 amendments have been approved by the CPRB. The total approved plan amount for 1992-1999 is$16,943, excluding TBTA.
In November 1995, the MTA Board approved a proposed 1995-1999 Capital Program for TBTA totaling $665,which was increased in December 1997 to $669. This plan includes the last two years of the 1992-1996 CapitalProgram and provides funding for three additional years. In February 1999, this amount was increased to $670.The plan does not require the approval of the CPRB. The total approved plan for TBTA, 1992-1999 is, $1,142.
At December 31, 2001, $17,851 had been committed and $15,012 had been expended for the 1992-1999Capital Programs for the Authority, including TBTA.
2000–2004 Capital ProgramThe 2000-2004 Capital Program, exclusive of TBTA, initially totaling $16,462 was approved by the MTA Boardin September 1999. This plan was submitted to the CPRB for approval in October 1999, but was returned forrevision in December 1999. In April 2000, the MTA Board approved subsequent revisions to the proposed2000-2004 Capital Program, which now totals $17,062. In May 2000 CPRB approved the $17,062 CapitalProgram. In February 2002 the CPRB approved the bond resolutions for restructured debt that helps fund the2000-2004 Capital Program. (See Note 6.) In February 2002, the MTA Board increased the 2000-2004 CapitalProjects to $17,224. The CPRB approved the increase in April 2002.
In September 1999, the MTA Board approved a proposed 2000-2004 Capital Program for TBTA that providesfor approximately $1,000 in capital expenditures. This plan does not require approval of the CPRB. In March2000, the MTA Board increased the 2000-2004 Capital Program for TBTA to $1,025.
At December 31, 2001, $6,115 had been committed and $1,663 had been expended for the 2000-2004Capital Program for the Authority, including TBTA.
The federal government has a contingent equity interest in assets acquired by the Authority with federalfunds, and upon disposal of such assets, the federal government has a right to its share of the sale proceeds.

Notes to Combined Financial StatementsDecember 31, 2001 and 2000($ millions)
20 M E T R O P O L I T A N T R A N S P O R T A T I O N A U T H O R I T Y
The Authority is not liable for real estate taxes, franchise taxes, other excise taxes on its properties andsales taxes on substantially all of its purchases.
Note 2—Accounting Policies
In accordance with Governmental Accounting Standards Board (“GASB”) Statement No. 20, “Accounting andFinancial Reporting for Proprietary Fund Accounting,” the Authority applies all applicable GASB pronouncementsas well as all Financial Accounting Standards Board (“FASB”) Statements and Interpretations issued on or beforeNovember 30, 1989 that do not conflict with GASB pronouncements. The Authority has elected not to applyFASB Standards issued after November 30, 1989.
Financial statements prepared in accordance with GAAP require the use of estimates made by management forcertain account balances and transactions. Actual results may differ from these estimates.
Basis of Accounting
The Authority follows enterprise fund and accrual basis of accounting, which is similar in presentation to privatebusiness enterprises.
Investments
The Authority’s investment policies comply with the New York State Comptroller’s guidelines for such policies.Those policies permit investments in, among others, obligations of the U.S. Treasury and its agencies and instru-mentalities, and repurchase agreements secured by such obligations.
Investments maturing and expected to be utilized within a year of December 31 have been classified ascurrent assets in the financial statements.
In accordance with GASB Statement No. 31, “Accounting and Financial Reporting for Certain Investments andfor External Investment Pools,” all investments are recorded on the balance sheet at fair value and all invest-ment income, including changes in the fair value of investments, is reported as revenue on the statement ofoperations. Fair values have been determined using quoted market values at December 31, 2001 and 2000.
Materials and Supplies
Materials and supplies are valued principally at the lower of average cost or market value, net of obsolescencereserve.
Prepaid Expenses and Other Current Assets
In December 2000, NYCTA deposited funds totaling $100 with the New York Power Authority (“NYPA”) to beused for NYCTA’s year 2001 energy costs. Each month during the billing period January 1, 2001 throughDecember 31, 2001 (billing is on a one-month lag), NYPA applied an amount equal to the sum of one-twelfth ofthe aggregate amount plus interest earned on that portion to amounts due from NYCTA for power purchased forthe prior month. As of December 31, 2000, the aggregate amount of $100 was reduced by a total credit of $8.5for the cost of power purchased from NYPA for the month of December 2000. No similar prepayment was madeduring 2001 for year 2002 energy costs.
Properties and Equipment
Properties and equipment are carried at cost and are depreciated on a straight-line basis over estimated usefullives. Expenditures for maintenance and repairs are charged to operations as incurred.
Self-insurance and Risk Retention
LIRR and MNCR are self-insured for liabilities arising from injuries to passengers, employees and others with theexception of injuries to non-employees and off-duty employees arising from occurrences at stations in NewYork State (“Station Liability”), and employees and non-employees, arising from reimbursable project work

Notes to Combined Financial StatementsDecember 31, 2001 and 2000
($ millions)
21
(“Force Account”). LIRR and MNCR accrue the estimated total cost for the self-insured liability arising out ofthese claims. Claims arising from Station Liability and Force Account occurring after November 1, 2001 are fullyinsured up to $7 per occurrence, claims arising November 1, 1996 to October 31, 2001 are insured up to $6,and claims arising December 15, 1986 to October 31, 1996 are insured up to $5. NYCTA and TBTA are self-insured up to certain per-occurrence limits for liability claims arising from injuries to persons, excluding employ-ees. For claims arising after November 1, 2001, the limits are $7 and $1.4, respectively. For claims arisingbetween November 1, 1996 and October 31, 2001, the limits are $6 and $1.2, respectively, and for claims aris-ing between December 15, 1986 and October 31, 1996, the limits are $5 and $1, respectively. NYCTA and TBTAare self-insured for workers’ compensation relating to work-related injuries to employees.
ELF insures certain claims in excess of the self-insured retention limits for LIRR, MNCR, NYCTA, and TBTAnoted above, and in excess of $1.2 for MTAHQ. It receives payments, as required by the ELF self-insuranceagreement, from the participating agencies to cover the actuarially computed amount required to pay claims. AtDecember 31, 2001 and 2000, ELF had $121 and $120, respectively, of assets available to insure current andfuture claims. The maximum amount of claims arising out of any one occurrence that can be paid by ELF is thelesser of the assets available for claims of the ELF or $50.
Effective October 31, 1997, a three-year All-Agency Excess Liability Insurance Policy was purchased. Thispolicy was renewed in 2000 for two additional years. This coverage affords the ELF an additional limit of $150,for a total limit of $200 ($150 excess of $50). In the event the ELF’s assets are exhausted due to payment ofclaims, the All-Agency Excess Liability Insurance will assume the ELF’s coverage position of $50.
Up until October 31, 2001 FMTAC insured property damage or loss exposures in excess of $15 per occur-rence and $30 annually in the aggregate for claims brought by the MTA, LIRR, MNCR, NYCTA, and TBTA.Effective November 1, 2001 FMTAC insures property damage or loss exposures in excess of $30 per occur-rence, with no annual aggregate, brought by the MTA, LIRR, MNCR and TBTA. FMTAC reinsures $7 per occur-rence for Station Liability and Force Account Liability of LIRR and MNCR from a third-party reinsurer. FMTACestablished a $10 aggregate Stop Loss Protection agreement with third-party reinsurers whereby if losses andallocated expenses assumed by FMTAC exceed $45, and $24, for the years ended December 31, 2001 and2000, respectively. The third-party reinsureres will reinsure FMTAC up to $10. If the stop-loss protection isexhausted, any additional losses and allocated expenses are retained by FMTAC. At December 31, 2001 and2000, FMTAC had $863 and $189, respectively, of assets available to insure current and future claims.
Operating Revenues
Passenger revenue and tollsRevenues from the sale of tickets, tokens, electronic toll collection system, and farecards are recognized asincome as they are used. Deferred revenue is recorded for the estimated amount of unused tickets, tokens, fare-cards and E-Z pass balances.
Nonoperating Revenues
Operating assistance, appropriations and grantsThe Authority receives, subject to annual appropriation, NYS operating assistance funds that are generallyrecognized as revenue when all applicable eligibility requirements are met. Generally, funds received under theNYS operating assistance program are fully matched by contributions from NYC and the seven other countieswithin the Authority’s service area.
NYS and Regional Mass Transit TaxesMTA, NYCTA, and SIRTOA receive, subject to annual appropriation, revenues from taxes enacted by the NYSLegislature. These taxes are recognized as revenue when all applicable eligibility requirements are met. Tax pro-ceeds are distributed to the Authority, as they are needed.

Notes to Combined Financial StatementsDecember 31, 2001 and 2000($ millions)
22 M E T R O P O L I T A N T R A N S P O R T A T I O N A U T H O R I T Y
Mortgage Recording Taxes (“MRT”)Under NYS law, the Authority receives capital and operating assistance through a Mortgage Recording Tax(“MRT-1”), which is collected by NYC and the seven other counties within the Authority’s service area, at therate of one-quarter of one percent of the debt secured by certain real estate mortgages. The Authority alsoreceives an additional Mortgage Recording Tax (“MRT-2”) of one-quarter of one percent of certain mortgagessecured by real estate improved or to be improved by structures containing one to six dwelling units in theAuthority’s service area. MRT-1 and MRT-2 taxes are recognized as revenue based upon reported amounts oftaxes collected.
MRT-1 proceeds are initially used to pay MTAHQ’s operating expenses. Remaining funds, if any, are allocated55 percent to the NYCTA and SIRTOA and 45 percent to the Commuter Railroads. The Commuter Railroad por-tion is first used to fund the NYS Suburban Highway Transportation Fund in an amount not to exceed $20 annu-ally. Any funds remaining after this payment are used to pay the commuter portion of debt service on theMortgage Recording Tax Bonds (the “MRT Bonds”). Any funds remaining after meeting debt-service requirementsmay be used for operating and capital needs of the Commuter Railroads at the discretion of the Authority’sBoard. The NYCTA portion is used to pay the transit portion of debt service on the MRT Bonds. Any excessfunds subsequent to meeting debt-service requirements may be used for operating and capital needs of NYCTAat the discretion of the Authority’s Board.
The first $5 of the MRT-2 proceeds is transferred to the MTA Dutchess, Orange, and Rockland Fund ($1.5each for Dutchess and Orange counties and $2 for Rockland County). Additionally, the Authority must transferto each county an amount equal to the product of (i) the percentage by which each respective county’s mortgagerecording tax payments to the Authority increased over such payments in 1989 and (ii) the base amountreceived by each county as described above. Excess amounts transferable to the counties were $5.2 and $1.9for 2001 and 2000, respectively. Remaining funds, if any, are used to pay debt service on the MRT Bonds.Unexpended funds from MRT-2 of $115.9 and $89.6 at December 31, 2001 and 2000, respectively, are avail-able to meet capital and operating needs, including debt service, of the Commuter Railroads and NYCTA, asdetermined by the Authority’s Board. In the years ended December 31, 2001 and 2000, the Commuter Railroadsused $6.0 and $5.3, and the NYCTA used $34.6 and $30.9, respectively, of MRT-2 funds to satisfy debt servicerequirements of the MRT bonds.
In addition, NYCTA receives operating assistance directly from NYC through a mortgage-recording tax at therate of five-eighths of one percent of the debt secured by certain real estate mortgages and through a propertytransfer tax at the rate of one percent of certain properties assessed value (collectively referred to as “UrbanTax Subsidies”).
Petroleum Business Tax (“PBT”)/Dedicated Trust Fund TaxesUnder NYS law, subject to annual appropriation, the Authority receives operating assistance through a portionof the following taxes collected by NYS: certain business privilege taxes imposed on petroleum businesses(“PBT”), the motor fuel tax on gasoline and diesel fuel, and certain motor vehicle fees, including both registrationand non-registration fees. The State Legislature enacts in an annual budget bill for each State Fiscal Year anappropriation to the MTA Dedicated Tax Fund for the then current State Fiscal Year and, with respect to PBTonly, an appropriation of the amount projected by the Director of the Budget to be deposited in the MTADedicated Tax Fund for the next succeeding State Fiscal Year. The PBT portion of such assistance is required bylaw to be allocated, after provision for debt service on Dedicated Tax Fund Bonds (see Note 6), 85 percent toNYCTA and SIRTOA and 15 percent to the Commuter Railroads. Revenues from this funding source are recog-nized based upon amounts of tax reported collected by NYS, to the extent of the appropriation.
Operating subsidies recoverable from Connecticut Department of Transportation (“CDOT”)The portion of the deficit from operations relating to MNCR’s New Haven line is recoverable from CDOT and isrecorded as a credit to operations. Under the terms of a renewed Service Agreement, which began on January 1,2000, and the 1998 resolution of an arbitration proceeding initiated by the State of Connecticut, CDOT pays

Notes to Combined Financial StatementsDecember 31, 2001 and 2000
($ millions)
23
100 percent of the net operating deficit of MNCR’s branch lines in Connecticut (New Canaan, Danbury, andWaterbury), 65 percent of the New Haven mainline operating deficit, and a fixed fee for the New Haven line’sshare of the net operating deficit of Grand Central Terminal (GCT) calculated using several years as a base, withannual increases for inflation and a one-time increase beginning in 1999 for the cost of operating GCT’s NorthEnd Access. The Service Agreement also provides that CDOT pay 100 percent of the cost of non-movable capitalassets located in Connecticut, 100 percent of movable capital assets to be used primarily on the branch linesand 65 percent of the cost of other movable capital assets allocated to the New Haven line. Remaining fundingfor New Haven line capital assets is provided by the Authority. The Service Agreement provides for automaticfive-year renewals. For a third consecutive time, the Service Agreement has been renewed for an additional fiveyears beginning January 1, 2000. Capital assets completely funded by CDOT are not reflected in these financialstatements, as ownership is retained by CDOT. The Service Agreement provides that final billings for each yearare subject to audit by CDOT. Years subsequent to 1995 remain subject to final audit.
Interagency subsidy-Triborough Bridge and Tunnel AuthorityNYS Law requires TBTA to transfer its annual operating surplus, as defined, to NYCTA and MTA. The initial $24of the operating surplus is provided to NYCTA and the balance, as adjusted to reflect debt service requirementsof TBTA bonds issued for their respective benefit, was divided between NYCTA and MTA in their respectiveamounts of $137.9 and $173.3 recognized in 2001. In 2000, the amounts related to NYCTA and MTA were$167.7 and $189.7, respectively.
Certain TBTA investment income is transferred to MTA and is Board-designated for use in acquiring or con-structing capital assets for the Commuter Railroads and NYCTA. MTA recognized $23.8 and $33.2 in 2001 and2000, respectively, related to the TBTA investment income transfer.
Sale of the New York ColiseumOn July 31, 2000, the Authority closed on the sale of the New York Coliseum. The sale contract price wasapproximately $345, resulting in a gain on the sale of approximately $340. Proceeds from the sale were remit-ted to NYC. At December 31, 2001, MTA has recorded an accounts receivable due from New York City of $340.MTA expects to receive these funds in 2002 and 2003.
Reimbursement of ExpensesThe cost of operating and maintaining the passenger stations of the Commuter Railroads in NYS is assessableby the Authority to NYC and the other counties in which such stations are located for each NYS fiscal year end-ing March 31, under provisions of the NYS Public Authorities Law. This funding is recognized as revenue basedupon an amount, fixed by statute, for the costs to operate and maintain passenger stations and is revised annu-ally by the increase or decrease in the regional Consumer Price Index.
NYC no longer fully reimburses NYCTA for costs of a free-fare program for students. Pursuant to an agree-ment with NYS and NYC, MTA continued the student program for the 1999-2000 school year, with NYS andNYC each agreeing to pay $45 of the approximate $135 cost. NYC’s current financial plan provides for the con-tinuation of NYC’s $45 contribution for the 2001-2002 school year, of which $15 was received in December2001. NYCTA’s approved 2002 Operating Budget assumes that the remaining $30 from NYC and NYS’s full $45for the 2001-2002 school year will be received in 2002. The NYCTA’s 2000-2004 financial plan assumes thecontinuation of the joint funding of a free-fare program for students.
On April 2, 1995, NYCTA’s transit police were merged into the NYC’s Police Department. Accordingly, NYC nolonger reimburses NYCTA for the costs of policing the transit system on an ongoing basis. Pursuant to themerger agreement, the costs of some transit police officers and certain other transit police costs are still paidby NYCTA and reimbursed by NYC. NYCTA received approximately $4.7 in 2001 and $7.2 in 2000 from NYC forthe reimbursement of transit police costs. An additional reimbursement of approximately $.8 was received inMarch 2002.

Notes to Combined Financial StatementsDecember 31, 2001 and 2000($ millions)
24 M E T R O P O L I T A N T R A N S P O R T A T I O N A U T H O R I T Y
Federal law and regulations require a paratransit system for passengers who are not able to ride the busesand trains because of their disabilities. Pursuant to an agreement between NYC and the MTA, NYCTA, effectiveJuly 1, 1993, assumed operating responsibility for all paratransit service required in NYC by the Americans withDisabilities Act of 1990. NYC reimburses NYCTA for the lesser of (a) 33 percent of net paratransit operatingexpenses defined as labor, transportation and administrative costs less fare revenues and 6 percent of grossUrban Tax Subsidies or, (b) an amount that is 20 percent greater than the amount paid by the City for the pre-ceding calendar year. Revenues from NYC reimbursement and paratransit fares aggregated approximately $30.3in 2001 and $25.4 in 2000.
Contributed Capital
For fiscal year 2001, with the implementation of Governmental Accounting Standards Board (“GASB”)Statements No. 33, externally restricted grants and appropriations for the purchase of capital assets arerecorded as capital contributions on the statements of operations. In fiscal year 2000 and prior, such itemswere recorded as additions to contributed capital in the consolidated balance sheet.
Statements of Cash Flows
Transactions involving instruments with maturity dates, when acquired, of 90 days or less, are reported on a net basis.
Reclassifications
Certain amounts in the 2000 combined financial statements have been reclassified to conform to the currentyear presentation.
Recent Accounting Pronouncements
The Authority adopted GASB Statement No. 33, “Accounting and Financial Reporting for Non-exchangeTransactions,” during the year ended December 31, 2001. GASB Statement No. 33 establishes accounting andfinancial reporting standards for the recognition of non-exchange transactions involving financial or capitalresources. In accordance with the requirements of GASB Statement No. 33, the Authority recorded current-yeartransactions involving externally restricted capital grants as nonoperating revenues in the statements of operations. It did not restate corresponding amounts that had been recorded in prior years as ContributedCapital in the equity section of the Balance Sheet. The Authority will restate prior-year Contributed Capitalamounts to nonoperating revenue when it adopts GASB Statement No. 34, as discussed below. The provisions of GASB Statement No. 33, other than those related to the reporting of capital contributions, have beenadopted effective January 1, 2000, and fiscal year 2000 amounts have accordingly been restated. The effect of the implementation of Statement GASB No. 33 on beginning cumulative surplus for fiscal years 2001 and2000 is an increase of $243 and $263, respectively. Provisions related to the reporting of capital contributionsare effective January 1, 2001, and as such, no restatement of fiscal year 2000 amounts related to capital contributions is permitted.
GASB issued Statement No. 34, “Basic Financial Statements and Management’s Discussion and Analysis forState and Local Governments,” Statement No. 37, “Basic Financial Statements and Management’s Discussion andAnalysis–State and Local Governments: Omnibus–an amendment of GASB Statements No. 21 and No. 34” andStatement No. 38, “Certain Financial Statement Note Disclosures” regarding the basic financial statement modelfor state and local government units. The Authority will adopt the provisions in these statements for the yearended December 31, 2002. Management has not fully assessed the impact of these pronouncements on thecombined financial statements.

Notes to Combined Financial StatementsDecember 31, 2001 and 2000
($ millions)
25
Note 3—Cash and Investments
Cash, including deposits in transit, consists of the following at December 31, 2001 and 2000:
2001 2000Carrying Bank Carrying Bank
Amount Balance Amount Balance
Insured (FDIC) or collateralized deposits $42 $27 $39 $22Uninsured and uncollateralized deposits 36 24 27 5
Total $78 $51 $66 $27
All collateralized deposits are held by the Authority or its agent in the Authority’s name.
The MTA, on behalf of the NYCTA, TBTA and MSBA, invests funds, which are not immediately required for theAuthority’s operations in securities permitted by the State Public Authorities Law, including repurchase agree-ments collateralized by U.S. Treasury securities, U.S. Treasury notes, and U.S. Treasury zero coupon bonds.
Investments, at fair value, consist of the following at December 31, 2001 and 2000:
2001 2000
Repurchase Agreements $1,186 $1,121U.S. Treasuries due 2002-2018 4,365 2,877Government National Mortgage
Association due 2014-2024 153 865Investments restricted for lease obligations 114 83Other agencies due 2005-2008 288 291
Total $6,106 $5,237
Fair values include accrued interest to the extent it is included in the carrying amounts. Accrued interest oninvestments other than Treasury bills and coupons is included in other receivables on the balance sheet. TheAuthority’s investment policy states that securities underlying repurchase agreements must have a market valueat least equal to the cost of the investment.
All investments are either insured or registered and held by the Authority or its agent in the Authority’s name.Accordingly, all investments are category-one credit risk (the lowest risk category). Investments had weightedaverage yields of 2.4 percent and 6.3 percent for the years ended December 31, 2001 and 2000, respectively.
Of the above cash and investments, amounts held for restricted purposes were as follows at December 31,2001 and 2000:
2001 2000
Construction or acquisition of capital assets $3,347 $2,702Funds received from affiliated agencies for investment 291 348Debt service 1,714 1,700Payment of claims 281 118Other 72 83
Total $5,705 $4,951

Notes to Combined Financial StatementsDecember 31, 2001 and 2000($ millions)
26 M E T R O P O L I T A N T R A N S P O R T A T I O N A U T H O R I T Y
Note 4—Employee Benefits
Substantially all Authority subsidiaries, component units and pension plans have separately issued financialstatements that are publicly available and contain descriptions and supplemental information regardingemployee benefit plans. These statements may be obtained by calling the administrative office of the respectivesubsidiary or component unit.
Pension Plans
The Authority sponsors and participates in a number of pension plans for its employees. These plans are notcomponent units of the Authority and are not included in the combined financial statements.
Defined Benefit Pension Plans
Single-Employer Public Employee Retirement SystemsThe Long Island Rail Road Company Pension Plan (“LIRR Plan”) and the Long Island Rail Road Company Plan for Additional Pensions (“LIRR Additional Plan”) are contributory, defined-benefit pension plans that coveremployees who began service with LIRR prior to January 1, 1988. Benefit provisions are established by LIRR and are based on length of qualifying service and final average compensation.
The TWU-MSBA Employees’ Pension Plan (“MSBA Plan”) is a contributory, defined-benefit plan covering sub-stantially all its employees who began service prior to January 23, 1983. Persons employed after that date arecovered by NYS Employees’ Retirement System (“NYSERS”). In 1999, the “MSBA Plan,” which was administeredunder terms of the TWU-MSBA Employees’ Pension Trust, was merged with the MTA Defined Benefit Plan andadministered by the MTA.
The MaBSTOA Pension Plan (“MaBSTOA Plan”) is a defined-benefit plan covering substantially all of itsemployees. This plan assigns authority to amend the plan and determine contributions to the MaBSTOA Board.
In 2001 and 2000, NYCTA made additional contributions to the MaBSTOA Plan of $83.5 and $113.8, respec-tively, resulting in the recognition of a pension asset in the combined balance sheet.
SIRTOA has a contributory, defined-benefit plan that is a single-employer public employee retirement system covering certain employees. Authority to amend the plan and to determine contributions rests with the MTA Board.
The Metropolitan Transportation Authority Defined-Benefit Pension Plan (“MTA Plan”) is a defined-benefitpension plan for certain LIRR and MNCR management employees hired after December 31, 1987, certain MSBAemployees hired prior to January 23, 1983 and MTA Police. The MTA Plan offers distinct retirement, disabilityand death benefits for MNCR and LIRR management employees, MTA 20-year Police Retirement Plan and MSBAEmployees’ Pension Plan. Annual pension costs and related information about this plan are presented in thetable below for all years presented as if the plan was a single-employer plan at the MTA level. A stand-alonefinancial report may be obtained by writing to the MTA Comptroller, 347 Madison Avenue, New York, New York,10017.
LIRR, MNCR, MTA and MSBA recognized 2001 and 2000 pension expense based upon an assessment, whichon average, was 12.22 percent and 11.32 percent, respectively, of annual compensation. The MTA Plan may beamended by the action of the MTA Board.

Notes to Combined Financial StatementsDecember 31, 2001 and 2000
($ millions)
27
Annual pension costs and related information about each plan follows:
Single-Employer Plans
LIRR SIRTOA MaBSTOA MTA Plan
Required contribution rates:Plan members variable 3.00% variable variable
Employer actuarially actuarially actuarially actuariallydetermined determined determined determined
Employer contributions made in 2001 $32.3 $1.4 $116.1 $14.4
Three year trend information:Annual Pension Cost (APC):2001 34.6 1.4 114.2 16.52000 32.1 0.8 99.5 13.81999 34.1 1.0 91.5 12.9
Net Pension Obligation(NPO) (assets) at end of year:2001 (2.2) None 62.6 2.12000 (4.5) None 64.5 –1999 1.5 None 67.9 5.8
Percentage of APC contributed:2001 93% 100% 102% 87%2000 119% 100% 103% 142%1999 117% 100% 103% 53%
Components of APC:Annual required contribution (ARC) 34.7 1.4 116.1 16.5Interest on NPO (0.3) – 5.3 –Adjustment of ARC 0.2 – (7.2) –
APC 34.6 1.4 114.2 16.5
Contributions made 32.3 1.4 116.1 14.4
Change in NPO (assets) 2.3 – (1.9) 2.1
NPO (assets) beginning of year (4.5) – 64.5 –
NPO (assets) end of year (2.2) – 62.6 2.1
Date of valuation 01/01/01 01/01/01 01/01/01 01/01/01Actuarial cost method entry age entry age frozen initial entry age
frozen initial liability normalliability frozen initial
liability
Method to determine actuarial value normal cost 5 yr moving 5 yr moving phasing to aaverage of average of 5 yr moving
market value market value average ofmarket value
Investment return 8.50% 8.25% 8.25% 8.25%Projected salary increases 4.0% 5.0%-12.0% 3.5%-18.0% 3.0%-36.2%
Consumer price inflation 3.75% 3.00% 2.50% 2.50%
Amortization method and period level % of level dollar/ level dollar/ level % ofpayroll/ 30 yrs 30 yrs payroll/40 yrs 30 yrs
Period closed or open closed closed closed closed

Notes to Combined Financial StatementsDecember 31, 2001 and 2000($ millions)
28 M E T R O P O L I T A N T R A N S P O R T A T I O N A U T H O R I T Y
Cost Sharing Multiple-Employer Plans
New York City Employees’ Retirement System (“NYCERS”)
Plan DescriptionNYCTA and TBTA contribute to NYCERS, a cost-sharing multiple-employer retirement system for employees ofNYC and certain other governmental units. NYCERS combines features of a defined-benefit pension plan withthose of a defined-contribution pension plan. NYCERS provides pension benefits to retired employees based onsalary and length of service. In addition, NYCERS provides disability benefits, accident benefits, cost-of-livingadjustments, and death benefits subject to satisfaction of certain service requirements and other provisions.The NYCERS Plan functions in accordance with existing NYS statutes and NYC laws and may be amended byaction of the State Legislature. NYCERS issues a publicly available comprehensive annual financial report thatincludes financial statements and required supplementary information. That report may be obtained by writingto the New York City Employees’ Retirement System, 335 Adams Street, Suite 2300, Brooklyn, New York 11201.
Funding PolicyNYCERS is a noncontributory plan, except for employees who entered qualifying service after July 1976, whocontribute 3 percent of their salary. The State legislature passed legislation in 2000 that suspends the 3 per-cent contribution for employees who have 10 years or more of credited service. The NYCTA and TBTA arerequired to contribute at an actuarially determined rate. The contribution requirements of plan members ofNYCTA and TBTA are established and amended by law. NYCTA’s contributions to NYCERS for the years endedDecember 31, 2001, 2000 and 1999 were $19.5, $29.5, and $17.4, respectively, and were equal to the annualrequired contributions for each year. TBTA’s contributions to NYCERS for the years ended December 31, 2001,2000 and 1999 were $1.0, $0.9 and $0.5, respectively. In December 2000, NYCTA prepaid its fiscal year 2000-2001 NYCERS contribution resulting in the recognition of a $2.3 million net pension asset on the combined bal-ance sheet.
Prior to 1981, NYCTA and TBTA were required to pay NYCERS its share of the pension liability on a two-yearlag basis. Due to a change in New York State law, the NYCTA and TBTA, in 1981, were required to make pensionliability payments on a current-year basis. The amount representing the “catch-up” liability remaining wasincluded in the consolidated balance sheet in accrued retirement and death benefits. However, in accordancewith Chapter 85 of the New York State laws of 2000, enacted as part of a number of changes to actuarialassumptions and methods, this liability is no longer being funded separately as part of actuarially determinedpension contributions and a liability on the part of the NYCTA and TBTA separate from its actuarially deter-mined pension contributions no longer exists. Accordingly, the amount of the recorded catch-up liability andrelated receivable from the NYC for the portion of the catch-up liability applicable to capital project engineerswas reduced to zero as of December 31, 2000, with the net effect of such elimination of $236.8 recorded as anonoperating transaction in the consolidated statements of operations and surplus.
New York State Employees’ Retirement System (“NYSERS”)
Plan Description and Funding PolicyMTAHQ and MSBA employees who were hired after January 23, 1983 are members of NYSERS. NYSERS is acost-sharing multiple-employer plan and offers a broad spectrum of benefits including retirement and disabilitybenefits. Generally, employees contribute 3 percent of salary. In 2000, the State legislature passed legislationthat suspends the 3 percent contribution of members who have 10 or more years of credited service. MTAHQand MSBA recognize pension expense based upon annual assessments made by NYSERS. NYSERS pensionexpense was approximately $1.2, $0.7, and $0.7, for the years ended December 31, 2001, 2000, and 1999,respectively, and equaled the annual required contributions for each year. Further information about the plan ismore fully described in the publicly available statement of NYSERS and may be obtained by writing to New YorkState and Local Retirement System, Office of the State Comptroller, A. E. Smith State Office Building, Albany,New York, 12244.

Notes to Combined Financial StatementsDecember 31, 2001 and 2000
($ millions)
29
Defined Contribution Plans
The MTA also provides retirement benefits to certain of its employees under the following defined-contributionplans:
Single-Employer Public Employee Retirement Systems1) The Long Island Rail Road Company Money Purchase Plan (“Money Purchase Plan”) is a defined-
contribution plan that covers all employees who began service with LIRR after December 31,1987. Employees participating in the plan contribute three percent of their compensation andLIRR contributes four percent of their compensation. The Plan is administered by the LIRR Boardof Managers of Pension. The MTA Board of Directors is responsible for establishing or amendingthe Plan’s provisions and contribution requirements.
2) The Metro-North Commuter Railroad Company Defined Contribution Pension Plan for AgreementEmployees (“Agreement Plan”), established January 1, 1988, covers union-represented employeesin accordance with applicable collective-bargaining agreements. Under this plan, MNCR will con-tribute to the plan an amount equal to 4 percent of each eligible employee’s gross compensationon that employee’s behalf. For employees who have 19 or more years of service MNCR con-tributes 7 percent. In addition, employees may voluntarily match MNCR’s contribution to theplan, on an after-tax basis. The Plan is administered by an employee of Metro-North CommuterRailroad and the Metro-North Board of Managers of Pension. The MTA Board of Directors isresponsible for establishing or amending the Plan’s provisions and contribution requirements.
2001 2000
LIRR MNCR LIRR MNCR
Money Purchase Agreement Money Purchase Agreement
Plan Plan Plan Plan
Employer contributions $8.3 $14.8 $6.3 $14.6
Employee contributions 5.2 1.2 4.2 1.1
Deferred Compensation Plans
As required by Internal Revenue Code Section 457, the Authority has established a trust or custodial account tohold plan assets for the exclusive use of the participants and their beneficiaries. Plan assets and liabilities arenot reflected on the Authority’s combined balance sheet. Certain Authority employees are participants in a second deferred-compensation plan established in accordance with Internal Revenue Code Section 401(k).Participation in the plan is available to all nonunion and certain other employees. All amounts of compensationdeferred under the plan, and all income attributable to such compensation, are solely the property of the partic-ipants; accordingly, this plan is not reflected in the accompanying combined balance sheet.

Notes to Combined Financial StatementsDecember 31, 2001 and 2000($ millions)
30 M E T R O P O L I T A N T R A N S P O R T A T I O N A U T H O R I T Y
Other Post-Employment Benefits
In addition to providing pension benefits, the Authority provides healthcare, life insurance, and survivor benefits forcertain retired employees and their families. These benefits are recorded on a pay-as-you-go basis. The Authorityis statutorily required to provide such benefits. The cost of the benefits is shared in varying proportions by theemployer and employee. The number of retirees and costs of providing the benefits by the Authority follow:
2001 2000
Number of Cost of Number of Cost of
participants benefits participants benefits
MTAHQ 181 $ 1.1 156 $ 0.8MNCR 1,262 1.8 1,310 1.7LIRR:
Management 641 4.5 593 3.8Represented 3,858 10.4 3,759 7.6
NYCTA 31,500 121.0 32,100 109.5TBTA 1,281 4.1 878 5.0SIRTOA 43 .2 37 0.1
Note 5—Properties and Equipment
Properties and equipment consist of the following at December 31, 2001 and 2000:
Useful life
(years) 2001 2000
Land $ 122 $ 122Road and track 25-60 7,800 7,451Bridges and tunnels 100 1,169 1,040Buildings and structures 25-50 8,313 8,155Equipment:Passenger cars 25-35 5,444 4,417Buses 12 1,531 1,494Other 2-40 6,288 5,771
Construction in progress 4,365 3,820
35,032 32,270Less accumulated depreciation (8,846) (7,894)
$26,186 $24,376
Interest capitalized in conjunction with the construction of capital assets for the years ended December 31,2001 and 2000 was $57 and $64, respectively.
Capital assets acquired prior to April 1982 for NYCTA were funded primarily by NYC with capital grants madeavailable to NYCTA. NYC has title to a substantial portion of such assets and, accordingly, these assets are notrecorded on the books of NYCTA. Subsequent acquisitions, which are part of the MTA Capital Program, arerecorded at cost by NYCTA. In certain instances, title to TBTA’s real property may revert to NYC in the eventTBTA determines such property is unnecessary for its corporate purpose. During 2001, the NYCTA beganreplacement of certain subway car fleets. The NYCTA scrapped 229 cars and recorded a loss on disposal of capital assets of approximately $58.

Notes to Combined Financial StatementsDecember 31, 2001 and 2000
($ millions)
31
As a result of the terrorist attacks on September 11, 2001, which destroyed the World Trade Center (“WTC”),the #1 and #9 subway tunnel was heavily damaged, including damage to line equipment, signals, communica-tions, tunnel lighting, power facilities, and fan plants. Approximately 1,800 feet of tunnel was destroyed. Therewas also damage to subway stations located at Cortlandt Street, Rector Street, Chambers Street, and WallStreet. Although damage assessment is still ongoing, the current estimate of the Authority’s capital loss expo-sure recorded in fiscal year 2001 for impaired capital assets is approximately $172.6.
Effective January 1, 2000, MNCR revised the depreciation rates utilized for revaluation of property andequipment, based on the results of engineering estimates and industry practices, to more appropriately reflectthe useful lives of the assets. The effect of the new rates was an increase of approximately $11 in depreciationin 2000 when compared to 1999.
For certain construction projects, the Authority holds in a trust account marketable securities pledged bythird-party contractors in lieu of cash retainages. At December 31, 2001 and 2000, these securities totaled$65.0 and $70.0, respectively, and had a market value of $66.5 and $71.9 respectively, and are not included inthese financial statements.
Note 6—Long-Term Debt
All of the net proceeds of long-term debt were used for the acquisition or construction of capital assets or torefund outstanding capital related debt. Long-term debt consists of the following:
December 31, December 31,
2000 Issued Retired Refunded 2001
MTA:Transit Facilities Revenue Bonds:
3.90%-8.00% due through 2029 $ 2,369 $ – $ 72 $ – $ 2,297
Commuter Facilities Revenue Bonds:4.00%-8.00% due through 2029 1,828 – 40 – 1,788
Commuter Facilities Subordinate Revenue Bonds (GCT):4.40%-5.70% due through 2024 104 – 2 – 102
Commuter Facilities Special Obligation Bond Anticipation Notes 1.30%-1.60%due through 2002 250 – – – 250
Transit Facilities Special Obligation Bond Anticipation Notes 1.35%-1.91%due through 2002 500 – – – 500
Transit and Commuter Facilities Service Contract Bonds:4.10%-9.25% due through 2021 1,904 – 60 – 1,844
Excess Loss Trust Fund Bonds:4.00%-6.70% due through 2010 49 – 4 – 45
Dedicated Tax Fund Bonds:4.00%-6.25% due through 2029 1,533 554 23 – 2,064
Certificates of Participation:4.40%-5.625% due through 2029 447 – 8 – 439
Unamortized discountand deferred amortization (481) 9 (22) – (450)
Total MTA 8,503 563 187 – 8,879

Notes to Combined Financial StatementsDecember 31, 2001 and 2000($ millions)
32 M E T R O P O L I T A N T R A N S P O R T A T I O N A U T H O R I T Y
December 31, December 31,
2000 Issued Retired Refunded 2001
NYCTA:
Transit Facilities Revenue Bonds:4.70%-7.50% due through 2021 187 – 9 – 178
Unamortized premium 19 4 – – 23
Total NYCTA 206 4 9 – 201
TBTA:
General Purpose Revenue Bonds:3.20%-7.00% due through 2030 3,669 1,424(1) 116 293 4,684
Mortgage Recording Tax Bonds:4.75%-7.10% due through 2019 932 – 19 – 913
Beneficial Interest Certificates:4.95%-5.20% due through 2005 43 – 8 – 35
Bond Anticipation Notes 2000A 807 – – – 807
Bond Anticipation Notes 2001A – 1,000 1,000 – –
Special Obligation Subordinated Bonds:3.55%-5.13% due through 2024 253 – 6 – 247
Unamortized discount (60) (30)(1) (26)(2) – (64)
Total TBTA 5,644 2,394 1,123 293 6,622
Combined total 14,353 2,961 1,319 293 15,702
Current portion (358) (409)
$13,995 $15,293
(1)Includes current year accretion on zero coupon bonds.(2)Includes current year amortization of discount.
MTA Transit and Commuter Facilities Revenue Bonds
These bonds are obligations payable solely from, and secured by a pledge of, the gross operating revenues,certain NYS and local operating subsidies and other monies, and the physical assets of LIRR and MNCR forCommuter Facilities Revenue Bonds, and a pledge of the gross revenues of the NYCTA and certain state andlocal operating subsidies and other monies, for the Transit Facilities Revenue Bonds. In accordance with thebond resolutions, sufficient funds to meet the maximum annual debt service requirements are held in reserveaccounts maintained by the trustee as security for payment of the bonds. The remaining revenues after debtservice on senior-lien and subordinated bonds are available to meet the operating needs of the agencies.
MTA Commuter Facilities Subordinated Revenue Bonds (GCT Redevelopment Project)
These bonds are obligations payable solely from, and secured by a pledge of, the gross operating revenues,certain NYS and local operating subsidies and other monies, of LIRR and MNCR. These bonds are subordinate toMTA Commuter Facilities Revenue Bonds.
MTA Transit and Commuter Facilities Special Obligation Bond Anticipation Notes
The interest rate payable on the notes depends on the maturity and market conditions at the time of issuance.At December 31, 2001, the average rate on the outstanding notes was 1.53 percent. Principal and interest onthe notes is additionally secured by a letter of credit issued by a bank. It is the Authority’s intention to reissuethe notes as they become due or to issue other securities, such as bonds, to refund the notes. If the notes arenot reissued (or other securities issued), the amounts due to the letter of credit bank are converted to bank

Notes to Combined Financial StatementsDecember 31, 2001 and 2000
($ millions)
33
parity-obligation bonds with a term of three years. The notes are therefore recognized as a long-term liabilityon the balance sheet.
MTA Transit and Commuter Facilities Service Contract Bonds
These bonds are obligations payable solely from, and secured by, semi-annual payments from NYS provided forunder service contracts entered into with the Authority and from certain funds established under the bond resolutions. The obligation of NYS to make payments of principal and interest under the service contracts isdependent upon annual appropriations by the NYS Legislature and the availability of monies to fund such payments. Net interest cost associated with the Service Contract Bonds of $97.3 and $100.5 in 2001 and2000, respectively, is funded by NYS. Amounts received from NYS to fund interest and principal costs was$150.4 and $147.2 in 2001 and 2000 respectively.
Excess Loss Trust Fund Bonds
These bonds are obligations of MTA, the proceeds of which reside with ELF. Debt service on these bonds ispayable from investment earnings and, if required, from assessments on participating agencies.
MTA Dedicated Tax Fund Bonds
These bonds are payable solely from and secured by funds held in the Pledged Amounts Account of the MTADedicated Tax Fund consisting generally of the taxes described in Note 2–Nonoperating Revenues–DedicatedTrust Fund Taxes and NYS and Regional Mass Transit Taxes, subject to appropriation by the State Legislature.
In December 2001, the Authority issued Dedicated Tax Fund Bonds, Series 2001A, in the amount of $544.These bonds were issued to finance certain capital expenditures of the transit and commuter systems.
MTA Certificates of Participation
These fixed-rate Serial and Term Certificates of Participation represent proportionate interests in the principaland interest components of Base Rent paid severally, but not jointly, in their respective proportionate shares by NYCTA, MTA, and TBTA, pursuant to a Leasehold Improvement Sublease Agreement, dated June 1, 1999.These certificates were issued to finance certain building and leasehold improvements to an office building inManhattan at Two Broadway, occupied by NYCTA and TBTA (See Note 7).
Short Term Note
On November 8, 2001, the Authority entered into a revolving credit agreement with J.P. Morgan Chase for $600to provide working capital assistance in connection with expenses incurred after the WTC attack. The Authorityhas drawn $300, as of December 31, 2001, due November of 2002.
NYCTA Transit Facilities Revenue Bonds
These bonds are obligations of NYCTA payable solely from and secured by a pledge of the same revenues that secure MTA Transit Facilities Revenue Bonds. These bonds are subordinate to MTA Transit FacilitiesRevenue Bonds.
TBTA General Purpose Revenue Bonds and Bond Anticipation Notes
These bonds are obligations of TBTA and are secured by a pledge of the net TBTA revenues and the funds andaccounts established under TBTA General Purpose Revenue Bonds 1980 Resolution.
In January 2001, TBTA issued General Purpose Revenue Bond Anticipation Notes, Series 2001A, in theamount of $1,000 with an interest rate of 5.0 percent. These notes were issued to finance certain transit andcommuter capital projects, as well as TBTA’s own capital projects. In November 2001, TBTA issued Series2001A General Purpose Revenue Bonds in the amount of $1,126. These Bonds were issued to refund TBTAGeneral Purpose Revenue Bonds Anticipation Notes, Series 2001A.

Notes to Combined Financial StatementsDecember 31, 2001 and 2000($ millions)
34 M E T R O P O L I T A N T R A N S P O R T A T I O N A U T H O R I T Y
In December 2001, TBTA issued General Purpose Revenue Bonds Series 2001B and Series 2001C in theamount of $296. These series were issued to refund certain outstanding TBTA General Purpose Revenue Bonds.Subsequent to year-end, TBTA issued $268.3 General Purpose Revenue Bond, Series 2002A at 5.0 percent. Theproceeds of the bonds will be applied to fund certain improvements to the present facilities of TBTA and tofinance certain costs of issuance.
TBTA Mortgage Recording Tax Bonds
These bonds are obligations payable from MRT levied by NYS and allocated between MTA and NYCTA asdescribed in Note 2. If available MRT receipts are not sufficient to fund debt service, TBTA is required to fundthe required amount from its net operating revenue after satisfying the requirements of the 1980 resolution.Total debt service for these bonds for 2001 and 2000 was $59 and $87, respectively. The portion not coveredby MRT receipts and funded by TBTA net operating revenue was zero in both 2001 and 2000.
These bonds are on parity, as to claims on available TBTA net revenue, with TBTA Beneficial InterestCertificates and with TBTA Special Obligation Subordinated Bonds.
TBTA Beneficial Interest Certificates
The Beneficial Interest Certificates are obligations of TBTA payable from net revenues and other amountsderived from TBTA facilities. These certificates are subordinate to the TBTA General Purpose Revenue Bonds andare on parity as to claims on available TBTA net revenues with the TBTA Mortgage Recording Tax Bonds andTBTA Special Obligation Subordinated Bonds.
TBTA Special Obligation Subordinated Bonds
These bonds are special obligations of the TBTA payable from operating revenues, after satisfying the require-ments of the 1980 Revenue Bond Resolution, on a parity with the TBTA Beneficial Interest Certificates andTBTA Mortgage Recording Tax Bonds.
Debt Limitation
The NYS Legislature has imposed limitations on the aggregate amount of debt that the Authority can issue tofund the approved transit and commuter capital programs. For the 1992 through 2004 Capital Programs, theimposed limitation, subject to certain exclusions, is $16,500 compared with issuances totaling approximately$5,461 at December 31, 2001.
Bond Refundings
Historically, the Authority has issued several series of refunding bonds, the proceeds of which were used to pur-chase U.S. Treasury obligations that were placed in irrevocable trusts, the principal and interest of which will beused to repay the refunded debt. Accordingly, the trust account assets and the refunded debt, including relateddeferred bond issuance costs, are excluded from the combined balance sheets.
In accordance with the provisions of GASB Statement 23, “Accounting and Financial Reporting for Refundingsof Debt Reported by Proprietary Activities,” gains or losses resulting from debt refundings have been deferredand amortized over the lesser of the remaining life of the old debt or the life of the new debt.
During 2000, debt refundings on the TBTA Mortgage Recording Tax Bonds resulted in an economic gain ofapproximately $2 and a decrease in future debt service cash flow of $4. Economic gain is defined as the presentvalue of the decrease in future debt service cash flows.

Notes to Combined Financial StatementsDecember 31, 2001 and 2000
($ millions)
35
At December 31, 2001, the following amounts of Authority bonds, which have been refunded, remain validdebt instruments and are secured solely by and payable solely from respective irrevocable trusts.
MTA Transit and Commuter Facilities:Transit Revenue Bonds $ 604Commuter Revenue Bonds 369
TBTA General Purpose Revenue Bonds 337TBTA 1991 Special Obligation Resolution Bonds 292
Total $1,602
Interest Rate Swap Options
In August 1998, TBTA entered into a forward interest rate swap agreement with an option, for certain obliga-tions of TBTA under separate International Swap and Derivatives Association master agreements with TBTA andSalomon Brothers Holding Co., Inc. and Bear Stearns Capital Markets Inc. (the “counterparties”). The optionswere exercised by the counterparties, resulting in the issuance by TBTA of its Special Obligation Variable RateRefunding Bonds (1991 Resolution), Series 2000A through Series 2000D in October 2000. TBTA will pay a fixedrate on a notional amount and in return receive a variable rate on the same notional amount from the counter-parties. TBTA received $45.3 in September 1998 for the option. The net proceeds were used by the Authority tofund the transit and commuter capital programs. Amounts received in connection with the swap option havebeen deferred and will be recognized as a yield adjustment over the life of the debt that will be issued in con-nection with the swap option.
In March 1999, TBTA entered into two forward-interest-rate swap agreements with options for certainobligations of TBTA under the International Swap and Derivatives Association master agreement, one betweenTBTA and AMBAC Financial Services, L.P. and the other between TBTA and Salomon Smith Barney (the “counter-parties”). The option with AMBAC was exercised with TBTA issuing $109.1 of its variable rate bonds (GeneralPurpose Revenue Bonds, Series 1999 C) during the fourth quarter of 1999 for the purpose of refunding certainTBTA 1991 Resolution Bonds, Series Q. The option with Salomon Smith Barney was exercised with TBTA issuing$296.4 million of its variable rate bonds, (General Purpose Revenue Bonds, Series 2001B and C) during the yearended December 31, 2001 for the purpose of refunding certain TBTA 1991 Resolution Bonds, Series X. TBTAreceived $27.6 in March 1999 for the option. The net proceeds were used by the Authority to fund the transitand commuter capital programs. Amounts received in connection with the swap option have been deferred andwill be recognized as a yield adjustment over the life of the debt that will be issued in connection with the swap option.

Notes to Combined Financial StatementsDecember 31, 2001 and 2000($ millions)
36 M E T R O P O L I T A N T R A N S P O R T A T I O N A U T H O R I T Y
Debt Service Payments
Principal and interest debt-service payments (excluding refunded bonds) at December 31, 2001, will be asfollows for the 12 months ended December 31:
2002 2003 2004 2005 2006 Thereafter Total
MTA:
Transit FacilitiesRevenue Bonds $ 194 $ 194 $ 194 $ 194 $ 194 $ 2,796 $ 3,766
Commuter FacilitiesRevenue Bonds 137 138 137 138 138 2,523 3,211
Commuter FacilitiesSubordinate RevenueBonds (GCT) 10 10 10 10 9 219 268
Transit and CommuterFacilities ServiceContract Bonds 166 166 165 166 165 1,985 2,813
Dedicated Tax FundBonds 107 143 142 143 143 3,299 3,977
Excess Loss Trust FundSpecial ObligationBonds 7 7 7 7 6 21 55
Certificates of Participation 32 32 32 32 32 690 850
Total MTA 653 690 687 690 687 11,533 14,940
NYCTA:
Transit FacilitiesRevenue Bonds 17 17 17 17 17 253 338
TBTA:
General PurposeRevenue Bonds 377 370 369 370 370 6,249 8,105
Mortgage RecordingTax Bonds 87 87 87 86 87 1,014 1,448
Beneficial InterestCertificates 10 10 10 – – – 30
Variable RateDemand Bonds 18 18 18 18 18 309 399
Total TBTA 492 485 484 474 475 7,572 9,982
Combined Total $1,162 $1,192 $1,188 $1,181 $1,179 $19,358 $25,260
Tax Rebate Liability
Under the Internal Revenue Code of 1986, the Authority accrues a liability for an amount of rebatable arbitrageresulting from investing low yielding tax-exempt bond proceeds in higher-yielding taxable securities. The arbi-trage liability is payable to the federal government every five years and is reported as part of other long-termliabilities. At December 31, 2001 and 2000, the Authority recorded a rebate liability amounting to $13.3 and$12.9, respectively.

Notes to Combined Financial StatementsDecember 31, 2001 and 2000
($ millions)
37
Debt Restructuring
As part of the 2000-2004 MTA Capital Programs, the MTA, NYCTA and TBTA are proposing to refund, defeaseand consolidate substantially all of their outstanding debt. The aggregate principal amount of debt, not includ-ing commercial paper of $750 million, proposed to be refunded and defeased is approximately $13,900. TheMTA and TBTA do not currently expect to refund and defease the Two Broadway Certificates of Participation,the MTA Excess Loss Fund Special Obligation Bonds or the TBTA Convention Center Project Bonds as part of thedebt restructuring. MTA’s bonding resolutions were approved by the CPRB in February 2002.
Through the debt restructuring, the MTA and TBTA propose to modernize their bond resolutions by updatingthe financial and operating covenants, including the elimination or reduction of debt service reserve require-ments, and provide for the use of other financial products.
Note 7—Lease Transactions
Lease/Leaseback Transactions
On March 31, 1997, MTAHQ entered into a lease/leaseback transaction with a third party whereby MTAHQleased LIRR’s Hillside maintenance facility. The term of the lease is 22 years, but the third party has the right torenew for a further 21.5-year term. The facility was subsequently subleased back to MTAHQ as a capital lease,and sub-subleased by MTAHQ to LIRR.
Under the terms of the lease/leaseback agreement, MTAHQ initially received $313.5, which was utilized asfollows: MTAHQ paid $266.4 to an affiliate of the third party’s lender, which has the obligation to make a por-tion of sublease rent payments equal to this amount, thereby eliminating the need for MTAHQ to make thesepayments to the third party. MTAHQ used $20.7 to purchase Treasury securities, which it deposited underpledge to the third party. This deposit, together with the aforementioned obligation of the third party’s lender,resulted in a financial defeasance of all sublease obligations, including the cost of purchasing the third party’sremaining rights at the end of the 22 year sublease period, if the purchase option is exercised. A further $0.6was used to pay for legal and other costs of the transaction, and $3.2 was used to pay the first rental paymentunder the sublease. A further $22.5 was MTAHQ’s net benefit from the transaction, representing considerationfor the tax benefits. TBTA has entered into a guarantee with the third party that the sublease payments will bemade. At December 31, 2001, the Authority has recorded a long-term capital obligation and capital asset of$281 arising from the transaction.
Subway and Rail Cars
On December 12, 1997, MTA entered into lease/leaseback transactions whereby MTAHQ leased certain ofMNCR’s rail cars to a third party and NYCTA leased certain subway-maintenance cars to the same third party.The lease periods for MNCR’s rail cars expire between 2009 and 2014, depending on the asset, and the leaseperiod for NYCTA’s subway-maintenance cars expires in 2013. The third party has the right to renew the leasefor an additional period of 12 years for MNCR cars, depending on the asset, and a further 12 years for NYCTA’ssubway maintenance cars. The cars were subsequently subleased back to MTAHQ as a capital lease, and sub-subleased by MTAHQ to MNCR and NYCTA, respectively.
Under the terms of the lease/leaseback agreement, MTAHQ initially received $76.6, which was utilized asfollows. MTAHQ paid $59.8 to an affiliate of the third party’s lender, which has the obligation to make a portionof sublease rent payments equal to this amount, thereby eliminating the need for MTAHQ to make these pay-ments to the third party. MTAHQ used $12.5 to purchase a Letter of Credit from an affiliate of the third party’slender, guaranteed by the third party lender’s parent. This payment, together with the aforementioned obligationof the third party’s lender, was sufficient to settle all obligations, including the cost of purchasing the thirdparty’s remaining rights at the end of the sublease period if the purchase options are exercised. A further $4.4,before legal costs, was MTA’s net benefit from the transaction, representing consideration for the tax benefits.At December 31, 2001, the Authority has recorded a long-term capital obligation and capital asset of $57arising from the transaction.

Notes to Combined Financial StatementsDecember 31, 2001 and 2000($ millions)
38 M E T R O P O L I T A N T R A N S P O R T A T I O N A U T H O R I T Y
Sale/Leaseback Transactions
During 1995, TBTA entered into a sale/leaseback transaction with a third party whereby the TBTA sold certainsubway cars, which were contributed by the NYCTA, for net proceeds of $84.2. These cars were subsequentlyleased back by the TBTA under a capital lease. The deferred credit of $34.2 was netted against the carryingvalue of the leased assets, and the assets were recontributed to the NYCTA. TBTA transferred $5.5 to the MTA,representing the net economic benefit of the transaction. The remaining proceeds, equal to the net presentvalue of the lease obligation, of which $71.3 was placed in an irrevocable deposit account and $7.5 wasinvested in U.S. Treasury Strips. The estimated yields and maturities of the deposit account and the TreasuryStrips are expected to be sufficient to meet all obligations under the lease as they become due. The capital leaseobligation is included in other long-term liabilities. At the end of the lease term, TBTA has the option to pur-chase the subway cars for approximately $106, which amount has been reflected in the net present value of thelease obligation, or to make a lease termination payment of approximately $89.
In 1995, MTA and CDOT completed a cross-border sale/leaseback of new rail cars with a third party. Thevalue of the leased equipment was $120. The transaction has a lease term of 16.5 years with lease rental pay-ments legally defeased. This transaction resulted in $4.1 of benefits shared by MTA and CDOT.
Other Lease Transactions
On July 29, 1998, the MTA, NYCTA and TBTA entered into a lease and related agreements whereby each agency,as sublessees, will rent, for an initial stated term of approximately 50 years, an office building at Two Broadwayin lower Manhattan. The lease term expires on July 30, 2048, and, pursuant to certain provisions, is renewablefor two additional 15-year terms. The lease comprises both operating (for the lease of land) and capital (for thelease of the building) elements. The total annual rental payments over the initial lease term are $1,602 with rentbeing abated from the commencement date through June 30, 1999. During 2001 and 2000, the Authority maderent payments of $20.8 and $15.1, respectively. In connection with the renovation of the building and for tenantimprovements, the MTA issued $121.2 and $328.2 in 2000 and 1999, respectively, of long-term obligations.The office building is principally occupied by NYCTA and TBTA.
On April 8, 1994, MTA amended its lease for the Harlem/Hudson line properties, including Grand CentralTerminal. This amendment initially extends the lease term, previously expiring in 2031, an additional 110 yearsand, pursuant to several other provisions, an additional 133 years. In addition, the amendment grants MTA anoption to purchase the leased property after the 25th anniversary of the amended lease. The amended leasecomprises both operating (for the lease of land) and capital (for the lease of buildings and track structure)elements.
In August 1988, the MTA entered into a 99-year lease agreement with Amtrak for Penn Station. This agree-ment, with an option to renew, is for rights to the lower-concourse level and certain platforms. The $44.6 paidto Amtrak by the Authority under this agreement is included in other assets. This amount is being amortizedover 30 years. In addition to the 99-year lease, LIRR entered into an agreement with Amtrak to share equallythe cost of the design and construction of certain facilities at Penn Station. Under this agreement, the MTA maybe required to contribute up to $60 for its share of the cost. As of December 31, 2000 the project was closedand $50 was included in property and equipment.
Total rent expense under operating leases approximated $16 in 2001 and $13 in 2000.

Notes to Combined Financial StatementsDecember 31, 2001 and 2000
($ millions)
39
At December 31, 2001, the future minimum lease payments under noncancellable leases are as follows:
Year Operating Capital
2002 $ 15 $ 472003 17 492004 17 552005 17 522006 17 59Thereafter 766 2,152
$849 $ 2,414Amount representing interest (1,802)
Present value of capital lease obligations $ 612
Note 8—Estimated Liability Arising from Injuries to Persons
A summary of activity in estimated liability as computed by actuaries arising from injuries to persons, includingemployees, and damage to third-party property, for the years ended December 31, 2001 and 2000 is presented below:
2001 2000Balance at beginning of year $ 887 $ 852Activity during the year:
Current year claims andchanges in estimates 129 172
Claims paid (126) (137)
Balance at end of year 890 887Less current portion (148) (146)
Long-term liability $ 742 $ 741
Note 9—Commitments and Contingencies
The September 11, 2001 terrorist attack on the World Trade Center in New York resulted in the following sig-nificant items: (1) significant physical and structural damage to NYCTA’s N, R, 1 and 9 lines and related facilitiesand stations; (2) temporary closure of TBTA’s bridges and tunnels, not all facilities, and certain restrictionsimposed on the number of vehicle occupants when the facilities were reopened; (3) safety and security expendi-tures in and around the World Trade Center; and (4) temporary closure of MNCR’s Grand Central Terminal andLIRR’s Pennsylvania Station. The Authority has submitted claims to its re-insurance providers for reimbursementfor expenditures incurred, for physical and structural damages and for loss of revenues due to business inter-ruption. Additional claims are expected to be submitted in 2002, including claims applicable to the year endedDecember 31, 2001. The Authority has not recognized any insurance recovery in the accompanying financialstatements as the Authority is pursuing the resolution of various contingencies with the insurance providers.
The Authority actively monitors its properties for the presence of pollutants and/or hazardous wastes andevaluates its exposure with respect to such matters. When the expense, if any, to clean up pollutants and/orhazardous wastes is estimable, it is accrued by the Authority.
NYCTA was cited by the New York State Department of Environmental Conservation (“NYSDEC”) for failing tocomply with state requirements for tightness testing of underground storage tanks and for failure to notifyNYSDEC of leaking tanks. NYCTA is obligated to remediate contaminated soil and groundwater. In 2001 and

Notes to Combined Financial StatementsDecember 31, 2001 and 2000($ millions)
40 M E T R O P O L I T A N T R A N S P O R T A T I O N A U T H O R I T Y
2000, the NYCTA expended $2.5 and $3.1, respectively, on such cleanup efforts. Such expenditures exclude thecost of capital improvements. In 2001 and 2000, an additional $2.0 in groundwater remediation reserves and$6.3 in soil-remediation reserves, respectively, were accrued. At December 31, 2001, the NYCTA believes that itsremaining accrued liability of $27.9 is sufficient to cover future costs associated with this cleanup. Also, in 2001,in settlement of allegations of non-compliance with various provisions of the Environmental Conservation law andrelated regulations concerning petroleum and chemical bulk handling and storage, underground storage tanks,tidal wetlands, and air emission requirements, the NYCTA and NYSDEC entered into a global consent order resolv-ing the outstanding environmental issues. The financial terms of the global consent required the payment of a $.4 penalty and the commitment of $2.0 toward implementation of an environmental benefits program.
Management has reviewed with counsel all actions and proceedings pending against or involving the Authority,including personal injury claims. Although the ultimate outcome of such actions and proceedings cannot bepredicted with certainty at this time, management believes that losses, if any, in excess of amounts accruedresulting from those actions will not be material to the financial position, results of operations or cash flows of the Authority.
A Federal appellate court has upheld a District Court opinion that the MTAHQ is a common carrier under theFederal Employers’ Liability Act (“FELA”) and therefore, a MTA police officer involved in a car accident while onduty may seek recovery for damages based upon his alleged personal injuries pursuant to FELA. The court limitedits holding to MTAHQ’s employees and expressly excluded employees who provide local transportation servicesand those who operate bridges and tunnels. The Authority has filed a petition for a Rehearing In Banc, and thepetition is pending. The Authority cannot determine the probable outcome of the litigation, but if the policeofficer’s position prevails, and the holding is extended to those similarly situated, The Authority’s liability could be significant.
On December 30, 1996, MTAHQ, LIRR and MSBA entered into a Funding Agreement (“Agreement”) with theCounty of Nassau (the “County”). Pursuant to the Agreement, MTAHQ agreed to make a grant transfer of $51 tothe County, after certain conditions were met by the County. In exchange, the County would make project contri-butions to MTAHQ equal to two times the amount of the grant transfer, provided that the aggregate amount ofproject contributions does not exceed $102. At December 31, 1997, $51 had been paid to the County as a grantand was recorded by MTA as a receivable against future project contributions. At December 31, 2001, MTA hadrequisitioned $84.8 and has received $81.0 from the County for reimbursement of project costs incurred. A sec-ond Funding Agreement (“Second Agreement”) with the County was entered into by MTAHQ and LIRR on May 1,1999. Pursuant to the Second Agreement, MTAHQ agreed to make a grant transfer of $70 to the County. Inexchange, the County will make project contributions to MTAHQ equal to two times the amount of the granttransfer, provided that the aggregate amount of project contributions does not exceed $140. At December 31,2001, MTA had requisitioned and received $140.
Pursuant to a Memorandum of Understanding (“MOU”) dated May 20, 1996, by and among the MTA, NYCTAand NYC, NYCTA was authorized, and made grant transfers to NYC totaling $250 through 1997. In exchange,NYC agreed to pay $500 from its capital budget to fund NYCTA’s capital program. The intent of the MOU was toprovide additional capital funding to the NYCTA, which did not require the issuance of bonds supported byNYCTA revenues including fare receipts. As of December 31, 2001, NYC has made capital payments totaling$232.4 to reduce the receivable due from NYC for the first $250 in the consolidated balance sheets to $17.6.The second $250 is recognized as contributed capital when NYC reimburses NYCTA for the costs of certain capi-tal projects. As of December 31, 2001, NYC has reimbursed NYCTA $163.5 million for capital projects includedin the second $250 million amount.
On March 31, 1995, the MTA Board agreed to a merger of the transit police with the New York City PoliceDepartment, in accordance with a memorandum of understanding between NYCTA and NYC. Pursuant to theterms of the merger, NYCTA’s operation of the transit police and NYC’s obligation to reimburse the cost of oper-ating the transit police terminated effective April 2, 1995. NYC has assumed the liability for substantially allpast and future costs associated with operating the transit police, including all future pension costs. NYCTA hasasserted a claim of approximately $92 against NYC relating to reimbursement of costs incurred in the operation

Notes to Combined Financial StatementsDecember 31, 2001 and 2000
($ millions)
41
of the transit police. NYCTA claims that NYC underpaid these amounts in the period from 1988 throughDecember 1994. In January 1995, NYCTA filed a demand for arbitration pursuant to the lease governing theoverall relationship between NYCTA and NYC to pursue, among other matters, payment of these arrearages. Thearbitration matter has been held in abeyance while NYC, NYCTA, and the Authority explore the possibility of anamicable resolution.
In 1990, a fire occurred in a subway tunnel operated by NYCTA resulting in passenger injuries on a subwaytrain passing through that tunnel. In 1991, a subway train operated by NYCTA derailed at Union Square result-ing in injuries to passengers who were aboard the train. The ultimate loss from each of these events exceeds theNYCTA’s retention limit and has resulted in a liability to the ELF. Management believes that the coverage pro-vided by the ELF will be sufficient to satisfy all claims and that payments of such claims by the ELF will notresult in a significant increase in premiums payable to the ELF by the participants.
MTA entered into a Coordination and Monitoring Agreement with the lessor, Two Broadway LLC. As part ofthis agreement, $68.3 was advanced to the lessor, as of December 31, 1999, to finance contracted base build-ing improvements from proceeds of the 1999 Certificates of Participation. Under the agreement, the lessor is toreimburse the advance with 1.25 percent interest, primarily through rent credits during the lease term. Thisadvance was discounted utilizing an effective interest rate of 8.5 percent resulting in a discount of $25.9. Theobligation to pay these rent credits is currently being disputed by lessor. The MTA intends to vigorously defendits rights to these rent credits. However, given the uncertainty of the collectability of the advance through rentcredits, the net advance at December 31, 2000 of $42.4 was reclassified to base building improvements duringfiscal year 2000. Amounts expended in fiscal year 2000, which, under the agreement, would be reimbursable bythe lessor, have also been recorded as base building improvements.

Notes to Combined Financial StatementsDecember 31, 2001 and 2000($ millions)
42 M E T R O P O L I T A N T R A N S P O R T A T I O N A U T H O R I T Y
Note 10—Segment Information
MNCR LIRR MTA* NYCTA TBTA Eliminations Total
2001
Operating revenue $ 366 $ 384 $ 86 $ 2,326 $ 923 $ (33) $ 4,052
Depreciation and amortization 128 158 23 727 31 – 1,067
Subsidies and grants – – 103 318 – – 421
Tax revenue – – 680 950 – – 1,630
Interagency subsidy – – 202 133 (335) – –
Operating (deficit) surplus (360) (539) (241) (2,161) 635 – (2,666)
Net (deficit) surplus (320) (539) 1,244 801 (796) – 390
Capital expenditures 77 169 3,002 685 1,106 (1,799) 3,240
Total assets 2,904 4,395 13,638 19,519 3,927 (6,968) 37,415
Net working capital (14) (41) 1,124 (38) (128) (230) 673
Long-term debt – – 9,179 201 6,667 (45) 16,002
Current contributed capital – – – – – – –
Total equity 2,693 3,483 667 12,971 (3,312) – 16,502
2000
Operating revenue $ 360 $ 380 $ 71 $ 2,301 $ 950 $ (29) $ 4,033
Depreciation and amortization 129 152 18 655 28 – 982
Subsidies and grants – – 114 317 – (18) 413
Tax revenue – – 596 867 – (1) 1,462
Interagency subsidy – – 227 163 (390) – –
Operating (deficit) surplus (332) (503) (211) (1,874) 681 22 (2,217)
Net (deficit) surplus (300) (503) 670 (368) 169 – (332)
Capital expenditures 74 139 2,592 618 907 (1,553) 2,777
Total assets 2,780 4,248 12,571 18,525 3,807 (7,200) 34,731
Net working capital (30) (25) 714 228 571 (17) 1,441
Long-term debt – – 8,505 206 5,688 (46) 14,353
Current contributed capital 165 316 572 1,399 (777) – 1,675
Total equity 2,585 3,281 592 12,170 (2,516) – 16,112
*Includes the amounts for MTAHQ, MSBA, SIRTOA, FMTAC and ELF.

This page is intentionally left blank

Required Supplementary Information: Schedule of Pension Funding Progress(Unaudited)($ millions)
44 M E T R O P O L I T A N T R A N S P O R T A T I O N A U T H O R I T Y
Single-Employer Plans
LIRR SIRTOA
Valuation Date 1/1/01 1/1/00 1/1/99 1/1/01 1/1/00 1/1/99
a. Actuarial value of plan assets $ 813.8 $ 796.7 $ 779.2 $31.0 $26.8 $22.6
b. Actuarial accrued liability (AAL) 1,361.1 1,160.1 1,169.6 39.2 33.3 29.2
c. Total unfunded AAL (UAAL) [b-a] 547.3 363.4 390.4 8.2 6.5 6.6
d. Funded ratio [a/b] 59.8% 68.7% 66.6% 79.1% 80.5% 77.4%
e. Covered payroll $ 192.5 $ 285.0 $ 289.5 $13.7 $11.9 $12.0
f. UAAL as a percentage ofcovered payroll [c/e] 284.2% 127.5% 134.9% 59.9% 54.6% 55.0%
*The MTA Plan for the year 1/1/99 is presented as if the plan was a single-employer plan at the MTA level.

(Unaudited)($ millions)
45
Single-Employer Plans
MaBSTOA MTA Plan
1/1/01 1/1/00 1/1/99 1/1/01 1/1/00 1/1/99*
$ 611.5 $ 540.1 $ 467.6 $240.4 $216.0 $231.1
1,592.5 1,471.8 1,342.0 270.2 253.1 265.7
981.0 931.7 874.4 29.8 37.1 34.6
38.4% 36.7% 34.8% 89.0% 85.3% 87.0%
$ 400.5 $ 378.9 $ 362.0 $135.1 $121.5 $108.3
244.9% 245.9% 241.5% 22.1% 30.5% 32.0%

Combining Balance SheetsDecember 31, 2001($ millions)
46 M E T R O P O L I T A N T R A N S P O R T A T I O N A U T H O R I T Y
MTA NYCTA TBTA Eliminations Total
Assets
Cash $ 39 $ 31 $ 8 $ – $ 78
Investments 1,539 14 334 – 1,887
Receivables:
Station maintenance, operation, and
use assessments 89 – – – 89
State and regional mass transit taxes 5 – – – 5
Interest 19 – 5 – 24
Due from affiliated agencies 254 334 113 (701) –
Due from New York City 340 – – – 340
Other 325 362 26 (7) 706
Less allowance for doubtful accounts (4) (26) – – (30)
Total receivables 1,028 670 144 (708) 1,134
Materials and supplies 94 147 – – 241
Prepaid expenses and other current assets 22 106 5 – 133
Total current assets 2,722 968 491 (708) 3,473
Properties and equipment, net 6,888 17,406 1,892 – 26,186
Assets held under capital leases, net 338 122 – – 460
Noncurrent investments 3,588 18 613 – 4,219
Recoverable from NYS to service
long-term debt 1,393 – – – 1,393
Due from NYC – 18 – – 18
Due from affiliated agencies 4,517 840 903 (6,260) –
Deferred expenses related to
issuance of debt 85 146 28 – 259
Other noncurrent assets 1,406 1 – – 1,407
Total assets $20,937 $19,519 $3,927 $(6,968) $37,415
Continued
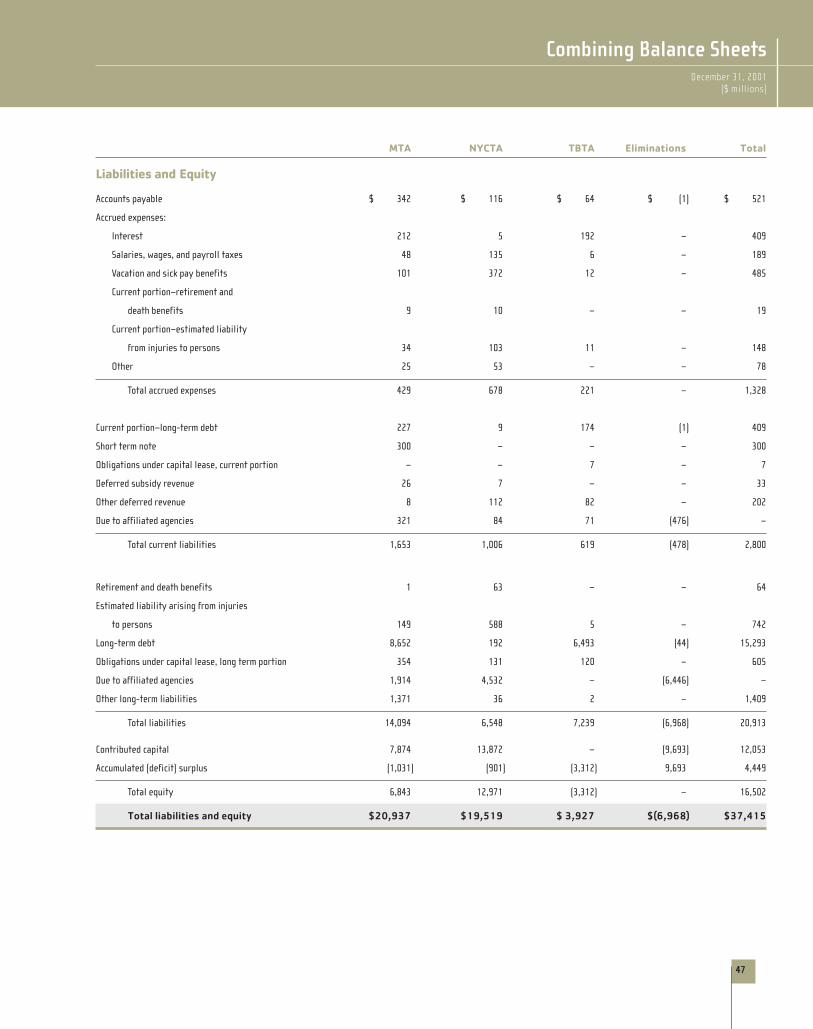
Combining Balance SheetsDecember 31, 2001
($ millions)
47
MTA NYCTA TBTA Eliminations Total
Liabilities and Equity
Accounts payable $ 342 $ 116 $ 64 $ (1) $ 521
Accrued expenses:
Interest 212 5 192 – 409
Salaries, wages, and payroll taxes 48 135 6 – 189
Vacation and sick pay benefits 101 372 12 – 485
Current portion–retirement and
death benefits 9 10 – – 19
Current portion–estimated liability
from injuries to persons 34 103 11 – 148
Other 25 53 – – 78
Total accrued expenses 429 678 221 – 1,328
Current portion–long-term debt 227 9 174 (1) 409
Short term note 300 – – – 300
Obligations under capital lease, current portion – – 7 – 7
Deferred subsidy revenue 26 7 – – 33
Other deferred revenue 8 112 82 – 202
Due to affiliated agencies 321 84 71 (476) –
Total current liabilities 1,653 1,006 619 (478) 2,800
Retirement and death benefits 1 63 – – 64
Estimated liability arising from injuries
to persons 149 588 5 – 742
Long-term debt 8,652 192 6,493 (44) 15,293
Obligations under capital lease, long term portion 354 131 120 – 605
Due to affiliated agencies 1,914 4,532 – (6,446) –
Other long-term liabilities 1,371 36 2 – 1,409
Total liabilities 14,094 6,548 7,239 (6,968) 20,913
Contributed capital 7,874 13,872 – (9,693) 12,053
Accumulated (deficit) surplus (1,031) (901) (3,312) 9,693 4,449
Total equity 6,843 12,971 (3,312) – 16,502
Total liabilities and equity $20,937 $19,519 $ 3,927 $(6,968) $37,415

MTA NYCTA TBTA Eliminations Total
Operating RevenuesPassenger and tolls $ 732 $ 2,255 $915 $ – $ 3,902
Rents, freight, and sundry 104 71 8 (33) 150
Total operating revenues 836 2,326 923 (33) 4,052
Operating Expenses
Salaries and wages 858 2,338 98 – 3,294
Retirement and other employee benefits 343 624 25 – 992
Materials and supplies 116 278 51 – 445
Fuel and power 91 183 5 – 279
Computer, engineering, and other consulting services 121 205 62 – 388
Public liability and claims 53 50 3 – 106
Depreciation and amortization 309 727 31 – 1,067
Other expenses 85 82 13 (33) 147
Total operating expenses 1,976 4,487 288 (33) 6,718
Operating (deficit) surplus (1,140) (2,161) 635 – (2,666)
Continued
Combining Statements of Operations and Changes in EquityFor the Year Ended December 31, 1999($ millions)
Combining Statements of Operations and Changes in EquityFor the Year Ended December 31, 2001($ millions)
48 M E T R O P O L I T A N T R A N S P O R T A T I O N A U T H O R I T Y

49
MTA NYCTA TBTA Eliminations Total
Nonoperating Revenues (Expenses)
Grants, appropriations, and taxes:
Tax supported subsidies–NYS 411 740 – – 1,151
Tax supported subsidies–NYC and Local 269 210 – – 479
Operating subsidies–NYS 58 159 – – 217
Operating subsidies–NYC and Local 45 159 – – 204
Total grants, appropriations, and taxes 783 1,268 – – 2,051
Interagency subsidy 202 133 (335) – –
Funds restricted for capital projects and debt service (23) – 23 – –
Operating subsidies recoverable from CDOT related to
MNCR’s New Haven Line 39 – – – 39
Suburban Highway Transportation Fund subsidy – – – – –
Subsidies to Dutchess, Orange, and Rockland counties (10) – – – (10)
Interest on long-term debt (213) (153) (143) – (509)
Station maintenance, operation, and use assessments 120 – – – 120
Impairment/loss of capital assets at World Trade Center – (173) – – (173)
Loss on disposal of subway cars – (58) – – (58)
Special expense reimbursement subsidies – 1 – – 1
Appropriations, grants and other receipts externally
restricted for capital projects 555 1,935 (980) – 1,510
Other nonoperating income 72 9 4 – 85
Net nonoperating revenues (expenses) 1,525 2,962 (1,431) – 3,056
Net surplus (deficit) 385 801 (796) – 390
Equity at beginning of year 6,458 12,170 (2,516) – 16,112
Equity at end of year $6,843 $12,971 $(3,312) $ – $16,502
Combining Statements of Operations and Changes in EquityFor the Year Ended December 31, 2001
($ millions)

MTA NYCTA TBTA Eliminations Total
Cash Flows from Operating Activities
Passenger receipts/tolls $ 732 $ 2,250 $ 924 $ – $ 3,906
Rents and other receipts 115 102 7 10 234
Payroll and related fringe benefits (1,200) (2,994) (126) – (4,320)
Other operating expenses (501) (619) (145) 55 (1,210)
Net cash (used in) provided by operating activities (854) (1,261) 660 65 (1,390)
Cash Flows from Noncapital FinancingActivities
Grants, appropriations, and taxes 858 1,286 – (52) 2,092
Operating subsidies from CDOT 39 – – – 39
Subsidies to Dutchess, Orange, and Rockland counties (7) – – – (7)
Subsidies received from affiliated agencies 210 134 (344) – –
Net cash provided by (used in) noncapital
financing activities 1,100 1,420 (344) (52) 2,124
Cash Flows from Capital and RelatedFinancing Activities
Dedicated tax fund bond proceeds 563 – – – 563
General purpose revenue bond anticipation notes – – 1,020 – 1,020
TBTA general purpose revenue bond proceeds – – 1,119 – 1,119
TBTA general purpose revenue bonds refunded – – (1,050) – (1,050)
TBTA general purpose variable rate revenue bond proceeds – – 296 – 296
TBTA general purpose variable rate revenue bonds refunded – – (295) – (295)
Proceeds from JP Morgan Chase loan 300 – – – 300
Grants and appropriations 2,010 – – – 2,010
CDOT capital contributions 2 – – – 2
Advance from WTC disaster – – 13 (13) –
Capital expenditures (3,248) (685) (1,106) 1,799 (3,240)
Debt service payments (666) (344) (451) 338 (1,123)
Subsidies designated for debt service payments – 344 – (338) 6
Reimbursement of capital project costs to/from MTA 1,361 438 – (1,799) –
Payment (to) from affiliated agencies for debt service (41) – 41 – –
Net cash (used in) provided by capital and related financing activities 281 (247) (413) (13) (392)
Continued
Combining Statements of Cash FlowsFor the Year Ended December 31, 1999($ millions)
Combining Statements of Cash FlowsFor the Year Ended December 31, 2001($ millions)
50 M E T R O P O L I T A N T R A N S P O R T A T I O N A U T H O R I T Y

MTA NYCTA TBTA Eliminations Total
Cash Flows from Investment Activities
Purchases of securities–long-term (3,410) (41) (1,116) – (4,567)
Sales or maturities of securities–long-term 4,310 51 1,082 – 5,443
Net short-term sales (purchases) of securities (1,492) – 99 – (1,393)
Net increase (decrease) in funds received from affiliated
agencies for centralized temporary investment (77) 68 9 – –
Earnings on investments 163 – 24 – 187
Net cash (used in) provided by
investment activities (506) 78 98 – (330)
Net increase in cash 21 (10) 1 – 12
Cash at the beginning of the year 18 41 7 – 66
Cash at end of the year $ 39 $ 31 $ 8 $ – $ 78
Reconciliation of operating deficit to net cash used in operating activities
Operating (deficit) surplus $ (1,140) $ (2,161) $ 635 $ – $ (2,666)
Adjustments to reconcile to net cash used
in operating activities:
Depreciation and amortization 309 727 31 – 1,067
Net decrease (increase) in payables, accrued expenses
and other liabilities 609 90 6 – 705
Net (increase) decrease in receivables (671) 22 3 – (646)
Net (decrease) increase in materials and supplies and
prepaid expenses 39 61 (15) 65 150
Net cash (used in) provided by
operating activities $ (854) $(1,261) $660 $65 $(1,390)
Combining Statements of Cash FlowsFor the Year Ended December 31, 2001
($ millions)
51

52 M E T R O P O L I T A N T R A N S P O R T A T I O N A U T H O R I T Y
Combining Balance SheetsDecember 31, 2000($ millions)
MTA NYCTA TBTA Eliminations Total
Assets
Cash $ 18 $ 41 $ 7 $ – $ 66
Investments 949 23 1,029 – 2,001
Receivables:
Station maintenance, operation, and
use assessments 85 – – – 85
State and regional mass transit taxes 4 – – – 4
Interest 41 – 5 (1) 45
Due from affiliated agencies 204 407 119 (730) –
Other 717 380 29 (5) 1,121
Less allowance for doubtful accounts (5) (25) – – (30)
Total receivables 1,046 762 153 (736) 1,225
Materials and supplies 86 127 – – 213
Prepaid expenses and other current assets 11 211 2 – 224
Total current assets 2,110 1,164 1,191 (736) 3,729
Properties and equipment, net 6,483 16,186 1,707 – 24,376
Assets held under capital leases, net 334 125 – – 459
Noncurrent investments 3,218 18 – – 3,236
Recoverable from NYS to service
long-term debt 1,536 – – – 1,536
Due from NYC 340 45 – – 385
Due from affiliated agencies 4,710 860 894 (6,464) –
Deferred expenses related to
issuance of debt 90 126 15 – 231
Other noncurrent assets 778 1 – – 779
Total assets $19,599 $18,525 $3,807 $(7,200) $34,731
Continued

53
Combining Balance SheetsDecember 31, 2000
($ millions)
MTA NYCTA TBTA Eliminations Total
Liabilities and Equity
Accounts payable $ 243 $ 127 $ 66 $ 2 $ 438
Accrued expenses:
Interest 199 8 234 – 441
Salaries, wages, and payroll taxes 59 123 7 – 189
Vacation and sick pay benefits 94 328 11 – 433
Current portion–retirement and
death benefits 8 4 – – 12
Current portion–estimated liability
from injuries to persons 32 108 6 – 146
Other 12 36 – – 48
Total accrued expenses 404 607 258 – 1,269
Current portion–long-term debt 200 9 150 (1) 358
Obligations under capital lease, current portion – – 6 – 6
Deferred subsidy revenue 23 6 – – 29
Other deferred revenue 9 108 71 – 188
Due to affiliated agencies 572 79 69 (720) –
Total current liabilities 1,451 936 620 (719) 2,288
Retirement and death benefits 1 64 – – 65
Estimated liability arising from injuries
to persons 139 587 14 – 740
Long-term debt 8,305 197 5,538 (45) 13,995
Obligations under capital leases 335 128 120 – 583
Due to affiliated agencies 2,028 4,408 – (6,436) –
Other long-term liabilities 882 35 31 – 948
Total liabilities 13,141 6,355 6,323 (7,200) 18,619
Contributed capital 7,869 12,898 – (8,714) 12,053
Accumulated surplus (deficit) (1,411) (728) (2,516) 8,714 4,059
Total equity 6,458 12,170 (2,516) – 16,112
Total liabilities and equity $19,599 $18,525 $ 3,807 $(7,200) $34,731

Combining Statements of Operations and Changes in EquityFor the Year Ended December 31, 2000($ millions)
54 M E T R O P O L I T A N T R A N S P O R T A T I O N A U T H O R I T Y
MTA NYCTA TBTA Eliminations Total
Operating Revenues
Passenger and tolls $ 721 $ 2,222 $940 $ – $ 3,883
Rents, freight, and sundry 90 79 10 (29) 150
Total operating revenues 811 2,301 950 (29) 4,033
Operating Expenses
Salaries and wages 801 2,204 86 – 3,091
Retirement and other employee benefits 312 577 26 – 915
Materials and supplies 113 242 48 – 403
Fuel and power 93 183 5 – 281
Computer, engineering, and other
consulting services 115 166 59 – 340
Public liability and claims 55 82 3 – 140
Depreciation and amortization 299 655 28 – 982
Other expenses 69 66 14 (51) 98
Total operating expenses 1,857 4,175 269 (51) 6,250
Operating (deficit) surplus (1,046) (1,874) 681 22 (2,217)
Continued

Combining Statements of Operations and Changes in EquityFor the Year Ended December 31, 2000
($ millions)
55
MTA NYCTA TBTA Eliminations Total
Nonoperating Revenues (Expenses)
Grants, appropriations, and taxes:
Tax supported subsidies–NYS 417 692 – (1) 1,108
Tax supported subsidies–NYC and Local 179 175 – – 354
Operating subsidies–NYS 58 159 – (1) 216
Operating subsidies–NYC and Local 56 158 – (17) 197
Total grants, appropriations, and taxes 710 1,184 – (19) 1,875
Interagency subsidy 227 163 (390) – –
Funds restricted for capital projects
and debt service (33) – 33 – –
Operating subsidies recoverable from CDOT
related to MNCR’s New Haven Line 32 – – – 32
Suburban Highway Transportation Fund subsidy (7) – – – (7)
Subsidies to Dutchess, Orange, and
Rockland counties (5) – – – (5)
Gain from sale of Coliseum – – 340 – 340
Transfer of proceeds of Coliseum
sale to City of New York – – (340) – (340)
Interest on long-term debt (178) (97) (159) – (434)
Elimination of NYCERS long-term pension liability – 237 – – 237
Station maintenance, operation, and
use assessments 110 – – – 110
Special expense reimbursement subsidies – 4 – – 4
Other nonoperating income 57 15 4 (3) 73
Net nonoperating revenues (expenses) 913 1,506 (512) (22) 1,885
Net (deficit) surplus (133) (368) 169 – (332)
Cumulative effect of change in accounting principle 84 179 – – 263
Appropriations, grants and other receipts externally
restricted for capital projects 1,053 1,399 (777) – 1,675
Equity at beginning of year 5,454 10,960 (1,908) – 14,506
Total equity at end of year $6,458 $12,170 $(2,516) $ – $16,112

MTA NYCTA TBTA Eliminations Total
Cash Flows From Operating ActivitiesPassenger receipts/tolls $ 722 $ 2,207 $ 934 $ – $ 3,863
Rents and other receipts 93 94 10 (33) 164
Payroll and related fringe benefits (1,104) (2,856) (114) – (4,074)
Other operating expenses (512) (665) (143) 55 (1,265)
Net cash (used in) provided by operating
activities (801) (1,220) 687 22 (1,312)
Cash Flows From Noncapital Financing ActivitiesGrants, appropriations and taxes 763 1,225 – (22) 1,966
Operating subsidies from CDOT 34 – – – 34
Suburban Transportation Fund subsidy (6) – – – (6)
Subsidies to Dutchess, Orange and Rockland counties (8) – – – (8)
Subsidies received from affiliated agencies 217 167 (384) – –
Other 70 23 – – 93
Net cash provided (used in) noncapital
financing activities 1,070 1,415 (384) (22) 2,079
Cash Flows From Capital and RelatedFinancing ActivitiesDedicated tax fund bonds proceeds 342 – – – 342
Certificates of Participation S2000A 120 – 12 (12) 120
Commuter facilities revenue bonds proceeds 17 – – – 17
TBTA Bond Anticipation Notes S2000A – – 853 – 853
TBTA mortgage recording tax bonds proceeds – – 525 – 525
TBTA mortgage recording tax bonds refunded – – (545) – (545)
Grants and appropriations 1,546 – – – 1,546
Proceeds from sale of Coliseum – – 361 – 361
Transfer of proceeds of Coliseum sale to City of New York – – (344) – (344)
CDOT capital contributions 1 – – – 1
Capital expenditures (2,805) (618) (907) 1,553 (2,777)
Debt service payments (574) (327) (417) 315 (1,003)
Subsidies designated for debt service payments – 327 – (315) 12
Reimbursement of capital project costs to/from MTA 1,136 405 – (1,541) –
Payment (to) from affiliated agencies for debt service (42) – 42 – –
Net cash used in capital
and related financing activities (259) (213) (420) – (892)
Continued
Combining Statements of Cash FlowsFor the Year Ended December 31, 2000($ millions)
Combining Statements of Cash FlowsFor the Year Ended December 31, 2000($ millions)
56 M E T R O P O L I T A N T R A N S P O R T A T I O N A U T H O R I T Y

For the Years Ended December 31, 2001 and 2000($ millions)
57
MTA NYCTA TBTA Eliminations Total
Cash Flows from Investment ActivitiesPurchases of securities–long-term (3,005) (44) (547) – (3,596)
Sales or maturities of securities–long-term 2,660 48 757 – 3,465
Net short-term sales (purchases) of securities 199 – (108) – 91
Net (decrease) increase in funds received
from affiliated agencies for centralized
temporary investment – 22 (22) – –
Earnings on investments 137 – 37 – 174
Net cash (used in) provided by
investment activities (9) 26 117 – 134
Net increase in cash 1 8 – – 9
Cash at beginning of year 17 33 7 – 57
Cash at end of the year $ 18 $ 41 $ 7 – $ 66
Reconciliation of operating deficit to net cash used in operating activitiesOperating (deficit) surplus $ (1,046) $ (1,874) $ 681 $ 22 $ (2,217)
Adjustments to reconcile to net cash used
in operating activities:
Depreciation and amortization 299 655 28 – 982
Elimination of NYCERS long-term pension liability – 237 – – 237
Net decrease (increase) in payables, accrued
expenses, and other liabilities 17 (176) (20) – (179)
Net increase in receivables (8) (3) (3) – (14)
Net (increase) decrease in materials and
supplies and prepaid expenses (63) (59) 1 – (121)
Net cash (used in) provided by
operating activities $ (801) $(1,220) $ 687 $22 $(1,312)
Combining Statements of Cash Flows(continued)
For the Year Ended December 31, 2000($ millions)
Combining Statements of Cash FlowsFor the Year Ended December 31, 2000
($ millions)

This page is intentionally left blank

Statistical Section


10-Year Statistical Tables
59
1,132
1,168
1,224
1,237
1,255
1,278
1,350
1,436
1,542
1,568
544
542
549
544
517
564
644
696
1992
1993
1994
1995
1996
1997
1998
1999
2000
2001
MTA Revenue Passengers(Millions)
Rail Cars Buses
*
0 200 400 600 800 1,000 1,200 1,400 1,600
770
729
1,451
1,373
1,291
1,471
1,419
1,512
1,448
1,674
1,688
1,939
1992
1993
1994
1995
1996
1997
1998
1999
2000
2001
MTA Passenger Miles(Millions)
Rail Cars Buses
*
* Revised from 2000 Annual Report
0 2,000 4,000 6,000 8,000 10,000 12,000 14,000
10,005
8,956
9,997
10,172
10,772
10,951
11,573
11,923
12,757
12,171

10-Year Statistical Tables
60 M E T R O P O L I T A N T R A N S P O R T A T I O N A U T H O R I T Y
399,380
390,978
405,295
411,889
410,884
407,675
411,128
419,288
431,040
434,570
98,975
97,731
99,225
97,696
100,823
97,748
101,586
106,091
110,665
113,122
1992
1993
1994
1995
1996
1997
1998
1999
2000
2001
MTA Revenue Vehicle Miles(Millions)
Rail Cars Buses
0 100 200 300 400 500
277
266
260
266
260
267
279
289
296
293
1992
1993
1994
1995
1996
1997
1998
1999
2000
2001
MTA Bridges and Tunnels Revenue Vehicles(Millions)
0 50 100 150 200 250 300 350

10-Year Statistical Tables
61
7,887
7,806
7,802
7,819
7,800
7,800
7,820
7,843
7,849
8,231
1992
1993
1994
1995
1996
1997
1998
1999
2000
2001
MTA Bus and Rail Cars(Millions)
0 1,000 2,000 3,000 4,000 5,000 6,000 7,000 8,000 9,000 10,000
3,964
3,980
4,029
3,899
3,874
4,184
4,477
4,756
4,871
4,864
47.6%
46.5%
44.8%
47.6%
57.8%
54.0%
50.3%
46.4%
47.6%
45.1%
1992
1993
1994
1995
1996
1997
1998
1999
2000
2001
MTA Farebox Recovery Ratios
0 10 20 30 40 50 60 70
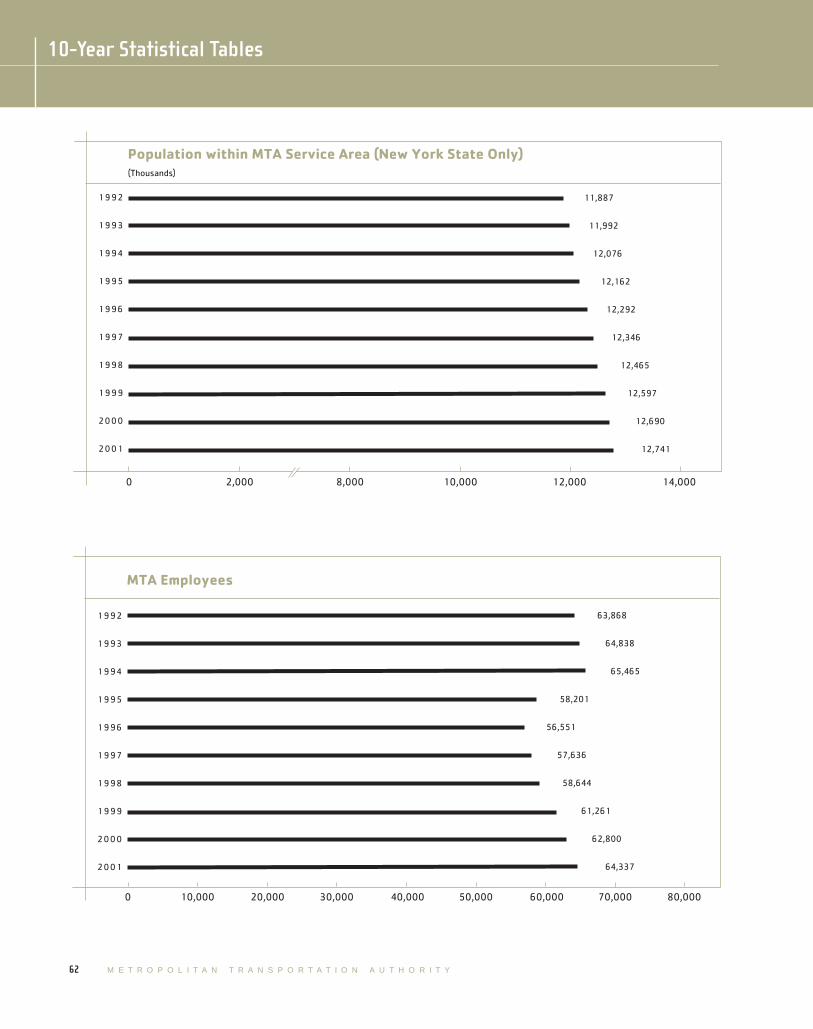
10-Year Statistical Tables
62 M E T R O P O L I T A N T R A N S P O R T A T I O N A U T H O R I T Y
63,868
64,838
65,465
58,201
56,551
57,636
58,644
61,261
62,800
64,337
1992
1993
1994
1995
1996
1997
1998
1999
2000
2001
MTA Employees
0 10,000 20,000 30,000 40,000 50,000 60,000 70,000 80,000
11,887
11,992
12,076
12,162
12,292
12,346
12,465
12,597
12,690
12,741
1992
1993
1994
1995
1996
1997
1998
1999
2000
2001
Population within MTA Service Area (New York State Only)(Thousands)
0 2,000 8,000 10,000 12,000 14,000

This page is intentionally left blank

2001 Operating Statistics
64 M E T R O P O L I T A N T R A N S P O R T A T I O N A U T H O R I T Y
MTA MTA MTA MTANew York City New York City Staten Island Long Island
Subway Bus1 Railway Rail Road2
Paid rides (annual)
2001 1,405,304,701 739,482,866 3,963,636 85,602,984
20006 1,381,078,913 698,898,863 4,112,820 84,730,852
Gain (Loss) 24,225,788 40,584,003 (149,184) 872,132
Percentage change 1.8% 5.8% -3.6% 1.0%
Paid rides (average weekday)
2001 4,579,240 2,382,718 14,401 306,236
2000 4,522,215 2,267,078 14,997 304,227
Gain (Loss) 57,025 115,640 (596) 2,009
Percentage change 1.3% 5.1% -4.0% 0.7%
Annual revenue vehicle miles
2001 325,923,674 101,025,661 2,148,000 57,687,000
2000 323,176,760 98,907,397 2,029,647 56,998,000
Gain (Loss) 2,746,914 2,118,264 118,353 689,000
Percentage change 0.9% 2.1% 5.8% 1.2%
Average number weekdaytrain/bus trips 8,43310 48,814 131 730
Stations 468 — 22 124
Train lines/bus routes 27 245 1 11
Route miles
Rail route miles11 233 — 14 319
Bus route miles — 1,671 — —
Track miles12 656 — 29 594
Rolling stock
Rail cars 6,183 — 64 1,092Buses — 4,465 — —
Bridges — — — —
Tunnels — — — —
Employees 27,322 14,277 303 6,424
1. Includes Manhattan and Bronx Surface Transit Operating Authority, an MTANew York City Transit subsidiary.
2. Ridership figures restated from 2000 Annual Report.3. Ridership and employee statistics reflect paratransit operations.4. Includes operations on the Harlem, Hudson and New Haven lines in New
York State and Connecticut as well as the New York State portions of thePort Jervis and Pascack Valley lines.
5. Ridership figures restated from 2000 Annual Report.6. Vehicle crossing figures restated from 2000 Annual Report.7. Total MTA New York City Subway plus MTA New York City Bus.8. MTA Long Island Rail Road plus MTA Metro-North Railroad.9. Ridership figures exclude MTA Bridges and Tunnels vehicle crossings.
Notes:

2001 Operating Statistics
65
MTA MTA MTA MTA Combined MTALong Island Metro-North Bridges and New York City MTA Railroads Network
Bus3 Railroad4,5 Tunnels6 Transit Total7 Total8 Total9
30,731,605 73,058,408 293,219,838 2,144,787,567 158,661,392 2,338,144,200
30,056,646 71,842,688 296,632,531 2,079,977,776 156,573,540 2,270,720,782
674,959 1,215,720 (3,412,693) 64,809,791 2,087,852 67,423,418
2.2% 1.7% -1.2% 3.1% 1.3% 3.0%
103,492 252,541 825,729 6,961,958 558,777 7,638,628
101,762 249,173 837,637 6,789,293 553,400 7,459,452
1,730 3,368 (11,908) 172,665 5,377 179,176
1.7% 1.4% -1.4% 2.5% 1.0% 2.4%
12,096,756 49,423,788 — 426,949,335 107,110,788 548,304,879
11,757,650 48,835,593 — 422,084,157 105,833,593 541,705,047
339,106 588,195 — 4,865,178 1,277,195 6,599,832
2.9% 1.2% — 1.2% 1.2% 1.2%
3,022 621 — 57,247 1,351 61,751
— 119 — 468 243 733
53 6 — 272 17 343
— 384 — 233 703 950975 — — 1,671 — 2,646
— 775 — 656 1,369 2,054
— 892 — 6,183 1,984 8,231399 — — 4,465 — 4,864
— — 7 — — 7
— — 2 — — 2
1,104 5,811 1,493 48,16413 12,235 64,37714
10. The average number of weekday subway trips provided by New York City Transitrose from 7,533 in 2000. Most of the increase in 2001 reflects service changesmade due to construction on the Manhattan Bridge.
11. Nondirectional route miles; i.e., the distance from terminal to terminal. Several rail or bus lines may share the same route.
12. Does not include track in yards.
13. Includes 1,578 employees at CPM, 1,378 employees atTelecommunications and Information Services, 1,336 at MetroCardOperations, 1,787 employees at Executive Vice President, and 486employees at other General and Administrative.
14. Includes 835 employees at MTA Headquarters and 243 employees at MTA Consolidated Services.

66 M E T R O P O L I T A N T R A N S P O R T A T I O N A U T H O R I T Y
Peter S. KalikowChairman
David S. MackVice Chairman
Katherine N. LappExecutive Director andChief Operating Officer
Members of the BoardRonnie P. Ackman†
Nancy Shevell Blakeman
Anthony J. Bottalico†
Kenneth A. Caruso
Thomas J. Cassano†
Beverly L. Dolinsky†
Edward B. Dunn
Barry L. Feinstein
Alan B. Friedberg
Lawrence W. Gamache
James H. Harding Jr.
Robert M. Harding
James L. McGovern†
Joseph Rutigliano†
Ernest J. Salerno
Andrew M. Saul
James L. Sedore Jr.
James S. Simpson
Edward A. Vrooman
Rudy Washington
Alfred E. Werner
The Metropolitan Transportation Authority is a public-benefit corporation chartered by the State of New York, George E. Pataki, Governor.
MTA Agencies
MTA New York City TransitLawrence G. Reuter President370 Jay StreetBrooklyn, NY 11201-5190(718) 330-3000
MTA Metro-North RailroadPeter A. CannitoPresident347 Madison AvenueNew York, NY 10017-3739(212) 340-3000
MTA Long Island Rail RoadKenneth J. BauerPresidentJamaica StationJamaica, NY 11435-4380(718) 558-7400
MTA Bridges and TunnelsMichael C. AscherPresidentRandall’s IslandNew York, NY 10035-0035(646) 252-7000
MTA Long Island BusNeil S. YellinPresident700 Commercial AvenueGarden City, NY 11530-6410(516) 542-0100
347 Madison AvenueNew York, NY 10017-3739(212) 878 -7000
www.mta.info
For additional copies of the 2001 MTA annual report, write to MTA Marketing and Corporate Communications, 347 Madison Avenue, New York, NY 10017-3739;for information about the 2001 financial statements, write to MTA Office of the Comptroller, 345 Madison Avenue, New York, NY 10017-3937.
The 2001 MTA annual report and financial statements are also available on our Web site at www.mta.info.
†Nonvoting member