archaeology and art in context: excavations at the gunu
TRANSCRIPT

University of Wollongong University of Wollongong
Research Online Research Online
Faculty of Science, Medicine and Health - Papers: Part B Faculty of Science, Medicine and Health
1-1-2020
Archaeology and art in context: Excavations at the Gunu site complex, Archaeology and art in context: Excavations at the Gunu site complex,
northwest Kimberley, Western Australia northwest Kimberley, Western Australia
Mark Moore
Kira Westaway
June Ross
Kim Newman
Yinika Perston
See next page for additional authors
Follow this and additional works at: https://ro.uow.edu.au/smhpapers1
Publication Details Citation Publication Details Citation Moore, M., Westaway, K., Ross, J., Newman, K., Perston, Y., Huntley, J., Keats, S., Morwood, M. J., Cathy, G., Greg, J., Goonack, M., Karadada, J., Hayward, J., DiEngland, D., Scown, M., Maher, R., Patterson, A., & Souter, C. (2020). Archaeology and art in context: Excavations at the Gunu site complex, northwest Kimberley, Western Australia. Faculty of Science, Medicine and Health - Papers: Part B. Retrieved from https://ro.uow.edu.au/smhpapers1/1191
Research Online is the open access institutional repository for the University of Wollongong. For further information contact the UOW Library: [email protected]

Archaeology and art in context: Excavations at the Gunu site complex, northwest Archaeology and art in context: Excavations at the Gunu site complex, northwest Kimberley, Western Australia Kimberley, Western Australia
Abstract Abstract Copyright: 2020 Moore et al. This is an open access article distributed under the terms of the Creative Commons Attribution License, which permits unrestricted use, distribution, and reproduction in any medium, provided the original author and source are credited. The Kimberley region of Western Australia is one of the largest and most diverse rock art provenances in the world, with a complex stylistic sequence spanning at least 16 ka, culminating in the modern art-making of the Wunumbal people. The Gunu Site Complex, in the remote Mitchell River region of the northwest Kimberley, is one of many local expressions of the Kimberley rock art sequence. Here we report excavations at two sites in this complex: Gunu Rock, a sand sheet adjacent to rock art panels; and Gunu Cave, a floor deposit within an extensive rockshelter. Excavations at Gunu Rock provide evidence for two phases of occupation, the first from 7-8 to 2.7 ka, and the second from 1064 cal BP. Excavations at Gunu Rock provide evidence for occupation from the end of the second phase to the recent past. Stone for tools in the early phase were procured from a variety of sources, but quartz crystal reduction dominated the second occupation phase. Small quartz crystals were reduced by freehand percussion to provide small flake tools and blanks for manufacturing small points called nguni by the Wunambal people today. Quartz crystals were prominent in historic ritual practices associated with the Wanjina belief system. Complex methods of making bifacially-thinned and pressure flaked quartzite projectile points emerged after 2.7 ka. Ochre pigments were common in both occupation phases, but evidence for occupation contemporaneous with the putative age of the oldest rock art styles was not discovered in the excavations. Our results show that developing a complete understanding of rock art production and local occupation patterns requires paired excavations inside and outside of the rockshelters that dominate the Kimberley.
Publication Details Publication Details Moore, M., Westaway, K., Ross, J., Newman, K., Perston, Y., Huntley, J., Keats, S., Morwood, M., Cathy, G., Greg, J., Goonack, M., Karadada, J., Hayward, J., DiEngland, D., Scown, M., Maher, R., Patterson, A. & Souter, C. (2020). Archaeology and art in context: Excavations at the Gunu site complex, northwest Kimberley, Western Australia. PLoS ONE, 15 (2), e0226628-1-e0226628-42.
Authors Authors Mark Moore, Kira Westaway, June Ross, Kim Newman, Yinika Perston, Jillian Huntley, Samantha Keats, Michael J. Morwood, Gavin Cathy, John Greg, Myron Goonack, Joseph Karadada, John Hayward, Deb DiEngland, Murray Scown, Robin Maher, Alistair Patterson, and Corili Souter
This journal article is available at Research Online: https://ro.uow.edu.au/smhpapers1/1191

RESEARCHARTICLE
Archaeology and art in context: Excavations at
the Gunu Site Complex, Northwest Kimberley,
Western Australia
MarkW. MooreID1,2*, KiraWestaway3, June Ross1, KimNewman1,4, Yinika Perston1,2,4,Jillian HuntleyID5, Samantha Keats1, Kandiwal Aboriginal Corporation¶, MichaelJ. Morwood6†
1 Archaeology and Palaeoanthropology, University of NewEngland, Armidale, New SouthWales, Australia,2 Stone Tools and CognitionResearchHub, University of New England, Armidale, NewSouthWales,Australia, 3 Department of Earth and Environmental Sciences, Macquarie University, Sydney, New SouthWales, Australia, 4 Australian ResearchCentre for Human Evolution, Griffith University, Brisbane,Queensland, Australia, 5 Place Evolution and Rock Art HeritageUnit, Griffith Centre for Social and CulturalResearch, Griffith University, Brisbane, Queensland, Australia, 6 Centre for Archaeological Science,University of Wollongong, Wollongong, New SouthWales, Australia
† Deceased.¶ Kandiwal Aboriginal Corporation contributors are listed in the Acknowledgments.* [email protected]
Abstract
The Kimberley region of Western Australia is one of the largest andmost diverse rock artprovenances in the world, with a complex stylistic sequence spanning at least 16 ka, culmi-nating in the modern art-making of the Wunumbal people. The Gunu Site Complex, in theremote Mitchell River region of the northwest Kimberley, is one of many local expressions ofthe Kimberley rock art sequence. Here we report excavations at two sites in this complex:Gunu Rock, a sand sheet adjacent to rock art panels; and Gunu Cave, a floor deposit withinan extensive rockshelter. Excavations at Gunu Rock provide evidence for two phases ofoccupation, the first from 7–8 to 2.7 ka, and the second from 1064 cal BP. Excavations atGunu Rock provide evidence for occupation from the end of the second phase to the recentpast. Stone for tools in the early phase were procured from a variety of sources, but quartzcrystal reduction dominated the second occupation phase. Small quartz crystals werereduced by freehand percussion to provide small flake tools and blanks for manufacturingsmall points called nguni by theWunambal people today. Quartz crystals were prominent inhistoric ritual practices associated with theWanjina belief system. Complex methods ofmaking bifacially-thinned and pressure flaked quartzite projectile points emerged after 2.7ka. Ochre pigments were common in both occupation phases, but evidence for occupationcontemporaneous with the putative age of the oldest rock art styles was not discovered inthe excavations. Our results show that developing a complete understanding of rock art pro-duction and local occupation patterns requires paired excavations inside and outside of therockshelters that dominate the Kimberley.
PLOSONE | https://doi.org/10.1371/journal.pone.0226628 February 5, 2020 1 / 42
a1111111111a1111111111a1111111111a1111111111a1111111111
OPEN ACCESS
Citation: Moore MW, Westaway K, Ross J,
Newman K, Perston Y, Huntley J, et al. (2020)
Archaeology and art in context: Excavations at the
Gunu Site Complex, Northwest Kimberley, Western
Australia. PLoS ONE 15(2): e0226628. https://doi.
org/10.1371/journal.pone.0226628
Editor: Michael D. Petraglia, Max Planck Institute
for the Science of Human History, GERMANY
Received: August 20, 2019
Accepted: December 2, 2019
Published: February 5, 2020
Copyright:© 2020 Moore et al. This is an open
access article distributed under the terms of the
Creative Commons Attribution License, which
permits unrestricted use, distribution, and
reproduction in any medium, provided the original
author and source are credited.
Data Availability Statement: All relevant data are
within the manuscript and its Supporting
Information files.
Funding: This work was supported by an
Australian Research Council (ARC) Linkage Grant
(LP0991845). The Linkage Partners were Kandiwal
Aboriginal Corporation, Kimberley Foundation
Australia (KFA), Slingair and Heliworks Pty Ltd, and
the Western Australian Department of Environment
and Conservation. The Linkage Partners had no
role in study design, data analysis, decision to

IntroductionThe Kimberley region of Western Australia, with its world-class corpus of rock art lying at theinterface between Asia and Australia, has long been recognised as offering enormous potentialfor tackling fundamental issues in Australian archaeology [1]. Recent research has shown thatNorthern Australia has the earliest evidence of human occupation, from 65 ka (thousandyears) [2], and may have been on the colonisation route from Indonesia [3, 4], with majorimplications for understanding human evolution [5]. Early dates from Kimberley sites suggestthat the region was extensively occupied by ca. 45 ka cal BP [6–8], and some have suggestedthat similarity in the earliest rock art motifs may indicate cultural ties across Australasia [9,10]. The Kimberley may have been a refugia during the Last Glacial Maximum [11] (however,see [12]), and the multi-phase Northwest Kimberley rock art sequence is believed to be one ofthe longest and most complex anywhere in the world [13]. Rock art documents dynamic socialand cultural development through the Holocene [14, 15], culminating in the Wanjina beliefsystem, still practiced today [16, 17].
Major intra-regional differences in geology and topography have significant implicationsfor Kimberley research. In the South Kimberley, Devonian limestones of the Napier and OscarRanges have caves and shelters containing deposits with early evidence of human occupation[7, 8, 18]. Deposits at these sites also preserve uncommon organic remains that provide abun-dant evidence for economic change spanning the entire 45 ka sequence of human occupation[19], but the limestone surfaces of the South Kimberley are relatively unstable and usually notconducive to long-term preservation of rock paintings. With a few exceptions, only the morerecent rock painting styles are represented. In contrast, the North Kimberley is dominated byextremely hard and stable sandstone bedrock outcrops that provided ideal contexts for long-term preservation of rock paintings. The stability of Northwest Kimberley rock surfaces alsomeans that there is less opportunity for the accumulation of deep deposits and stratified cul-tural remains within rockshelters through bedrock weathering. Much of the Northwest Kim-berley is also extremely rugged with few roads or tracks, seriously limiting access and posingsignificant logistic difficulties to archaeological research. Kimberley excavation programs havetargeted the more accessible South Kimberley (e.g., [20]), or localities in the North or EastKimberley with coastal or road access (e.g., [21–26]).
The Change and Continuity project [1] was designed to help rectify this gap in archaeolog-ical coverage through detailed rock art recording and analysis, a comprehensive reconstructionof stone tool manufacturing technology, and test excavations in rockshelters and adjoiningsand sheets at key sites in remote locations. The research focused on site complexes identifiedduring helicopter reconnaissance by MJM and JR with Wunambal and Gaambera traditionalowners, and in consultation with National Park rangers and avocational rock art researchers.The Mitchell and Lawley rivers were specifically targeted because those catchments containmany of the type sites for specific styles and superimpositions used by Crawford [27, 28],Walsh [29], and Welch [30] to construct the relative rock art sequence for the Kimberleyregion (cf. [31]). Here we report the results of test excavations undertaken at the Gunu SiteComplex—Gunu Cave and Gunu Rock—in the lower Mitchell River catchment (Fig 1).
Gunu Site ComplexThe Gunu Site Complex is an extensive series of Aboriginal art galleries, artefact scatters, andburial cairns located 3.3 km northeast of Lower Mitchell Falls (Fig 2, S1 Fig). The complex wasselected for focused research because of the potential depth of the archaeological deposits, theabundance of surface artefacts, and the presence of all of the acknowledged Kimberley rock artstyles, thus flagging Aboriginal use of the complex over an extended period of time. The
Archaeology and art in context
PLOSONE | https://doi.org/10.1371/journal.pone.0226628 February 5, 2020 2 / 42
publish, or preparation of the manuscript.
Laboratory analyses of pigments were aided by a
Stage 1 grant from the KFA.
Competing interests: The authors have the
following interests: The Kandiwal Aboriginal
Corporation, an incorporated body encompassing
members of the Kandiwal community (about 45
people) provided support during field work and
knowledge about sites in their country, under a
research agreement with the ARC (as a Linkage
Partner). Slingair and Heliwork Pty Ltd provided a
discount on air travel across the northwest
Kimberley under a research agreement with the
ARC (as a Linkage Partner). There are no patents,
products in development or marketed products to
declare. This does not alter our adherence to all the
PLoS One policies on sharing data and materials,
as detailed online in the guide for authors.

Wunambal and Gaambera are the traditional owners of the region, and the Kandiwal Commu-nity identifies the Lower Mitchell River as their core cultural area. The sites are located on thenorthern and eastern sides of a bench of block-weathered quartzarenite sandstone that rises up
Fig 1. Map of the North Kimberley showing locations mentioned in the text. 1) Gunu Site Complex, 2) Malauwarra Site Complex, 3) Bush Spirit Creek Site Complex,4) Brremangurey Site Complex; 5) Wundalal shelter, 6) Bangorono shelter, 7) Ngurini shelter [26]; 8) Drysdale 3 shelter [24]; 9) Borologo 1 shelter [22]. Australiantopography base map courtesy of Geoscience AustraliaMapConnect 2019 under CC BY 4.0 license.
https://doi.org/10.1371/journal.pone.0226628.g001
Archaeology and art in context
PLOSONE | https://doi.org/10.1371/journal.pone.0226628 February 5, 2020 3 / 42

to 10 m above the adjoining sand sheet. Gunu Rock, at the centre of the complex, consists ofan art panel with painted images variously interpreted as deer by Wilson ([32]:4–7, 109–113),figures engaged in dance by Welch [33], or gunu, or yams by the Kandiwal people (Fig 3). Thisart panel, and the site complex surrounding it, has been referred to as ‘Reindeer Rock’ [32–34],‘Deer Rock’ [33], and ‘Deer Cave’ [31]. Here we refer to the Gunu Site Complex to includeGunu Cave and Gunu Rock.
Gunu Cave is a large rockshelter located 15 m south of Gunu Rock (Fig 4). The rockshelterpenetrates through the sandstone bench, opening onto a large amphitheatre to the west ringedby a sandstone escarpment (Figure B in S1 Fig). During the wet season, water flowing into theamphitheatre exits a crack at the base of the bedrock wall immediately south of Gunu Cave.Three burial cairns (called wundulmul-wundulmul or wala wana [21]: 14) are in close proxim-ity to Gunu Cave, and an extensive lithic scatter occurs across the area. Inside Gunu Cave andin smaller unnamed rockshelters nearby are numerous art galleries with images spanning thecomplete Kimberley rock art sequence. Indurated patches and seams of quartzite in the shelv-ing sandstone, and on horizontal bedrock surfaces, were quarried for stone tools [36]. TheWunambal’s continuing attachment to the site complex is attested by historic artefacts in asmall rockshelter ca. 175 m northwest of Gunu Cave, including a red glass bead and flakedartefacts of brown, cobalt, and selenium glass (Figure D in S1 Fig). Selenium began replacing
Fig 2. Overview of the Gunu Site Complex. The photograph faces southwest, towards the Lower Mitchell River, and the eastern entrance of Gunu Cave isindicated by an arrow. Photo courtesy of Michael Donaldson.
https://doi.org/10.1371/journal.pone.0226628.g002
Archaeology and art in context
PLOSONE | https://doi.org/10.1371/journal.pone.0226628 February 5, 2020 4 / 42

manganese as a glass clearing agent from 1916 ([37]: 159) and dominated glass productionfrom ca. 1920–1940 ([38]: 53–54).
MethodsThe North Kimberley region is one of the most rugged and inaccessible parts of Australia, andour project area is ca. 400 km northwest of the nearest regional centre, in the East Kimberleyat Kununurra. The bedrock is composed of silicified lower Proterozoic King Leopold Sand-stone, a massive, strongly bedded quartzarenite craton that dominates the project’s study
Fig 3. Images on the Gunu Rock panel. a) Series of figures described as yams, or gunu, by theWunumbal. b) Boats and other images in a variety of Kimberleyart styles ([31]: 252–255) (see Fig 4 in [35]). The style of the figures in the boats may place them into theWararrajai Gwion Period ([35]: 74). The Gunu Rockexcavation was directly below the middle boat image. Photos are enhanced in DStretch_yxx.
https://doi.org/10.1371/journal.pone.0226628.g003
Archaeology and art in context
PLOSONE | https://doi.org/10.1371/journal.pone.0226628 February 5, 2020 5 / 42

areas. The sandstone successions vary in hardness and more rapid weathering of lower stratahas created vast expanses of block-fracture and ubiquitous rockshelters. Discontinuous sandsheets occur between sandstone outcrops. Vertical sandstone cliffs created by block-fracturedefy most modes of modern access and this has significantly curtailed archaeological explora-tion of the northwest Kimberley. Our field crew and supplies were flown to an airstrip on theMitchell Plateau and shuttled by helicopter to a landing area cleared from the spinifex adjacentto the Gunu Site Complex. The significant logistical issues placed severe limits on our fieldequipment and ability to remove samples for processing.
Traditional Owners from Kandiwal graas (estate) shared their knowledge and participatedin our research (S1 Text). All necessary permits were obtained for the described study, whichcomplied with all relevant regulations. Research was completed under Western AustralianDepartment of Indigenous Affairs, Section 16 Permit No. 465 (2010) and an Authority 4 Per-mit from theWestern Australian Department of Environment and Conservation CE002829(2010). At the completion of analysis and reporting, artefacts and samples will be curated atthe Western Australian Museum, Perth. Individuals in photographs have given writteninformed consent (as outlined in PLOS consent form) to publish these images.
Using Gunu Cave as a central point, the area within a radius of 1 km was surveyed for addi-tional rock arts sites, stone quarries, and lithic scatters in order to obtain a complete
Fig 4. Photographs of Gunu Cave. a) Overview of the organic-rich occupied area at the eastern entrance. The arrow indicates the location of the excavation, on thefloor behind the sandstone boulder. Ground and polished bedrock surfaces can be seen at left. b) Western entrance showing the lower tier of solution cavities and pillars.c) Exfoliating surface layer of mulberry-coloured micaceous siltstone outcrop quarried for pigment (see [34]). Stone tools were used to incise the surface.
https://doi.org/10.1371/journal.pone.0226628.g004
Archaeology and art in context
PLOSONE | https://doi.org/10.1371/journal.pone.0226628 February 5, 2020 6 / 42

understanding of the archaeological and environmental contexts of the Gunu Site Complex.This strategy ensured that the entire rocky outlier (Fig 2) was included in the survey.
One excavation was placed inside Gunu Cave to test the depth of deposit and recoverorganic material for dating. A second excavation was placed at the base of the Gunu Rock artpanel to assess the potential of sand sheets for establishing a long chronological sequence, andin the hope of recovering pigments used to produce the adjacent rock art. Although carbon ispoorly preserved in acidic sand sheets like those in the Northwest Kimberley, advances in sin-gle-grain OSL dating of quartz grains [39], combined with proven age of aeolian deposits innearby regions [40], promised to extend the chronological sequence of activity in the complexbeyond that documented inside the cave.
Excavation and sampling methods were tailored to the logistics of research in this remoteregion. Deposits were removed following observed strata where possible, but mostly in arbi-trary spits averaging 53 mm thick at Gunu Rock and 29 mm in Gunu Cave. Deposits wereweighed to the nearest 0.5 kg and dry-sieved (Gunu Rock) or wet-sieved (Gunu Cave) throughnested 5 mm and 3 mm screens. Plastic sheets were erected over adjacent rock art to protectthe images from dust raised in backfilling, and sieving was conducted well-away from the artsites. Material was field-sorted and non-cultural stone and sediment was recorded, weighed,sampled, and backfilled. Discarded stone and sediment weights were recorded. Sphericity androundedness were recorded on a minimum sample of 10 non-cultural rocks per spit. Weightsfor rocks extending vertically across several spits were recorded for the spit in which they wereresting. Depths were recorded below datum in the field and adjusted to below surface for thisstudy. Excavation continued until bedrock covered the entire floor of the square. Radiocarbonsamples were detrital charcoal from the sieve fractions, except for one sample from GunuRock (WK-28821) taken directly from hearth fill. Sediments for luminescence dating were col-lected from the Gunu Rock excavation by hammering opaque PVC tubes into the cleaned sec-tions. Bulk sediment samples were collected from each spit in both excavations for particle sizeand magnetic susceptibility analysis. Methods for these analyses can be found in S2 Text.
The aim of the lithic analysis was to document the manufacturing techniques used to pro-duce tools, and changes in those manufacturing techniques through time. Methods followedthe reduction sequence approach, which involves classifying artefacts into technological typesaccording to their inferred origin in the reduction sequence model [41, 42]. Attribute record-ing and metrical analysis was then applied to these typological subsets. All artefacts in the>5mm sieve fraction were analysed in detail; artefacts in the 3–5 mm sieve fraction were searchedfor diagnostic types, such as pressure flakes, which were set aside for detailed analysis. Theremainder of the lithic artefacts in the 3–5 mm fraction, as well as micaeous pigment, wassorted by material type, counted, and weighed.
A goal of the study was to relate ochre recovered archaeologically to the ochre pigmentsused in the Gunu Site Complex rock art sequence [34]. Archaeological pigments were analysedto describe their geochemistry, and where possible structure. Differences between pigmentsare not always obvious and geochemical characterisation is often required to describe andcompare them [43]. Rock art panels in the Gunu Site Complex and the mulberry-colouredochre source inside Gunu Cave [34] were analysed in the field using portable X-Ray Fluores-cence Spectrometry (pXRF). Modified ochre nodules recovered from both test locations, aswell as surface finds collected prior excavation, were analysed in the laboratory via pXRF, witha small subset also examined using Scanning Electron Microscopy and X-Ray Powder Diffrac-tion (S3 Text). Modified ochre artefacts were also analysed morphologically and according tothe technical process of pigment production. Ochre colour was determined with a NaturalColour System (NCS) Colour Scan 2.0 instrument (S2 Text).
Archaeology and art in context
PLOSONE | https://doi.org/10.1371/journal.pone.0226628 February 5, 2020 7 / 42

Rock Art in the Gunu Site ComplexThe 31 rock art sites composing the Gunu Site Complex were documented in detail using cul-turally appropriate nomenclature to the Wunambal Gaambera (after [15, 35, 44, 45]) (Table Fin S1 Table). Five main stylistic periods are recognized (Fig 5), from oldest to youngest: Irregu-lar Infill Animal, Gwion, Wararrajai Gwion, Painted Hand andWanjina. Irregular Infill Ani-mal Period motifs were identified in the site complex (6 sites), along with string and grass
Fig 5. Rock art images, Gunu Site Complex. a) Grass prints. Three panels of grass prints and one of string prints were recorded at four sites, including Gunu Cave. Allare located on panels higher than most other art (up to 2.5 m above the closest platform on which to stand), and they appear in a dominant visual position at theentrances to the shelters. The prints are repeated, sometimes as many as 50 times, as at Gunu Cave. In all cases the grass or string does not appear to have been thrownagainst the panel, as there is almost no splattered pigment evident; this suggests that the pigment-saturated grass or string was pressed against the surface. b) Kangaroomotif from the Painted Hand Period. c) Gwion Period figure with elaborate decorative features and holding paired boomerangs in one hand. d) An unusual WanjinaPeriod motif painted on a yellow background. This image is on the wall near the excavation in Gunu Cave (see also [31]: 250). Photos b-d are enhanced in DStretch_yxx(b, d) and DStretch_lxx (c).
https://doi.org/10.1371/journal.pone.0226628.g005
Archaeology and art in context
PLOSONE | https://doi.org/10.1371/journal.pone.0226628 February 5, 2020 8 / 42

prints (4 sites) which also appear to be part of the earliest art period. The greatest proliferationof painting occurred during the subsequent Gwion Period (19 sites) with steady productioncontinuing to a second peak during the Wanjina Period (15 sites). One rockshelter containedjust a single classifiable motif, while others contained fewer than ten motifs painted in a singlestyle, suggesting that visits to these sites were less frequent. In contrast, the 90 motifs docu-mented at Gunu Cave include examples of all recognised Kimberley stylistic periods, demon-strating that this site has retained its significance over the entire period of Kimberley rock artproduction.
Although the relative stylistic sequence of the Kimberley rock art assemblage is generallyaccepted [15, 22, 30, 46], the degree of overlap between styles requires additional refinementand the chronology of the earlier styles remains problematic [22, 44, 47, 48]. In addition, manymotifs cannot be securely attributed to an identifiable stylistic period. David et al. ([22]: 3 cit-ing [49]) conclude that, based on the current evidence ‘classicWanjina iconography probablydates to the last millennium’ (our emphasis) while accepting the premise that incipient Wan-jina design elements are likely to be older [44].
Gunu RockThe Gunu Rock art panel is 19 m long and is located on the lower 3–4 m of a vertical sandstonewall protected by a high overhang (Fig 6). The sand sheet at the base of the cliff is deflatedclose to the mouth of Gunu Cave, but the opposite end is a small localised catchment for wind-blown sediment. The catchment measures about 6 m long and 2.5–3 m wide, and is containedbehind chunks of sandstone embedded just beyond the dripline. No artefacts were visible onthe catchment surface. A 1 x 1 m excavation was placed below boat images (Fig 7).
The Gunu Rock excavation ended at bedrock 228 cm below the surface, and eight strati-graphic layers were identified (Fig 8). The sediment in the Gunu Rock excavation is weakly-structured medium sand with subangular grains, consistent with aeolian deposition. Particlesize analysis shows that the finer fraction is persistently tri-modal, indicating regular deposi-tion of widely sourced dust throughout the period of sediment accumulation. The coarser frac-tion is semi-sorted throughout (weakly trimodal, with a long tail of fines), suggesting relativelylittle bioturbation (Table A in S1 Table; Figure F in S1 Fig). The deposit is acidic (Table B in S1Table), visible detrital carbon is rare, and no bone was recovered.
The underlying bedrock surface within the excavation is composed of two large sandstoneboulders, 60–70 cm thick, stacked on top of each other and resting on the underlying sand-stone. The top boulder is offset from the bottom forming a stair-stepped gap between the boul-ders and the cliff face. The top of the gap is about 95 cm below the modern surface. A slab ofunmodified indurated sandstone rested nearly vertically in the bottom of the gap, leaningagainst the lower boulder, indicating that the gap was entirely exposed when the slab fell in.The gap was then infilled by sand and horizontally-resting sandstone fragments. The sedimentin the lowest part of the gap, Layer 10, is capped by a dipping deposit of moderately densegravel-sized sandstone fragments, Layer 9. Paired OSL samples taken in Layer 8, just above thecontact with Layer 9, returned ages of 10 ± 1 ka (thousand years ago) (SG-OSL-RR1) and12 ± 1 ka (SG-OSL-RR5) (Table 1, Fig 9). Mass magnetic susceptibility (MMS) values risemoderately below Spit 33 in Layer 9, and there is a distinct rise in frequency dependent mag-netic susceptibility (FDMS) values from spits 30 to 42 in Layers 9–10, as well as the largest neg-ative values (Table C in S1 Table). This indicates periods of erosion in the sediment source atthis time, redepositing both topsoil (high values) and clays (low negative values) in alternatingphases. The highest FDMS value occurs in Spit 42, at the very bottom of the deposit (Layer 10).This is inconsistent with in situ pedogenesis, where the A horizon, with the highest FDMS,
Archaeology and art in context
PLOSONE | https://doi.org/10.1371/journal.pone.0226628 February 5, 2020 9 / 42

would normally be above the B horizon; rather it suggests that a mature soil profile was dis-rupted and redeposited rapidly, infilling the lowest part of the gap and forming Layers 9–10,prior to ca. 10–12 ka.
After ca. 10–12 ka, the gap was further filled by sand and scattered sandstone rubble. Asample near the middle of this fill returned an age of 7 ± 1 ka (SG-OSL-RR2), and a samplejust above the gap returned a similar age of 8 ± 1 ka (SG-OSL-RR3) (Table 1), suggesting thatsedimentation was relatively rapid from ca. 7–8 ka. Particle sizes in sediments above the gap(Layers 1–7 and the upper part of Layer 8), postdating ca. 7–8 ka, are dominated by mediumsand, with larger, water-borne grains present in Layers 5–8. This suggests that the sandstone
Fig 6. Plan and profiles of Gunu Rock. Contour interval 0.05 m and elevations AMSL.
https://doi.org/10.1371/journal.pone.0226628.g006
Archaeology and art in context
PLOSONE | https://doi.org/10.1371/journal.pone.0226628 February 5, 2020 10 / 42

Archaeology and art in context
PLOSONE | https://doi.org/10.1371/journal.pone.0226628 February 5, 2020 11 / 42

lenses composing Layers 5 and 7 were the result of episodic minor deflation of the sand matrixby low-energy water flow (concentrating roof-fall into lenses) followed by aeolian deposition.An OSL sample from sand above Layer 5 returned an age estimate of 2.7 ± 0.5 ka(SG-OSL-RR4); this sample is above the deflation horizon, indicating the event dates to themiddle or early Holocene (between ca. 7–8 ka and 2.7 ka). MMS is fairly uniform and unex-ceptional in these upper deposits. Aeolian deposition, without clear evidence for water defla-tion, continued from 2.7 ka to the present (Layers 1 and 4). A hearth feature (Layers 2 and 3),radiocarbon dated to 1064–933 cal BP (Wk-28821)(Table 2), was dug into Layer 4. A piece oftabular sandstone was placed over the top of the hearth. Although broken in situ, it is notheavily oxidized; nor is the surrounding sediment. Hearth-capping with flat sandstone slabswas also observed on Late Holocene hearths at Borologa 1 in the North Kimberly, a behaviourdescribed as ‘a distinctive act of hearth treatment’ ([22]: 76). Hearth abandonment at GunuRock was followed by an additional 20 cm of sand deposition to the modern ground surface.
Stone artefacts first appear 118 cm below the surface in Layer 8 (Spit 25), when the sand sur-face was still about 24 cm below the top of the gap, but artefacts increase in density after thegap was completely filled (from Spits 18/19). This is when sand deposition first created a wide,flat living surface on the sand sheet behind the dripline, and has been constrained to ca. 7–8ka. Stone artefacts continue from there to the surface.
Fig 7. Gunu Rock excavation. The end of the photoscale rests on the bottom of Spit 12, 54 cm below the modern surface.Pigments were recovered up to 72 cm below the surface, some 3.4–3.7 m below the top of the rock art panel. The rock in theforeground was placed there by tourists as a step-stool for photographing the art.
https://doi.org/10.1371/journal.pone.0226628.g007
Fig 8. Stratigraphic section, Gunu Rock. Layer 1 is dark brown (7.5YR 3/4) medium sand, slightly darker than underlying deposits but with an indistinct transition.Fragments of sandstone are relatively common and much of it is bedded at the bottom of the layer. Layers 2 and 3 are a dark brown (7.5YR 3/2) medium sand hearthfeature measuring ca. 60 cm in diameter and 24 cm deep, placed into a pit dug into underlying Layer 4. It was situated at the base of the cliff and extended slightly underthe overhanging shelf. Small fragments of sandstone occur in the hearth fill, and a tabular sandstone slab was placed over the top of the hearth. Layers 4–10 are strongbrown (7.5YR 4/6) medium sand distinguished by the quantity of sandstone rocks. Layers 4 and 6 have relatively few pieces of sandstone, and layers 5 and 7 are thinsandstone-rich lenses. Scattered large sandstone rocks are present in Layer 8, but are not distributed in lenses. Layer 9 is a thin lens of mainly sandstone gravel resting onbedrock in the northern half of the excavation, and extending across the top of Layer 10 in the southern half. Lateritic pebbles, smaller than pea-sized, are rare butpresent. Layer 10 consists of abundant sandstone fragments in a matrix of strong brown (7.5YR 5/6) medium sand resting on the underlying bedrock. Unmodified rockthroughout the deposit is, on average, semi-tabular in shape and moderately rounded (Table D in S1 Table).
https://doi.org/10.1371/journal.pone.0226628.g008
Archaeology and art in context
PLOSONE | https://doi.org/10.1371/journal.pone.0226628 February 5, 2020 12 / 42

Table 1. Ultraviolet OSL single-grain and red TL dating of sediments at Gunu Rock: Dose rate data, equivalent doses, and ages.
SampleCode
Depth Context GrainSize(µm)
Beta doserate a
(Gy ka-1)
Field gammadose rate b
(Gy ka-1)
Cosmic-ray doserate c
(Gy ka-1)
Watercontent d
(%)
Total doserate e
(Gy ka-1)
Technique f StatisticalModel g
Equivalentdose h, i
(Gy)
Age j
(ka)
RR1 Spit33,166
cm BS
Sample frombottom of Layer 8,above Layer 8/9boundary;minimum age ofLayer 9 deflationevent and Layer 10deposition event
180–212
0.525± 0.039 0.420 ± 0.043 0.151 6 /5 ± 2 1.14 ± 0.09 UVSG MAM 12 ± 1 10 ± 1
RR2 Spit26,123
cm BS
Sample frommiddle of Layer 8
180–212
0.439 ± 0.038 0.428 ± 0.032 0.156 5 / 5 ± 2 1.06 ± 0.09 UVSG MAM 7 ± 0.3 7 ± 1
RR3 Spit18,
84 cmBS
Sample from belowLayer 7/8 boundary;maximum age ofLayer 5–7deposition/deflation events;minimum age ofLayer 8 depositionevent
90–125
0.415 ± 0.060 0.422 ± 0.047 0.178 8 / 7 ± 2 1.05 ± 0.11 RTL – 14 ± 5 13 ± 5
90–125
0.415 ± 0.060 0.422 ± 0.047 0.178 8 / 7 ± 2 1.05 ± 0.11 UVSA MAM 26 ± 1 25 ± 3
180–212
0.415 ± 0.060 0.422 ± 0.047 0.178 8 / 7 ± 2 1.03 ± 0.11 UVSG MAM 10 ± 1 8 ± 1
RR4 Spit 8,36 cmBS
Sample from Layer4, above Layer 4/5boundary;minimum age ofLayer 5–7deposition/deflation events
180–212
0.531 ± 0.038 0.489 ± 0.030 0.166 2 /2 ± 0.5
1.15 ± 0.10 UVSG MAM 3.2 ± 0.5 2.7 ± 0.5
RR5 Spit34,173
cm BS
RR1 sample pair 90–125
0.499 ± 0.064 0.517 ± 0.050 0.175 3 / 3 ± 2 1.22 ± 0.11 UVSA MAM 34 ± 2 28 ± 3
180–212
0.499 ± 0.064 0.517 ± 0.050 0.175 3 / 3 ± 2 1.20 ± 0.11 UVSG MAM 14 ± 1 12 ± 1
a Concentrations determined from beta counter measurements of dried and powdered sediment samples.b Determined from U, Th and K concentrations measured using a portable gamma-ray spectrometer at field water content.c Time-averaged cosmic-ray dose rates (for dry samples), each assigned an uncertainty of ± 10%.d Field / time-averaged water contents, expressed as (mass of water/mass of dry sample) x 100. The latter values were used to calculate the total dose rates and OSL/TLages.e Mean ± total (1σ) uncertainty, calculated as the quadratic sum of the random and systematic uncertainties. An internal dose rate of 0.03 Gy ka-1 is also included.f Three luminescence techniques were applied to these samples UVSA = UV single-aliquot and RTL = red TL as multiple grain techniques, and UVSG = UV single-graintechnique.g Statistical models used to determine the dose distribution between aliquots: MAM—Minimum Age Model.h Palaeodoses include a ± 2% systematic uncertainty associated with laboratory beta-source calibrations.i UVSA = UV OSL signal measured using small (0.5 mm) single-aliquots. On average 24 discs were run for each sample. UVSG UV OSL signal measured using single-grains of quartz. On average 1000 grains were analysed for each sample (between 500–1500) with between 19–47% of the grains emitting an acceptable luminescencesignal (Table E in S1 Table), with the De derived from a MAM. R, easy-to-bleach red signal (i.e., very light-sensitive signal, last reset when the grains were exposed tosunlight), only 2 large aliquots were analysed per sample.j Uncertainties at 68% confidence interval.
https://doi.org/10.1371/journal.pone.0226628.t001
Archaeology and art in context
PLOSONE | https://doi.org/10.1371/journal.pone.0226628 February 5, 2020 13 / 42

Gunu Rock artefact analysisSources of stone knapped in the Gunu Site Complex. The Mitchell and Lawley river
catchments are rich in stone for tool manufacture. Quartzite is locally available in the Gunu
Fig 9. OSL single-grain quartz analysis of samples from Gunu Rock. Refer to Table 1 and Fig 8 for sample contexts. a-e) Radial plots of the equivalent doses derivedfrom each grain of quartz with relative error and precision (%) on the x-axis plotted against Dose (Gy) on the y-axis. This type of plot allows the equivalent doses to beplotted in relation to their uncertainties so that the range of dose distribution and overdispersion can be seen. Each of the plots has been centred according to the centralage (CAM) of each distribution, with its error range displayed with the grey shading. In addition, the minimum age (MAM) of each distribution plus its error range hasbeen depicted by a red line. For each sample between 500 and 1500 grains were run with the proportion of grains that luminesce ranging between 18–46%. Thus, thenumber of accepted grains ranges between 160–400 grains for each sample. This is a statistically significant number from which to draw a reliable equivalent dose usingthe MAM. This model was chosen rather than the CAM due to the high chance of partial bleaching in this rockshelter environment and the high overdispersiondisplayed in the data (71–100%).
https://doi.org/10.1371/journal.pone.0226628.g009
Archaeology and art in context
PLOSONE | https://doi.org/10.1371/journal.pone.0226628 February 5, 2020 14 / 42

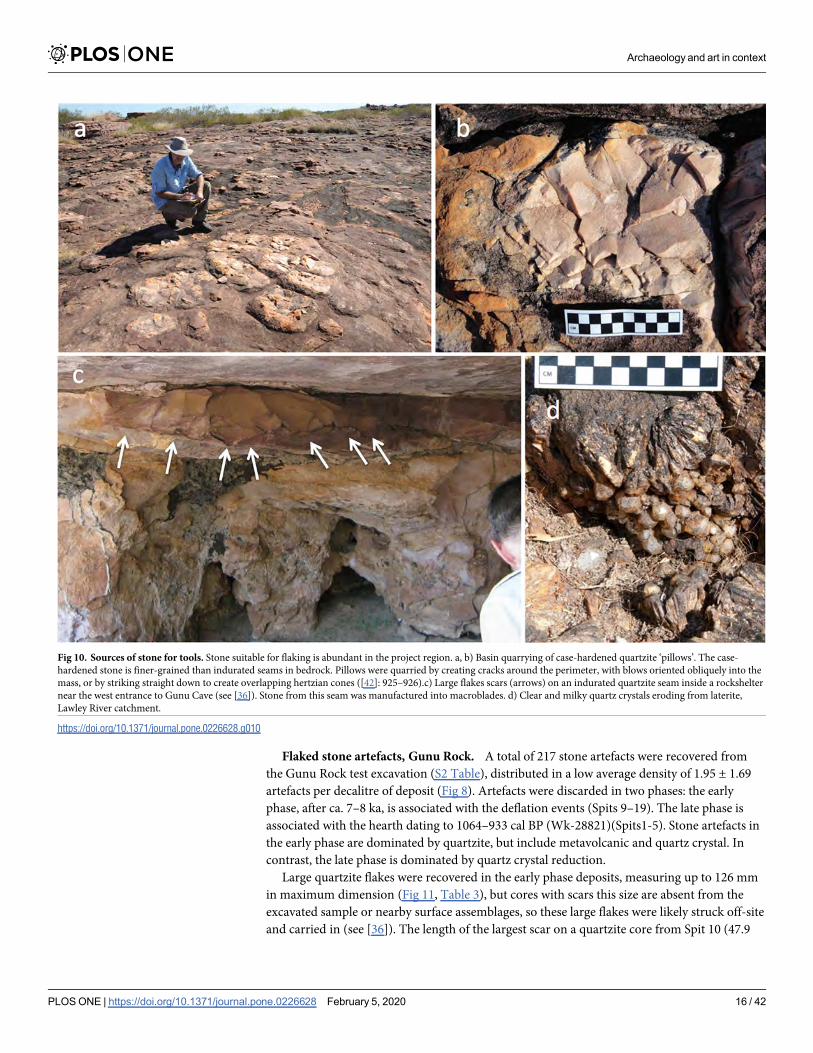
Site Complex and extensively quarried, occurring as indurated layers in the bedrock and case-hardened pillows on horizontal surfaces [36] (Fig 10). Metavolcanic stone is available as smallwater-rolled pebbles and cobbles in the gravel bed of the Mitchell River, and fine-grainedmetabasalt ([52] in [26]: 469) and other volcanics/metavolcanics are available on the MitchellPlateau [21]. A sample of green-gray material similar to artefacts in the Gunu Site Complex—called silcrete by Veitch [26]—was identified in thin section as weakly metamorphosed siltyshale, probably originating as volcanic ash ([52] in [26]: 470) This metamorphic material isalso available in the Drysdale River catchment ([53]:110) and is similar to the material calledwurumungkayi by theWorora [54]. Relatively large, high-quality clear and milky quartz crys-tals occur in small, localised laterite pockets on the Lawley River (Fig 10D) and the MitchellPlateau ([21], [26]: 36), but despite extensive lateritic pisolith pavements from laterite deflationin the Mitchell Falls area, naturally-occurring crystals were not observed there. Rare seams ofmilky crystals were observed in the sandstone bedrock, but these are too small for flaking (<10mm long). It seems likely that the unweathered quartz crystals knapped in the Mitchell Fallsarea were imported from elsewhere; the closest source is probably the extensive laterite andvolcanic deposits on the Mitchell Plateau.
Table 2. Radiocarbon dates, Gunu Site Complex excavations.
Site Spit/depth below
surface
Context Labnumber
Sample/Method
δ 13C(%)
14C Age(years BP)
Age(cal BP, 1σ)[50, 51]
Age(cal BP, 2σ)
GunuRock
Spit 3/13 cm BS
Sample from hearth (Layer3) intruding from base ofLayer 1 into Layer 4; age of Layer 1/4 interface
Wk-28821
Charcoal/conventional
-25.9 ± 0.2 1142 ± 37 1055–1015(35.4%)995–959(32.8%)
1064–933(95.4%)
GunuCave
Spit 4/12 cm BS
Sample from upper Layer 1 Wk-29832
Charcoal/conventional
-26.7 ± 0.2 220 ± 32 287–271(11.6%)218–149(56.6%)
304–241(25.4%)230–138(62.6%)114–103(1.5%)
93–71 (3%)23–0 (2.9%)
GunuCave
Spit 8/24 cm BS
Sample from Layer 2/3 interface Wk-29833
Charcoal,conventional
-27.3 ± 0.2 2383 ± 39 2431–2390(17.5%)
2383–2320(50.7%)
2680–2640(3.1%)
2608–2600(0.5%)
2493–2304(89.3%)
2235–2205(2.5%)
GunuCave
Spit 13/43 cm BS
Sample from middle of Layer 3 Wk-29834
Charcoal/conventional
-26.7 ± 0.2 765 ± 36 716–707(6.0%)686–648(55.2%)585–575(7.0%)
725–635(81.7%)594–569(13.7%)
GunuCave
Spit 16/66 cm BS
Sample from cracks in bedrock; beginning of sedimentdeposition
Wk-28823
Charcoal/AMS
-27.7 ± 0.2 2401 ± 34 2436–2338(68.2%)
2679–2641(4.3%)
2608–2601(0.6%)
2493–2316(90.5%)
Radiocarbon dates were calibrated with OxCal 4.3.2 using ShCal 13, the southern hemisphere atmospheric carbon calibration curve.
https://doi.org/10.1371/journal.pone.0226628.t002
Archaeology and art in context
PLOSONE | https://doi.org/10.1371/journal.pone.0226628 February 5, 2020 15 / 42
Flaked stone artefacts, Gunu Rock. A total of 217 stone artefacts were recovered fromthe Gunu Rock test excavation (S2 Table), distributed in a low average density of 1.95 ± 1.69artefacts per decalitre of deposit (Fig 8). Artefacts were discarded in two phases: the earlyphase, after ca. 7–8 ka, is associated with the deflation events (Spits 9–19). The late phase isassociated with the hearth dating to 1064–933 cal BP (Wk-28821)(Spits1-5). Stone artefacts inthe early phase are dominated by quartzite, but include metavolcanic and quartz crystal. Incontrast, the late phase is dominated by quartz crystal reduction.
Large quartzite flakes were recovered in the early phase deposits, measuring up to 126 mmin maximum dimension (Fig 11, Table 3), but cores with scars this size are absent from theexcavated sample or nearby surface assemblages, so these large flakes were likely struck off-siteand carried in (see [36]). The length of the largest scar on a quartzite core from Spit 10 (47.9
Fig 10. Sources of stone for tools. Stone suitable for flaking is abundant in the project region. a, b) Basin quarrying of case-hardened quartzite ‘pillows’. The case-hardened stone is finer-grained than indurated seams in bedrock. Pillows were quarried by creating cracks around the perimeter, with blows oriented obliquely into themass, or by striking straight down to create overlapping hertzian cones ([42]: 925–926).c) Large flakes scars (arrows) on an indurated quartzite seam inside a rockshelternear the west entrance to Gunu Cave (see [36]). Stone from this seam was manufactured into macroblades. d) Clear and milky quartz crystals eroding from laterite,Lawley River catchment.
https://doi.org/10.1371/journal.pone.0226628.g010
Archaeology and art in context
PLOSONE | https://doi.org/10.1371/journal.pone.0226628 February 5, 2020 16 / 42

mm) can serve as a proxy for the largest dimension of the flakes struck on-site. The five outlierflakes measuring longer than this, probably struck off-site, average 84.9 x 60.4 mm (length xwidth) and are more consistent in length (coefficient of variation, CoV = 0.35) and width(CoV = 0.32) than the complete flakes struck on-site (CoV for length = 0.52; CoV forwidth = 0.85). The average size of quartzite flakes struck on-site is a relatively small 17.9 x 25.0mm. The lower variation for flakes struck off-site may be the result of flake selection for trans-port, whereas the small flakes struck on-site display a wider range of morphologies.
Quartzite flakes selected for retouching measured at least 7 to 12 mm thick, based on thelengths of the quartzite uniface retouching flakes (Table 3). One large broken flake, probablymade off-site, was removed down the edge of a much larger flake blank, itself struck onto theunmodified flat face of a quartzite chunk (Fig 11D). The strategy of using large flakes as blanksfor producer cores is common at the local quarries, where large flakes were struck directlyfrom bedrock seams or chunks broken from these seams. The early phase quartzite flakes are
Fig 11. Flakes recovered from the Gunu Rock and Gunu Cave excavations. a) Metasedimentary flake with extensive overhang removal on the dorsal platform edge,Gunu Cave, Spit 11. b) Basalt flake with unidentified organic residue on dorsal surface, Gunu Cave, Spit 4. c) Quartzite flake, Gunu Cave, Spit 13. d) Quartzite flakestruck down the lateral ede of a large flake blank, Gunu Rock, Spit 18. e) Quartzite flake, Gunu Rock, Spit 9. f) Quartzite flake, Gunu Rock, Spit 15. Scale bar 50 mm.
https://doi.org/10.1371/journal.pone.0226628.g011
Archaeology and art in context
PLOSONE | https://doi.org/10.1371/journal.pone.0226628 February 5, 2020 17 / 42

not markedly elongated (Fig 12): the elongation ratio (length/width) of the flakes struck on-site is 0.96 ± 0.61, compared to 1.46 ± 0.51 for the outliers. Although one small blade-like flakewas noted in the early phase assemblage—with the targeted mass created by parallel prior flakeremovals—flakes were more often struck from relatively flat core surfaces with geometries cre-ated by sub-parallel (e.g., Fig 11E) or non-parallel prior flake removals.
The technological and metrical evidence suggests a similar opportunistic approach wasused to produce large quartzite blanks at the quarries and small flakes from transported cores.Significantly, this approach differs from the macroblade production sequences documented atnearby quartzite procurement sites, which may be broadly contemporaneous with the GunuRock early phase assemblage (see [25, 26]). These elaborate and complex quartzite reductionsequences—not present in the Gunu Rock assemblage—focused on manipulating the core faceto produce straight arrises for removing long, elongated macroblades in series.
Quartz crystal reduction in the early phase was mostly by direct freehand percussion (Figs13 and 14). In contrast to later phase technology, the bipolar technique was also practiced, andcortex indicates that some crystals were sourced from fluvial (water-rolled) sources. Earlyphase quartz crystal flakes are slightly larger than those struck in the late phase (Table 3), butsample sizes are low. Metasedimentary stones reduced in the early phase are devitrifiedthrough post-depositional processes. Cortical surfaces were not identified on these artefacts,and it is unclear whether the stone was sourced fromMitchell River gravels or possible bed-rock sources on the Mitchell Plateau.
The late phase occupation at Gunu Rock, associated with the hearth dating to ca. 1064–933cal BP (Wk-28821), documents a marked change in raw material preference; the proportion ofquartzite and metasedimentary stone dropped dramatically from the early phase (Fig 10). Two
Table 3. Metric data for complete flakes (>5 mm), Gunu Site Complex excavations.
Site 1 Flake Type 2
(sample size)Material Attribute
(Range; Mean ± SD; CoV) 3
Length, mm Width, mm Thickness, mm Elongation 4 Platform Depth 5, mm GramsGunu Rock,early phase
Early Reduction(N = 4)
Quartz 7.62–21.87;15.1 ± 6.1;
0.40
10.77–16.45;13.3 ± 2.7;
0.20
2.55–5.77;3.59 ± 1.49;
0.41
0.52–1.93;1.1 ± 0.6;0.49
2.67–3.89;3.1 ± 0.66;0.21 (N = 3)
0.27–1.07;0.58 ± 0.38;
0.65Gunu Rock,late phase
Early Reduction(N = 18)
Quartz 6.53–17.55;11.4 ± 3.3;
0.29
5.15–15.76;9.4 ± 3.1;0.33
1.51–5.68;3.51 ± 1.41;
0.40
0.48–2.68;1.3 ± 0.6;0.46
1.13–7.48;3.3 ± 1.2;
0.57 (N = 19)
0.10–1.25;0.38 ± 0.31;
0.82Gunu Cave Early Reduction
(N = 24)Quartz 7.28–19.18;
10.3 ± 2.8;0.27
6.89–19.41;10.2 ±3.5;
0.35
1.06–6.97;3.47 ± 1.37;
0.40
0.58–1.79;1.1 ± 0.3;0.26
0.73–8.52;2.6 ± 1.5;
0.40 (N = 31)
0.07–1.47;0.41 ±0.40;
0.99Gunu Rock,early phase
Early Reduction(N = 19)
Quartzite 6.02–125.82;29.4 ± 29.3;
1.00
5.37–93.68;31.1 ± 24.7;
0.79
1.29–43.18;11.5 ± 10.2;
0.88
0.31–2.27;1.05 ± 0.62;
0.59
0.96–41.06;7.6 ± 8.7;
1.15 (N = 34)
0.06–321.35;32.4 ± 69.0;
2.13Gunu Cave Early Reduction
(N = 9)Quartzite 7.67–53.44;
22.0 ± 14.7;0.67
8.27–51.65;21.2 ± 14.4;
0.68
1.98–15.0;6.0 ± 4.0;0.66
0.61–1.74;1.08 ± 0.36;
0.33
2.21–11.66;5.4 ± 3.9;
0.73 (N = 11)
0.08–40.99;6.5 ± 14.0;
2.15Gunu Rock,early phase
Uniface Retouching(N = 4)
Quartzite 6.74–11.89;9.0 ± 2.2;0.24
13.07–28.57;21.0 ± 6.4;
0.30
4.78–7.59;6.29 ± 1.2;
0.19
0.37–0.52;0.44 ± 0.06;
0.14
6.50–9.30;7.9 ± 1.5;
0.19 (N = 4)
0.5–2.14;1.3 ± 0.8;0.65
1 Gunu Rock, early phase includes spits 9–19, and late phase includes spits 1–5.2 Flake types after [41]. See also definitions in S2 Table, Tables A-B.3 SD: standard deviation. CoV: Coefficient of variation.4 Length/Width.5 Platform depths were also measured on proximal fragments to increase the sample size (N) for this attribute.
https://doi.org/10.1371/journal.pone.0226628.t003
Archaeology and art in context
PLOSONE | https://doi.org/10.1371/journal.pone.0226628 February 5, 2020 18 / 42

blade-like flakes were recovered, one of quartzite and one of metasedimentary stone, but giventhe lack of cores and core reduction debris, both were probably struck off-site and carried tothis location. The distal end of a quartzite biface thinning flake (after [42]: 921–922) was recov-ered from Spit 1. A small number of quartzite biface thinning flakes were cached inside a smallhollow in the cliff face near the excavation, but it is unclear if this was done by Aboriginal peo-ple or tourists. Quartz crystal artefacts dominate the later phase assemblage. Crystal cores werereduced by direct freehand percussion, producing very small flakes for retouching or use andmany shatter fragments measuring <5 mm in maximum dimension. Some cores are heavily
Fig 12. Scatterplot of quartzite flake lengths and widths. Gunu Rock, early phase (Spits 9–19).
https://doi.org/10.1371/journal.pone.0226628.g012
Archaeology and art in context
PLOSONE | https://doi.org/10.1371/journal.pone.0226628 February 5, 2020 19 / 42

Archaeology and art in context
PLOSONE | https://doi.org/10.1371/journal.pone.0226628 February 5, 2020 20 / 42

reduced, whereas others have only one percussion scar (Fig 13C). Unmodified quartz crystalsare also present (Fig 13A and 13B).
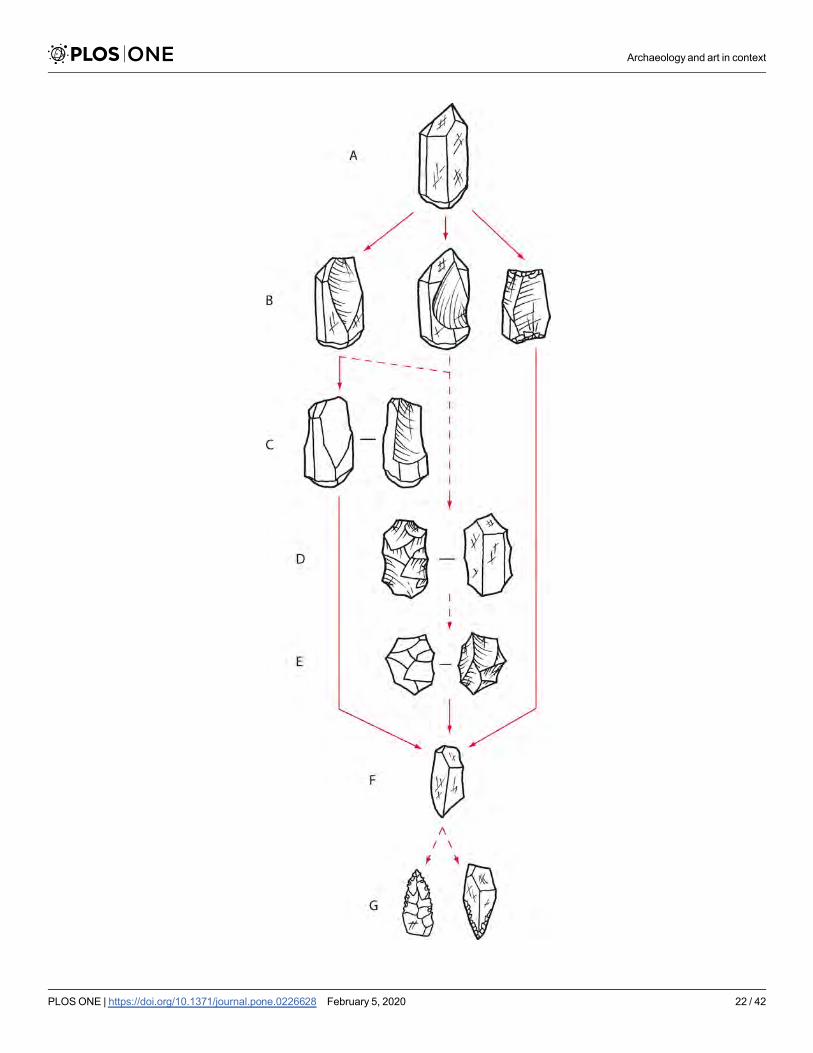
The quartz reduction sequence usually began by removing a flake down the crystal’s longaxis from the distal end, where the geometry of growth facets at the crystal’s tip naturally createan acute platform angle ideal for striking a flake by direct percussion (Fig 15). However, due tothe geometry of crystal growth, an offset is present between this platform surface and the natu-ral arrises on the sides of the crystal. Depending on how the blow was delivered, the flake mayhave propagated down the high mass defined by a natural arris, or the flat crystal face betweentwo natural arrises. This created early-stage flakes with a blade-like morphology, with one ormore dorsal crystal-facet arrises oriented parallel to the percussion axis. However, most
Fig 13. Quartz cores and manuports recovered from the excavations. a) Unmodified quartz crystal manuport, Gunu Rock, Spit 8. Thiscrystal is milky quartz, in contrast to, for instance, b & c. The ochre-like iron staining is likely non-cultural and derived from the crystalsource. Iron staining is common in the crystal assemblage. b) Unmodified quartz crystal manuport, Gunu Rock, Spit 3. c-d) Quartz crystalcores flaked unifacially on the distal end. c) Gunu Rock, Spit 2. d) Gunu Cave, Spit 7. This artefact is internally fractured and crenated fromexposure to heat. Scale bar 50 mm.
https://doi.org/10.1371/journal.pone.0226628.g013
Fig 14. Quartz flakes recovered from the excavations. a) Quartz crystal utilised flake with microflaking use-wear on distal end and unidentified residue on dorsalsurface (right), Gunu Cave, Spit 8. b) Quartz crystal flake, Gunu Rock, Spit 8. c) Quartz crystal blade-like flake, Gunu Rock, Spit 2. Scale bar 30 mm.
https://doi.org/10.1371/journal.pone.0226628.g014
Archaeology and art in context
PLOSONE | https://doi.org/10.1371/journal.pone.0226628 February 5, 2020 21 / 42
Archaeology and art in context
PLOSONE | https://doi.org/10.1371/journal.pone.0226628 February 5, 2020 22 / 42
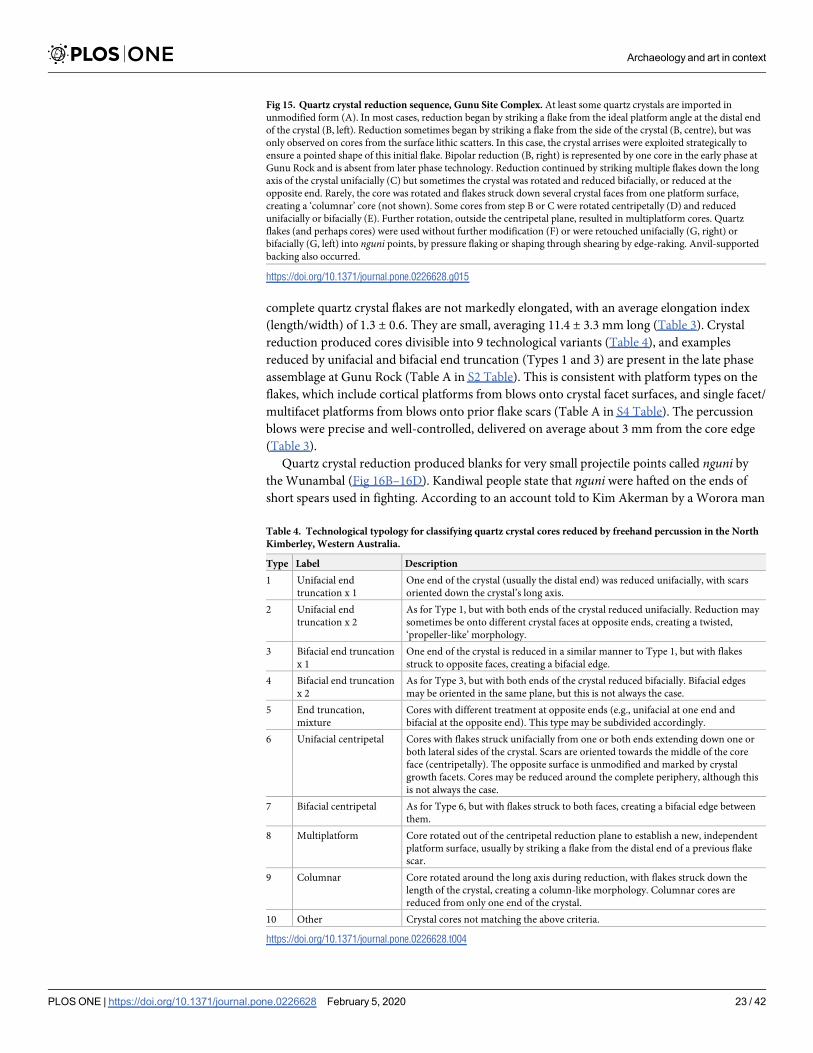
complete quartz crystal flakes are not markedly elongated, with an average elongation index(length/width) of 1.3 ± 0.6. They are small, averaging 11.4 ± 3.3 mm long (Table 3). Crystalreduction produced cores divisible into 9 technological variants (Table 4), and examplesreduced by unifacial and bifacial end truncation (Types 1 and 3) are present in the late phaseassemblage at Gunu Rock (Table A in S2 Table). This is consistent with platform types on theflakes, which include cortical platforms from blows onto crystal facet surfaces, and single facet/multifacet platforms from blows onto prior flake scars (Table A in S4 Table). The percussionblows were precise and well-controlled, delivered on average about 3 mm from the core edge(Table 3).
Quartz crystal reduction produced blanks for very small projectile points called nguni bytheWunambal (Fig 16B–16D). Kandiwal people state that nguni were hafted on the ends ofshort spears used in fighting. According to an account told to Kim Akerman by aWorora man
Fig 15. Quartz crystal reduction sequence, Gunu Site Complex. At least some quartz crystals are imported inunmodified form (A). In most cases, reduction began by striking a flake from the ideal platform angle at the distal endof the crystal (B, left). Reduction sometimes began by striking a flake from the side of the crystal (B, centre), but wasonly observed on cores from the surface lithic scatters. In this case, the crystal arrises were exploited strategically toensure a pointed shape of this initial flake. Bipolar reduction (B, right) is represented by one core in the early phase atGunu Rock and is absent from later phase technology. Reduction continued by striking multiple flakes down the longaxis of the crystal unifacially (C) but sometimes the crystal was rotated and reduced bifacially, or reduced at theopposite end. Rarely, the core was rotated and flakes struck down several crystal faces from one platform surface,creating a ‘columnar’ core (not shown). Some cores from step B or C were rotated centripetally (D) and reducedunifacially or bifacially (E). Further rotation, outside the centripetal plane, resulted in multiplatform cores. Quartzflakes (and perhaps cores) were used without further modification (F) or were retouched unifacially (G, right) orbifacially (G, left) into nguni points, by pressure flaking or shaping through shearing by edge-raking. Anvil-supportedbacking also occurred.
https://doi.org/10.1371/journal.pone.0226628.g015
Table 4. Technological typology for classifying quartz crystal cores reduced by freehand percussion in the NorthKimberley,Western Australia.
Type Label Description1 Unifacial end
truncation x 1One end of the crystal (usually the distal end) was reduced unifacially, with scarsoriented down the crystal’s long axis.
2 Unifacial endtruncation x 2
As for Type 1, but with both ends of the crystal reduced unifacially. Reduction maysometimes be onto different crystal faces at opposite ends, creating a twisted,‘propeller-like’ morphology.
3 Bifacial end truncationx 1
One end of the crystal is reduced in a similar manner to Type 1, but with flakesstruck to opposite faces, creating a bifacial edge.
4 Bifacial end truncationx 2
As for Type 3, but with both ends of the crystal reduced bifacially. Bifacial edgesmay be oriented in the same plane, but this is not always the case.
5 End truncation,mixture
Cores with different treatment at opposite ends (e.g., unifacial at one end andbifacial at the opposite end). This type may be subdivided accordingly.
6 Unifacial centripetal Cores with flakes struck unifacially from one or both ends extending down one orboth lateral sides of the crystal. Scars are oriented towards the middle of the coreface (centripetally). The opposite surface is unmodified and marked by crystalgrowth facets. Cores may be reduced around the complete periphery, although thisis not always the case.
7 Bifacial centripetal As for Type 6, but with flakes struck to both faces, creating a bifacial edge betweenthem.
8 Multiplatform Core rotated out of the centripetal reduction plane to establish a new, independentplatform surface, usually by striking a flake from the distal end of a previous flakescar.
9 Columnar Core rotated around the long axis during reduction, with flakes struck down thelength of the crystal, creating a column-like morphology. Columnar cores arereduced from only one end of the crystal.
10 Other Crystal cores not matching the above criteria.
https://doi.org/10.1371/journal.pone.0226628.t004
Archaeology and art in context
PLOSONE | https://doi.org/10.1371/journal.pone.0226628 February 5, 2020 23 / 42

in Mowanjum in 1976 [55], nguni is the term used for a short reed spear (ca. 1.5 m long) witha wood, bone, wire, or stone point used historically in ambush warfare or settling camp dis-putes (but not for hunting). The point was small and embedded in beeswax, which was thenmoulded over the entire point, with the point’s base resting against a nodal septum at the endof the reed spear shaft (Phragmites sp. [56]). The spear was thrown with a ‘gooseneck’ spear-thrower (warimi or warimirri [55]), and the point was meant to dislodge beneath the skin onimpact. Here we follow our Kandiwal colleagues, and define nguni as small quartz crystalpoints (under 30 mm long and 15 mm wide, and<1.5 g) (Table 5) with an acute tip created bysteep and mostly non-invasive percussion or pressure flaking, applied unifacially or bifaciallyto one or both margins.
Two nguni points were recovered from the late phase Gunu Rock deposits. One of thesewas modified by unifacial retouch (Fig 16B) and the second was modified by a combination of
Fig 16. Projectile points recovered from the excavations. a) Quartzite bifacial point, Gunu Cave, Spit 7. b) Quartz crystal unifacial point, Gunu Rock, Spit 2. The pointwas made on a blade-like end truncation flake with the parallel arrises between crystal facets extending lengthwise down the point’s dorsal surface. The edge wasmodified by a unifacial shearing (‘edge-raking’) gesture towards the flake’s dorsal surface to create an acute point c) Quartz crystal unifacial and backed point, GunuRock, Spit 1. The point was made on a flake struck diagonally across the distal end of a quartz crystal (possibly from a Type 6 or 7 core Table 4), intersecting negativescars struck from the crystal’s opposite side. The flake appears to have overstruck the core’s edge, resulting in a thick margin; this margin was subsequently reduced byunifacial anvil-supported backing, visible in the side view. The opposite edge was modified by bifacial, non-invasive retouch—probably by pressure flaking—to createthe acute tip. d) Quartz bifacial point, Gunu Cave, Spit 8. Scale bar 50 mm.
https://doi.org/10.1371/journal.pone.0226628.g016
Archaeology and art in context
PLOSONE | https://doi.org/10.1371/journal.pone.0226628 February 5, 2020 24 / 42

bifacial flaking and anvil-supported backing (Fig 16C). Backing retouch was used on toolsdated to ca. 1675 ± 185 in the East Kimberley [23], and the technique was sometimes used toshape points in the South Kimberley [59], but backed artefacts were rarely encountered duringour Northwest Kimberley fieldwork. Three backed artefacts were recorded: the Gunu Rockspecimen, a similar nguni point from the deflated area adjacent to Gunu Rock (Fig 17B), and athird nguni point on the surface of a site in the Lawley River catchment. The technique in theNorth Kimberley is likely a contingent solution to create a pointed tip on a very small quartzcrystal blank with a thick edge, rather than, as suggested for the South Kimberley, a ‘regionalresponse to a particular technological requirement’ ([59]: 154). In international context, ngunipoints are exceptionally small for dart point armatures. The range of tip cross-sectional areavalues of the Gunu specimens (18.7–31.4)(Table 5) is well below Shea’s mean TCSA value fordart point armatures elsewhere in the world (58 ± 18) (Table 1 in [58]) and is even smallerthan the mean TCSA value for ethnographic arrowpoints (33 ± 20) (cf. [60]). Encasing thesetiny nguni points in beeswax may have increased the dart’s tip mass sufficiently for use with aspearthrower.
Other artefacts, Gunu Rock. Three quartzite grinding stones were recovered from GunuRock (Fig 18A–18C). The artefacts have a brick-like shape, with grinding facets and percussionpitting on all or most faces and edges. All three stones appear to be made on water-rolled cob-bles. Two of the Gunu Rock grinding stones date to the early occupation phase, and the thirddates to the late occupation phase, roughly contemporary with a broken specimen excavatedin Gunu Cave. They are morphologically similar to each other (Table B in S4 Table), averaging103.2 x 85.9 x 56.7 mm (length x width x thickness) and 808.5 g. The CoVs for these dimen-sions are remarkably low, ranging from 0.05 for thickness to 0.16 for width; CoVs up to 0.05are thought to reflect highly specialised production ([61]: 497), and up to ca. 0.19 may result
Table 5. Projectile point dimensions, Gunu Site Complex.
Site, Figure Depth Typology � Technology Material PlatformType #
Length,mm
Width,mm
Thickness,mm
Platformdepth, mm
Grams TCSA § [57,58], mm2
Gunu Cave,Fig 16A
Spit 7 Group 1 Bifacial Quartzite – 29.37 14.92 4.49 – 1.66 33.5
Gunu Cave,Fig 17A
Surface Group 2,Kimberley
Point
Bifacial Quartzite – (33.89) 31.37 8.89 – (8.65) 139.4
Gunu Rock,Fig 16C
Spit 1 Group 1,nguni
Bifacial/Unifacial,backed
Quartz – 19.29 9.7 3.86 – 0.73 18.7
Gunu Rock,Fig 16B
Spit 2 Group 1,nguni
Unifacial Quartz SingleFacet
17.97 7.28 5.38 5.48 0.51 19.6
Gunu Rock,Fig 17B
Surface Group 1,nguni
Unifacial,backed
Quartz – 27.66 12.08 4.6 – 1.23 27.8
Gunu Cave,Fig 17D
Spit 8 Group 1,nguni
Bifacial Quartz SingleFacet
14.7 12.04 5.21 3.16 0.79 31.4
Mean ± SD(N = 4) $
19.9 ± 5.5 10.3 ± 2.3 4.8 ± 0.7 – 0.82 ± 0.30 –
CoV (N = 4) $ 0.28 0.22 0.14 – 0.37 –
Incomplete dimensions are in parentheses.� Technological groupings after ([42]: 937–938).# Platform type of the flake blank modified into the projectile point.§ TCSA is a proxy measurement of the ‘tip cross sectional area’, calculated by multiplying the maximum thickness by one half the maximum width.$ Summary statistics are for nguni points only. SD: Standard deviation. CoV: Coefficient of variation. N: sample size.
https://doi.org/10.1371/journal.pone.0226628.t005
Archaeology and art in context
PLOSONE | https://doi.org/10.1371/journal.pone.0226628 February 5, 2020 25 / 42

from a small number of artisans [62]. However, the consistent morphology of the Gunu arte-facts across a wide chronological range more likely reflects convergence on ideal tool ergo-nomics in the context of their local function. For instance, grinding stones from westernNorth America have similarly low CoV values, ranging from 0.17–0.22 (Table 1 in [61]). Giventhe profile and small size of the convex grinding surfaces, the Gunu artefacts are probably topstones rather than bottom stones (see also [22]). One small fragment of a flat-profile grindingstone—possibly a bottom stone—was recovered from the late phase deposits at Gunu Rock,and extensive flat and concave grinding patches are present on horizontal bedrock surfaces inGunu Cave (Fig 4A).
All of the pigment recovered from Gunu Rock is from the early phase, including six piecesmodified by grinding (Fig 19, Table 6). Two of these were directly associated with the 8 ± 1 kaage estimate (SG-OSL-RR3), including a large red ground piece (Fig 19D), as well as a mica-ceous siltstone ground piece (Fig 19E) likely from the source within Gunu Cave (Fig 4C). Mul-berry pigments are typical of the Gwion art styles and it is possible that this piece was usedduring the production of images on the art panel above the excavation (S3 Text). The tops ofthe art panels, including the Gwion figures, are about 3.4–3.7 m above the surface containingthese ground pieces. A soft white clay recovered ca. 10 cm below the 2.7 ± 0.5 age estimate(SG-OSL-RR4) (Fig 19A) was likely used to produce white pigment (see [22, 63–67]. The rockart panel no longer includes motifs with white elements as these less durable pigments haveexfoliated off the rock face [63]. Welch ([33]: 173) suggests that white pigment may have oncebeen part of the yam motifs at Gunu Rock. All of the ground ochres recovered below the GunuRock art panel date between ca. 2.7 ka (SG-OSL-RR4) and 7–8 ka (OSL-SG-RR2,OSL-SG-RR3).
Gunu CaveGunu Cave penetrates the bedrock outlier 15 m south of the Gunu Rock excavation. GunuCave measures 13 m wide and 6 m high at the dripline on the eastern-facing main entrance,
Fig 17. Projectile point fragments recovered from the surface. a) Quartzite Group 2 ‘Kimberley Point’ proximal fragment from the floor of Gunu Cave (see Fig 12A in[42]). b) Quartz nguni point from the surface at Gunu Rock. The point is retouched by backing on the right lateral margin. Scale bar 50 mm.
https://doi.org/10.1371/journal.pone.0226628.g017
Archaeology and art in context
PLOSONE | https://doi.org/10.1371/journal.pone.0226628 February 5, 2020 26 / 42

and extends 26 m to the west-facing entrance, which provides access to the open amphitheatreto the west and southwest of the site (Fig 20). The western shelter floor is marked by a series oflow tunnels and galleries caused by erosion of softer underlying sandstone. The eastern occu-pation floor is ca. 3 m above the sand sheet at the base of Gunu Rock, and adjoins a scree slopeof large sandstone slabs and boulders. Wide elevated sandstone shelves are above the occupa-tion floor along the northern and southern walls. Thin layers of micacaeous siltstone inside theshelter (Fig 4C) are presently the only known source in the Kimberley for mulberry-coloured
Fig 18. Quartzite grinding stones recovered from the excavations. a) Gunu Rock, Spit 3. b) Gunu Rock, Spit 11. This artefact was exposed in the side wall of theexcavation (see Fig 19). c) Gunu Rock, Spit 16. d) Gunu Cave, Spit 9. Scale bar 50 mm.
https://doi.org/10.1371/journal.pone.0226628.g018
Archaeology and art in context
PLOSONE | https://doi.org/10.1371/journal.pone.0226628 February 5, 2020 27 / 42

pigment with evidence of extraction and processing [34]. The occupation floor is a denseorganic-rich surface scatter of stone flakes, charcoal, bone, and marine and freshwater shell.Melaleuca paperbark and fragmentary human remains are present on the floor along the northwall of the shelter, from one or more secondary burials fallen from niches and shelves. Groundand polished hollows—some marked by large inicipient cones from pounding—occur on theelevated shelves (Fig 4A) in association with in situ quartzite fluvial cobbles, although well-defined ‘cupules’ are not present. One fluvial cobble is identified as a ‘sacred stone’ by Welch([33]: 172) (see Fig 4A, to the right of the person at the top of the photograph). Quartzite bifa-cial percussion and pressure flakes are in hollows and vertical cracks in the elevated shelves atthe eastern entrance, indicating that stone-flaking occurred on these well-lit surfaces. A varietyof art images adorn the walls of the cave (e.g., [31]: 246–249, 251), and 77 quartzite bedrockedges were subjected to unifacial and bifacial percussion flaking. Individual flaked bedrockedges, with overlapping flake scars, extend for up to 3.6 m (avg 0.6 ± 0.52 m). Some flakingremoved parts of rock art images, and images were also painted over flake scars [36].
A 50 x 50 cm test excavation was placed on the shelter floor behind an elevated bedrockshelf which protects the deposits there from wind and water erosion (Fig 4A). The matrix was
Fig 19. Ochre pigment recovered from the excavations. Arrows denote percussion scars. a) White clay, Gunu Rock, Spit 10. b) Oxidised sandstone, Gunu Rock, Spit12. c) Lateritic piece, Gunu Rock, Spit 9. d) Lateritic piece, Gunu Rock, Spit 18. e) Micaceous siltstone, Gunu Rock, Spit 18. f) Lateritic piece, Gunu Cave, Spit 10. g)Micaceous siltstone, Gunu Cave, Spit 12. h) Lateritic piece, Gunu Cave, Spit 10. i) Oxidised sandstone, Gunu Cave, Spit 12. Scale bar 50 mm.
https://doi.org/10.1371/journal.pone.0226628.g019
Archaeology and art in context
PLOSONE | https://doi.org/10.1371/journal.pone.0226628 February 5, 2020 28 / 42

weakly-structured medium sand with abundant organics. The deposit is acidic to neutral/slightly alkaline (Table B in S1 Table). Three layers were identified (Fig 21), including a loose‘scuff zone’ (Layer 1) with more compact sediments beneath (Layer 2) and reddish sedimentsand abundant roof-fall in contact with bedrock (Layer 3). Bedrock was encountered 50–55 cmbelow the surface, with cracks in the floor extending to 66 cm deep. An age estimate of 2316–2679 cal BP (Wk-28823)(Table 2) was obtained from cracks in the bedrock surface, and a sam-ple from the interface between Layers 2 and 3 returned an age estimate of 2205–2680 cal BP(Wk-29833). The calibrated ages overlap at two standard deviations. A dispersed charcoal sam-ple from the middle of Layer 3, between these dates, returned an age estimate of 569–725 calBP (Wk-29834) and a modern date was returned from a sample at the top of Layer 1 (Wk-29832). For the purpose of analysis we treat the materials as a single assemblage dating from2316–2679 cal BP (Wk-28823) to the present. The quantity of charcoal and other organics (Fig21, Table D in S3 Table) is highest near the surface, decreases from the surface through mostof Layer 1, increases at the Layer 2/3 interface, and declines steadily through Layer 3 to thebase of the deposit. In contrast, bone is rare in Layers 1 and 2, but occurs in relatively high den-sity in Layer 3. Discrete hearth features were not identified but burned stone and bone arepresent throughout the deposit.
Gunu Cave artefact analysisFlaked stone artefacts, Gunu Cave. The density of stone artefacts in the Gunu Cave exca-
vation is nearly 11 times higher than at Gunu Rock (Fig 21). Density is highest in the upperpart of Layer 3 and at the Layer 2/3 interface, with a second peak in the Layer 1 surface deposit.Stone types are most diverse near the base of Layer 3 (Fig 21, S3 Table). Quartz crystal domi-nates the assemblage from the top of Layer 3, with quartzite density increasing substantiallynear the surface. Most of the ochre pigment is from the base of Layer 3.
Table 6. Ochre artefact dimensions and colour, Gunu Site Complex.
Site, Figure Spit Material Length, mm Width, mm Thickness, mm Grams NCS Colour 1
Gunu Rock,Fig 19C
9 Lateritic piece 15.96 11.24 6.2 1.52 4020-Y70R
Gunu Rock,Fig 19A
10 White clay 23.67 16.49 6.16 2.83 1005-Y40R
Gunu Rock,Fig 19B
12 Oxidised sandstone 23.42 19.23 10.38 4.58 4020-Y70R
Gunu Rock 14 Micaceous siltstone2 – – – 13.03 3020-Y60RGunu Rock, Fig 19D 18 Lateritic piece 71.44 54.85 35.32 172.79 4040-Y70R
Gunu Rock,Fig 19E
18 Micaceous siltstone 39.86 29.28 11.15 15 2040-Y60R
Gunu Cave 5 Micaceous siltstone 23.87 18.68 4.05 2.31 3020-Y60RGunu Cave,Fig 19H
10 Lateritic piece 29.91 25.59 17.72 19.38 3040-Y60R
Gunu Cave,Fig 19F
10 Lateritic piece 40.24 30.4 12.7 17.21 4040-Y70R
Gunu Cave 12 Oxidised sandstone 19.68 14.07 9.8 2.13 2040-Y50RGunu Cave,Fig 19I
12 Oxidised sandstone 40.77 28.37 19.47 21 3030-Y50R
Gunu Cave,Fig 19G
12 Micaceous siltstone 48.37 20.4 10.31 13.28 2040-Y50R
1 Refer to S2 Text for an explanation of the NCS colour recording system.2 14 exfoliated fragments from one artefact.
https://doi.org/10.1371/journal.pone.0226628.t006
Archaeology and art in context
PLOSONE | https://doi.org/10.1371/journal.pone.0226628 February 5, 2020 29 / 42

Quartzite cores were flaked opportunistically to produce relatively small early reductionflakes. One large quartzite flake (Fig 11C) is within the ‘outlier’ size range defined for GunuRock, and may have been struck off-site and carried here. The size range of the quartzite flakeassemblage is statistically the same as the early phase quartzite assemblage from Gunu Rock(Table A in S5 Table), and evidence for quartzite macroblade production is absent from theGunu Cave assemblage. This suggests that a similar opportunistic approach to quartzite reduc-tion, in both technology and size of products, spans the Holocene. Several fine-grained metase-dimentary and basalt early reduction flakes were recovered in Gunu Cave, including two flakeswith cortex consistent with a bedrock or colluvial source (Fig 11A and 11B). Cores of thesematerials were not recovered from the excavation and were rarely encountered in surface scat-ters, and the two the largest of these (measuring 39.6 and 51.5 mm in maximum dimension)were probably struck off-site and carried in. Both are damaged by use-wear microflaking andone is stained on the dorsal surface by an unidentified residue (Fig 11B).
Fig 20. Plan and profile of Gunu Cave.
https://doi.org/10.1371/journal.pone.0226628.g020
Archaeology and art in context
PLOSONE | https://doi.org/10.1371/journal.pone.0226628 February 5, 2020 30 / 42

Pressure flake proximal fragments are technologically distinctive, and seven quartzite pres-sure flakes were identified from Layer 2 or the Layer 2/3 interface (Table 7). The pressure flakeswere initiated by bending, and three of the pressure flakes were detached from ground plat-form edges (see [53]). Platforms average only 1.2 ± 0.3 mm deep, consistent with on-edgeforce application. Flake margins are parallel and the platform composes most of the proximalend of the flake, with limited lateral expansion outward from the single-facet or multifacetedplatform. The pressure flakes are flat to slightly curved lengthwise; the curvature is consistentwith collateral pressure flaking on blanks thinned and contoured by percussion flaking [42].The dorsal surfaces are marked by high mass zones created by prior flake removals, includingsingle parallel arrises. Although sample sizes are small, complete pressure flake metrics displaylow CoVs for length (0.15), width (0.25), thickness (0.23), and platform depth (0.23), indicat-ing a relatively high degree of standardisation [62]. The Gunu Cave flakes were most likelydetached during invasive collateral pressure flaking (after [42]: 926) of relatively large points.
Fig 21. Stratigraphic section, Gunu Cave. Layer 1 is a loose surface deposit of loose very dark grey (5YR 3/1) organic-rich medium sand with abundant charcoal. Layer2 is a deposit of weakly-structured dark grey (5YR 3/1) organic-rich medium sand with abundant charcoal and rock fragments. Layer 2 is more compact than Layer 1.Layer 3 is a deposit of weakly-structured dusky red (2.5YR 3/2) medium-sand interspersed among roof-fall fragments, increasing with depth to bedrock. Charcoal is raretowards the bottom and the boundary between Layers 2 and 3 is gradual.
https://doi.org/10.1371/journal.pone.0226628.g021
Table 7. Pressure flake attributes, Gunu Cave.
Spit Platform Type Length, mm Width, mm Thickness, mm Platform depth,mm
Grams Bend initiation Conchoidalinitiation
Groundplatform
1 Multifacet (3.78) 4.75 1.21 1.16 (0.02) 1 – 11 Multifacet (5.04) (4.61) 1.08 1.28 (0.03) 1 – 12 Single facet (7.70) (6.27) 1.41 1.29 (0.07) 1 – 16 Multifacet (5.48) 6.93 1.39 1.78 (0.06) 1 – –7 Single facet 6.32 (5.51) 1.49 1.19 (0.06) – 1 –9 Single facet (4.41) 4.02 0.82 0.94 (0.01) – 1 –9 Single facet 5.09 4.71 0.87 0.94 0.01 1 – –$
Mean ± SD5.7 ± 0.9,(N = 2)
5.1 ± 1.3(N = 4)
1.2 ± 0.3(N = 7)
1.2 ± 0.3(N = 7)
$ CoV 0.15 0.25 0.23 0.23
All pressure flakes are quartzite. Incomplete dimensions are in parentheses.$ SD: Standard deviation. CoV: Coefficient of variation. N: sample size. Summary statistics are for complete dimensions only.
https://doi.org/10.1371/journal.pone.0226628.t007
Archaeology and art in context
PLOSONE | https://doi.org/10.1371/journal.pone.0226628 February 5, 2020 31 / 42

The increase in quartzite density in Layer 1 and the top of Layer 2 reflects a spike in artefactsmeasuring 3–5 mm (Table B in S3 Table), and many of these may be non-diagnostic fragmentsfrom pressure flaking. Percussion bifacial thinning debris is absent from the excavatedassemblage.
One quartzite point, shaped entirely by pressure flaking, was recovered from the base ofLayer 2 (Fig 16A). Point manufacture in the Kimberley falls into two technological groupings([42]: 937–938). Group 1 points were made by mostly non-invasive percussion or pressureretouch to shape blades, blade-like flake blanks, and other types of small flake blanks. Theblanks they were made on were produced by percussion, and maximum point thickness wasdetermined by the core reduction strategy ([60]: 2617–2619). Retouching scars may overlap atthe distal ends of these points, but the original blank surfaces are rarely eliminated entirely,and pressure-shaping scars are small. In contrast, Group 2 points were made by a technicallycomplex sequence of percussion bifacial thinning which eliminated the original blank surfaces(and created a lenticular cross-section), followed by an equally complex sequence of invasiveand non-invasive pressure flaking, often producing large pressure flake scars in the early pres-sure flaking stages [42]. The excavated Gunu Cave point is a Group 1 variant. The pressureflakes identified in the assemblage average about 5.7 mm long and 5.1 mm wide; they are largerthan the flakes detached from most of the scars on the excavated Gunu Cave point, but aresmaller than the largest scar sizes on a broken Group 2 Kimberley Point recovered from thesurface at the rockshelter entrance (Fig 17B).
A relatively large quartz crystal assemblage was recovered from the Gunu Cave excavation.The approach to crystal reduction was the same as that documented for Gunu Rock. The sizesof the quartz crystal cores is similar in both assemblages, with relatively low CoVs for length(0.33), width (0.32), and thickness (0.35) (Table C in S4 Table). Six unmodified crystals arepresent in the two assemblages; these are, on average, smaller than the crystal cores. Crystalflake sizes do not differ significantly between the two assemblages (Table B in S5 Table), proba-bly because variation in size attributes was constrained by the small sizes of unmodified crys-tals. A small quartz crystal flake from Gunu Cave is stained by an unidentified residue on thedorsal surface (Fig 14A), and is damaged by use wear microflaking on the distal edge, showingthat despite their diminutive size, crystal flakes were used as tools without modification. Onebifacial nguni point was recovered from Gunu Cave at the Layer 2/3 interface (Fig 16D). Thewidths, thicknesses, and weights of the nguni points from the Gunu Site Complex are statisti-cally the same as the excavated quartz crystal early reduction flakes, but the nguni points aresignificantly longer (Table C in S5 Table) and were probably made the first flakes struck fromquartz crystal cores.
Other artefacts, Gunu Cave. The micaceous siltstone ochre outcropping in Gunu Cave isfriable, and exfoliated fragments cover the modern shelter floor. Small pieces of this pigment(measuring 3-5mm in maximum dimensions) were recovered throughout the deposit, averag-ing 2.4 g per spit. Fragments were concentrated in Layer 1, at the Layer 2/3 interface, and inthe roof-fall at the bottom of Layer 3. Two larger (>5 mm) siltstone pieces were recoveredfrom spits 5 and 12 (Table 6), and one shows minor striations and a flake scar from pigmentproduction (Fig 19G). Modified lateritic pieces from two sources—one a deflated pebble sur-face (Fig 19H), and the other occurring as flat slabs (Fig 19F)—were recovered from near thebottom of Layer 3, along with two pieces of soft, iron-rich oxidised sandstone (Fig 19I).
One small fragment of an unidentified resin, possibly related to tool hafting, was recoveredfrom the upper part of Layer 2 (Fig 22). A broken surface has exposed a glassy brown-colouredinterior, similar to plant resins. The resin was mixed with quartz sand and crushed shell. Eth-nographic accounts of resin manufacture in the historic period do not describe shell as a bind-ing agent.
Archaeology and art in context
PLOSONE | https://doi.org/10.1371/journal.pone.0226628 February 5, 2020 32 / 42

One grinding stone fragment, probably fractured by exposure to heat, was recovered fromthe upper part of Layer 3 (Fig 18D; Table B in S4 Table)
Discussion and conclusionsThree different quartz luminescence dating techniques—OSL single-aliquot (UVSA), OSL sin-gle-grain (UVSG) and red TL (RTL)—have been applied to this site to test the integrity of theluminescence signal (S2 Text, Table 1, Fig 9). Both the UVSA and RTL use multiple grains ineach aliquot and are usually much larger than the UVSG results. The multiple grains techniquesare thus interpreted as maximum ages due to an averaging effect compared to UVSG that iso-lates the dose history of individual grains. The results indicate that many of the quartz grainswere not fully reset before burial. This justifies the use of the single-grain minimum age model(UVSG MAM) for isolating the grains that have received the most sunlight ‘bleaching’ as repre-sentative of the last burial event. However, in this study the agreement (within errors) betweenthe red TL and SG-OSL results, which are at odds with the much larger single-aliquot results,indicates that quartz grains derived from roof spall with a large residual signal may be causingan overestimation in the single-aliquot age, as seen in Jinmium rockshelter [68]. This roofspall quartz does not contain an inherent red luminescence signal, hence the relative agree-ment with the SG-OSL age estimates.
O’Connell et al. [69] have raised concerns about the stratigraphic integrity of unconsoli-dated sand sheets in northern Australia, which are prone to disturbance by splash erosion, sub-surface lateral eluviation, soil creep and bioturbation by termites. Splash erosion andsubsurface eluviation result in sediment compaction from the removal of fine sediments, andsoil creep results in downslope movement proportional to the sine of the slope angle. Signifi-cant bioturbation by termites can produce shallow stone lenses through the removal of finesoil particles and downward movement of larger stones. When combined with soil creep andsubsurface eluviation, stone layers can form near the base of the sand deposit. The Gunu Rocksediments do not show evidence of compaction or substantial removal of silt/clay particles(Fig F in S1 Fig). The deposits behind the dripline are protected from splash erosion but, asdiscussed above, the sand sheet may have been affected by low-energy water flow behind thedripline when Layers 5 and 7 were exposed at the surface. The north-south slope of the sandsheet surface behind the sediment-damming sill at the dripline is 0.7% and the east-west slopefor the first 7 m beyond the sill is 5%, decreasing markedly towards the creekline. The flat sur-face behind the dripline and the basin-like contour of the underlying bedrock seem to precludesubstantial soil creep in the sampled part of the deposit. A termite colony was noted in the
Fig 22. Fragment of resin with embedded shell. Gunu Cave, Spit 4. Scale bar 5 mm.
https://doi.org/10.1371/journal.pone.0226628.g022
Archaeology and art in context
PLOSONE | https://doi.org/10.1371/journal.pone.0226628 February 5, 2020 33 / 42

cracks in the bedrock 2.5 m from the excavation, and a small number of organically-stainedactive termite runs were noted in the deposits up to 0.9 m deep, with most limited to the upper0.6 m. The colony was located inside a deep fissure in the bedrock and the insects had not builta sediment mound at the time of excavation. The stone lenses in Layers 5 and 7 at Gunu Rockare deeply buried, near the middle of the section rather than the base or top, include water-borne sand grains, are in a flat-lying sand sheet, and are covered by aeolean deposits, so low-energy water deflation seems a more parsimonious explanation for them than soil creep. Thecarbon and OSL age estimates, particle size, and magnetic susceptibility analysis suggest thatthe sand sheet is not significantly disturbed, although there is evidence for deflation by waterin Layers 5 and 7, and some bioturbation by termites in the upper part of the deposits.
The Gunu Rock excavation indicates a significant change in sedimentation before 10–12 ka(SG-OSL-RR1, SG-OSL-RR5). The sequence begins with erosion and redeposition of topsoil,followed by rapid aeolian deposition to about 7–8 ka (SG-OSL-RR2, SG-OSL-RR3), when arte-facts first appear. Pedogenesis implies stability in the sediment source area in the terminalPleistocene, and its erosion and redeposition points to significant environmental change in theEarly Holocene, perhaps associated with the re-establishment of the summer monsoon afterca. 14 ka [70]. Occupation began at Gunu Rock when a flat living surface was establishedthrough sand deposition against the cliff face. An earlier phase of occupation corresponds withat least two low-energy water deflation events, separated by aeolian deposition, between ca.7–8 (SG-OSL-RR2, SG-OSL-RR3) and 2.7 ka (SG-OSL-RR4). This was followed by aeoliandeposition at Gunu Rock from 2.7 ka. Sand deposition began in Gunu Cave ca. 2316–2679 calBP (Wk-28823), eventually covering the angular sandstone blocks and creating a flat livingsurface. This process was contemporary with a dune-forming event in the Kimberley to ca. 2.9ka and active coastal dune transgression after 2 ka [71]. The occupation inside Gunu Caveoccurred at the same time as the later phase of occupation at Gunu Rock.
The complete sequence of Kimberley art styles are represented at sites in the Gunu SiteComplex, suggesting significant time depth for human activities here. However, the earliestartefacts from the Gunu Rock sand sheet date to the Early Holocene, ca. 7–8 ka, and the arte-facts from Gunu Cave date to the Late Holocene, after ca. 2316–2679 cal BP (Wk-28823). Thisdisjuncture between the possible age of the earliest rock art in the Northwest Kimberley—which is earlier than 16 ± 1 ka in the Lawley River catchment [44]—and the maximum age ofrockshelter deposits, is a recurring pattern in the archaeology of the region (e.g., [24, 25]).However, sand sheets in the northern Australia formed at least 75–100 ka [40], and sand sheetsin the Northwest Kimberley may be good candidates for preserving evidence of early occupa-tion missing from the rockshelters.
The excavated cultural sequence documents a significant shift in stone preference. From ca.7–8 ka to 2.7 ka, the toolkit at Gunu Rock was composed mostly of local quartzite, but with fre-quent use of quartz crystal and metasedimentary stone. Quartzite was reduced opportunisti-cally throughout the Holocene to provide large flakes (struck off-site) and small flakes (struckon-site) for cutting tools and retouching, and, although sample sizes are low, reduction ofmetasedimentary stones appear to follow a similar approach. After 2.7 ka, quartz crystal domi-nates the Gunu assemblages, most likely collected from small localised pockets of unerodedlaterite, but perhaps carried in from more extensive sources elsewhere. Although the quartzcrystals were small, stoneworkers applied freehand percussion in a patterned sequence, andflakes struck early in crystal reduction provided blanks for crystal nguni points. Nguni pointspostdate 2679–2316 cal BP (Wk-28823) at Gunu Cave and 2488–3002 cal BP (OZC436) atDrysdale 3 ([72]:9–10), a broadly similar terminus post quem in the North Kimberley to thecrystal nguni-like point directly dated to 3160–2954 cal BP (SANU-39030) in the South Kim-berley [73]. Crystal nguni-like points postdate ca. 1000 cal BP at two other South Kimberley
Archaeology and art in context
PLOSONE | https://doi.org/10.1371/journal.pone.0226628 February 5, 2020 34 / 42

sites [74]; this and the occurrence of two nguni above the hearth dated to 933–1064 cal BP(Wk-28821) at Gunu Rock confirms Wunambal oral history that they persisted into the recentpast. The archaeological data suggest that a ‘gooseneck’-like weapon system, including the war-imi spearthrower and nguni spear, significantly predates the 1930s (however, see [55]: 3).
Historically in the North Kimberley, transparent quartz crystal ‘medicine’ (alumburru [75]:51) was associated with the snake Ungud ([76]: 349–350). In one ritual, Ungud scattered crys-tals in or around a waterhole, which were then collected and distributed to all those present;‘[e]verybody then receives some Ungud power’ ([75]: 53) (see also [77]: 143). The dramaticincrease in quartz crystal after 2700 BP in the Gunu Site Complex—seen most clearly at GunuRock—aligns chronologically with the transition to Wanjina-style motifs in the rock art [22,44, 49], and a preference for quartz crystal tools may be, along with Kimberley Point manufac-ture, a technological manifestation of the changing social relations seen with the advent of theWanjina belief system in the Northwest Kimberley [42].
Despite these patterns, the complete range of stone-working activities that occurred in theGunu Site Complex were not captured in the excavated assemblages. Group 1 points made onlarge macroblades were manufactured in the South Kimberley by ca. 5000 cal BP [74] and inthe Mitchell River catchment by ca. 2746–3145 cal BP (Wk-1615) at Ngurini [26]. Evidencefrom elsewhere in our project area shows that production of macroblade points continued tothe recent past, postdating 530–649 cal BP (Wk-29830) at Kangaroo Shelter in the MalauwarraSite Complex (Table 8). But although quartzite seams were extensively exploited for macro-blade production within 60 m of the Gunu excavations, debris from macroblade production isnot represented in the excavated assemblages. This reflects the nature of macroblademanufacturing technology, which was strongly tethered to stone sources across Northern Aus-tralia. Excavations in the South Kimberley date the origin of the pressure flaking technique toafter ca. 1400–1000 BP [74, 78], suggesting that the Group 2 (Kimberley Point) reductionsequence was also a late innovation. The Group 2 point reduction sequence is elaborate and, incontrast to macroblade production, stages of production were spatially segregated, with bifacethinning and pressure flaking occurring in various locations across the landscape [42]. Bifacethinning was occurring at the mouth of Gunu Cave, and high-quality quartzite was basin-quarried and reduced into bifaces on the top of the Gunu sandstone massif, but only one latestage biface thinning flake was recovered in the excavations, from Spit 1 at Gunu Rock, post-dating 933–1064 cal BP (Wk-28821). The final stage of production is represented by quartzitepressure flakes from Gunu Cave, postdating 2316–2679 cal BP (Wk-28823). Flakes struck inreworking basalt edge-ground axes were noted in surface artefact scatters within the Gunu SiteComplex, and this is another reduction sequence not present in the excavations. Aside fromopportunistic on-site reduction of small cores, only the quartz crystal nguni productionsequence is wholly represented in the excavated assemblages. These variations in the waysaspects of stone tool manufacture were distributed across the landscape—and their visibility tovarious audiences—is a manifestation of social display and communication [79, 80], and theintensive reduction of culturally important quartz crystal may be significant in this context.The restricted parts of the reduction sequences captured by the Gunu excavated samplesreflects the vagaries of limited sampling within this spatially complex and poorly understoodtechnological system, and the long-term changes occurring within it.
Modified ochre pigments, from multiple sources, are relatively common in the excavatedassemblages. Although relating excavated pigments to specific motifs can be problematic, thedating of the modified pieces at Gunu Rock suggest pigment production there was most com-mon between about 2.7 and 7–8 ka, with two pieces—including one from the mulberry pig-ment source inside Gunu Cave [34]—directly associated with the 8 ± 1 (SG-OSL-RR3) ageestimate. This may mean that at least some of the images on the wall above the excavation
Archaeology and art in context
PLOSONE | https://doi.org/10.1371/journal.pone.0226628 February 5, 2020 35 / 42

Table 8. Earliest dates for projectile points at North Kimberley sites.
Site Typology � Source Depth oflowest point
(s)
SampleProvenance
Labnumber
Sample,Method
δ 13C (%) 14C Age(years BP)
Age(cal BP,1σ)
Age(cal BP,2σ)
Gunu Rock Group 1,nguni(N = 1)
this paper Spit 2 Spit 3 Wk-28821
Charcoal,conventional
-25.9 ± 0.2 1142 ± 37 1055–1015(35.4%)995–959(32.8%)
1064–933(95.4%)
Gunu Cave Group 1,nguni(N = 1)
this paper Spit 8 Spit 16 Wk-28823
Charcoal, AMS -27.7 ± 0.2 2401 ± 34 2460–2380(23.7%)
2370–2320(44.5%)
2679–2641(4.3%)
2609–2601(0.6%)
2493–2316(90.5%)
Kangaroo Shelter,Malauwarra Site
Complex
Group 1,nguni,
macroblade(N = 3)
ms in prep Spit 6 Spit 6 (EU2) Wk-29830
Charcoal,conventional
-26.2 ± 0.2 628 ± 33 631–600(42.4%)565–546(25.8%)
649–585(56.9%)575–530(38.5%)
Brremangurey Shelter Group 1(N = 2) 1
ms in prep Spit 18(K26)
Spit 18 (K26) Wk-32409
Charcoal,conventional
-25 ± 0.2 3394 ± 25 3640–3560(66.3%)
3520–3525(1.9%)
3689–3662(7.3%)
3646–3546(72.5%)
3538–3481(15.6%)
Site 30BF01, BushSpirit Creek Site
Complex
Group 2,Kimberley
Point(N = 1) 2
Fig 12C in[42]
NA Surface insiderockshelter
Wk-40918
Resin, AMS -16.1 ± 0.2 164 ± 20 266–240(16.6%)231–221(5.8%)147–138(5.6%)114–102(7.2%)95–69(16.3%)24–0
(16.7%)
275–213(30.4%)153–131(9.2%)125–55(34.8%)45–0
(21.0%)
Ngurini Group 1,macroblade(N = 1)
Fig 11.4 in[26]: 199
Spit 10 Spit 10 Wk-1615
Charcoal,conventional
-25.6 2820 ± 90 2974–2772(68.2%)
3145–3090(4.2%)
3083–2746(91.2%)
Bangorono Group 1(N = 1)
Fig 11.3 in[26]: 303
Spit 8 Spit 9 WK-1617
Charcoal,conventional
-25.9 1510 ± 70 1419–1300(68.2%)
1525–1275(95.4%)
Wundalal Group 1,Nguni(N = 1)
Fig 11.3 in[26]: 266
Spit 7 Spit 10 Wk-1616
Charcoal,conventional
-25.9 3560 ± 110 3963–3948(2.6%)
3928–3680(60.1%)
3670–3642(5.4%)
4142–4127(0.6%)
4093–3556(93.5%)
3532–3495(1.3%)
Drysdale 3 Group 1,Nguni(N = 1)
Fig 30 in[24], [72]:
9–10
Spit 17 Spit 17 (F5d) OZC436 Charcoal,conventional
Notreported
2710 ± 90 2923–2905(3.2%)
2891–2717(65%)
3002–2488(95.4%)
Radiocarbon dates were calibrated with OxCal 4.3.2 [50] using ShCal 13, the southern hemisphere atmospheric carbon calibration curve [51]. The dates are a terminuspost quem for the appearance of points at these sites, although associations vary between artefacts and radiocarbon sample locations.� Technological groupings after ([42]:937–938).1 Two point fragments recovered within a charcoal-rich cooking feature dug into a sand layer underneath a midden deposit. At present this is the most secure date forthe appearance of points in the North Kimberley.2 AMS date acquired from resin adhering to base of point illustrated in Fig 12C in [42].
https://doi.org/10.1371/journal.pone.0226628.t008
Archaeology and art in context
PLOSONE | https://doi.org/10.1371/journal.pone.0226628 February 5, 2020 36 / 42

were created in this time period, and it also demonstrates that Aboriginal people were produc-ing mulberry pigment from this source by 8 ka. The discovery of white clay pigment at GunuRock suggests that pigment colours were used that are no longer evident on the adjacent artpanels.
The most intensive ritual use of the Gunu Site Complex, as measured by number of artsites, occurred during the Gwion Period (19 sites; Table F in S1 Table). If, as seems likely, theorigin of Gwion figures predates the terminal Pleistocene [44, 48], this early art phase occurredearlier than the basal dates obtained from both excavations. While the people who producedthe Gwion figures probably lived in the immediate vicinity of the art sites, evidence for occupa-tion was not captured in the excavations. This is likely because flat surfaces suitable for occupa-tion at this early period were not available in the tested locations: our results suggest that thefloor of Gunu Cave was covered by sandstone rubble and the surface at Gunu Rock was a deepcavity between bedrock exposures. Earlier occupation may have been on the open sandsheetaway from the cliff wall, or perhaps on horizontal bedrock surfaces within the cave. Paintingactivity continued through the Wararrajai Gwion Period (12 sites) and Painted Hand Period(12 sites), culminating in the Wanjina Period (15 sites), and the excavated assemblages spanthese artistic transitions, from 8 ka. There is no evidence of Wanjina Period motifs on thepanel immediately adjacent to the excavation at Gunu Rock, which may account for theabsence of modified ochre in the upper layers of the deposit. The pigments recovered at GunuRock are likely associated with the Dynamic/Wararrajai Gwion and Painted Hand periods. Incontrast to the art at Gunu Rock, Classic Wanjina motifs are the dominant style in Gunu Cave,and are painted (and overpainted) on the large flat ceiling and wall panels. Stylistic variation inthe wayWanjina motifs are depicted is evident within Gunu Cave and elsewhere in the GunuSite Complex. The ochre pieces recovered from the excavation in Gunu Cave, postdating2679–2316 cal BP (Wk-28823), are likely associated with pigment production during the War-arrajai Gwion, Painted Hand, and/or Wanjina periods of rock art production.
The chronologically early Irregular Infill Animal Period art style in the Kimberley, whichoccurs in the Gunu Rock Complex, has stylistic similarities with rock art in Island SoutheastAsia dating to more than 40 ka [9, 81]. This may be evidence for social contact back throughWallacea, perhaps from the outset of colonisation of Australia at 65 ka [82]. As the earliestclear evidence for modern abilities at enhanced working memory [83, 84], the colonisation ofAustralia is one of the most significant events in recent human evolution. Regionalisation sub-sequently emerged as climate shifted into the Last Glacial Maximum and populations movedinto well-watered refugia, including the Kimberley. Our work in the Gunu Site Complex docu-mented major Holocene innovations in stone tool technology occurring alongside stylisticchanges in the rock art. Given the timing of the technological innovations, and the prominentrole of stone technology in social signalling [42, 85], these changes are likely linked manifesta-tions of major post-LGM economic adjustments to rising sea levels and a changing ecosystemacross the Mitchell Plateau and adjoining Admiralty Gulf. Our excavation results show thatdeveloping a complete understanding of the patterns in the Northwest Kimberley requiresintensive archaeological survey of the landscapes of stone technology and rock art, combinedwith paired excavations in the deposits inside and sandsheets outside of the rockshelters thatdominate the region.
Supporting informationS1 Text. Kandiwal Aboriginal Corporation statement.(DOCX)
Archaeology and art in context
PLOSONE | https://doi.org/10.1371/journal.pone.0226628 February 5, 2020 37 / 42

S2 Text. Analytical methods.(DOCX)
S3 Text. Physiochemical Analysis of Pigments.(DOCX)
S1 Fig. Overview photos and particle size analysis graphs.(PDF)
S1 Table. Sample analysis results, Gunu Rock and Gunu Cave.(DOCX)
S2 Table. Stone artefact data, Gunu Rock.(DOCX)
S3 Table. Stone artefact and organics/bone data, Gunu Cave.(DOCX)
S4 Table. Stone artefact data, Gunu Rock and Gunu Cave.(DOCX)
S5 Table. Results of statistical comparisons, stone artefact attributes, Gunu Rock andGunu Cave.(DOCX)
AcknowledgmentsThe excavation and recording field team included MWM, JR, KN, YP, MJM; Cathy, Gavin,Greg, John and Myron Goonack; Joseph Karadada (Kandiwal Aboriginal Corporation); JohnHayward (Western Australian Department of Environment and Conservation); Deb Holt, DiEngland, Murray Scown, Robin Maher, Alistair Patterson, and Corili Souter. Dean Flemingcollected the particle size and magnetic susceptibility data and Robert Heyworth interpretedthe results. Wendy Beck sorted the organic material from Gunu Cave. Meg Travers createdand analysed the rock art database. The luminescence dating aspects of this research were con-ducted by KW at Traps MQ Luminescence Dating Facility. SEM analyses of pigments wereconducted by JH at the Australian Centre for Microscopy and Microanalysis, University ofSydney; and diffractometry at the Electron Microscope and X-Ray Unit, University of Newcas-tle. We thank Kim Akerman for supplying a comparative huntite sample fromMowanjum,and for providing insightful comments on our field observations.
Author ContributionsConceptualization:Mark W. Moore, Kira Westaway, June Ross, Michael J. Morwood.
Data curation:Mark W. Moore, Kira Westaway, June Ross, Jillian Huntley.
Formal analysis:Mark W. Moore, Kira Westaway, June Ross, Kim Newman, Yinika Perston,Jillian Huntley, Samantha Keats.
Funding acquisition:Mark W. Moore, Kira Westaway, June Ross, Jillian Huntley, Michael J.Morwood.
Investigation:Mark W. Moore, Kira Westaway, June Ross, Kim Newman, Yinika Perston, Jil-lian Huntley, Samantha Keats, Michael J. Morwood.
Archaeology and art in context
PLOSONE | https://doi.org/10.1371/journal.pone.0226628 February 5, 2020 38 / 42

Methodology:Mark W. Moore, Kira Westaway, June Ross, Kim Newman, Yinika Perston, Jil-lian Huntley, Samantha Keats, Michael J. Morwood.
Project administration:Mark W. Moore, Kira Westaway, June Ross, Michael J. Morwood.
Resources:Mark W. Moore, Kira Westaway, June Ross, Jillian Huntley, Michael J. Morwood.
Supervision:Mark W. Moore, June Ross.
Validation:Mark W. Moore, Kira Westaway, June Ross, Jillian Huntley, Samantha Keats.
Visualization:Mark W. Moore, Kira Westaway, June Ross, Kim Newman, Yinika Perston, Jil-lian Huntley.
Writing – original draft:Mark W. Moore, Kira Westaway, June Ross, Jillian Huntley,Samantha Keats.
References1. MorwoodMJ. Archaeology of the Kimberley, Northwest Australia. In Clement C, Gresham J, McGla-
shan H, editors. Kimberley history, people, exploration and development. Perth: Kimberley Society;2010. pp. 24–39.
2. ClarksonC, Jacobs Z, Marwick B, Fullagar R, Wallis L, Smith M, et al. Human occupation of northernAustralia by 65,000 years ago. Nature. 2017; 547: 306–310. https://doi.org/10.1038/nature22968PMID: 28726833
3. Bird MI, BeamanRJ, Condie SA, Cooper A, Ulm S, Veth P. Palaeogeography and voyagemodellingindicates early human colonization of Australia was likely from Timor-Roti. Quater Sci Rev. 2018; 191:431–439.
4. Bird MI, Condie SA, O’Connor S, O’Grady D, Reepmeyer C, Ulm S, et al. Early human settlement ofSahul was not an accident. Sci Rep. 2019; https://doi.org/10.1038/s41598-019-42946-9 PMID:31209234
5. Westaway MC. The first hominin fleet. Nature Ecol and Evol. 2019; https://doi.org/10.1038/s41559-019-0928-9 PMID: 31209288
6. Maloney T, O’Connor S, Wood R, Aplin K, Balme J. 2018 CarpentersGap 1: A 47,000 year old recordof indigenous adaption and innovation. Quater Sci Rev 2018; 191: 204–228.
7. O’Connor S, Maloney T, Vannieuwenhuyse D, Balme J, Wood R. Occupation at Carpenter’s Gap 3,WindjanaGorge, Kimberley, Western Australia. Austral Archaeol. 2014; 78: 10–23.
8. Wood R, Jacobs Z, Vannieuwenhuyse D, Balme J, O’Connor S, Whitau R. Towards an accurate andprecise chronology for the colonization of Australia: the example of Riwi, Kimberley, Western Australia.PloSOne. 2016; https://doi.org/10.1371/journal.pone.0160123 PMID: 27655174
9. Aubert M, Setiawan P, Oktaviana AA, BrummA, Sulistyarto PH, SaptomoEW, et al. Palaeolithic caveart in Borneo. Nature. 2018; 564: 254–257. https://doi.org/10.1038/s41586-018-0679-9 PMID:30405242
10. Tacon PSC, Tan NH, O’Connor S, Xueping J, Gang L, Curnoe D, et al. The global implications of theearly surviving rock art of greater Southeast Asia. Antiquity. 2014; 88: 1050–1064.
11. Veth P. Islands in the interior: the dynamics of prehistoric adaptationswithin the arid zone of Australia.Ann Arbor: InternationalMonographs in Prehistory; 1993.
12. Williams AN, Ulm S, Cook AR, LangleyMC, CollardM. Human refugia in Australia during the last glacialmaximum and terminal Pleistocene: a geospatial analysis of the 25–12 ka Australian archaeologicalrecord. J Archaeol Sci. 2013; 40: 4612–4625.
13. MorwoodMJ. Visions from the past: the archaeology of Australian Aboriginal art. Crows Nest: Allen &Unwin; 2002.
14. Balme J, O’Connor S. Rock art and continuity in the south central Kimberley region of Western Austra-lia. In Lal Malla B, editor. Rock Art Studies Volume II: Interpretation throughmultidisciplinaryapproaches. NewDehli: Aryan Books International; 2014. pp. 19–42.
15. Travers M, Ross J. Continuity and change in the anthropomorphic figures of Australia’s northwest Kim-berley. Austral Archaeol. 2016; 82(2): 148–167.
16. Blundell V, Woolagoodja D. Keeping theWandjinas Fresh: SamWoolagoodja and the Enduring Powerof Lalai. Freemantle: Fremantle Press; 2005.
Archaeology and art in context
PLOSONE | https://doi.org/10.1371/journal.pone.0226628 February 5, 2020 39 / 42
17. Akerman K. Wanjina: Notes on some iconic ancestral beings of the Northern Kimberley. Carlisle: Hes-perian Press; 2016.
18. Maloney T, O’Connor S, Wood R, Aplin K, Balme J. 2018 CarpentersGap 1: A 47,000 year old recordof indigenous adaption and innovation. Quater Sci Rev 2018; 191: 204–228.
19. Dilkes-Hall IE, O’Connor S, Balme J. People-plant interaction and economic botany over 47,000 yearsof occupation at Carpenter’s Gap 1, south central Kimberley. Austral Archaeol. 2019; 85(1): 30–47.
20. O’Connor S. 30,000 years of Aboriginal occupation: Kimberley, NorthWest Australia. Canberra: TerraAustralis 14; 1999.
21. Crawford IM, Vinnicombe P, Troilett G. The Mitchell Plateau Aboriginal Sites Survey. Report to theMitchell Plateau Bauxite Company and Aborigines of Mowanjum and Kalumburu. Perth: Western Aus-tralianMuseum; 1982.
22. David B, Delannoy J-J, Petchey F, Gunn R, Huntley J, Veth P, et al. Dating painting events through by-products of ochre processing: Borologa 1 Rockshelter, Kimberley, Australia. Austral Archaeol. 2019;85: 57–94.
23. Dortch C. 1977. Early and late industrial phases inWestern Australia. InWright RVS, editor. StoneTools as Cultural Markers. Canberra: Australian Institute of Aboriginal Studies; 1977. pp. 104–132.
24. MorwoodMJ, HobbsD. The archaeologyof Kimberley art. InWalshGL, editor. Bradshawart of the Kim-berley. Toowong: Takarakka Nowan Kas Publications; 2000. pp. 34–37.
25. Veitch B. Evidence for mid-Holocene change in the Mitchell Plateau, Northwest Kimberley, WesternAustralia. In Veth P, Hiscock P, editors. Archaeology of Northern Australia. Brisbane: AnthropologyMuseum, University of Queensland, Tempus 4; 1996. pp. 66–89.
26. Veitch B. What happened in the mid-Holocene? Archaeological evidence for change from the MitchellPlateau, Northwest Kimberley, Western Australia. PhD thesis. Perth: University of Western Australia;1999.
27. Crawford IM. The art of theWandjina: Aboriginal cave paintings in the Kimberley. Melbourne: OxfordUniversity Press; 1968.
28. Crawford IM. The relationship of Bradshaw andWandjina art in north-west Kimberley. In Ucko PJ, edi-tor. Form in Indigenous art: schematization in the art of Aboriginal Australia and prehistoric Europe.Canberra: Australian Institute of Aboriginal Studies; 1977. pp. 357–369.
29. Walsh G. Bradshaws: ancient rock paintings of north-west Australia. Carouge-Geneva: Edition Lim-itee; 1994.
30. Welch DM. Stylistic change in Kimberley rock art, Australia. In Lorblanchet M, Bahn PG, editors. Rockart studies: the post-stylistic era, or where do we go from here? Oxford: OxbowMonograph 35;1993. pp. 99–113.
31. DonaldsonM. Kimberley rock art volume one: Mitchell Plateau area, Perth: Wildrocks Publications;2012.
32. Wilson I. Lost world of the Kimberley. Crows Nest: Allen and Unwin; 2006.33. Welch DM. Oh dear! No deer! Rock Art Research. 2012; 29(2): 171–177.34. Huntley J, Aubert M, Ross J, Brand HEA, MorwoodMJ. One colour (at least) twominerals: a study of
mulberry rock art pigment and a mulberry pigment ‘quarry’ from the Kimberley, Northern Australia.Archaeometry. 2015; 57(1): 77–99.
35. Ross J, Travers M. ‘Ancient mariners’ in Northwest Kimberley rock art: an analysis of watercraft andcrew depictions. The Great Circle. 2013; 34(2): 55–82.
36. NewmanK. Bedrock flaking in the North Kimberley in cultural perspective. MSci thesis. Armidale: Uni-versity of New England; 2017.
37. Hutchison D. Identifying bottles. In BirminghamJ, Bairstow D, editors. Papers in Australian historicalarchaeology. Sydney: Australian Society for Historical Archaeology; 1987. pp. 153–164.
38. Lockhart B. The color purple: Dating solarized amethyst container glass. Historical Archaeol. 2006; 40(2): 45–56.
39. Roberts RG, MorwoodMJ, Westaway KE. Illuminating Southeast Asian prehistory: new archaeologicaland paleoanthropological frontiers for luminescence dating. Asian Perspec. 2005; 44:293–319.
40. Ward IAK, Fullagar RLK, Boer-Mah T, Head LM, Tacon PSC, MulvaneyK. Comparison of sedimenta-tion and occupation histories inside and outside rock shelters, KeepRiver Region, Northwestern Austra-lia. Geoarchaeol. 2006; 21(1): 1–27.
41. MooreMW, Sutikna T, Jatmiko, MorwoodMJ, BrummA. Continuities in stone flaking technology atLiang Bua, Flores, Indonesia. J HumEvol. 2009; 57: 503–526. https://doi.org/10.1016/j.jhevol.2008.10.006 PMID: 19361835
Archaeology and art in context
PLOSONE | https://doi.org/10.1371/journal.pone.0226628 February 5, 2020 40 / 42

42. MooreMW. Bifacial flintknapping in the Northwest Kimberley, Western Australia. J Archaeol Methodand Theory. 2015; 22: 913–951.
43. Chalmin E, Huntley J. Characterizing rock art pigments. In David B, andMcNiven IJ, editors. The Oxfordhandbook of the archaeology and anthropology of rock art. Oxford: Oxford University Press; 2018. pp.885–910.
44. Ross J, Westaway K, Travers M, MorwoodMJ, Hayward J. Into the past: a step towards a robust Kim-berley rock art chronology. PLoSOne. 2016: https://doi.org/10.1371/journal.pone.0161726PMID:27579865
45. Travers M, Ross J. The shifting function of artefacts in Australia’s northwest Kimberley rock art assem-blage. The Artefact. 2015: 8–26.
46. Walsh GL, editor. Bradshaw art of the Kimberley. Toowong: Takarakka NowanKasPublications; 2000.47. Aubert M. 2012 A review of rock art dating in the Kimberley, Western Australia. J of Archaeol Sci. 2012;
39: 573–577.48. Roberts RG,Walsh GL, Murray A, Olley J, Jones R, MorwoodMJ, Tuniz C, Lawson E, Macphail M,
Bowdery D, Naumann I. Luminescence dating of rock art and past environments usingmud-wasp nestsin northern Australia. Nature 1997; 387: 696–699.
49. MorwoodMJ, Watchman AL,Walsh GL. AMS radiocarbon ages for beeswax and charcoal pigments inNorth Kimberley rock art. Rock Art Research. 2010; 27(1): 3–8.
50. Bronk Ramsey C. Methods for summarizing radiocarbon datasets. Radiocarbon. 2017; 59(2): 1809–1833.
51. Hogg AG, Hua Q, Blackwell PG, NiuM, Buck CE, Guilderson TP, et al. SHCal13 southern hemispherecalibration, 0–50,000 years cal BP. Radiocarbon. 2013; 55(4): 1889–1903.
52. LibbyWG. Thin sections of five artefacts from the Kimberley area. Petrological report no. 1558. Perth:Western Australia Geological Survey; 1990.
53. Elkin AP. Pressure flaking in the northern Kimberley, Australia. Man. 1948; 130: 110–113.54. Akerman K, Fullagar R, van Gijn A. Weapons and wunan: production, function and exchange of Kimber-
ley Points. Austral Aboriginal Studies. 2002; 1: 13–46.55. Akerman K. Contemporary changes in the construction of a Northern Australian form of spearthrower.
The Beagle. 1996; 13: 1–8.56. Allen H, Akerman K. Innovation and change in northern Australian Aboriginal spear technologies: the
case for reed spears. Archaeol in Oceania. 2015; 50 (Supp): 83–93.57. Hughes SS. Getting to the point: evolutionary change in prehistoric weaponry. J Archaeol Method and
Theory. 1998; 5(4): 345–408.58. Shea JJ. The origins of lithic projectile point technology: evidence from Africa, the Levant, and Europe.
J of Archaeol Sci. 2006; 33: 823–846.59. Maloney T, O’Connor S. Backed points in the Kimberley: revisiting the north-south division for backed
artefact production in Australia. Austral Archaeol. 2014; 79: 146–155.60. NewmanK, MooreMW. Ballistically anomalous stone projectile points in Australia. J Archaeol Sci.
2013; 40: 2614–2620.61. Eerkens JW, Bettinger RL. Techniques for assessing standardization in artifact assemblages: can we
scalematerial variability? Am Antiq. 2001; 66(3): 493–504.62. Hiscock P. Standardised axemanufacture at Mount Isa. In Macfarlane I, MountainM-J, Paton R, edi-
tors. Many exchanges: archaeology, history, community, and the work of Isabel McBryde, pp. 287–300.Canberra: Aboriginal History Monograph 11, Australian National University; 2005. pp. 287–300.
63. Clarke J. Two Aboriginal rock art pigments fromWestern Australia: their properties, use and durability.Studies in Conservation. 1976; 21: 134–142.
64. Crawford IM. We won the victory: Aborigines and outsiders on the north-west coast of the Kimberley.Fremantle: Fremantle Arts Center Press; 2001.
65. Huntley J, Brand HEA, Aubert M, MorwoodMJ. The first Australian synchrotron powder diffraction anal-ysis of pigment from aWandjina motif in the Kimberley,Western Australia. Austral Archaeol. 2014; 78:33–38.
66. Thomas AM. 1998. Spit of the Serpent: an ethnographic and scientific analysis of white pigments usedinWandjina rock art. Kimberleys, Western Australia. BA Hons thesis. Armidale: University of NewEngland; 1998.
67. Watchman A. Kimberley paint and accretion compositions. Canberra: Australian Institute of Aboriginaland Torres Strait Islander Studies; 1997.
Archaeology and art in context
PLOSONE | https://doi.org/10.1371/journal.pone.0226628 February 5, 2020 41 / 42

68. Roberts RG, Galbraith RF, Olley JM, YoshidaH, Laslett GM. Optical dating of single andmultiple grainsof quartz from Jinmium rock shelter, northern Australia: part II, results and implications. Archaeometry.1999; 41(2): 365–395.
69. O’Connell JF, Allen J, WilliamsMAJ, Williams AN, Turney CSM, Spooner NA, et al. When didHomosapiens first reach Southeast Asia and Sahul?, supplementary information. Proc Natl Acad Sci. 2018;115(34): 8482–8490. https://doi.org/10.1073/pnas.1808385115PMID: 30082377
70. Wyrwoll K-H, Miller GH. Initiation of the Australian summer monsoon 14,000 years ago. Quater Int.2001; 83–85: 119–128.
71. Reeves JM, Bostock HC, Ayliffe LK, Barrows TT, De Deckker P, Devriendt LS, et al. Palaeoenviron-mental change in tropical Australasia over the last 30,000 years–a synthesis by the OZ-INTIMATEgroup. Quater Sci Rev. 2013; 74: 97–114.
72. MorwoodMJ. Preliminary report on archaeological fieldwork in the North Kimberley,W.A., 1994–1996.Armidale: University of New England; 1997.
73. Maloney T, Wood R, O’Connor S, Whitau R. Direct dating of resin hafted point technology in Australia.Austral Archaeol. 2015; 81: 35–43.
74. Maloney T, O’Connor S, Balme J. New dates for point technology in the Kimberley. Archaeol in Ocea-nia. 2014; 49:137–147.
75. Lommel A. The Unambal: a tribe in Northwest Australia. Translation of Lommel A. 1952. Die Unambal:ein stamm in Nordwest-Australien. Carnarvon Gorge: Takarakka Nowan Kas Publications; 1997.
76. Elkin AP. The rainbow-serpent myth in North-west Australia. Oceania. 1930; 1(3): 349–352.77. Elkin AP. Aboriginal men of high degree, second ed. St Lucia: University of QueenslandPress; 1977.78. HarrisonR. Archaeology and the colonial encounter: Kimberley spear points, cultural identity andmas-
culinity in the north of Australia. J Social Archaeol. 2002; 2(3): 352–377.79. Tostevin GB. Social intimacy, artefact visibility and acculturation models of Neanderthal—modern
human interaction. In Mellars P, Boyle K, Bar-Yosef O, Stringer C, editors. Rethinking the human revo-lution: new behavioural and biological perspectives on the origin and dispersal of modern humans.Cambridge: McDonald Institute Monographs; 2007. pp. 341–357.
80. Tostevin GB. Levels of theory and social practice in the reduction sequence and chaıne operatoiremethods of lithic analysis. PaleoAnthropol. 2011: 351–375.
81. Aubert M, BrummA, Ramli M, Sutikna T, Saptomo EW, Hakim B, et al. Pleistocene cave art from Sula-wesi, Indonesia. Nature. 2014; 514: 223–227. https://doi.org/10.1038/nature13422PMID: 25297435
82. Aubert M, BrummA, Tacon PSC. The timing and nature of human colonization of Southeast Asia in theLate Pleistocene. Curr Anthropol. 2017; 58: S553–S556.
83. Davidson I. The colonization of Australia and its adjacent islands and the evolution of modern cognition.Curr Anthropol. 2010; 51: S177–S189.
84. Wynn T, Coolidge FL. Archaeological insights into hominin cognitive evolution. Evol Anthropol. 2016;25: 200–213. https://doi.org/10.1002/evan.21496PMID: 27519459
85. MooreMW. Simple stone flaking in Australasia: patterns and implications. Quater Int. 2013; 285: 140–149.
Archaeology and art in context
PLOSONE | https://doi.org/10.1371/journal.pone.0226628 February 5, 2020 42 / 42