arctic engineering module 5a - university of alaska...
TRANSCRIPT

Arctic Engineering Module 5a
Page 1 of 30
Slide script
Hello. This is Hannele Zubeck. In this module, we first review some basic material from soil mechanics and extend that information to frozen ground. To keep the file size manageable, I try not to read all the material from the slides, but rather try to provide some additional insight when needed. So, listen or read the narration, and then study the slide at your own speed.

Arctic Engineering Module 5a
Page 2 of 30
Slide script
Our learning objectives for this module are first we try to understand the frozen ground thermal regime and describe the terrain features in permafrost area. List the engineering considerations in cold regions due to frozen ground. Review soil classification and weight-volume relationhips. Estimate soil volume changes as the soil water freezes.

Arctic Engineering Module 5a
Page 3 of 30
Slide script
State requirements for excessive frost heave. List remediation methods for frost heave and thaw weakening. Estimate soil frost susceptibility. Estimate thaw settlement. Estimate the thermal and mechanical soil properties. State basics for foundation design.

Arctic Engineering Module 5a
Page 4 of 30
Slide script
Let's have a look at some principles of soil freezing. The slide gives rules of thumb for frozen ground to occur. The ground temperatures are often plotted on so called trumpet curve that shows the minimum and maximum annual temperatures, the current temperature, geothermal gradient and shows the depth of the perennially frozen ground, or permafrost.

Arctic Engineering Module 5a
Page 5 of 30
Slide script
The whiplash curves that are temperatures at a given time lash all over the shaded area with time. The left and rightmost points that the whiplash curve touches are then the minimum and maximum temperatures with depth. The point at which the temperature does not change with time is called the zero temperature fluctuation or the zero temperature amplitude sometimes. Temperature warms gradually with depth that gives the geothermal gradient. Active layer is the zone where the ground temperature fluctuates above freezing in the permafrost area and below freezing in the seasonal frost area. By definition permafrost is frozen ground with temperature less than 0 degrees Celsius for at least two winters and the consecutive summer.
Arctic Engineering Module 5a
Page 6 of 30
Slide script
Frozen ground is divided into seasonally and perennially frozen ground. Some issues apply for both cases and some don't, and therefore it is important to know, what kind of frozen ground is considered. This arbitrary division is given as a definition, but not much used in the practice.

Arctic Engineering Module 5a
Page 7 of 30
Slide script
Definitions for active layer and permafrost are given. Note that the active layer applies for both seasonally and perennially frozen ground. As you can see, permafrost is a significant issue for several Northern regions.

Arctic Engineering Module 5a
Page 8 of 30
Slide script
This map created at the Alaska Engineering Design Information System and it shows the distribution of permafrost in Alaska.

Arctic Engineering Module 5a
Page 9 of 30
Slide script
This schematic picture gives an idea of the cross-section of the permafrost in Alaska.

Arctic Engineering Module 5a
Page 10 of 30
Slide script
Let's now have a look at Permafrost Terrain Features. First of all, ice wedges are initiated by thermal cracking of frozen soil. The cracks fill with water in summer that freezes in winter, expands 9%, and cracks due to thermal stressing. The cycle repeats itself anually, and thick wedges form. And in this picture there is a side view of an ice wedge in permafrost tunnel. A link is provided in the end of this presentation for more information on this very interesting Permafrost tunnel near Fairbanks.
Arctic Engineering Module 5a
Page 11 of 30
Slide script
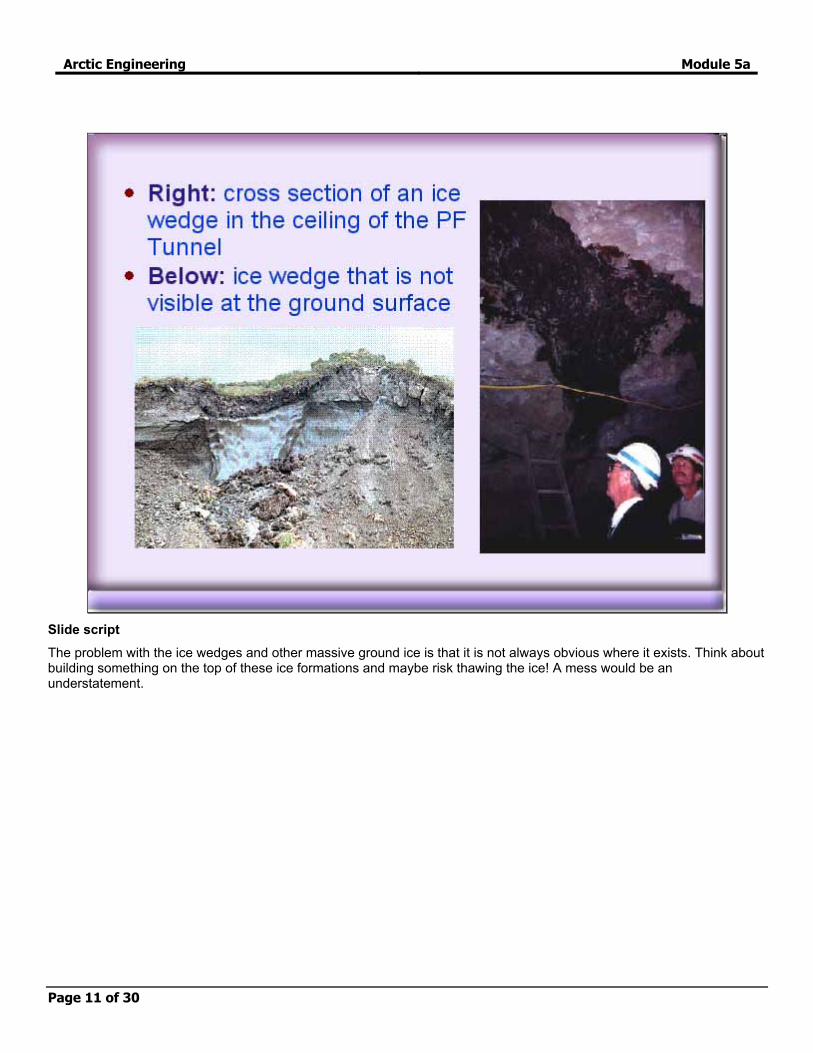
The problem with the ice wedges and other massive ground ice is that it is not always obvious where it exists. Think about building something on the top of these ice formations and maybe risk thawing the ice! A mess would be an understatement.

Arctic Engineering Module 5a
Page 12 of 30
Slide script
These photos were taken from an airplane flying across the tundra. As you can see again building any kind of infrastructure on this type of ground is very challenging.

Arctic Engineering Module 5a
Page 13 of 30
Slide script
These photos were taken from an airplane flying across the tundra. As you can see again building any kind of infrastructure on this type of ground is very challenging.
Arctic Engineering Module 5a
Page 14 of 30
Slide script
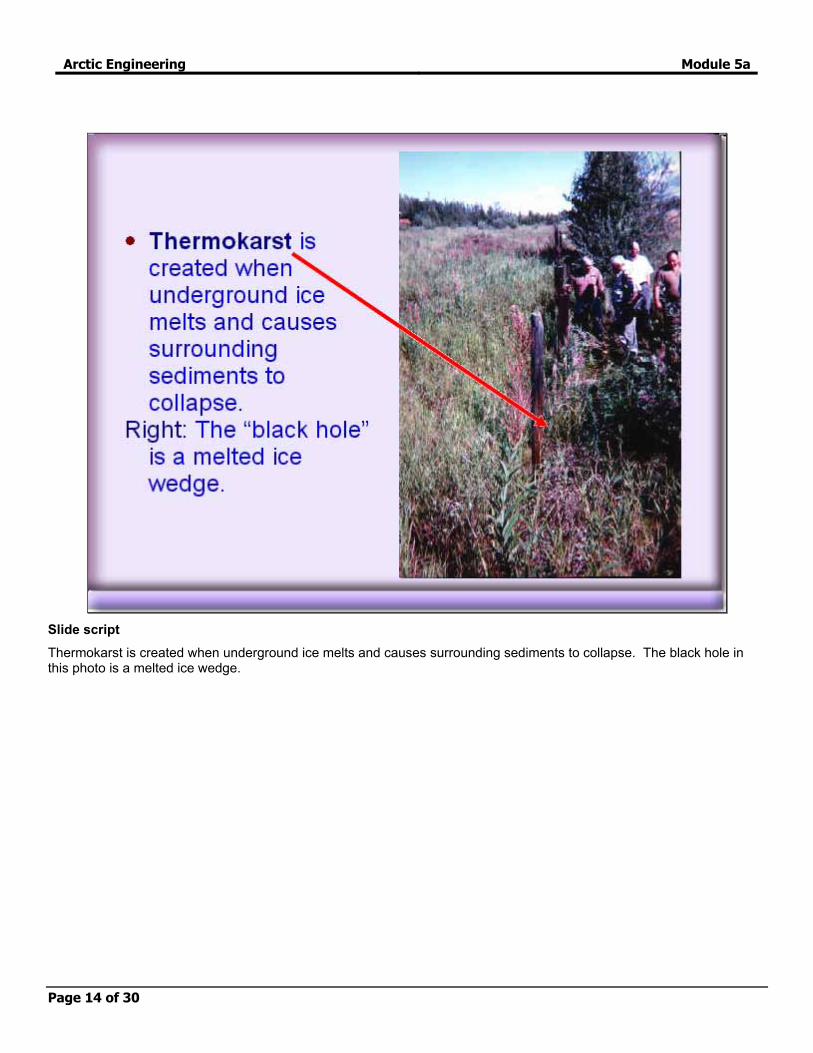
Thermokarst is created when underground ice melts and causes surrounding sediments to collapse. The black hole in this photo is a melted ice wedge.
Arctic Engineering Module 5a
Page 15 of 30
Slide script
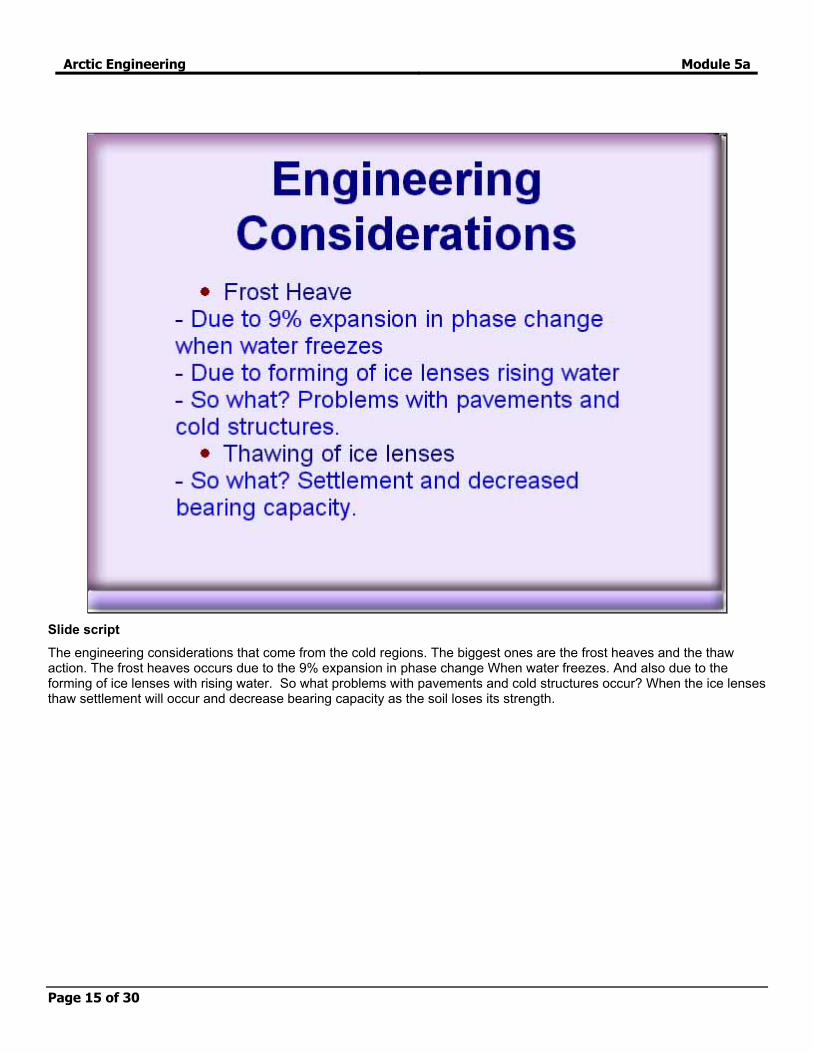
The engineering considerations that come from the cold regions. The biggest ones are the frost heaves and the thaw action. The frost heaves occurs due to the 9% expansion in phase change When water freezes. And also due to the forming of ice lenses with rising water. So what problems with pavements and cold structures occur? When the ice lenses thaw settlement will occur and decrease bearing capacity as the soil loses its strength.

Arctic Engineering Module 5a
Page 16 of 30
Slide script
In civil engineering, two soil classification systems are typically used: AASHTO and Unified Soil Classification system. AASHTO is used with highway materials and USCS is used with geotechnical projects. Both systems are based on gradation and plasticity. Frozen ground engineering uses the USC system.
Arctic Engineering Module 5a
Page 17 of 30
Slide script
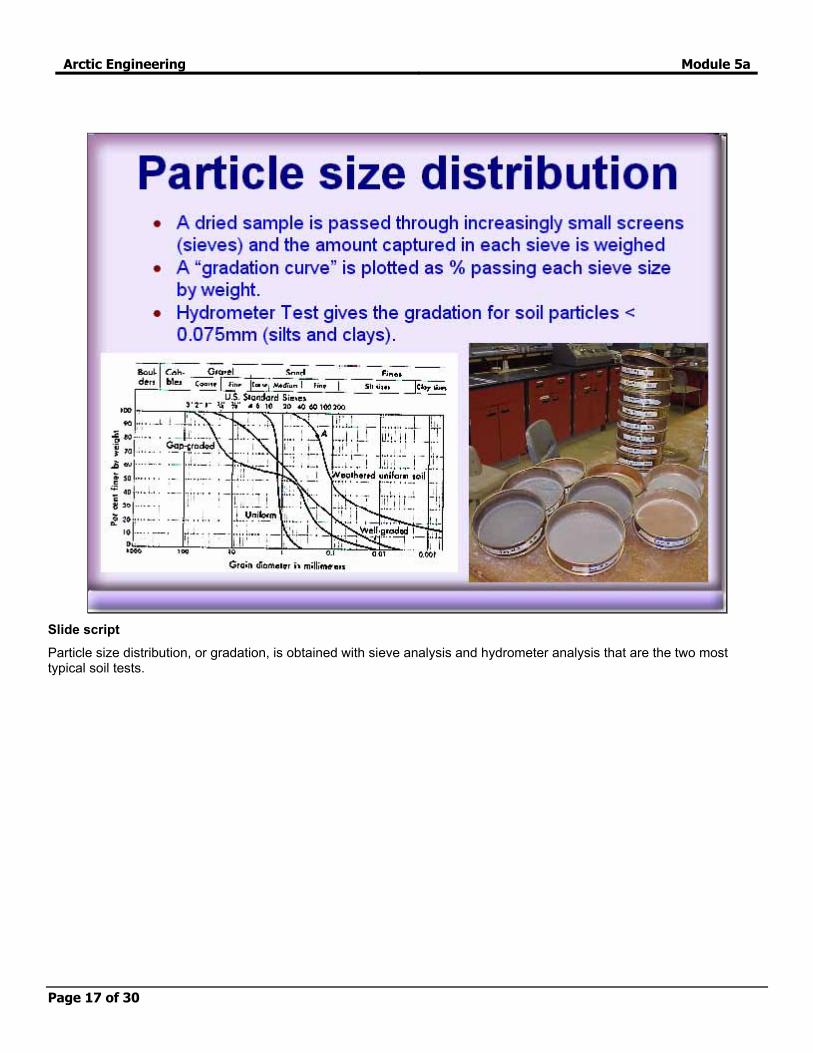
Particle size distribution, or gradation, is obtained with sieve analysis and hydrometer analysis that are the two most typical soil tests.

Arctic Engineering Module 5a
Page 18 of 30
Slide script
Plasticity describes the consistency and moldability of fine grained soils. Atterberg limits (ASTM D), Shrinkage (SL), plastic (PL) and liquid limit (LL), are water contents at which soil changes from solid to semi-solid, from semi-solid to plastic and finally from plastic to liquid respectively. Plasticity index is defined as PI= LL-Pl. LL and PI are plotted in Plasticity Chart (see any geotechnical text). The location of the plotted point together with the grain size distribution classifies the soil.

Arctic Engineering Module 5a
Page 19 of 30
Slide script
This slide gives the sizes of the main soils cobbles and boulders, gravel, sand and silt and clay. It also shows typical soil classes within the main categories. See the letter symbols G for gravel, W for well graded and so on. This presentation is only an introduction to soil classification. To really classify soils, see any geotechnical introductory text.

Arctic Engineering Module 5a
Page 20 of 30
Slide script
Weight-Volume Relationships they are very important for many things and here for frost heave calculations. The three phases in a soil sample are solid, liquid and gas. And in the case of soil those are soil solids, water and air. So the phase diagrams separates the phases for the relationship calculations.

Arctic Engineering Module 5a
Page 21 of 30
Slide script
Familiarize yourself with the phase diagram. Note that the unit weight of water is a known variable, 9.81 kN/cubic meter. Note also that the weight of air is considered to be zero.
Arctic Engineering Module 5a
Page 22 of 30
Slide script
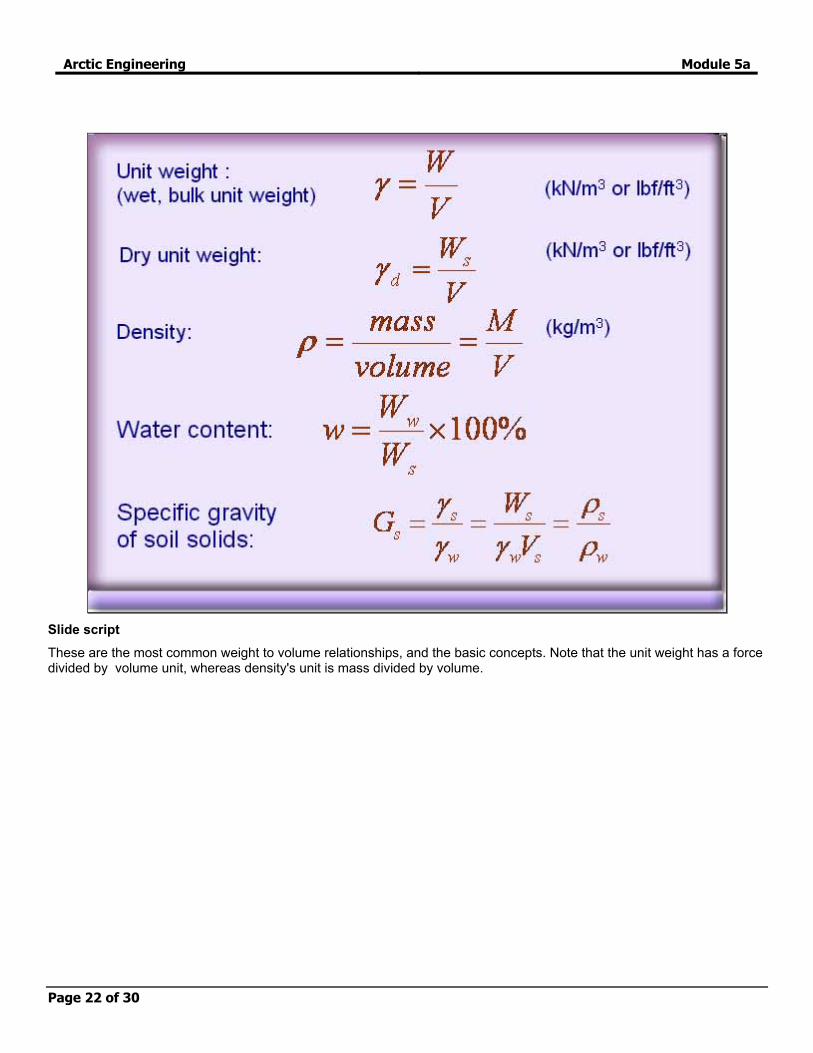
These are the most common weight to volume relationships, and the basic concepts. Note that the unit weight has a force divided by volume unit, whereas density's unit is mass divided by volume.
Arctic Engineering Module 5a
Page 23 of 30
Slide script
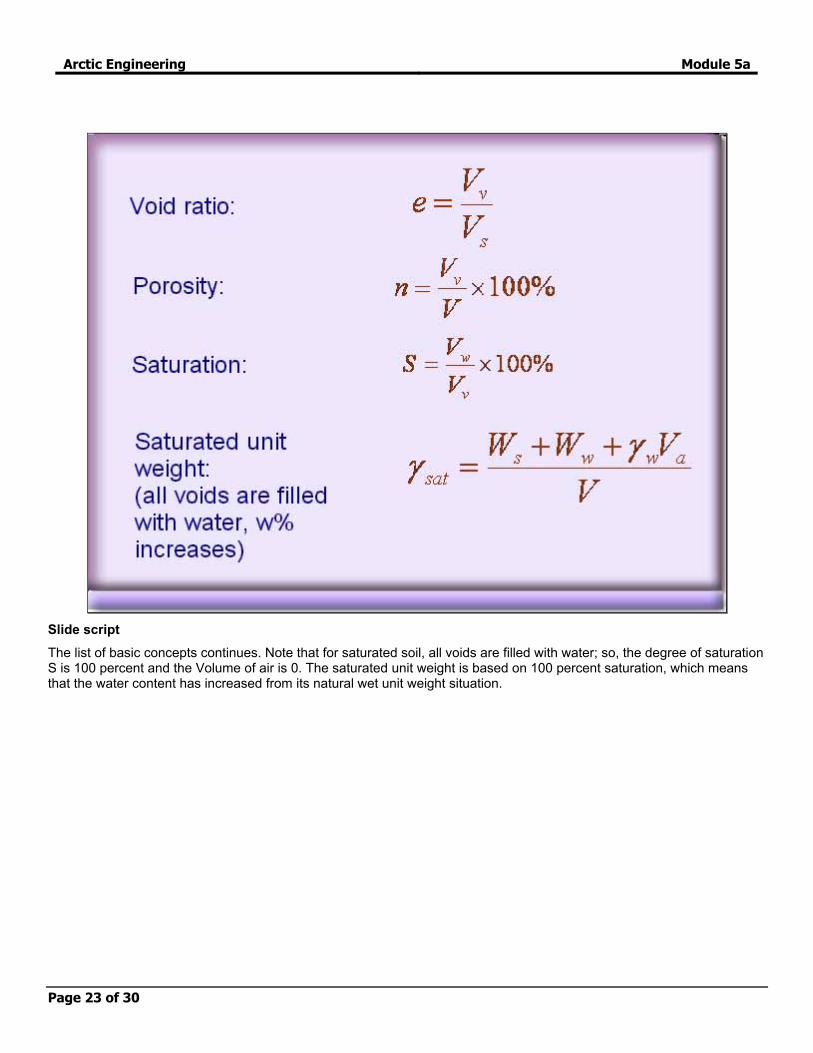
The list of basic concepts continues. Note that for saturated soil, all voids are filled with water; so, the degree of saturation S is 100 percent and the Volume of air is 0. The saturated unit weight is based on 100 percent saturation, which means that the water content has increased from its natural wet unit weight situation.

Arctic Engineering Module 5a
Page 24 of 30
Slide script
Note that soil water does not necessarily freeze at 0 celsius. This graph shows unfrozen water contents for a few soils. For example, the good, rich clay has about 9% unfrozen water content at -2 Celsius.T here might be unfrozen water down to -70 Celsius for certain clays.

Arctic Engineering Module 5a
Page 25 of 30
Slide script
The total water content is the ice content plus the unfrozen water content. The unfrozen water content increases the soil strength decreases. The unfrozen water content is really hard to determine, however, there are some empirical estimation methods.

Arctic Engineering Module 5a
Page 26 of 30
Slide script
Phase change. Note the difference in the unit weights and densities between the water and soil. Water is about 9% heavier than ice per unit volume, which means that water expands about 9% when it freezes. Not all this is seen as vertical expansion, and therefore, the 9-% expansion of the existing soil water does not normally cause problems. And by the way, remember that the unit weight and density of water and ice are considered to be known variables in all problems.

Arctic Engineering Module 5a
Page 27 of 30
Slide script
The steps to solve weight-volume relationships are: 1) draw the phase diagram, 2) fill in all known information including the unit weight of water or ice, 3) if the total volume is given fine, otherwise assign V=1 or V sub-s=1 (if e is given use V sub-s=1), 4) remember that the unit weight is the weight divided by volume; and if you know 2 of these three, you can solve the 3rd. Sometimes, however, you may want to do create 2 equations with 2 unknowns, and 5) when you have solved all weights and volumes, you can calculate all requested relationships.
Arctic Engineering Module 5a
Page 28 of 30
Slide script
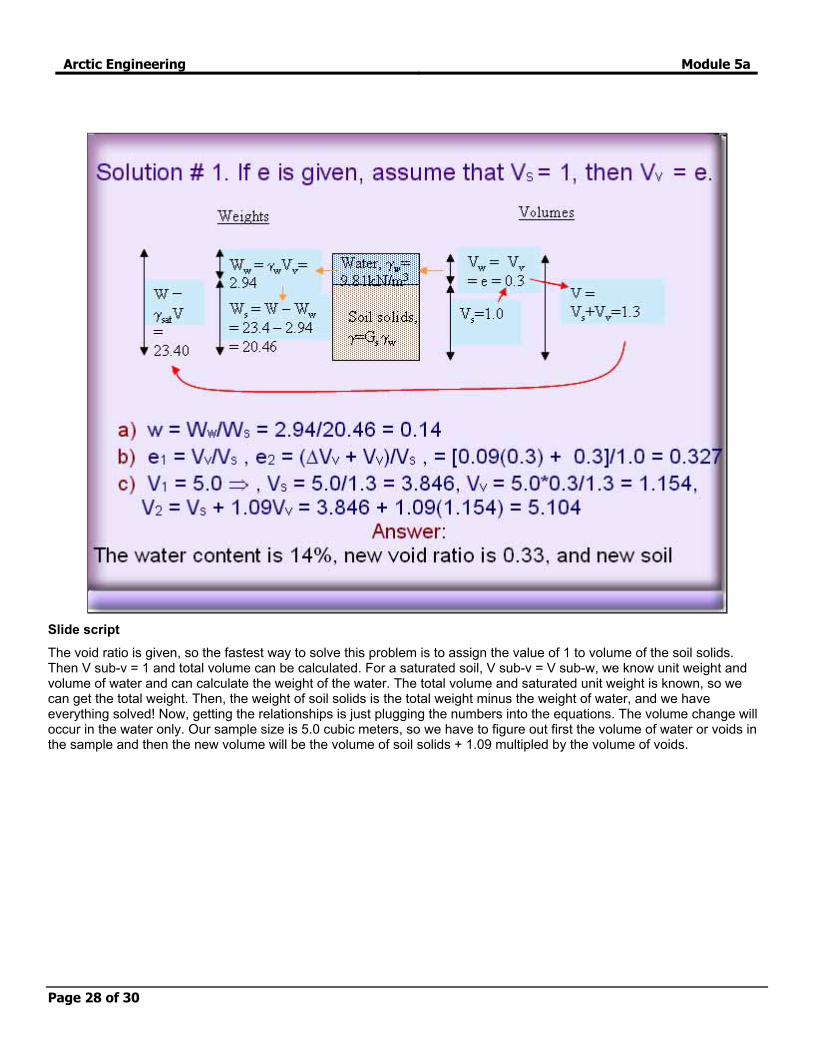
The void ratio is given, so the fastest way to solve this problem is to assign the value of 1 to volume of the soil solids. Then V sub-v = 1 and total volume can be calculated. For a saturated soil, V sub-v = V sub-w, we know unit weight and volume of water and can calculate the weight of the water. The total volume and saturated unit weight is known, so we can get the total weight. Then, the weight of soil solids is the total weight minus the weight of water, and we have everything solved! Now, getting the relationships is just plugging the numbers into the equations. The volume change will occur in the water only. Our sample size is 5.0 cubic meters, so we have to figure out first the volume of water or voids in the sample and then the new volume will be the volume of soil solids + 1.09 multipled by the volume of voids.

Arctic Engineering Module 5a
Page 29 of 30
Slide script
Here I filled in the values as given, V=5.0 that gave me the total sample weight using the given unit weight. Then I used the void ratio to get the volumes for the soil solids and voids.
Arctic Engineering Module 5a
Page 30 of 30
Slide script
Sometimes only dry density and water content is given and we need the wet density. This slide shows how to derive a relationship between wet density, dry density and water content. Other relationships can be derived as needed in the same way.