are employees better off in socially responsible …ftp.iza.org/dp5407.pdfare employees better off...
TRANSCRIPT
DI
SC
US
SI
ON
P
AP
ER
S
ER
IE
S
Forschungsinstitut zur Zukunft der ArbeitInstitute for the Study of Labor
Are Employees Better Off in Socially Responsible Firms?
IZA DP No. 5407
December 2010
Katrin TammRaul EametsPille Mõtsmees

Are Employees Better Off in Socially
Responsible Firms?
Katrin Tamm University of Tartu
Raul Eamets University of Tartu
and IZA
Pille Mõtsmees University of Tartu
Discussion Paper No. 5407 December 2010
IZA
P.O. Box 7240 53072 Bonn
Germany
Phone: +49-228-3894-0 Fax: +49-228-3894-180
E-mail: [email protected]
Any opinions expressed here are those of the author(s) and not those of IZA. Research published in this series may include views on policy, but the institute itself takes no institutional policy positions. The Institute for the Study of Labor (IZA) in Bonn is a local and virtual international research center and a place of communication between science, politics and business. IZA is an independent nonprofit organization supported by Deutsche Post Foundation. The center is associated with the University of Bonn and offers a stimulating research environment through its international network, workshops and conferences, data service, project support, research visits and doctoral program. IZA engages in (i) original and internationally competitive research in all fields of labor economics, (ii) development of policy concepts, and (iii) dissemination of research results and concepts to the interested public. IZA Discussion Papers often represent preliminary work and are circulated to encourage discussion. Citation of such a paper should account for its provisional character. A revised version may be available directly from the author.
IZA Discussion Paper No. 5407 December 2010
ABSTRACT
Are Employees Better Off in Socially Responsible Firms?* The growing awareness of the issue of corporate social responsibility (CSR) has raised the questions about how responsible behavior of firms would impact employees’ well-being. This paper investigates the link between corporate social responsibility and job satisfaction, which is a more widely recognized measure to assess well-being at work. Based on the survey of 3637 employees in Estonia, Latvia and Lithuania, measures of internal and external social responsibility are found to be positively associated with job satisfaction. Findings of the study indicate that employees’ assessments on various aspects of their job are noticeably higher in firms that are perceived as more engaged in CSR activities both towards their internal and external stakeholders. A further outcome of the study emphasizes the negative link between firm size and corporate social responsibility thus reflecting that smaller firms tend to show higher assessments regarding CSR. Similar relationships are also found between firm size and job satisfaction. JEL Classification: M14, M52 Keywords: corporate social responsibility, stakeholder view, employee engagement,
job satisfaction Corresponding author: Raul Eamets University of Tartu Faculty of Economics and Business Administration Narva Road 4-124 51009 Tartu Estonia E-mail: [email protected]
* This study was undertaken with support from Estonian Science Foundation project number SF0180037s08 and supported by European Social Fund’s Doctoral Studies and Internationalization Program DoRa.

3
Introduction
Employees are more and more conscious of the widening obligations of firms towards the society. This means that they nowadays perceive corporate social responsibility as one of the important issues to be considered by the employers. If awareness about the issue is enhancing it may be resulted in influences on employees’ attitudes and behaviors. Among other factors, satisfaction with different aspects of job can be affected which we would like to investigate in the current paper.
Although the issue of corporate social responsibility has been among heavily researched phenomena for last couple of decades, there are still research gaps to be found. One of those is the relationship between internal and external social responsibility, the former being associated with the firm’s socially responsible activities within the organization, thus towards its’ internal stakeholders and the latter indicating the respective activities towards external stakeholders.
Increasing firm responsibilities towards the society are emerging from growing stakeholder demands and rising belief that business should contribute more directly to respond the social challenges such as pro-active protection of human rights, poverty alleviation, protection of natural environment etc. Therefore, many authors indicate to the need for more distinct stakeholder (relations) management (Steurer et al, 2001) and stakeholder engagement (Greenwood, 2007). Stakeholder engagement is traditionally seen as corporate social responsibility in action.
Similarly to Freeman (1984) we define stakeholders as “any group or individual who can affect or is affected by the achievement of the organization’s objectives”. Internal and external stakeholders are separated, any of them having specific stakeholder claims which are often in conflict with each other and thus facing the firm with an essential question how various stakeholder claims should be taken into account. One may ask whether all stakeholder claims should be responded by the firm on the equal level or whether the presence of stakeholder power has any role to play in stakeholder engagement.
The empowerment literature (e.g. Claydon and Doyle, 1996) emphasizes the importance of employee power in organizational engagement. Similarly, in the study by Greenwood (2007) employees as representatives of the internal side of the organization are identified as the most salient stakeholders among all others and thus can be expected to have the biggest power in terms of stakeholder engagement. This is why we will concentrate on employees in our study. Our main objective is to observe the relationships between CSR and different aspects of job satisfaction. Employee assessments of corporate social responsibility as well as their relationships with job satisfaction will be in focus of analysis. The reasoning behind the choice of job satisfaction as a descriptive variable for our analysis is related with the fact that this is associated with many important organizational variables and traditionally used in business research that investigates employee-based phenomena.
The link between corporate social responsibility and job satisfaction has not been directly investigated before, but there are some studies referring to an indirect relationship between these two phenomena either through organizational ethics (e.g. Valentine and Fleischman, 2008) or organizational justice (e.g. Rupp et al, 2006). Though, the findings of an earlier work of Gavin and Maynard (1975) have already indicated to significant associations between the degree to which an organization fulfills its societal obligations and the extent to which employees are satisfied with their job. Nevertheless, the existing empirical support to this link is anchored mainly on the analyses of specific measures that could be seen only as indirect proxies for assessing CSR. Our contribution to the literature lies in investigating the links based on
4
composed CSR indexes which enable to separately analyze the role of internal and external responsibilities of the firm. Interrelations between internal and external social responsibility have not been studied before, at least according to our knowledge. ‘Based on the resource-based-view of the firm we claim that internal social responsibility should prevail or appear at least on the comparable level vis-à-vis external social responsibility. However, as corporate social responsibility is understood in many different ways and there are a number of CSR issues firms can address towards their internal and/or external stakeholders, it is not always entirely evident that internal stakeholder issues are favored. Sometimes there is also an inconsistency in how socially responsible behavior is appraised by managers and other stakeholders of the firm which will be tested on our sample.
The empirical study will rest upon the Baltic Working Environment and Labor survey conducted by SKDS Latvia, under the supervision of Charles Woolfson, Marie Curie Chair to the Baltic States, under Framework Program 6 of the European Commission, among the firms in Estonia, Latvia and Lithuania. In total, 3637 employees were questioned over the period from August to November 2006. As main research methods, various quantitative methods such as mean comparison, one-way analysis of variance (ANOVA) as well as correlation and factor analyses are applied.
The paper is structured as follows. In a second section we clarify the theoretical framework for analyzing corporate social responsibility and job satisfaction and develop our research hypothesis. In the third section data and methodology description is provided. Fourth section aims to explain how CSR indexes have been composed and brings out first results regarding level of corporate social responsibility within the sample. As next, interrelations between internal and external CSR will be examined. Then our focus will be shifted to investigate the link between corporate social responsibility and job satisfaction measures. Finally, the seventh section concludes the study, discusses the limitations and suggests directions for future research. Theoretical Foundation and Hypotheses The issue of corporate social responsibility is a complex phenomenon as being one of the key conceptions in the study of business and society relations. Its complexity initially derives from differences in national, cultural and social contexts that also call for different sorts of responsibility from firms (Midttun, 2007). In a very general sense, corporate social responsibility describes the duties of organizations towards the society whereby the issues of voluntariness and going beyond compliance are stressed. Hence, corporate social responsibility of organizations could be understood as “doing more than they are required to do under applicable laws and regulations governing the environment, worker safety and health, and investments in the communities they work” (Portney, 2008). This, in turn, leaves decisions about the content and extent of CSR to managers’ discretion and dependent on their ethical values.
Authors of the current paper are aware of the critics addressed towards the questionable nature of the CSR concept. According to the opponents’ view, corporate social responsibility is just an invention of public relations which aims “to ensure that companies receive recognition for their involvements in the community and for their role as “good corporate citizens”” (Frankental, 2001). This is justified by the recognition of CSR as a means to improve an organization’s image and position at the market, which on critics’ opinion does not necessarily bring along long-term positive impact on society. Of course, it could be argued that the motivation for engaging in CSR can be explained by the intention of reputation management, but this should rather be an issue for large organizations as we can often read about the degrading image of big businesses nowadays arising from the negative side-effects of their activities towards environment and society (e.g. O’Riordan and Fairbrass, 2008). Small organizations, in turn, that are also in focus of our study,
5
do not have the resources for a notable image management. Therefore we believe that activities that can be regarded as corporate social responsibility do not only benefit organizations, but a much broader range of beneficiaries could be brought out.
One of the essential approaches to corporate social responsibility has its roots in stakeholder theory that has been presented both within the framework of organization theories (Freeman, 1984) and within that of business ethics (Carroll, 1991). Central proposition of stakeholder theory says that the long term value of a company rests primarily on the knowledge, abilities and commitment of its employees, and its relationships with investors, customers and other stakeholders (Wheeler and Sillanpää, 1997). To put differently, stakeholders act as gatekeepers to resources that firms need. For example, customers decide whether or not to buy the company’s products and services, communities decide whether or not to let the company occupy a location in their area, and employees decide whether or not to share their innovative ideas with their employer or defect to a competitor. Thus, the quality of a company’s relationships with its stakeholders can be considered as an indicator of the organization’s capability to access valuable resources (Wheeler et al., 2001). Therefore it is widely recognized that managers must satisfy a variety of stakeholders who can influence firm outcomes. According to stakeholder view, it is beneficial for the firm to engage certain activities of corporate social responsibility that stakeholders perceive to be important, because otherwise these groups might withdraw their support for the firm. Consequently, a number of managers have understood the importance of socially responsible initiatives as representing opportunities for more efficient management of their human resources.
Employees are considered as a primary stakeholder group and as noted by Greenwood (2007), they are identified as relatively highly salient stakeholders to whom the firm owes a perfect duty, which means that they have high power and legitimacy to influence the firm. Thus, we can say, paraphrasing McWilliams and Siegel (2001) that “employees are another source of stakeholder demand for CSR. For example, they tend to support progressive labor relations policies, safety, financial security, and workplace amenities, such as childcare. Workers are searching for signals that managers are responding to causes they support.” According to Tuzzolino and Armandi (1981), satisfying employees’ expectations will lead to improved job attitudes and increased productivity, which is good for the company, but it has to be pointed out that this effect is mediated through employees’ well-being.
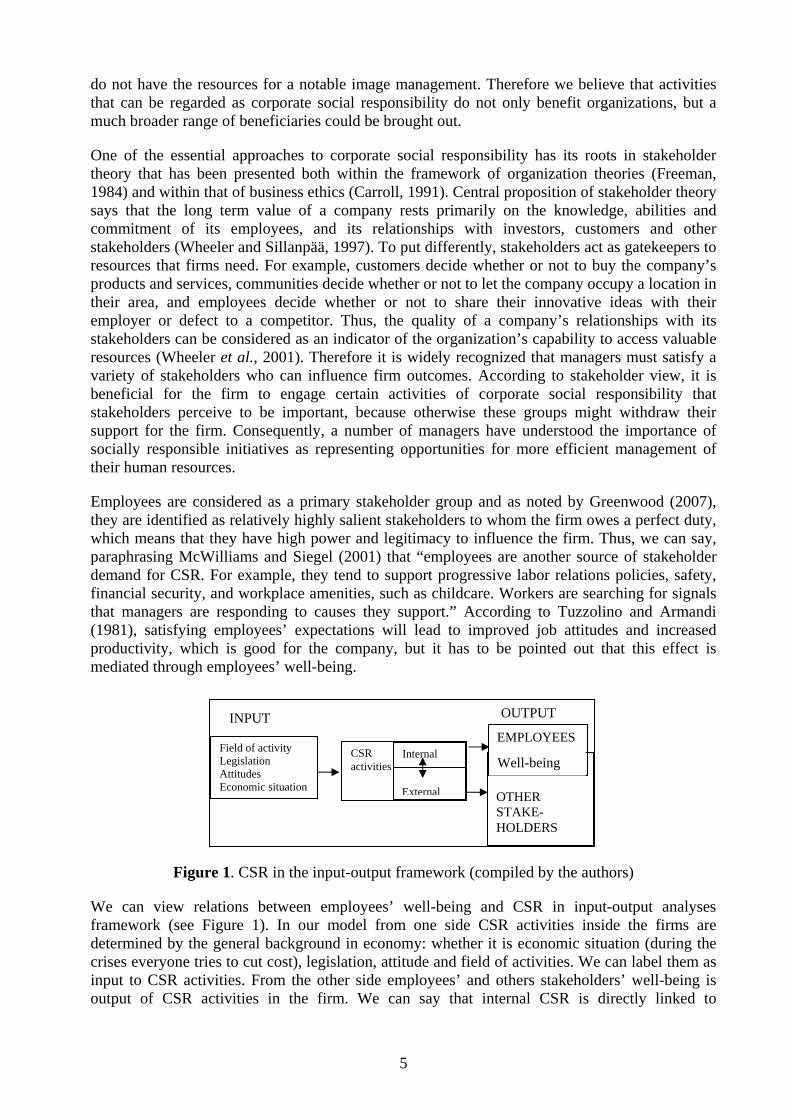
Figure 1. CSR in the input-output framework (compiled by the authors)
We can view relations between employees’ well-being and CSR in input-output analyses framework (see Figure 1). In our model from one side CSR activities inside the firms are determined by the general background in economy: whether it is economic situation (during the crises everyone tries to cut cost), legislation, attitude and field of activities. We can label them as input to CSR activities. From the other side employees’ and others stakeholders’ well-being is output of CSR activities in the firm. We can say that internal CSR is directly linked to
Field of activity Legislation Attitudes Economic situation
CSR activities
Internal
External
OTHER STAKE-HOLDERS
EMPLOYEES INPUT OUTPUT
Well-being
6
employees’ well-being and we can measure this through job satisfaction indicators. External CSR is affecting mostly other stakeholders’ well-being, but this is not an objective of current papers.
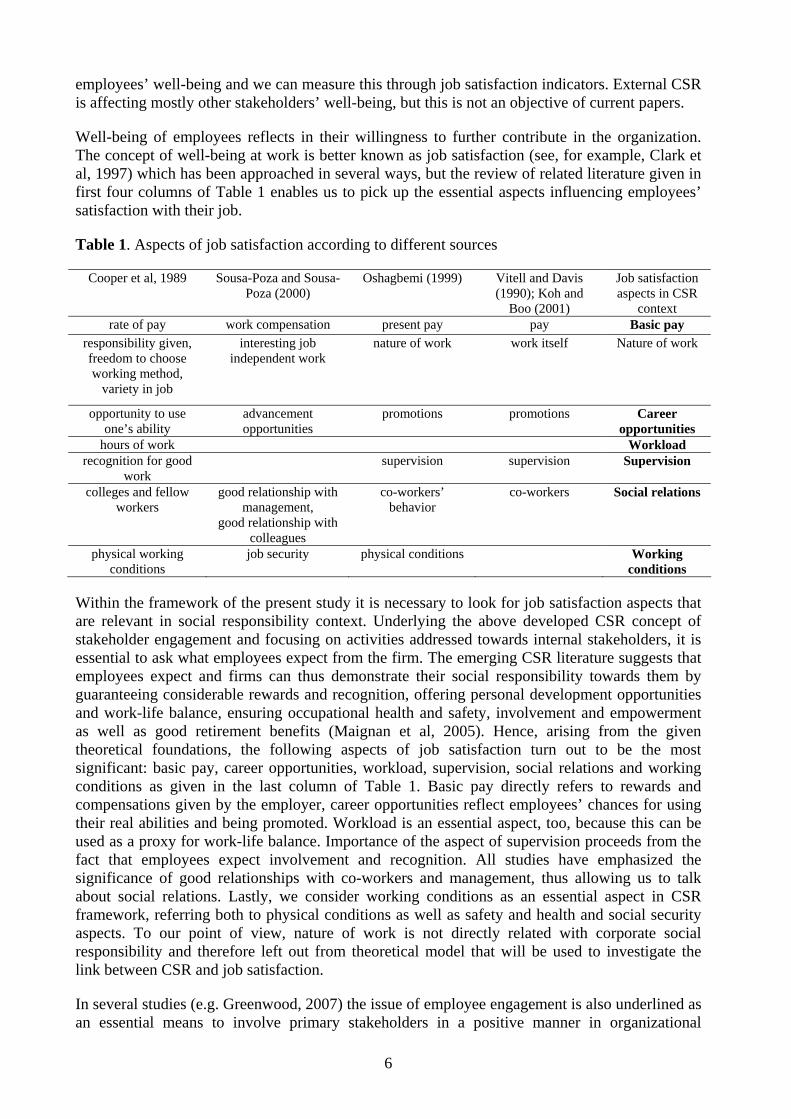
Well-being of employees reflects in their willingness to further contribute in the organization. The concept of well-being at work is better known as job satisfaction (see, for example, Clark et al, 1997) which has been approached in several ways, but the review of related literature given in first four columns of Table 1 enables us to pick up the essential aspects influencing employees’ satisfaction with their job.
Table 1. Aspects of job satisfaction according to different sources
Cooper et al, 1989 Sousa-Poza and Sousa-Poza (2000)
Oshagbemi (1999) Vitell and Davis (1990); Koh and
Boo (2001)
Job satisfaction aspects in CSR
context rate of pay work compensation present pay pay Basic pay
responsibility given, freedom to choose working method,
variety in job
interesting job independent work
nature of work work itself Nature of work
opportunity to use one’s ability
advancement opportunities
promotions
promotions
Career opportunities
hours of work Workload recognition for good
work supervision supervision
Supervision
colleges and fellow workers
good relationship with management,
good relationship with colleagues
co-workers’ behavior
co-workers Social relations
physical working conditions
job security physical conditions Working conditions
Within the framework of the present study it is necessary to look for job satisfaction aspects that are relevant in social responsibility context. Underlying the above developed CSR concept of stakeholder engagement and focusing on activities addressed towards internal stakeholders, it is essential to ask what employees expect from the firm. The emerging CSR literature suggests that employees expect and firms can thus demonstrate their social responsibility towards them by guaranteeing considerable rewards and recognition, offering personal development opportunities and work-life balance, ensuring occupational health and safety, involvement and empowerment as well as good retirement benefits (Maignan et al, 2005). Hence, arising from the given theoretical foundations, the following aspects of job satisfaction turn out to be the most significant: basic pay, career opportunities, workload, supervision, social relations and working conditions as given in the last column of Table 1. Basic pay directly refers to rewards and compensations given by the employer, career opportunities reflect employees’ chances for using their real abilities and being promoted. Workload is an essential aspect, too, because this can be used as a proxy for work-life balance. Importance of the aspect of supervision proceeds from the fact that employees expect involvement and recognition. All studies have emphasized the significance of good relationships with co-workers and management, thus allowing us to talk about social relations. Lastly, we consider working conditions as an essential aspect in CSR framework, referring both to physical conditions as well as safety and health and social security aspects. To our point of view, nature of work is not directly related with corporate social responsibility and therefore left out from theoretical model that will be used to investigate the link between CSR and job satisfaction.
In several studies (e.g. Greenwood, 2007) the issue of employee engagement is also underlined as an essential means to involve primary stakeholders in a positive manner in organizational
7
activities. Numerous definitions of employee engagement can be derived from the practice- and research driven literatures. Common to these definitions is the notion that employee engagement is a desirable condition, has an organizational purpose, and connotes involvement, commitment, passion, enthusiasm, focused effort, and energy, so it has both attitudinal and behavioral components. All mentioned attitudes and behaviors stem from conditions under which people work, and their consequences apparently influence organizational effectiveness (Macey & Schneider, 2008). It is worth mentioning that the engagement process of employees should be first of all regarded as being necessarily good for employees. As pointed out by Greenwood (2007), sometimes it could also be taken to fulfill someone other’s interests: “In the organizational setting, employee involvement in decision making may not be undertaken to achieve the goals of employees, but rather done to further the objectives of the organization”.
The review of literature suggests that fulfillment of stakeholders’ expectations helps to shape the corporate image. As reported by Gray et al (1995), engagement of various stakeholders and reports about corporate social responsibility could be seen as mechanisms by which organizations respond to stakeholder demands to demonstrate satisfactory CSR performance. Often the activities that are taken in favor of external stakeholders are more transparently observable and therefore we can assume that organizations that do more beyond the firm can more easily and by a larger amount of stakeholder groups be perceived as socially responsible. Nevertheless, previous studies have shown that if an organization is viewed as socially responsible in favor of the community and fulfilling its societal obligations, employees tend to assess its responsibility towards internal stakeholders more highly, too. In Gavin and Maynard (1975) study an inference has been drawn about the positive link between work-reward expectancies and external CSR perceptions (according to their terminology, external commitments to social responsibilities, such as concern for environment). Work-reward expectancies are obviously related to socially responsible activities that firms can demonstrate towards their employees (as demonstrated in Table 1), thus we can posit our first hypothesis as follows:
H1: Assessments of internal CSR are higher in firms that are viewed as more engaged in external social responsibility
There is a growing body of literature suggesting that an organization’s efforts to be involved in activities that are regarded as corporate social responsibility have an impact on various stakeholders’ reactions to the organization (Valentine and Fleischman, 2007). As mentioned above, activities outside the company are more widely seen. At the same time, these activities are recognized as means for the firm to increase investor interest, consumer purchases, positive relationships with the government (e.g. McWilliams and Siegel, 2001) and improve public opinion about the company. Inside the organization, the main aim of socially responsible activities is to enhance employees’ responses to their work environment. Therefore it can be assumed that as external CSR could only provide indirect benefits for employees (Brammer et al, 2005) employees’ concern should be higher regarding internal CSR, whereas managers should consider both dimensions as equally important. Due to the variation in perceptions regarding CSR we will posit the second hypothesis:
H2: Managers’ and employees’ assessments of external CSR are closer to each other than their assessments of internal CSR
Previous studies demonstrate anecdotal evidence that that corporate social responsibility is associated with job satisfaction. For this study the link between these two phenomena is explained by stakeholder theory, the salient points of which have been summarized in the beginning of this section. According to stakeholder theory, employees have expectations that have to be responded by the firm in order to ensure the continuous commitment by employees to the organization, which is necessary for its long-term survival. Commitment is guaranteed only

8
when employees are satisfied with their work. Some earlier studies that have brought out indirect links between CSR and job satisfaction either through ethics programs (Valentine and Fleischman, 2008) or organizational justice (Rupp et al, 2006) allow us believe that socially responsible activities of the firm have an impact on the degree to which employees are satisfied with their job. Our assumption is further affirmed by Kenexa Research Institute’s empirical study of Indian organizations indicating that an organization’s CSR efforts also positively affect employees’ personal outlooks of the future, satisfaction with their job and confidence in the company’s future. As pointed out in this study, employees who rate their organization as having a strong CSR culture outscored those who viewed their company’s CSR activities as weak on each of these key indicators. Based on above reasoning, we can thus formulate the next hypothesis:
H3: Assessments of CSR and job satisfaction are positively related
Description of Data and Methodology
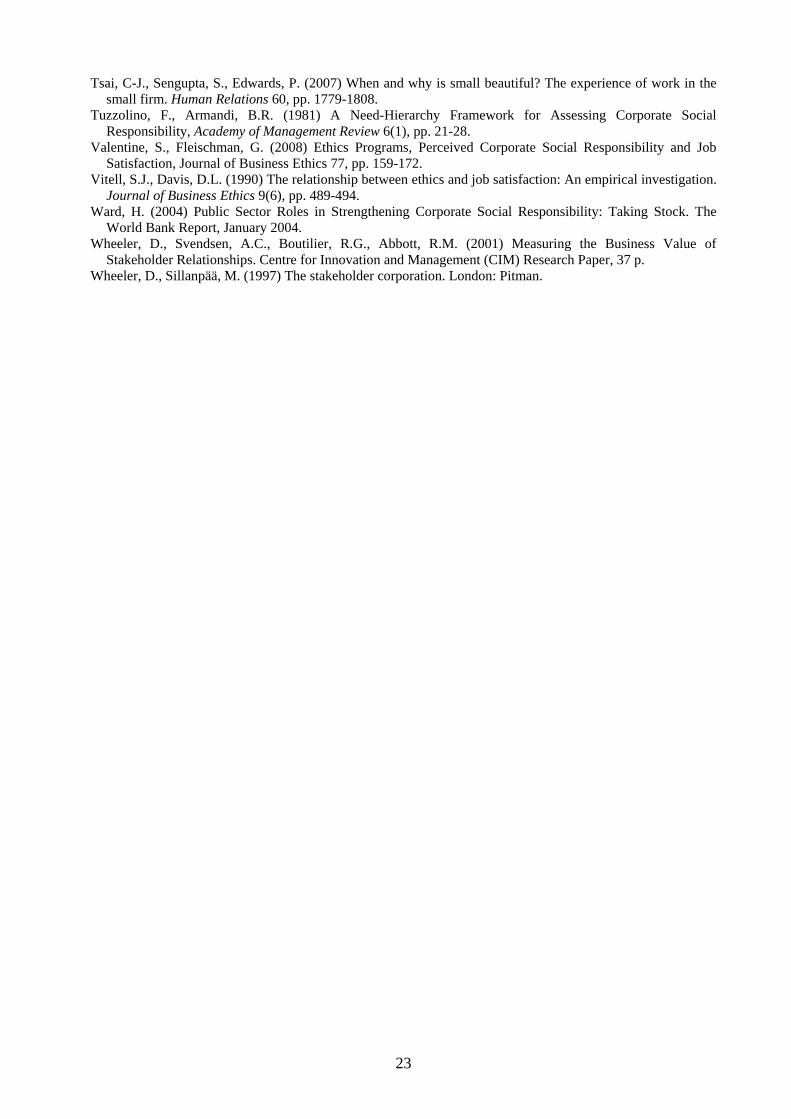
For empirical analysis we have used the Baltic Environment and Labor Survey conducted in three Baltic States in 2006. The sample consists of 3637 responses from Estonia, Latvia and Lithuania. Further general descriptive information about the sample is presented in Appendix 1. It is specific to our sample that 63% of respondents represent micro sized firms (1-9 employees) and 21% are employed by small firms (10-49 employees), but just a small share of respondents come from medium sized (11%) or big (4%) firms. As a matter of fact, if we look at real situation in survey year, the percentage of micro sized firms was even larger (for example in Estonia 88%) (Estonian Statistical Office, 2007), but all other groups had smaller shares than in our sample. Thus we can say that in our sample, micro sized firms are under-represented while all other categories are over-represented. Regarding the capital ownership, the sample corresponds quite well to the actual situation. In case of the field of activity, agricultural sector is under-represented and manufacturing firms over-represented, while other fields’ share in the sample responds relatively well to the reality. Additionally, there are some personal features of respondents that can be used to analyze our results. One essential characteristic is respondent’s occupation according to which we can separate between employees in private sector, which is the biggest category among all occupations, followed by manual workers in private sector, managers and top specialists, clerk in public sector, manual workers in public sector and self-employed people. Respective to respondents’ age our sample is divided into five categories and the division between age groups corresponds quite well to actual division. Out of all respondents, 62% are females and 38% males, indicating that females are over-represented in the sample as compared to real numbers.
To assess corporate social responsibility perceptions of respondents, proxy variables from the survey were used both for investigating internal and external CSR. The most of survey questions used in the present research were estimated on a four-point scale, where respondents were asked to express the level of agreement with statements ranging from “completely agree” to “completely disagree” or “totally satisfied” to “not satisfied at all”. 1 means the highest possible agreement or satisfaction while 4 is a reflection of lowest agreement or satisfaction. It is worth mentioning here that as the construction of scales does not correspond to the usual logic which would associate the highest assessment to the highest agreement or satisfaction, this peculiarity has to be taken into account while interpreting the empirical findings. Besides the set-up of majority of questions, some questions have been measured on five-point scale (for example, “considerably improved”, “slightly improved”, “remained constant”, “slightly worsened”, “considerably worsened”) and in some cases only three response possibilities were available (“yes, regularly”, “yes, sometimes” or “never”). Thus, we have to admit that the database is not ideal for detailed analysis, but still enables us to find relationships between variables that are in focus of the study.

9
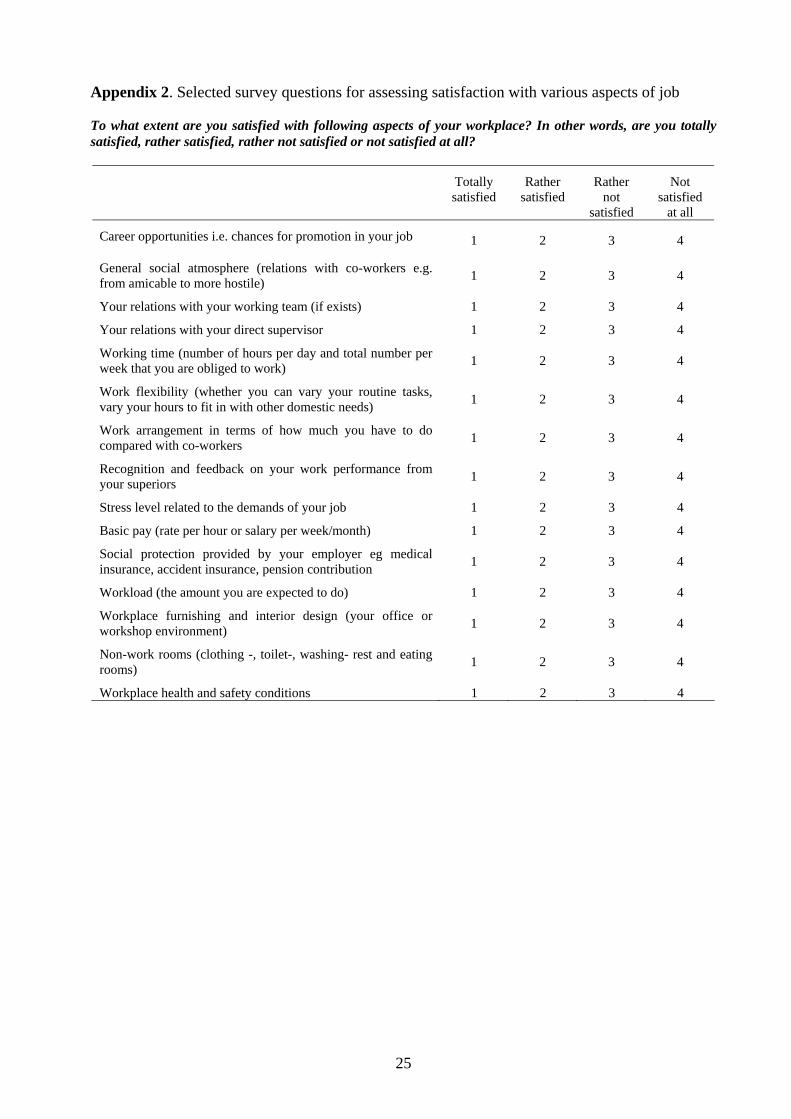
Job satisfaction was measured using 15 statements about various aspects of job that were assigned as essential in the CSR context taking into account theoretical considerations raised in previous section of the paper. Those aspects were: basic pay, career opportunities, supervision, working conditions, social relations and workload. The list of survey questions is presented in Appendix 2. Typical questions included: “to what extent are you satisfied with career opportunities i.e. chances for promotion in your job”, “to what extent are you satisfied with social protection provided by your employer e.g. medical insurance, accident insurance, pension contribution”. In each case respondents were asked to respond on a four-point scale, ranging from “totally satisfied” to “not satisfied at all”.
The analysis of data was done with help of various quantitative methods. We used descriptive statistics such as means, min, max and SD, mean comparison methods such as t-test and one-way analysis of variance (ANOVA), correlation and factor analysis. The independent samples t-test was used to identify differences in the mean estimations of corporate social responsibility measures. Levene’s test was applied to check the hypotheses about the variances in the assessments of employees and managers regarding internal and external CSR. If Levene’s test is significant at p=0.05 level the null hypothesis can be rejected. The one-way analysis of variance makes it possible to identify the differences in the means of two groups using a single independent variable. ANOVA analysis was used while testing for differences in groups that were formed based on corporate social responsibility indexes composed by the authors. A Spearman correlation analysis was used to find relationships between internal and external CSR and job satisfaction measures. Factor analysis enabled to capture initial variables of job satisfaction into more generalized composite indicators solving also the problem of autocorrelation. The appropriateness of initial variables has been verified according to the Kaiser-Meyer-Olkin Measure of Sampling Adequacy (KMO). The component scores of composed general job satisfaction variables were used to compare the respondents’ assessments about different aspects of job satisfaction in different CSR levels. Component scores indicate the relative position of each individual response in the sample according to the described aspect; the mean value of the component scores as per one indicator is zero. Hence, responses below zero indicate to a higher satisfaction level and vice versa, compared to the whole sample.
Composition of Corporate Social Responsibility Index
CSR index has been calculated in two steps and was based on the following initial variables (see Table 2).
Table 2. The logic of how CSR index has been composed
Initial variables from Employees’ Survey Computed variables • Management is honest and fair in
relations with employees • Management takes care of the
employees’ welfare • My employer listens to workers’
health and safety concerns
Internal
CSR index
• My employer takes special care for environment
• Management is honest in relations with customers
• My company is not always simply chasing the ‘bottom line’ of profits alone and is willing to consider wider social obligations to the community
External
CSR index
CSR index
10
As a first step, variables have been selected out of the survey questionnaire which according to our view could be used as proxies for assessing internal and external social responsibility. For both internal and external side of CSR three initial variables have been chosen and their mean value reflects respective partial indexes. Finally, the CSR index was found as a mean of all six initial variables.
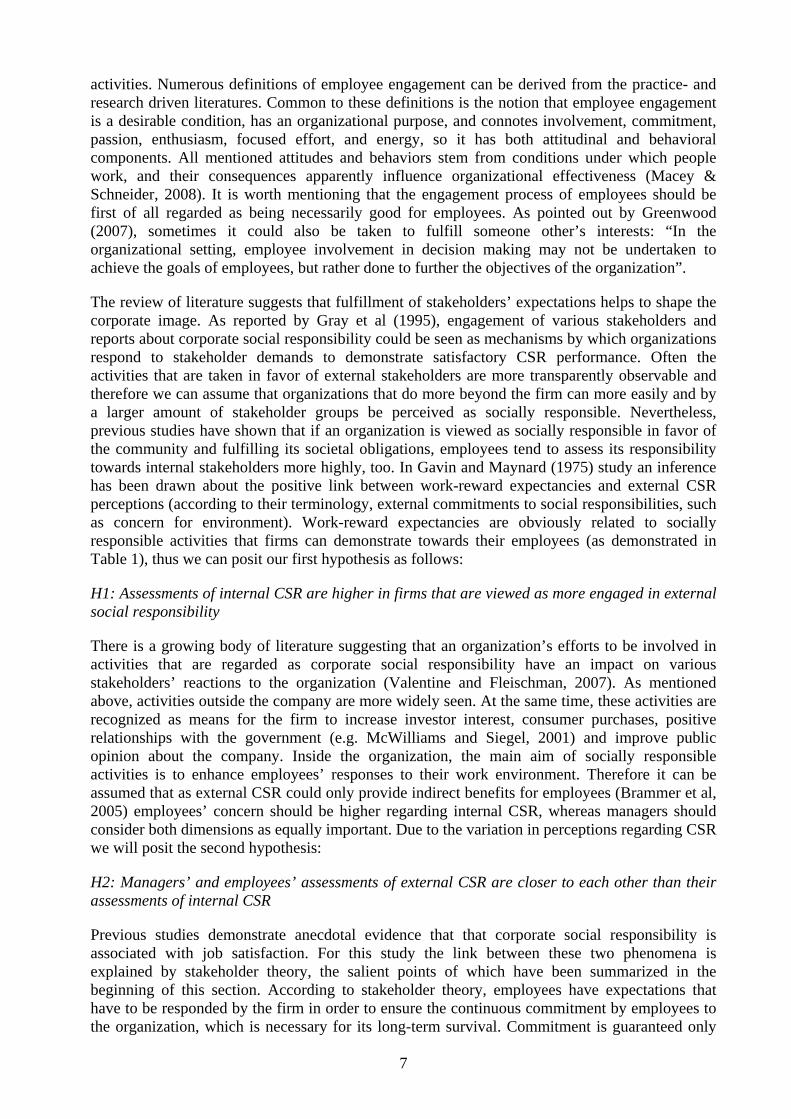
As lower initial variables indicate to higher corporate social responsibility according to the questionnaire, the indexes have been built up following the similar logic. Hence, both partial indexes and final CSR index range from one to four as indicating to minimum and maximum values respectively whereby lower number reflects to higher CSR as perceived by respondents. Descriptive statistics for the composed CSR indexes are given in the following Table 3.
Table 3. Descriptive statistics for the composed CSR indexes N Minimum Maximum Mean SD Variance Overall CSR index 3596 1.00 4.00 1.9799 0.63559 0.404 Internal CSR index 2887 1.00 4.00 1.9129 0.69064 0.477 External CSR index 3476 1.00 4.00 1.9931 0.66728 0.445 Valid N (listwise) 2861
Notes: N=sample size; SD=standard deviation
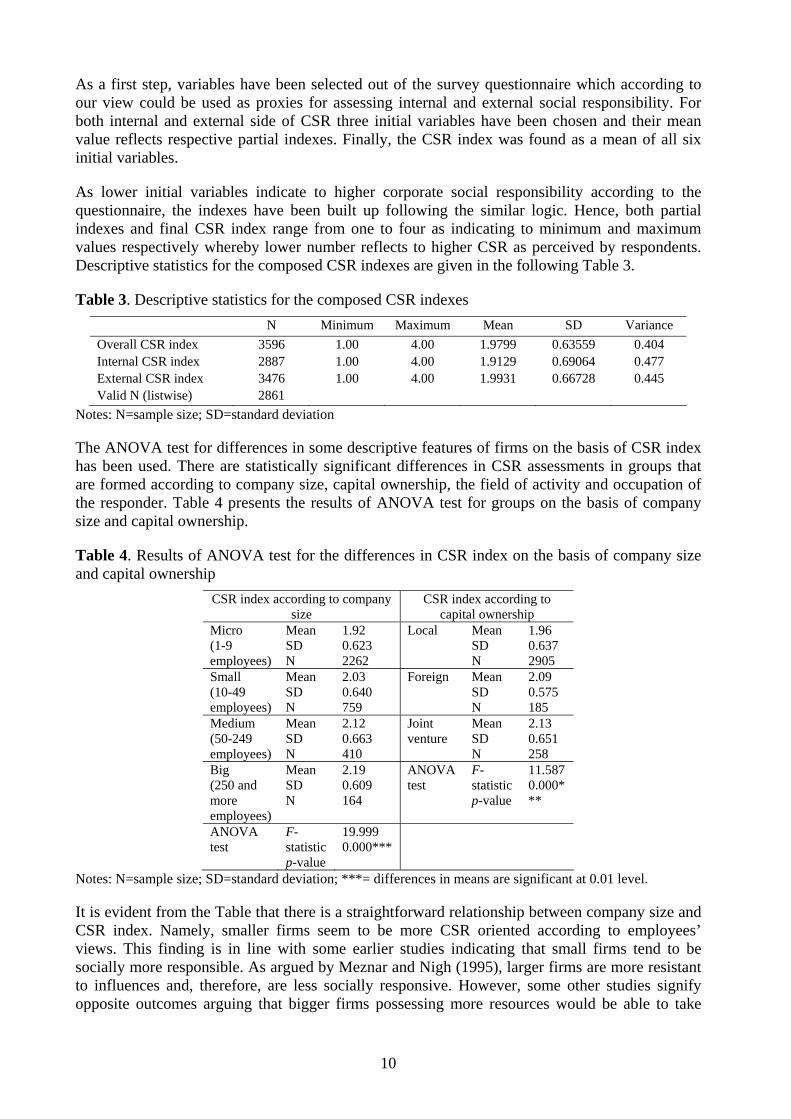
The ANOVA test for differences in some descriptive features of firms on the basis of CSR index has been used. There are statistically significant differences in CSR assessments in groups that are formed according to company size, capital ownership, the field of activity and occupation of the responder. Table 4 presents the results of ANOVA test for groups on the basis of company size and capital ownership.
Table 4. Results of ANOVA test for the differences in CSR index on the basis of company size and capital ownership
CSR index according to company size
CSR index according to capital ownership
Micro (1-9 employees)
Mean SD N
1.92 0.623 2262
Local Mean SD N
1.96 0.637 2905
Small (10-49 employees)
Mean SD N
2.03 0.640 759
Foreign Mean SD N
2.09 0.575 185
Medium (50-249 employees)
Mean SD N
2.12 0.663 410
Joint venture
Mean SD N
2.13 0.651 258
Big (250 and more employees)
Mean SD N
2.19 0.609 164
ANOVA test
F-statistic p-value
11.587 0.000***
ANOVA test
F-statistic p-value
19.999 0.000***
Notes: N=sample size; SD=standard deviation; ***= differences in means are significant at 0.01 level.
It is evident from the Table that there is a straightforward relationship between company size and CSR index. Namely, smaller firms seem to be more CSR oriented according to employees’ views. This finding is in line with some earlier studies indicating that small firms tend to be socially more responsible. As argued by Meznar and Nigh (1995), larger firms are more resistant to influences and, therefore, are less socially responsive. However, some other studies signify opposite outcomes arguing that bigger firms possessing more resources would be able to take
11
more activities that are considered as socially responsible ones. This issue will be further discussed in section of discussion.
If we look at the differences in CSR index according to capital ownership, it turns out that local firms show higher perceived social responsibility compared to firms with foreign ownership. This is a reflection of the fact that capital ownership is related with company size. Another ANOVA test explicitly indicated that local firms tend to belong to the groups of micro or small size, while firms possessing foreign ownership usually fit in the group of big firms. Consequently, we can declare that the differences in perceived social responsibility depending on capital ownership are to a great extent influenced by the company size, thus no clear conclusions cannot be made about the impact of local or foreign capital on CSR.
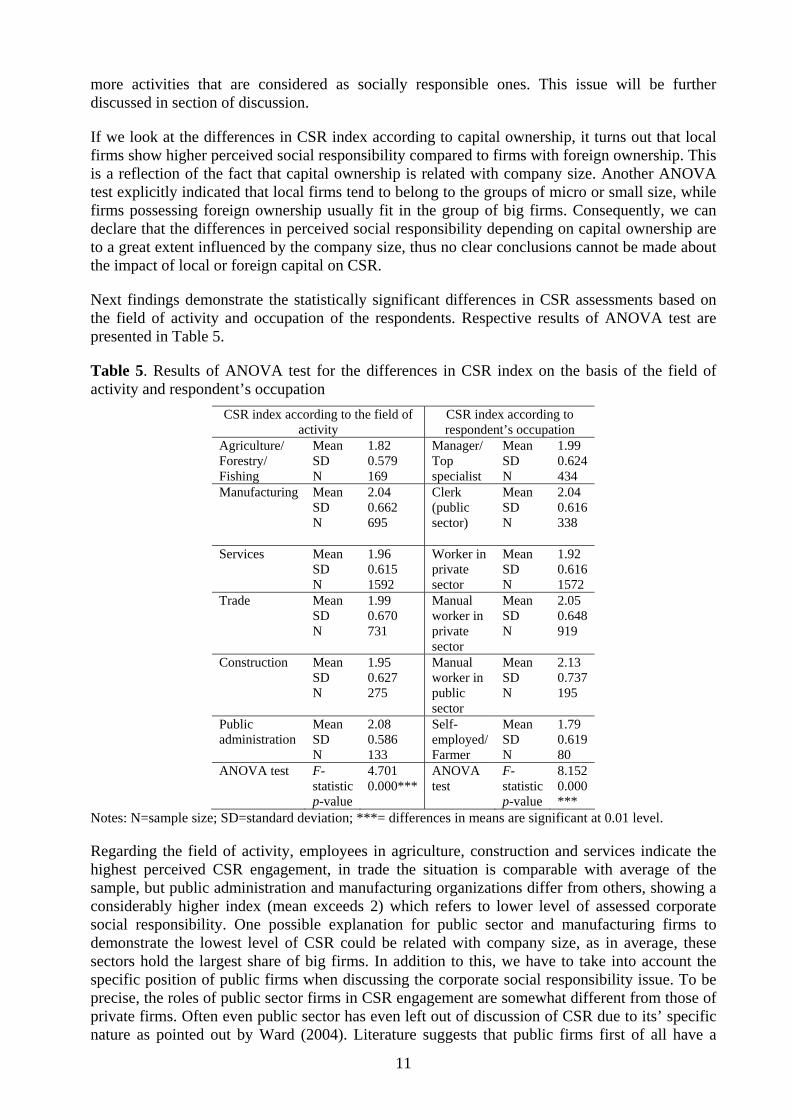
Next findings demonstrate the statistically significant differences in CSR assessments based on the field of activity and occupation of the respondents. Respective results of ANOVA test are presented in Table 5.
Table 5. Results of ANOVA test for the differences in CSR index on the basis of the field of activity and respondent’s occupation
CSR index according to the field of activity
CSR index according to respondent’s occupation
Agriculture/ Forestry/ Fishing
Mean SD N
1.82 0.579 169
Manager/ Top specialist
Mean SD N
1.99 0.624 434
Manufacturing Mean SD N
2.04 0.662 695
Clerk (public sector)
Mean SD N
2.04 0.616 338
Services Mean SD N
1.96 0.615 1592
Worker in private sector
Mean SD N
1.92 0.616 1572
Trade Mean SD N
1.99 0.670 731
Manual worker in private sector
Mean SD N
2.05 0.648 919
Construction Mean SD N
1.95 0.627 275
Manual worker in public sector
Mean SD N
2.13 0.737 195
Public administration
Mean SD N
2.08 0.586 133
Self-employed/Farmer
Mean SD N
1.79 0.619 80
ANOVA test F-statistic p-value
4.701 0.000***
ANOVA test
F-statistic p-value
8.152 0.000***
Notes: N=sample size; SD=standard deviation; ***= differences in means are significant at 0.01 level.
Regarding the field of activity, employees in agriculture, construction and services indicate the highest perceived CSR engagement, in trade the situation is comparable with average of the sample, but public administration and manufacturing organizations differ from others, showing a considerably higher index (mean exceeds 2) which refers to lower level of assessed corporate social responsibility. One possible explanation for public sector and manufacturing firms to demonstrate the lowest level of CSR could be related with company size, as in average, these sectors hold the largest share of big firms. In addition to this, we have to take into account the specific position of public firms when discussing the corporate social responsibility issue. To be precise, the roles of public sector firms in CSR engagement are somewhat different from those of private firms. Often even public sector has even left out of discussion of CSR due to its’ specific nature as pointed out by Ward (2004). Literature suggests that public firms first of all have a
12
supporting role towards businesses to strengthen the business case of CSR. Ward (2004) refers to four central public sector roles in strengthening CSR: mandating, facilitating, partnering and endorsing, that all should guide businesses to higher engagement in CSR. Traditionally, public firms offer public goods, which could automatically be regarded as high social responsibility towards the society, but it seems that employees do not perceive it as such, at least in our sample case.
The right-hand side of the Table 5 displays differences in CSR index according to respondents’ occupation. Consistent with above results, respondents from public sector reflect the lowest assessments regarding CSR. Comparable evaluations from private sector are given by manual workers. White-collar workers as well as managers and self-employed people assess the level of CSR noticeably higher, which we can consider as an expected result.
Country variable turned out to be a statistically insignificant characteristic. This can be seen as a relatively expected result of our study, too, because earlier surveys have shown that there were no substantial differences between the three examined countries in terms of overall development and recognition of CSR. Based on the Baltic Working Environment and Labor survey conducted among Estonian, Latvian and Lithuanian employers on 2006 it turned out that in all countries roughly 75-80% of employers observe principles of corporate social responsibility in their business operations. Additionally, respondents from all countries evaluated their knowledge about ideas of CSR and potential benefits from introducing a CSR policy rather similarly.
We used some control variables to assess the value of the composed CSR index. In the area of corporate social responsibility issues such as equal opportunities for women and men, prospects for training, opportunities to have personal say and to influence management’s decisions are of great importance. Therefore we checked for possible relationships between the composed index and the above mentioned issues. As presented in Appendix 3, Spearman correlation coefficients show weak, but positive and statistically significant relationships between initial variables and CSR index, thus reflecting that in companies which turn more attention to corporate social responsibility according to employees’ view, during last years employees also have realized better opportunities for training, regarding personal say concerning wages and conditions, influence of management decisions, more equal opportunities for women and men as well as improved work safety. This result is consistent with our expectations.
Second, the survey questions about desired future improvements regarding employee engagement such as more power for safety representatives or safety committees to raise issues with management and more cooperation between managers and workers on health and safety issues have been correlated with CSR index. Spearman correlation coefficients (see Appendix 3) indicate to weak, but statistically significant negative relationships. This means that in companies that are more engaged with CSR employees are less eager to desire more engagement. This result verifies our assumption that in companies with more CSR employees already are more engaged in various company processes.
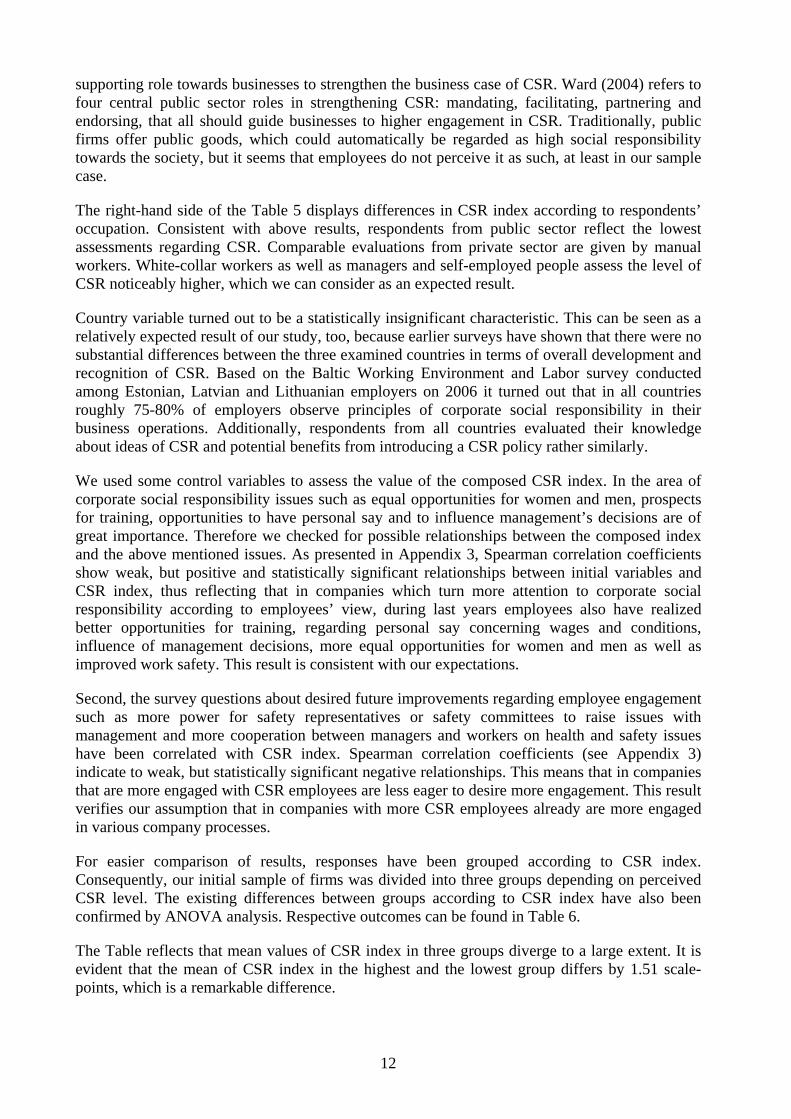
For easier comparison of results, responses have been grouped according to CSR index. Consequently, our initial sample of firms was divided into three groups depending on perceived CSR level. The existing differences between groups according to CSR index have also been confirmed by ANOVA analysis. Respective outcomes can be found in Table 6.
The Table reflects that mean values of CSR index in three groups diverge to a large extent. It is evident that the mean of CSR index in the highest and the lowest group differs by 1.51 scale-points, which is a remarkable difference.
13
Table 6. Results of ANOVA test for the differences in CSR index on the basis of firm groups
Mean SD N High level of CSR 1.32 0.258 1217 Medium level of CSR 1.97 0.110 1292 Low level of CSR 2.73 0.439 1086 ANOVA test F-statistic
p-value 6719.24 0.000***
Notes: N=sample size; SD=standard deviation; ***= differences in means are significant at 0.01 level.
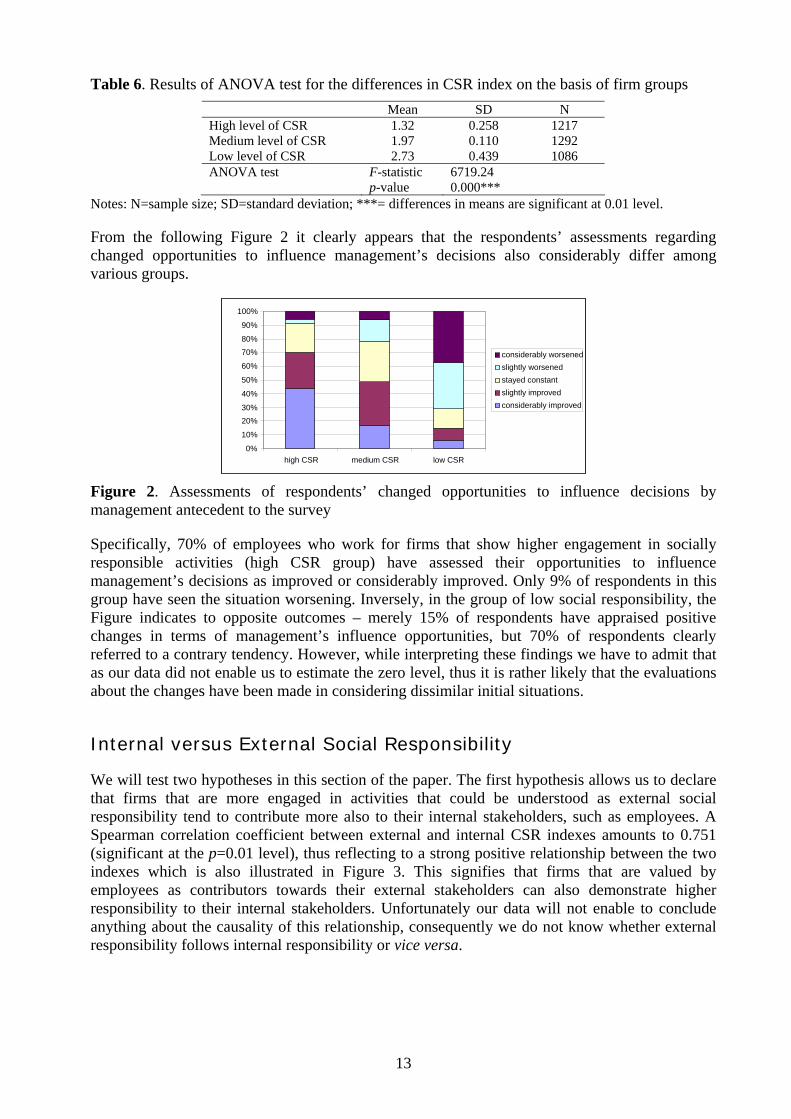
From the following Figure 2 it clearly appears that the respondents’ assessments regarding changed opportunities to influence management’s decisions also considerably differ among various groups.
Figure 2. Assessments of respondents’ changed opportunities to influence decisions by management antecedent to the survey
Specifically, 70% of employees who work for firms that show higher engagement in socially responsible activities (high CSR group) have assessed their opportunities to influence management’s decisions as improved or considerably improved. Only 9% of respondents in this group have seen the situation worsening. Inversely, in the group of low social responsibility, the Figure indicates to opposite outcomes – merely 15% of respondents have appraised positive changes in terms of management’s influence opportunities, but 70% of respondents clearly referred to a contrary tendency. However, while interpreting these findings we have to admit that as our data did not enable us to estimate the zero level, thus it is rather likely that the evaluations about the changes have been made in considering dissimilar initial situations.
Internal versus External Social Responsibility
We will test two hypotheses in this section of the paper. The first hypothesis allows us to declare that firms that are more engaged in activities that could be understood as external social responsibility tend to contribute more also to their internal stakeholders, such as employees. A Spearman correlation coefficient between external and internal CSR indexes amounts to 0.751 (significant at the p=0.01 level), thus reflecting to a strong positive relationship between the two indexes which is also illustrated in Figure 3. This signifies that firms that are valued by employees as contributors towards their external stakeholders can also demonstrate higher responsibility to their internal stakeholders. Unfortunately our data will not enable to conclude anything about the causality of this relationship, consequently we do not know whether external responsibility follows internal responsibility or vice versa.
0%
10%
20%30%
40%
50%
60%
70%80%
90%
100%
high CSR medium CSR low CSR
considerably worsenedslightly worsenedstayed constantslightly improved considerably improved

14
1.0
1.5
2.0
2.5
3.0
3.5
4.0
1 1.5 2 2.5 3 3.5 4
External CSR index
Inte
rnal
CSR
inde
x
Figure 3. Relationship between external and internal CSR indexes (N=2861)
Our second hypothesis declares that managers’ and employees’ assessments of external CSR are closer than their assessments of internal CSR. Based on the available data it is unfortunately not possible to extract managers’ views, because managers and top specialists were allocated to the same category in the questionnaire. Therefore our interpretations remain rather speculative on this matter. Nevertheless, if we look at mean values of internal CSR index according to the respondents’ occupation (see Figure 4), it turns out that employees and workers from public sector are the least evaluating their organizations’ internal social responsibility (mean value over 2.00), while self-employed people’s assessments are the highest. The latter is rather self-evident in case of self-employment one has to assess his or her own work. However, managers and top specialists as one group do not show the highest assessments regarding internal CSR as was expected. Internal CSR index remains between 1.69 (self-employed) and 2.10 (public sector manual worker), which does not indicate a big difference between occupation categories and remains in any cases relatively close to the judgment of “rather satisfied”. However, ANOVA analysis demonstrated that the differences between categories are still statistically significant.
1.00 1.25 1.50 1.75 2.00 2.25 2.50
self-employed/farmer
w orker in private sector (not physicalw ork)
clerk (public sector)
manager, top specialist
manual w orker in public sector
w orker in private sector
External CSR
Internal CSR
Figure 4. Mean values of internal and external CSR index based on occupation of respondents
The second hypothesis also applies to assessments regarding external CSR, declaring that there are no significant differences between employees’ and managers’ views. In statistical terms, differences between occupation categories are less distinguishable indeed, but still statistically significant according to ANOVA analysis. The mean values of external CSR index remain between 2.08 (workers in private sector) and 1.83 (self-employed), thus the variation between occupation groups is rather low. As we can see from Figure 3, assessments of various occupation representatives noticeably differ from others only in case of self-employed people and employees in private sector.
15
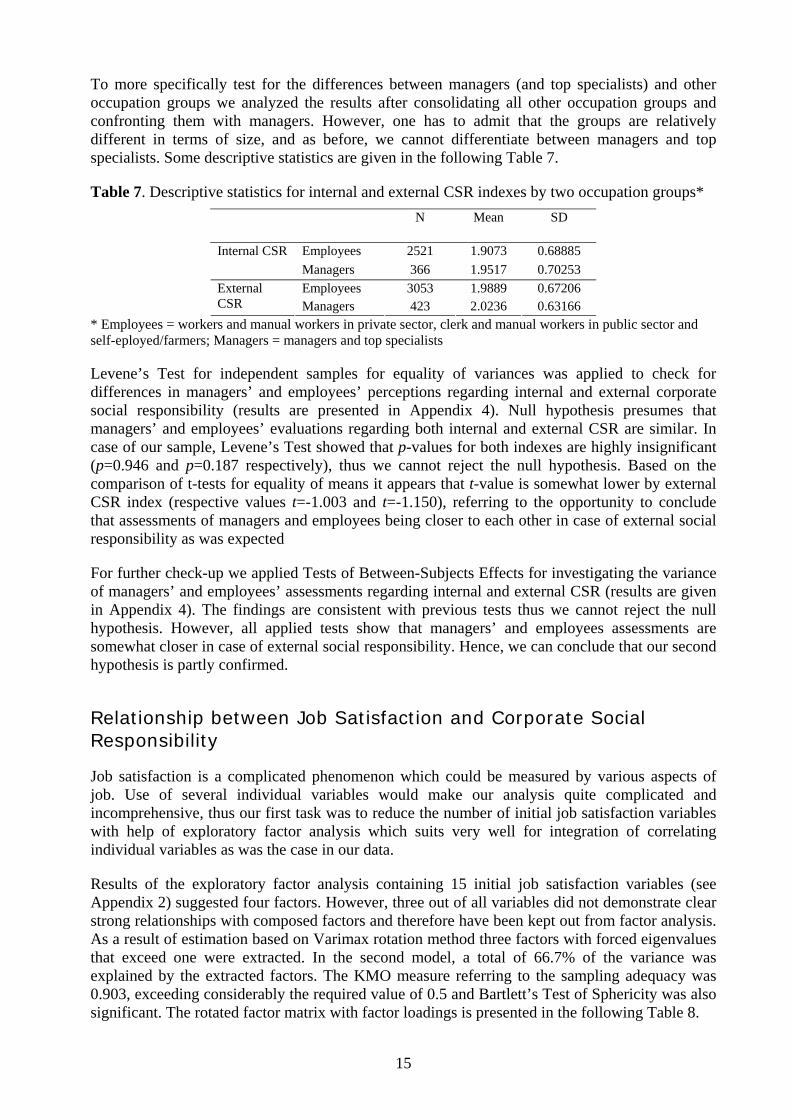
To more specifically test for the differences between managers (and top specialists) and other occupation groups we analyzed the results after consolidating all other occupation groups and confronting them with managers. However, one has to admit that the groups are relatively different in terms of size, and as before, we cannot differentiate between managers and top specialists. Some descriptive statistics are given in the following Table 7.
Table 7. Descriptive statistics for internal and external CSR indexes by two occupation groups* N Mean SD
Employees 2521 1.9073 0.68885 Internal CSR Managers 366 1.9517 0.70253 Employees 3053 1.9889 0.67206 External
CSR Managers 423 2.0236 0.63166 * Employees = workers and manual workers in private sector, clerk and manual workers in public sector and self-eployed/farmers; Managers = managers and top specialists
Levene’s Test for independent samples for equality of variances was applied to check for differences in managers’ and employees’ perceptions regarding internal and external corporate social responsibility (results are presented in Appendix 4). Null hypothesis presumes that managers’ and employees’ evaluations regarding both internal and external CSR are similar. In case of our sample, Levene’s Test showed that p-values for both indexes are highly insignificant (p=0.946 and p=0.187 respectively), thus we cannot reject the null hypothesis. Based on the comparison of t-tests for equality of means it appears that t-value is somewhat lower by external CSR index (respective values t=-1.003 and t=-1.150), referring to the opportunity to conclude that assessments of managers and employees being closer to each other in case of external social responsibility as was expected
For further check-up we applied Tests of Between-Subjects Effects for investigating the variance of managers’ and employees’ assessments regarding internal and external CSR (results are given in Appendix 4). The findings are consistent with previous tests thus we cannot reject the null hypothesis. However, all applied tests show that managers’ and employees assessments are somewhat closer in case of external social responsibility. Hence, we can conclude that our second hypothesis is partly confirmed.
Relationship between Job Satisfaction and Corporate Social Responsibility
Job satisfaction is a complicated phenomenon which could be measured by various aspects of job. Use of several individual variables would make our analysis quite complicated and incomprehensive, thus our first task was to reduce the number of initial job satisfaction variables with help of exploratory factor analysis which suits very well for integration of correlating individual variables as was the case in our data.
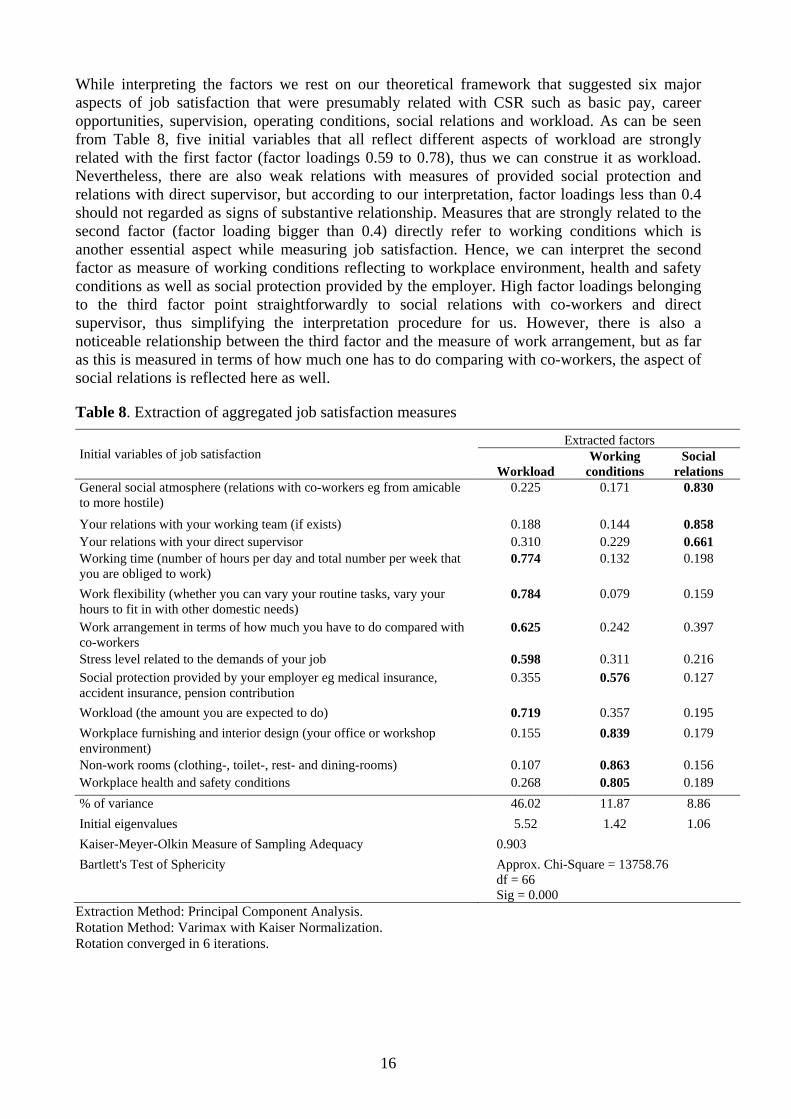
Results of the exploratory factor analysis containing 15 initial job satisfaction variables (see Appendix 2) suggested four factors. However, three out of all variables did not demonstrate clear strong relationships with composed factors and therefore have been kept out from factor analysis. As a result of estimation based on Varimax rotation method three factors with forced eigenvalues that exceed one were extracted. In the second model, a total of 66.7% of the variance was explained by the extracted factors. The KMO measure referring to the sampling adequacy was 0.903, exceeding considerably the required value of 0.5 and Bartlett’s Test of Sphericity was also significant. The rotated factor matrix with factor loadings is presented in the following Table 8.
16
While interpreting the factors we rest on our theoretical framework that suggested six major aspects of job satisfaction that were presumably related with CSR such as basic pay, career opportunities, supervision, operating conditions, social relations and workload. As can be seen from Table 8, five initial variables that all reflect different aspects of workload are strongly related with the first factor (factor loadings 0.59 to 0.78), thus we can construe it as workload. Nevertheless, there are also weak relations with measures of provided social protection and relations with direct supervisor, but according to our interpretation, factor loadings less than 0.4 should not regarded as signs of substantive relationship. Measures that are strongly related to the second factor (factor loading bigger than 0.4) directly refer to working conditions which is another essential aspect while measuring job satisfaction. Hence, we can interpret the second factor as measure of working conditions reflecting to workplace environment, health and safety conditions as well as social protection provided by the employer. High factor loadings belonging to the third factor point straightforwardly to social relations with co-workers and direct supervisor, thus simplifying the interpretation procedure for us. However, there is also a noticeable relationship between the third factor and the measure of work arrangement, but as far as this is measured in terms of how much one has to do comparing with co-workers, the aspect of social relations is reflected here as well.
Table 8. Extraction of aggregated job satisfaction measures
Extracted factors Initial variables of job satisfaction
Workload Working
conditions Social
relations General social atmosphere (relations with co-workers eg from amicable to more hostile)
0.225 0.171 0.830
Your relations with your working team (if exists) 0.188 0.144 0.858 Your relations with your direct supervisor 0.310 0.229 0.661 Working time (number of hours per day and total number per week that you are obliged to work)
0.774 0.132 0.198
Work flexibility (whether you can vary your routine tasks, vary your hours to fit in with other domestic needs)
0.784 0.079 0.159
Work arrangement in terms of how much you have to do compared with co-workers
0.625 0.242 0.397
Stress level related to the demands of your job 0.598 0.311 0.216 Social protection provided by your employer eg medical insurance, accident insurance, pension contribution
0.355 0.576 0.127
Workload (the amount you are expected to do) 0.719 0.357 0.195 Workplace furnishing and interior design (your office or workshop environment)
0.155 0.839 0.179
Non-work rooms (clothing-, toilet-, rest- and dining-rooms) 0.107 0.863 0.156 Workplace health and safety conditions 0.268 0.805 0.189 % of variance 46.02 11.87 8.86 Initial eigenvalues 5.52 1.42 1.06 Kaiser-Meyer-Olkin Measure of Sampling Adequacy 0.903 Bartlett's Test of Sphericity Approx. Chi-Square = 13758.76
df = 66 Sig = 0.000
Extraction Method: Principal Component Analysis. Rotation Method: Varimax with Kaiser Normalization. Rotation converged in 6 iterations.
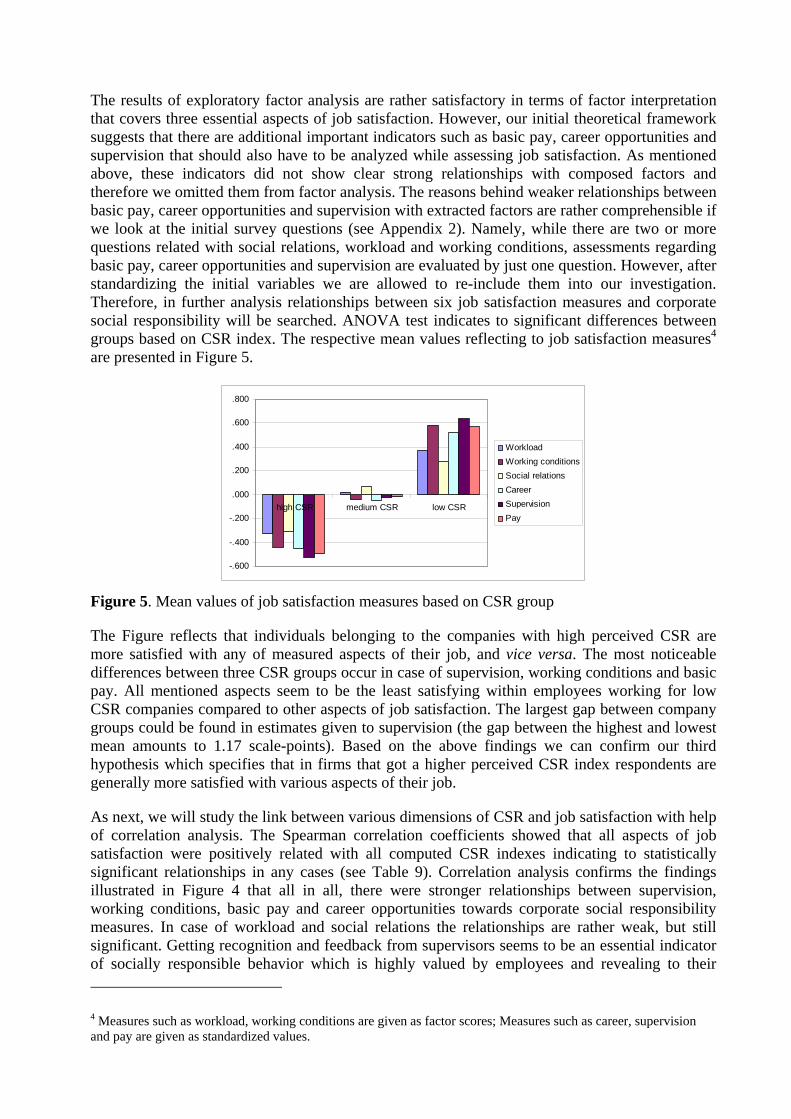
The results of exploratory factor analysis are rather satisfactory in terms of factor interpretation that covers three essential aspects of job satisfaction. However, our initial theoretical framework suggests that there are additional important indicators such as basic pay, career opportunities and supervision that should also have to be analyzed while assessing job satisfaction. As mentioned above, these indicators did not show clear strong relationships with composed factors and therefore we omitted them from factor analysis. The reasons behind weaker relationships between basic pay, career opportunities and supervision with extracted factors are rather comprehensible if we look at the initial survey questions (see Appendix 2). Namely, while there are two or more questions related with social relations, workload and working conditions, assessments regarding basic pay, career opportunities and supervision are evaluated by just one question. However, after standardizing the initial variables we are allowed to re-include them into our investigation. Therefore, in further analysis relationships between six job satisfaction measures and corporate social responsibility will be searched. ANOVA test indicates to significant differences between groups based on CSR index. The respective mean values reflecting to job satisfaction measures4 are presented in Figure 5.
-.600
-.400
-.200
.000
.200
.400
.600
.800
high CSR medium CSR low CSR
WorkloadWorking conditionsSocial relationsCareerSupervisionPay
Figure 5. Mean values of job satisfaction measures based on CSR group
The Figure reflects that individuals belonging to the companies with high perceived CSR are more satisfied with any of measured aspects of their job, and vice versa. The most noticeable differences between three CSR groups occur in case of supervision, working conditions and basic pay. All mentioned aspects seem to be the least satisfying within employees working for low CSR companies compared to other aspects of job satisfaction. The largest gap between company groups could be found in estimates given to supervision (the gap between the highest and lowest mean amounts to 1.17 scale-points). Based on the above findings we can confirm our third hypothesis which specifies that in firms that got a higher perceived CSR index respondents are generally more satisfied with various aspects of their job.
As next, we will study the link between various dimensions of CSR and job satisfaction with help of correlation analysis. The Spearman correlation coefficients showed that all aspects of job satisfaction were positively related with all computed CSR indexes indicating to statistically significant relationships in any cases (see Table 9). Correlation analysis confirms the findings illustrated in Figure 4 that all in all, there were stronger relationships between supervision, working conditions, basic pay and career opportunities towards corporate social responsibility measures. In case of workload and social relations the relationships are rather weak, but still significant. Getting recognition and feedback from supervisors seems to be an essential indicator of socially responsible behavior which is highly valued by employees and revealing to their 4 Measures such as workload, working conditions are given as factor scores; Measures such as career, supervision and pay are given as standardized values.
18
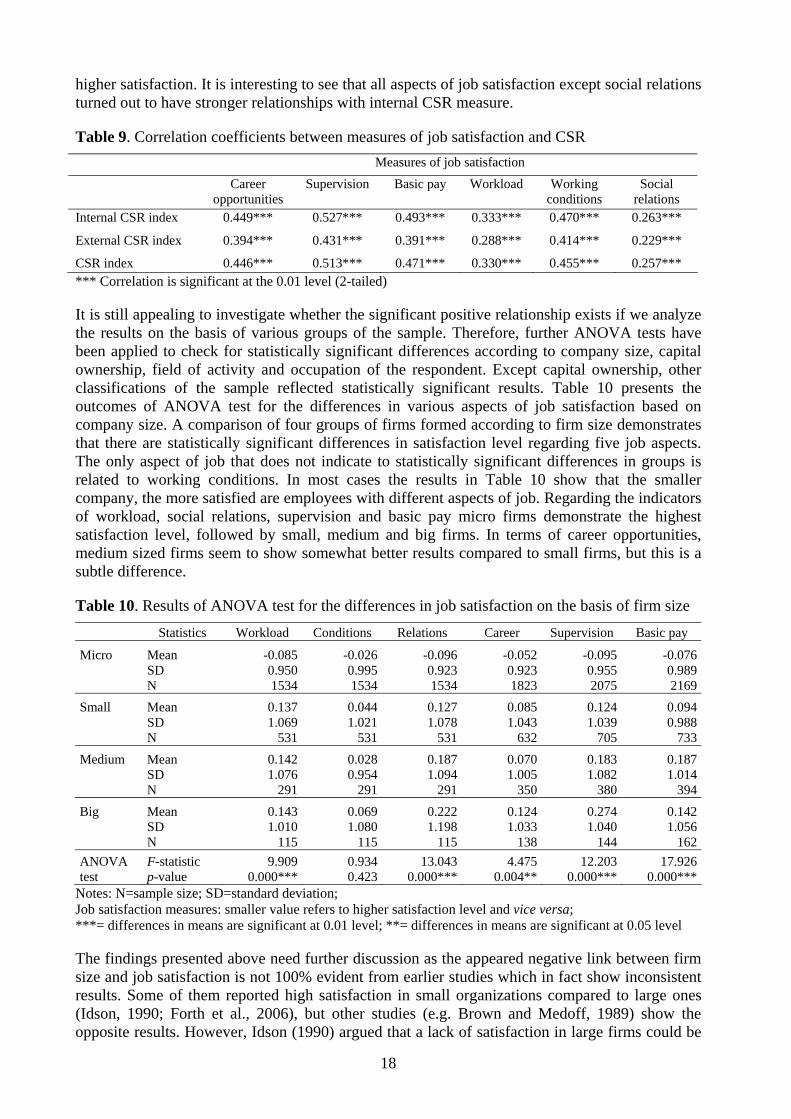
higher satisfaction. It is interesting to see that all aspects of job satisfaction except social relations turned out to have stronger relationships with internal CSR measure.
Table 9. Correlation coefficients between measures of job satisfaction and CSR Measures of job satisfaction Career
opportunities Supervision Basic pay Workload Working
conditions Social
relations Internal CSR index 0.449*** 0.527*** 0.493*** 0.333*** 0.470*** 0.263***
External CSR index 0.394*** 0.431*** 0.391*** 0.288*** 0.414*** 0.229***
CSR index 0.446*** 0.513*** 0.471*** 0.330*** 0.455*** 0.257*** *** Correlation is significant at the 0.01 level (2-tailed)
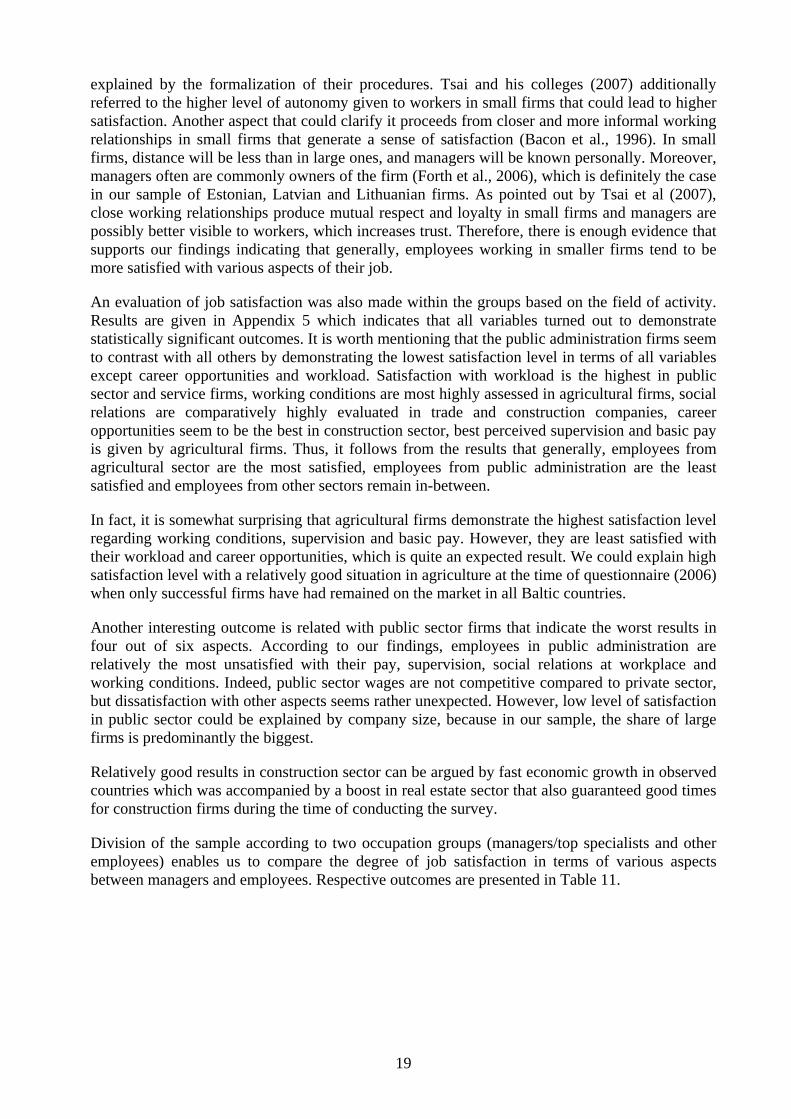
It is still appealing to investigate whether the significant positive relationship exists if we analyze the results on the basis of various groups of the sample. Therefore, further ANOVA tests have been applied to check for statistically significant differences according to company size, capital ownership, field of activity and occupation of the respondent. Except capital ownership, other classifications of the sample reflected statistically significant results. Table 10 presents the outcomes of ANOVA test for the differences in various aspects of job satisfaction based on company size. A comparison of four groups of firms formed according to firm size demonstrates that there are statistically significant differences in satisfaction level regarding five job aspects. The only aspect of job that does not indicate to statistically significant differences in groups is related to working conditions. In most cases the results in Table 10 show that the smaller company, the more satisfied are employees with different aspects of job. Regarding the indicators of workload, social relations, supervision and basic pay micro firms demonstrate the highest satisfaction level, followed by small, medium and big firms. In terms of career opportunities, medium sized firms seem to show somewhat better results compared to small firms, but this is a subtle difference.
Table 10. Results of ANOVA test for the differences in job satisfaction on the basis of firm size
Statistics Workload Conditions Relations Career Supervision Basic pay
Micro
Mean SD N
-0.085 0.950 1534
-0.0260.9951534
-0.0960.9231534
-0.0520.9231823
-0.095 0.955 2075
-0.0760.9892169
Small
Mean SD N
0.137 1.069
531
0.0441.021
531
0.1271.078
531
0.0851.043
632
0.124 1.039
705
0.0940.988
733Medium
Mean SD N
0.142 1.076
291
0.0280.954
291
0.1871.094
291
0.0701.005
350
0.183 1.082
380
0.1871.014
394Big
Mean SD N
0.143 1.010
115
0.0691.080
115
0.2221.198
115
0.1241.033
138
0.274 1.040
144
0.1421.056
162ANOVA test
F-statistic p-value
9.909 0.000***
0.9340.423
13.0430.000***
4.4750.004**
12.203 0.000***
17.9260.000***
Notes: N=sample size; SD=standard deviation; Job satisfaction measures: smaller value refers to higher satisfaction level and vice versa; ***= differences in means are significant at 0.01 level; **= differences in means are significant at 0.05 level
The findings presented above need further discussion as the appeared negative link between firm size and job satisfaction is not 100% evident from earlier studies which in fact show inconsistent results. Some of them reported high satisfaction in small organizations compared to large ones (Idson, 1990; Forth et al., 2006), but other studies (e.g. Brown and Medoff, 1989) show the opposite results. However, Idson (1990) argued that a lack of satisfaction in large firms could be
19
explained by the formalization of their procedures. Tsai and his colleges (2007) additionally referred to the higher level of autonomy given to workers in small firms that could lead to higher satisfaction. Another aspect that could clarify it proceeds from closer and more informal working relationships in small firms that generate a sense of satisfaction (Bacon et al., 1996). In small firms, distance will be less than in large ones, and managers will be known personally. Moreover, managers often are commonly owners of the firm (Forth et al., 2006), which is definitely the case in our sample of Estonian, Latvian and Lithuanian firms. As pointed out by Tsai et al (2007), close working relationships produce mutual respect and loyalty in small firms and managers are possibly better visible to workers, which increases trust. Therefore, there is enough evidence that supports our findings indicating that generally, employees working in smaller firms tend to be more satisfied with various aspects of their job.
An evaluation of job satisfaction was also made within the groups based on the field of activity. Results are given in Appendix 5 which indicates that all variables turned out to demonstrate statistically significant outcomes. It is worth mentioning that the public administration firms seem to contrast with all others by demonstrating the lowest satisfaction level in terms of all variables except career opportunities and workload. Satisfaction with workload is the highest in public sector and service firms, working conditions are most highly assessed in agricultural firms, social relations are comparatively highly evaluated in trade and construction companies, career opportunities seem to be the best in construction sector, best perceived supervision and basic pay is given by agricultural firms. Thus, it follows from the results that generally, employees from agricultural sector are the most satisfied, employees from public administration are the least satisfied and employees from other sectors remain in-between.
In fact, it is somewhat surprising that agricultural firms demonstrate the highest satisfaction level regarding working conditions, supervision and basic pay. However, they are least satisfied with their workload and career opportunities, which is quite an expected result. We could explain high satisfaction level with a relatively good situation in agriculture at the time of questionnaire (2006) when only successful firms have had remained on the market in all Baltic countries.
Another interesting outcome is related with public sector firms that indicate the worst results in four out of six aspects. According to our findings, employees in public administration are relatively the most unsatisfied with their pay, supervision, social relations at workplace and working conditions. Indeed, public sector wages are not competitive compared to private sector, but dissatisfaction with other aspects seems rather unexpected. However, low level of satisfaction in public sector could be explained by company size, because in our sample, the share of large firms is predominantly the biggest.
Relatively good results in construction sector can be argued by fast economic growth in observed countries which was accompanied by a boost in real estate sector that also guaranteed good times for construction firms during the time of conducting the survey.
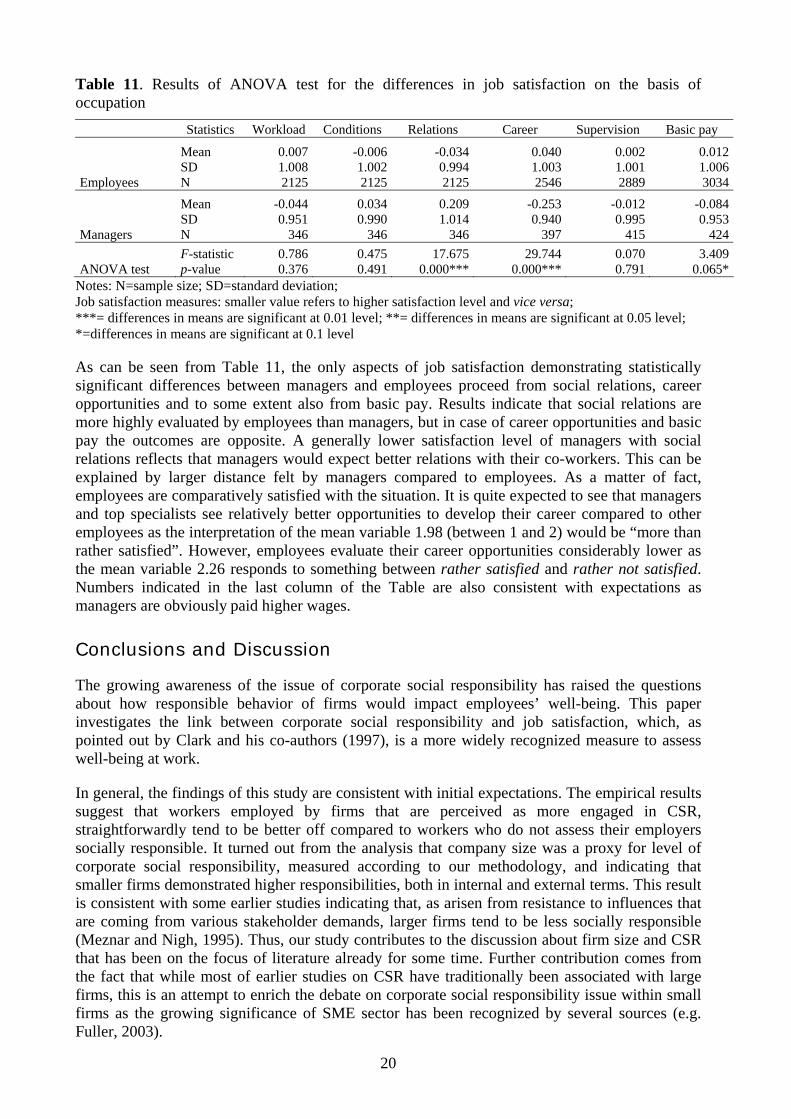
Division of the sample according to two occupation groups (managers/top specialists and other employees) enables us to compare the degree of job satisfaction in terms of various aspects between managers and employees. Respective outcomes are presented in Table 11.
20
Table 11. Results of ANOVA test for the differences in job satisfaction on the basis of occupation
Statistics Workload Conditions Relations Career Supervision Basic pay
Employees
Mean SD N
0.007 1.008 2125
-0.0061.0022125
-0.0340.9942125
0.040 1.003 2546
0.002 1.001 2889
0.0121.0063034
Managers
Mean SD N
-0.044 0.951
346
0.0340.990
346
0.2091.014
346
-0.253 0.940
397
-0.012 0.995
415
-0.0840.953
424
ANOVA test F-statistic p-value
0.786 0.376
0.4750.491
17.6750.000***
29.744 0.000***
0.070 0.791
3.4090.065*
Notes: N=sample size; SD=standard deviation; Job satisfaction measures: smaller value refers to higher satisfaction level and vice versa; ***= differences in means are significant at 0.01 level; **= differences in means are significant at 0.05 level; *=differences in means are significant at 0.1 level
As can be seen from Table 11, the only aspects of job satisfaction demonstrating statistically significant differences between managers and employees proceed from social relations, career opportunities and to some extent also from basic pay. Results indicate that social relations are more highly evaluated by employees than managers, but in case of career opportunities and basic pay the outcomes are opposite. A generally lower satisfaction level of managers with social relations reflects that managers would expect better relations with their co-workers. This can be explained by larger distance felt by managers compared to employees. As a matter of fact, employees are comparatively satisfied with the situation. It is quite expected to see that managers and top specialists see relatively better opportunities to develop their career compared to other employees as the interpretation of the mean variable 1.98 (between 1 and 2) would be “more than rather satisfied”. However, employees evaluate their career opportunities considerably lower as the mean variable 2.26 responds to something between rather satisfied and rather not satisfied. Numbers indicated in the last column of the Table are also consistent with expectations as managers are obviously paid higher wages. Conclusions and Discussion
The growing awareness of the issue of corporate social responsibility has raised the questions about how responsible behavior of firms would impact employees’ well-being. This paper investigates the link between corporate social responsibility and job satisfaction, which, as pointed out by Clark and his co-authors (1997), is a more widely recognized measure to assess well-being at work.
In general, the findings of this study are consistent with initial expectations. The empirical results suggest that workers employed by firms that are perceived as more engaged in CSR, straightforwardly tend to be better off compared to workers who do not assess their employers socially responsible. It turned out from the analysis that company size was a proxy for level of corporate social responsibility, measured according to our methodology, and indicating that smaller firms demonstrated higher responsibilities, both in internal and external terms. This result is consistent with some earlier studies indicating that, as arisen from resistance to influences that are coming from various stakeholder demands, larger firms tend to be less socially responsible (Meznar and Nigh, 1995). Thus, our study contributes to the discussion about firm size and CSR that has been on the focus of literature already for some time. Further contribution comes from the fact that while most of earlier studies on CSR have traditionally been associated with large firms, this is an attempt to enrich the debate on corporate social responsibility issue within small firms as the growing significance of SME sector has been recognized by several sources (e.g. Fuller, 2003).
21
While analyzing the relationships between CSR and different aspects of job satisfaction such as workload, working conditions, social relations, career opportunities, supervision and basic pay the findings clearly showed that employees working for low CSR companies obviously felt less satisfied with any aspects of job. The largest gap between assessments of employees in low and high CSR companies derives from the estimates given to supervision, basic pay and working conditions. Hence, these can be interpreted as the most essential factors indicating to positive relationships between CSR and job satisfaction. The confirmed positive link between corporate social responsibility and job satisfaction has important implications. As employees feel better off in firms that commit themselves more to socially responsible activities, it indicates that developing socially responsible practices can be seen as a means to enhance job satisfaction among the employees in the workplace. As indicated by Brammer et al (2005), greater job satisfaction is expected to augment organizational commitment.
An essential contribution of the present study was the assessment of the link between internal and external social responsibility which, to the knowledge of authors of this paper, has not been investigated before. It is interesting to see that firms that do more activities in favor of their external stakeholders are also seen as higher contributors towards their employees. According to our interpretation, this may be an evidence of the fact that firms do not only attempt to show their external responsibility to build a better image or reputation, as declared by the critics, but while demonstrating a higher external responsibility they are simultaneously fulfilling their obligations towards employees. Hence, our findings confirm the raised hypothesis stating that assessments of internal CSR are higher in firms that are viewed as more engaged in external social responsibility.
One out of three hypotheses has found only partial support by empirical outcomes of the study. Namely, based on theoretical considerations and review of literature we assumed that assessments of managers and employees being closer to each other regarding external CSR compared to the assessments about internal CSR. The presumed inconsistency in mangers’ and employees’ assessments proceeds from the conflicting goals that these groups have in relation with the firm. Our results show that employees do have somewhat higher assessments regarding corporate social responsibility, either evaluated through internal or external measures. This finding is a bit unexpected, as managers’ assessments in fact reflect their self-evaluation results, which supposed to be more highly assessed. The possible explanation for this arises from the fact that due to the limitations of the sample it was not possible to separate managers from top specialists, thus managers’ evaluations also include top specialists’ ones. Notwithstanding of this our findings demonstrate that employees’ and managers’ assessments regarding external responsibility were closer to each other.
An interesting outcome of the study reveals that based on the sample of Estonian, Latvian and Lithuanian firms, the majority of which are micro or small sized, one can conclude that the smaller company, the more employees feel satisfied with various aspects of job. This is a rather surprising result, because in several studies higher satisfaction with work has been associated with larger companies, proceeding from the fact that large firms possess more resources that can be used for paying higher wages or providing better working conditions (Brown and Medoff, 1989) to their employees. However, there are a number of studies emphasizing factors that unfavorably influence employees at large firms such as lower autonomy level (Tsai et al, 2007), formalization of procedures (Idson, 1990) and relationships (Bacon et al, 1996) as well as big distance between managers and employees (Forth et al, 2006). All these factors can be regarded as supporting evidence of our findings demonstrating that employees are more satisfied in smaller firms.
22
References Bacon, N., Ackers, P., Storey, J. & Coates, D. (1996) It’s a small world: Managing human resources in small
businesses. International Journal of Human Resource Management 7, pp. 83–100. Brammer, S., Millington, A., Rayton, B. (2005) The Contribution of Corporate Social Responsibility to
Organisational Commitment, University of Bath School of Management Working Paper Series, 20, 37 p. Brown, C., Medoff, J. (1989) The employer size-wage effect. Journal of Political Economy 97, pp. 1027-1059. Carroll, A. (1991) The pyramid of corporate social responsibility: Toward the moral management of
organizational stakeholders, Business Horizons, 34(4), pp. 39-48. Clark, A.E., Georgellis, Y., Sanfey, P. (1997) Job satisfaction, wage changes and quits. Evidence from
Germany. Discussion Paper No. 97/11, University of Kent at Canterbury. Claydon, T., Doyle, M. (1996) Trusting Me, Trusting You? The Ethics of Employee Empowerment, Personnel
Review 25(6), pp. 13-25. Cooper C.L., Rout U., Faragher B. (1989) Mental health, job satisfaction, and job stress among general
practitioners. British Medical Jorunal 298, pp. 366–370. Estonian Statistical Office (2007) http://pub.stat.ee/px-
web.2001/Database/Majandus/10Majandusuksused/02Ettevetjad/02Ettevetjad.asp Forth, J., Bewley, H. & Bryson, A. (2006) Small and medium-sized enterprises: Findings from the 2004
Workplace Employment Relations Survey. London: Department of Trade and Industry. Frankental, P. (2001) Corporate social responsibility – a PR invention? Corporate Communications: An
International Journal 6(1), pp. 18-23. Freeman, R.E. (1984) Stakeholder Management: Framework and Philosophy, Pitman, Mansfield, MA. Fuller, T. (2003) Small Business Futures in Society. Futures 35(4), pp. 297-304. Gavin, J.F., Maynard, W.S. (1975) Perceptions of Corporate Social Responsibility, Personnel Psychology, 28,
pp. 377-387. Gray, R., Kouhy, R., Lavers, S. (1995) Corporate Social and Environmental Reporting: A Review of the
Literature and a Longitudinal Study of UK Disclosure, Accounting, Auditing and Accountability Journal 8(2), pp. 47-77.
Greenwood, M. (2007) Stakeholder Engagement: Beyond the Myth of Corporate Responsibility, Journal of Business Ethics, 74, pp. 315-327.
Idson, T.L. (1990) Establishment size, job satisfaction and the structure of work. Applied Economics, 22, pp. 1007-1018.
Koh, H.C., Boo, E.H.Y. (2001) The Link Between Organizational Ethics and Job Satisfaction: A Study of Managers in Singapore. Journal of Business Ethics 29, pp. 309-324.
Macey, W.H., Schneider, B. (2008) The Meaning of Employee Engagement, Industrial and Organizational Psychology 1, pp. 3–30.
Maignan, I., Ferrell, O.C., Ferrell, L. (2005) A stakeholder model for implementing social responsibility in marketing. European Journal of Marketing 39(9/10), pp. 956-977.
McWilliams, A., Siegel, D. (2001) Corporate Social Responsibility: A Theory of the Firm Perspective. The Academy of Management Review 26(1), pp. 117-127.
Meznar, M.B., Nigh, D. (1995) Buffer or Bridge? Environmental and Organizational Determinants of Public Affairs Activities in American Firms, Academy of Management Journal 38, pp. 975-996.
Midttun, A. (2007) Corporate responsibility from a resource and knowledge perspective. Towards a dynamic reinterpretation of C(S)R: are corporate responsibility and innovation compatible or contradictory? Corporate Governance 7(4), pp. 401-413.
O’Riordan, L., Fairbrass, J. (2008) Corporate Social Responsibility (CSR): Models and Theories in Stakeholder Dialogue, Journal of Business Ethics 83, pp. 745-758.
Oshagbemi, T. (1999) Overall job satisfaction: how good are single versus multiple-item measures? Journal of Managerial Psychology 14(5), pp. 388-403.
Portney, P.R. (2008) The (Not So) New Corporate Social Responsibility: An Empirical Perspective, Review of Environmental Economics and Policy 2(2), pp. 261-275.
Rupp, D.E., Ganapathi, J., Aguilera, R.V., Williams, C.A. (2006) Employee reactions to corporate social responsibility: an organizational justice framework. Journal of Organizational Behaviour 27, pp. 537–543.
Sousa-Poza, A., Sousa-Poza, A.A. (2000) Well-being at work: a cross-national analysis of the levels and determinants of job satisfaction. Journal of Socio-Economics 29, pp. 517-538.
Steurer, R., Langer, M.E., Konrad, A., Martinuzzi, A. (2005) Corporations, Stakeholders and Sustainable Development I: A Theoretical Exploration of Business-Society Relations, Journal of Business Ethics, 61, pp. 263-281.
23
Tsai, C-J., Sengupta, S., Edwards, P. (2007) When and why is small beautiful? The experience of work in the small firm. Human Relations 60, pp. 1779-1808.
Tuzzolino, F., Armandi, B.R. (1981) A Need-Hierarchy Framework for Assessing Corporate Social Responsibility, Academy of Management Review 6(1), pp. 21-28.
Valentine, S., Fleischman, G. (2008) Ethics Programs, Perceived Corporate Social Responsibility and Job Satisfaction, Journal of Business Ethics 77, pp. 159-172.
Vitell, S.J., Davis, D.L. (1990) The relationship between ethics and job satisfaction: An empirical investigation. Journal of Business Ethics 9(6), pp. 489-494.
Ward, H. (2004) Public Sector Roles in Strengthening Corporate Social Responsibility: Taking Stock. The World Bank Report, January 2004.
Wheeler, D., Svendsen, A.C., Boutilier, R.G., Abbott, R.M. (2001) Measuring the Business Value of Stakeholder Relationships. Centre for Innovation and Management (CIM) Research Paper, 37 p.
Wheeler, D., Sillanpää, M. (1997) The stakeholder corporation. London: Pitman.
Appendix 1. Description of the sample Feature Division of respondents by respective feature Country Latvia
34% Estonia
33% Lithuania
33%
Firm size Micro (1-9)63%
Small (10-49)21%
Medium (50-249)
11%
Big (over 250) 4%
Capital ownership
Local 86%
Local+foreign 8%
Foreign 6%
Field of activity
Services 44%
Trade 20%
Manufacturing 19% Construction
8% Agriculture
5% Public
administration 4%
Respondent’s occupation
Employee in private sector 44%
Manual worker in
private sector 26%
Manager/top specialist
12%
Clerk (public sector) 10%
Manual worker in
public sector 6%
Self-employed/
farmer 2%
Respondent’s age
25-34 years29%
35-44 years 27%
45-54 years 21% 18-24 years
14% Over 55 years
9%
Respondent’s gender
Female 62%
Male 38%
25
Appendix 2. Selected survey questions for assessing satisfaction with various aspects of job To what extent are you satisfied with following aspects of your workplace? In other words, are you totally satisfied, rather satisfied, rather not satisfied or not satisfied at all?
Totally satisfied
Rather satisfied
Rather not
satisfied
Not satisfied
at all
Career opportunities i.e. chances for promotion in your job 1 2 3 4
General social atmosphere (relations with co-workers e.g. from amicable to more hostile) 1 2 3 4
Your relations with your working team (if exists) 1 2 3 4
Your relations with your direct supervisor 1 2 3 4
Working time (number of hours per day and total number per week that you are obliged to work) 1 2 3 4
Work flexibility (whether you can vary your routine tasks, vary your hours to fit in with other domestic needs) 1 2 3 4
Work arrangement in terms of how much you have to do compared with co-workers 1 2 3 4
Recognition and feedback on your work performance from your superiors 1 2 3 4
Stress level related to the demands of your job 1 2 3 4
Basic pay (rate per hour or salary per week/month) 1 2 3 4
Social protection provided by your employer eg medical insurance, accident insurance, pension contribution 1 2 3 4
Workload (the amount you are expected to do) 1 2 3 4
Workplace furnishing and interior design (your office or workshop environment) 1 2 3 4
Non-work rooms (clothing -, toilet-, washing- rest and eating rooms) 1 2 3 4
Workplace health and safety conditions 1 2 3 4
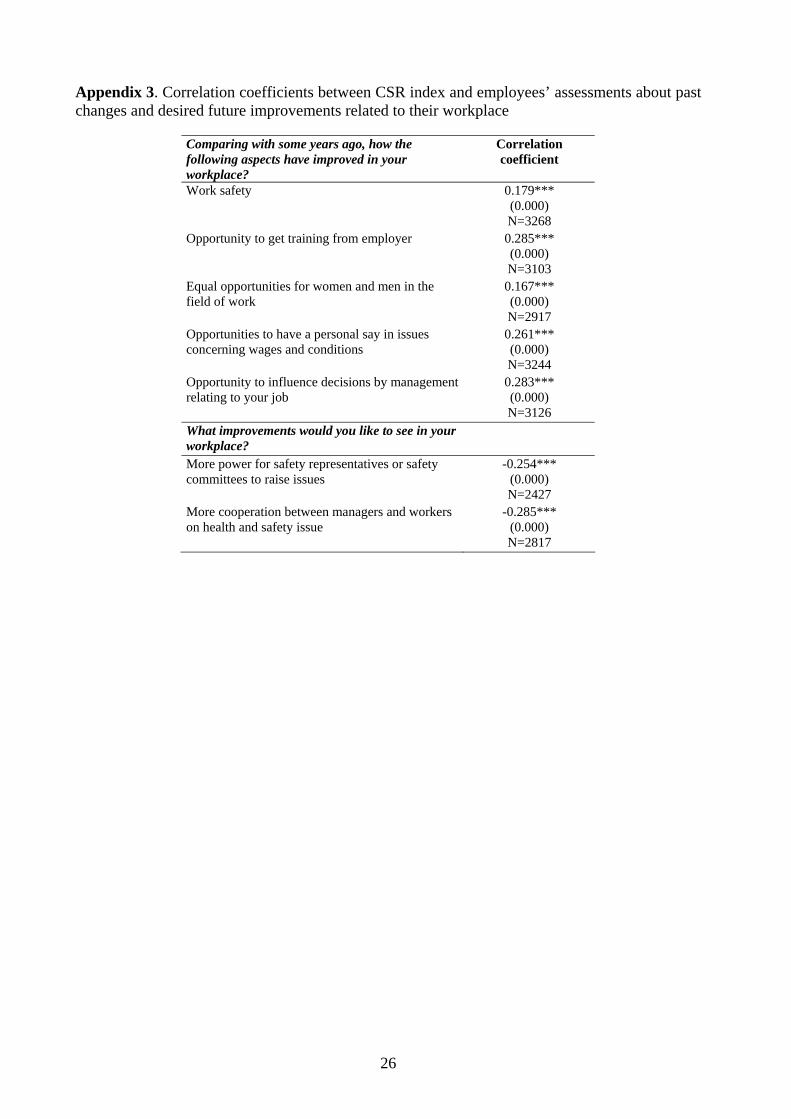
26
Appendix 3. Correlation coefficients between CSR index and employees’ assessments about past changes and desired future improvements related to their workplace
Comparing with some years ago, how the following aspects have improved in your workplace?
Correlation coefficient
Work safety 0.179*** (0.000) N=3268
Opportunity to get training from employer 0.285*** (0.000) N=3103
Equal opportunities for women and men in the field of work
0.167*** (0.000) N=2917
Opportunities to have a personal say in issues concerning wages and conditions
0.261*** (0.000) N=3244
Opportunity to influence decisions by management relating to your job
0.283*** (0.000) N=3126
What improvements would you like to see in your workplace?
More power for safety representatives or safety committees to raise issues
-0.254*** (0.000) N=2427
More cooperation between managers and workers on health and safety issue
-0.285*** (0.000) N=2817
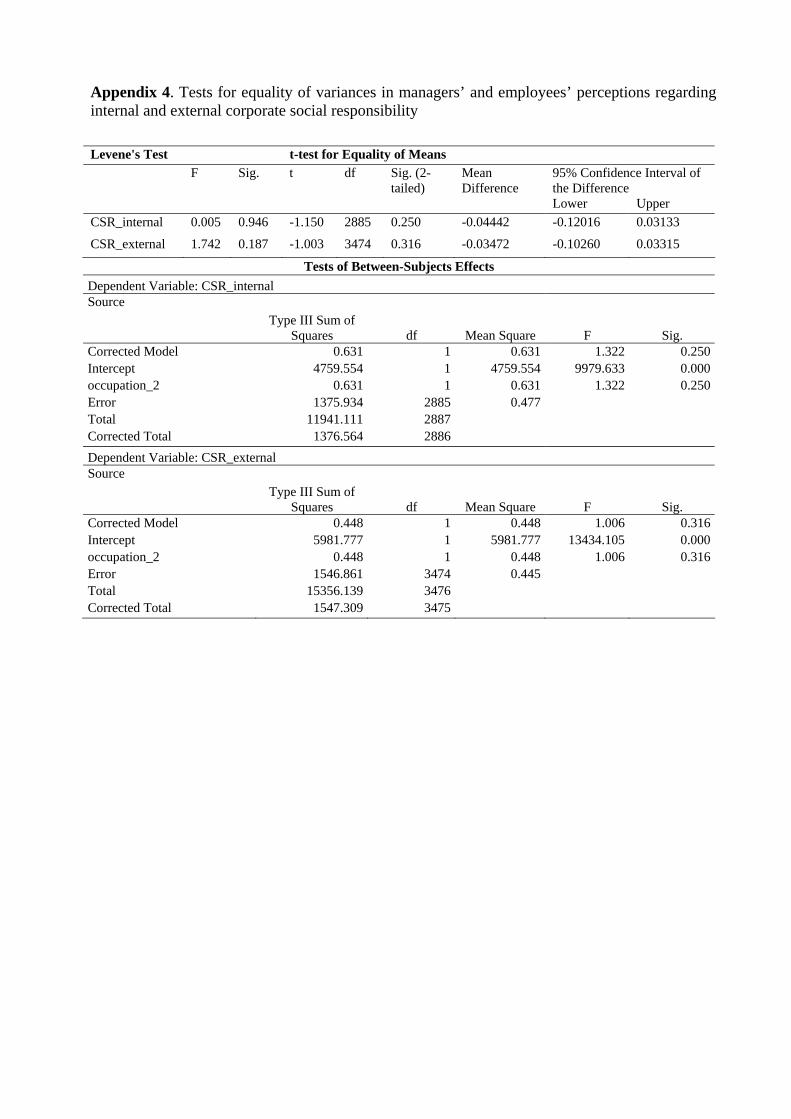
Appendix 4. Tests for equality of variances in managers’ and employees’ perceptions regarding internal and external corporate social responsibility
Levene's Test t-test for Equality of Means 95% Confidence Interval of
the Difference
F Sig. t df Sig. (2-tailed)
Mean Difference
Lower Upper CSR_internal 0.005 0.946 -1.150 2885 0.250 -0.04442 -0.12016 0.03133
CSR_external 1.742 0.187 -1.003 3474 0.316 -0.03472 -0.10260 0.03315
Tests of Between-Subjects Effects Dependent Variable: CSR_internal Source
Type III Sum of Squares df Mean Square F Sig.
Corrected Model 0.631 1 0.631 1.322 0.250Intercept 4759.554 1 4759.554 9979.633 0.000occupation_2 0.631 1 0.631 1.322 0.250Error 1375.934 2885 0.477 Total 11941.111 2887 Corrected Total 1376.564 2886 Dependent Variable: CSR_external Source
Type III Sum of Squares df Mean Square F Sig.
Corrected Model 0.448 1 0.448 1.006 0.316Intercept 5981.777 1 5981.777 13434.105 0.000occupation_2 0.448 1 0.448 1.006 0.316Error 1546.861 3474 0.445 Total 15356.139 3476 Corrected Total 1547.309 3475
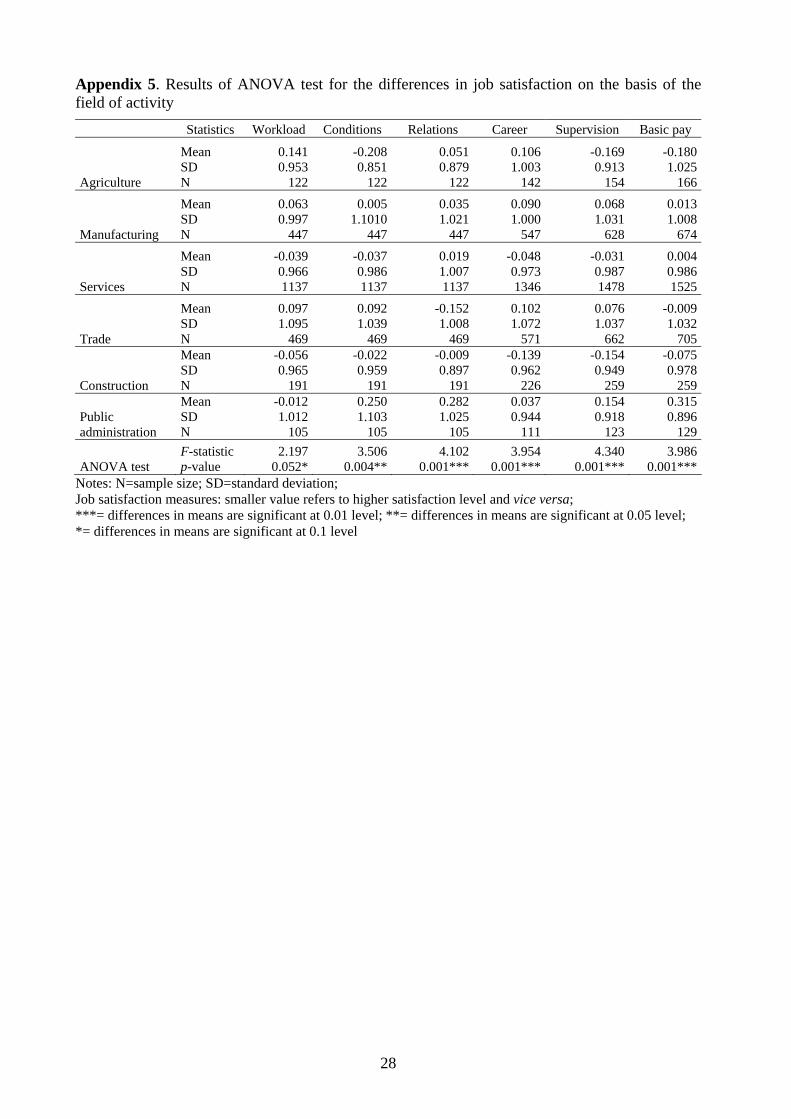
28
Appendix 5. Results of ANOVA test for the differences in job satisfaction on the basis of the field of activity
Statistics Workload Conditions Relations Career Supervision Basic pay
Agriculture
Mean SD N
0.141 0.953
122
-0.2080.851
122
0.0510.879
122
0.1061.003
142
-0.169 0.913
154
-0.1801.025
166
Manufacturing
Mean SD N
0.063 0.997
447
0.0051.1010
447
0.0351.021
447
0.0901.000
547
0.068 1.031
628
0.0131.008
674
Services
Mean SD N
-0.039 0.966 1137
-0.0370.9861137
0.0191.0071137
-0.0480.9731346
-0.031 0.987 1478
0.0040.9861525
Trade
Mean SD N
0.097 1.095
469
0.0921.039
469
-0.1521.008
469
0.1021.072
571
0.076 1.037
662
-0.0091.032
705
Construction
Mean SD N
-0.056 0.965
191
-0.0220.959
191
-0.0090.897
191
-0.1390.962
226
-0.154 0.949
259
-0.0750.978
259
Public administration
Mean SD N
-0.012 1.012
105
0.2501.103
105
0.2821.025
105
0.0370.944
111
0.154 0.918
123
0.3150.896
129
ANOVA test F-statistic p-value
2.197 0.052*
3.5060.004**
4.1020.001***
3.9540.001***
4.340 0.001***
3.9860.001***
Notes: N=sample size; SD=standard deviation; Job satisfaction measures: smaller value refers to higher satisfaction level and vice versa; ***= differences in means are significant at 0.01 level; **= differences in means are significant at 0.05 level; *= differences in means are significant at 0.1 level