are uk companies prepared for the international impacts of
TRANSCRIPT

01
Are UK companies prepared for the international impacts of climate change?
FTSE 350 Climate Change Report 20139 October 2013
Report writer and global advisor

02
The evolution of CDP
With great pleasure, CDP announced an exciting change this year.
Over ten years ago CDP pioneered the only global disclosure system for companies to report their environmental impacts and strategies to investors. In that time, and with your support, CDP has accelerated climate change and natural resource issues to the boardroom and has moved beyond the corporate world to engage with cities and governments.
The CDP platform has evolved significantly, supporting multinational purchasers to build more sustainable supply chains. It enables cities around the world to exchange information, take best practice action and build climate resilience. We assess the climate performance of companies and drive improvements through shareholder engagement.
Our offering to the global marketplace has expanded to cover a wider spectrum of the earth’s natural capital, specifically water and forests, alongside carbon, energy and climate.
For these reasons, we have outgrown our former name of the Carbon Disclosure Project and rebranded to CDP. Many of you already know and refer to us in this way. Our rebrand denotes our progress as we continue to catalyse action and respond to business, finance, investment and environmental needs globally.
We now have a bolder, more dynamic look and logo that reflects the scale of the work we must undertake in the coming years to move the markets ahead of where they would otherwise be on these issues and realise truly sustainable economies.
Over 5,000 companies from all over the world have been asked to report on climate change through CDP this year;
81% of the world’s 500 largest public companies listed on the Global 500 engage with CDP to enable effective measurement of their carbon footprint and climate change action;
CDP is a not-for-profit organisation. If you would like to support our vital work through donations or sponsorship opportunities, please email [email protected] or telephone +44 (0) 7703 184 312.
03
CEO Foreword 4
Executive Summary 6
2013 Climate Performance and Disclosure Leaders 8
2013 Leadership Criteria 10
Investor insight - the “Aiming for A” coalition 11
FTSE 350 companies have a global footprint 12
Companies’ focus on climate change risks and opportunities needs broadening 12
Scientific Insight - Professor Sir Brian Hoskins 17
Companies’ understanding of their value chain is limited 20
Corporate insight - Reckitt Benckiser 22
FTSE 100 companies have a more sophisticated response to climate change than FTSE 250 companies 23
Preparing for climate change: Comparing FTSE 100 and FTSE 250 companies 26
PwC commentary – Celine Herweijer 28
Appendix I – Non-responding companies 30
Appendix II – Responding companies, scores and emissions data 31
Appendix III – Responding FTSE SmallCap companies 34
Appendix IV – Investor members and signatories 34
Important Notice
The contents of this report may be used by anyone providing acknowledgement is given to Carbon Disclosure Project (CDP). This does not represent a license to repackage or resell any of the data reported to CDP or the contributing authors and presented in this report. If you intend to repackage or resell any of the contents of this report, you need to obtain express permission from CDP before doing so.
Pwc and CDP have prepared the data and analysis in this report based on responses to the CDP 2013 Climate Change information request. No representation or warranty (express or implied) is given by Pwc, CDP or any of its contributors as to the accuracy or completeness of the information and opinions contained in this report. You should not act upon the information contained in this publication without obtaining specific professional advice. To the extent permitted by law, PwC, CDP and its contributors do not accept or assume any liability, responsibility or duty of care for any consequences of you or anyone else acting, or refraining to act, in reliance on the information contained in this report or for any decision based on it. All information and views expressed herein by CDP and any of its contributors are based on their judgment at the time of this report and are subject to change without notice due to economic, political, industry and firm-specific factors. Guest commentaries where included in this report reflect the views of their respective authors; their inclusion is not an endorsement of them.
CDP and its contributors, their affiliated member firms or companies, or their respective shareholders, members, partners, principals, directors, officers and/or employees, may have a position in the securities of the companies discussed herein. The securities of the companies mentioned in this document may not be eligible for sale in some states or countries, nor suitable for all types of investors; their value and the income they produce may fluctuate and/or be adversely affected by exchange rates.
Carbon Disclosure Project’ and ‘CDP’ refer to Carbon Disclosure Project, a United Kingdom company limited by guarantee, registered as a United Kingdom charity number 1122330.
© 2013 Carbon Disclosure Project. All rights reserved.
Contents
04
CEO Foreword
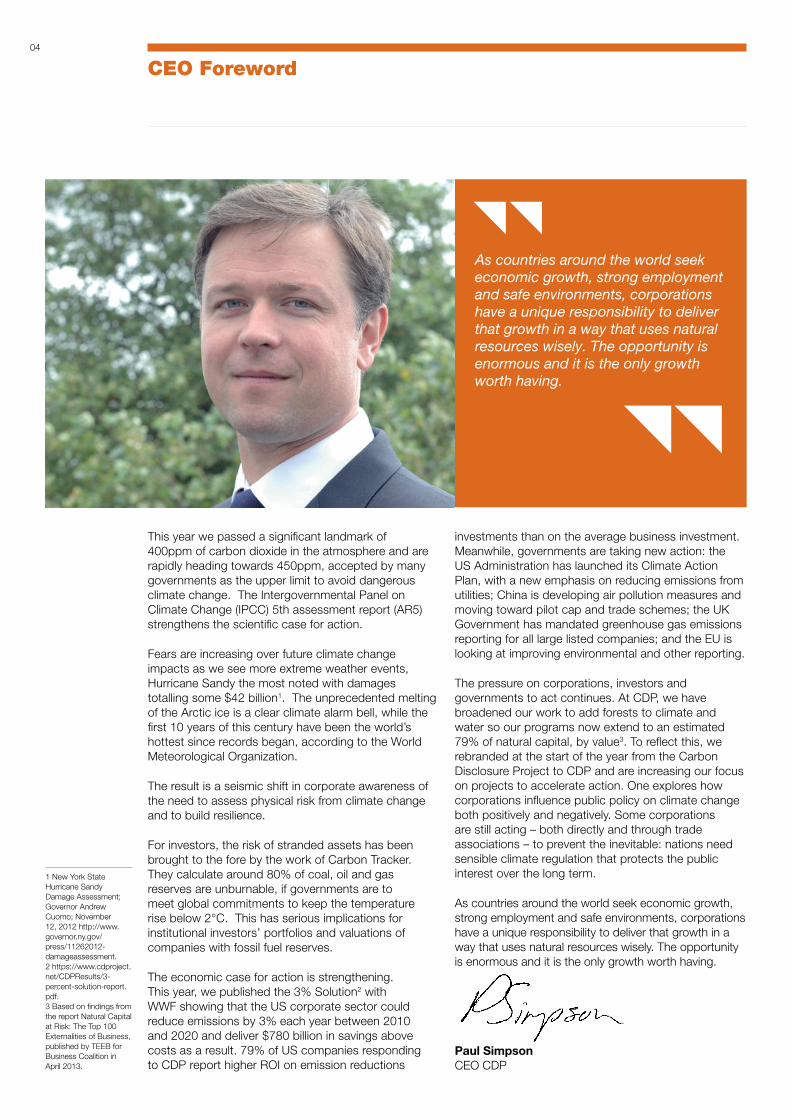
This year we passed a significant landmark of 400ppm of carbon dioxide in the atmosphere and are rapidly heading towards 450ppm, accepted by many governments as the upper limit to avoid dangerous climate change. The Intergovernmental Panel on Climate Change (IPCC) 5th assessment report (AR5) strengthens the scientific case for action.
Fears are increasing over future climate change impacts as we see more extreme weather events, Hurricane Sandy the most noted with damages totalling some $42 billion1. The unprecedented melting of the Arctic ice is a clear climate alarm bell, while the first 10 years of this century have been the world’s hottest since records began, according to the World Meteorological Organization.
The result is a seismic shift in corporate awareness of the need to assess physical risk from climate change and to build resilience.
For investors, the risk of stranded assets has been brought to the fore by the work of Carbon Tracker. They calculate around 80% of coal, oil and gas reserves are unburnable, if governments are to meet global commitments to keep the temperature rise below 2°C. This has serious implications for institutional investors’ portfolios and valuations of companies with fossil fuel reserves.
The economic case for action is strengthening. This year, we published the 3% Solution2 with WWF showing that the US corporate sector could reduce emissions by 3% each year between 2010 and 2020 and deliver $780 billion in savings above costs as a result. 79% of US companies responding to CDP report higher ROI on emission reductions
As countries around the world seek economic growth, strong employment and safe environments, corporations have a unique responsibility to deliver that growth in a way that uses natural resources wisely. The opportunity is enormous and it is the only growth worth having.
investments than on the average business investment. Meanwhile, governments are taking new action: the US Administration has launched its Climate Action Plan, with a new emphasis on reducing emissions from utilities; China is developing air pollution measures and moving toward pilot cap and trade schemes; the UK Government has mandated greenhouse gas emissions reporting for all large listed companies; and the EU is looking at improving environmental and other reporting.
The pressure on corporations, investors and governments to act continues. At CDP, we have broadened our work to add forests to climate and water so our programs now extend to an estimated 79% of natural capital, by value3. To reflect this, we rebranded at the start of the year from the Carbon Disclosure Project to CDP and are increasing our focus on projects to accelerate action. One explores how corporations influence public policy on climate change both positively and negatively. Some corporations are still acting – both directly and through trade associations – to prevent the inevitable: nations need sensible climate regulation that protects the public interest over the long term.
As countries around the world seek economic growth, strong employment and safe environments, corporations have a unique responsibility to deliver that growth in a way that uses natural resources wisely. The opportunity is enormous and it is the only growth worth having.
Paul Simpson CEO CDP
1 New York State Hurricane Sandy Damage Assessment; Governor Andrew Cuomo; November 12, 2012 http://www.governor.ny.gov/press/11262012-damageassessment. 2 https://www.cdproject.net/CDPResults/3-percent-solution-report.pdf. 3 Based on findings from the report Natural Capital at Risk: The Top 100 Externalities of Business, published by TEEB for Business Coalition in April 2013.

05

06
Executive Summary
Companies face increasing pressure to take responsibility for their activities and impacts across the whole of their value chain, not just for the operations they own or control. They are now expected to make sure that the input to their products and services are sourced from responsible, reliable suppliers and to help their customers reduce the environmental impacts of using their products and services.
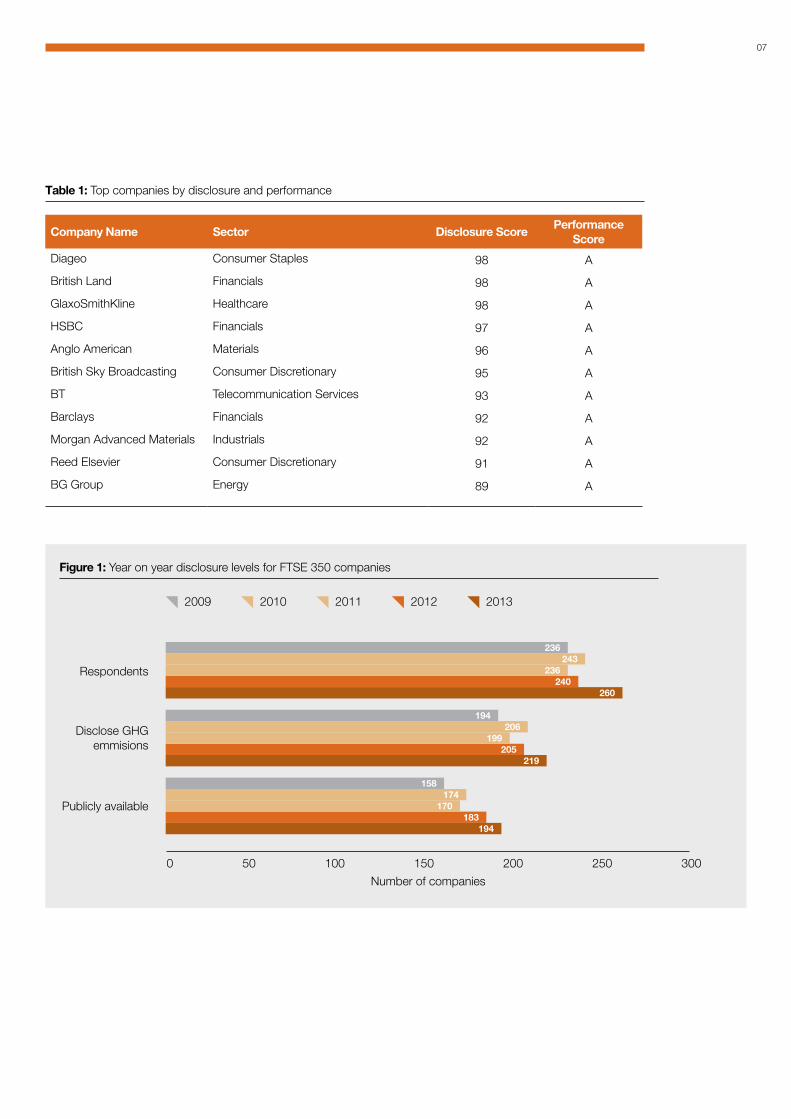
In 2013, CDP sent its annual request to FTSE 350 companies on behalf of 722 investors representing US$87 trillion in assets, asking them to disclose what climate change means for their business. This year, 74% (260) of companies in the FTSE 3504 sample responded to the investor request from CDP5. To understand the full range of impacts from climate change, more emphasis is now placed on Scope 3 reporting and supply chain management.
This report addresses how prepared UK companies are for the international impacts of climate change and looks at how FTSE 350 companies responding to CDP in 2013 address threats and opportunities from climate change abroad. It builds on the conclusions from the report International Threats and Opportunities of Climate Change for the UK, prepared by PwC for the Department for Environment, Food and Rural Affairs (Defra) earlier this year.
The report for Defra concludes that climate change impacts overseas are expected to affect the UK in diverse ways and warns that these indirect impacts could be even more significant than direct impacts within the UK. It is therefore important to see whether FTSE 350 companies – the majority of which have operations abroad – are preparing for the international impacts of climate change when assessing risks and opportunities, and whether these assessments feed into their strategies.
The primary findings of this year’s FTSE 350 report show that the majority of companies have operations and Scope 1 and 2 emissions which originated abroad. However, companies’ current focus on risks and opportunities needs broadening. While the majority of FTSE 350 companies identify risks (86%) and opportunities (82%) from climate change, the focus remains relatively narrow, looking primarily at direct, shorter-term risks. Only 32% of companies report risks (14% opportunities) which have timeframes of ten years or more and 13% of companies report that they have not identified any climate change related risks at all.
The findings also show that companies have a limited understanding of their value chain. 48% of companies do not engage with their supply chain on emissions or climate change and the majority of emissions from companies’ value chains are not currently being measured. Some companies want to understand emissions from their core operations before covering their whole value chain emissions.
A comparison between FTSE 100 and FTSE 250 companies shows that these samples are very different in both the quality of their response and the amount of emissions they produce. FTSE 100 companies show a much more sophisticated response to the threats and opportunities of climate change than FTSE 250 companies. In addition, FTSE 250 companies report emitting just one tenth the emissions of the FTSE 100 companies (FTSE 100: 541 million tonnes CO2e, FTSE 250: 59 million tonnes CO2e).
In order for companies to be fully prepared for the international impacts of climate change, this report suggests a five point plan that UK companies can implement: engage the executive team; engage the value chain; identify and assess risks; evaluate options for managing risks and capitalising on opportunities; implement decisions, monitor effectiveness and plan for the future.
4 The FTSE 350 index is based on the market price of 350 companies listed on the London Stock Exchange, including companies on the FTSE 100 index and FTSE 250 index.5 The FTSE 350 report is based on the analysis of the 234 responses received by 1 July 2013.
07
Company Name Sector Disclosure ScorePerformance
Score
Diageo Consumer Staples 98 A
British Land Financials 98 A
GlaxoSmithKline Healthcare 98 A
HSBC Financials 97 A
Anglo American Materials 96 A
British Sky Broadcasting Consumer Discretionary 95 A
BT Telecommunication Services 93 A
Barclays Financials 92 A
Morgan Advanced Materials Industrials 92 A
Reed Elsevier Consumer Discretionary 91 A
BG Group Energy 89 A
Table 1: Top companies by disclosure and performance
Figure 1: Year on year disclosure levels for FTSE 350 companies
240236
260
243236
205199
219
206194
183170
194
174158
0 50 100 150 200 250 300
Respondents
Disclose GHG emmisions
Publicly available
2009 2010 2011 2012 2013
Number of companies

08
Sector CompanyDisclosure
scorePerformance
band
Consecutive years in the
CPLI
Consumer Discretionary British Sky Broadcasting 95 A 1Reed Elsevier 91 A 1UBM 80 A 1
Consumer Staples Diageo 98 A 2Unilever 85 A 2
Energy BG Group 89 A 1Financials British Land 98 A 1
HSBC 97 A 1Barclays 92 A 1
Healthcare GlaxoSmithKline 98 A 1Industrials Morgan Advanced Materials 92 A 2Materials Anglo American 96 A 2
Costain* 84 A 1Telecommunication Services BT 93 A 1
2013 Climate Performance Leadership Index (CPLI)
98/Athe best score in 2013, achieved by British Land, Diageo and GlaxoSmithKline

09
Sector CompanyDisclosure
scorePerformance
band
Consecutive years in the
CDLI
Consumer Discretionary British Sky Broadcasting 95 A 4WPP 95 B 1TUI Travel 92 B 6Reed Elsevier 91 A 5Aga Rangemaster* 88 B 1
Consumer Staples Reckitt Benckiser 99 B 5Diageo 98 A 3Tesco 96 A- 5J Sainsbury 95 B 1British American Tobacco 94 B 3Tate & Lyle 94 A- 2
Energy Royal Dutch Shell 90 B 5BG Group 89 A 3
Financials British Land 98 A 3HSBC 97 A 5Barclays 92 A 5Aberdeen Asset Management 91 B 1Old Mutual 91 B 5Standard Chartered 91 B 2Lloyds Banking 90 B 5Standard Life 90 B 1Derwent London 89 C 1Land Securities 88 B 2Royal Bank of Scotland 88 B 5Shaftesbury 88 B 1
Healthcare GlaxoSmithKline 98 A 5Smith & Nephew 92 B 2
Industrials Morgan Advanced Materials 92 A 2Serco 92 C 4Morgan Sindall* 91 B 2International Airlines Group 88 B 1Travis Perkins 88 B 1
Information Technology Pace 91 B 1Materials Anglo American 96 A 4
Croda 93 B 1Antofagasta 92 C 1Lonmin 88 B 1Rio Tinto 88 B 1
Telecommunication Services BT 93 A 4Utilities National Grid 98 B 1
Centrica 97 B 5Pennon 96 A- 1SSE 90 B 5
2013 Climate Disclosure Leadership Index (CDLI)
* These FTSE SmallCap companies are in the FTSE 350 but achieved the required score to join the CPLI/CDLI

10
2013 Leadership Criteria
What are the CDLI and CPLI criteria?
To enter the CDLI, a company must:
• Make its response public and submit via CDP’s Online Response System
• Achieve a score within the top 10% of the total FTSE 350 population (41 companies in 2013)6
To enter the CPLI (Performance Band A), a company must:
• Make its response public and submit via CDP’s Online Response System
• Attain a performance score greater than 85
• Score maximum performance points on question 12.1a for greenhouse gas emissions reductions due to emission reduction actions over the past year (4% or above in 2013)
• Disclose gross global Scope 1 and Scope 2 figures
• Score maximum performance points for verification of Scope 1 and Scope 2 emissions
However, CDP reserves the right to exclude any company from the CPLI if there is anything in its response or other publicly available information that calls into question its suitability for inclusion.
There are 13 companies in the CPLI in 2013.
Each year, company responses are analysed and scored against two parallel scoring schemes: disclosure and performance.
The disclosure score assesses the completeness and quality of a company’s response. Its purpose is to provide a summary of the extent to which companies have answered CDP’s questions in a structured format. A high disclosure score signals that a company has provided comprehensive information about the measurement and management of its carbon footprint, its climate change strategy, risk management processes and outcomes.
The performance score assesses the level of action, as reported by the company, on climate change mitigation, adaptation and transparency. Its intent is to highlight positive climate action as demonstrated by a company’s CDP response. A high performance score signals that a company is measuring, verifying and managing its carbon footprint, for example by setting and meeting carbon reduction targets and implementing programs to reduce emissions in both its direct operations and supply chain.
The highest scoring companies for disclosure and performance enter the Climate Disclosure Leadership Index (CDLI) and the Climate Performance Leadership Index (CPLI) respectively. Public scores are available in CDP reports, through Bloomberg Terminals, Google Finance and Deutsche Boerse’s website.
How are the CDLI and CPLI used by investors?
Good disclosure and performance scores are used by investors as a proxy of good climate change management or climate change performance of companies.
Investors identify and then engage with companies to encourage them to improve their score. The “Aiming for A” initiative which was initiated by CCLA Investment Management is driven by a coalition of UK asset owners and mutual fund managers. They are asking ten major UK-listed utilities and extractive companies to aim for inclusion in the CPLI. This may involve filing supportive shareholder resolutions for Annual General Meetings occurring after September 2013.
Investors are also using CDP scores for creating new financial products. For example, Nedbank in South Africa developed the Nedbank Green Index. Disclosure scores are used for selecting stocks and performance scores for assigning weight.
For further information on the CDLI and the CPLI and how scores are determined, please visit www.cdp.net/guidance
Note: Companies that achieve a performance score high enough to warrant inclusion in the CPLI, but do not meet all of the other CPLI requirements are classed as Performance Band A- but are not included in the CPLI.
6 The 34th-41st highest scoring companies scored 88 and were all included in the CDLI.

11
Last year CCLA built an “Aiming for A” coalition. This includes fellow mutuals in the UK fund management industry and influential UK asset owners, including the £115bn Local Authority Pension Fund Forum and the largest members of the £12bn Church Investors Group. In a nutshell, we’re asking ten major UK-listed utilities and extractives companies to aim for continuous inclusion in CDP’s Climate Performance Leadership Index (CPLI) by achieving and retaining an “A” Performance Band. Our capital stewardship work will involve filing supportive shareholder resolutions at some of these companies’ AGMs in due course. We have also been encouraging CDP to develop sectoral methodologies, so that as the CPLI evolves it can more closely reflect the strategic challenges that are unique to high-impact sectors.
There are several reasons why we’ve come together to support investee companies in their efforts to improve their response to the low-carbon transition in this way. These range from systemic risk management and our collective fiduciary duty to engage in transformational change, through to amplifying long-term investor voices and involving ultimate beneficiaries.
Firstly, thanks to Mercer and Carbon Tracker’s work, horizon-scanning investors are aware of the risks of public policy uncertainty and stranded assets to their portfolios. Major technology transitions are rarely smooth, but draconian policy that has to be introduced quickly after prolonged delay increases risks to long-term investors.
Secondly, this is, of course, a collective action problem. How long should investors wait for someone else to lead? Shouldn’t we find the courage to help co-lead the economic transformation required as part of our fiduciary duties? After all the UK’s Kay Review concluded that: “the principal role of equity markets in the allocation of capital relates to the oversight of capital allocation within companies rather than the allocation of capital between them”.
Thirdly, it is easy for long-term investors’ voices to be drowned out by the short-term noise from the financial markets. We believe that supportive shareholder resolutions could play a high-profile positive stewardship role in the UK. They could amplify long-term investors’ requests, to the companies that we expect to hold in our portfolios for many years, about the need to balance the short- and longer-term aspects of shareholder value creation.
Fourthly, ultimate beneficiaries can find it hard to influence the activities of their fund managers. “Aiming for A” will mean that they will be able to ask their pension providers, insurers, ISA and other investment managers, how they voted on these critical shareholder resolutions. As Matthew Taylor, chief executive of the Royal Society of Arts said in 2008 “citizen engagement is the key to accountability in the financial system”.
Investor insight - the “Aiming for A” coalition
Congratulations to Anglo American (A) and BG Group (A). We’d also like to thank BHP Billiton (C), BP (C), Centrica (B), Glencore/Xstrata (C), National Grid (B), Rio Tinto (B), Shell (B), and SSE (B) for their ongoing constructive engagement with us.

12
Main Themes of 2013 Responses
7 International Threats and Opportunities of Climate Change for the UK (Defra, by PwC (2013), page 22). 8 The Climate Disclosure Standards Board’s ongoing research (www.cdsb.net/standards) has identified 380 types of arrangements in place around the world that directly or indirectly affect the way in which enterprises report on sustainability; indeed, the UK Government has introduced regulations that will require UK quoted companies to include their global greenhouse gas (GHG) emissions in their annual reports from 1 October 2013 (Department for Business, Innovation and Skills, https://www.gov.uk/government/news/better-and-simpler-company-reporting). 9 CDP’s water programme seeks to address water risks by catalysing action towards sustainable corporate water stewardship, safeguarding water resources for those who need them most.
FTSE 350 companies have a global footprint
A recent study from PwC examining climate change impacts around the world shows they could represent a bigger threat than opportunity for British business and investment. The report, International Threats and Opportunities of Climate Change for the UK, prepared for Defra by PwC, calls for companies to take action to assess their level of risk and invest to develop new solutions, services and skills. It warns that international impacts could be even more significant for the UK than local impacts. The analysis shows that the areas which might have the highest impact on the UK are trade, investment and supply chain.
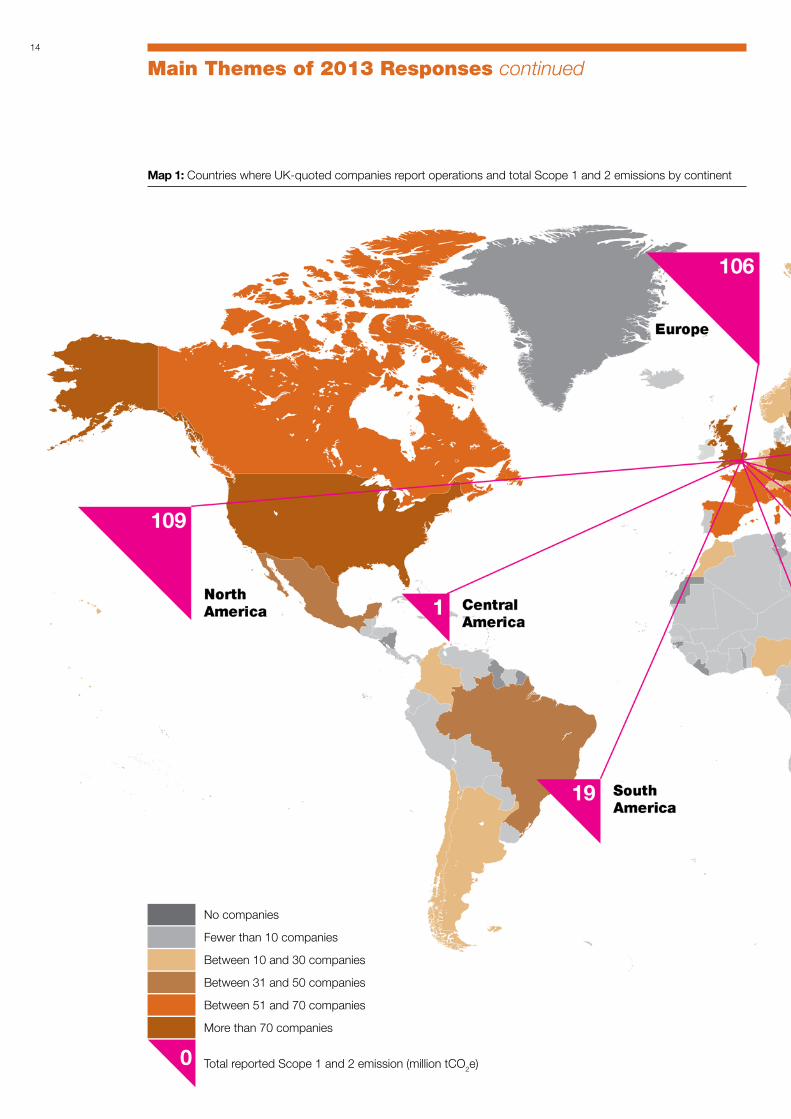
FTSE 350 companies are highly multinational, reporting operations in a total of 145 countries. Only 31% of respondents operate exclusively in the UK. As might be expected based on traditional trade partnerships, FTSE 350 companies operate mostly in the Organisation for Economic Co-Operation and Development (OECD) countries: 100 companies report operations in the United States of America and 96 in European countries, though the level of investment in Europe was greater - at the end of 2010, UK assets in Europe totalled £4.95 trillion (51%) compared to £2.8 trillion (29%) in the U.S.A7.
A majority of the emissions of companies in the FTSE 350 also originate overseas: 77% of Scope 1 and 83% of Scope 2 emissions reported by FTSE 350 companies come from abroad.
This pattern of ownership and operations exposes many large UK companies to a range of important physical, regulatory and other climate-related risks8. But, at the same time, the UK is well placed to benefit from international opportunities.
Map 1 (p.14) shows the number of companies which report operations in each country and the level of Scope 1 and 2 emissions per continent.
Companies’ focus on climate change risks and opportunities needs broadening
The PwC report for Defra shows how the international impact of climate change on UK business will depend on countries’ resilience to climate change and the extent of their business links with the UK. Map 2 (p.18) shows some of the potential global impacts due to climate change in 2020. The majority of these impacts will be negative, such as increased pestilence, increased extreme weather events or declining water availability9.
Companies are already preparing for such changes: 86% of FTSE 350 companies report risks due to climate change and 82% report opportunities. However, companies’ focus remains relatively narrow, looking primarily at direct, shorter-term risks.
Perhaps surprisingly, 13% of companies report that they have not identified any climate change risks. For some, this may mean that climate change isn’t adequately integrated into their risk management processes.
Carbon taxes may have an adverse impact on the level of economic activity in the territories where the group’s businesses operate. It is not possible to state with any reasonable degree of accuracy whether local, national or international regulatory bodies may impose this type of tax [and its] magnitude or the time frame that might be involved.
National Express

13
Antofagasta conducted a workshop with all its divisions to investigate the impact of unusual weather events on local operations and what measures to implement to mitigate them.
Gustavo Pössel Environmental Manager, Antofagasta
Micro Focus is committed to ensuring its Business Continuity Management is robust and rolled out across its major locations around the world, thereby delivering resilience into its operational infrastructure.
Micro Focus
If international agreements cause rises in the cost of fuel and/or carbon, this could potentially result in increased demand for more efficient and/or lower-carbon products.
Rolls-Royce
10 International Threats and Opportunities of Climate Change for the UK (Defra, by PwC (2013))
Companies are not identifying enough indirect risks At present, companies report more risks than opportunities. This is partly because the types of risks (such as carbon taxes) reported by companies are seen as more tangible, despite uncertainty levels around their specific impact.
70% of companies report direct risks but only 33% report indirect risks. However, almost all companies face indirect risks: not reporting these risks could mean companies’ strategies, operations and value chains aren’t fully resilient to climate change risks. Indirect impacts can include the effect of extreme weather on supply chains and the price or availability of raw materials and other goods, as well as having an impact on business in terms of investments and trade.
The report prepared for Defra10 concludes that risks considerably outweigh opportunities for the UK, both in terms of their magnitude and the confidence in the probability that they will occur. In line with that, companies might also expect climate change to pose more risks than opportunities.
Some companies are already managing these risks. For example, Dairy Crest describes how it designs its sites to meet local climatic conditions: buildings located close to rivers with a risk of flooding are constructed to be waterproof.
Companies are focusing on short term risks and opportunities The majority of risks (51%) and opportunities (54%) reported have timeframes of under five years. Only 32% of companies report risks (opportunities: 14%) which have timeframes of ten years or more. This presents a mixed message: on the one hand, companies are identifying immediate threats and opportunities, for example in response to recent weather events or regulatory changes, Royal Dutch Shell mentions how hurricane Katrina disrupted its operations in the US Gulf of Mexico, which led the company to retrofit some of its platforms and to make changes in its operations. On the other hand, the lack of focus on longer term risks and opportunities could mean that strategies for adapting to climate change risks are not in place.
14
Main Themes of 2013 Responses continued
Map 1: Countries where UK-quoted companies report operations and total Scope 1 and 2 emissions by continent
More than 70 companies
Total reported Scope 1 and 2 emission (million tCO2e)
Between 51 and 70 companies
Between 31 and 50 companies
Between 10 and 30 companies
Fewer than 10 companies
No companies
0

15
*’Other’ includes: ‘Rest of World’, ‘International Waters/Air Space’ and non-specific descriptions: e.g. Eurasia, EMEA.

16
Figure 2: Percentage of companies reporting risks and opportunities from climate change
Figure 3: Percentage of companies selecting the five most commonly reported risks
Figure 4: Percentage of companies selecting the five most commonly reported opportunities
A number of countries where we have operations including in the EU, South Africa, United States, India and China are involved in on-going negotiations to determine international agreements and action on climate change to replace the Kyoto Protocol that finished at the end of 2012...The uncertainty of the exact nature of the agreements affects our ability to effectively assess long term investment decisions; which we define here as an indirect operational cost (as opposed to a direct operational cost which would include our office operations).
Old Mutual
Main Themes of 2013 Responses continued
84%
75%
Regulation Physical Other climate related risks
74%
59% 71%
70%
Risks Opportunites
Carbon taxes Reputation
Emission reporting
regulations
Fuel/energy taxes and regulations
Changing consumer behaviour
58% 55% 49%
47% 45%
51%
Reputation
Other physical climate opportunities
Changing consumer behaviour
General environmental regulations,
including planning
Fuel/energy taxes and regulations
48% 31%
26% 24%
17
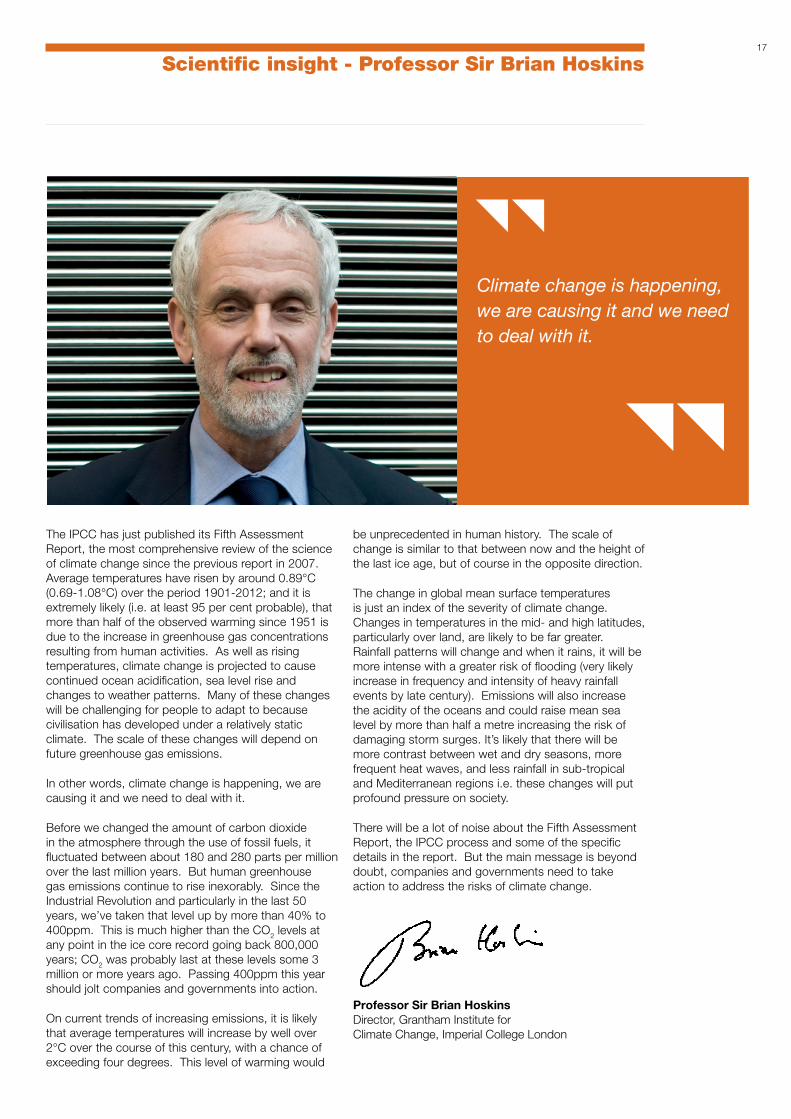
Scientific insight - Professor Sir Brian Hoskins
The IPCC has just published its Fifth Assessment Report, the most comprehensive review of the science of climate change since the previous report in 2007. Average temperatures have risen by around 0.89°C (0.69-1.08°C) over the period 1901-2012; and it is extremely likely (i.e. at least 95 per cent probable), that more than half of the observed warming since 1951 is due to the increase in greenhouse gas concentrations resulting from human activities. As well as rising temperatures, climate change is projected to cause continued ocean acidification, sea level rise and changes to weather patterns. Many of these changes will be challenging for people to adapt to because civilisation has developed under a relatively static climate. The scale of these changes will depend on future greenhouse gas emissions.
In other words, climate change is happening, we are causing it and we need to deal with it.
Before we changed the amount of carbon dioxide in the atmosphere through the use of fossil fuels, it fluctuated between about 180 and 280 parts per million over the last million years. But human greenhouse gas emissions continue to rise inexorably. Since the Industrial Revolution and particularly in the last 50 years, we’ve taken that level up by more than 40% to 400ppm. This is much higher than the CO2 levels at any point in the ice core record going back 800,000 years; CO2 was probably last at these levels some 3 million or more years ago. Passing 400ppm this year should jolt companies and governments into action.
On current trends of increasing emissions, it is likely that average temperatures will increase by well over 2°C over the course of this century, with a chance of exceeding four degrees. This level of warming would
Climate change is happening, we are causing it and we need to deal with it.
be unprecedented in human history. The scale of change is similar to that between now and the height of the last ice age, but of course in the opposite direction.
The change in global mean surface temperatures is just an index of the severity of climate change. Changes in temperatures in the mid- and high latitudes, particularly over land, are likely to be far greater. Rainfall patterns will change and when it rains, it will be more intense with a greater risk of flooding (very likely increase in frequency and intensity of heavy rainfall events by late century). Emissions will also increase the acidity of the oceans and could raise mean sea level by more than half a metre increasing the risk of damaging storm surges. It’s likely that there will be more contrast between wet and dry seasons, more frequent heat waves, and less rainfall in sub-tropical and Mediterranean regions i.e. these changes will put profound pressure on society.
There will be a lot of noise about the Fifth Assessment Report, the IPCC process and some of the specific details in the report. But the main message is beyond doubt, companies and governments need to take action to address the risks of climate change.
Professor Sir Brian Hoskins Director, Grantham Institute for Climate Change, Imperial College London

18
Main Themes of 2013 Responses continued
Water availablility
Temperature
Extreme events
Health
Agriculture
Biodiversity
Fisheries
Negative impact
Positive impact
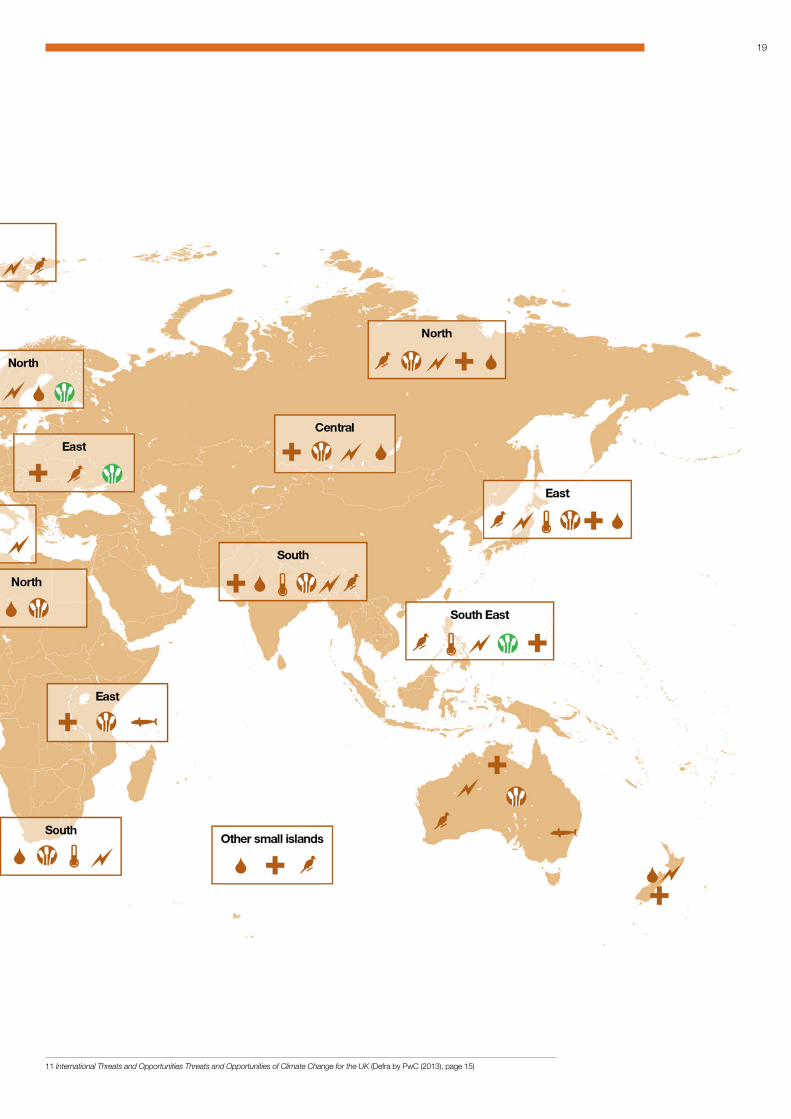
19
11 International Threats and Opportunities Threats and Opportunities of Climate Change for the UK (Defra by PwC (2013), page 15)
20
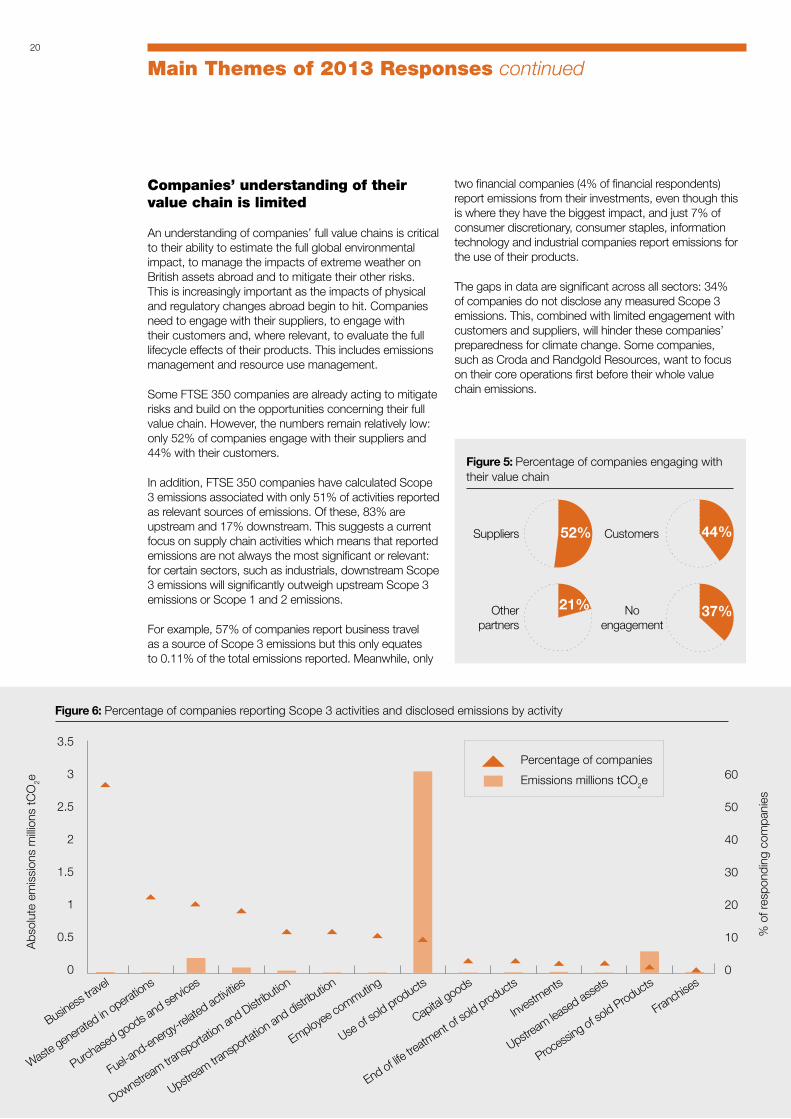
Figure 5: Percentage of companies engaging with their value chain
Suppliers
Other partners
Customers
No engagement
44%
37%
52%
21%
Companies’ understanding of their value chain is limited
An understanding of companies’ full value chains is critical to their ability to estimate the full global environmental impact, to manage the impacts of extreme weather on British assets abroad and to mitigate their other risks. This is increasingly important as the impacts of physical and regulatory changes abroad begin to hit. Companies need to engage with their suppliers, to engage with their customers and, where relevant, to evaluate the full lifecycle effects of their products. This includes emissions management and resource use management.
Some FTSE 350 companies are already acting to mitigate risks and build on the opportunities concerning their full value chain. However, the numbers remain relatively low: only 52% of companies engage with their suppliers and 44% with their customers.
In addition, FTSE 350 companies have calculated Scope 3 emissions associated with only 51% of activities reported as relevant sources of emissions. Of these, 83% are upstream and 17% downstream. This suggests a current focus on supply chain activities which means that reported emissions are not always the most significant or relevant: for certain sectors, such as industrials, downstream Scope 3 emissions will significantly outweigh upstream Scope 3 emissions or Scope 1 and 2 emissions.
For example, 57% of companies report business travel as a source of Scope 3 emissions but this only equates to 0.11% of the total emissions reported. Meanwhile, only
two financial companies (4% of financial respondents) report emissions from their investments, even though this is where they have the biggest impact, and just 7% of consumer discretionary, consumer staples, information technology and industrial companies report emissions for the use of their products.
The gaps in data are significant across all sectors: 34% of companies do not disclose any measured Scope 3 emissions. This, combined with limited engagement with customers and suppliers, will hinder these companies’ preparedness for climate change. Some companies, such as Croda and Randgold Resources, want to focus on their core operations first before their whole value chain emissions.
Abs
olut
e em
issi
ons
milli
ons
tCO
2e
% o
f res
pond
ing
com
pani
es
Downstream
transporta
tion and Distr
ibution
Upstream
transporta
tion and distr
ibution
Employee co
mmuting
Use of so
ld products
Capital goods
End of life tre
atment o
f sold products
Investm
ents
Upstream
leased
asset
s
Processin
g of sold Products
Franchise
s
Business
travel
Waste g
enerated
in operations
Purchase
d goods and se
rvices
Fuel-and-en
ergy-r
elated
activit
ies
Emissions millions tCO2e
Percentage of companies
3.5
3
2.5
2
1.5
1
0.5
0
60
50
40
30
20
10
0
Figure 6: Percentage of companies reporting Scope 3 activities and disclosed emissions by activity
Main Themes of 2013 Responses continued

21
At the moment, we don’t directly engage with our suppliers regarding climate change strategies. [This is] mainly because of the large number of individual suppliers involved.
Croda
Randgold [does not engage with our value chain because] GHG emissions reduction strategy is still relatively new to the company and the focus is on reducing emissions under our control.
Randgold Resources
What can companies do? There is a range of support available to companies who wish to start monitoring and reporting their Scope 3 emissions. For instance, Defra has recently published guidelines for reporting Scope 3 emissions per £1 of expenditure12. Companies can also use CDP to engage and track their value chain by asking suppliers to disclose their emissions; CDP’s supply chain programme can help to facilitate communication between customers and suppliers, enabling organisations to implement successful supplier engagement strategies, reduce supply chain emissions, control water impact and manage risk in a changing climate. United Utilities requires all their top 50 suppliers to use schemes such as CEMARS; the Prince of Wales’ May Day Network or CDP to measure, manage and reduce their greenhouse gas (GHG) emissions.
We have made a business decision to focus on the impact of our supply chain on the environment and to mitigate against the changing local environments in which we work.
Pace
Severe and unpredictable weather events represent a risk to our own buildings and sites. They are also likely to have an impact on our customers, suppliers and employees’ homes and buildings which can have an indirect effect upon our business. As our operations are primarily located in the UK, only some of these global weather events will impact upon our business directly. However, it is very possible that some of our suppliers from other countries could be affected by weather events which do not directly impact upon the UK. For example, the delivery of wind turbine components from overseas, or fuel supplies or materials for building projects coming from abroad, may be delayed.
SSE
12 https://www.gov.uk/government/publications/2012-greenhouse-gas-conversion-factors-for-company-reporting

22
Corporate insight - Reckitt Benckiser
Identifying innovations solutions, increasing effi ciency and reducing environmental impacts go hand in hand at Reckitt Benckiser. We’re a fast-moving, global, health, hygiene and home company - we have operations in more than 60 countries and sales in more than 200 countries. As such, we are fully aware of the international impacts of climate change on our business. We thrive on setting and beating ambitious targets. So, back in 2007, following a cross-company full lifecycle carbon footprint analysis, we set a goal to reduce our carbon footprint per dose of product by 20% by 2020.
Our analysis revealed that about two thirds of our global impact was in the consumer product use. So we focused attention on reducing consumer use impacts through product development by incorporating sustainability assessments into our design processes.
We beat our goal – eight years ahead of time. In September 2012, we set a more ambitious target – a further 33% emissions reduction by 2020, on top of the 20% already achieved. This is part of our new approach to sustainability, called betterbusiness, in support of our new vision, purpose and business strategy.
We identifi ed six global megatrends like rising energy costs, emission constraints and increasing water scarcity. We are responding to these with a strategy for more sustainable innovation, especially in areas where we can make the biggest impact. We also focus on minimising carbon emissions across the lifecycle of our products, including Scope 3 emissions.
We know that our supply chain could be vulnerable to the adverse impacts of climate change, particularly to extreme precipitation events or drought. To help us to
Setting targets is the easy part - the challenge is to guide product development in order to meet our climate goals.
manage this risk we launched our responsible natural raw materials sourcing programme. A key element of this is the assessment and management of sustainability risks (including climate change) associated with our sourcing of natural raw materials.
Setting targets is the easy part - the challenge is to guide product development in order to meet our climate goals. To do this, we developed the Sustainable Innovation Calculator to measure the lifecycle sustainability impact of each new innovation. We’ve built sustainability assessments into our product development processes and standardized reporting at key developmental milestones. Another signifi cant change we introduced was setting a fi nancial (net revenue) sales target of more sustainable innovations. Framing sustainability in the language of business helps further embed sustainability into day-to-day business operations.
Our long term aim is for each innovation to be more sustainable than the last. Having visibility of our future impact is already shaping our product pipeline to further decouple our impacts from the growth of the business.
Sharon James Senior Vice President R&D, Reckitt Benckiser

23
Main Themes of 2013 Responses continued
13 These figures compare the 2012 FTSE 350 sample to the 2013 FTSE 350 sample rather than company to company.
FTSE 100 companies have a more sophisticated response to climate change than FTSE 250 companies
94% of FTSE 100 companies (the 100 largest companies on the London Stock Exchange) and 56% of FTSE 250 companies (the 101st to 350th largest companies) responded to CDP in 2013. The samples are very different in both the quality of their response and the amount of emissions they produce. However, they are both at risk of the impacts of international climate change.
FTSE 100 companies have a more sophisticated response to the threats and opportunities of climate change – their responses are generally longer term, more comprehensive and more strategic than the FTSE 250’s. However, this may be a reflection of a greater exposure to climate change related risks due to more international operations. Across almost every metric, they show an increased disclosure or performance level which is summarised in the infographic on pages 26 and 27. This is reflected in the 61% of FTSE 100 companies that report a decrease in emissions since 2012 compared to only 34% of FTSE 250 companies.
Overall, FTSE 100 Scope 1 and 2 emissions went up by just under 2% since 2012. FTSE 250 Scope 1 and 2 emissions showed a much sharper increase, up 25% to 59 million tonnes CO2e, although this is still only one tenth of the emissions of FTSE 100 companies (541 million tonnes CO2e)13 (see infographic on p.26).
The large increase in FTSE 250 emissions may be partly explained by the fact that almost half (42%) of the responding companies have no emissions reduction target and only 27% have an absolute emissions target. Of those reporting targets, more FTSE 100 companies report both long term targets (FTSE 100: 55%, FTSE 250: 25%) and short term targets (FTSE 100: 64%, FTSE 250: 29%). In addition, the average target year is later by more than 2.5 years for FTSE 100 companies. This suggests that FTSE 100 companies are better prepared for some of the immediate impacts of climate change as well as the longer term consequences. Indeed, only 21% of FTSE 250 companies report risks with timeframes of ten years or more (49% of FTSE 100 companies do).
Fewer FTSE 250 companies appear to have a good understanding of climate change risks: three times as many FTSE 250 companies say their company does not face substantive risks or opportunities from climate change. While the magnitude of the impacts will vary depending on the sector which is affected, all companies face some risks or opportunities from climate change, whether directly or via their supply chain or customers. Even where competitors face higher risks than them, companies should still build these risks and opportunities into their business strategies.
The main physical threats to our assets and operations are from the increased intensity and frequency of severe weather events and other changes to weather patterns ... If severe weather events continue to increase in frequency and intensity, our business could be at risk from increased insurance premiums. In addition, there are equity and commodity risks if supply of electricity is interrupted.
Centrica
With over 200 offices worldwide, Atkins is likely to be subject to the physical risks of climate change; for example an increased incidence of flooding due to extreme weather events. The Group has a Business Continuity Strategy and Plan that seeks to identify threats to the organisation and provides a framework for building resilience and the capability for an effective response should an incident occur.
Atkins

24
Main Themes of 2013 Responses continued
Currently, 15% of the FTSE 100 and 43% of the FTSE 250 do not engage with research organisations or trade associations or through direct engagement with policy makers. Only 11% of FTSE 250 companies fund research organisations. These types of engagement are important in ensuring their viewpoints are accounted for in policy setting. Indeed, 92% of companies currently report that trade associations’ viewpoints are consistent with theirs.
The sectoral mix differs between the FTSE 100 and FTSE 250 companies – fewer FTSE 250 companies (13%; FTSE 100: 30%) are from high emitting sectors (Energy, Materials and Utilities – see pages 26 and 27) - and so does the current sophistication of their response to climate change. However, both samples will face significant threats from the international impacts of climate change, as illustrated by Centrica (FTSE 100) and Atkins (FTSE 250).
Healthcar
e
Industrials
Informatio
n Technology
Material
s
Teleco
mmunication Serv
ices
Utilities
Consumer Disc
retionary
Consumer Stap
lesEnerg
y
Financials
% o
f res
pond
ing
com
pani
es
30%
25%
20%
15%
10%
5%
0%
Figure 7: Sector breakdown for FTSE 100 and FTSE 250 companies
15
18
12
4
7
5
20
24
4 4
15
24
2
10
17
6
24
5
1
FTSE 100FTSE 250

25
In order for companies to be fully prepared for the international impacts of climate change, this report suggests a five point plan and a call to action that UK companies and investors can implement:
Engage executive team: Use common business language and metrics and define your company’s risk appetite. Ensure buy-in from senior management and identify risk champions throughout the business (including treasury, procurement, risk, insurance and corporate affairs);
Engage with your value chain: Collaborate with suppliers, customers and other partners (e.g. local governments, community groups) to identify current and historical risks and risk mitigation approaches. Establish a collaboration to build resilience and secure a sustainable value chain;
Identify and assess risks: Use analytical tools for a risk assessment of present and future weather and climate risks. Verify your data to ensure risks are identified and assessed across the value chain. Prioritise high risk assets and risk drivers for further assessment;
Evaluate options for managing risks and capitalising on opportunities: Use cost-benefit analyses to evaluate whether risks should be reduced, shared or accepted. Insert risks into risk registers and assess implications for insurance purchasing, procurement, business continuity plans and asset allocation. Identify new business models and opportunities for products and services that build climate resilience. Understand the return on investment of priority interventions; and
Implement decisions, monitor effectiveness and plan for the future: Work with partners from your value chain to implement resilience initiatives and monitor their performance. Revisit risks assessment as the value chain evolves, new data emerges, and as appetite to build further resilience grows.

26
Preparing for climate change: Comparing FTSE 100 and FTSE 250 companies
Average FTSE 100 score
Average FTSE 250 score81/B 60/C
FTS
E 1
00
FTSE
250
94%
56%
Who is responding?Amongst these, FTSE 100 companies are disclosing more and performing better
CD
LI
CP
LI
FTSE 100 FTSE 250
7
FTSE 250: 59m tCO2e16%84%
Scope 1 Scope 2
FTSE 100: 541m tCO2e
79%Scope 1
21%Scope 2
52% verify both Scope 1 and 2 emissions
45% report a decrease in emissions since 2012
62% have monetary incentives
FTSE 100 FTSE 250
Decrease
49%
6%
17%
Increase Other
61%
34%
33%
+1.7%since 2012 since 2012
+25.3%
79%
34%
FTSE
100
FTSE
250
FTSE 100: 79% FTSE 250: 49%
And they have six times as many companies in the CDLI and CPLI
Companies emitted: And total Scope 1 and 2 emissions increased by 3.6% overall
However, all companies can do more to respond to improve their performance:
FTSE 100 FTSE 250
34
11
2

27
FTSE 250 companies have fewer emissions reduction targets, which are more short term
And twice as many state there are no risks or opportunities to their companies
Physical Regulation Reputation and customer
behaviour
% o
f com
pani
es
0
20
40
60
80
100
0
20
40
60
80
100
Physical Regulation Reputation and customer
behaviour
% o
f com
pani
es
31.5
activities
activitiesFTSE 250
FTSE 100
Average number of activities reported:
Outsourced emissions
Business travel Product use Raw materials
2013 2014 2015 20172016
FTSE 250 companies report fewer risks and opportunities
Fewer FTSE 250 companies have stated that climate change is integrated into their strategies
Opportunities
Risks
76%94% 100%
FTSE 100
FTSE 250
FTSE 250 companies report emissions for half as many Scope 3 activities
This shows the % of companies that reported long and short term changes to their strategy due to climate change
Long term
FTSE 100
FTSE 250
FTSE 100
FTSE 250
Short term
0 10 20 30 40 50 60 70 80
55%
26%
64%
29%
84% of FTSE 100 companies have a target58% of FTSE 250
companies have a target
Average year for target

28
PwC commentary - Celine Herweijer
British business is already feeling the effects of climate change. Record losses have been racked up over recent years in the wake of increasingly frequent extreme weather events. Flooding in the UK in 2007 cost businesses over £1bn14. But, as our report for Defra shows, UK businesses may be even more exposed to the impacts of climate change abroad. Globalisation of our supply chains and asset base has shortened the distance between headline disasters and our high streets. This was demonstrated by the Thai floods in 2011 which wiped over £1.6bn off Lloyds of London’s books15 and restricted availability of some electronic goods.
Business resilience is critical to create value, achieve and sustain growth and sometimes for survival. The coming decades are expected to see major shifts in the frequency, severity and distribution of extreme events and climate conditions. This will impact security of supply, asset value and the continuity of business operations. Basing investment and risk management decisions on past experiences only will increasingly expose business to losses in the future.
While 86% of the FTSE 350 respondents report that they consider climate risks or opportunities, most businesses have little knowledge of their true exposure to weather and climate change risks across their operations and value chain. Nor do they have the ability to respond, if and when a threat materialises. This is particularly concerning when you consider that over £10 trillion of the UK’s assets are located abroad16.
Our input into this year’s United Nations Global Assessment Report on Disaster Risk Reduction shows that the focus still tends to be on directly owned assets, short term risks, and post-disaster responses.
Globalisation of our supply chains and asset base has shortened the distance between headline disasters and our high streets.
The level of understanding of, and ability to manage risks, in distant supply chains overseas is far lower. Of the FTSE 350 companies, only 52% report engaging with their suppliers on GHG emissions and climate change strategies.
At PwC, we have been working with our clients to help them understand and quantify the risks posed by disasters and the changing climate. Our Climate Risk Analytics work helps businesses integrate climate change and disaster risk into their enterprise risk management approaches. We have assessed the impacts of climate on security of supply for major retailers and worked with investors to understand climate risks to their portfolios. We use quantitative models to evaluate risks and to understand the return on investment of risk mitigation strategies.
The private sector is well placed to tackle these challenges, reduce risks and save costs. It is developing new and innovative products and services targeted at building resilience. Businesses are using new mobile-supported early warning systems that provide alerts to changing weather patterns, and investing in innovative financial risk transfer products. Many businesses now recognise that building resilience is critical to success and increasingly survival.
Celine Herweijer Partner, PwC
14 http://nationalfloodforum.org.uk/wp-content/uploads/EA-Costs-of-Flooding.pdf 15 http://www.theguardian.com/business/2012/feb/14/lloyds-thailand-flooding-2bn-dollars 16 International threats and opportunities of climate change to the UK, PwC report for Defra, 2013

29

30
Appendix I - Non-responding companies
Company name Country 2013 Status
Consumer Discretionary
Barratt Developments United Kingdom DPBetfair United Kingdom NRBwin.party Digital Entertainment United Kingdom INCarpetright United Kingdom NRDixons Retail United Kingdom DPDunelm United Kingdom INHalfords United Kingdom NRHowden Joinery United Kingdom DPInchcape United Kingdom NRITV United Kingdom DPJD Sports Fashion United Kingdom INJohn Menzies United Kingdom NRMitchells & Butlers United Kingdom DPOcado United Kingdom DPPERFORM United Kingdom NRRank United Kingdom DPRestaurant Group United Kingdom DPSports Direct United Kingdom DPWilliam Hill United Kingdom DP
Consumer Staples
A.G. Barr United Kingdom NRBooker United Kingdom DPDevro United Kingdom NR
Energy
Bumi United Kingdom DPEnQuest United Kingdom NROphir Energy United Kingdom NRSalamander Energy United Kingdom DP
Financials
Aberforth Smaller Companies Trust United Kingdom DPAshmore United Kingdom NRBank of Georgia Holdings United Kingdom NRBH Global Channel Islands NRBH Macro Channel Islands NRBlueCrest AllBlue United Kingdom DPBrewin Dolphin United Kingdom NRCaledonia Investments United Kingdom NRClose Brothers United Kingdom DPDaejan Holdings United Kingdom DPDexion Absolute United Kingdom DPGenesis Emerging Markets Fund United Kingdom NRHansteen Holdings United Kingdom DPHargreaves Lansdown United Kingdom DPHerald Investment Trust United Kingdom NRIG Group United Kingdom DPInternational Public Partnerships United Kingdom DPIP Group United Kingdom NRJardine Lloyd Thompson United Kingdom NRLancashire Holdings Bermuda DPLondonMetric Property United Kingdom DPMan United Kingdom DPNB Global Floating Rate Income Fund United Kingdom NRParagon United Kingdom NRPhoenix Group Holdings United Kingdom NRPolar Capital Technology Trust United Kingdom NRRaven Russia United Kingdom NRRIT Capital Partners United Kingdom NRScottish Investment Trust United Kingdom DPSt. Modwen Properties United Kingdom NRSVG Capital United Kingdom DPTullett Prebon United Kingdom NRUtilico Emerging Markets Bermuda NR
Company name Country 2013 Status
Witan Investment Trust United Kingdom DP
Healthcare
Genus United Kingdom NRWorldwide Healthcare Trust United Kingdom NR
Industrials
Babcock United Kingdom DPCapita United Kingdom DPFenner United Kingdom NRHomeserve United Kingdom DPKentz United Kingdom DPMelrose United Kingdom DPPaypoint United Kingdom DPUltra Electronic United Kingdom DPVesuvius United Kingdom NR
Information Technology
Anite United Kingdom NRAveva United Kingdom NRCSR United Kingdom DPFidessa United Kingdom NRImagination Technologies United Kingdom NRMoneysupermarket.com United Kingdom NROxford Instruments United Kingdom DPPlaytech United Kingdom DPSDL United Kingdom NR
Materials
Alent United Kingdom DPAz Electronic Materials United Kingdom NRCentamin United Kingdom NRFerrexpo Switzerland NRHochschild Mining United Kingdom NRKenmare Resources Ireland NRNew World Resources Netherlands DPPetropavlovsk United Kingdom DPPolymetal Russia DP
Utilities
Telecom Plus United Kingdom NR
To read 2013 company responses in full please go to www.cdp.net/en-US/Results/Pages/responses.aspx
Appendices Key :
AQ(L): Answered questionnaire late, and therefore is not scored.DP: Declined to participateIN: Information provided (e.g. CSR report)NR: No responseSA(AQ): See another - refers to another company responseNot public: the company responded privatelyNumber of Scope 3 categories: value indicates number of scope 3 categories that were reported as ‘relevant and calculated’*: the asterisk on Scope 1 or Scope 2 emissions figure indicates full points were awarded for verification that is complete or underway using an approved standardBold: companies that are in either CPLI (performance band A) or CDLI (disclosure score 88 or higher), or both.

31
Company name Country 2013 Score Scope 1 Scope 2
Number of Scope 3
catagories
Consumer Discretionary
Aegis United Kingdom 81 C 975 13,987 1Bellway United Kingdom 61 D 365* 2,819* 0Berkeley United Kingdom 78 C 3,173 9,719 3Bovis Homes United Kingdom 60 D 923 373 2British Sky Broadcasting United Kingdom 95 A 20,972* 80,458* 11Burberry United Kingdom 75 C 1,334* 38,014* 7Carnival United Kingdom 83 C 10,819,814* 57,585* 4Compass United Kingdom 82 C 76,141 9,064 0Debenhams United Kingdom 74 B Not publicDignity United Kingdom 72 D 15,097* 7,861* 0Dominos Pizza United Kingdom 63 E 6,390 4,362 3Enterprise Inns United Kingdom 25 1,787Euromoney Institutional Investors United Kingdom 49 170 2,920 1
GKN United Kingdom 60 D 201,318 946,111 0Greene King United Kingdom 61 D 42,139 93,474 1Home Retail United Kingdom 80 B 110,636* 167,599* 1Informa United Kingdom 74 D Not publicIntercontinental Hotels United Kingdom 85 B 447,000 1,806,000 4Kingfisher United Kingdom 83 B 146,819* 308,000* 7Ladbrokes United Kingdom 73 B Not publicMarks & Spencer United Kingdom 85 B 181,348* 371,633* 7Maston’s United Kingdom 52 D Not publicMillennium & Copthorne Hotels United Kingdom 68 C 73,372 235,625 0
N Brown United Kingdom 75 B 3,365 10,474 6Next United Kingdom 87 B Not publicPearson United Kingdom 72 B 30,972 118,686 5Persimmon United Kingdom 71 C 9,237 4,761 1Redrow United Kingdom 66 D 4,519 2,096 1Reed Elsevier United Kingdom 91 A 10,752* 127,105* 7Rightmove United Kingdom 26 Not publicSuperGroup United Kingdom 7 Not publicTaylor Wimpey United Kingdom 75 D 10,923 13,444 6Ted Baker United Kingdom 71 C 109 3,737 5TUI Travel United Kingdom 92 B 6,169,809* 220,058* 5UBM United Kingdom 80 A 1,022* 8,613* 5Wetherspoon United Kingdom 63 D Not publicWH Smith United Kingdom 64 B 6,439* 43,752* 1Whitbread United Kingdom 77 B 56,226* 161,381* 5WPP United Kingdom 95 B 9,859* 164,206* 2Consumer Staples
Associated British Foods United Kingdom 85 B 2,295,328* 1,067,934* 0British American Tobacco United Kingdom 94 B 359,184* 387,168* 5Britvic United Kingdom 65 D Not publicCranswick United Kingdom 56 D 33,432 44,811 2Dairy Crest United Kingdom 71 C 102,810 71,380 3Diageo United Kingdom 98 A 597,619* 83,898* 6Greggs United Kingdom 81 B Not publicImperial Tobacco United Kingdom 83 B 144,153* 163,819* 0J Sainsbury United Kingdom 95 B 728,738* 807,964* 4Morrison Supermarkets United Kingdom 83 B 469,567* 762,686* 2PZ Cussons United Kingdom 67 C Not publicReckitt Benckiser United Kingdom 99 B 104,934* 208,576* 7SABMiller United Kingdom 74 B 1,009,825* 997,465*Tate & Lyle United Kingdom 94 A- 2,177,876* 1,247,670* 3Tesco United Kingdom 96 A- 1,418,798* 3,764,068* 7Unilever United Kingdom 85 A 1,053,344* 907,399* 9Energy
Afren United Kingdom 37 Not publicAMEC United Kingdom 75 C 28,951 31,432 1BG Group United Kingdom 89 A 7,739,569* 20,295* 3BP United Kingdom 80 C 59,830,000* 8,360,000* 1Cairn Energy United Kingdom 80 D 1,589* 280* 1Essar Energy Mauritius 33 Not publicHeritage Oil Channel Islands 18 Not publicHunting United Kingdom 49 9,061 36,149Petrofac United Kingdom 77 B 160,998 40,677 1Premier Oil United Kingdom 66 D 890,809* 2,122 1
Company name Country 2013 Score Scope 1 Scope 2
Number of Scope 3
catagories
Royal Dutch Shell Netherlands 90 B 72,000,000* 9,000,000* 5Soco International United Kingdom 39 Not publicTullow Oil United Kingdom 72 B 579,834* 122* 0Wood Group United Kingdom 82 D 2,308 7,054 1Financials
3i United Kingdom 63 D 0 406 2
3i Infrastructure (see 3i) Channel Islands SA (AQ)
Aberdeen Asset Management United Kingdom 91 B 123* 3,444* 2
Admiral United Kingdom 60 D 361 6,070 2Alliance Trust United Kingdom 74 C 166 486 2Amlin United Kingdom 77 C 892* 2,997* 4Aviva United Kingdom 79 B 23,849* 75,733* 6Bankers Investment Trust (see Henderson) United Kingdom SA
(AQ)Barclays United Kingdom 92 A 46,757* 889,915* 1Beazley United Kingdom 44 42 1,618 2Big Yellow United Kingdom 71 D 143* 7,176* 0Blackrock World (see Blackrock - Global 500) United Kingdom SA
(AQ)British Assets Trust (F&C Asset Management) United Kingdom SA
(AQ)British Empire Securities United Kingdom 15British Land United Kingdom 98 A 6,728* 39,637* 10Capital & Counties Properties United Kingdom 70 C Not public
Catlin United Kingdom 85 C 750 6,206 3City of London Investment Trust (see Henderson) United Kingdom SA
(AQ)Derwent London United Kingdom 89 C 3,632* 7,053* 3Direct Line Insurance (see Royal Bank of Scotland) United Kingdom SA
(AQ)Edinburgh Dragon Trust (see Aberdeen Asset Management)
USA SA (AQ)
Edinburgh Investment Trust (see Invesco - S&P 500) United Kingdom SA
(AQ)Electra Private Equity United Kingdom 0F&C Asset Management United Kingdom 60 D 0 690 1F&C Commercial Property Trust (see F&C Asset Management)
United Kingdom SA (AQ)
Fidelity China Special Situations (see Fidelity European Values)
United Kingdom SA (AQ)
Fidelity European Values United Kingdom 48 Not publicForeign & Colonial Investment Trust (see F&C Asset Management)
United Kingdom SA (AQ)
Grainger United Kingdom 78 C 398 379 2Great Portland Estates United Kingdom 81 C 880* 4,265* 1Hammerson United Kingdom 67 C 3,061 39,420 0Henderson Ireland 81 B 29* 1,644* 3HICL Infrastructure (see HSBC) Channel Islands SA
(AQ)Hiscox United Kingdom 70 C 204 1,016 1HSBC United Kingdom 97 A 64,918* 688,827* 1Icap United Kingdom 4Intermediate Capital Group United Kingdom 60 E 44 586 1International Personal Finance United Kingdom 77 C 21,133 5,054 2
Intu Properties United Kingdom 74 B 5,458 41,857 0Investec (see Investec Ltd - South Africa) United Kingdom SA
(AQ)John Laing Infrastructure Fund Guernsey 49 19,058 71,921 0
JPMorgan American IT (see JPMorgan Chase - Global 500)
United Kingdom SA (AQ)
JPMorgan Emerging Markets Investment Trust (see JPMorgan Chase - Global 500)
United Kingdom SA (AQ)
JPMorgan Indian Investment Trust (see JPMorgan Chase - Global 500)
United Kingdom SA (AQ)
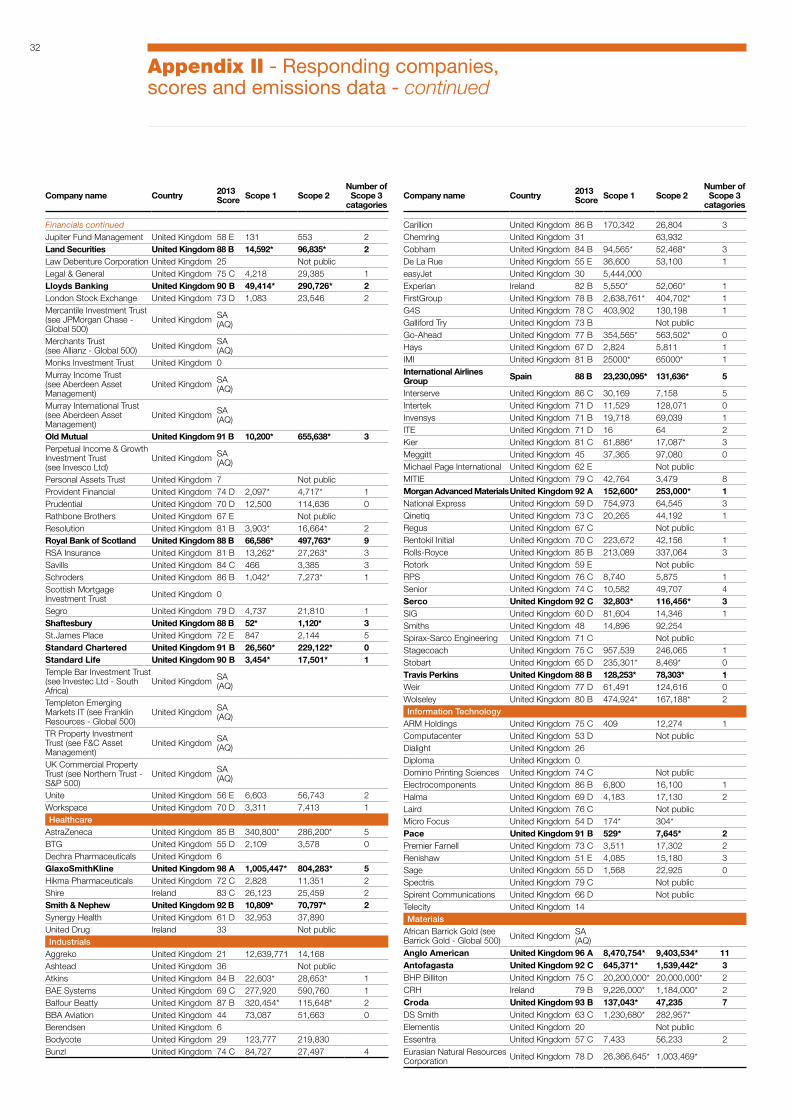
Appendix II - Responding companies, scores and emissions data
32
Company name Country 2013 Score Scope 1 Scope 2
Number of Scope 3
catagories
Financials continuedJupiter Fund Management United Kingdom 58 E 131 553 2Land Securities United Kingdom 88 B 14,592* 96,835* 2Law Debenture Corporation United Kingdom 25 Not publicLegal & General United Kingdom 75 C 4,218 29,385 1Lloyds Banking United Kingdom 90 B 49,414* 290,726* 2London Stock Exchange United Kingdom 73 D 1,083 23,546 2Mercantile Investment Trust (see JPMorgan Chase - Global 500)
United Kingdom SA (AQ)
Merchants Trust (see Allianz - Global 500) United Kingdom SA
(AQ)Monks Investment Trust United Kingdom 0Murray Income Trust (see Aberdeen Asset Management)
United Kingdom SA (AQ)
Murray International Trust (see Aberdeen Asset Management)
United Kingdom SA (AQ)
Old Mutual United Kingdom 91 B 10,200* 655,638* 3Perpetual Income & Growth Investment Trust (see Invesco Ltd)
United Kingdom SA (AQ)
Personal Assets Trust United Kingdom 7 Not publicProvident Financial United Kingdom 74 D 2,097* 4,717* 1Prudential United Kingdom 70 D 12,500 114,636 0Rathbone Brothers United Kingdom 67 E Not publicResolution United Kingdom 81 B 3,903* 16,664* 2Royal Bank of Scotland United Kingdom 88 B 66,586* 497,763* 9RSA Insurance United Kingdom 81 B 13,262* 27,263* 3Savills United Kingdom 84 C 466 3,385 3Schroders United Kingdom 86 B 1,042* 7,273* 1Scottish Mortgage Investment Trust United Kingdom 0
Segro United Kingdom 79 D 4,737 21,810 1Shaftesbury United Kingdom 88 B 52* 1,120* 3St.James Place United Kingdom 72 E 847 2,144 5Standard Chartered United Kingdom 91 B 26,560* 229,122* 0Standard Life United Kingdom 90 B 3,454* 17,501* 1Temple Bar Investment Trust (see Investec Ltd - South Africa)
United Kingdom SA (AQ)
Templeton Emerging Markets IT (see Franklin Resources - Global 500)
United Kingdom SA (AQ)
TR Property Investment Trust (see F&C Asset Management)
United Kingdom SA (AQ)
UK Commercial Property Trust (see Northern Trust - S&P 500)
United Kingdom SA (AQ)
Unite United Kingdom 56 E 6,603 56,743 2Workspace United Kingdom 70 D 3,311 7,413 1Healthcare
AstraZeneca United Kingdom 85 B 340,800* 286,200* 5BTG United Kingdom 55 D 2,109 3,578 0Dechra Pharmaceuticals United Kingdom 6GlaxoSmithKline United Kingdom 98 A 1,005,447* 804,283* 5Hikma Pharmaceuticals United Kingdom 72 C 2,828 11,351 2Shire Ireland 83 C 26,123 25,459 2Smith & Nephew United Kingdom 92 B 10,809* 70,797* 2Synergy Health United Kingdom 61 D 32,953 37,890United Drug Ireland 33 Not publicIndustrials
Aggreko United Kingdom 21 12,639,771 14,168Ashtead United Kingdom 36 Not publicAtkins United Kingdom 84 B 22,603* 28,653* 1BAE Systems United Kingdom 69 C 277,920 590,760 1Balfour Beatty United Kingdom 87 B 320,454* 115,648* 2BBA Aviation United Kingdom 44 73,087 51,663 0Berendsen United Kingdom 6Bodycote United Kingdom 29 123,777 219,830Bunzl United Kingdom 74 C 84,727 27,497 4
Company name Country 2013 Score Scope 1 Scope 2
Number of Scope 3
catagories
Carillion United Kingdom 86 B 170,342 26,804 3Chemring United Kingdom 31 63,932Cobham United Kingdom 84 B 94,565* 52,468* 3De La Rue United Kingdom 55 E 36,600 53,100 1easyJet United Kingdom 30 5,444,000Experian Ireland 82 B 5,550* 52,060* 1FirstGroup United Kingdom 78 B 2,638,761* 404,702* 1G4S United Kingdom 78 C 403,902 130,198 1Galliford Try United Kingdom 73 B Not publicGo-Ahead United Kingdom 77 B 354,565* 563,502* 0Hays United Kingdom 67 D 2,824 5,811 1IMI United Kingdom 81 B 25000* 65000* 1International Airlines Group Spain 88 B 23,230,095* 131,636* 5
Interserve United Kingdom 86 C 30,169 7,158 5Intertek United Kingdom 71 D 11,529 128,071 0Invensys United Kingdom 71 B 19,718 69,039 1ITE United Kingdom 71 D 16 64 2Kier United Kingdom 81 C 61,886* 17,087* 3Meggitt United Kingdom 45 37,365 97,080 0Michael Page International United Kingdom 62 E Not publicMITIE United Kingdom 79 C 42,764 3,479 8Morgan Advanced MaterialsUnited Kingdom 92 A 152,600* 253,000* 1National Express United Kingdom 59 D 754,973 64,545 3Qinetiq United Kingdom 73 C 20,265 44,192 1Regus United Kingdom 67 C Not publicRentokil Initial United Kingdom 70 C 223,672 42,156 1Rolls-Royce United Kingdom 85 B 213,089 337,064 3Rotork United Kingdom 59 E Not publicRPS United Kingdom 76 C 8,740 5,875 1Senior United Kingdom 74 C 10,582 49,707 4Serco United Kingdom 92 C 32,803* 116,456* 3SIG United Kingdom 60 D 81,604 14,346 1Smiths United Kingdom 48 14,896 92,254Spirax-Sarco Engineering United Kingdom 71 C Not publicStagecoach United Kingdom 75 C 957,539 246,065 1Stobart United Kingdom 65 D 235,301* 8,469* 0Travis Perkins United Kingdom 88 B 128,253* 78,303* 1Weir United Kingdom 77 D 61,491 124,616 0Wolseley United Kingdom 80 B 474,924* 167,188* 2Information Technology
ARM Holdings United Kingdom 75 C 409 12,274 1Computacenter United Kingdom 53 D Not publicDialight United Kingdom 26Diploma United Kingdom 0Domino Printing Sciences United Kingdom 74 C Not publicElectrocomponents United Kingdom 86 B 6,800 16,100 1Halma United Kingdom 69 D 4,183 17,130 2Laird United Kingdom 76 C Not publicMicro Focus United Kingdom 54 D 174* 304*Pace United Kingdom 91 B 529* 7,645* 2Premier Farnell United Kingdom 73 C 3,511 17,302 2Renishaw United Kingdom 51 E 4,085 15,180 3Sage United Kingdom 55 D 1,568 22,925 0Spectris United Kingdom 79 C Not publicSpirent Communications United Kingdom 66 D Not publicTelecity United Kingdom 14Materials
African Barrick Gold (see Barrick Gold - Global 500) United Kingdom SA
(AQ)Anglo American United Kingdom 96 A 8,470,754* 9,403,534* 11Antofagasta United Kingdom 92 C 645,371* 1,539,442* 3BHP Billiton United Kingdom 75 C 20,200,000* 20,000,000* 2CRH Ireland 79 B 9,226,000* 1,184,000* 2Croda United Kingdom 93 B 137,043* 47,235 7DS Smith United Kingdom 63 C 1,230,680* 282,957*Elementis United Kingdom 20 Not publicEssentra United Kingdom 57 C 7,433 56,233 2Eurasian Natural Resources Corporation United Kingdom 78 D 26,366,645* 1,003,469*
Appendix II - Responding companies, scores and emissions data - continued
33
Company name Country 2013 Score Scope 1 Scope 2
Number of Scope 3
catagories
Evraz United Kingdom 22 Not publicFresnillo Mexico 68 D 236,184 346,134 2Glencore International Switzerland 82 C Not publicJohnson Matthey United Kingdom 76 C 158,483 254,968 2Kazakhmys United Kingdom 65 D Not publicLonmin United Kingdom 88 B 97,452* 1,470,773* 3Mondi United Kingdom 87 B 4,329,585* 1,267,224*Petra Diamonds United Kingdom 13Randgold Resources United Kingdom 84 C 467,706* 50,418* 3Rexam United Kingdom 77 D Not publicRio Tinto United Kingdom 88 B 26,900,000* 16,400,000* 6RPC United Kingdom 73 D Not publicSynthomer United Kingdom 15 65,500 118,300Vedanta Resources United Kingdom 76 C 34,025,949 1,464,428 4Victrex United Kingdom 53 E Not publicXstrata Switzerland 82 C Not publicTelecommunicatin Services
BT United Kingdom 93 A 200,876* 192,644* 10Cable & Wireless Communications United Kingdom 48 Not public
Colt Technology Services United Kingdom 63 D 1,939 115,583 3Inmarsat United Kingdom 18 4,328KCOM United Kingdom 59 D 2,908 22,639 2TalkTalk Telecom United Kingdom 73 C 592 67,782 1Vodafone United Kingdom 85 B 404,885* 2,178,178* 2Utilities
Centrica United Kingdom 97 B 7,230,344* 166,476* 6Drax United Kingdom 75 C 22,694,674* 875,130 0National Grid United Kingdom 98 B 7,913,978* 4,547,930* 6Pennon United Kingdom 96 A- 1,934,332* 164,712* 8Severn Trent United Kingdom 83 B 147,433* 389,206* 5SSE United Kingdom 90 B 24,560,110* 1,364,652* 1United Utilities United Kingdom 80 C 118,865 377,562 2
Company name Country 2013 Score Scope 1 Scope 2
Number of Scope 3
catagories
Consumer DiscretionaryAga Rangemaster United Kingdom 88 B 13,200 13,801 0Fiberweb United Kingdom 49 28,288 138,070 2Henry Boot United Kingdom 31 1,393 927 2Mecom United Kingdom 46 Not publicMothercare United Kingdom 63 C 5,766 21,739 0Thomas Cook United Kingdom 69 C 4,309,161 20,315 1Trinity Mirror United Kingdom 65 C 5,464 45,664 3UTV Media United Kingdom 34 564 2,331Consumer Staples
Greencore Ireland 66 D Not publicHilton Food United Kingdom 34 0 28,534 1McBride United Kingdom 75 C 12,232 49,312 3Premier Foods United Kingdom 68 C Not publicEnergy
Fortune Oil Hong Kong 39 7,980 6,517JKX Oil and Gas United Kingdom 50 E 128,568 9,335 0
Lamprell United Arab Emirates
25 78,276 0
FinancialsBaillie Gifford Japan Trust United Kingdom 0Edinburgh Worldwide Investment Trust
United Kingdom 0
Helical Bar United Kingdom 63 D 723 3,578 1Impax Environmental Markets
United Kingdom 55 E 0 64 1
Pacific Horizon Investment Trust
United Kingdom 0
Quintain Estates United Kingdom 10 Not publicScottish Oriental Smaller Companies Trust
United Kingdom 9 Not public
HealthcareVectura United Kingdom 52 D Not publicIndustrials
Costain United Kingdom 84 A 9,210* 3,378* 4Hyder Consulting United Kingdom 58 D 164 2,863 1
Morgan Sindall Group United Kingdom 91 B 34,662* 11,345* 3Ricardo United Kingdom AQ (L)Shanks United Kingdom 54 D 510,000 79,000Speedy Hire United Kingdom 65 C 19,051 4,701 1UK Mail Ltd United Kingdom 30 57,900 0Wincanton United Kingdom 75 C Not publicXP Power United Kingdom 53 D 37 1,835 2Information Technology
Xchanging United Kingdom 59 E 3,231 15,553 1Materials
Aquarius Platinum Bermuda 76 E 26,753 634,313 3British Polythene Industries United Kingdom 41 3,491 122,847 1First Quantum Minerals Canada 80 D 763,326 37,212 2Hill & Smith United Kingdom 51 E 18,589 11,837 0Marshalls United Kingdom 85 B 41,956* 18,342* 5Talvivaara Mining Finland 81 D 197,072 17,402 3
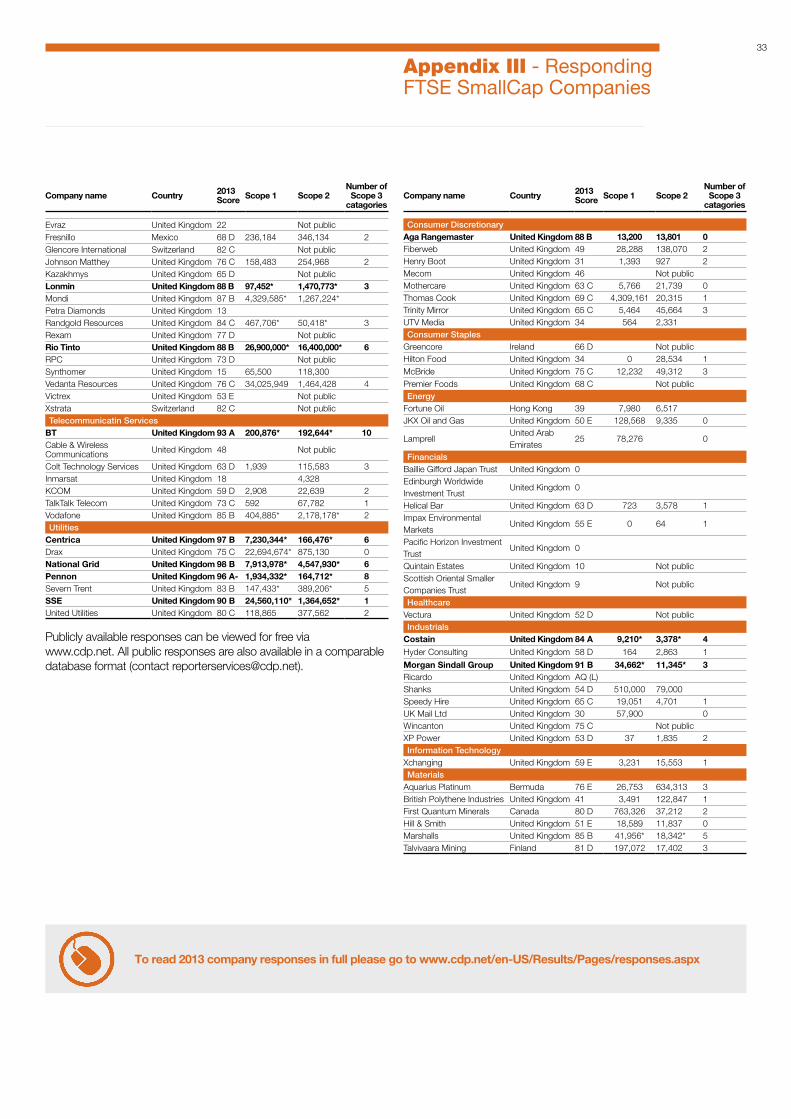
Appendix III - Responding FTSE SmallCap Companies
To read 2013 company responses in full please go to www.cdp.net/en-US/Results/Pages/responses.aspx
Publicly available responses can be viewed for free via www.cdp.net. All public responses are also available in a comparable database format (contact [email protected]).

34
2013 INVESTOR SIGNATORY BREAKDOWN - TYPE
247 Mainstream Asset Managers167 Pension funds160 Banks51 Insurance39 SRI Asset Managers34 Foundations27 Other
Appendix IV - Investor members
CDP works with investors globally to advance the investment opportunities and reduce the risks posed by climate change by asking over 5,000 of the world’s largest companies to report their climate strategies, GHG emissions and energy use through CDP’s
standardised format. To learn more about CDP’s member offering and becoming a member, please contact us or visit the investor pages at https://www.cdp.net/en-US/WhatWeDo/Pages/investors.aspx
ABRAPP - Associação Brasileira das Entidades Fechadas de Previdência Complementar
ATP Group
Aviva Investors
Bank of America
Bendigo and Adelaide Bank
BlackRock
Boston Common Asset Management, LLC
California Public Employees' Retirement System (CalPERS)
California State Teachers' Retirement System (CalSTRS)
Calvert Group, Ltd.
Capricorn Investment Group
Catholic Super
CCLA Investment Management Ltd
Daiwa Asset Management Co. Ltd.
Generation Investment Management
Goldman Sachs Group Inc.
Henderson Global Investors
HSBC Holdings plc
Legg Mason, Inc.
KLP
London Pensions Fund Authority
Mobimo Holding AG
2013 INVESTOR SIGNATORY BREAKDOWN - REGION
Africa (15)
America - Latin & Caribbean (71)
America - North (174)
Asia (71)
Australia and New Zealand (61)
Europe - North & Western (294)
Europe - Southern & Eastern (39)
0 50 100 150 200 250 300
Mongeral Aegon Seguros e Previdência S.A.
Morgan Stanley
National Australia Bank
Neuberger Berman
Newton Investment Management Limited
Nordea Bank
Norges Bank Investment Management (NBIM)
Northwest and Ethical Investments L.P. (NEI Investments)
PFA Pension
Robeco
RobecoSAM AG
Rockefeller Asset Management
Royal Bank of Scotland Group
Sampension KP Livsforsikring A/S
Schroders
Scottish Widows Investment Partnership
Skandinaviska Enskilda Banken AB (SEB AB)
Sompo Japan Insurance Inc.
Standard Chartered
Sun Life Financial Inc
Sustainable Insights Capital Management
TD Asset Management
The Wellcome Trust
INCREASING NUMBER OF INVESTORS REQUESTING CLIMATE DATA THROUGH CDP
• Investor signatory assets• Number of investor signatories
1 CDP INVESTOR SIGNATORIES & ASSETS (US$ TRILLION) AGAINST TIME
• Investor CDP Signatories• Investor CDP Signatory Assets
354.5
9510
15521
22531
31541
38557
47555
53464
55171
65578
72287
2003 2004 2007 2008 2009 2010 2011 2012 201320062005
800
700
600
500
400
300
200
100
0
100
90
80
70
60
50
40
30
20
10
0
Ass
ets
(US
$ Tr
illio
ns)
Num
ber
of S
igna
torie
s
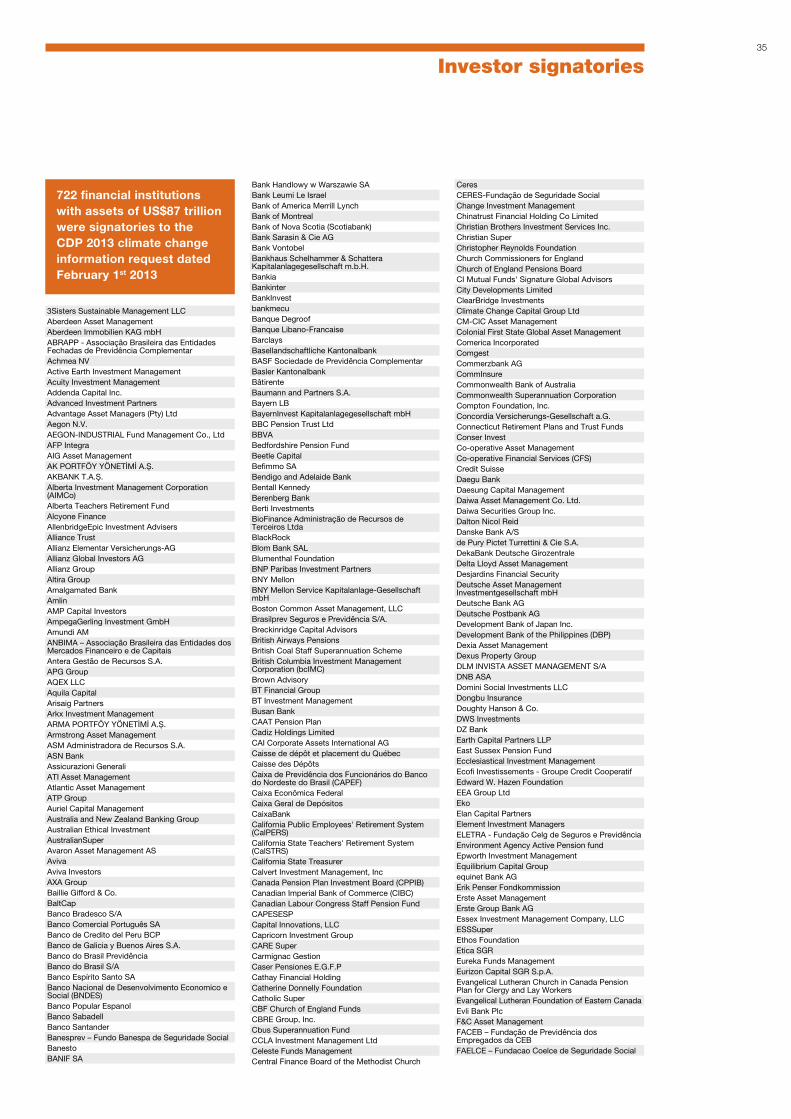
35
3Sisters Sustainable Management LLCAberdeen Asset ManagementAberdeen Immobilien KAG mbHABRAPP - Associação Brasileira das Entidades Fechadas de Previdência ComplementarAchmea NVActive Earth Investment ManagementAcuity Investment ManagementAddenda Capital Inc.Advanced Investment PartnersAdvantage Asset Managers (Pty) LtdAegon N.V.AEGON-INDUSTRIAL Fund Management Co., LtdAFP IntegraAIG Asset ManagementAK PORTFÖY YÖNETİMİ A.Ş.AKBANK T.A.Ş.Alberta Investment Management Corporation (AIMCo)Alberta Teachers Retirement FundAlcyone FinanceAllenbridgeEpic Investment AdvisersAlliance TrustAllianz Elementar Versicherungs-AGAllianz Global Investors AGAllianz GroupAltira GroupAmalgamated BankAmlinAMP Capital InvestorsAmpegaGerling Investment GmbHAmundi AMANBIMA – Associação Brasileira das Entidades dos Mercados Financeiro e de CapitaisAntera Gestão de Recursos S.A.APG GroupAQEX LLCAquila CapitalArisaig PartnersArkx Investment ManagementARMA PORTFÖY YÖNETİMİ A.Ş.Armstrong Asset ManagementASM Administradora de Recursos S.A.ASN BankAssicurazioni GeneraliATI Asset ManagementAtlantic Asset ManagementATP GroupAuriel Capital ManagementAustralia and New Zealand Banking GroupAustralian Ethical InvestmentAustralianSuperAvaron Asset Management ASAvivaAviva InvestorsAXA GroupBaillie Gifford & Co.BaltCapBanco Bradesco S/ABanco Comercial Português SABanco de Credito del Peru BCPBanco de Galicia y Buenos Aires S.A.Banco do Brasil PrevidênciaBanco do Brasil S/ABanco Espírito Santo SABanco Nacional de Desenvolvimento Economico e Social (BNDES)Banco Popular EspanolBanco SabadellBanco SantanderBanesprev – Fundo Banespa de Seguridade SocialBanestoBANIF SA
Bank Handlowy w Warszawie SABank Leumi Le IsraelBank of America Merrill LynchBank of MontrealBank of Nova Scotia (Scotiabank)Bank Sarasin & Cie AGBank VontobelBankhaus Schelhammer & Schattera Kapitalanlagegesellschaft m.b.H.BankiaBankinterBankInvestbankmecuBanque DegroofBanque Libano-FrancaiseBarclaysBasellandschaftliche KantonalbankBASF Sociedade de Previdência ComplementarBasler KantonalbankBâtirenteBaumann and Partners S.A.Bayern LBBayernInvest Kapitalanlagegesellschaft mbHBBC Pension Trust LtdBBVABedfordshire Pension FundBeetle CapitalBefimmo SABendigo and Adelaide BankBentall KennedyBerenberg BankBerti InvestmentsBioFinance Administração de Recursos de Terceiros LtdaBlackRockBlom Bank SALBlumenthal FoundationBNP Paribas Investment PartnersBNY MellonBNY Mellon Service Kapitalanlage-Gesellschaft mbHBoston Common Asset Management, LLCBrasilprev Seguros e Previdência S/A.Breckinridge Capital AdvisorsBritish Airways PensionsBritish Coal Staff Superannuation SchemeBritish Columbia Investment Management Corporation (bcIMC)Brown AdvisoryBT Financial GroupBT Investment ManagementBusan BankCAAT Pension PlanCadiz Holdings LimitedCAI Corporate Assets International AGCaisse de dépôt et placement du QuébecCaisse des DépôtsCaixa de Previdência dos Funcionários do Banco do Nordeste do Brasil (CAPEF)Caixa Econômica FederalCaixa Geral de DepósitosCaixaBankCalifornia Public Employees' Retirement System (CalPERS)California State Teachers' Retirement System (CalSTRS)California State TreasurerCalvert Investment Management, IncCanada Pension Plan Investment Board (CPPIB)Canadian Imperial Bank of Commerce (CIBC)Canadian Labour Congress Staff Pension FundCAPESESPCapital Innovations, LLCCapricorn Investment GroupCARE SuperCarmignac GestionCaser Pensiones E.G.F.PCathay Financial HoldingCatherine Donnelly FoundationCatholic SuperCBF Church of England FundsCBRE Group, Inc.Cbus Superannuation FundCCLA Investment Management LtdCeleste Funds ManagementCentral Finance Board of the Methodist Church
CeresCERES-Fundação de Seguridade SocialChange Investment ManagementChinatrust Financial Holding Co LimitedChristian Brothers Investment Services Inc.Christian SuperChristopher Reynolds FoundationChurch Commissioners for EnglandChurch of England Pensions BoardCI Mutual Funds' Signature Global AdvisorsCity Developments LimitedClearBridge InvestmentsClimate Change Capital Group LtdCM-CIC Asset ManagementColonial First State Global Asset ManagementComerica IncorporatedComgestCommerzbank AGCommInsureCommonwealth Bank of AustraliaCommonwealth Superannuation CorporationCompton Foundation, Inc.Concordia Versicherungs-Gesellschaft a.G.Connecticut Retirement Plans and Trust FundsConser InvestCo-operative Asset ManagementCo-operative Financial Services (CFS)Credit SuisseDaegu BankDaesung Capital ManagementDaiwa Asset Management Co. Ltd. Daiwa Securities Group Inc.Dalton Nicol ReidDanske Bank A/Sde Pury Pictet Turrettini & Cie S.A.DekaBank Deutsche GirozentraleDelta Lloyd Asset ManagementDesjardins Financial SecurityDeutsche Asset Management Investmentgesellschaft mbHDeutsche Bank AGDeutsche Postbank AGDevelopment Bank of Japan Inc.Development Bank of the Philippines (DBP)Dexia Asset ManagementDexus Property GroupDLM INVISTA ASSET MANAGEMENT S/ADNB ASADomini Social Investments LLCDongbu InsuranceDoughty Hanson & Co.DWS InvestmentsDZ BankEarth Capital Partners LLPEast Sussex Pension FundEcclesiastical Investment ManagementEcofi Investissements - Groupe Credit CooperatifEdward W. Hazen FoundationEEA Group LtdEkoElan Capital PartnersElement Investment ManagersELETRA - Fundação Celg de Seguros e PrevidênciaEnvironment Agency Active Pension fundEpworth Investment ManagementEquilibrium Capital Groupequinet Bank AGErik Penser FondkommissionErste Asset ManagementErste Group Bank AGEssex Investment Management Company, LLCESSSuperEthos FoundationEtica SGREureka Funds ManagementEurizon Capital SGR S.p.A.Evangelical Lutheran Church in Canada Pension Plan for Clergy and Lay WorkersEvangelical Lutheran Foundation of Eastern CanadaEvli Bank PlcF&C Asset ManagementFACEB – Fundação de Previdência dos Empregados da CEBFAELCE – Fundacao Coelce de Seguridade Social
Investor signatories
722 financial institutions with assets of US$87 trillion were signatories to the CDP 2013 climate change information request dated February 1st 2013

36
FAPERS- Fundação Assistencial e Previdenciária da Extensão Rural do Rio Grande do SulFASERN - Fundação COSERN de Previdência ComplementarFédéris Gestion d'ActifsFIDURA Capital Consult GmbHFIM Asset Management LtdFIM ServicesFinanciere de l'EchiquierFIPECq - Fundação de Previdência Complementar dos Empregados e Servidores da FINEP, do IPEA, do CNPqFIRA. - Banco de MexicoFirst Affirmative Financial Network, LLCFirst Commercial BankFirst State InvestmentsFirst State Superannuation SchemeFirst Swedish National Pension Fund (AP1)Firstrand LimitedFive Oceans Asset ManagementFlorida State Board of Administration (SBA)FolketrygdfondetFolksamFondaction CSNFondation de LuxembourgForma Futura Invest AGFourth Swedish National Pension Fund, (AP4)FRANKFURT-TRUST Investment Gesellschaft mbHFriends Fiduciary CorporationFubon Financial HoldingsFukoku Capital Management IncFUNCEF - Fundação dos Economiários FederaisFundação AMPLA de Seguridade Social - BrasiletrosFundação Atlântico de Seguridade SocialFundação Attilio Francisco Xavier FontanaFundação Banrisul de Seguridade SocialFundação BRDE de Previdência Complementar - ISBREFundação Chesf de Assistência e Seguridade Social – FachesfFundação Corsan - dos Funcionários da Companhia Riograndense de SaneamentoFundação de Assistência e Previdência Social do BNDES - FAPESFUNDAÇÃO ELETROBRÁS DE SEGURIDADE SOCIAL - ELETROSFundação Forluminas de Seguridade Social - FORLUZFundação Itaipu BR - de Previdência e Assistência SocialFUNDAÇÃO ITAUBANCOFundação Itaúsa IndustrialFundação Promon de Previdência SocialFundação Rede Ferroviaria de Seguridade Social – ReferFUNDAÇÃO SANEPAR DE PREVIDÊNCIA E ASSISTÊNCIA SOCIAL - FUSANFundação Sistel de Seguridade Social (Sistel)Fundação Vale do Rio Doce de Seguridade Social - VALIAFUNDIÁGUA - FUNDAÇÃO DE PREVIDENCIA COMPLEMENTAR DA CAESBFuturegrowth Asset ManagementGEAP Fundação de Seguridade SocialGeneral Equity Group AGGenerali Deutschland Holding AGGeneration Investment ManagementGenus Capital ManagementGerman Equity Trust AGGjensidige Forsikring ASAGlobal Forestry Capital S.a.r.l.GLS Gemeinschaftsbank eGGoldman Sachs Group Inc.GOOD GROWTH INSTITUT für globale Vermögensentwicklung mbHGovernance for OwnersGovernment Employees Pension Fund (“GEPF”), Republic of South AfricaGPT GroupGreater Manchester Pension FundGreen Cay Asset ManagementGreen Century Capital ManagementGROUPAMA EMEKLİLİK A.Ş.GROUPAMA SİGORTA A.Ş.Groupe Crédit CoopératifGroupe Investissement Responsable Inc.GROUPE OFI AMGrupo Financiero Banorte SAB de CVGrupo Santander BrasilGruppo Bancario Credito ValtellineseGruppo Monte PaschiGuardians of New Zealand Superannuation
Hang Seng BankHanwha Asset Management CompanyHarbour Asset ManagementHarrington Investments, IncHauck & Aufhäuser Asset Management GmbHHazel Capital LLPHDFC Bank LtdHealthcare of Ontario Pension Plan (HOOPP)Helaba Invest Kapitalanlagegesellschaft mbHHenderson Global InvestorsHermes Fund ManagersHESTA SuperHIP InvestorHolden & PartnersHSBC Global Asset Management (Deutschland) GmbHHSBC Holdings plcHSBC INKA Internationale Kapitalanlagegesellschaft mbHHumanisHyundai Marine & Fire Insurance Co., Ltd.Hyundai Securities Co., Ltd.IBK SecuritiesIDBI Bank LtdIDFC LtdIllinois State Board of InvestmentIlmarinen Mutual Pension Insurance CompanyImpax Group plcIndependent Planning GroupIndusind BankIndustrial Alliance Insurance and Financial Services Inc.Industrial BankIndustrial Bank of KoreaIndustrial Development CorporationIndustry Funds ManagementInflection Point PartnersING GroupInsight Investment Management (Global) LtdInstituto Infraero de Seguridade Social - INFRAPREVInstituto Sebrae De Seguridade Social - SEBRAEPREVInsurance Australia GroupIntReal KAGInvestec Asset ManagementInvesting for GoodIrish Life Investment ManagersItaú Asset ManagementItaú Unibanco Holding S.A.Janus Capital Group Inc.Jarislowsky Fraser LimitedJessie Smith Noyes FoundationJOHNSON & JOHNSON SOCIEDADE PREVIDENCIARIAJPMorgan Chase & Co.Jubitz Family FoundationJupiter Asset ManagementKaiser Ritter Partner Privatbank AG (Schweiz)KB Kookmin BankKBC Asset Management NVKBC GroupKCPS and CompanyKDB Asset Management Co., Ltd.KDB Daewoo Securities Co. Ltd.KEPLER-FONDS Kapitalanlagegesellschaft m. b. H.KEVAKeyCorpKfW BankengruppeKillik & Co LLPKiwi Income Property TrustKleinwort Benson InvestorsKlimaINVESTKLP InsuranceKorea Investment ManagementKorea Technology Finance CorporationKPA PensionLa Banque Postale Asset ManagementLa Financiere ResponsableLampe Asset Management GmbHLandsorganisationen i SverigeLaSalle Investment ManagementLBBW - Landesbank Baden-WürttembergLBBW Asset Management Investmentgesellschaft mbHLD Lønmodtagernes DyrtidsfondLegal & General Investment ManagementLegg Mason, Inc.LGT Capital Management Ltd.LIG Insurance Co., Ltd.Light Green Advisors, LLC
Living Planet Fund Management Company S.A.Lloyds Banking GroupLocal Authority Pension Fund ForumLocal Government SuperLOGOS PORTFÖY YÖNETIMI A.Ş.London Pensions Fund AuthorityLothian Pension FundLUCRF SuperMacquarie GroupMagNet Magyar Közösségi Bank Zrt.MainFirst Bank AGMalakoff MédéricMAMA Sustainable Incubation AGMan Group plcMandarine GestionMAPFREMaple-Brown AbbottMarc J. Lane Investment Management, Inc.Maryland State TreasurerMatrix Asset ManagementMatrix GroupMcLean BuddenMEAG MUNICH ERGO Asset Management GmbHMediobancaMeeschaert Gestion PrivéeMeiji Yasuda Life Insurance CompanyMendesprev Sociedade PrevidenciáriaMerck Family FundMercy Investment Services, Inc.Mergence Investment ManagersMetallRente GmbHMetrus – Instituto de Seguridade SocialMetzler Investment GmbhMFS Investment ManagementMidas International Asset ManagementMiller/Howard InvestmentsMirae Asset Global Investments Co. Ltd.Mirae Asset SecuritiesMirvac GroupMissionary Oblates of Mary ImmaculateMistra, Foundation for Strategic Environmental ResearchMitsubishi UFJ Financial Group, Inc.Mitsui Sumitomo Insurance Co.,LtdMizuho Financial Group, Inc.Mn ServicesMomentum Manager of Managers (Pty) LtdMonega Kapitalanlagegesellschaft mbHMongeral Aegon Seguros e Previdência S.A.Morgan StanleyMountain Cleantech AGMTAA Superannuation FundMutual Insurance Company Pension-FenniaNanuk Asset ManagementNatcan Investment ManagementNathan Cummings Foundation, TheNational Australia BankNational Bank of CanadaNational Bank Of GreeceNational Grid Electricity Group of the Electricity Supply Pension SchemeNational Grid UK Pension SchemeNational Pensions Reserve Fund of IrelandNational Union of Public and General Employees (NUPGE)Nativus Sustainable InvestmentsNatixis SANatural Investments LLCNedbank LimitedNeedmor FundNelson Capital Management, LLCNest SammelstiftungNeuberger BermanNew Alternatives Fund Inc.New Amsterdam Partners LLCNew ForestsNew Mexico State TreasurerNew York City Employees Retirement SystemNew York City Teachers Retirement SystemNew York State Common Retirement Fund (NYSCRF)Newton Investment Management LimitedNGS SuperNH-CA Asset ManagementNikko Asset Management Co., Ltd.Nipponkoa Insurance Company, LtdNissay Asset Management CorporationNORD/LB Kapitalanlagegesellschaft AGNordea BankNorfolk Pension Fund
Investor signatories continued

37
Norges Bank Investment Management (NBIM)North Carolina Retirement SystemNorthern Ireland Local Government Officers' Superannuation Committee (NILGOSC)Northern Star GroupNorthern TrustNorthward CapitalNorthwest and Ethical Investments L.P. (NEI Investments)NykreditOceanRock Investments Inc.Oddo & Cieoeco capital Lebensversicherung AGÖKOWORLDOld Mutual plcOMERS Administration CorporationOntario Pension BoardOntario Teachers' Pension PlanOP Fund Management Company LtdOppenheim & Co LimitedOppenheim Fonds Trust GmbHOpplysningsvesenets fond (The Norwegian Church Endowment)OPSEU Pension Trust (OP Trust)Oregon State TreasurerOrion Energy SystemsOsmosis Investment ManagementPanahpurPark FoundationParnassus InvestmentsPax World FundsPensioenfonds VervoerPension DenmarkPension Fund for Danish Lawyers and EconomistsPension Protection FundPensionsmyndighetenPerpetual InvestmentsPETROS - Fundação Petrobras de Seguridade SocialPFA PensionPGGMPhillips, Hager & North Investment Management Ltd.PhiTrust Active InvestorsPictet Asset Management SAPinstripe Management GmbHPioneer InvestmentsPiraeus BankPKAPluris Sustainable Investments SAPNC Financial Services Group, Inc.Pohjola Asset Management LtdPolden Puckham Charitable FoundationPortfolio 21 InvestmentsPorto Seguro S.A.POSTALIS - Instituto de Seguridade Social dos Correios e TelégrafosPower Finance CorporationPREVHAB PREVIDÊNCIA COMPLEMENTARPREVI Caixa de Previdência dos Funcionários do Banco do BrasilPREVIG Sociedade de Previdência ComplementarPrologisProvinzial Rheinland HoldingPrudential Investment ManagementPrudential PLCPsagot Investment House LtdPSP InvestmentsQ Capital Partners Co. LtdQBE Insurance GroupRabobankRaiffeisen Fund Management Hungary Ltd.Raiffeisen Kapitalanlage-Gesellschaft m.b.H.Raiffeisen SchweizRathbone Greenbank InvestmentsRCM (Allianz Global Investors)Real Grandeza Fundação de Previdência e Assistência SocialREI SuperReliance Capital LtdRepresentative Body of the Church in WalesResolutionResona Bank, LimitedReynders McVeigh Capital ManagementRiver Twice Capital Advisors, LLCRLAMRobecoRobecoSAM AGRobert & Patricia Switzer FoundationRockefeller Asset Management
Rose Foundation for Communities and the EnvironmentRothschildRoyal Bank of CanadaRoyal Bank of Scotland GroupRPMI Railpen InvestmentsRREEF Investment GmbHRussell InvestmentsSampension KP Livsforsikring A/SSamsung Fire & Marine InsuranceSamsung Life InsuranceSamsung SecuritiesSanlamSanta Fé Portfolios LtdaSantam LtdSarasin & PartnersSAS Trustee CorporationSauren Finanzdienstleistungen GmbH & Co. KGSchrodersScottish Widows Investment PartnershipSEB Asset Management AGSecond Swedish National Pension Fund (AP2)Seligson & Co Fund Management PlcSentinel FundsSERPROS - Fundo MultipatrocinadoService Employees International Union Benefit FundsServite FriarsSeventh Swedish National Pension Fund (AP7)Shiga Bank, Ltd.Shinhan BankShinhan BNP Paribas Investment Trust Management Co., LtdShinkin Asset Management Co., LtdSiemens Kapitalanlagegesellschaft mbHSignet Capital Management LtdSkandiaSkandinaviska Enskilda Banken AB (SEB AB)Smith Pierce, LLCSNS Asset ManagementSocial(k)Sociedade de Previdencia Complementar da Dataprev - PrevdataSocrates Fund ManagementSolaris Investment ManagementSompo Japan Insurance Inc.Sonen Capital LLCSopher Investment ManagementSoprise! LLPSouthPeak Investment ManagementSPF Beheer bvSpring Water Asset Management, LLCSprucegrove Investment Management LtdStandard CharteredStandard Chartered Korea LimitedStandard Life InvestmentsState Bank of IndiaState Street CorporationStatewideSuperStocklandStorebrand ASAStrathclyde Pension FundStratus GroupSumitomo Mitsui Financial GroupSumitomo Mitsui Trust Holdings, Inc.Sun Life Financial Inc.Superfund Asset Management GmbHSUSI Partners AGSustainable CapitalSustainable Development Capital LLPSustainable Insight Capital ManagementSvenska Kyrkan, Church of SwedenSvenska Kyrkans PensionskassaSwedbankSwift FoundationSwiss ReSwisscanto Holding AGSycomore Asset ManagementSyntrus Achmea Asset ManagementT. Rowe PriceT.GARANTİ BANKASI A.Ş.T.SINAİ KALKINMA BANKASI A.Ş.Tata Capital LimitedTD Asset ManagementTeachers Insurance and Annuity Association – College Retirement Equities FundTelluride AssociationTempis Capital Management Co., Ltd.Terra Forvaltning ASTerraVerde Capital Management LLC
TfL Pension FundThe ASB Community TrustThe Brainerd FoundationThe Bullitt FoundationThe Central Church Fund of FinlandThe Children's Investment Fund FoundationThe Clean Yield GroupThe Collins FoundationThe Co-operators Group LimitedThe Daly FoundationThe Environmental Investment Partnership LLPThe Hartford Financial Services Group, Inc.The Joseph Rowntree Charitable TrustThe Korea Teachers PensionThe New SchoolThe Oppenheimer GroupThe Pension Plan For Employees of the Public Service Alliance of CanadaThe Pinch GroupThe Presbyterian Church in CanadaThe Russell Family FoundationThe Sandy River Charitable FoundationThe Sisters of St. AnnThe Standard Bank GroupThe Sustainability GroupThe United Church of Canada - General CouncilThe University of Edinburgh Endowment FundThe Wellcome TrustThird Swedish National Pension Fund (AP3)Threadneedle Asset ManagementTobamTokio Marine & Nichido Fire Insurance Co., Ltd.Toronto Atmospheric FundTrillium Asset Management, LLCTriodos BankTri-State Coalition for Responsible InvestmentTrygTurner InvestmentsUBSUnibail-RodamcoUniCreditUnion Asset Management Holding AGUnion di Banche Italiane S.c.p.aUnion Investment Privatfonds GmbHUnionenUnipensionUNISON staff pension schemeUniSuper Unitarian Universalist AssociationUnited Methodist Church General Board of Pension and Health BenefitsUnited Nations FoundationUnity Trust BankUniversities Superannuation Scheme (USS)Vancity Group of CompaniesVCH Vermögensverwaltung AGVentas IncVeris Wealth PartnersVeritas Investment Trust GmbHVermont State TreasurerVexiom Capital, L.P.VicSuperVictorian Funds Management CorporationVIETNAM HOLDING ASSET MANAGEMENT LTD.Vinva Investment ManagementVoigt & CollegenVOLKSBANK INVESTMENTSWaikato Community TrustWalden Asset Management, a division of Boston Trust & Investment Management CompanyWARBURG - HENDERSON Kapitalanlagegesellschaft für Immobilien mbHWARBURG INVEST KAPITALANLAGEGESELLSCHAFT MBHWater Asset Management, LLCWells Fargo & CompanyWest Yorkshire Pension FundWestLB Mellon Asset Management (WMAM)Westpac Banking CorporationWHEB Asset ManagementWhite Owl Capital AGWoori BankWoori Investment & SecuritiesYES BANK LimitedYork University Pension FundYouville Provident Fund Inc.Zegora Investment ManagementZevin Asset ManagementZurich Cantonal Bank

38
Notes

39
CDP Gold Consultancy Partners 2013
CDP Silver UK Consultancy Partners 2013
CDP Silver UK Education & Training Partner 2013
Design and production Printing
www.productionstudios.co.uk
Global Advisor and Report Writer

40
CDP Contacts
Paul DickinsonExecutive Chairman
Paul SimpsonChief Executive Officer
Frances WayCo-Chief Operating Officer
Sue HowellsCo-Chief Operating Officer
Daniel TurnerHead of Disclosure
James HulseHead of Investor Initiatives
James HowardDirector, Disclosure
Rosie MackenzieSenior Project Officer
CDP UK40 Bowling Green Lane London, EC1R 0NEUnited KingdomTel: +44 (0) 20 7970 5660
PwC Contacts
Emma CoxPartner
Celine HerweijerPartner
Jonathan GrantDirector
Simon MessengerProject Lead
Ellen DanielssonAssistant Project Manager
PricewaterhouseCoopers LLP7, More LondonLondon, SE1 2RTUnited KingdomTel: +44 (0) 20 7583 5000
Contact details can be found at the following web address:www.pwc.com/sustainability
CDP Board of Trustees
Chairman: Alan BrownSchroders
James CameronClimate Change Capital & ODI
Ben GoldsmithWHEB
Chris PageRockefeller Philanthropy Advisors
Dr. Christoph Schroeder
Jeremy Smith
Takejiro Sueyoshi
Tessa Tennant
Martin WiseRelationship Capital Partners
Our sincere thanks are extended to the following: Allen & Overy, Board and Technical Working Group of Climate Disclosure Standards Board, European Commission, Freshfields, Institutional Investors Group on Climate Change, Investor Group on Climate Change, Investor Network on Climate Risk, Skadden Arps, UK Department of Environment Food and Rural Affairs, UK Foreign & Commonwealth Office, UN Environment Programme Finance Initiative, UNFCCC Secretariat, UN Global Compact, UN Principles for Responsible Investment, World Business Council for Sustainable Development, World Resources Institute
Global Partners
Global Implementation Partner Global Technology Partner