aris method manual
TRANSCRIPT

This document applies to ARIS Version 10.0 and to all subsequent releases. Specifications contained herein are subject to change and these changes will be reported in subsequent release notes or new editions. Copyright © 2010 - 2019 Software AG, Darmstadt, Germany and/or Software AG USA Inc., Reston, VA, USA, and/or its subsidiaries and/or its affiliates and/or their licensors. The name Software AG and all Software AG product names are either trademarks or registered trademarks of Software AG and/or Software AG USA Inc. and/or its subsidiaries and/or its affiliates and/or their licensors. Other company and product names mentioned herein may be trademarks of their respective owners. Detailed information on trademarks and patents owned by Software AG and/or its subsidiaries is located at http://softwareag.com/licenses. Use of this software is subject to adherence to Software AG's licensing conditions and terms. These terms are part of the product documentation, located at http://softwareag.com/licenses and/or in the root installation directory of the licensed product(s). This software may include portions of third-party products. For third-party copyright notices, license terms, additional rights or restrictions, please refer to "License Texts, Copyright Notices and Disclaimers of Third Party Products". For certain specific third-party license restrictions, please refer to section E of the Legal Notices available under "License Terms and Conditions for Use of Software AG Products / Copyright and Trademark Notices of Software AG Products". These documents are part of the product documentation, located at http://softwareag.com/licenses and/or in the root installation directory of the licensed product(s).

METHOD MANUAL
I
Contents 1 Introduction ............................................................................................................ 1
2 Architecture of Integrated Information Systems (ARIS) ................................................ 3 2.1 ARIS architecture concept ............................................................................... 3 2.2 Descriptive views ........................................................................................... 3 2.3 Descriptive levels ........................................................................................... 7
3 Process chain analysis ............................................................................................ 11 3.1 Description of the business management problem ........................................... 11 3.2 Process chain diagram (PCD) ........................................................................ 12
4 Modeling within the views and levels of the ARIS concept ........................................... 14 4.1 Function view .............................................................................................. 14
4.1.1 Requirements definition ........................................................................ 14 4.1.1.1 Function tree ............................................................................. 15 4.1.1.2 Y diagram ................................................................................. 20 4.1.1.3 SAP applications diagram ............................................................ 21 4.1.1.4 Objective diagram ...................................................................... 22
4.1.2 Design specification - Application system type diagram............................. 23 4.1.3 Implementation - Application system diagram ......................................... 27
4.2 Data view ................................................................................................... 30 4.2.1 Requirements definition ........................................................................ 30
4.2.1.1 The ERM base model .................................................................. 30 4.2.1.2 ERM - eERM extensions............................................................... 35
4.2.1.2.1 Design operators added ...................................................... 35 4.2.1.2.2 Extension of cardinalities ..................................................... 40 4.2.1.2.3 Identification and existence dependency ............................... 42 4.2.1.2.4 Modeling technical terms used in a company - Technical
terms model ...................................................................... 43 4.2.1.2.5 eERM attribute allocation diagram ........................................ 45
4.2.1.3 Alternative forms of representation .............................................. 46 4.2.1.3.1 SAP SERM ......................................................................... 46 4.2.1.3.2 IE data model .................................................................... 48 4.2.1.3.3 SeDaM model .................................................................... 49
4.2.1.4 Summary of the main terms and forms of representation of the eERM ........................................................................................ 50
4.2.1.5 Document type definition ............................................................ 51 4.2.1.5.1 Element types.................................................................... 51 4.2.1.5.2 Connection types ............................................................... 53 4.2.1.5.3 Attribute types ................................................................... 54
4.2.1.5.3.1 Data type of the attribute value ................................... 55 4.2.1.5.3.2 Attribute default ......................................................... 56
4.2.1.5.4 Testing a DTD .................................................................... 58 4.2.1.6 Material flow modeling - Material diagram ..................................... 59 4.2.1.7 Modeling the Data Warehouse structure ........................................ 60 4.2.1.8 Authorization hierarchy ............................................................... 61 4.2.1.9 Process cost management data models ......................................... 62
4.2.1.9.1 CD diagram ....................................................................... 62 4.2.1.9.2 Cost category diagram ........................................................ 63
4.2.1.10 Project management data model .................................................. 64 4.2.1.10.1 Information carrier diagram................................................. 64
METHOD MANUAL
II
4.2.2 Design specification ............................................................................. 65 4.2.2.1 Relations diagram and Attribute allocation diagram ........................ 65 4.2.2.2 System interface models - System attributes, System attribute
domain ..................................................................................... 68 4.2.3 Implementation - Table diagram ............................................................ 70
4.3 Organization view ........................................................................................ 72 4.3.1 Requirements definition ........................................................................ 72
4.3.1.1 Organizational structure of companies .......................................... 72 4.3.1.2 Organizational chart ................................................................... 75 4.3.1.3 Shift calendar ............................................................................ 80
4.3.2 Design specification - Network topology .................................................. 82 4.3.3 Implementation ................................................................................... 84
4.3.3.1 Network diagram ....................................................................... 84 4.3.3.2 Material flow modeling - Technical resources ................................. 86
4.4 Process view ............................................................................................... 89 4.4.1 Requirements definition ........................................................................ 89
4.4.1.1 Linking functions with organization - EPC, Function/Organizational level diagram ............................................................................ 89
4.4.1.2 Linking functions with data .......................................................... 91 4.4.1.2.1 Event control - Event-driven process chain (EPC) ................... 91 4.4.1.2.2 Function allocation diagram (I/O) ........................................ 102 4.4.1.2.3 Information flow diagrams ................................................. 106 4.4.1.2.4 Event diagram .................................................................. 107
4.4.1.3 Functions - Organization - Data .................................................. 108 4.4.1.3.1 EPC/PCD .......................................................................... 108 4.4.1.3.2 Input/Output diagram ........................................................ 111 4.4.1.3.3 Value-added chain diagram ................................................ 112 4.4.1.3.4 Rule diagram .................................................................... 113 4.4.1.3.5 Communications diagram ................................................... 114 4.4.1.3.6 Classification diagram ........................................................ 114
4.4.1.4 Object-oriented modeling ........................................................... 114 4.4.1.5 Process variants ........................................................................ 115
4.4.1.5.1 Process selection matrix ..................................................... 115 4.4.1.6 Material flow modeling ............................................................... 116
4.4.1.6.1 EPC (material flow) ........................................................... 116 4.4.1.6.2 Material flow diagram ........................................................ 118 4.4.1.6.3 EPC (column/row display) .................................................. 119
4.4.1.7 SAP ALE models ........................................................................ 121 4.4.1.7.1 SAP ALE filter model .......................................................... 121 4.4.1.7.2 SAP ALE message flow model ............................................. 121 4.4.1.7.3 SAP ALE message type model ............................................. 121
4.4.1.8 Role assignment diagram (RAD) ................................................. 122 4.4.1.9 Other models ........................................................................... 123
4.4.1.9.1 Business controls diagram .................................................. 123 4.4.1.9.2 DW transformation ............................................................ 124 4.4.1.9.3 E-Business scenario diagram .............................................. 125 4.4.1.9.4 Structuring model ............................................................. 127 4.4.1.9.5 Industrial process and Office process ................................... 128 4.4.1.9.6 Project process chain (PPC) ................................................ 129 4.4.1.9.7 Process instantiation model ................................................ 131 4.4.1.9.8 RAMS .............................................................................. 133 4.4.1.9.9 Role diagram .................................................................... 135
METHOD MANUAL
III
4.4.1.9.10 Quick model ..................................................................... 136 4.4.1.9.11 c3 method ........................................................................ 137 4.4.1.9.12 Screen design ................................................................... 139 4.4.1.9.13 Screen navigation ............................................................. 140 4.4.1.9.14 Business segment matrix ................................................... 141
4.4.2 Design specification ............................................................................ 143 4.4.2.1 Access diagram ......................................................................... 143
4.4.2.1.1 Linking functions with data ................................................. 143 4.4.2.1.2 Linking organization with data ............................................ 144 4.4.2.1.3 Linking organization with function ....................................... 145
4.4.2.2 Program flow chart .................................................................... 146 4.4.2.3 Program flow chart (PF) ............................................................. 147 4.4.2.4 Screen diagram ........................................................................ 148 4.4.2.5 SAP integration process (XI) ....................................................... 150
4.4.3 Implementation - Access diagram (physical) .......................................... 151 4.4.3.1 Linking functions with data ......................................................... 151 4.4.3.2 Linking organization with data .................................................... 153 4.4.3.3 Linking organization with functions .............................................. 154
4.5 Product/Service modeling ............................................................................ 156 4.5.1 Product/Service exchange diagram ....................................................... 157 4.5.2 Product/Service tree ........................................................................... 158 4.5.3 Product allocation diagram ................................................................... 159 4.5.4 Product tree ....................................................................................... 161 4.5.5 Product selection matrix ...................................................................... 162 4.5.6 Competition model .............................................................................. 163
5 Unified Modeling Language (UML) in ARIS................................................................ 164 5.1 Introduction ............................................................................................... 164 5.2 ARIS UML Designer - Supported UML standard ............................................... 164
6 Object Modeling Technique (OMT) .......................................................................... 165 6.1 Introduction ............................................................................................... 165 6.2 Summary of the OMT methodology ............................................................... 165 6.3 Object modeling techniques in ARIS .............................................................. 166
6.3.1 OMT Object model .............................................................................. 166 6.3.2 OMT Dynamic model ........................................................................... 173 6.3.3 OMT Functional model ......................................................................... 176 6.3.4 How to arrange objects in a hierarchy ................................................... 179
7 Methods for knowledge management ...................................................................... 180 7.1 Introduction ............................................................................................... 180 7.2 Object types for modeling knowledge processing ............................................ 181
7.2.1 Knowledge category ............................................................................ 181 7.2.2 Documented knowledge ....................................................................... 183
7.3 Model types for modeling knowledge processing ............................................. 183 7.3.1 Knowledge structure diagram ............................................................... 183 7.3.2 Knowledge map .................................................................................. 184 7.3.3 Representation of knowledge processing in business processes ................. 186
8 Balanced Scorecard method ................................................................................... 187 8.1 Introduction ............................................................................................... 187 8.2 The Balanced Scorecard concept ................................................................... 187
8.2.1 Key elements of the BSC approach........................................................ 187 8.2.2 Strategic management process and Balanced Scorecard .......................... 188

METHOD MANUAL
IV
8.2.2.1 Formulation and realization of vision and strategy ......................... 189 8.2.2.1.1 Standard perspectives of a Balanced Scorecard ..................... 190 8.2.2.1.2 Cause-and-effect chain ...................................................... 191 8.2.2.1.3 Definition of leading and lagging indicators ........................... 191
8.2.2.2 Communication and derivation of further scorecards ..................... 192 8.2.2.3 Planning and targets ................................................................. 192 8.2.2.4 Strategic learning and feedback .................................................. 193
8.2.3 Advantages and benefits of the Balanced Scorecard ................................ 194 8.3 Developing a Balanced Scorecard with ARIS BSC ............................................ 195
8.3.1 Terms and abbreviations ...................................................................... 195 8.3.2 Creating Balanced Scorecards with ARIS BSC ......................................... 196
8.3.2.1 Specification of perspectives ....................................................... 196 8.3.2.2 Balanced Scorecard system structure specification ........................ 197 8.3.2.3 Cause-and-effect relationship specification ................................... 197 8.3.2.4 Specification of initiatives and KPIs to monitor objectives ............... 200 8.3.2.5 Description of KPIs and their relationships .................................... 203
8.3.3 Relationships to other models ............................................................... 203
9 E-Business scenario diagram .................................................................................. 204 9.1 Introduction ............................................................................................... 204 9.2 E-Business scenario diagram method ............................................................ 206
9.2.1 The idea ............................................................................................ 206 9.2.2 The model and its objects .................................................................... 206 9.2.3 'Transmission type' attribute group ....................................................... 208
9.3 Evaluations using reports ............................................................................. 208 9.3.1 Data security check ............................................................................. 208 9.3.2 System support .................................................................................. 208 9.3.3 Information flow ................................................................................. 209 9.3.4 Collaborative business maps ................................................................ 209
9.4 Connection to other methods and components ............................................... 209
10 IT City Planning .................................................................................................... 213 10.1 Enterprise Architecture and IT City Planning ................................................... 213 10.2 Which companies may benefit from IT City Planning? ...................................... 213 10.3 IT City Planning with ARIS ........................................................................... 214 10.4 Service view .............................................................................................. 216 10.5 Service types and their data ......................................................................... 219 10.6 Detail description of service types ................................................................. 220 10.7 Chronological-logical operational sequences of IS elements .............................. 221 10.8 IT view ...................................................................................................... 222 10.9 IT elements and their data ........................................................................... 223 10.10 Detail description of IT elements................................................................... 223 10.11 Organizational aspects ................................................................................ 224 10.12 Chronological-logical operational sequences of IT elements .............................. 224 10.13 Chronological-logical operational sequences within the architecture .................. 225 10.14 Possible evaluations .................................................................................... 226
11 Business process modeling .................................................................................... 227 11.1 Process classes and the business process diagram .......................................... 227 11.2 Implementation of BPMN in ARIS .................................................................. 229 11.3 Elements of the business process diagram ..................................................... 230
11.3.1 Pools and lanes .................................................................................. 230 11.3.2 Modeling guidelines for pools and lanes ................................................. 231 11.3.3 Sequence flow .................................................................................... 231
METHOD MANUAL
V
11.3.4 Modeling guidelines for sequence flow connections .................................. 232 11.3.5 Message flow...................................................................................... 232 11.3.6 Modeling guidelines for message flow connections .................................. 233 11.3.7 Association ........................................................................................ 233 11.3.8 Events ............................................................................................... 234 11.3.9 Modeling guidelines for events .............................................................. 235 11.3.10 Activities ............................................................................................ 236 11.3.11 Modeling guidelines for activities ........................................................... 237 11.3.12 Gateway ............................................................................................ 238 11.3.13 Modeling guidelines for gateways .......................................................... 239 11.3.14 Artifact .............................................................................................. 241 11.3.15 Sources of figures ............................................................................... 242
12 Modeling BPMN 2.0 ............................................................................................... 243 12.1 Introduction ............................................................................................... 243
12.1.1 Initial situation and objective ............................................................... 243 12.1.2 Purpose of this chapter ........................................................................ 243
12.2 BPMN core elements and their implementation in ARIS .................................... 244 12.2.1 Infrastructure ..................................................................................... 244 12.2.2 Foundation ......................................................................................... 245 12.2.3 Common Elements .............................................................................. 247
12.2.3.1 Artifacts ................................................................................... 247 12.2.3.1.1 Association ....................................................................... 250 12.2.3.1.2 Group .............................................................................. 250 12.2.3.1.3 Text annotation ................................................................ 251
12.2.3.2 Callable Elements ...................................................................... 252 12.2.3.3 Event ...................................................................................... 252 12.2.3.4 Expression ............................................................................... 253 12.2.3.5 Flow Element ............................................................................ 253 12.2.3.6 Flow Elements Container ............................................................ 254 12.2.3.7 Gateways ................................................................................. 255 12.2.3.8 Message .................................................................................. 256 12.2.3.9 Message flow ............................................................................ 257 12.2.3.10 Participant ............................................................................... 260 12.2.3.11 Resource .................................................................................. 263 12.2.3.12 Sequence flow .......................................................................... 263 12.2.3.13 Elements not included in the current implementation ..................... 266
12.3 BPMN diagrams and ARIS model types: An overview ....................................... 267 12.4 Process...................................................................................................... 268
12.4.1 Activities ............................................................................................ 270 12.4.1.1 Resource assignment ................................................................. 272 12.4.1.2 Performer ................................................................................ 272 12.4.1.3 Activity type: Task .................................................................... 272 12.4.1.4 Human interactions ................................................................... 276 12.4.1.5 Activity type: Subprocess ........................................................... 276
12.4.1.5.1 Subprocess type: Subprocess ............................................. 277 12.4.1.5.2 Subprocess type: Event subprocess ..................................... 279 12.4.1.5.3 Subprocess type: Transaction ............................................. 280 12.4.1.5.4 Subprocess type: Ad hoc subprocess ................................... 281
12.4.1.6 Subprocess type: Call Activity ..................................................... 283 12.4.1.7 Global task ............................................................................... 285 12.4.1.8 Loop characteristics ................................................................... 285
12.4.1.8.1 Loop characteristics representations .................................... 285
METHOD MANUAL
VI
12.4.1.8.2 Standard and multi-instance loop characteristics and complex behavior definition ................................................ 287
12.4.2 Items and Data .................................................................................. 290 12.4.2.1 Data object .............................................................................. 290 12.4.2.2 Data store ................................................................................ 292
12.4.3 Events ............................................................................................... 293 12.4.3.1 Catch events and throw events ................................................... 295 12.4.3.2 Start event ............................................................................... 297 12.4.3.3 Intermediate events .................................................................. 298 12.4.3.4 End event ................................................................................ 299 12.4.3.5 Event definitions ....................................................................... 300
12.4.4 Gateways ........................................................................................... 306 12.4.4.1 Exclusive gateway ..................................................................... 307 12.4.4.2 Inclusive gateway ..................................................................... 307 12.4.4.3 Parallel gateway ....................................................................... 308 12.4.4.4 Complex gateway ..................................................................... 308 12.4.4.5 Event-based gateways ............................................................... 309
12.4.5 Lanes ................................................................................................ 310 12.5 Collaboration .............................................................................................. 312
12.5.1 Pool and participant ............................................................................ 313 12.5.2 Object types and connection types reused from a process ........................ 313 12.5.3 Message flow...................................................................................... 314
12.6 Conversation .............................................................................................. 315 12.6.1 Conversation container ........................................................................ 315 12.6.2 Conversation nodes ............................................................................. 316 12.6.3 Participant ......................................................................................... 317 12.6.4 Artifacts ............................................................................................. 317 12.6.5 Conversation link ................................................................................ 317 12.6.6 Message flow in a conversation ............................................................. 318 12.6.7 Model assignments.............................................................................. 318
12.7 Enterprise BPMN collaboration diagram .......................................................... 319
13 Customer Experience Management (CXM)................................................................ 320 13.1 Customer journey landscape ........................................................................ 320 13.2 Customer journey map ................................................................................ 322 13.3 Customer touchpoint allocation diagram ........................................................ 324 13.4 Customer touchpoint map ............................................................................ 325 13.5 Linking CXM and BPM .................................................................................. 326
13.5.1 Analysis capabilities ............................................................................ 327 13.5.1.1 Report ..................................................................................... 327 13.5.1.2 Queries .................................................................................... 328
13.5.1.2.1 Get full customer journey overview ..................................... 328 13.5.1.2.2 Find customer touchpoints clustered by associated risk .......... 330 13.5.1.2.3 Find customer touchpoints clustered by associated ownership
...................................................................................... 330 13.5.1.2.4 Find customer touchpoints clustered by associated channel .... 331 13.5.1.2.5 Find risks and initiatives for all customer touchpoints ............ 332 13.5.1.2.6 Find risks and initiatives for bad customer touchpoints only .... 333 13.5.1.2.7 Find all processes related to customer journeys .................... 334

METHOD MANUAL
VII
14 Use cases ............................................................................................................ 335 14.1 General company documentation .................................................................. 338 14.2 Database management/Data warehousing ..................................................... 339 14.3 PC hardware and network management ......................................................... 340 14.4 Process cost management ........................................................................... 341 14.5 Quality management ................................................................................... 342 14.6 Reorganization measures ............................................................................. 343 14.7 SAP R/3 implementation .............................................................................. 344 14.8 Software development and implementation .................................................... 345 14.9 Knowledge management.............................................................................. 346 14.10 Workflow management ................................................................................ 347
15 Bibliography ......................................................................................................... 348 15.1 General literature list .................................................................................. 348 15.2 Topic-related bibliography ............................................................................ 350
15.2.1 Unified Modeling Language in ARIS ....................................................... 350 15.2.1.1 UML specification ...................................................................... 350 15.2.1.2 Using UML ................................................................................ 350 15.2.1.3 UML and business process modeling ............................................ 350
15.2.2 Object Modeling Technique (OMT) ......................................................... 350 15.2.3 Methods for knowledge management .................................................... 351
15.2.3.1 General knowledge management ................................................ 351 15.2.3.2 Using ARIS for knowledge management ....................................... 351
15.2.4 Balanced Scorecard method ................................................................. 351 15.2.5 IT City Planning .................................................................................. 351 15.2.6 Business process modeling ................................................................... 351
16 Legal information.................................................................................................. 352 16.1 Documentation scope .................................................................................. 352 16.2 Data protection .......................................................................................... 353 16.3 Disclaimer.................................................................................................. 353
17 Index ...................................................................................................................... i
METHOD MANUAL
I
List of figures Figure 1: Business process model 4
Figure 2: Process model views 5
Figure 3: Views of a process model 6
Figure 4: Descriptions of an information system 8
Figure 5: ARIS concept 9
Figure 6: Example of a process chain diagram 12
Figure 7: Representation of the 'Verify customer inquiry' function 14
Figure 8: Function tree (extract) 15
Figure 9: Object-oriented function tree 16
Figure 10: Process-oriented function tree 17
Figure 11: Execution-oriented function tree 18
Figure 12: Y diagram 20
Figure 13: SAP® applications diagram 21
Figure 14: Objective diagram 22
Figure 15: Graphical representation of an application system type 23
Figure 16: Modular structure of an application system type 24
Figure 17: Graphical representation of an IT function type 24
Figure 18: Allocation of functions to application system types 25
Figure 19: Application system type configuration 25
Figure 20: Screen and list assignments 26
Figure 21: Graphical representation of the application system and the module 27
Figure 22: Assignment of application systems to their application system types 27
Figure 23: Different modular structure of two application systems of the same type 28
Figure 24: Assignment of application system types, program module types, and program modules 28
Figure 25: Examples of entity types 31
Figure 26: Examples of attributes of the 'Customer' entity type 31
Figure 27: Example of a relationship type 32
Figure 28: Cardinalities of relationships between two entity types 33
Figure 29: Representation of cardinalities in the ERM 33
Figure 30: ERM for a bill of materials 34
Figure 31: Assignment of attributes in the ERM 34
Figure 32: Classification of customers 35
Figure 33: Generalization/Specialization 36
Figure 34: Complete specialization 36
Figure 35: Example of an aggregation 37
METHOD MANUAL
II
Figure 36: Aggregation with reinterpreted relationship types 38
Figure 37: Data cluster (graphic symbol) 38
Figure 38: Data cluster view of multiple objects 39
Figure 39: Grouping 39
Figure 40: Upper/Lower limit (1) 40
Figure 41: Upper/Lower limit (2) 40
Figure 42: Upper/Lower limit (3) 40
Figure 43: Upper/Lower limit (4) 41
Figure 44: Existence dependency 42
Figure 45: Technical terms (1) 43
Figure 46: Technical terms (2) 43
Figure 47: Allocation of ERM attributes to an entity type 45
Figure 48: Representation of an attribute type group 45
Figure 49: eERM and SAP® ERM representation 47
Figure 50: Data model in IE notation 48
Figure 51: Data model in SeDaM notation 49
Figure 52: eERM: Terms and forms of representation 50
Figure 53: DTD element type with pure text contents 51
Figure 54: Element types with mixed contents and conversion in the DTD 52
Figure 55: Element type with enumeration attribute type 56
Figure 56: Example of a material diagram 59
Figure 57: Data Warehouse in the star schema 60
Figure 58: Authorization hierarchy 61
Figure 59: Example of a CD diagram 62
Figure 60: Example of a cost category diagram 63
Figure 61: Information carrier diagram 64
Figure 62: Graphical representation of the relation 65
Figure 63: Allocation of the requirements definition attributes and data objects 66
Figure 64: Attribute allocation diagram 66
Figure 65: Definition of a view 67
Figure 66: Allocation of ERM relationship type to attribute 67
Figure 67: Example of a 'System attributes' model 68
Figure 68: System attribute domain 69
Figure 69: Graphical representation of table and field 70
Figure 70: Field allocations 70
Figure 71: Allocation of requirements definition and design specification objects 71
Figure 72: Table specimens 71

METHOD MANUAL
III
Figure 73: Organizational breakdown by product 73
Figure 74: Hybrid organizational forms 73
Figure 75: Organizational chart 75
Figure 76: Organizational chart with position and person assignment 76
Figure 77: Person types 77
Figure 78: Location assignments 78
Figure 79: Location hierarchies 79
Figure 80: Example of a shift calendar 81
Figure 81: Graphical representation of a network type 82
Figure 82: Network topology 83
Figure 83: Network diagram with location assignment 84
Figure 84: Network diagram with hardware components and location assignment 85
Figure 85: Example of a 'Technical resources' model 88
Figure 86: Allocation of organizational elements to functions 90
Figure 87: Events (graphical representation) 91
Figure 88: Example of an EPC 92
Figure 89: Examples of rules 92
Figure 90: Logic operators (rules) 94
Figure 91: AND operator for triggering events 95
Figure 92: OR operator for triggering events 95
Figure 93: XOR operator for triggering events 96
Figure 94: AND operator for created events 97
Figure 95: OR operator for created events 97
Figure 96: XOR operator for created events 98
Figure 97: AND operator of functions with created events 99
Figure 98: OR operator of functions with created events 99
Figure 99: XOR operator of functions with created events 100
Figure 100: AND operator of functions with triggering events 101
Figure 101: Example of a function allocation diagram (I/O) 102
Figure 102: Detailed representation of the function allocation diagram 103
Figure 103: EPC with input/output data 104
Figure 104: EPC with input/output data 105
Figure 105: Information flow diagram with open Assignment Wizard 106
Figure 106: Example of an event diagram 107
Figure 107: Example of a process chain (requirements definition) 109
Figure 108: EPC with functions, data, organizational units, and events 110
Figure 109: Input/Output diagram 111

METHOD MANUAL
IV
Figure 110: Value-added chain 112
Figure 111: Illustration of complex operators in the rule diagram 113
Figure 112: Process selection matrix (extract from the SAP AG R/3 reference model) 115
Figure 113: Extract from an EPC (material flow) 117
Figure 114: EPC (column display) 119
Figure 115: Role assignment diagram (RAD) 122
Figure 116: Example of a business controls diagram 123
Figure 117: DW transformation - Data transformation of a Data Warehouse 124
Figure 118: Example of an e-business scenario diagram for the motor industry 126
Figure 119: Example of a structuring model (extract from VDA 6.2 standard) 127
Figure 120: Example of facts in EPC, Industrial process, and Office process model types 128
Figure 121: Example of a PPC created from an EPC 130
Figure 122: Process instantiation model 132
Figure 123: Example of a RAMS diagram 133
Figure 124: Role diagram 135
Figure 125: Structure of a c3 model 137
Figure 126: Example of a screen design for a registration dialog and implementation in C++ 139
Figure 127: Example of screen navigation with events 140
Figure 128: Example of a business segment matrix 141
Figure 129: Report 142
Figure 130: Information flow between application system types 143
Figure 131: I/O data at the design specification level 143
Figure 132: Access privileges 144
Figure 133: Definition of responsibilities 144
Figure 134: Access diagram (excerpt) 146
Figure 135: Example of a program flow chart (PF) 147
Figure 136: Example of a screen diagram 148
Figure 137: Screen derived from the screen diagram of the previous figure 149
Figure 138: Data flow 151
Figure 139: Input/Output relationships 152
Figure 140: Assignments to hardware component 153
Figure 141: Hardware component as platform 154
Figure 142: Users and application systems 154
Figure 143: Location assignments 155
Figure 144: Example of product/service exchange in a software company 157
Figure 145: Product/Service tree 158
METHOD MANUAL
V
Figure 146: Example of a product allocation diagram 159
Figure 147: Product allocation diagram - Checking account 160
Figure 148: Product allocation diagrams - Sales products 160
Figure 149: Classification of the 'Resident and citizenship affairs' product group using a product tree 161
Figure 150: Product selection matrix of the social welfare office 162
Figure 151: Competition in the sports car market 163
Figure 152: Representation of instances 166
Figure 153: Representation of classes 166
Figure 154: Connections between instances and classes 166
Figure 155: Assignment of attributes to classes 167
Figure 156: Assignment of operations to classes 167
Figure 157: Associations between instances 167
Figure 158: Associations between classes 168
Figure 159: Ternary relationship between classes 168
Figure 160: Modeling an association as a class 169
Figure 161: Representation of qualified associations 169
Figure 162: Representation of orders for associations 170
Figure 163: Aggregation between classes 170
Figure 164: Representation of the generalization/specialization relationship between classes 171
Figure 165: Representation of attribute constraints 172
Figure 166: Representation of association constraints 172
Figure 167: Example of an OMT Object model 173
Figure 168: Representation of initial states, final states, and transitions 173
Figure 169: Representation of the transition between states 174
Figure 170: Representation of additional transition information 174
Figure 171: Example of an OMT Dynamic model 175
Figure 172: Representation of data stores 176
Figure 173: Representation of processes 176
Figure 174: Representation of actors 176
Figure 175: Representation of data flows 176
Figure 176: Representation of data flow splitting 177
Figure 177: Example of an OMT Functional model 178
Figure 178: Knowledge structure diagram 183
Figure 179: Knowledge map - Relating to organizational units 184
Figure 180: Knowledge map - Matrix representation 185

METHOD MANUAL
VI
Figure 181: Knowledge processing in an EPC 186
Figure 182: BSC as a structure for strategic management 188
Figure 183: Perspectives of BSC 190
Figure 184: BSC Cause-and-effect diagram 198
Figure 185: BSC KPI allocation diagram 200
Figure 186: KPI tree 203
Figure 187: Transaction options in e-business 205
Figure 188: Objects in the e-business scenario diagram 207
Figure 189: Excerpt from the 'Online shop' e-business scenario 210
Figure 190: Excerpt from the pipeline diagram 211
Figure 191: Excerpt from the DTD: Order 212
Figure 192: Process view, IS view, IT view 215
Figure 193: Zones of a company's information system 216
Figure 194: Zone divided into districts 217
Figure 195: District divided into building clusters 217
Figure 196: 'Human resources support' building cluster divided into functional blocks 218
Figure 197: Capabilities and IS services of the 'Salaries' functional block 218
Figure 198: 'is owner of' connection between symbols of the IS view and relationship and entity types 219
Figure 199: 'supports' connection between IS elements and functions 220
Figure 200: Subsystem structure of the DATEV system 223
Figure 201: Detailed description of IT elements in the access diagram 223
Figure 202: Influences and effects of the technical infrastructure 224
Figure 203: Integration of IS and IT elements into a chronological-logical operational sequence 225
Figure 204: Two pools with sequence and message flow 229
Figure 205: Pool with two lanes according to BPMN 230
Figure 206: Sequence flow connection 231
Figure 207: Message flow connection 232
Figure 208: Association connections 233
Figure 209: Event categories 234
Figure 210: Examples of event types 234
Figure 211: Activities according to BPMN 236
Figure 212: Assigned function as activity in ARIS 236
Figure 213: Gateway types 238
Figure 214: E-mail voting process 241
Figure 215: Structuring model: Categories and their values 250

METHOD MANUAL
VII
Figure 216: Group symbol 250
Figure 217: Symbol representing text annotations 251
Figure 218: Message symbol 256
Figure 219: Message flow between participants/pools 257
Figure 220: BPMN allocation diagram (BPMN 2.0): Participant and partner entity/partner role 260
Figure 221: Symbols representing activities in the Symbols bar 270
Figure 222: Task symbols 272
Figure 223: Symbols of a standard subprocess 277
Figure 224: Symbols of an event subprocess 279
Figure 225: Symbol for a collapsed transaction 280
Figure 226: Symbol for a collapsed and expanded Ad hoc subprocess 281
Figure 227: Symbols of Standard loop activities 285
Figure 228: Symbols of BPMN multi-instance (parallel) activities 285
Figure 229: Symbols for activities of the BPMN multi-instance (parallel) 286
Figure 230: Symbols of data objects 290
Figure 231: Symbol for a data store 292
Figure 232: BPMN gateway types 306
Figure 233: Nested Lanes 310
Figure 234: Symbols of Conversation nodes 316
Figure 235: Conversation link with Participant multiplicity 317
Figure 236: Message flow between Participants in a BPMN conversation diagram (BPMN 2.0) 318
Figure 237: Customer journey landscape 320
Figure 238: Customer journey map 322
Figure 239: CXM symbols 323
Figure 240: Customer touchpoint allocation diagram 324
Figure 241: Customer touchpoint map 325
Figure 242: Linking CXM and BPM 326
Figure 243: CXM infographic 327
Figure 244: Customer journey overview 328
Figure 245: Full overview – Customer journey table 329
Figure 246: Customer touchpoints by risk (query) 330
Figure 247: Risks and initiatives for all customer touchpoints (query) 330
Figure 248: Find customer touchpoints clustered by associated channel (query) 331
Figure 249: Risks and initiatives for all customer touchpoints (query) 332
Figure 250: Risks and initiatives for bad customer touchpoints (query) 333

METHOD MANUAL
VIII
Figure 251: Find all processes related to customer journeys 334

METHOD MANUAL
1
1 Introduction Due to increasing hardware standardization and a dramatic drop in hardware prices the focus of information system development tasks has changed considerably.
In the past, system design and system integration had the greatest potential for optimization. In recent years, however, the focus has shifted more and more towards creating solutions for the special demands of individual sectors. The fact that decentralized information systems became available and that it was possible to incorporate them into integrated information system infrastructures created new cost saving potential regarding the organizational design of companies.
Organizational structures were formerly broken down functionally and established centrally because they were mostly based on centralized host environments with only limited capabilities. As a consequence, companies suffered a loss of flexibility. In the beginning, few people realized or paid attention to the new prospects resulting from the increase in decentralization of computer services and parallel development of new information system architecture concepts (for example, client/server, workflow management).
Today, steadily intensifying competition has turned this potential into the number one topic for every single company. Flexible structures that persistently focus on internal business processes are becoming the decisive competition factor for companies. However, only a holistic view of all business processes enables a company to recognize, streamline, and support interconnected processes through optimized information system infrastructures. Compared with the management of centralized business environments, the management of these new structures is significantly more complex. Facing this challenge requires unequivocal assignment of responsibilities, maximum transparency of structures, homogeneous communication throughout all company levels, and streamlined project management based on defined business objectives.
Enterprise modeling methods assist business managers in accomplishing these complex tasks. Enterprise models are a crucial prerequisite for analyzing business processes, bringing projects in line with the overall business objectives, and using information system infrastructures in the form of composite distributed and integrated systems to optimally support these lean organizational structures.
Thus, modeling the company's actual situation - and, in doing so, examining holistic business processes - is becoming more and more the focus of the discussion. The diversity and increasing multitude of modeling methods used to result in complexity and confusion. Consequently, efforts were made to define standardized framework concepts (architectures) for development and modeling methods.
One of these architectures is the Architecture of Integrated Information Systems (ARIS©) developed by Scheer (see Scheer, Architecture of Integrated Information Systems, 1992). This architecture concept enables methods to be evaluated and organized by focusing on their main points, and it serves as an orientation framework for complex development projects because due to its structural elements, it contains an implicit procedure model for developing integrated information systems.

METHOD MANUAL
2
An architecture of this kind naturally leads towards standardization in the use of methods. Based on this architecture, existing and new modeling methods were combined to create a holistic method for modeling business processes.
In addition, the ARIS architecture integrates products such as ARIS Architect within the product range of Software AG. These products support consultants and companies in creating, analyzing, and evaluating business processes in terms of business process reengineering. Convenient recording and modeling of the relevant business processes in the operating departments is enabled by ARIS Designer.
This manual gives a first introduction to the relevant modeling methods. In addition, approaches and methods are presented that make use of the full range of ARIS products including the system add-ons they offer. This manual also provides excellent support for users who deal with modeling methods without the intention of considering questions or problems regarding the use of tools.
METHOD MANUAL
3
2 Architecture of Integrated Information Systems (ARIS)
2.1 ARIS architecture concept The ARchitecture of integrated Information Systems (ARIS) is based on an integration concept derived from a holistic view of business processes. The first step in creating the architecture is to develop a business process model containing all basic features for describing business processes. The result is a highly complex model, which is broken down into individual views so that its complexity is reduced. Due to this breakdown, it is possible to describe the content of individual views by special methods suitable for a specific view without having to pay attention to the numerous view interrelationships. The relationships between the views are incorporated in a final step and combined to form an overall overview of process chains without any redundancies.
A second approach that also reduces complexity is a differentiation via descriptions. Following the lifecycle concept, the various description methods for information systems are classified based on their proximity to information technology. This ensures a consistent description, from business management problems through to technical implementation.
Thus, the ARIS concept is a framework for developing and optimizing integrated information systems and for describing their implementation. As the emphasis lies on the technical descriptive level, the ARIS concept serves as a model for creating, analyzing, and evaluating business management process chains. Scheer describes the Architecture of integrated Information Systems in more detail (see Scheer, Architecture of Integrated Information Systems, 1992, and Scheer, ARIS - Business Process Frameworks, 1998).
2.2 Descriptive views The focus of this approach is on a business process, like the one shown in the following figure.
The process is triggered by the Customer order received event. In turn, this event activates the Accept customer order function (procedure). For this procedure to be performed, the current state of the relevant process environment must first be described. In particular, this includes data relating to customers and items. The state of associated objects may change during workflow processing, for example, when the items' inventory data is updated with the new reservation data.
The procedures are performed by sales employees who can be assigned to departments. Departments use specific information technology resources (personal computers, printers, etc.) to perform their tasks.

METHOD MANUAL
4
Once the Accept customer order procedure is completed, the Order is confirmed event occurs that in turn may trigger other procedures, such as Track order or Create production plan. The Order object is now in a new state because the Order received object has become an Order confirmed object. Carrying out the Accept customer order function has generated a product/service that is used - in combination with human and technical resources - as an input for processing subsequent procedures.
Figure 1: Business process model
The components required to provide a full description of a business process include procedures, events, products/services (states), users, organizational units, and information technology resources. Covering all effects on all elements of every procedure under consideration would result in a rather complex model and lead to redundancies in the description.

METHOD MANUAL
5
To reduce complexity, the general context is broken down into individual views (see the following figure) that represent specific modeling and design aspects (see Scheer, Architecture of Integrated Information Systems, 1992, p. 13 et sqq.). These can be processed independently. The views are broken down in such a way that relationships between the components are rather numerous within a single view, while there are only relatively few relationships between the various views.
Figure 2: Process model views
Events, such as Customer order received or Invoice created, represent the fact that the state of information objects (data) changes. Events are described in the data view of the ARIS architecture.
The states that exist in the objects' environment, for example, within the scope of the customer order, are represented by products/services. The term product/service refers to the supply of either goods or services. Services that create and provide information are information services. Products/Services also include the provision of financial resources. Relationships between products/services are described in the ARIS architecture's Product/Service view.
The functions to be carried out (procedures) and their interrelationships form a second view, the Function view. It contains the description of the function, an enumeration of individual subfunctions that are part of the overall context, and the relationships that exist between the functions.
The Organization view subsumes users and organizational units, as well as their relationships and structures.
Information technology resources constitute the fourth area of consideration, the so-called Resource view. However, this view is significant for the technical consideration of business processes only insofar as it provides general conditions for describing other components that are more directly geared toward business management. For this reason, the components of the other

METHOD MANUAL
6
views (Data, Function, and Organization view) are described in terms of their proximity to the information technology resources. Thus, resources are dealt with at the design specification and implementation level of the other views (see chapter Descriptive levels (page 7)). The lifecycle model that is defined as a result of the descriptive level approach replaces the resource view as an independent object of consideration.
While breaking down the process into individual views reduces complexity, the process component relationships across the views are lost. For this reason, the Control view is provided as an additional view for describing the relationships between views. Combining these relationships in a separate view allows for systematic and redundancy-free recording of all relationships.
The control view is an essential component of ARIS. It is the fundamental feature that distinguishes the ARIS concept from other architecture approaches (for comparison with other architecture approaches see Scheer, Architecture of Integrated Information Systems, p. 24 et sqq.).
Thus, there is a total of five ARIS views, which form the basis of the following method descriptions.
Figure 3: Views of a process model

METHOD MANUAL
7
2.3 Descriptive levels As mentioned earlier, the ARIS resource view is replaced by a lifecycle concept of an information system's descriptions.
Lifecycle models in the form of level or phase concepts describe the lifecycle of information systems. However, the ARIS lifecycle model is not to be understood as a procedure model for developing an information system. It rather serves to define the various descriptions that differ in their proximity to information technology.
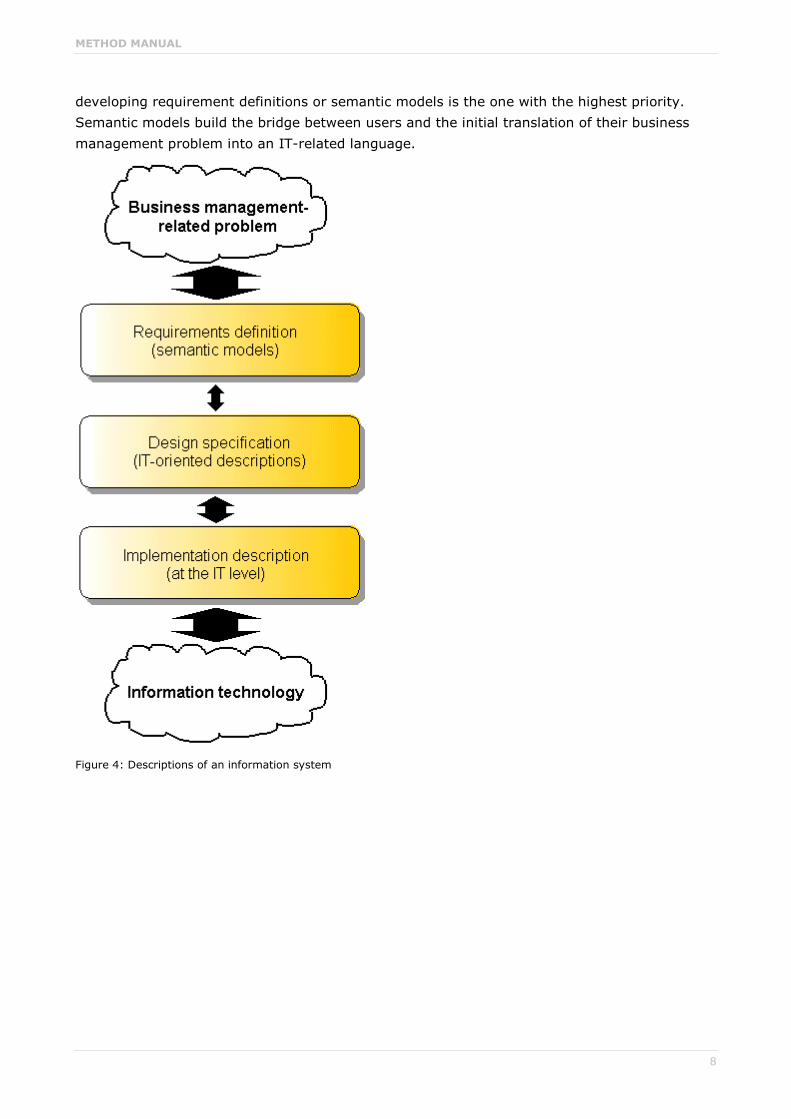
ARIS uses the three-tier division shown in the following figure (see Scheer, Architecture of Integrated Information Systems, 1992, p. 16 et sqq.).
The focus of this approach is on the business management problem. The description lists rough facts that focus very closely on technical objectives and technical language. The options that information technology provides for supporting business management processes and decisions are also included. Therefore, only semi-formal description methods are used for representation purposes. Because of their lack of detail and their highly technical vocabulary, these description methods cannot serve as a starting point for a formalized implementation.
Thus, a Requirements definition has a rather formalized description language to describe the business management approach to be supported, so that it can be used as the basis for consistent transformation into information technology. This procedure is also referred to as (semantic) modeling. The requirements definition is closely associated with the business management problem, as indicated by the width of the arrow in the following figure.
Applying the requirements definition's concept to the design of IT systems leads to the Design specification level. Here, the modules or transactions that carry out technical functions are defined, not the functions themselves. At this level, the requirements definition is aligned with general concepts used in information technology. However, the requirements definition and the design specification are only loosely coupled. This means that a design specification can be changed without affecting the requirements definition. However, this does not imply that requirement definitions and design specifications can be developed separately from each other. In fact, once a requirements definition is complete, the business management-related topics should be specified in such a way that purely IT-specific considerations, such as the information system performance, do not have any impact on the technical content.
At the Implementation level, the design specification is transformed into functional hardware and software components. This establishes the link to information technology.
The descriptions have individual update cycles. The update frequency is lowest at the requirements definition level and highest at the implementation level.
The implementation level is closely coupled with information technology development and is subject to continuous change as a result of rapid innovation cycles in information technology.
The requirements definition level is of particular importance because it serves as a repository for the long-term business management approach and, at the same time, is the starting point for further steps towards technical implementation. Requirement definitions have the longest lifecycle and – due to their close proximity to the business management problem – also document the technical benefits of the information system. For this reason, the view that deals with
METHOD MANUAL
8
developing requirement definitions or semantic models is the one with the highest priority. Semantic models build the bridge between users and the initial translation of their business management problem into an IT-related language.
Figure 4: Descriptions of an information system
METHOD MANUAL
9
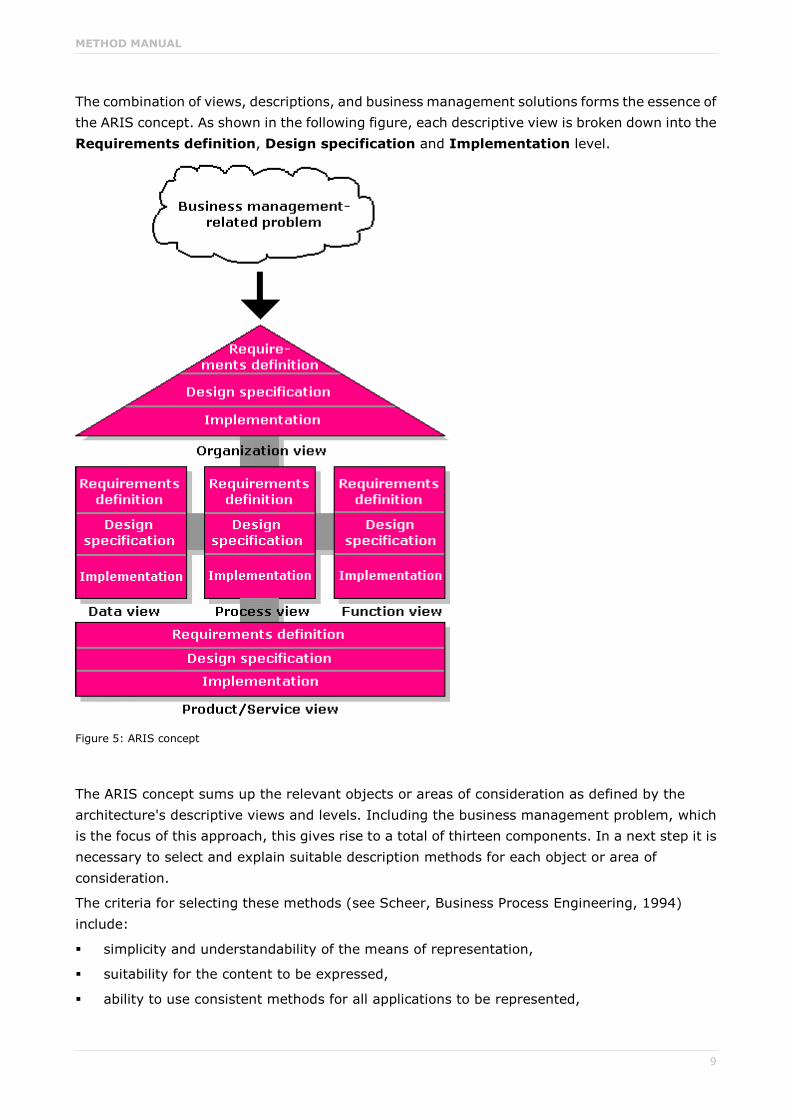
The combination of views, descriptions, and business management solutions forms the essence of the ARIS concept. As shown in the following figure, each descriptive view is broken down into the Requirements definition, Design specification and Implementation level.
Figure 5: ARIS concept
The ARIS concept sums up the relevant objects or areas of consideration as defined by the architecture's descriptive views and levels. Including the business management problem, which is the focus of this approach, this gives rise to a total of thirteen components. In a next step it is necessary to select and explain suitable description methods for each object or area of consideration.
The criteria for selecting these methods (see Scheer, Business Process Engineering, 1994) include:
simplicity and understandability of the means of representation,
suitability for the content to be expressed,
ability to use consistent methods for all applications to be represented,

METHOD MANUAL
10
existing or expected level of familiarity with the methods, and
independence of the methods from technical developments in information technology.
Individual methods applied to the objects or areas of consideration are described in the following chapters.
METHOD MANUAL
11
3 Process chain analysis
3.1 Description of the business management problem Individual objects or areas of consideration are modeled within the ARIS architecture (views and levels) based on the initial business situation, that is, the business management problem. The description mentions the weak points that information systems currently used do have in terms of the support they provide for existing business processes and also includes the main content of the target concept for the system to be developed. The target concept in turn reflects the objectives pursued by using new information systems.
Thus, the model used for describing the business management problem must have the ability of recording as many facts as possible from the data, function, and organization views, including their interrelationships. Moreover, the model must allow for the target concept to be specified to such an extent that this specification can serve as a starting point for the remaining steps of the modeling process. It is only at the stage of creating the requirements definition that the business problem is broken down into the views stipulated by the ARIS concept.
Due to the claim that the initial business management situation be described coherently and that the weak points of existing information systems be displayed concisely, the use of common modeling methods is restricted. Given their focus of representation, the common modeling methods are appropriate only when it comes to modeling individual views.
Using process chain diagrams (PCDs) is a good means of concisely describing the business problem and, at the same time, providing an overview of the information system under consideration (see Scheer, 'EDV-orientierte Betriebswirtschaftslehre' [EDP-oriented business management], 1990, p.39 et sqq.).

METHOD MANUAL
12
3.2 Process chain diagram (PCD) A process chain diagram represents a closed process chain. All views of a business process (organization view, data view, function view, resource view) are expressed with their relationships in a coherent form.
The following figure shows an example of the process chain for Order processing.
Figure 6: Example of a process chain diagram
The two columns on the left represent the chronological-logical operational sequence of the business process under consideration. Individual functions of the procedure are listed in the second column and linked to the events by which they are triggered and which they generate. The connections between functions and events define exactly which events trigger functions and which events are generated by functions and thus regulate the control flow between functions. In the example given, the Order received event triggers the Enter order function. The result of this function is defined by the Order entered end event. This event triggers the next function, called Process order. This way of connecting events and functions produces a chronological-logical operational sequence of functions, a so-called process chain. Logical dependencies of possible branches and loops in the control flow can be expressed by means of rules.
Input and output data required by the functions are represented in the form of Cluster/Data models in the next column. The Process order function requires Order data and Customer master data as the input data and creates the customer order as the output data. The representation can be restricted to information objects, or may also include the information carriers (media) containing the information. An information carrier can be a document, list, handwritten receipt, or storage medium, such as a hard disk.
METHOD MANUAL
13
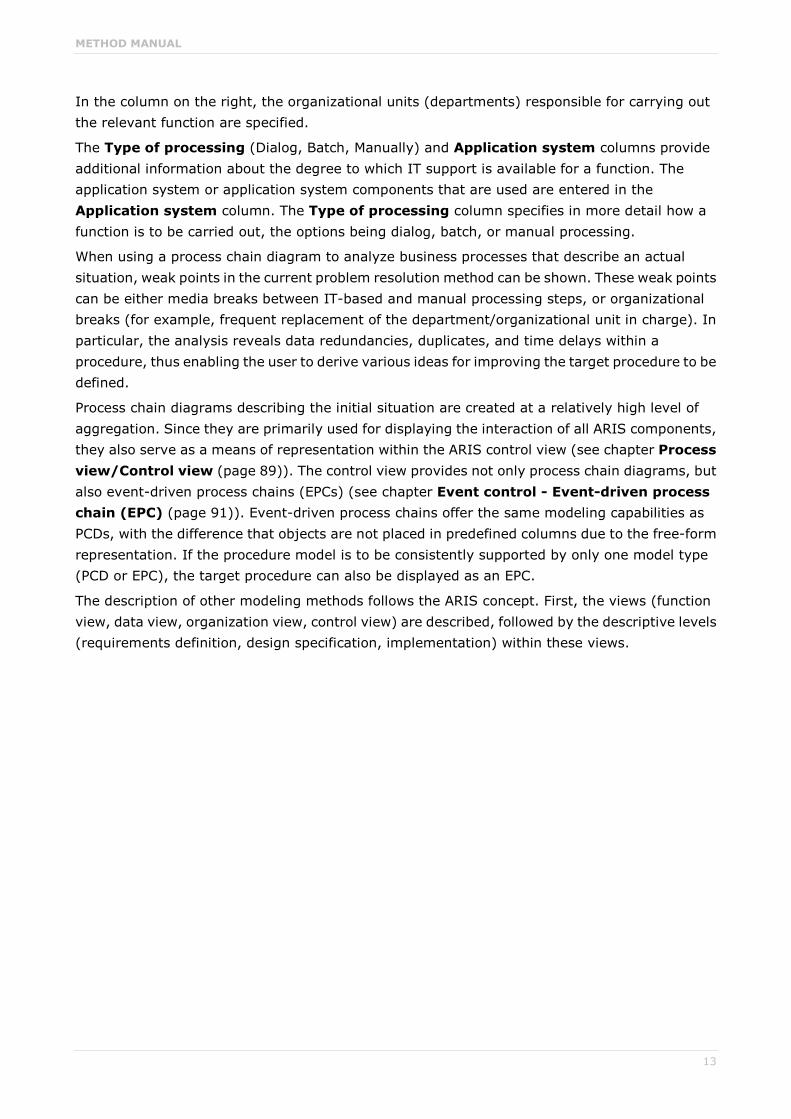
In the column on the right, the organizational units (departments) responsible for carrying out the relevant function are specified.
The Type of processing (Dialog, Batch, Manually) and Application system columns provide additional information about the degree to which IT support is available for a function. The application system or application system components that are used are entered in the Application system column. The Type of processing column specifies in more detail how a function is to be carried out, the options being dialog, batch, or manual processing.
When using a process chain diagram to analyze business processes that describe an actual situation, weak points in the current problem resolution method can be shown. These weak points can be either media breaks between IT-based and manual processing steps, or organizational breaks (for example, frequent replacement of the department/organizational unit in charge). In particular, the analysis reveals data redundancies, duplicates, and time delays within a procedure, thus enabling the user to derive various ideas for improving the target procedure to be defined.
Process chain diagrams describing the initial situation are created at a relatively high level of aggregation. Since they are primarily used for displaying the interaction of all ARIS components, they also serve as a means of representation within the ARIS control view (see chapter Process view/Control view (page 89)). The control view provides not only process chain diagrams, but also event-driven process chains (EPCs) (see chapter Event control - Event-driven process chain (EPC) (page 91)). Event-driven process chains offer the same modeling capabilities as PCDs, with the difference that objects are not placed in predefined columns due to the free-form representation. If the procedure model is to be consistently supported by only one model type (PCD or EPC), the target procedure can also be displayed as an EPC.
The description of other modeling methods follows the ARIS concept. First, the views (function view, data view, organization view, control view) are described, followed by the descriptive levels (requirements definition, design specification, implementation) within these views.

METHOD MANUAL
14
4 Modeling within the views and levels of the ARIS concept
4.1 Function view
4.1.1 Requirements definition Modeling methods often look at functions in the context of objects from other descriptive views of ARIS. For example, the relationship between data and functions is displayed to illustrate how the input/output data affect the process of transforming a function.
In contrast, the ARIS architecture strictly separates the various areas of consideration (see Scheer, Architecture of Integrated Information Systems, 1992, p. 62). Consequently, the function view covers only those means of representation that show the interconnections between functions. Relationships between functions and data are displayed in the ARIS process view.
A function is a technical task or activity performed for an object to support one or more business objectives (see Scheer, Architecture of Integrated Information Systems, 1992, p. 63).
Functions are displayed as rectangles with rounded corners:
Figure 7: Representation of the 'Verify customer inquiry' function
Usually, the criterion for establishing such a function is an information object, such as a customer inquiry or a production order. This should also be expressed in the function name. This is shown in the above figure. Customer inquiry defines the object while Check indicates the operation that is performed for this object. At a higher level, however, mostly a noun is used as the function name (for example, Procurement logistics, Production, Sales).
METHOD MANUAL
15
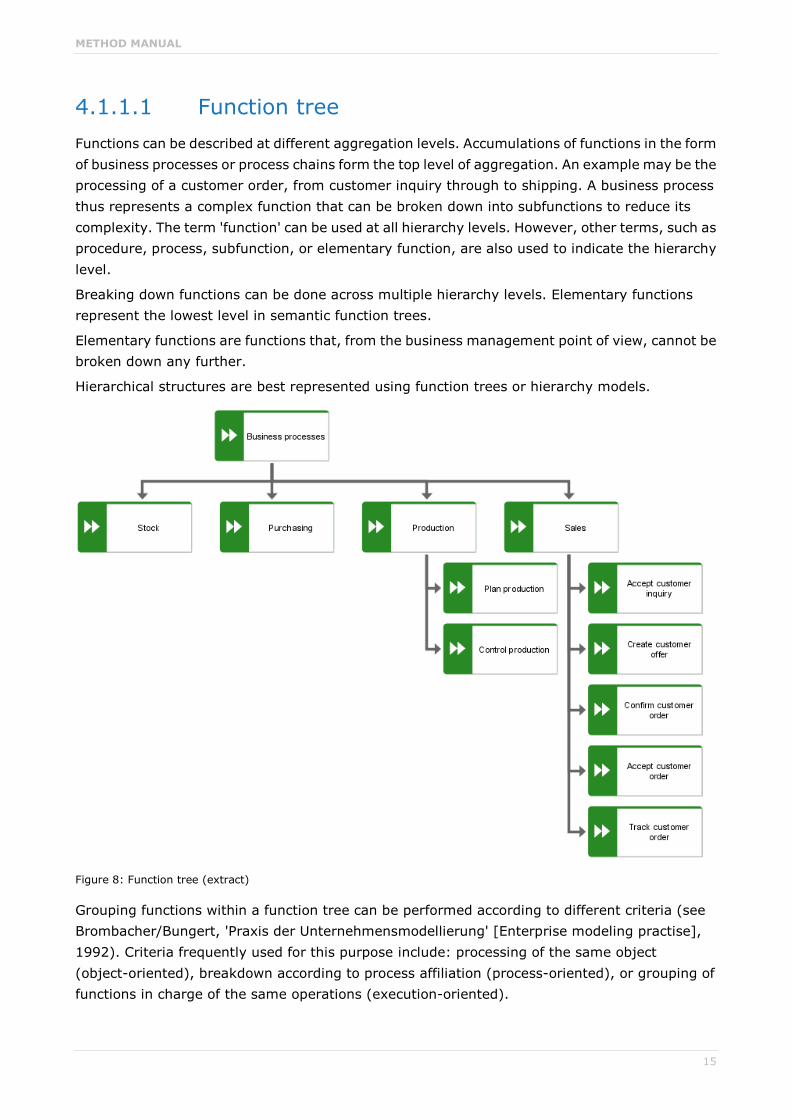
4.1.1.1 Function tree Functions can be described at different aggregation levels. Accumulations of functions in the form of business processes or process chains form the top level of aggregation. An example may be the processing of a customer order, from customer inquiry through to shipping. A business process thus represents a complex function that can be broken down into subfunctions to reduce its complexity. The term 'function' can be used at all hierarchy levels. However, other terms, such as procedure, process, subfunction, or elementary function, are also used to indicate the hierarchy level.
Breaking down functions can be done across multiple hierarchy levels. Elementary functions represent the lowest level in semantic function trees.
Elementary functions are functions that, from the business management point of view, cannot be broken down any further.
Hierarchical structures are best represented using function trees or hierarchy models.
Figure 8: Function tree (extract)
Grouping functions within a function tree can be performed according to different criteria (see Brombacher/Bungert, 'Praxis der Unternehmensmodellierung' [Enterprise modeling practise], 1992). Criteria frequently used for this purpose include: processing of the same object (object-oriented), breakdown according to process affiliation (process-oriented), or grouping of functions in charge of the same operations (execution-oriented).

METHOD MANUAL
16
The next figure shows an example of an object-oriented breakdown. The superior Process production order function is subdivided into the functions Create production order, Confirm production order, Update production order, Cancel production order, Release production order and Monitor production order. These functions describe different operations (create, update, cancel, etc.) that are performed for one and the same object, which is Production order.
Figure 9: Object-oriented function tree
A process-oriented representation is recommended for function trees that represent the results of business process modeling. The following figure shows an example of process-oriented function breakdown.

METHOD MANUAL
17
The functions Accept customer order, Check customer order, Create customer data, Check customer creditworthiness, Check product availability, and Confirm customer order are part of the Process customer order business process. Unlike the object-oriented breakdown, the operations here are performed for different objects (customer order, product availability, etc.).
Figure 10: Process-oriented function tree

METHOD MANUAL
18
Execution-oriented grouping means that all functions performing the same operation (check, create, delete) for different information objects are grouped together. An example of the Change operation is shown in the following figure. The functions shown may occur in different processes and are involved in processing different objects. However, the type of operation they perform for the various objects is always the same.
Figure 11: Execution-oriented function tree
Representing functions in a function tree reduces complexity, but the representation is static. Besides the static representation, the chronological sequence of functions may also be of interest. Chronological-logical operational sequences are represented in so-called event-driven process chains (EPCs). These contain not only functions, but also events linking the functions. Events belong to the data view in ARIS. In line with the principle of separation of views stipulated by ARIS (see chapter Requirements definition (page 14)), event-driven process chains are described in the ARIS control view.

METHOD MANUAL
19
Describing functions from a requirements definition-related point of view involves not only the principle of breaking down functions into subfunctions, but also other function properties, especially those that can influence the design of business processes.
For example, it is recommended that functions always include information on whether or not user intervention is required for carrying out the function. Functions of similar type that can be carried out automatically may be bundled and processed in a batch run.
Information on the quantity structure of a function (for example, number of inquiries processed in a day) and on the total amount of time it takes to carry out the function provide further data that can serve as a basis for decision-making with regard to the redesign of business processes. The total amount of time can be further divided into individual units of time (orientation time, processing time, wait time). In ARIS, this information can be saved in the attributes of the Function object type. A list of all attribute types that are available is provided in the ARIS Method Reference manual (ARIS Method Reference.pdf) on your installation media.

METHOD MANUAL
20
4.1.1.2 Y diagram The Y diagram is used to represent the functions (tasks) of a company at a highly aggregated level. It includes comprehensive functional areas, such as product design, materials management, and maintenance. The structured representation in the form of the Y-CIM model (see Scheer, A.-W.: Business Process Engineering, 1994) shows a classification of individual functions. Scheer places the business management planning functions of production planning and production control in the left branch of the Y, while the right branch contains the technically oriented functions of product planning and product implementation. Planning functions are arranged in the upper sections of the Y, while control and implementation functions are located in its lower sections.
Thus, the Y-CIM model represents a framework for sorting all functions of a production company.
In ARIS, this model type can be used for a function-oriented approach to complex reference models. The objects shown are of the Function object type. When arranged in a hierarchy, this object type can be linked with the Function tree and EPC model types, for example.
An example is shown in the following figure.
Figure 12: Y diagram

METHOD MANUAL
21
4.1.1.3 SAP applications diagram The SAP® applications diagram offers an approach to the SAP® R/3 reference model with the focus on SAP® R/3 application system modules. In the R/3 reference model, a process selection matrix is assigned to every object of this model type. This matrix displays the main processes that are available in the relevant R/3 modules, as well as the process scenarios that can thus be illustrated.
The SAP® applications diagram provided by the SAP® R/3 system is shown in the following figure.
Figure 13: SAP® applications diagram
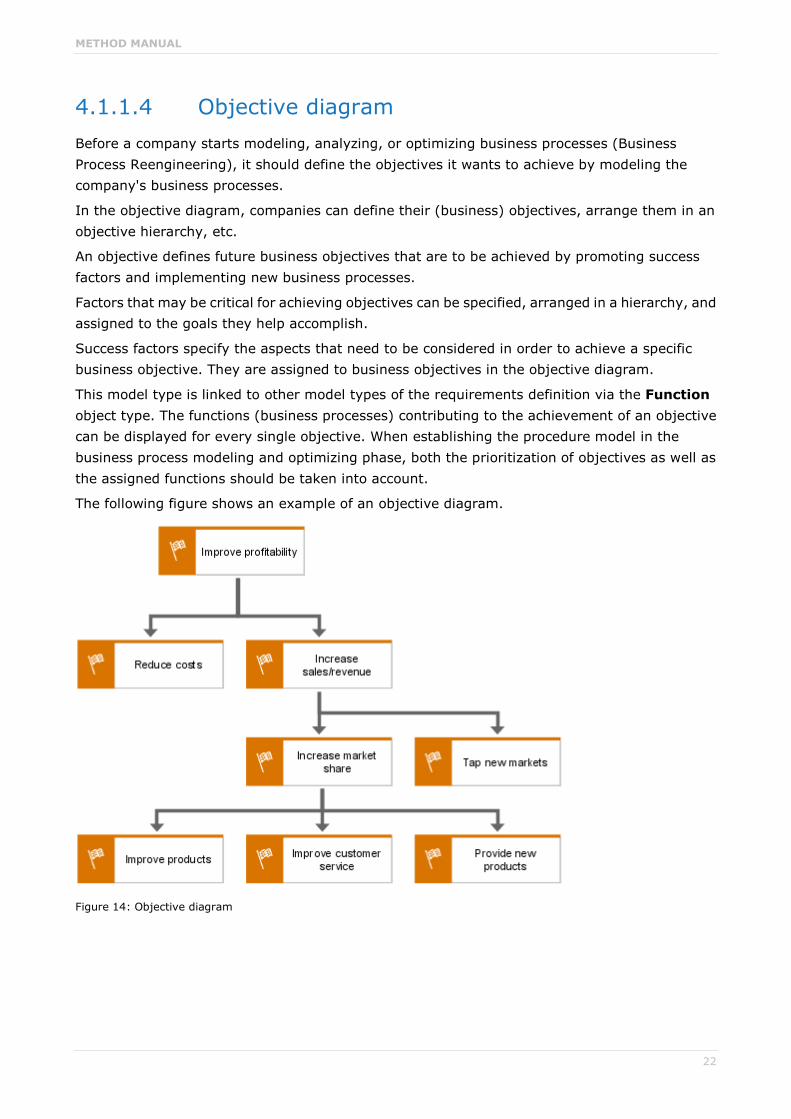
METHOD MANUAL
22
4.1.1.4 Objective diagram Before a company starts modeling, analyzing, or optimizing business processes (Business Process Reengineering), it should define the objectives it wants to achieve by modeling the company's business processes.
In the objective diagram, companies can define their (business) objectives, arrange them in an objective hierarchy, etc.
An objective defines future business objectives that are to be achieved by promoting success factors and implementing new business processes.
Factors that may be critical for achieving objectives can be specified, arranged in a hierarchy, and assigned to the goals they help accomplish.
Success factors specify the aspects that need to be considered in order to achieve a specific business objective. They are assigned to business objectives in the objective diagram.
This model type is linked to other model types of the requirements definition via the Function object type. The functions (business processes) contributing to the achievement of an objective can be displayed for every single objective. When establishing the procedure model in the business process modeling and optimizing phase, both the prioritization of objectives as well as the assigned functions should be taken into account.
The following figure shows an example of an objective diagram.
Figure 14: Objective diagram

METHOD MANUAL
23
4.1.2 Design specification - Application system type diagram
The design specification of the function view contains the specification for the application system and module types, as well as the modular structure of the application system type, an outline of individual transaction steps, and the definition of input and output presentations in the form of draft lists and screen designs.
Key questions to which the design specification of the function view provides answers are:
How can application system types, module types, or IT functions support the functions defined in the requirements definition?
What is the modular structure of application system types or module types?
Which lists and screens are required to carry out a function?
Which lists can be created with an application system type or a module type, and which screens do application system types and module types use?
What technology (operating system, user interface, database management system) is an application system type based on?
Which business objectives are pursued when a specific application system type is used?
Thus, the Application system type is the key object type of the function view's design specification.
Unlike concrete application systems that come into play only at the implementation level of the function view and that represent specific, identifiable (for example, by a license number) application systems within a company, application system types are generated as the result of typifying all application systems that are based on precisely the same technology.
An application system type typifies individual application systems that are based on precisely the same technology.
Example: ARIS Architect is an application system type. You can purchase several licenses for this application system type and thus obtain various individual application systems.
Application system types are represented by the following graphic symbol:
Figure 15: Graphical representation of an application system type

METHOD MANUAL
24
Application system types are mostly modular in structure. The application system type diagram is a means of representing this modular structure. Application system types are broken down into module types. The following figure shows an example:
Figure 16: Modular structure of an application system type
In the above example, ARIS Architect consists of the module types Explorer, Model, Matrix Editor, Administration, and Script Editor. As with application system types, module types typify individual modules that are based on precisely the same technology. Module types are components of application system types. They are capable of autonomous operation.
A module type is a component of an application system type, which is capable of autonomous operation. Module types typify individual modules that are based on precisely the same technology.
Application system types and module types can be arranged in any hierarchy. At the lowest level, module types can be divided into IT function types.
An IT function type, in the sense of a transaction, is the smallest unit of a module type. IT function types are realized as individual program modules and must always be carried out completely to process an individual work step.
Figure 17: Graphical representation of an IT function type
The application system type diagram is also a means of defining the functions of the requirements definition that are supported by the specified application system types and module types. This

METHOD MANUAL
25
assignment forms the link between the requirements definition and the design specification of the function view. The following figure shows an example.
Figure 18: Allocation of functions to application system types
To obtain a more detailed specification of the technology that application system types and module types are based on, it is possible to allocate to them the types of user interfaces, database management systems, and operating systems under which they can run, as well as the programming languages that are used to implement them. As this concerns types and not concrete specimen, multiple relationships are possible. For example, an application system type can be assigned the Windows 7 and Windows 8 user interface, which means that the application system type can run under both user interfaces. A unique relationship is required only when the graphical user interface is assigned to a concrete specimen (that is, a specific application system) at the implementation level of the function view. This relationship describes the exact configuration of the application system type license that the company purchased.
An example of possible assignments in an application system type diagram is shown in the following figure.
Figure 19: Application system type configuration

METHOD MANUAL
26
Processing a technical function with the support of an application system involves the use of various screens and the creation or use of various lists provided by the corresponding application system. For this purpose, the List and Screen objects are available and can be assigned to either the technical function or the application system types and module types.
If, in a first step, general operational procedures are to be defined without reference to specific application system types, the Draft list and Screen design objects can be used to specify the required screens and lists. First, both object types specify in general which type of list or screen is to be used (for example, Enter customer data), without establishing a specific reference to application system type lists or screens. Subsequently, these draft lists and screen designs can be assigned to specific lists and screens. Existing assignments determine possible implementation scenarios. The following figure illustrates an example.
Figure 20: Screen and list assignments
A list of object types and relationships that are available in an application system type diagram is provided in the ARIS Method Reference manual on your installation media.

METHOD MANUAL
27
4.1.3 Implementation - Application system diagram In the application system type diagram, you can assign specific application systems and modules to the application system types and module types described in the design specification. Application systems are specimens of an application system type that exist in the company and can be uniquely identified, for example, by the license numbers.
An application system (module) is an individual specimen of an application system type (module type), which can be uniquely identified, for example, by the license number.
Application systems and modules are displayed graphically as follows.
Figure 21: Graphical representation of the application system and the module
As a company may have more than one license for an application system type (module type), more than one application system (module) can be assigned to an application system type (module type) in the application system diagram.
Figure 22: Assignment of application systems to their application system types

METHOD MANUAL
28
The application system diagram shows the actual modular structure of an application system. While the design specification lists all modular components that an application system type may have, here we are dealing with a single application system license so that the modular components can be uniquely defined for each license. Therefore, a company may have multiple application systems of the same application system type, but with completely different modular structures.
Figure 23: Different modular structure of two application systems of the same type
The implementation level not only represents all existing application systems and modules, but also enables the technical (physical) implementation of application systems to be defined in the form of individual program files.
The application system type diagram illustrates which program module types are required to implement an application system type or module type.
A program module is a program file on a storage medium obtained by purchasing a license (for example, an EXE file or COM file). A program module type is created by typifying program modules that are based on precisely the same technology.
The following figure illustrates the assignment of program module types to an application system type and of individual program modules to program module types.
Figure 24: Assignment of application system types, program module types, and program modules

METHOD MANUAL
29
The ARIS Architect application system type consists of the arisarchitect.exe, dbbase.dll, abaris.dll, and ATAexpl.dll program module types. Multiple specimens (program modules) of each program module type may exist in the company if several licenses were purchased or if backup copies were created.
Program module types and program modules can be arranged in any hierarchy. For a more precise technological specification of the program it is possible to also represent the access of program module types to program libraries in the application system type diagram.
A list of object types and relationships that are available in an application system type diagram is provided in the ARIS Method Reference manual on your installation media.

METHOD MANUAL
30
4.2 Data view
4.2.1 Requirements definition The requirements definition of the data view includes a description of the semantic data model of the area of consideration. In line with the breakdown approach stipulated by ARIS, the description covers both the objects that specify the start and end events of a process chain and the current state of the relevant process chain environment.
Unlike function modeling, data modeling is particularly demanding as far as the method is concerned. In the function view, the only object examined is the function. Furthermore, relationships between functions simply illustrate superordination or subordination.
Chen's Entity-Relationship Model (ERM) is the most widely used designing method for semantic data models (see Chen, The Entity-Relationship Model, 1976). This modeling method uses a variety of specialized terms, such as entity type, relationship type, attribute, etc. The relationships that exist between these objects are numerous and - compared with function modeling - significantly more difficult to classify.
The following pages introduce modeling with entity relationship models (ERM). First, the objects and relationships of Chen's base model are explained. Then, another chapter describes several rules that were added later to the base model.
4.2.1.1 The ERM base model The base model distinguishes between entities, attributes, and relationships. Basically, a distinction is made between type level and occurrence level.
Entities are real or abstract objects that are relevant for the business management tasks being examined.
For example, a business process can be a considered object. According to the ARIS breakdown model, the data objects of interest are objects of the environment and objects specifying events. Examples of entities in the Customer order processing process are:
Customer 1235,
Item 471,
Order 11.
Entities are described in more detail by specific attributes (properties). For example, a customer can be specified more precisely by his name, first name, and address.
If similar entities are grouped into sets, these are referred to as entity types, the individual occurrences of which are the entities.

METHOD MANUAL
31
Entities of a similar type can be described by the same attributes. For example, customer Moore and customer Miller are grouped under the Customer entity type; item 4710 and item 4712 are grouped under the Item entity type. Entity types are displayed as rectangles in the ERM (see the figure below). In the following, entity types are indicated by capitalized text.
Figure 25: Examples of entity types
Attributes are properties describing entity types.
Attribute occurrences are specific values of attributes of individual entities. For example, customer 1235 can be described by attribute occurrences such as Miller, Peter, and Munich. The relevant attributes are Name, First name, and City.
Attributes are usually represented by an oval or a circle. In the following, attributes are represented by ovals. The following figure shows examples of attributes for the CUSTOMER entity type.
Figure 26: Examples of attributes of the 'Customer' entity type
Entity types and attributes are often hard to distinguish and can sometimes only be determined from the context of the modeling procedure. For example, a customer address can be understood as an entity and not as an attribute of CUSTOMER. In this case, a separate entity type ADDRESS would be modeled with a relationship to CUSTOMER. A helpful criterion for specifying whether you are dealing with an entity type or an attribute is the fact that entities have attributes, while attributes cannot have their own attributes. An attribute that is created in an ERM and is to be

METHOD MANUAL
32
described by further attributes later on thus becomes an entity type. Whether or not an object will have relationships with other entity types is another helpful question. If yes, the object under consideration is an entity type as well.
A relationship is a logical link between entities.
Therefore, the existence of relationships directly depends on the existence of entities.
If similar relationships are grouped into sets, these are referred to as relationship types.
For example, a possible relationship type between SUPPLIER and PART is SUPPLIES. In the following text, relationship types are also indicated by capital letters. In an ERM, relationship types are displayed as diamonds and are linked with entity types using connections (see the following figure).
Figure 27: Example of a relationship type
Often, only one direction of reading relationship type names results in viable connections. The example above illustrates the relationship Supplier supplies Part. In the opposite direction, this would read Part supplies Supplier, which is not suitable. If you cannot determine the particular read direction, carefully select superior terms.
Various kinds of relationship types can be distinguished. The distinguishing criteria are the number of entity types linked by relationship types, and the complexity of a relationship.
Thus, unary, binary, or n-ary relationships may exist between entity types.
The complexity or cardinality indicates how many entities of one entity type may be connected with an entity of another entity type.
The relationships to be distinguished are illustrated in the following figure (see Scheer, Business Process Engineering, 1994, p. 34).
There are four different types of relationships (cardinalities):
1:1 relationship,
1:n relationship,
n:1 relationship,
n:m relationship.
In a 1:1 relationship, each entity of the first set is assigned to exactly one entity of the second set.
In a 1:n relationship, each entity of the first set is assigned to exactly one entity of the second set, but each entity of the second set may be connected with multiple entities of the first set.
An n:1 relationship means the same, but in reverse order.
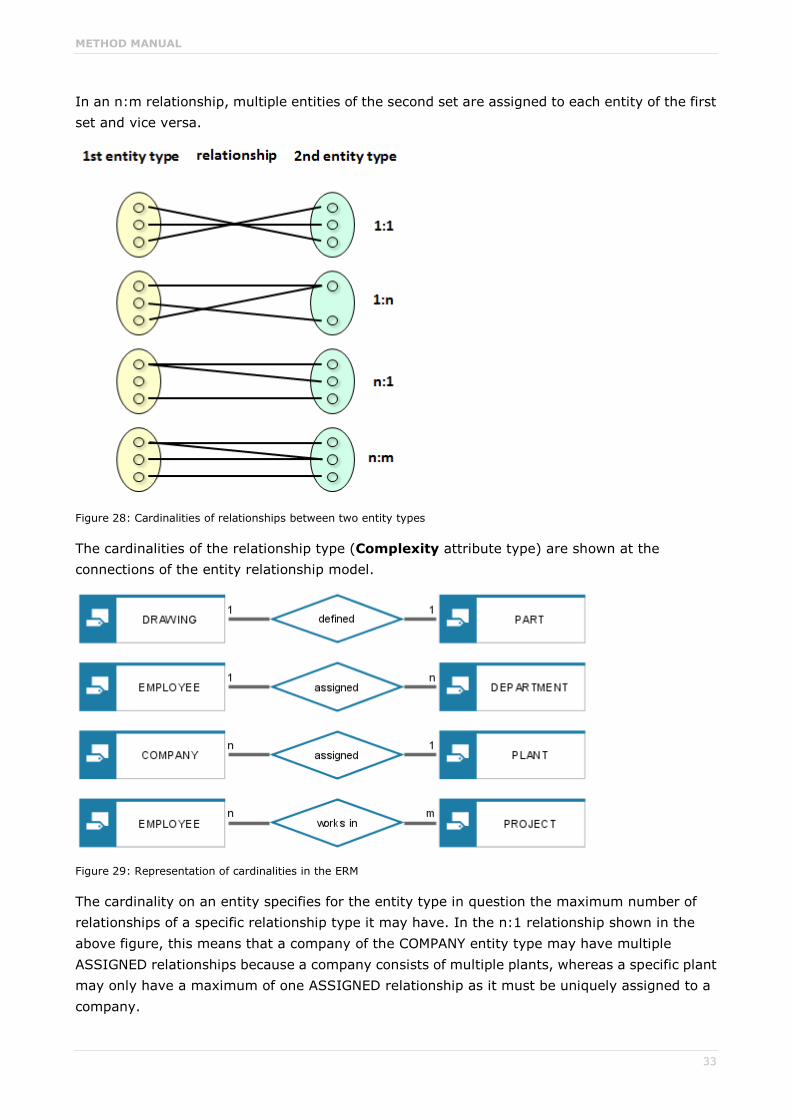
METHOD MANUAL
33
In an n:m relationship, multiple entities of the second set are assigned to each entity of the first set and vice versa.
Figure 28: Cardinalities of relationships between two entity types
The cardinalities of the relationship type (Complexity attribute type) are shown at the connections of the entity relationship model.
Figure 29: Representation of cardinalities in the ERM
The cardinality on an entity specifies for the entity type in question the maximum number of relationships of a specific relationship type it may have. In the n:1 relationship shown in the above figure, this means that a company of the COMPANY entity type may have multiple ASSIGNED relationships because a company consists of multiple plants, whereas a specific plant may only have a maximum of one ASSIGNED relationship as it must be uniquely assigned to a company.

METHOD MANUAL
34
Chen’s original work poses a different interpretation of cardinality. However, the notation used in this manual allows for clearer specifications, particularly when illustrating relationships between multiple entity types. In order to avoid confusion, Chen's original work is not discussed in detail here.
Due to the fact that relationships between entities of one entity type are allowed, two parallel connections may exist between an entity type and a relationship type. These connections can be distinguished by assigning role names. The following figure illustrates recursive relationships. A superior part consists of various subordinate parts. A subordinate part, in turn, may also be used as a component in various superior parts.
Figure 30: ERM for a bill of materials
Both entity types and relationship types can be described by attributes (see the figure below).
The value ranges of attributes are called domains.
Assignments of domain elements to elements of entity or relationship types are also relationships and can be represented by a connection named accordingly.
A 1:1 relationship must exist between an entity type and at least one domain. The values of this domain uniquely identify individual entities. Therefore, they are called the key attributes of the entity type.
In the example shown in the figure below (see Scheer, Business Process Engineering, 1994, p. 33), the entities of CUSTOMER are uniquely identified by the Customer ID key attribute.
Relationships are identified by merging the key attributes of all linked entities. Thus, the key attributes of the RESIDES AT relationship type are Customer ID and Address ID.
The descriptive attributes of the relevant data objects are defined by values derived from domains having a 1:n relationship to entity types or relationship types.
Figure 31: Assignment of attributes in the ERM

METHOD MANUAL
35
4.2.1.2 ERM - eERM extensions In the last few years, Chen's base model has been substantially extended. This manual will discuss only those extensions that are significant for modeling the data view in the ARIS concept.
4.2.1.2.1 Design operators added Design operators provide formal support in creating a data model. Their use ensures systematic creation of data structures and provides the person who looks at an existing data structure with insights into the design process. Based on existing terms, new terms are developed by using design operators. This process is an intellectual procedure running at the level of business management knowledge. The examination of business management facts in terms of data structures either entails that known structures are changed based on new approaches, or that entirely new conclusions are drawn.
Of the numerous and various approaches for extending ERM modeling, four basic design operators have become accepted (see Scheer, Business Process Engineering, 1994, p. 35 et sqq.):
Classification,
Generalization,
Aggregation, and
Grouping.
CLASSIFICATION
Through classification, objects (entities) of the same type are identified and assigned to a term (entity type). Two objects are identical if the same properties (attributes) are used to describe them.
Classification thus results in the previously described identification of entity types.
Figure 32: Classification of customers
GENERALIZATION/SPECIALIZATION
Generalization means that similar object types are grouped under a superior object type.
As shown in the following figure, the Customer entity type and the Supplier entity type are generalized to form the generic term Business associate. Properties (described by attributes) that both source objects share are transferred to the generalized object type. Thus, only those attributes in which the source object types differ are left to be described. The formation of the new entity type Business associate is graphically represented by a triangle, also called an 'is a' relationship.

METHOD MANUAL
36
Specialization is the breakdown of a generic term into subterms (Business associate is split into Customer and Supplier).
Specialization is the reverse of generalization. The specialized objects inherit the properties of the generalized object. Apart from these inherited attributes, the specialized object types may have their own attributes. Graphically, specialization and generalization are represented in the same way.
For this reason, the links in the illustration are not drawn as arrows indicating a direction.
Figure 33: Generalization/Specialization
While specialization primarily supports a top-down procedure when creating a data model, generalization is used to support a bottom-up procedure.
Within the scope of specialization, the completeness and disjunction (alternative) of the subsets formed can be specified as they are created.
Non-disjoint subsets are characterized by the fact that the occurrence of an object may exist in one subset as well as in another. In the above example, a customer may also be a supplier. If an occurrence can be allocated to precisely one subset only, these sets are disjoint.
Complete specialization describes the fact that all specialized object types that meet a specific specialization criterion are listed for a generalized object type. For example, when specializing the Human being entity type the Female and Male entity types can be listed. Thus, specialization in terms of Gender is complete.
Figure 34: Complete specialization

METHOD MANUAL
37
Combining these criteria results in the following four occurrences used for specifying a generalization/specialization in more detail:
disjoint/complete,
disjoint/incomplete,
non-disjoint/complete,
non-disjoint/incomplete.
AGGREGATION
Aggregation is the formation of new object types by combining existing object types. The new object type can be carrier of new properties.
In the ERM, aggregation is expressed by the formation of relationship types (see the following figure). Aggregating the Production order and Routing entity types forms the new object Order routing.
Figure 35: Example of an aggregation
The aggregation operator can also be applied to relationships. An existing relationship type is then treated as an entity type and can thus become the starting point for creating new relationships. An example illustrating this is shown in the following figure.
In a first aggregation step, the Order routing relationship type is formed from the Production order and Routing entity types. The production order number (PONO) and routing number (RNO) key attributes form the complex key of the order routing. Now, multiple operations can be assigned to the order routing. Therefore, the Order operation relationship is formed between the Order routing relationship type and the Operation entity type. As relationships can be created only between entity types, the original Order routing relationship type must be reinterpreted. In the following figure, this is illustrated by a framed diamond. This reinterpreted relationship type thus formed is treated as a 'normal' entity type. To graphically illustrate the formation of the relationship type, the connections of the entity types participating in that formation are drawn to the diamond. The outgoing connections of the reinterpreted relationship type that form new relationships are drawn only to the edges of the rectangle and do not touch the diamond inside the symbol.

METHOD MANUAL
38
Although, as a general rule, it is possible to replace the complex keys with simple keys, maintaining complex keys is useful in terms of tracing the data model's creation.
Figure 36: Aggregation with reinterpreted relationship types
In an ERM, a complex structural context is split into a transparent structure. As the relation to the overall structure might become obscured, complex objects in the form of Cluster/Data models are introduced.
A Cluster/Data model is the logical view of multiple entity types and relationship types of a data model that are required for describing a complex object.
Besides entity types and relationship types, Cluster/Data models themselves can be part of a Cluster/Data model. Unlike entity and relationship types, Cluster/Data models can be arranged in any hierarchy and thus mainly supports a top-down procedure in the process of creating data models. However, forming Cluster/Data models may also be very helpful when combining and consolidating submodels during a bottom-up approach.
The following figure graphically displays a Cluster/Data model.
Figure 37: Data cluster (graphic symbol)

METHOD MANUAL
39
Figure 38: Data cluster view of multiple objects
The Cluster/Data model represents a logical view of multiple entity types and relationship types. The Customer, Time, Customer order header, Item, and Customer order item entity types and relationship types are required to describe the complex Customer order object.
GROUPING
Grouping forms groups from the elements of an entity set.
For example, in the following figure, all Operating resources are combined into an Operating resources group. The operating resources group is an independent object which can be described more precisely by additional attributes (name of the operating resources group, number of operating resources) not contained in the individual operating resources. Other examples are the grouping of workstations into departments or the combination of order line items into orders.
Figure 39: Grouping

METHOD MANUAL
40
4.2.1.2.2 Extension of cardinalities When specifying cardinalities, so far only the upper limit for the admitted number of relationship occurrences was indicated. For example, the cardinalities in the following figure indicate that a project can be assigned a maximum number (m) of employees and one employee can participate in a maximum number (n) of projects.
Figure 40: Upper/Lower limit (1)
Besides the upper limit, the lower limit specifying the minimum number of relationship occurrences may also be of interest. For this purpose, the cardinalities can be expressed as a letter pair (a,b), for example, (see Scheer, Business Process Engineering). The letter pair (a1, b1) in the following figure indicates that every project can participate in at least a1 and at most b1 relationship occurrences of the works in type, which means that every project can be assigned at least a1 and at most b1 employees. The other letter pair (a2, b2) indicates that one employee can participate in at least a2 and in at most b2 projects.
Figure 41: Upper/Lower limit (2)
Thus, every relationship is defined by two degrees of complexity (minimum, maximum). The lower limit often has the values 0 and 1, whereas the value range for the upper limit is defined as 1 <= max <= * (where * is 'any number').
A lower limit of min = 0 means that an entity may participate in a relationship, but does not necessarily have to. A lower limit of min = 1 indicates that an entity must participate in at least one relationship.
In the following figure, the lower limits indicate that an employee may participate in a relationship, but does not necessarily have to (min = 0), while a project has to participate in at least one relationship (min = 1). What is expressed here is that there can be employees who are not assigned to a project. In turn, however, every project must be assigned at least one employee.
Figure 42: Upper/Lower limit (3)
If minimum values are equal to 0 or 1 and maximum values are equal to 1 or *, the following four cases of a (min,max) notation can be distinguished: (1,1), (1,m), (0,1), and (0,m). Alternatively,

METHOD MANUAL
41
the following abbreviated notation can be used (see Schlageter/Stucky, Database systems, 1983, p. 51):
1 (corresponds to (1,1))
c (corresponds to (0,1)),
m (corresponds to (1,m)),
cm (corresponds to (0,m)).
The following figure shows the previous graphical example using the abbreviated notation.
Figure 43: Upper/Lower limit (4)

METHOD MANUAL
42
4.2.1.2.3 Identification and existence dependency The method of extending cardinalities via the specification of lower and upper limits as discussed in chapter ERM - eERM extensions (page 35) enables certain dependencies between data objects to be defined.
By definition, relationship types and reinterpreted relationship types do not exist autonomously, but come into being due to the existence of the entity types they link. This means that they depend on other entity types in terms of both identification and existence.
In addition, there are entity types that depend on the existence of other entities even though they have their own key attribute. These dependencies may be the result of a grouping operation, for example. Thus, in the example of the following figure, a department requires at least one assigned workstation, while defining a workstation, in turn, implies that it be assigned to a department. As shown in the following figure, these existence-related dependencies are expressed by specifying the complexity. A (min, max) notation uses (1,1) and (1,*). The definition of existence-related dependencies within the data model results in conditions for the referential data integrity when implemented. In other words, complying with these conditions ensures that the consistency of the database contents is preserved even after certain transactions have been performed. In the example below, this means that a department can be deleted only if all workstations assigned to this department are also deleted.
Figure 44: Existence dependency

METHOD MANUAL
43
4.2.1.2.4 Modeling technical terms used in a company - Technical terms model
In modeling, and especially in data modeling, a difficulty that frequently occurs is the variety of terms used for information objects in large companies. For example, the purchasing department's definition of the term order differs from the production department's definition of the same term. However, acceptance of the information gathered can be substantially increased by the use of consistent terminology throughout the company or the department. For this reason, ARIS Method provides the so-called Technical terms model that may be used for managing the various terms in the form of a synonym management for data objects, as well as for specifying the relationships that exist between the objects of data models (entity type, relationship type, ...) and the technical terms used within the company.
In order to represent these relationships, the 'Technical term' object type was introduced. You can thus assign multiple technical terms to every information object of the data model. The following figure illustrates an example.
Figure 45: Technical terms (1)
Technical terms can be interrelated and may be arranged in a hierarchy. The following figure illustrates how connection types are used between technical terms.
Figure 46: Technical terms (2)

METHOD MANUAL
44
The technical terms defined in the technical terms model can also be used in other model types that contain information objects, for example, in process chains for illustrating a function's input/output data.

METHOD MANUAL
45
4.2.1.2.5 eERM attribute allocation diagram Data models in the form of eERMs, even if they display entity types and relationship types only, mostly have a rather complex structure. If ERM attributes were included in these models, they would no longer be legible.
eERM attribute allocation diagrams enable you to assign ERM attribute allocations to every entity type and relationship type in a separate model. The object type of the eERM (entity type or relationship type) can be included in this model as an occurrence copy, and the relationships to the ERM attributes can be modeled. It is possible to distinguish whether the linked ERM attribute is a key attribute, a foreign key, or a descriptive attribute. The following figure illustrates an example.
Figure 47: Allocation of ERM attributes to an entity type
This model type not only enables individual ERM attributes to be represented and allocated, but also displays attribute type groups and their allocations.
An attribute type group represents a group of ERM attributes of an entity type that are closely related semantically. For example, ERM attributes of an entity type that, in their entirety, form a secondary key can be combined to form an attribute type group.
Attribute type groups are represented as follows:
Figure 48: Representation of an attribute type group
A list of relationships that are available in an ERM attribute allocation diagram is provided in the ARIS Method Reference manual on your installation media.
METHOD MANUAL
46
4.2.1.3 Alternative forms of representation
4.2.1.3.1 SAP SERM Besides the representation form described here, other ERM representations are also in use. Frequently, relationship types are not represented as individual objects, but as connections between entity types. Relationship types that have their own attributes are then represented as (weak) entity types.
One such form of representation is the SERM representation (Structured Entity Relationship Model) developed by Sinz (see Sinz, Entity Relationship Model, 1990). The data structure's direction of development becomes visible by displaying the original and dependent data objects using directed graphs and arranging the model objects from left (strong entity types) to right (weak entity types and relationship types). The connection anchor points are restricted by the relevant object and thus enhance visualization of the development direction. The main difference between SER models and the modeling based on the eERM method described so far lies in the graphical representation.
The modeling technique developed by SAP AG in Walldorf/Germany as part of its modeling methodology links the concepts of the SER approach with the eERM approach presented here (see Keller/Hechler, Information Model, 1991).
In this context, no graphic distinction is made between entity types and relationship types during object formation. The dependencies between information objects are expressed by the relationship complexity of the arrow representations. A distinction is made between hierarchical, aggregating, and referential relationships (see the following figure).
Hierarchical relationships define a unilateral existence dependency between information objects.
Aggregating relationships correspond to the formation of relationship types based on the eERM approach.
Referential relationships describe logical dependencies between reinterpreted entity types and original entity types based on the eERM approach.
Specialization is represented in analogy to the ERM approach.
The following figure explains this notation by showing an example of the eERM representation being converted into the SAP® ERM representation (see also: Seubert, SAP® data model, 1991, p. 94).
This clearly shows that the fundamental technical content can be transferred to this form of representation without any loss of information.

METHOD MANUAL
47
The SAP® ERM may be considered as a representation of data models after the creation process has been completed. Due to the graph-oriented arrangement of information objects in the SAP® ERM, faster navigation and orientation is supported, particularly in larger data models.
Figure 49: eERM and SAP® ERM representation

METHOD MANUAL
48
4.2.1.3.2 IE data model The IE data model complies with the data modeling notation of the Information Engineering Facility (IEF) CASE tool by Texas Instruments Inc.
Just like the SAP® SERM notation, the IE notation does not provide proprietary object types for relationships between entity types.
The following figure illustrates an example of a data model in IE notation.
Figure 50: Data model in IE notation

METHOD MANUAL
49
4.2.1.3.3 SeDaM model The SeDaM (Semantic Data Model) data model notation is a notation from BASF AG.
It does not provide proprietary object types for relationships between entity types.
There is no strict arrangement of entity types from left to right (see SAP® SERM notation).
The Cluster/Data model and Generalization type object types are also available.
The following figure shows an example of a data model in SeDaM notation.
Figure 51: Data model in SeDaM notation
A list of relationship types that are available in a SeDaM model is provided in the ARIS Method Reference manual on your installation media.

METHOD MANUAL
50
4.2.1.4 Summary of the main terms and forms of representation of the eERM
The terms and representation forms of structural elements and design operators featured by the extended entity relationship model (eERM) are summarized in the following figure (see Scheer, Business Process Engineering, 1994, p. 45).
Figure 52: eERM: Terms and forms of representation

METHOD MANUAL
51
4.2.1.5 Document type definition A model of the DTD (Document Type Definition) type describes the rules according to which an XML document of a specific type must be structured. The description is provided in the form of element type declarations.
For example, you can use a DTD to define the general structure of a document type. A valid document of a document type defined in the DTD is an XML document. This has the advantage that the document can be processed by various programs based on the corresponding DTD.
Starting from an Element type object, the model must be set up according to a strict hierarchy. The source object must not have any incoming connections. Furthermore, connections must always run from the superior object to the subordinate object. While you can describe all element types in a DTD model for clear document structures, with complex structures you have the option to declare an element type in an assigned DTD model.
If you work with assignments, the assigned model must contain the complete description of the element type.
4.2.1.5.1 Element types The essential components of a DTD are element types. Instances of element types that occur in the DTD model hierarchy may occur in a valid XML document and are called elements.
Each element type is described by its content and its attribute types.
Three types of element types can be distinguished by their content:
Element types with text as content
Element types without content
Element types with text and/or other element types as content
To describe an element type that has only text as its content, you place an Element type object with the required name and an element of the Contents type with the #PCDATA symbol. You then draw a connection of the contains type between the element type and the content.
Figure 53: DTD element type with pure text contents
To describe an element type without content, you place an Element type object with the required name and an element of the Contents type with the EMPTY symbol. You then draw a connection of the contains type between the element type and the content. A typical example of an element type without content is the <img> tag in HTML. The essential benefit of empty element types is that they can have useful attributes, such as the SRC, ALIGN, ALT, and ISMAP attributes of the img tag.
The most complex form of an element type is an element type with mixed content. In this case, text or element types can be assigned to an object of the Element type type. To describe the

METHOD MANUAL
52
form in which assignments are linked to each other, rules can be used. The connections between element type and assignments describe how often an assignment may occur in the element type content.
The sequence operator and the XOR rule are available for the purpose of linking assignments.
If only one of a specified number of assignments is allowed in the content of the element type being described, the assignments must be linked to each other by an XOR rule.
If multiple assignments are allowed in the content of the element type being described, but only in a certain order, they must be linked by a sequence operator. To clearly define the required order, specify the relevant position for the assignment at the connection between the operator and the assignment.
Figure 54: Element types with mixed contents and conversion in the DTD
Assignments can also be linked to the element described without using operators. In this case it is assumed that the sequence may be of any order.

METHOD MANUAL
53
4.2.1.5.2 Connection types Assignments in the content of an element type can occur with varying frequency. The number of permitted occurrences of an assignment in the content of the element type is determined by the connection type between element type and assignment.
The following connection types are available:
has any number of times
has at least once
has at most once
has exactly once
The following table explains the various connection types and the corresponding character that is used in the generated DTD to symbolize their occurrence:
Connection type
Description Character
has any number of times
The assignment must not necessarily occur in the content of the element type being described. It may occur once or multiple times (min = 0, max = any positive integer).
*
has at least once The assignment must occur in the content of the element type being described and it may occur more than once (min = 1, max = any positive integer).
+
has at most once The assignment must not necessarily occur in the content of the element type being described. It may occur only once (min = 0, max = 1).
?
has exactly once The assignment must occur in the content of the element type being described. It may occur only once (min = 1, max = 1).
no character
METHOD MANUAL
54
4.2.1.5.3 Attribute types Besides the description of the structure, a DTD may also contain declarations of attribute types. Attribute types describe the properties of an element type. They are always assigned to an element type. Simple attribute types and enumeration attribute types can be declared in a DTD.
Procedure
1. Place an Attribute type object with the required name in the model.
2. Draw a connection from the element type whose property is described by the attribute type to the new attribute type.
3. Open the Attribute dialog to specify further information for the attribute type declaration.
This information includes:
Data type of the attribute value
Attribute default
Default value
The attribute types are declared.

METHOD MANUAL
55
4.2.1.5.3.1 Data type of the attribute value To specify the data type of the attribute value, specify the Data type attribute. The following table explains the data types you specified.
Data type Description
CDATA Strings.
ID A unique identifier. If the value is not unique, the XML processor sends an error message.
IDREF A reference to an identifier that is defined elsewhere in the document. If an identifier that has not been assigned in the current XML document is used as a value, the XML processor sends an error message.
IDREFS The attribute value may consist of multiple attribute values of the IDREF type, separated by spaces. If an identifier that has not been assigned in the current XML document is referred to in the attribute value, the XML processor sends an error message.
ENTITY A reference to a remote binary entity that is declared within the DTD.
ENTITIES The attribute value may consist of multiple attribute values of the ENTITY type, separated by spaces.
NMTOKEN Any combination of letters, numbers, periods, dashes, semi-colons, or underscores may be used as an attribute type.
NMTOKENS The attribute value may consist of multiple attribute values of the NMTOKEN type, separated by spaces.
NOTATION A reference to a notation declared in the DTD.
The NMTOKEN value is specified as the default for the Data type attribute.
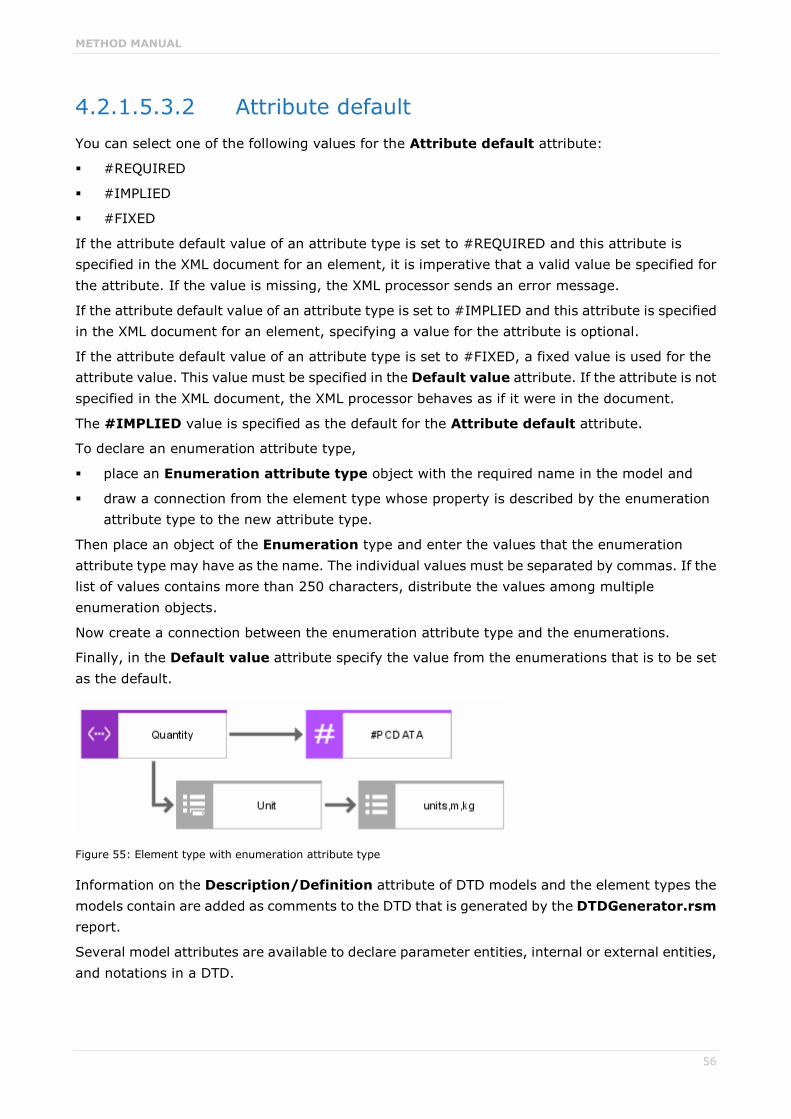
METHOD MANUAL
56
4.2.1.5.3.2 Attribute default You can select one of the following values for the Attribute default attribute:
#REQUIRED
#IMPLIED
#FIXED
If the attribute default value of an attribute type is set to #REQUIRED and this attribute is specified in the XML document for an element, it is imperative that a valid value be specified for the attribute. If the value is missing, the XML processor sends an error message.
If the attribute default value of an attribute type is set to #IMPLIED and this attribute is specified in the XML document for an element, specifying a value for the attribute is optional.
If the attribute default value of an attribute type is set to #FIXED, a fixed value is used for the attribute value. This value must be specified in the Default value attribute. If the attribute is not specified in the XML document, the XML processor behaves as if it were in the document.
The #IMPLIED value is specified as the default for the Attribute default attribute.
To declare an enumeration attribute type,
place an Enumeration attribute type object with the required name in the model and
draw a connection from the element type whose property is described by the enumeration attribute type to the new attribute type.
Then place an object of the Enumeration type and enter the values that the enumeration attribute type may have as the name. The individual values must be separated by commas. If the list of values contains more than 250 characters, distribute the values among multiple enumeration objects.
Now create a connection between the enumeration attribute type and the enumerations.
Finally, in the Default value attribute specify the value from the enumerations that is to be set as the default.
Figure 55: Element type with enumeration attribute type
Information on the Description/Definition attribute of DTD models and the element types the models contain are added as comments to the DTD that is generated by the DTDGenerator.rsm report.
Several model attributes are available to declare parameter entities, internal or external entities, and notations in a DTD.

METHOD MANUAL
57
PARAMETER ENTITY
To declare a parameter entity, enter the following information in the specified order:
the symbolic name,
a keyword, and
a Uniform Resource Identifier (URI) for the required parameter entity declaration.
The symbolic name can be used as a parameter entity reference in the current DTD.
SYSTEM and PUBLIC can be used as keywords. To use the parameter entity to refer to a file that is known and used only within your company, enter the keyword SYSTEM. Enter PUBLIC to refer to a file that is part of a standard library.
An example of a URI that follows the keyword PUBLIC is: "-//w3c//ENTITIES Latin//EN//HTML" "http://www.w3.org/DTD/ISOLAT1.ent".
INTERNAL ENTITY
To declare an internal entity, enter the following information in the specified order:
the symbolic name, and
a text, both used to declare a general internal entity. Insert a space between the name and the text and enclose the text in quotation marks.
If an XML document of the current DTD contains an entity reference with the specified symbolic name, this name will be replaced by the specified text.
EXTERNAL ENTITY
To declare an external entity, enter the following information in the specified order:
a symbolic name,
a keyword,
a Uniform Resource Identifier (URI), and
a notation, all used to declare a general external entity.
The symbolic name can be used as an entity reference in an XML document of the current DTD.
SYSTEM and PUBLIC can be used as keywords. To use the external entity to refer to a file that is known and used only within your company, enter the keyword SYSTEM. Enter PUBLIC to refer to a file that is part of a standard library.
A URI tells the XML processor where the object that the external entity refers to can be found.
An example of a URI following the keyword SYSTEM is:
"c:\images\test.gif".
An example of a URI following the keyword PUBLIC is:
"-//w3c//ENTITIES Latin//EN//HTML" "http://www.w3.org/DTD/ISOLAT1.ent".
The notation at the end of the entry tells the XML processor about the type of object the external entity refers to. The notation used must be declared in the current DTD.

METHOD MANUAL
58
For example, if you use the URI from the first example in your entity declaration, first declare a notation for the GIF data format in the DTD and then insert NDATA GIF to complete your entry in this attribute type.
NOTATION
To declare a notation, enter the following information in the specified order:
a symbolic name,
a keyword, and
a Uniform Resource Identifier (URI).
This information tells the XML processor how to handle objects of this type that occur in XML documents of the current DTD.
The symbolic name for the notation can be used in attribute and entity declarations of the current DTD.
SYSTEM and PUBLIC can be used as keywords. For example, to declare a notation for objects in GIF format and tell the XML processor to display objects of this type with the Internet Explorer locally available, enter the keyword SYSTEM. Enter PUBLIC as the keyword to declare a notation for files of the TEX type and refer the XML processor to a generally accessible resource or source.
The uniform resource identifier tells the XML processor where to find the application or information providing the instructions for dealing with objects of the specified type. For example, the URI for the GIF notation with the keyword SYSTEM may be "c:\Program Files\Internet Explorer\Iexplore.exe", whereas "ISBN 0-201-13448-9:://NOTATION TeX//EN" may be entered as the URI for the notation with the keyword PUBLIC.
4.2.1.5.4 Testing a DTD When you have created the required DTD and want to test it in two steps, you can activate or disable parts of the DTD that are not included in the current test using the Conditional section object type.
To hide element types from a DTD that are subordinate to a conditional section, activate the Ignore attribute of the corresponding conditional section.
If you use the DTDImport.rsg report script to turn a text DTD containing a conditional section into a model of the DTD type, the content of that section will not be included.
A model of the DTD type can be assigned to data elements of ARIS Method. The data elements include:
Cluster/Data model
Package
Entity type
Relationship type
Technical term

METHOD MANUAL
59
4.2.1.6 Material flow modeling - Material diagram To illustrate the material flow in process models (EPC (material flow), PCD (material flow)), material types are allocated to individual functions of the business process in the form of function input or output. Similar to the allocation of information objects to functions (representation of information transformation by functions), this allocation represents the transformation of input material types to output material types.
In the material diagram, you can define material types, arrange them in a hierarchy, and assign them to material classes.
A material type typifies individual materials with identical material properties.
Similar material types can be combined to form a material class. The similarity can be based on different classification criteria. Thus, a material type can be assigned to multiple material classes.
Material types can be assigned to packaging material types. This indicates that certain material types can only be transported in specific packaging material types.
Packaging material types can also be arranged in hierarchies and classified. This enables the structure and restrictions of complex bulk packaging to be illustrated, for example.
A packaging material type typifies individual packaging materials with identical properties (for example, material properties).
Similar packaging material types can be combined to form a packaging material class. The similarity can be based on different classification criteria. Thus, a packaging material type can be assigned to multiple packaging material classes.
The following figure illustrates an example of a materials diagram with its hierarchy levels and classifications.
Figure 56: Example of a material diagram
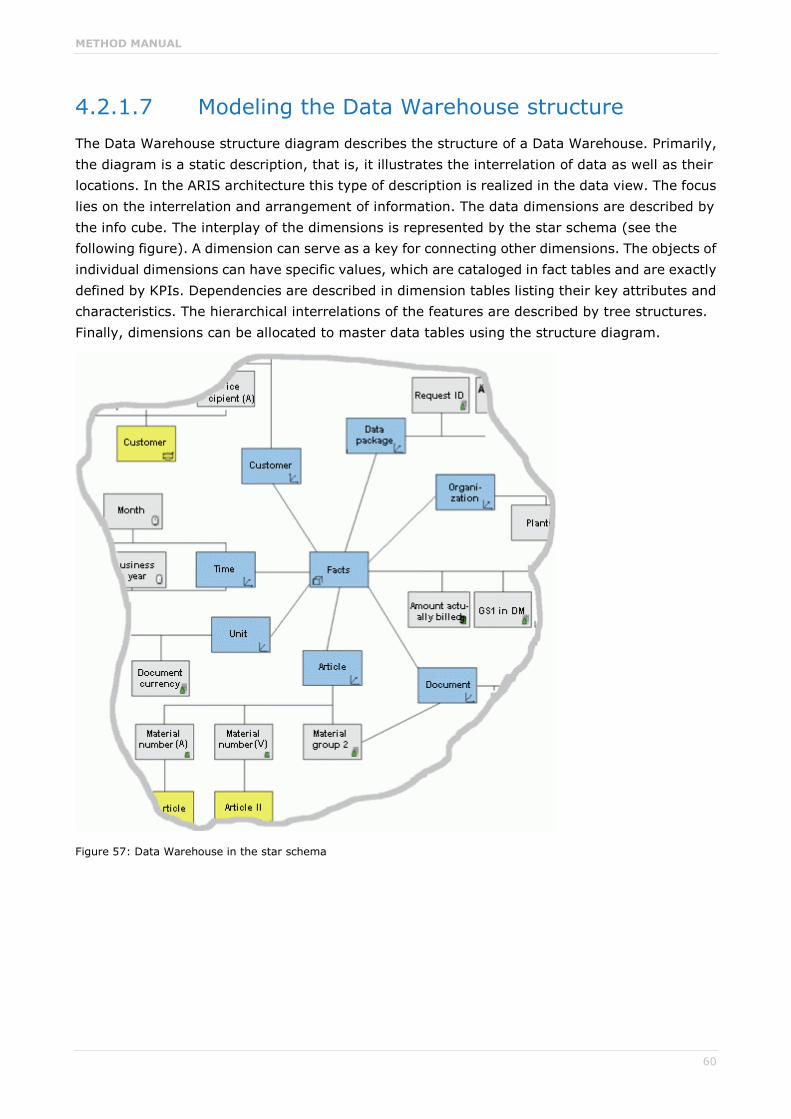
METHOD MANUAL
60
4.2.1.7 Modeling the Data Warehouse structure The Data Warehouse structure diagram describes the structure of a Data Warehouse. Primarily, the diagram is a static description, that is, it illustrates the interrelation of data as well as their locations. In the ARIS architecture this type of description is realized in the data view. The focus lies on the interrelation and arrangement of information. The data dimensions are described by the info cube. The interplay of the dimensions is represented by the star schema (see the following figure). A dimension can serve as a key for connecting other dimensions. The objects of individual dimensions can have specific values, which are cataloged in fact tables and are exactly defined by KPIs. Dependencies are described in dimension tables listing their key attributes and characteristics. The hierarchical interrelations of the features are described by tree structures. Finally, dimensions can be allocated to master data tables using the structure diagram.
Figure 57: Data Warehouse in the star schema

METHOD MANUAL
61
4.2.1.8 Authorization hierarchy The authorization hierarchy diagram is used in role modeling and organizational modeling. It illustrates the relationships of authorizations that were defined in the role diagram. Superior and subordinate authorizations are defined to ensure a logical structure and avoid authorization conflicts.
The authorization hierarchy diagram is closely associated with the role diagram. The authorizations listed are used in the role description to define the requirements profile. The structure corresponds to that of a function tree.
Figure 58: Authorization hierarchy

METHOD MANUAL
62
4.2.1.9 Process cost management data models
4.2.1.9.1 CD diagram The CD diagram (cost driver diagram) is used in process cost management (for example, with ARIS Optimizer). The CD diagram represents the cost driver hierarchy.
A cost driver is an informative indicator or reference value for estimating the costs of a specific process. The reference value should be an operational value that can be easily derived from available information sources and is proportional to accruing costs.
Therefore, cost drivers can be defined only for performance amount-variable or performance amount-induced processes. Cost drivers cannot be defined for performance amount-neutral processes, for example, Manage department. An example of a cost driver is Length of a street for the Blacktopping a street process.
The hierarchy of cost drivers is represented in the CD diagram by directed connections of the determines volume of type. The CD ratio numerator and CD ratio denominator attributes must be specified for these connections. If CD ratio denominator is not specified, a value of 1 is assumed. The quotient of these two attributes determines the quantity ratio between the two cost drivers for process calculation.
The example in the following figure shows two cost drivers: Number of cars (limousines) and Number of doors. To show that each limousine has four doors, the CD ratio numerator attribute must be set to 4 at the connection linking the Number of cars (limousines) cost driver with the Number of doors cost driver.
Figure 59: Example of a CD diagram
The cost drivers are allocated to individual processes in the process view tables. The usage factor for each function in the processes can be determined automatically via the cost driver hierarchy.
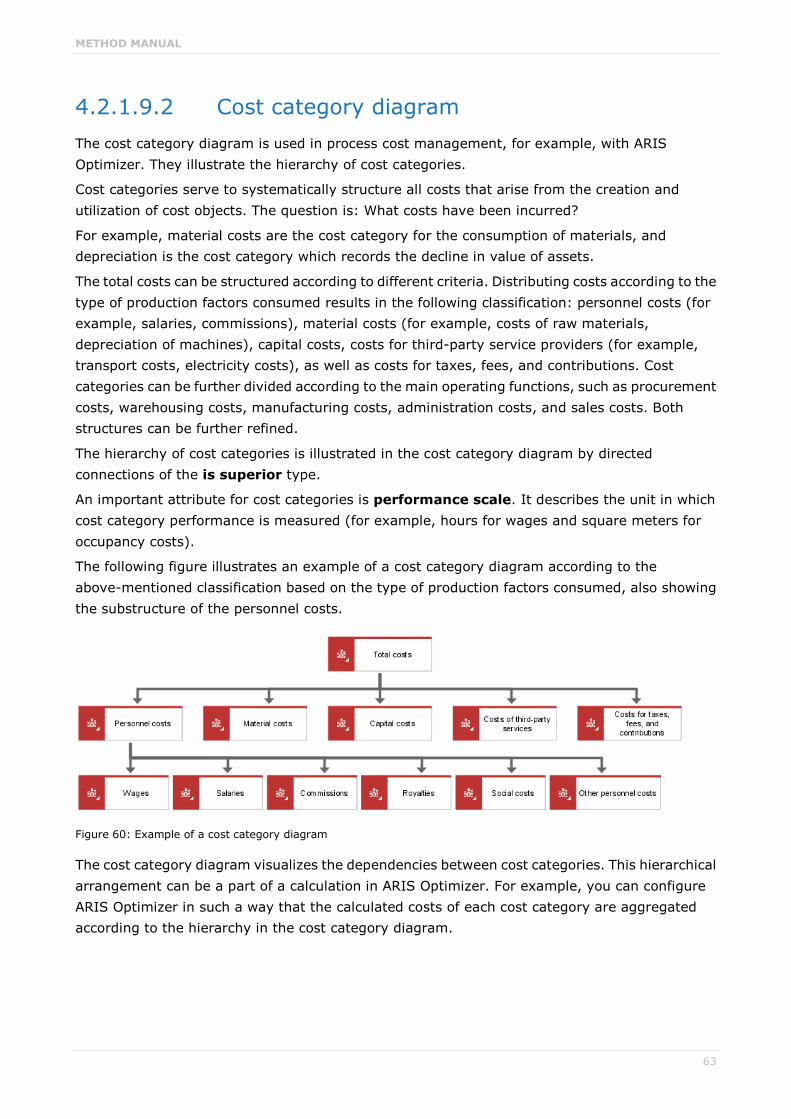
METHOD MANUAL
63
4.2.1.9.2 Cost category diagram The cost category diagram is used in process cost management, for example, with ARIS Optimizer. They illustrate the hierarchy of cost categories.
Cost categories serve to systematically structure all costs that arise from the creation and utilization of cost objects. The question is: What costs have been incurred?
For example, material costs are the cost category for the consumption of materials, and depreciation is the cost category which records the decline in value of assets.
The total costs can be structured according to different criteria. Distributing costs according to the type of production factors consumed results in the following classification: personnel costs (for example, salaries, commissions), material costs (for example, costs of raw materials, depreciation of machines), capital costs, costs for third-party service providers (for example, transport costs, electricity costs), as well as costs for taxes, fees, and contributions. Cost categories can be further divided according to the main operating functions, such as procurement costs, warehousing costs, manufacturing costs, administration costs, and sales costs. Both structures can be further refined.
The hierarchy of cost categories is illustrated in the cost category diagram by directed connections of the is superior type.
An important attribute for cost categories is performance scale. It describes the unit in which cost category performance is measured (for example, hours for wages and square meters for occupancy costs).
The following figure illustrates an example of a cost category diagram according to the above-mentioned classification based on the type of production factors consumed, also showing the substructure of the personnel costs.
Figure 60: Example of a cost category diagram
The cost category diagram visualizes the dependencies between cost categories. This hierarchical arrangement can be a part of a calculation in ARIS Optimizer. For example, you can configure ARIS Optimizer in such a way that the calculated costs of each cost category are aggregated according to the hierarchy in the cost category diagram.

METHOD MANUAL
64
4.2.1.10 Project management data model
4.2.1.10.1 Information carrier diagram The information carrier diagram is an optional component for project management with ARIS Architect. It belongs to the requirements definition of the data view and is used to record incoming and outgoing data, such as documents, logs, or ARIS models.
ARIS models can be assigned to a cluster in a PPC (project process chain, see requirements definition of the process view). This way, a preliminary specification of the cluster data can be realized. The required documents (for example, word processing files) can be displayed explicitly and accessed from within ARIS Architect via the Link 1 to Link 4 attributes.
Figure 61: Information carrier diagram

METHOD MANUAL
65
4.2.2 Design specification
4.2.2.1 Relations diagram and Attribute allocation diagram
In the design specification, the logical data structures designed in the requirements definition are transformed into a form of description that concrete database systems can be based on. ARIS provides the relations diagram for this purpose.
The relations diagram and the attribute allocation diagram are available to define existing relations and attributes including their relationships to the information objects introduced in the requirements definition.
In a first step, the required relations are defined in the relations diagram.
A relation describes an entity type through its attributes. A relation is a subset of possible value range combinations of individual attributes.
Relations are shown in graphical form as follows:
Figure 62: Graphical representation of the relation
Every eERM entity type now constitutes a relation in the relations diagram. When realizing relationship types of an eERM, the cardinality is a very important factor in deciding whether or not to create a separate relation for the relationship type. Unlike 1:n relations, n:m relations must be represented in separate relations.
In a second step, the relations diagram can indicate for each relation which entity type or relationship type of the eERM it represents.

METHOD MANUAL
66
A relation can be specified in more detail by listing its attributes. Whether the corresponding attribute serves as a key attribute, foreign key attribute, or descriptive attribute may be defined by specifying the relevant connection when linking the relation and the attribute. Also, the relationship of every single attribute to the ERM attribute of the requirements definition it illustrates can be established.
Figure 63: Allocation of the requirements definition attributes and data objects
To reduce representation complexity, the attributes of every relation can be defined in an attribute allocation diagram that is linked to the relation. An example is shown in the following figure.
Figure 64: Attribute allocation diagram
Cluster/Data models of the requirements definition are realized in the design specification by a separate object type called View. Based on the definition of Cluster/Data models, View is defined as follows:
A View is the logical view of multiple relations.

METHOD MANUAL
67
Assignments of relations to a View can also be shown in a relations diagram.
Figure 65: Definition of a view
1:n relationships of the ERM are not represented by separate relations in the relations diagram. The relationship is illustrated by integrating the key attribute of the superior entity type into the relation of the subordinate entity type. In this process, the original key attribute becomes the relation's foreign key.
A connection can be used in the relations diagram to show which attribute of the relations diagram illustrates the ERM's relationship type.
Figure 66: Allocation of ERM relationship type to attribute
A list of object and relationship types that are available in a relations diagram is provided in the ARIS Method Reference manual on your installation media.
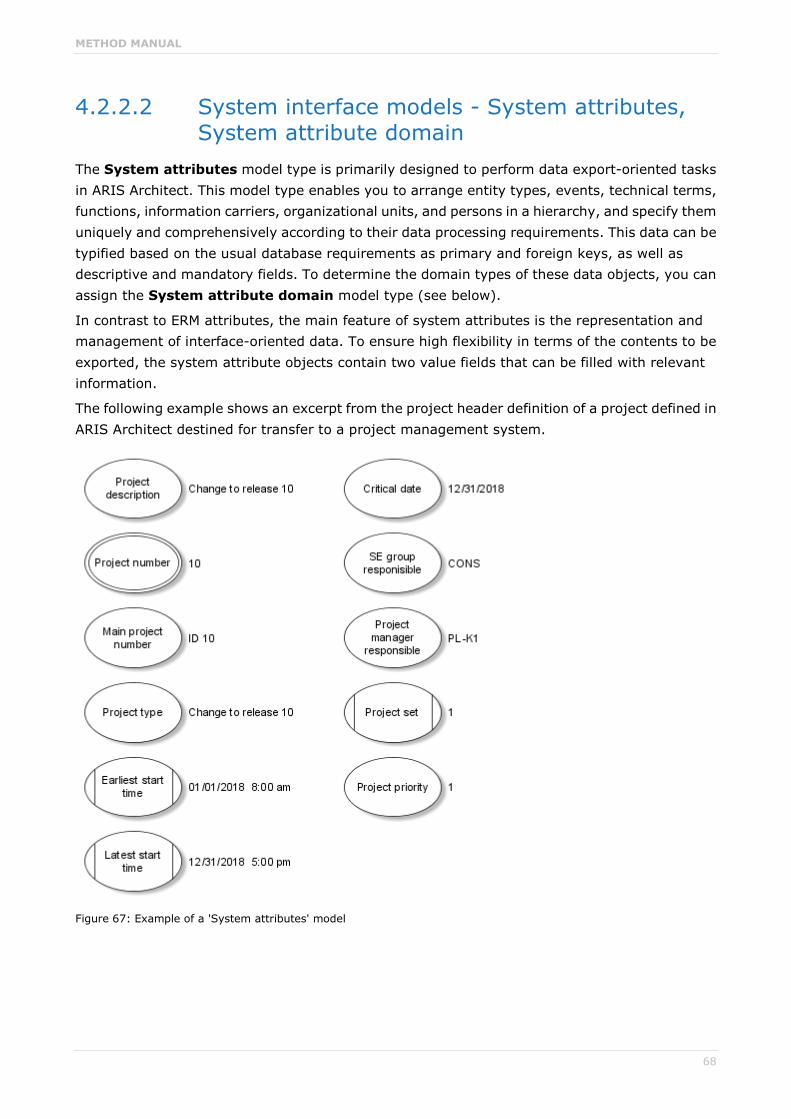
METHOD MANUAL
68
4.2.2.2 System interface models - System attributes, System attribute domain
The System attributes model type is primarily designed to perform data export-oriented tasks in ARIS Architect. This model type enables you to arrange entity types, events, technical terms, functions, information carriers, organizational units, and persons in a hierarchy, and specify them uniquely and comprehensively according to their data processing requirements. This data can be typified based on the usual database requirements as primary and foreign keys, as well as descriptive and mandatory fields. To determine the domain types of these data objects, you can assign the System attribute domain model type (see below).
In contrast to ERM attributes, the main feature of system attributes is the representation and management of interface-oriented data. To ensure high flexibility in terms of the contents to be exported, the system attribute objects contain two value fields that can be filled with relevant information.
The following example shows an excerpt from the project header definition of a project defined in ARIS Architect destined for transfer to a project management system.
Figure 67: Example of a 'System attributes' model

METHOD MANUAL
69
The System attribute domain model type is used to define the system attribute objects based on the data type; it specifies the domain type (char, int, date, etc.) and field length, for example. It is mainly used to provide information when data is exported to external systems.
Figure 68: System attribute domain

METHOD MANUAL
70
4.2.3 Implementation - Table diagram The table diagram is used to describe the tables and fields of a database system. The following figure shows a graphical representation of tables and fields.
Figure 69: Graphical representation of table and field
The individual fields assigned to this table can be shown for each table. For further specification, a sorting index and the domain can be assigned to each field. The following figure illustrates an example.
Figure 70: Field allocations
As relations of a relations diagram are not necessarily converted into tables and fields on a 1:1 basis (for example, for reasons of database performance), multilateral relationships between tables and relations or entity types may occur. These relationships can be illustrated in the table diagram by selecting the relevant connections. The Cluster/Data models defined in the requirements definition or the views defined in the relations diagram are represented in the table diagram by the View (physical) object.
Due to the fact that converting or documenting database tables and fields used in a company does not necessarily require the definition of a relational schema, both the realization relationships between relations (or attributes) and tables (or fields) and between entity types (or ERM attributes) and tables (or fields) can be represented.
The representation may focus either on the relations and attributes realized by the tables and fields, or - leaving out the relational definitions – on the entity types, relationship types, and ERM
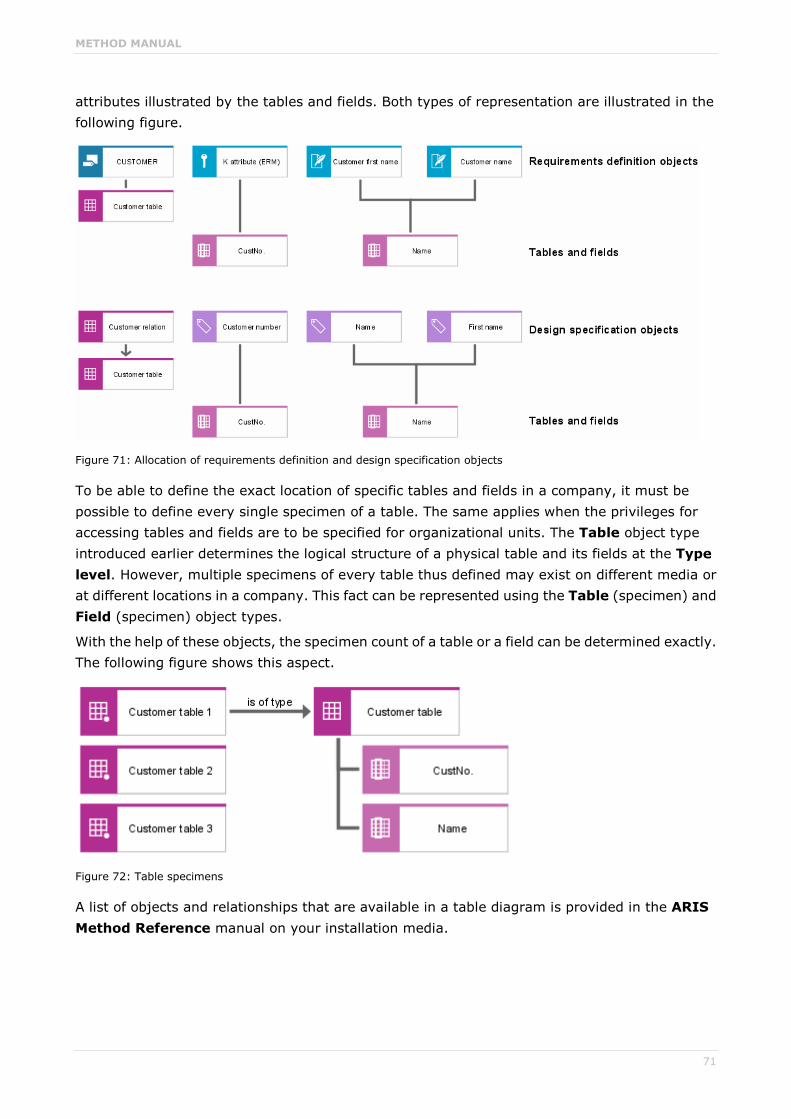
METHOD MANUAL
71
attributes illustrated by the tables and fields. Both types of representation are illustrated in the following figure.
Figure 71: Allocation of requirements definition and design specification objects
To be able to define the exact location of specific tables and fields in a company, it must be possible to define every single specimen of a table. The same applies when the privileges for accessing tables and fields are to be specified for organizational units. The Table object type introduced earlier determines the logical structure of a physical table and its fields at the Type level. However, multiple specimens of every table thus defined may exist on different media or at different locations in a company. This fact can be represented using the Table (specimen) and Field (specimen) object types.
With the help of these objects, the specimen count of a table or a field can be determined exactly. The following figure shows this aspect.
Figure 72: Table specimens
A list of objects and relationships that are available in a table diagram is provided in the ARIS Method Reference manual on your installation media.

METHOD MANUAL
72
4.3 Organization view
4.3.1 Requirements definition
4.3.1.1 Organizational structure of companies Companies are complex social structures that are divided into manageable units. To deal with the given complexity, patterns are defined and rules established. The result of this process is called organization. Until recently, the role of organizational considerations as an aspect of developing information systems has rarely been the object of research. But newer business concepts, such as Lean Production, Lean Management, or CIM are closely allied with the organizational setup of the area of consideration. For this reason, the ARIS concept provides an independent descriptive view on organization.
In a company's organizational design, a distinction can be made between the organizational structure and the process organization.
The organizational structure encompasses the rules by which the company is statically structured. The process organization contains the rules relating to the tasks to be performed by the company. This task-related structure in the sense of distributing functions to task performers is dealt with in the control view of the ARIS house. The organization view basically looks at a company's organizational structure.
The design of an ideal company organization with the aim of reducing coordination efforts to a minimum depends on the company's business environment and objectives. Therefore, it is not possible to define universally valid ideal organizational structures that may serve as reference structures.
The structure of organizational units depends on various criteria.
A very common criterion is the functional structure. One company function (procurement, production, finance and accounting, sales) is given responsibility for all products and sectors. The advantage of this approach lies in a high level of staff specialization, but it also entails a multiplication of efforts concerning communication and coordination between the functional areas.
Both the design and use of information systems had their focus on this functional breakdown of companies for a long time. However, looking at integrated process chains in the sense of cohesive processing of similar data objects makes it difficult to establish interrelationships between individual functions for such a structural design.
For this reason, the discussion of integrated data processing resulted in the demand for a consistent base of data aimed to support the various functions. However, the intended integration of functions counteracts the desired effect of reducing complexity via the functional structure.
Hence, when dealing with the aim of achieving functional integration, other criteria of organizational breakdown are frequently applied.
For example, the breakdown may focus on criteria such as sectors or products. The following figure shows a breakdown by product (see Scheer, Business Process Engineering, 1994, p. 26 et sqq.).

METHOD MANUAL
73
In a sector-based organizational structure the organizational units are specified in accordance with the local distribution of the company or corporate division. This kind of structure is particularly suitable for sales functions because regional factors such as varying legislation can be dealt with more appropriately.
Figure 73: Organizational breakdown by product
A product-based organizational structure defines organizational units for products or product groups. Within a product group, a maximum number of functions that are relevant for this particular product group are integrated. The aim of this procedure is to reduce the communication effort that functional structures entail. However, this results in the necessity of information exchange between the product group-based subsystems.
To counteract these effects, hybrid organizational forms are often created. The following figure illustrates this with an example of Purchasing (see Scheer, Business Process Engineering, 1994, p. 26 et sqq.).
Figure 74: Hybrid organizational forms
Using a purely functional structure would imply that a central purchasing department was responsible for all product groups. In this case, synergy effects between the product groups may be exploited, but major coordination problems would arise from carrying out a purchasing procedure across all subfunctions. When the purchasing functions are split up according to the various product groups, individual purchasing departments must be established for every product group to carry out all purchasing functions. When selecting suppliers or negotiating framework contracts, for example, synergy effects may only be obtained at the expense of high coordination efforts.
In the breakdown illustrated in the above figure, those purchasing functions for which high synergy effects are expected are broken down functionally, that is, they are carried out by a central purchasing department. Functions that must comply with specific requirements and restrictions stipulated by individual product groups are divided by product group in an object-oriented approach. These functions can thus be integrated in the process flow of the

METHOD MANUAL
74
individual product groups immediately. This means that the operational handling of processes takes place in decentralized units, while the relationships among the decentralized units are dealt with at the superior, central coordination level.
These flexible organizational forms are given special emphasis in the ARIS concept due to their strongly process-oriented approach. The formation of organizational structures to which various breakdown criteria are applied at the same time is a claim put forward especially by accounting-based approaches, such as the profit center concept.
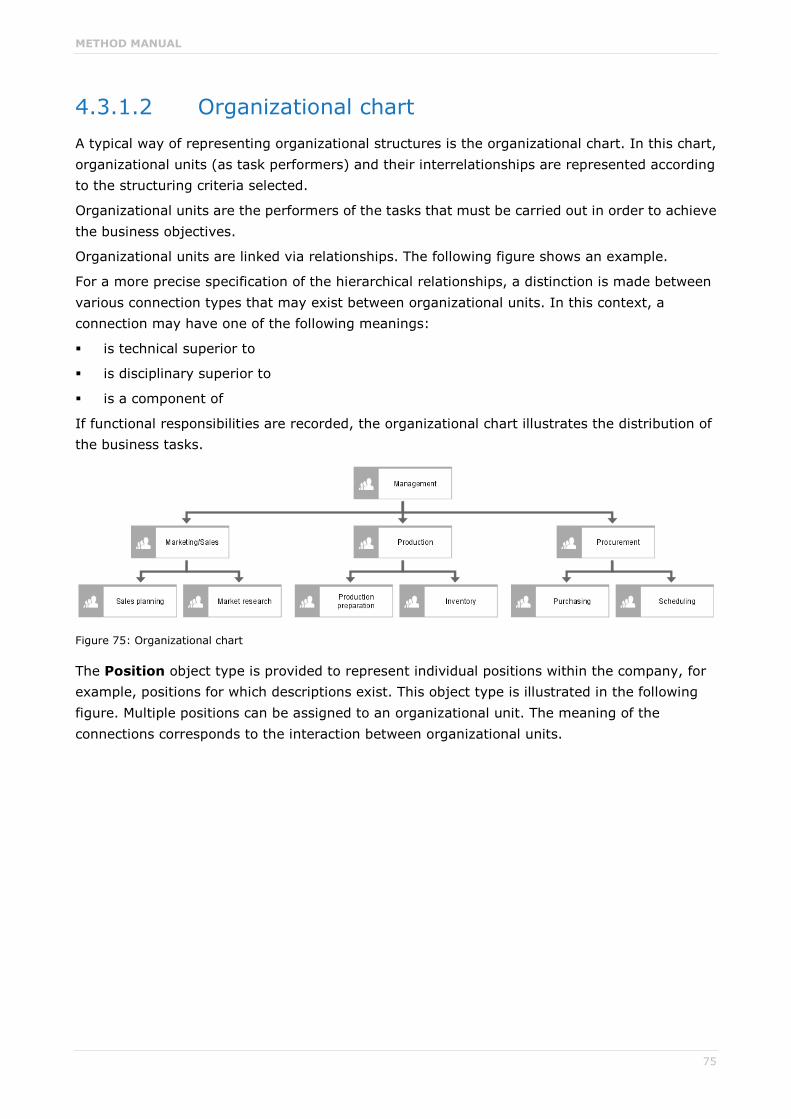
METHOD MANUAL
75
4.3.1.2 Organizational chart A typical way of representing organizational structures is the organizational chart. In this chart, organizational units (as task performers) and their interrelationships are represented according to the structuring criteria selected.
Organizational units are the performers of the tasks that must be carried out in order to achieve the business objectives.
Organizational units are linked via relationships. The following figure shows an example.
For a more precise specification of the hierarchical relationships, a distinction is made between various connection types that may exist between organizational units. In this context, a connection may have one of the following meanings:
is technical superior to
is disciplinary superior to
is a component of
If functional responsibilities are recorded, the organizational chart illustrates the distribution of the business tasks.
Figure 75: Organizational chart
The Position object type is provided to represent individual positions within the company, for example, positions for which descriptions exist. This object type is illustrated in the following figure. Multiple positions can be assigned to an organizational unit. The meaning of the connections corresponds to the interaction between organizational units.
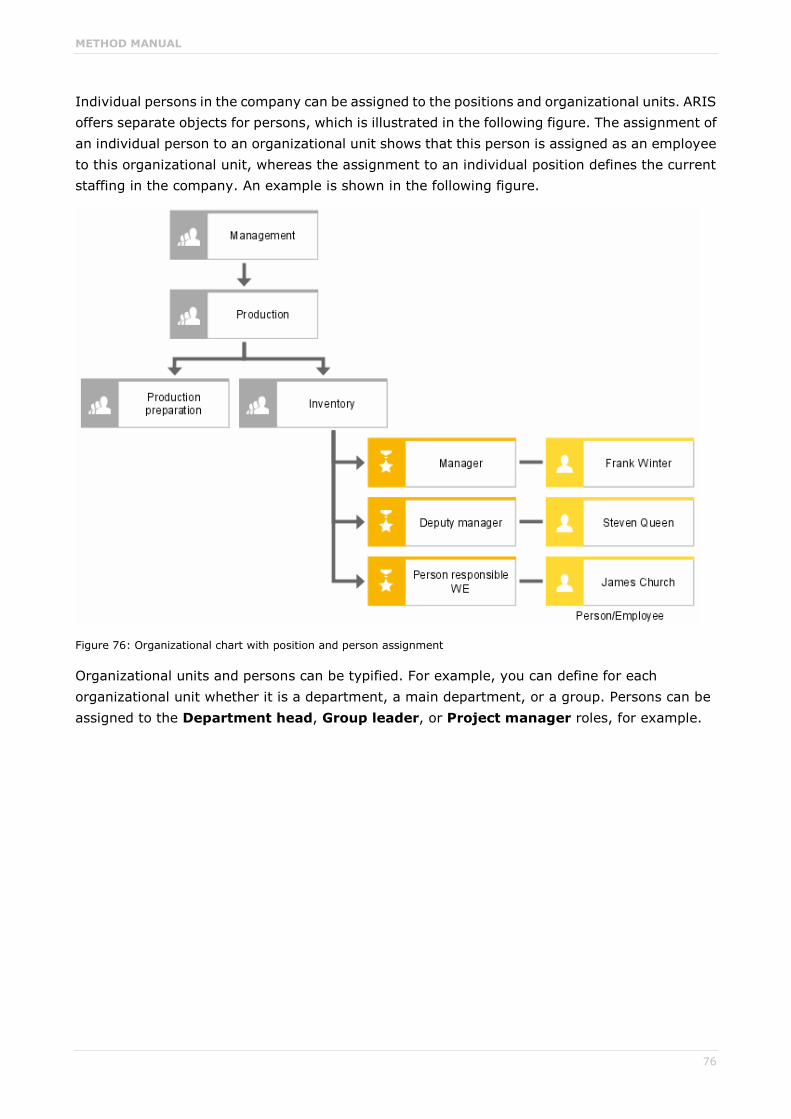
METHOD MANUAL
76
Individual persons in the company can be assigned to the positions and organizational units. ARIS offers separate objects for persons, which is illustrated in the following figure. The assignment of an individual person to an organizational unit shows that this person is assigned as an employee to this organizational unit, whereas the assignment to an individual position defines the current staffing in the company. An example is shown in the following figure.
Figure 76: Organizational chart with position and person assignment
Organizational units and persons can be typified. For example, you can define for each organizational unit whether it is a department, a main department, or a group. Persons can be assigned to the Department head, Group leader, or Project manager roles, for example.
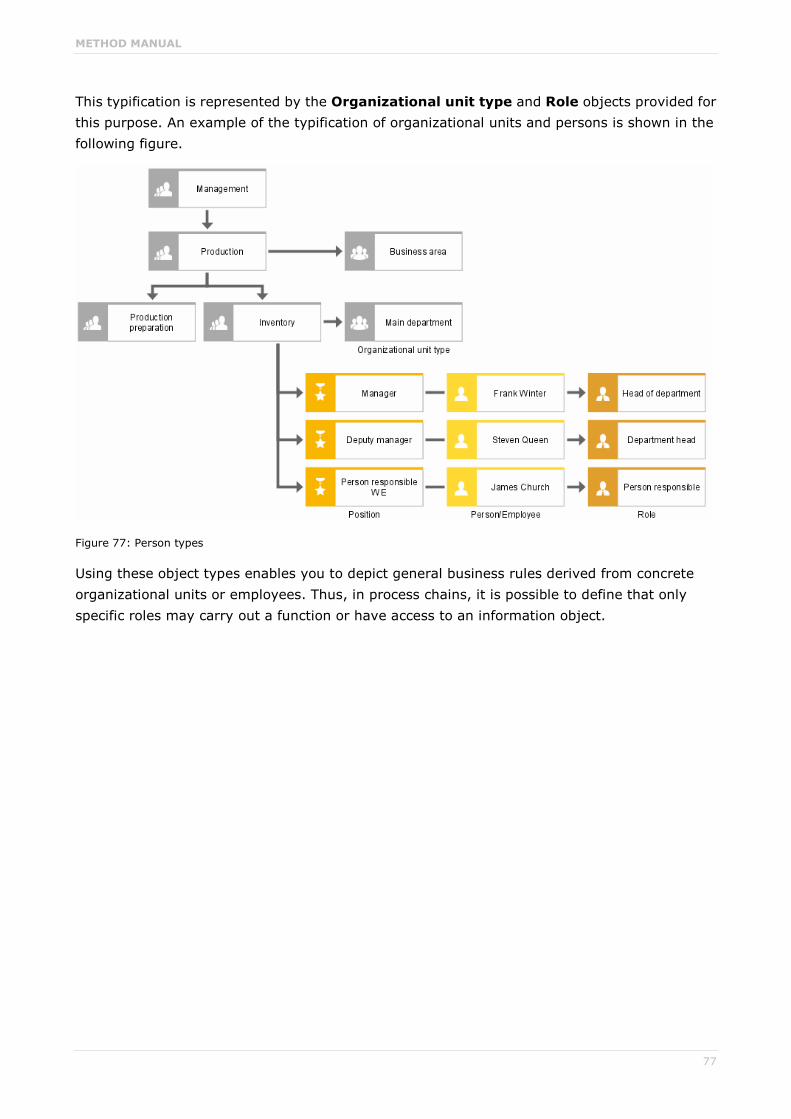
METHOD MANUAL
77
This typification is represented by the Organizational unit type and Role objects provided for this purpose. An example of the typification of organizational units and persons is shown in the following figure.
Figure 77: Person types
Using these object types enables you to depict general business rules derived from concrete organizational units or employees. Thus, in process chains, it is possible to define that only specific roles may carry out a function or have access to an information object.
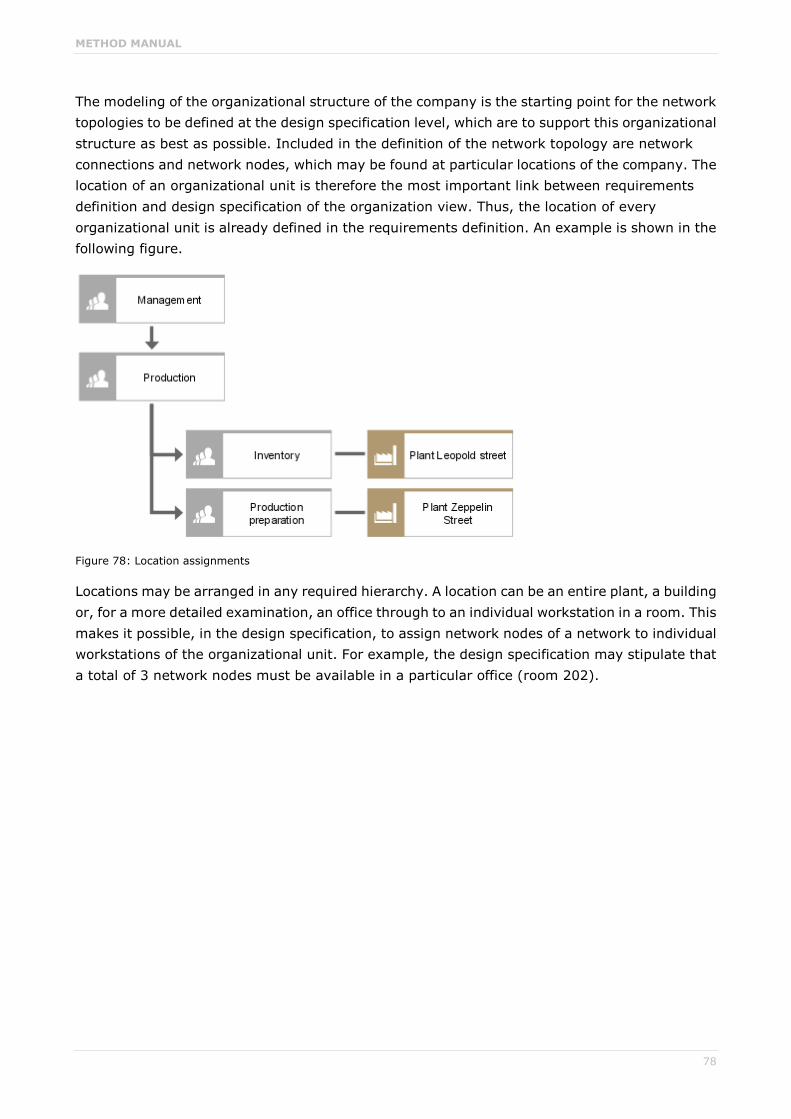
METHOD MANUAL
78
The modeling of the organizational structure of the company is the starting point for the network topologies to be defined at the design specification level, which are to support this organizational structure as best as possible. Included in the definition of the network topology are network connections and network nodes, which may be found at particular locations of the company. The location of an organizational unit is therefore the most important link between requirements definition and design specification of the organization view. Thus, the location of every organizational unit is already defined in the requirements definition. An example is shown in the following figure.
Figure 78: Location assignments
Locations may be arranged in any required hierarchy. A location can be an entire plant, a building or, for a more detailed examination, an office through to an individual workstation in a room. This makes it possible, in the design specification, to assign network nodes of a network to individual workstations of the organizational unit. For example, the design specification may stipulate that a total of 3 network nodes must be available in a particular office (room 202).

METHOD MANUAL
79
The following figure shows an example of a location hierarchy.
Figure 79: Location hierarchies
METHOD MANUAL
80
4.3.1.3 Shift calendar Shift calendars can be assigned to human and technical resources to specify when a resource is available.
Organizational charts or EPCs are the appropriate models for assigning shift calendars to resources. Shift calendars can be assigned to any human or technical resource. In a hierarchy of human resources, the relevant calendar is always the one located on the lowest hierarchy level.
A shift calendar is a multi-level object model. The lowest level provides objects of the Break type. A break is the daily time interval within a shift during which no work is performed. The break is defined by its relative start and its duration. The relative start always relates to the shift to which the break is assigned. For example, if the shift begins at 8:00 a.m. and the break has a relative start of 2 hours, the break begins at 10:00 a.m.
The next hierarchy level contains objects of the Shift type. A shift is the daily time interval during which work is performed. The shift is defined by its relative shift start and its duration. A shift may have more than one break. The relative start times of breaks must lie within the shift times.
Typical examples of shifts are the early, midday, night, and day shifts. Each shift is repeated every 24 hours. A shift cycle is the weekly or multi-day time interval during which work is performed. The shift cycle thus determines the days on which a certain shift is run or is not run. The shift cycle is defined by its relative cycle start and cycle duration. The requirement that a shift cycle be continuously repeated can be defined using the Repeat in cycles attribute. In addition, the Period attribute determines how often a cycle is repeated.
Shift cycles frequently cover a period of one or two weeks. An employee can thus have an early shift one week and a midday shift the next. This sequence can be constantly repeated using shift cycles.
Example
In line with the example above, two shift cycles can be defined:
Early shift shift cycle:
Relative cycle start = 0
Cycle duration = 5 days
Repeat in cycles = yes
Period = 14 days
Midday shift shift cycle:
Relative cycle start = 7 days
Cycle duration = 5 days
Repeat in cycles = yes
Period = 14 days
The individual shifts are repeated in a 14-day rhythm, that is, the periodicity is 2 weeks. If the same employee were to work an early shift on Saturdays every four weeks, the third shift cycle could be defined as follows:
Early shift shift cycle:
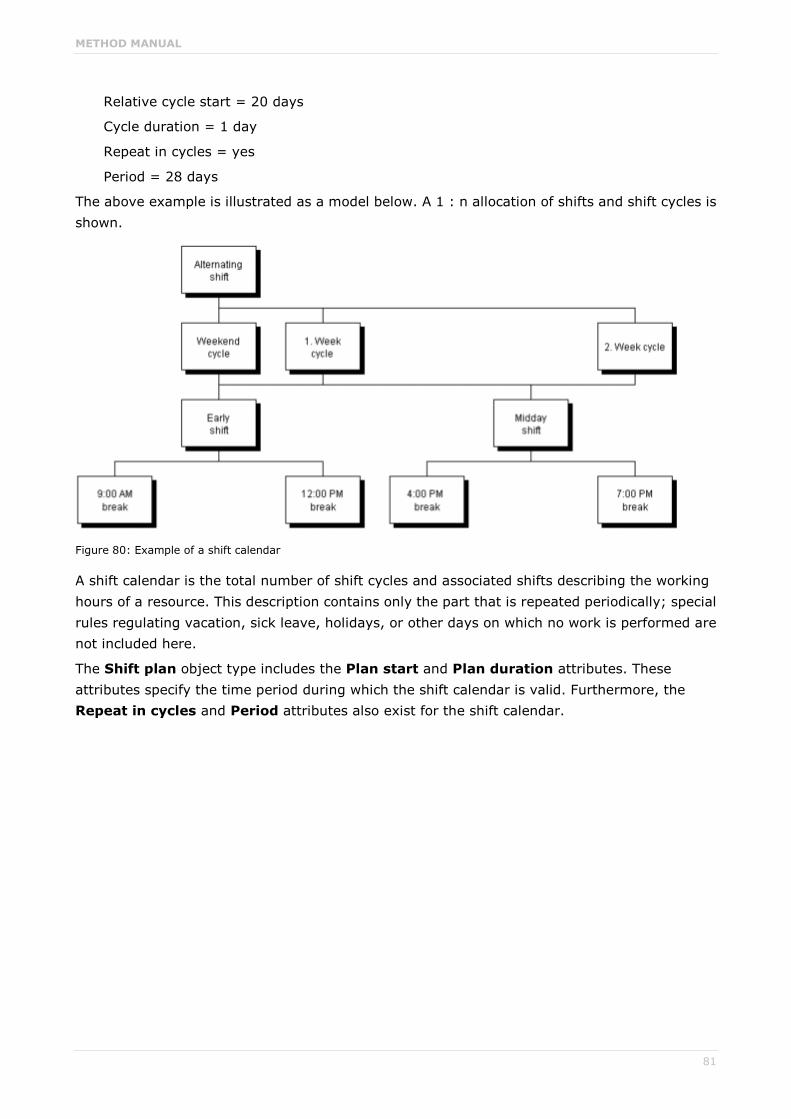
METHOD MANUAL
81
Relative cycle start = 20 days
Cycle duration = 1 day
Repeat in cycles = yes
Period = 28 days
The above example is illustrated as a model below. A 1 : n allocation of shifts and shift cycles is shown.
Figure 80: Example of a shift calendar
A shift calendar is the total number of shift cycles and associated shifts describing the working hours of a resource. This description contains only the part that is repeated periodically; special rules regulating vacation, sick leave, holidays, or other days on which no work is performed are not included here.
The Shift plan object type includes the Plan start and Plan duration attributes. These attributes specify the time period during which the shift calendar is valid. Furthermore, the Repeat in cycles and Period attributes also exist for the shift calendar.
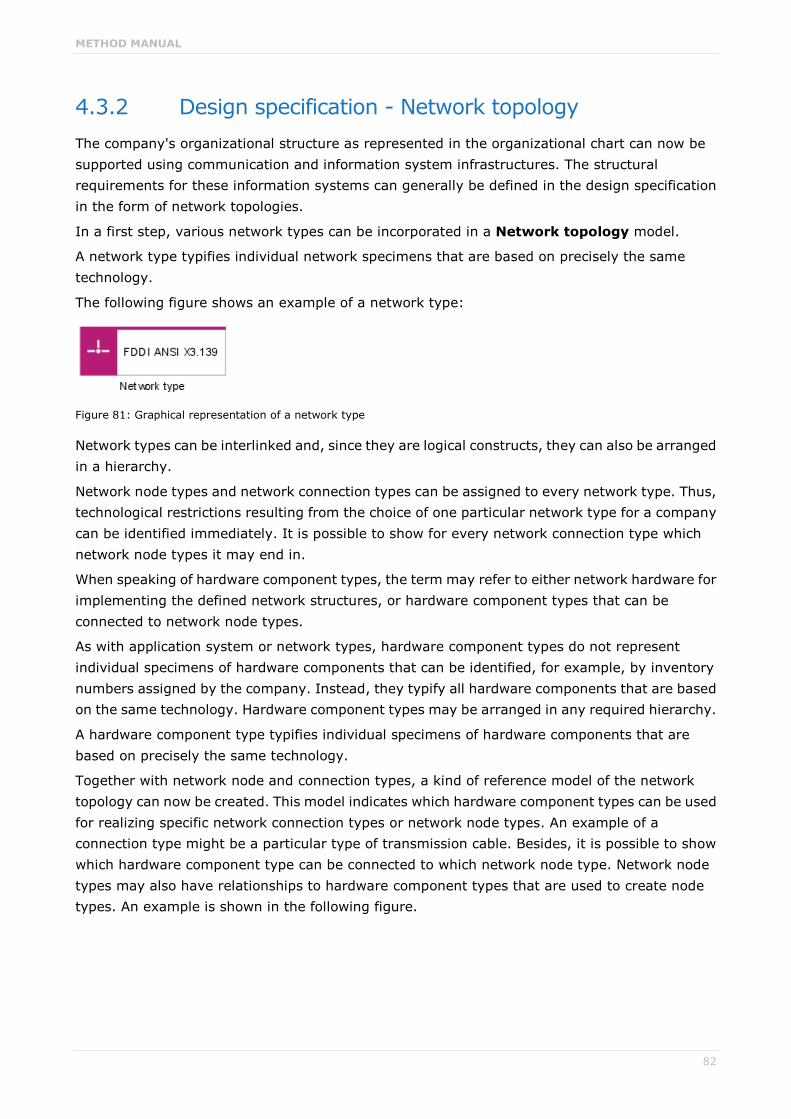
METHOD MANUAL
82
4.3.2 Design specification - Network topology The company's organizational structure as represented in the organizational chart can now be supported using communication and information system infrastructures. The structural requirements for these information systems can generally be defined in the design specification in the form of network topologies.
In a first step, various network types can be incorporated in a Network topology model.
A network type typifies individual network specimens that are based on precisely the same technology.
The following figure shows an example of a network type:
Figure 81: Graphical representation of a network type
Network types can be interlinked and, since they are logical constructs, they can also be arranged in a hierarchy.
Network node types and network connection types can be assigned to every network type. Thus, technological restrictions resulting from the choice of one particular network type for a company can be identified immediately. It is possible to show for every network connection type which network node types it may end in.
When speaking of hardware component types, the term may refer to either network hardware for implementing the defined network structures, or hardware component types that can be connected to network node types.
As with application system or network types, hardware component types do not represent individual specimens of hardware components that can be identified, for example, by inventory numbers assigned by the company. Instead, they typify all hardware components that are based on the same technology. Hardware component types may be arranged in any required hierarchy.
A hardware component type typifies individual specimens of hardware components that are based on precisely the same technology.
Together with network node and connection types, a kind of reference model of the network topology can now be created. This model indicates which hardware component types can be used for realizing specific network connection types or network node types. An example of a connection type might be a particular type of transmission cable. Besides, it is possible to show which hardware component type can be connected to which network node type. Network node types may also have relationships to hardware component types that are used to create node types. An example is shown in the following figure.
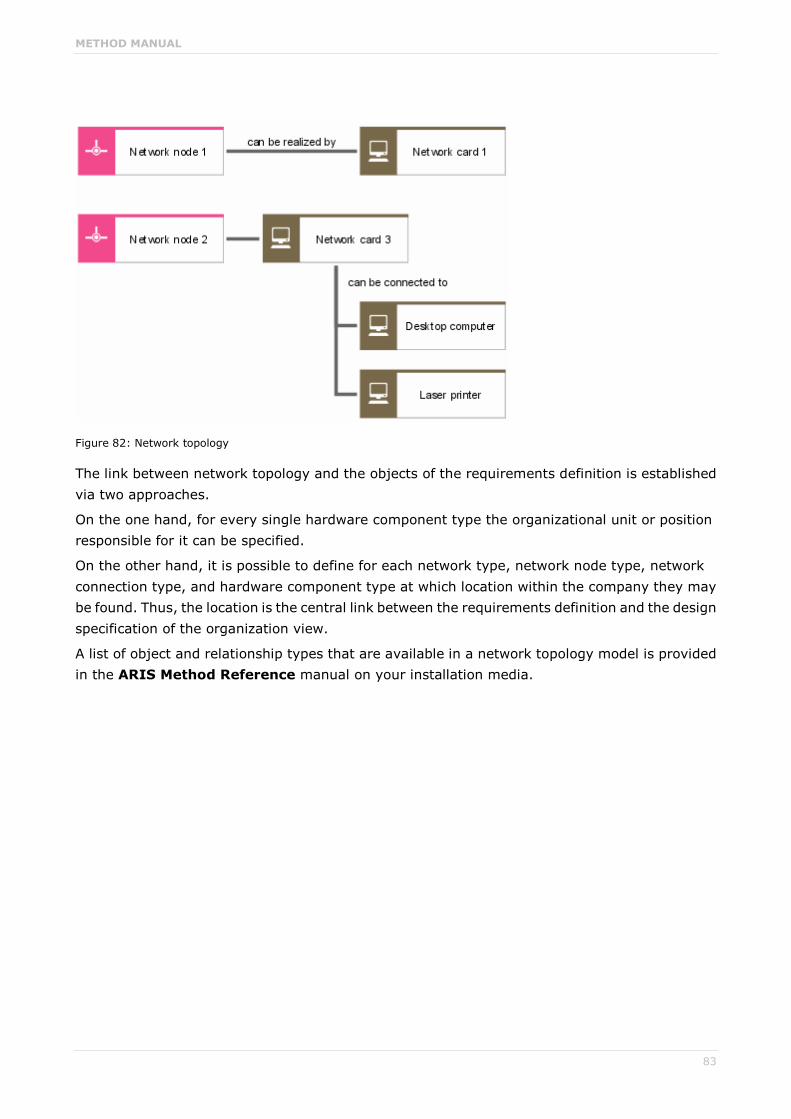
METHOD MANUAL
83
Figure 82: Network topology
The link between network topology and the objects of the requirements definition is established via two approaches.
On the one hand, for every single hardware component type the organizational unit or position responsible for it can be specified.
On the other hand, it is possible to define for each network type, network node type, network connection type, and hardware component type at which location within the company they may be found. Thus, the location is the central link between the requirements definition and the design specification of the organization view.
A list of object and relationship types that are available in a network topology model is provided in the ARIS Method Reference manual on your installation media.

METHOD MANUAL
84
4.3.3 Implementation
4.3.3.1 Network diagram The network diagram illustrates the realization of the network topology defined in the design specification.
The networks that exist in the company are recorded by means of the Network object. It is possible to specify for each network the network nodes and network connections it consists of.
The exact location of every network, network node, and network connection within the company can be indicated. A location can be an entire plant, a specific building, a complex of buildings, an office, or an individual workstation.
Figure 83: Network diagram with location assignment

METHOD MANUAL
85
The network diagram also records the hardware components used to realize each network connection and network node. Besides, it is possible to illustrate the structure of every single hardware component. On the one hand, hardware components are used to form network connections and network nodes; on the other hand, they can be connected to network nodes. This relationship can be represented in the network diagram, as well. For every object of the specimen level, the relationship to the corresponding object of the design specification level can be modeled. This way it is possible to express, for example, that the network in the Port St. plant is of the FDDI ANSI X3.139 type.
Figure 84: Network diagram with hardware components and location assignment
Thus, the network diagram establishes the links to the design specification via type allocations, as well as the links to the requirements definition via the allocation of network components to specific locations.
A list of object and relationship types that are available in a network diagram is provided in the ARIS Method Reference manual on your installation media.

METHOD MANUAL
86
4.3.3.2 Material flow modeling - Technical resources To illustrate the material flow in process models (EPC (material flow), PCD (material flow)), material types are allocated to individual functions of the business process in the form of function input or output. Similar to the allocation of information objects to functions (representation of information transformation by functions), this allocation represents the transformation of input material types to output material types. Additionally, the technical resources required for transforming materials can be recorded in the process chains. In this context, a distinction is made between operating resources, warehouse equipment, transport systems, and technical operating supplies.
In the Technical resources model type you can arrange technical resources in a hierarchy, assign a type to them, and classify them. The following object types are available for this purpose:
OPERATING RESOURCE
Operating resources are specimens of various operating resource types that are available for a company to perform its tasks. Operating resources are often identified by inventory numbers (for example, number of a production plant).
OPERATING RESOURCE TYPE
An operating resource type typifies individual operating resources that are based on precisely the same technology.
OPERATING RESOURCE CLASS
Similar operating resource types can be combined to form an operating resource class. The similarity can be based on different classification criteria. Thus, an operating resource type can be assigned to multiple operating resource classes.
WAREHOUSE EQUIPMENT
Warehouse equipment items are specimens of various warehouse equipment types that are available for a company to perform its tasks. Warehouse equipment items are often identified by inventory numbers.
WAREHOUSE EQUIPMENT TYPE
A warehouse equipment type typifies individual warehouse equipment items that are based on precisely the same technology.
WAREHOUSE EQUIPMENT CLASS
Similar warehouse equipment types can be combined to form a warehouse equipment class. The similarity can be based on different classification criteria. Thus, a warehouse equipment type can be assigned to multiple warehouse equipment classes.
METHOD MANUAL
87
TECHNICAL OPERATING SUPPLY
A technical operating supply is an individual specimen of a technical operating supply type. In general, it can be identified by means of an inventory number.
TECHNICAL OPERATING SUPPLY TYPE
A technical operating supply type typifies individual technical operating supply items that are based on precisely the same technology.
TECHNICAL OPERATING SUPPLY CLASS
Similar technical operating supply types can be combined to form a technical operating supply class. The similarity can be based on different classification criteria. Thus, a technical operating supply type can be assigned to multiple technical operating supply classes.
TRANSPORT SYSTEM
A transport system is an individual specimen of a transport system type. In general, it can be identified by means of an inventory number or a plant number.
TRANSPORT SYSTEM TYPE
A transport system type typifies individual transport systems that are based on precisely the same technology.
TRANSPORT SYSTEM CLASS
Similar transport system types can be combined to form a transport system class. The similarity can be based on different classification criteria. Thus, a transport system type can be assigned to multiple transport system classes.
Due to the various possibilities of creating hierarchies in the Technical resources model type it is possible to describe the structure of complex technical installations. For example, the components of a complex production plant and their interrelationships can be illustrated this way.
In addition to the modeling options mentioned above, there is also the possibility of defining location allocations and organizational responsibilities for technical resources. To do this, the Location, Organizational unit, Group, Position, and Person object types which you already know from the Organizational chart model type are available. These object types can be linked to the Operating resource, Warehouse equipment, Technical operating supply, and Transport system object types.

METHOD MANUAL
88
An example of a Technical resources model type is shown in the following figure.
Figure 85: Example of a 'Technical resources' model

METHOD MANUAL
89
4.4 Process view
4.4.1 Requirements definition The relationships between the objects of the data, organization, and function views are analyzed in the control/process view. The relationships to be analyzed result from the connections between the views.
First, the relationships between two views are examined, then diagrams are introduced, illustrating the relationships between all three views.
4.4.1.1 Linking functions with organization - EPC, Function/Organizational level diagram
Linking the function view with the organization view serves to allocate the functions defined in the function tree to the task performers (organizational units) of the organizational chart. This allocation defines an organizational unit's responsibility and decision-making power with regard to its allocated functions. Looking at how these organizational allocations are realized in a process chain (business processes) enables you to identify the degree of functional integration, that is, the number of business process functions that are to be processed by an organizational unit.

METHOD MANUAL
90
The following figure shows an example of the allocation of organizational units to functions. In this figure, the function placed on the left is assigned the organizational unit responsible for its execution. The functions' superior or subordinate positions in the hierarchy are illustrated in the function view (function tree), and the relationships between the organizational units are shown in the organization view (organizational chart). Therefore, there is no need to define them at this point.
Figure 86: Allocation of organizational elements to functions

METHOD MANUAL
91
4.4.1.2 Linking functions with data
4.4.1.2.1 Event control - Event-driven process chain (EPC)
The operational sequence of functions in the sense of business processes is represented in process chains. The start and end events of every function can be specified. Not only do events trigger functions, they also represent results of functions.
An event describes the fact that an information object has taken on a business management-relevant state that controls or influences the progression of the business process. Events trigger functions and are the results of functions. Unlike a function, which is a time-consuming task, an event relates to one point in time.
The change in state of an information object may refer to the first occurrence of this information object (for example, Customer order received), or to a change in state in the sense of a change in status recorded in an attribute occurrence (for example, Offer is refused). Since information objects and attributes are described in the ARIS data view, the event-driven representation of process chains forms a link between the data view and the function view and is thus attributed to the ARIS control view.
Events are graphically represented as hexagons. The name should not only contain the information object itself (Order), but also its state change (received). The following figure illustrates events.
Figure 87: Events (graphical representation)
Events trigger functions and are the results of functions. By arranging events and functions in a sequence, so-called Event-driven process chains (EPCs) are created. An event-driven process chain (EPC) shows the chronological-logical operational sequence of a business process.
An example of an EPC is shown in the following figure. Since events determine which state or condition will trigger a function and which state will define the end of a function, the start and end nodes of such an EPC are always events. Multiple functions can originate from one event simultaneously, and a function can have multiple events as its result. A rule that is represented by a circle is used to illustrate branches and processing loops in an EPC. However, these connections
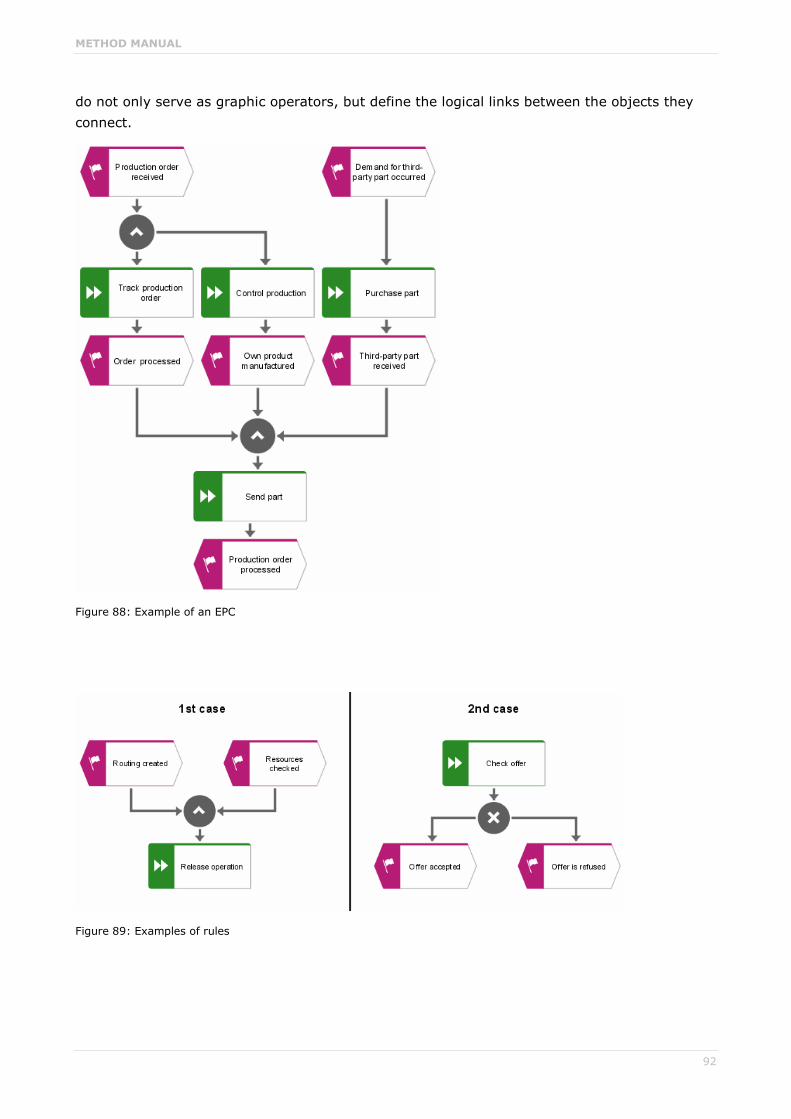
METHOD MANUAL
92
do not only serve as graphic operators, but define the logical links between the objects they connect.
Figure 88: Example of an EPC
Figure 89: Examples of rules

METHOD MANUAL
93
In the first example of this figure the start events are connected via an AND rule. This means that the Release operation procedure is started only if the routing and the required resources are available. Therefore, both events must have occurred before the procedure can begin. The second example shows an exclusive OR connection using an XOR rule. The Check supplier offer function may result in either acceptance or rejection of the quote. Both results, however, cannot occur at the same time. Besides these two cases and links of the 'inclusive OR' type, more complex relationships are possible. A general rule can be represented in an EPC, which is described in more detail in the form of a rule diagram.
Thus, two different types of operators exist:
1. event operators and
2. function operators.

METHOD MANUAL
94
An overview of all possible event and function operators is listed in the following figure (see Hoffmann, Kirsch, Scheer, 'Modellierung mit Ereignisgesteuerten Prozessketten' [Modeling with event-driven process chains], 1993, p. 13).
Figure 90: Logic operators (rules)

METHOD MANUAL
95
In this context, special attention must be paid to the restrictions which exist for function operators. Due to the fact that events cannot make decisions (only functions can do this), a triggering event must not be linked using an OR or XOR operator.
Below, possible operators are explained using examples.
LINKING TRIGGERING EVENTS
AND RULE
Figure 91: AND operator for triggering events
The function can be started only after all events have occurred.
OR RULE
Figure 92: OR operator for triggering events
The function is carried out after at least one of the events has occurred.

METHOD MANUAL
96
EXCLUSIVE OR RULE (XOR RULE)
Figure 93: XOR operator for triggering events
The function is started after no more than exactly one event has occurred.

METHOD MANUAL
97
LINKING CREATED EVENTS
AND RULE
Figure 94: AND operator for created events
All events will occur after function execution is complete.
OR RULE
Figure 95: OR operator for created events
At least one of the events will occur after function execution is complete.
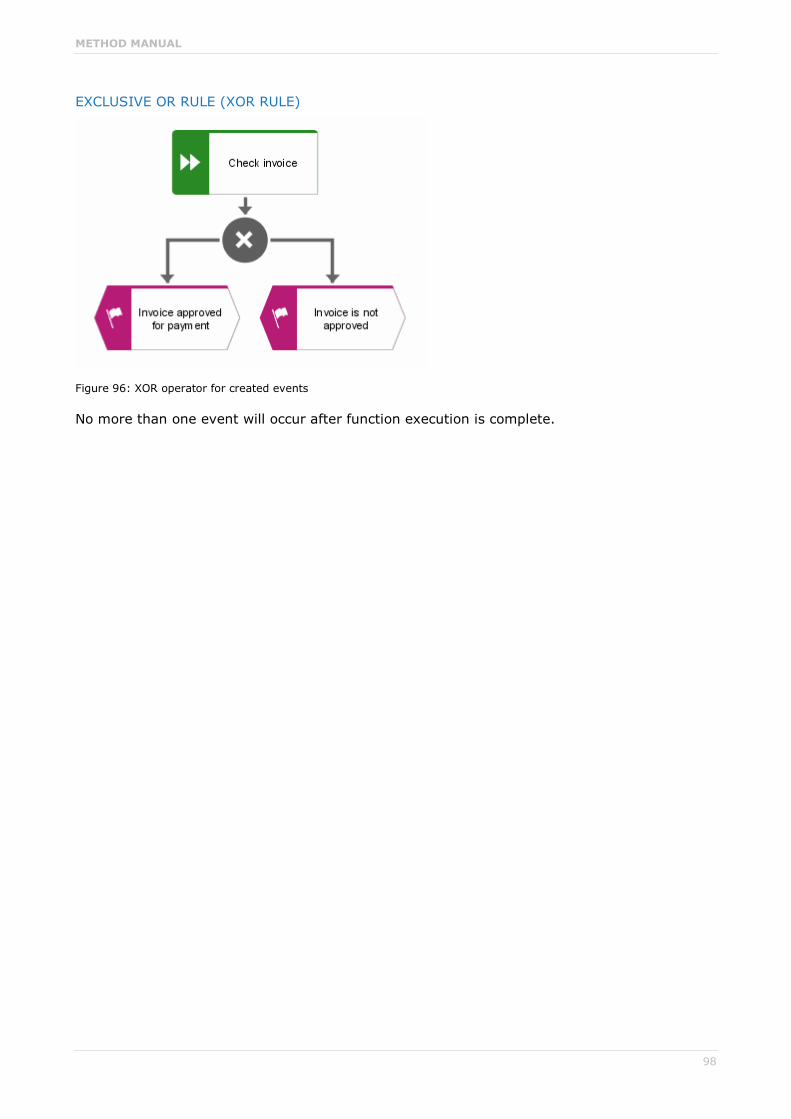
METHOD MANUAL
98
EXCLUSIVE OR RULE (XOR RULE)
Figure 96: XOR operator for created events
No more than one event will occur after function execution is complete.

METHOD MANUAL
99
LINKING FUNCTIONS WITH CREATED EVENTS
AND RULE
Figure 97: AND operator of functions with created events
The event occurs only after all functions have been carried out.
OR RULE
Figure 98: OR operator of functions with created events
The event occurs after at least one of the functions has been carried out.

METHOD MANUAL
100
EXCLUSIVE OR RULE (XOR RULE)
Figure 99: XOR operator of functions with created events
The event occurs after no more than exactly one function has been carried out.

METHOD MANUAL
101
LINKING FUNCTIONS WITH TRIGGERING EVENTS
AND RULE
Figure 100: AND operator of functions with triggering events
The event triggers all functions.
OR RULE
Events have no decision-making power. This operator is invalid.
EXCLUSIVE OR RULE (XOR RULE)
Events have no decision-making power. This operator is invalid.
Besides being illustrated in the form of event-driven process chains, these branches can also be represented in table form in the event and function columns of a process chain diagram (see chapter Process chain analysis (page 11)). Since functions are sorted sequentially in a process chain diagram, branches and processing loops can be represented only in a rather complex and thus confusing manner.
EPC: BPML EXPORT
ARIS supports the BPML file export format. However, due to the fact that BPML development is no longer carried on and that the number of systems still able to use BPML is restricted, BPML will soon cease to be supported by ARIS.

METHOD MANUAL
102
4.4.1.2.2 Function allocation diagram (I/O) In addition to the event control representation explained in chapter Event-driven process chain (EPC) (page 91), the transformation of input data into output data and the representation of data flows between functions also form a link between the data view and the function view in the ARIS concept. The transformation of input data into output data can be illustrated in so-called Function allocation diagrams (I/O) which basically correspond to pure input/output diagrams used in other methods. The figure below illustrates an example of a function allocation diagram (I/O). The input data of the Determine delivery date function are Parts data, Inventory data, Bill of materials data, and Shipping data. Inquiry data serves as both input data and output data. Thus, a function allocation diagram (I/O) consists of functions of the function view and information objects of the data view. The arrows determine whether an information object is used only as input data, output data, or as input/output data. More detailed specifications are possible, indicating, for example, that the function has created or deleted an information object. Depending on the degree of detail, information objects can be Cluster/Data models, Entity types or Relationship types, or attributes of the data view.
Figure 101: Example of a function allocation diagram (I/O)
The example shown above illustrates the actual aim of function allocation diagrams (I/O), which is to represent a function's input/output data.

METHOD MANUAL
103
Besides a function's input/output data, events and all other objects that can be allocated to the functions in an EPC are available. Thus, the user is able to restrict the modeling of process chains in EPC diagrams to events and functions, and to assign each function a function allocation diagram (I/O) containing all additional relationships the function has. This allows for much clearer representations of business processes and also explains the use of a new name for this model type. The figure below illustrates an example of this more detailed representation in a function allocation diagram.
Figure 102: Detailed representation of the function allocation diagram
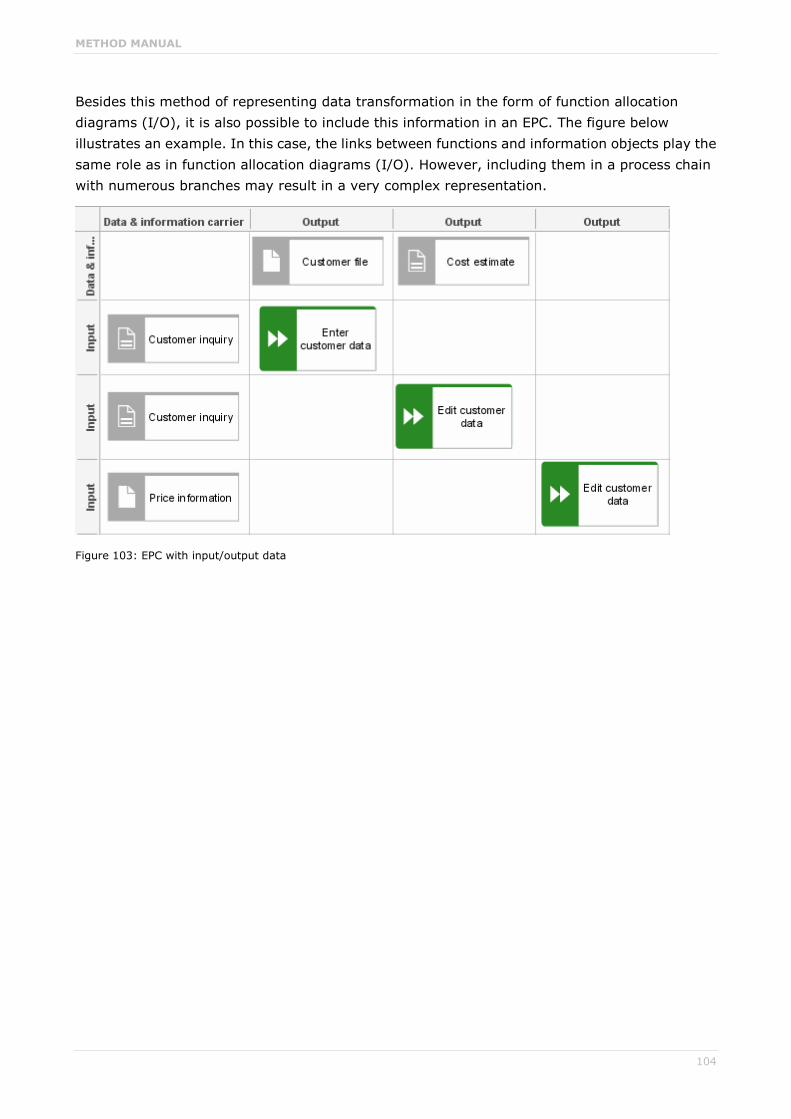
METHOD MANUAL
104
Besides this method of representing data transformation in the form of function allocation diagrams (I/O), it is also possible to include this information in an EPC. The figure below illustrates an example. In this case, the links between functions and information objects play the same role as in function allocation diagrams (I/O). However, including them in a process chain with numerous branches may result in a very complex representation.
Figure 103: EPC with input/output data
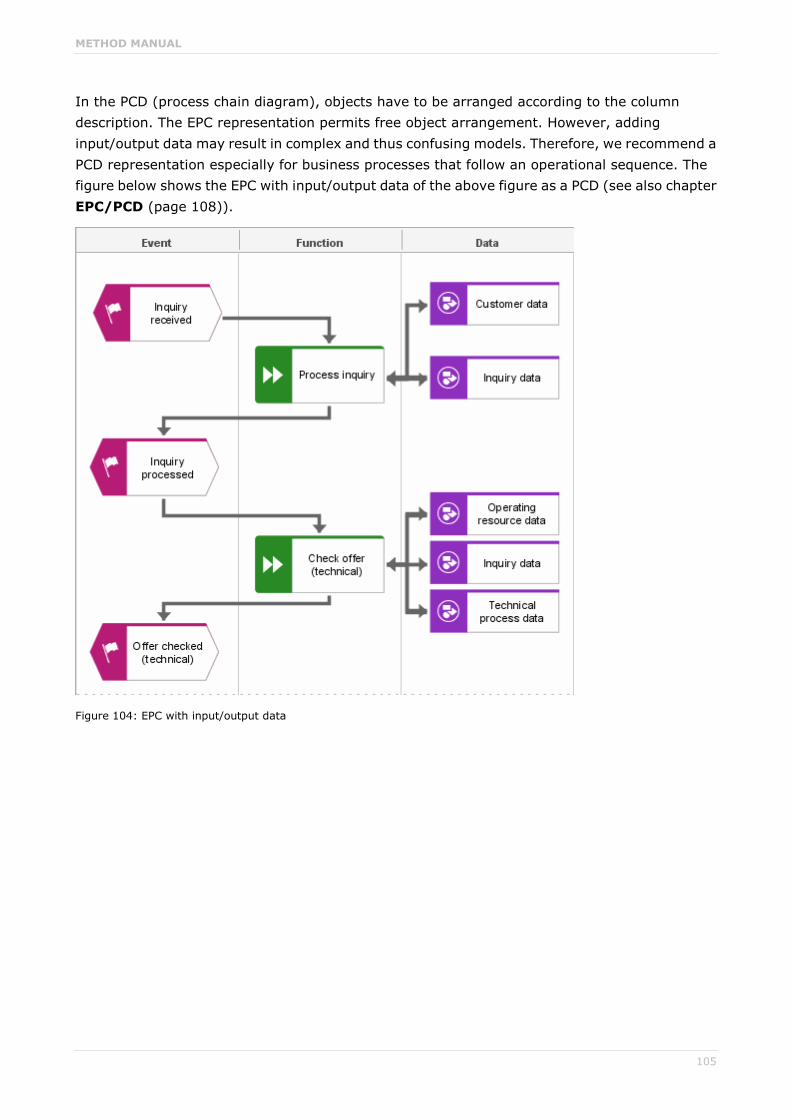
METHOD MANUAL
105
In the PCD (process chain diagram), objects have to be arranged according to the column description. The EPC representation permits free object arrangement. However, adding input/output data may result in complex and thus confusing models. Therefore, we recommend a PCD representation especially for business processes that follow an operational sequence. The figure below shows the EPC with input/output data of the above figure as a PCD (see also chapter EPC/PCD (page 108)).
Figure 104: EPC with input/output data
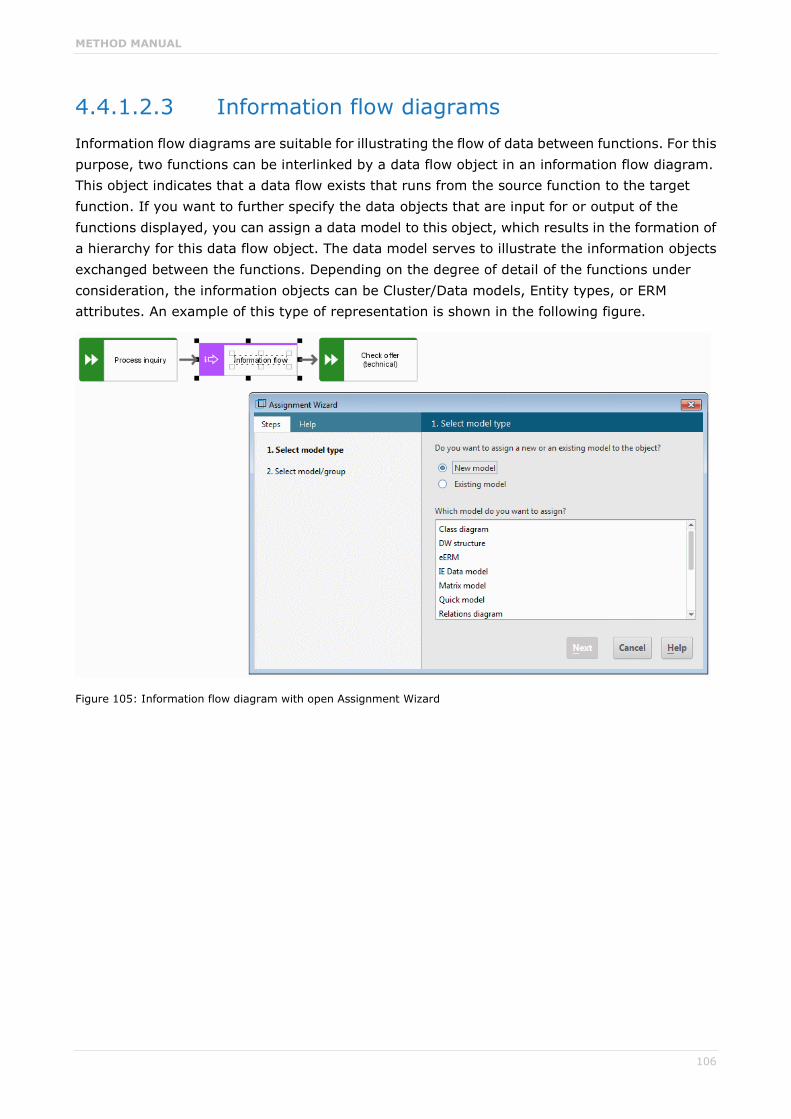
METHOD MANUAL
106
4.4.1.2.3 Information flow diagrams Information flow diagrams are suitable for illustrating the flow of data between functions. For this purpose, two functions can be interlinked by a data flow object in an information flow diagram. This object indicates that a data flow exists that runs from the source function to the target function. If you want to further specify the data objects that are input for or output of the functions displayed, you can assign a data model to this object, which results in the formation of a hierarchy for this data flow object. The data model serves to illustrate the information objects exchanged between the functions. Depending on the degree of detail of the functions under consideration, the information objects can be Cluster/Data models, Entity types, or ERM attributes. An example of this type of representation is shown in the following figure.
Figure 105: Information flow diagram with open Assignment Wizard
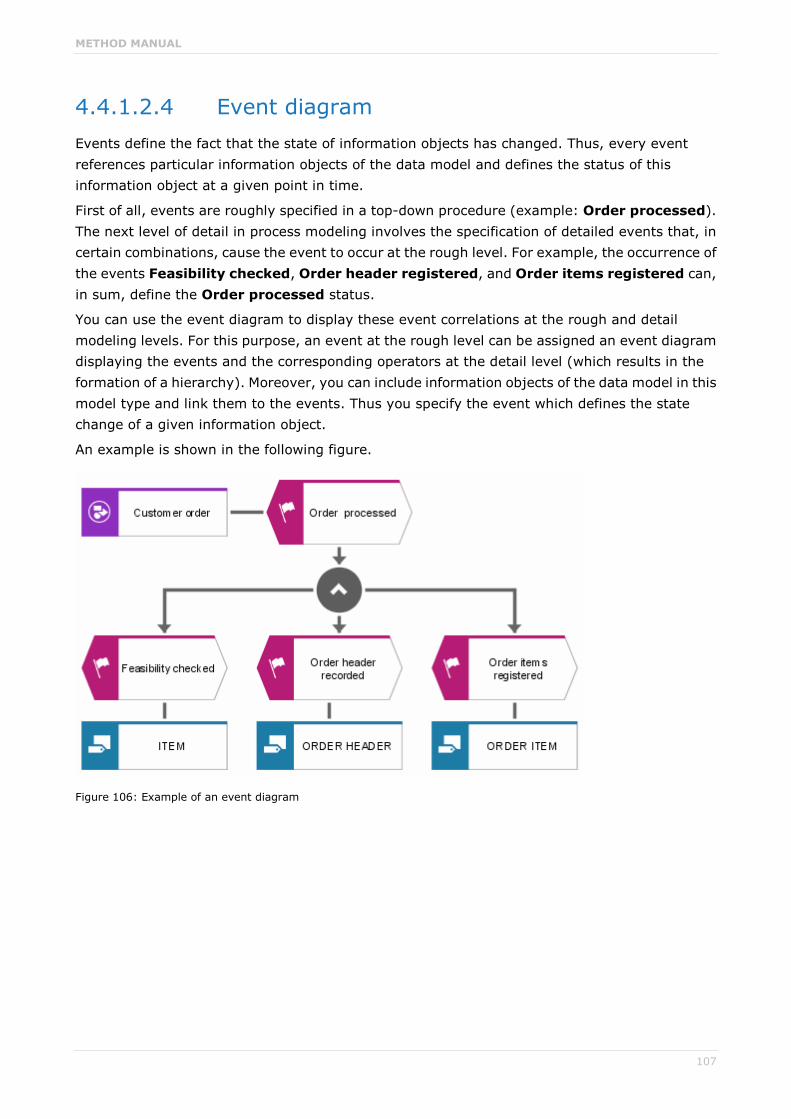
METHOD MANUAL
107
4.4.1.2.4 Event diagram Events define the fact that the state of information objects has changed. Thus, every event references particular information objects of the data model and defines the status of this information object at a given point in time.
First of all, events are roughly specified in a top-down procedure (example: Order processed). The next level of detail in process modeling involves the specification of detailed events that, in certain combinations, cause the event to occur at the rough level. For example, the occurrence of the events Feasibility checked, Order header registered, and Order items registered can, in sum, define the Order processed status.
You can use the event diagram to display these event correlations at the rough and detail modeling levels. For this purpose, an event at the rough level can be assigned an event diagram displaying the events and the corresponding operators at the detail level (which results in the formation of a hierarchy). Moreover, you can include information objects of the data model in this model type and link them to the events. Thus you specify the event which defines the state change of a given information object.
An example is shown in the following figure.
Figure 106: Example of an event diagram

METHOD MANUAL
108
4.4.1.3 Functions - Organization - Data
4.4.1.3.1 EPC/PCD EPCs and PCDs represent the same facts.
Up to this point, we have been dealing with only two views; now a third view is introduced. The process chain's partial views are thus combined to form an overall view, and the interactions of all components of the ARIS concept can be examined. So the process chain - our original object of consideration - is again represented in detail. However, this examination does not focus on the details provided by the individual views for the objects examined, but on the connections between these objects.

METHOD MANUAL
109
The following figure shows a process chain with all its views. Events representing data view objects are placed in the first column. The arrows lead to the process column where the process chain's functions are listed. Thus, the first and second columns define the event control. The third column lists data objects and shows their relations to individual functions. The view of the second and third column of the PCD defines the data flow within the process chain. Unlike the PCD introduced in chapter The Process chain diagram (page 12), the process chain diagram of the requirements definition has no columns for defining the processing type and IT system. These facts are required to record the actual situation in a company, but they are not part of the subject area-related description of a business process. The organizational units of the organization view that are responsible for carrying out the individual functions of the process chain are defined in the fourth column.
Figure 107: Example of a process chain (requirements definition)

METHOD MANUAL
110
The process chain illustrated in this figure can also have the form of an EPC.
Figure 108: EPC with functions, data, organizational units, and events
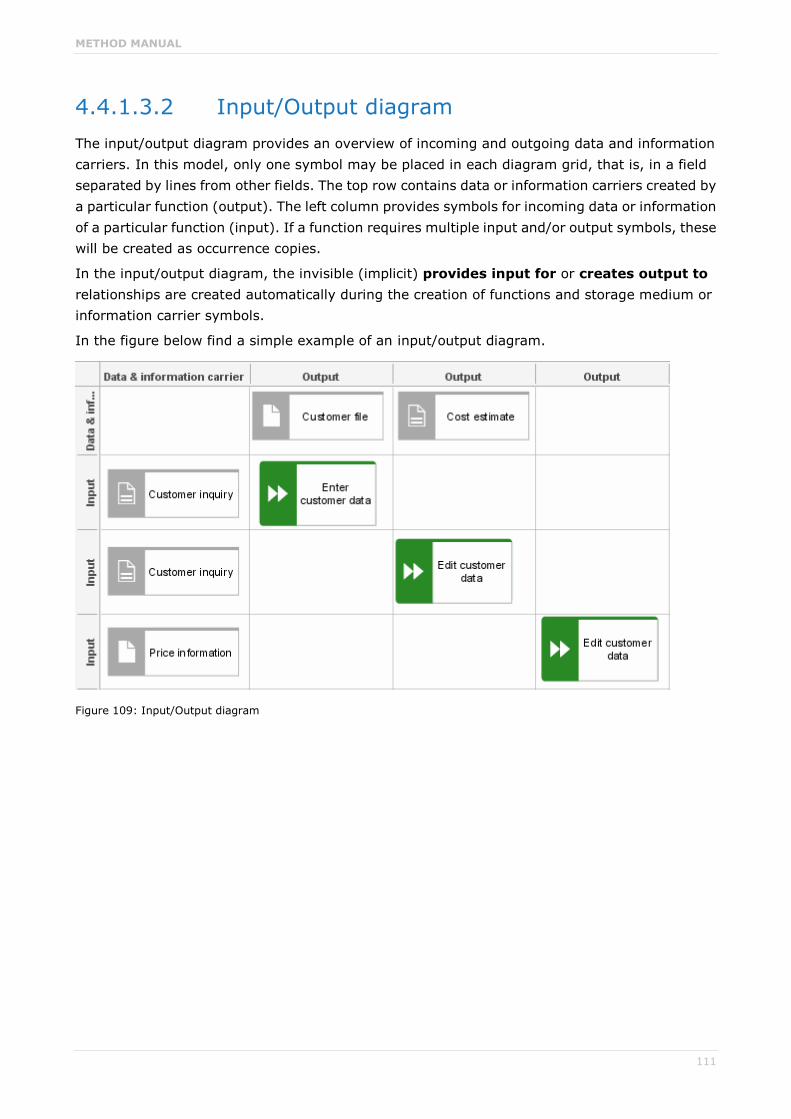
METHOD MANUAL
111
4.4.1.3.2 Input/Output diagram The input/output diagram provides an overview of incoming and outgoing data and information carriers. In this model, only one symbol may be placed in each diagram grid, that is, in a field separated by lines from other fields. The top row contains data or information carriers created by a particular function (output). The left column provides symbols for incoming data or information of a particular function (input). If a function requires multiple input and/or output symbols, these will be created as occurrence copies.
In the input/output diagram, the invisible (implicit) provides input for or creates output to relationships are created automatically during the creation of functions and storage medium or information carrier symbols.
In the figure below find a simple example of an input/output diagram.
Figure 109: Input/Output diagram

METHOD MANUAL
112
4.4.1.3.3 Value-added chain diagram The value-added chain diagram is mainly used to identify the functions within a company that are directly involved in the creation of a company's value added. These functions can be interlinked as a sequence of functions and thus form a value-added chain. The following figure shows an example of a value-added chain diagram.
Figure 110: Value-added chain
In a value-added chain diagram, functions can be arranged in a hierarchy, similar to a function tree. It always represents process-oriented superiority/subordination.
A value-added chain diagram not only enables you to express a superiority or subordination of functions, it can also display the functions' links to organizational units and information objects. When allocating organizational units to functions, as with process chains we differentiate between a function's technical responsibility, its IT responsibility, and the actual execution of a function.
A list of other relationships that are available in a value-added chain diagram is provided in the ARIS Method Reference manual on your installation media.
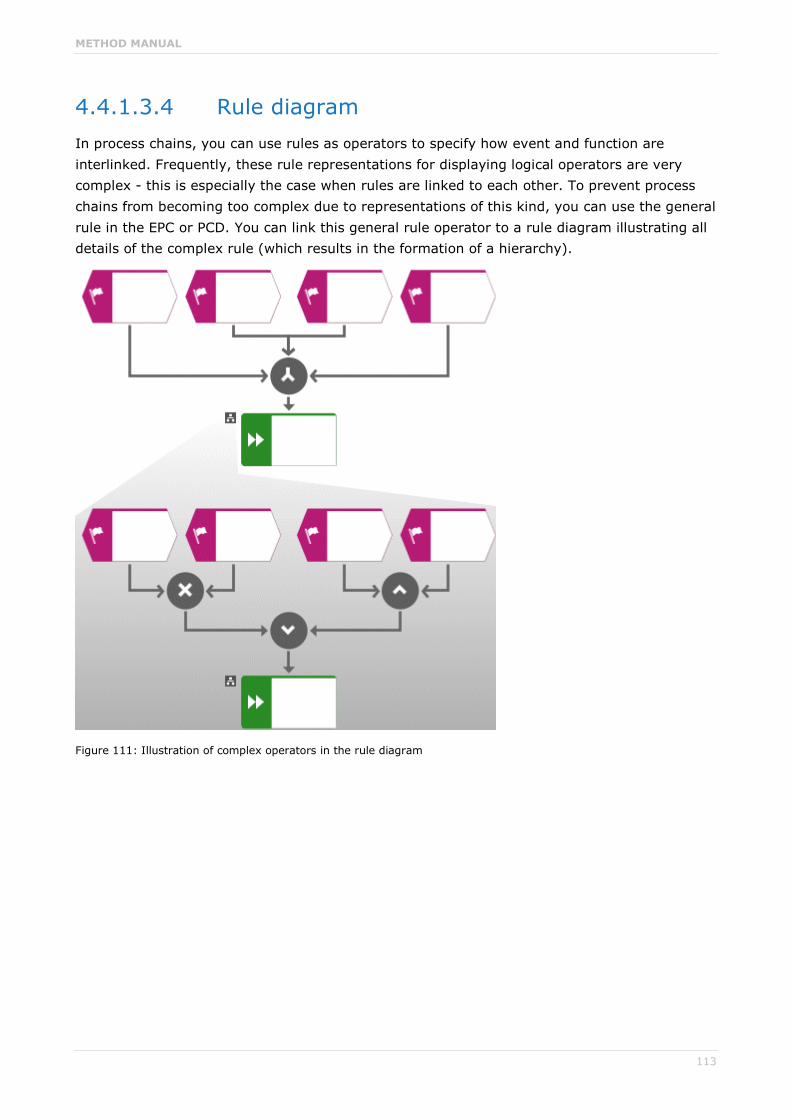
METHOD MANUAL
113
4.4.1.3.4 Rule diagram In process chains, you can use rules as operators to specify how event and function are interlinked. Frequently, these rule representations for displaying logical operators are very complex - this is especially the case when rules are linked to each other. To prevent process chains from becoming too complex due to representations of this kind, you can use the general rule in the EPC or PCD. You can link this general rule operator to a rule diagram illustrating all details of the complex rule (which results in the formation of a hierarchy).
Figure 111: Illustration of complex operators in the rule diagram

METHOD MANUAL
114
4.4.1.3.5 Communications diagram Large reference models contain a large number of process models. The inclusion of elements of the organization view in these process models illustrates who communicates with whom during the process. The communications diagram enables you to group all processes according to the communication between organizational units.
Therefore, the communications diagram displays all organizational units that communicate with each other. For example, the Sales organizational unit is linked to the Customer organizational unit via an object of the Communication type. Objects of the Communication type can be arranged in a hierarchy. They can be linked to the Process selection matrix model type. This process selection matrix displays all processes in which the sales department communicates with the customer.
4.4.1.3.6 Classification diagram The classification diagram enables you to classify functions by assigning object type classes to them. Classifications can be defined according to various classification criteria. To specify the classification criteria, you can link the Object type class object type with the Classification criterion object type.
4.4.1.4 Object-oriented modeling For modeling in a UML environment, UML is available. All method-relevant information on UML diagrams and UML elements is accessible directly via the ARIS UML Designer interface.

METHOD MANUAL
115
4.4.1.5 Process variants
4.4.1.5.1 Process selection matrix The process selection matrix displays different process scenarios by assigning main processes to individual scenarios.
The user can determine which functions of the scenario processes are to occur in the company. For this purpose, all main functions (scenario functions) of an application system or of an industry reference model need to be included as processes.
The following symbol types are available for modeling a process selection matrix:
Scenario
Process
Main process
A scenario represents a scenario process in the selection matrix which arranges different main processes in groups.
The process represents functions of the scenario process that are described in more detail in the reference model by process models.
The main process represents the main functions in function trees to which the processes (functions from the scenario processes) are assigned.
The following figure shows an example of a process selection matrix.
Figure 112: Process selection matrix (extract from the SAP AG R/3 reference model)

METHOD MANUAL
116
4.4.1.6 Material flow modeling You can use process models (EPC and PCD) to illustrate not only the information flow, but also the material transformation. To represent a material flow within business processes, ARIS provides the EPC (material flow) model type which is an extension of the EPC model type.
4.4.1.6.1 EPC (material flow) In addition to the object types of an EPC, the following object types are available in the 'EPC (material flow)':
Material type
Packaging material type
Operating resource type
Operating resource
Technical operating supply type
Technical operating supply
Warehouse equipment type
Warehouse equipment
Transport system type
Transport system
The Material type object type can be linked to the Function object type by means of an incoming or outgoing connection. In the case of an incoming connection, the materials that a function requires as input are defined. In this context, by selecting the corresponding connection type, you can define whether the function uses none, part, or all of the material. An outgoing connection specifies the material types created by the function.
Technical resources are required for material transformation. In process chains, you can also link them to the Function object type. To specify alternative resources that may be available, the requires alternatively connection type is provided in addition to the requires connection type.
If materials are to be packaged during function execution, packaging material types are needed. In order to specify the corresponding packaging material types, you can model a relationship between the function and the required packaging material types.

METHOD MANUAL
117
The following figure shows an EPC (material flow) and the corresponding technical resource types and packaging material types.
Figure 113: Extract from an EPC (material flow)

METHOD MANUAL
118
4.4.1.6.2 Material flow diagram You can use material flow diagrams to illustrate material flows between functions. In modeling, they are treated similarly to information flow diagrams. In a material flow diagram, you link two functions by means of a material flow connection. This connection indicates a material flow from the source function to the target function. If you want to further specify the material that is input for or output of the functions displayed, you can assign a material diagram to this connection, which results in the formation of a hierarchy for this material flow connection. The material diagram serves to illustrate the material or material types exchanged between the functions.
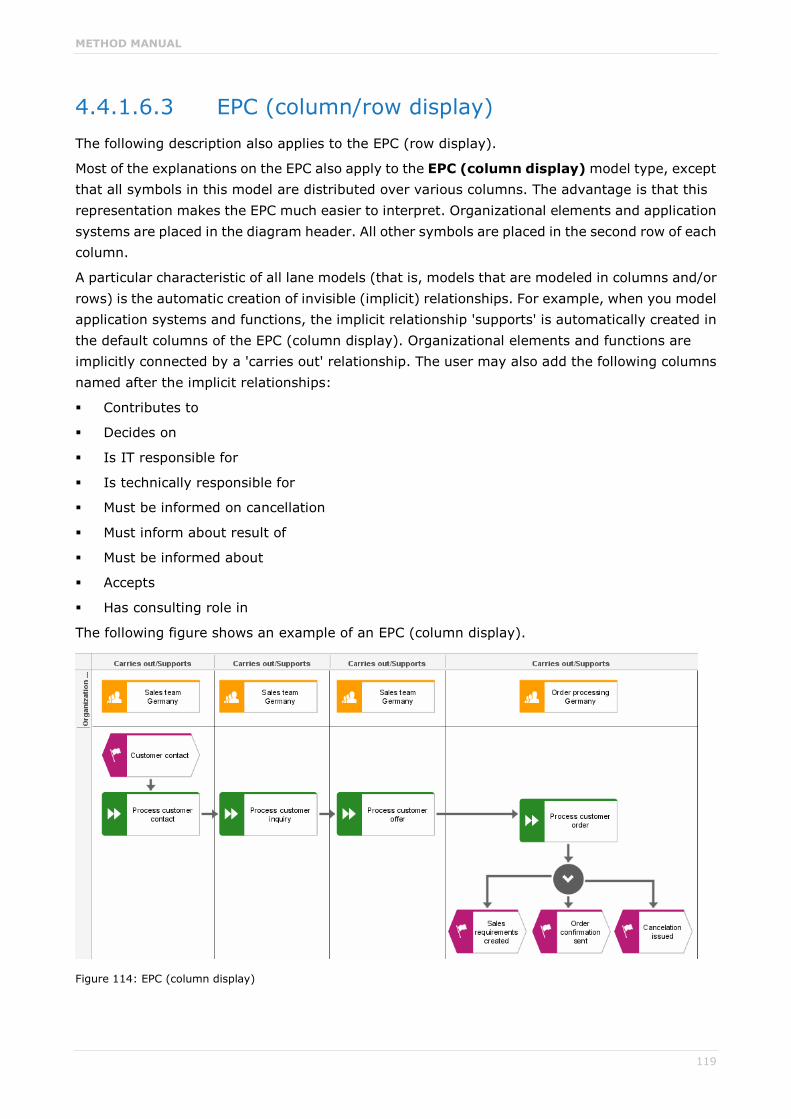
METHOD MANUAL
119
4.4.1.6.3 EPC (column/row display) The following description also applies to the EPC (row display).
Most of the explanations on the EPC also apply to the EPC (column display) model type, except that all symbols in this model are distributed over various columns. The advantage is that this representation makes the EPC much easier to interpret. Organizational elements and application systems are placed in the diagram header. All other symbols are placed in the second row of each column.
A particular characteristic of all lane models (that is, models that are modeled in columns and/or rows) is the automatic creation of invisible (implicit) relationships. For example, when you model application systems and functions, the implicit relationship 'supports' is automatically created in the default columns of the EPC (column display). Organizational elements and functions are implicitly connected by a 'carries out' relationship. The user may also add the following columns named after the implicit relationships:
Contributes to
Decides on
Is IT responsible for
Is technically responsible for
Must be informed on cancellation
Must inform about result of
Must be informed about
Accepts
Has consulting role in
The following figure shows an example of an EPC (column display).
Figure 114: EPC (column display)

METHOD MANUAL
120
The difference between the EPC (column display) and the EPC (row display) lies in the modeling direction. In the EPC (column display) modeling is performed from top to bottom, in the EPC (row display) from left to right.
METHOD MANUAL
121
4.4.1.7 SAP ALE models Models of the SAP ALE (SAP® Application Linking Enabling) type are used to model links between functions and applications.
4.4.1.7.1 SAP ALE filter model The SAP ALE filter model shows the criteria according to which a function type can be used more than once in a system (in an application). In this regard, the Filter object type object serves as a separation criterion within a distribution model.
4.4.1.7.2 SAP ALE message flow model The SAP ALE message flow model uses the Message flow object type to represent the message flows between systems and function types, including their direction.
4.4.1.7.3 SAP ALE message type model The SAP ALE message type model uses the Message type object type to classify the messages being exchanged between distributed systems, depending on the data and transactions involved.

METHOD MANUAL
122
4.4.1.8 Role assignment diagram (RAD) The SAP® reference model is represented using EPCs. These EPCs illustrate the business processes at different levels of detail. In the EPCs with the highest level of detail, which the SAP® terminology refers to as processes, procedures of processing executables in the SAP® system are modeled. These processes can be assigned both roles and executables.
In ARIS, this is done in the function allocation diagram where the EPC containing the modeled process must be assigned to the corresponding function definition. Thus, the function allocation diagram shows which roles are necessary to run the executables. However, since there are no direct relationships between roles and executables, no decision can be made as to which executable a role is responsible for if there are multiple roles. For this reason, the assignment of roles to executables takes place in the role assignment diagram (RAD). One role is displayed per column. Executables are placed in columns, which creates implicit relationships.
The information can be used during R/3 implementation to create the necessary user profiles and authorization concepts for operating the SAP® system.
Figure 115: Role assignment diagram (RAD)

METHOD MANUAL
123
4.4.1.9 Other models
4.4.1.9.1 Business controls diagram A business controls diagram displays potential risks for a process or function as well as risk control methods.
A risk represents the possible danger of a defined process objective not being achieved.
Risk control is a general way of eliminating or minimizing risks.
Risk solution means implementing risk control for a risk.
The business controls diagram layout corresponds to a matrix or table. The abscissa shows the potential process risks, and the ordinate shows the possible risk control methods. Risk solutions are now inserted as operators between risk and risk control. Additionally, organizational units (in the sense of user requirements) and documents, which also support implementation of risk control for a risk, may be added to the model.
Figure 116: Example of a business controls diagram
This model type is generally used to describe SAP® standard processes. The model shows the risks and risk control methods of an SAP® solution for the process being examined.

METHOD MANUAL
124
4.4.1.9.2 DW transformation The Data Warehouse data transformation diagram is used to describe a Data Warehouse. The focus is on the description of the dynamic aspects described in the process view of the ARIS architecture.
The model illustrates the transformation of general information object data into InfoCube data formats. To ensure that you can proceed efficiently and without loss of data in the transformation, a method specification is required for modeling. The methodology contains transformation rules and procedures that are graphically represented in the model.
The transformation is realized in two steps. First, the transfer structure items are transformed into communication structure items. Then they are transferred to the InfoCube.
You can run this procedure on different levels. On the one hand, you can show at a very high (requirements definition) abstraction level which transfer and communication structures exist to fill the info cube. On the other hand, on a very low (implementation) level you can illustrate how individual data elements are mapped to each other.
Figure 117: DW transformation - Data transformation of a Data Warehouse

METHOD MANUAL
125
4.4.1.9.3 E-Business scenario diagram The smooth execution of inter-company business processes is continuously gaining in significance. Here, the focus of interest lies on the operational sequence of specific procedures at the interfaces between companies on the one hand and at the interfaces between companies and their customers on the other. The contacts need to take place in a clear, quick, consistent, and direct manner.
Also, rapidly finding suitable business associates (from a corporate perspective) and providers (from a consumer point of view) is becoming increasingly more important. Maximum optimization of these processes results in a competitive advantage. The ideal platform for supporting these bilateral relationships is the Internet. As the processes in the above-mentioned environment are very complex, it is necessary to define the term e-business.
E-business describes all computer-assisted processes involving two economic agents and the attempt to gain added value by using new media.
Thus, e-business can mean simply acquiring an item using the Internet, or a highly complex project involving two companies, or creating a Web site for a corporate presentation.
Relationships between companies are referred to as Business-to-Business (or B2B), while relationships between companies and consumers are called Business-to-Consumer (or B2C).
The E-Business scenario diagram was developed to support e-business.
The ability to view a value-added chain in its entirety, that is, from the end user to each of the companies involved in a procedure, provides a basis for developing optimization potential. The objective is, for example, to improve the supply chain, to reduce procurement and distribution costs, or to optimize the information system architecture. The contents represented by the objectives can be modeled using this method.
The economic agents are arranged in the upper row of the diagram and referred to as Business participants. The participating companies can be assigned using an organizational chart. Here, interest centers on the individual processes that economic agents perform as part of the overall process as well as the interfaces between these subprocesses. An individual process is a business process that plays an important role in inter-company cooperation and that can be assigned to the process model. The business process is supported by application systems (business components), such as the R/3 system.
Even the roles of the employees involved in the process can be defined. These are referred to in the model as Employee role.
The main feature of the interfaces is the transfer of process-specific information. The information is gathered in business documents and can assume the form of an XML or HTML document. The business document can also be assigned as a data model. As an alternative to this object, the objects Money transaction (for representing a cash flow), Goods shipment (for representing a flow of goods), as well as E-mail, Internet, Intranet, Extranet, and Mobile phone (for specifying the technological aspects of the data transfer) can also be used.
All operational procedures relating to a company are modeled in the row below the business participant, but in the same column.

METHOD MANUAL
126
Thus, column borders form abstract interfaces. These merit special attention, as they carry the main potential for optimization, and it is therefore always beneficial to model them.
Explanation of terms: In the sample model below, OEM stands for Original Equipment Manufacturer and MRP for Material Resource Planning Controller.
Figure 118: Example of an e-business scenario diagram for the motor industry
The sample model shows how a manufacturer, an importer, and a dealer cooperate. Each party has its specific processes in the overall structure and uses business documents to exchange information via the interfaces to processes of other business associates. The persons involved in the business processes are also recorded and assigned with their roles.

METHOD MANUAL
127
4.4.1.9.4 Structuring model The structuring model is generally used to express the hierarchy or systematization (specialization or generalization) of facts.
A structural element represents a fact (in the direction of the intended systematization).
Models relating to the facts can be assigned to individual structural elements of the fact hierarchy.
Structuring models are most frequently used in quality management, particularly for certification purposes. There, the structuring model divides a norm into its individual components, and models which help meet the quality criterion are assigned to individual structural elements.
Figure 119: Example of a structuring model (extract from VDA 6.2 standard)
By means of a report, these facts can easily be evaluated or used for documentation purposes.

METHOD MANUAL
128
4.4.1.9.5 Industrial process and Office process The Industrial process and Office process model types essentially represent the same facts as the EPC model type or EPC (material flow), with the difference that they provide only a limited selection of objects and the symbols are represented in graphical form
This kind of graphical representation has the advantage that employees in the operating departments can understand the models without training and are able to adjust and develop them themselves. For instance, it is easy for every user to see that a symbol showing three persons represents a group, whereas this is not as obvious in the abstract EPC symbolism (oval with double frame). Therefore, the goal of these two model types is to establish process modeling, process optimization, and process utilization in the operating departments.--
To maximize the identification with symbols, two process types (model types) are provided: the 'Industrial process' illustrates production processes (which create material goods/products), while the 'Office process' illustrates office processes (which create intangible goods/services).
The models can be displayed in all three model types (if the objects exist in the corresponding model type) by copying the content of one model type to another. When copying, ARIS automatically converts the symbols. The following figure illustrates an example of the same fact being displayed in three model types - EPC, Industrial process, and Office process.
Figure 120: Example of facts in EPC, Industrial process, and Office process model types

METHOD MANUAL
129
4.4.1.9.6 Project process chain (PPC) The PPC model type forms the link between ARIS and Microsoft Project. ARIS Architect can represent the operational sequence of functions in the sense of a business process by means of event-driven process chains (EPCs). However, this abstract level is insufficient for the capacity and time planning purposes of a project. Instead, actual event instances and tasks must be examined and specified. The PPC meets this requirement by providing its own object type at occurrence level instead of using the Event and Function object types.
Previously, it was possible to automatically create PPCs from EPCs with the help of the former interface between ARIS and Microsoft Project. The current interface between ARIS Architect and MS Project 2000 no longer refers back to the PPC. Today, this model type only plays a minor role and is essentially used to display former models.
An event instance is an event that occurs in a specific process instance. The event instance can be evaluated, that is, it is possible to determine whether it is true or false.
A task is a function that occurs in a specific process instance. A unique start and end time, as well as other required attributes can be assigned to it.
Project structural items (tasks, event instances, rules, and connections) serve to represent the chronological-logical operational sequence of a project. The PPC also contains the Internal person/External person, Operating resource, and General resource resource objects. They are aimed at date and capacity planning.
A general resource is a resource that is not described in detail and is not necessarily a person or an operating resource. A general resource serves to run procedures.
Furthermore, cluster instances may be used to specify tasks in more detail within the PPC.
A cluster instance is an instantiation of the Cluster/Data model object. It represents a logical view of multiple data objects or structures.
The PPC uses cluster instances to represent the relationship between tasks and data. The Cluster instance object type can be assigned a model of the Information carrier diagram type (see requirements definition of the data view). Thereby, it is possible to illustrate on which information carrier the data is stored.

METHOD MANUAL
130
The figure below illustrates an example of a project process chain created by converting an EPC.
Figure 121: Example of a PPC created from an EPC
The XOR rule in the example indicates that branches occurred at this position in the converted EPC. These branches are interpreted as alternative paths for the project and must be uniquely specified.
The PPC model type can also be modeled directly in ARIS Architect.

METHOD MANUAL
131
4.4.1.9.7 Process instantiation model The main aspect of a simulation is the analysis of the operational sequence of processes during their dynamic progression. The processes to be analyzed are instantiated (started or generated) at start events. In agreement with their respective areas of application, users must be able to decide when and how often processes should be instantiated. In addition, the user needs to be able to prioritize processes so that urgent processes can be taken into account, for example.
ARIS Method prioritizes tasks by specifying the Priority attribute (Simulation attribute type group) for start events, and all processes instantiated at the corresponding start event retain this priority.
The requirement described is met by the process instantiation model. This model is developed as a multi-level object model. The Instantiation interval object is at the lowest level. Such an interval contains the Relative interval start, Interval duration, Number of process instances, Distribution, Repeat in cycles, and Period attributes. An interval duration of 0 is permitted in order to express a certain point in time. While intervals describe shorter periods of time, process instantiation cycles are used to repeat an ever recurring sequence of intervals. For example, a day can be modeled by four different intervals, which are repeated as a cycle for the entire simulation time period (for example, a week). But it is also possible to divide the simulation time period into several cycles (for example, work days and weekends), each of which may contain different intervals. A process instantiation plan may contain one or more cycles. The following example explains the object model more clearly:
A process model exists as an EPC with a start event. The following assumptions apply for this process: On weekdays (Mon - Fri), 50 processes are started at 8.00 a.m. at the beginning of the working day. From 8:00 am to 12:00 noon as well as from 1:00 p.m. to 5:00 p.m., 20 processes are started in equal distribution; from 12:00 noon to 1:00 p.m. and outside of work hours, no processes will be started. On Saturday, 60 processes will be started in a triangular distribution from 9:00 a.m. to 3:00 p.m. Generally, no processes are started on Sundays. This weekly rhythm applies from January to December, except during the vacation period from July to August. During this period, no one works on Saturdays.

METHOD MANUAL
132
Based on the example described above we can generate the following model:
Figure 122: Process instantiation model
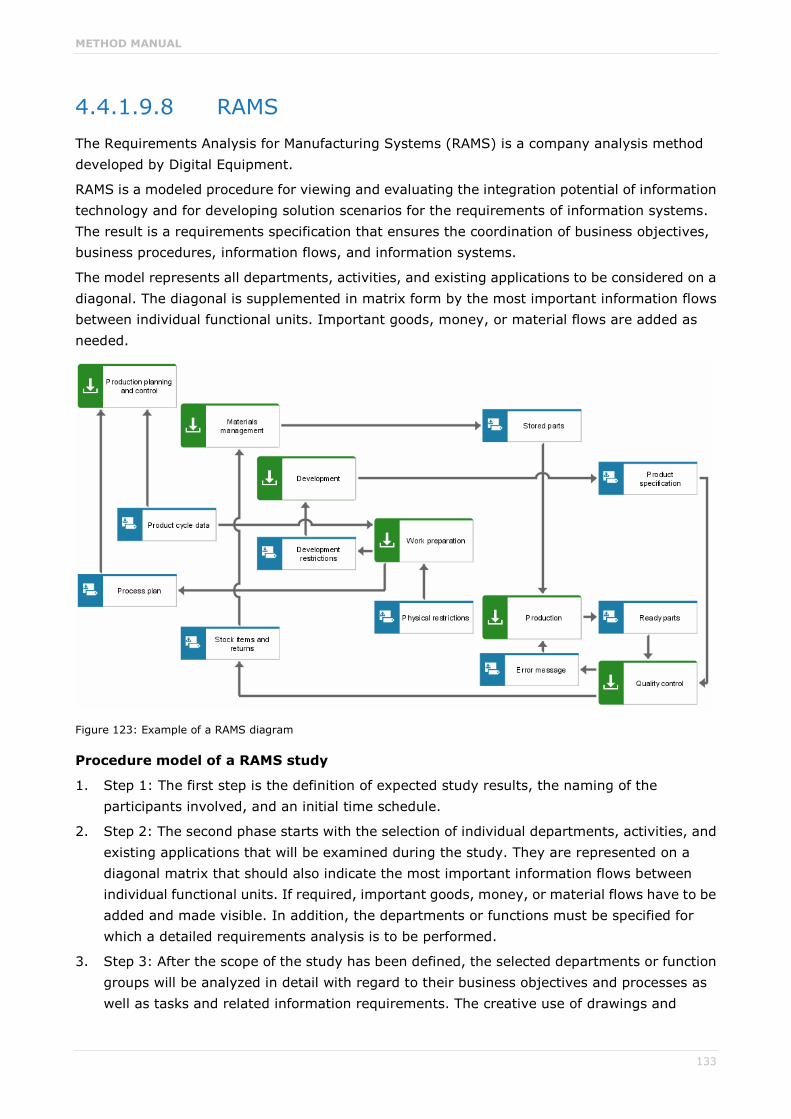
METHOD MANUAL
133
4.4.1.9.8 RAMS The Requirements Analysis for Manufacturing Systems (RAMS) is a company analysis method developed by Digital Equipment.
RAMS is a modeled procedure for viewing and evaluating the integration potential of information technology and for developing solution scenarios for the requirements of information systems. The result is a requirements specification that ensures the coordination of business objectives, business procedures, information flows, and information systems.
The model represents all departments, activities, and existing applications to be considered on a diagonal. The diagonal is supplemented in matrix form by the most important information flows between individual functional units. Important goods, money, or material flows are added as needed.
Figure 123: Example of a RAMS diagram
Procedure model of a RAMS study
1. Step 1: The first step is the definition of expected study results, the naming of the participants involved, and an initial time schedule.
2. Step 2: The second phase starts with the selection of individual departments, activities, and existing applications that will be examined during the study. They are represented on a diagonal matrix that should also indicate the most important information flows between individual functional units. If required, important goods, money, or material flows have to be added and made visible. In addition, the departments or functions must be specified for which a detailed requirements analysis is to be performed.
3. Step 3: After the scope of the study has been defined, the selected departments or function groups will be analyzed in detail with regard to their business objectives and processes as well as tasks and related information requirements. The creative use of drawings and

METHOD MANUAL
134
illustrations makes complex processes or procedures easier to understand. Frequently, original business forms, reports, or screens are used to clarify aspects. An important task of this analysis is to discover possible irregularities in the information flow and business procedure interrelationships in existing activities and systems. Improvement potential of existing activities and systems is also examined. During the analysis, problems, questions, and suggestions for the best possible solutions are presented. Subsequently, the information gathered is structured and examined in detail in terms of its causes and effects relating to business activities. If improvement potential emerges, it is recorded and its benefit evaluated.
4. Step 4: The results of this detailed actual analysis are now used as a basis for the following requirements specification. The problem areas are now clearly outlined, and new ideas and alternative solutions can be developed for them. It is important that suggested solutions - which can range from complex systems to simple process changes - are always closely related to the previously recorded initial situation. This comparison with the initial situation must be performed for all functions and activities in the relevant areas. The result of the study may be the confirmation that generic solutions are practicable, or may be the creation and synchronization of user requirements.
5. Step 5: The results collected during each step of the analysis will be incorporated in the formulation of the final requirements specifications. All information, detailed examinations, and suggestions compiled in the course of the study are summarized in a final report and establish the basis for future system requirements. The next solution implementation step is a functional system specification.
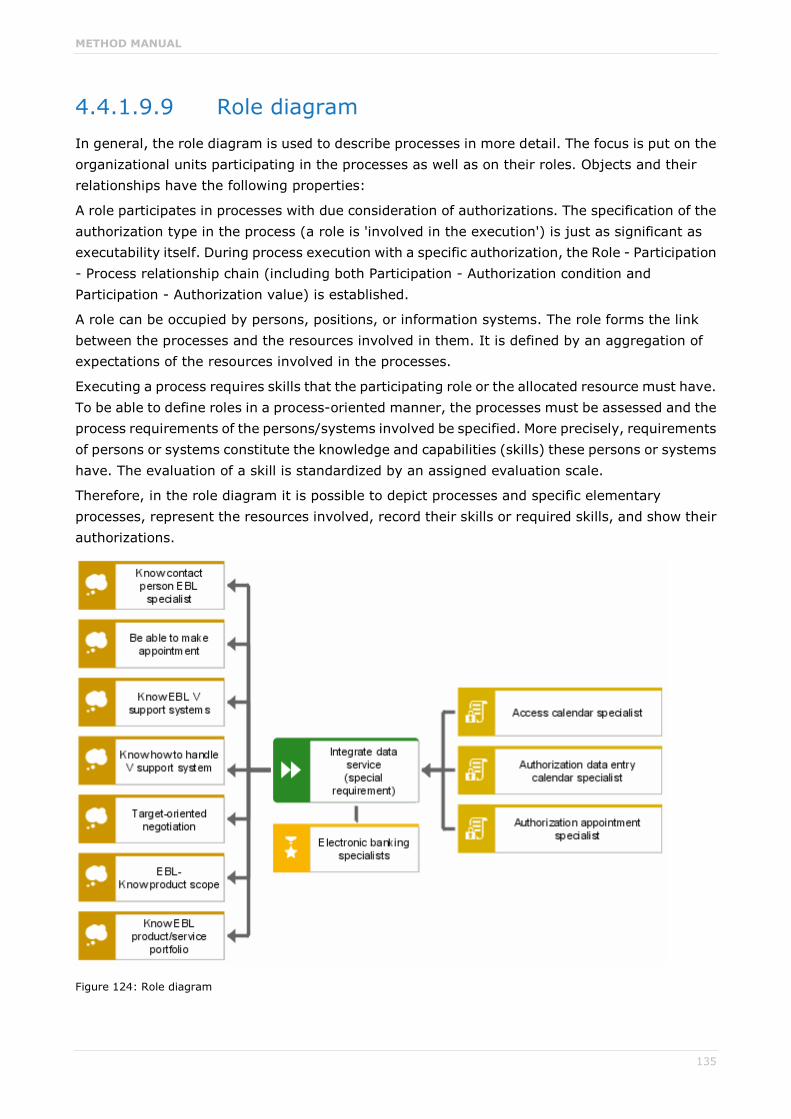
METHOD MANUAL
135
4.4.1.9.9 Role diagram In general, the role diagram is used to describe processes in more detail. The focus is put on the organizational units participating in the processes as well as on their roles. Objects and their relationships have the following properties:
A role participates in processes with due consideration of authorizations. The specification of the authorization type in the process (a role is 'involved in the execution') is just as significant as executability itself. During process execution with a specific authorization, the Role - Participation - Process relationship chain (including both Participation - Authorization condition and Participation - Authorization value) is established.
A role can be occupied by persons, positions, or information systems. The role forms the link between the processes and the resources involved in them. It is defined by an aggregation of expectations of the resources involved in the processes.
Executing a process requires skills that the participating role or the allocated resource must have. To be able to define roles in a process-oriented manner, the processes must be assessed and the process requirements of the persons/systems involved be specified. More precisely, requirements of persons or systems constitute the knowledge and capabilities (skills) these persons or systems have. The evaluation of a skill is standardized by an assigned evaluation scale.
Therefore, in the role diagram it is possible to depict processes and specific elementary processes, represent the resources involved, record their skills or required skills, and show their authorizations.
Figure 124: Role diagram

METHOD MANUAL
136
The sample model displays the elementary process' requirements of the role (capabilities and authorizations), as well as the elementary role's requirements of the resource with regard to capabilities and authorizations.
The diagram is assigned to the relevant elementary process and elementary role. By assigning the diagram to the elementary process, the requirements of the underlying process EPC (corresponds to the process reference model) can be viewed. Assigning it to the elementary role shows the elementary role's requirements of the resource with regard to its capabilities and authorizations in the role structure diagram.
4.4.1.9.10 Quick model The Quick model model type enables you to model without method restrictions. The Quick model contains the Quick object object type with over 30 different symbols. Relationships of the has relation with type can be created between quick objects. Multiple connections of this type are allowed between two objects.
The corresponding default attributes can be specified for models, objects, and connections.
You can assign multiple quick models to all objects of any object type provided by ARIS Method. In addition, you can assign any number of models provided by ARIS Method to a quick object regardless of the model type.
You can transform Quick model model types and/or Quick object object types into method-based models or objects using the Semantics Generator in ARIS.

METHOD MANUAL
137
4.4.1.9.11 c3 method The c3 method model type describes the initial process approach above the process level in a change management project.
The focus is always on the process to be improved. For each process examined, various different objects are modeled that illustrate project-relevant information in list form. This includes information on:
organizational aspects (for example, process responsibility and substitution rules);
tasks performed to improve the process;
KPIs by which the improvement in the process is measured;
tools to be used to improve the process;
activities planned to change the process in the near future;
improvement potential of the process examined;
skills required to run the process;
goals pursued by the project;
tools currently in use (software, methods, continuous training);
tools to be used for process improvement and integration in the overall system.
The structure of the c3 method type is shown in the following figure:
Figure 125: Structure of a c3 model

METHOD MANUAL
138
You can draw a connection only between process/task and process owners, process managers, or process supervisors.
The other relationships are derived from the position of the objects in the model.
As with objects of the organization view, objects in a c3 method model can be assigned the processes that are recorded later.
The Description/Definition attribute can be used for a short description of an object.

METHOD MANUAL
139
4.4.1.9.12 Screen design When designing software, you can use a 'Screen design' in ARIS to specify the technical requirements of a dialog or Web form.
In the Layout column, you specify the structure of the dialog or Web form. The procedure for designing a dialog, for example, is similar to working with a resource editor in a development environment.
The graphic elements that can be placed in the Layout column include text boxes, spin boxes, option buttons and check boxes, combo boxes, buttons, tree and list controls, as well as bitmaps and static text. You can use the Tabindex attribute type to specify the order in which the Tab key moves the cursor to the individual screen elements.
You can place various data elements and function objects in the Data and Functions columns. Using a connection of the represents type, the objects can be associated with the data elements and functions they are editing.
Each screen design can be assigned to the corresponding screen object that is used, for example, in an EPC or a model of the Screen navigation type. In addition, a screen design can also be assigned to the entity type, cluster, complex object type, class, or function/IT function edited via the screen.
Figure 126: Example of a screen design for a registration dialog and implementation in C++

METHOD MANUAL
140
4.4.1.9.13 Screen navigation In a model of the Screen navigation type, you can either specify the structure of a screen that comprises multiple subscreens (for example, a Website with several form fields or frames), or you can describe the transition between various screens. The transition between the screens can be described in detail.
Example
You want to illustrate that a screen element has to be active before the next screen can be accessed. Assign the triggering screen element (of the Screen design model) to the screen using the contains connection. Then draw a connection of the calls type from the screen element to the screen that follows.
It is also possible to show that navigation depends on events. When you exit a screen various events can occur. For example, if a user has completed the registration page of an online shop, the registration can either be completed successfully or it can fail. This will determine whether the user moves to the contents page of the catalog or is returned to the registration page.
Figure 127: Example of screen navigation with events

METHOD MANUAL
141
4.4.1.9.14 Business segment matrix In the business segment matrix, the various markets in which a company is active are shown in an overview and their significance for the success of the company is shown in visual terms.
Each market is described by
the product or service offered and
the customer group that the offer addresses.
Products and services (objects of the Product/Service type) are placed in the cells of the first column of the business segment matrix. The target group (various organizational elements) is placed in the cells of the first row. You define the market by placing a business segment object in the cell where product row and target group column intersect. Implicit relationships of the belongs to business segment type are established between the product/service and the organizational element.
To emphasize the significance of a business segment, five different symbols are available from almost unimportant to very important.
When modeling, you need to observe that each business segment can be placed within the matrix only once.
For each business segment, you can indicate its importance in terms of the corporate strategy. A strategy describes long-term procedures that the company employs to achieve its objectives and to gain competitive edge.
The following figure shows a business segment matrix from the pharmaceutical field.
Figure 128: Example of a business segment matrix
Business segments can also be assigned an objective diagram. The objective diagram contains the objectives set for the business segment as well as the processes and success factors supporting the achievement of these objectives.
The success factors in the objective diagram can be the basis of success factor analysis if the Success - Actual, Success - Target, and Success - Competitor attributes are specified in the attribute type group of the same name. Success is evaluated by means of a five-step scale from very low to very high.
Procedures
To perform a success factor analysis,

METHOD MANUAL
142
1. use the pop-up menu of the business segment to start ARIS report (Evaluate > Report),
2. and select the MSF_Analysis(Object).rso report script of the BPM group in the default path of the Report Wizard.
The report is output in HTML format.
Figure 129: Report
Alternatively, you can start the success factor analysis via the pop-up menu of the objective diagram. Select the MSF_Analysis(Model).rsm report script.
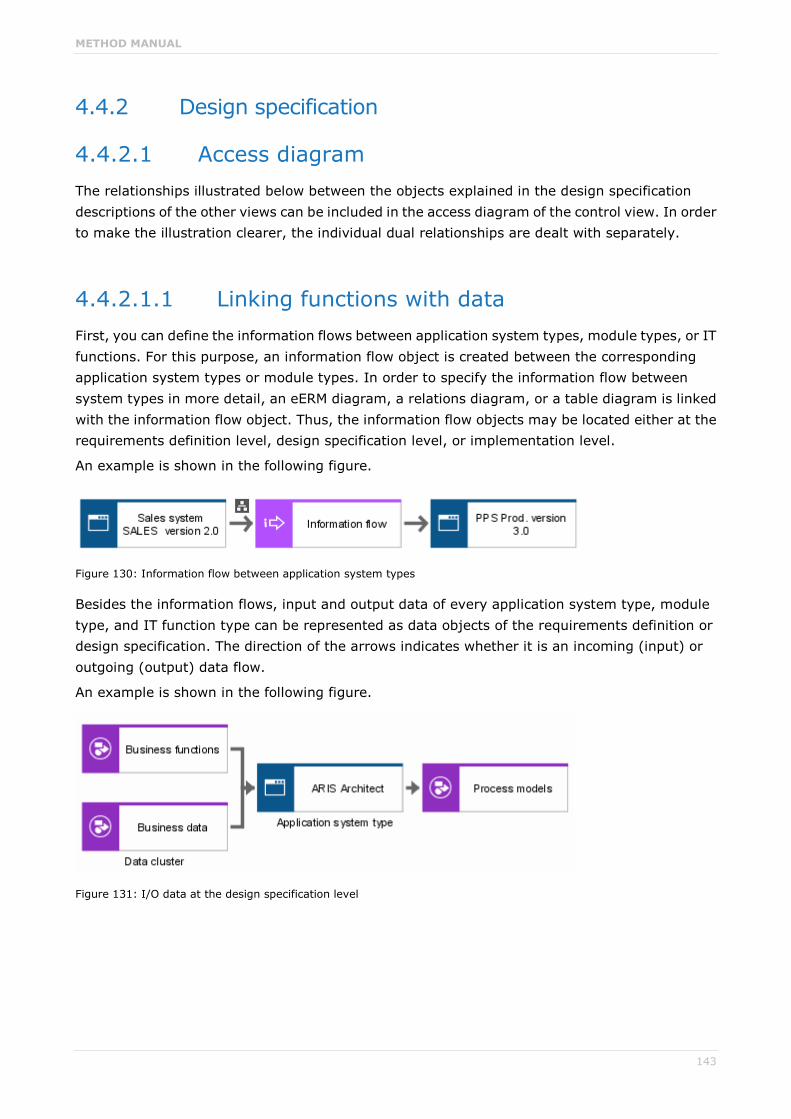
METHOD MANUAL
143
4.4.2 Design specification
4.4.2.1 Access diagram The relationships illustrated below between the objects explained in the design specification descriptions of the other views can be included in the access diagram of the control view. In order to make the illustration clearer, the individual dual relationships are dealt with separately.
4.4.2.1.1 Linking functions with data First, you can define the information flows between application system types, module types, or IT functions. For this purpose, an information flow object is created between the corresponding application system types or module types. In order to specify the information flow between system types in more detail, an eERM diagram, a relations diagram, or a table diagram is linked with the information flow object. Thus, the information flow objects may be located either at the requirements definition level, design specification level, or implementation level.
An example is shown in the following figure.
Figure 130: Information flow between application system types
Besides the information flows, input and output data of every application system type, module type, and IT function type can be represented as data objects of the requirements definition or design specification. The direction of the arrows indicates whether it is an incoming (input) or outgoing (output) data flow.
An example is shown in the following figure.
Figure 131: I/O data at the design specification level

METHOD MANUAL
144
4.4.2.1.2 Linking organization with data The essential tasks to be performed when linking data view and organization view at the design specification level are to define the responsibilities of organizational units for company data objects and to determine the access privileges that essentially define which organizational units may access specific company data.
The relationships thus established link technical objects of the organization view (organizational unit, position, role, person, etc.) with data objects of the relations diagram at the design specification level (relation, attribute, view). Therefore, these relationships are attributed to the process view's design specification level.
In order to define access privileges for relations or individual fields, the relevant data objects can be assigned either positions or roles. This allows you to stipulate that a certain position is authorized to access particular fields, but by assigning roles, you can also define business rules such as this field may only be accessed by department heads. The following figure illustrates an example.
Figure 132: Access privileges
Defining the responsibilities for the contents of a field or an entire relation is as important as assigning access privilege. For this reason, a second connection called is responsible for can be drawn between organizational units and data objects in the relations diagram. Unlike access privileges, responsibilities for data objects are mostly assigned to one position in the company only. Business rules similar to the ones mentioned earlier can again be defined by assigning roles. These rules then relate to the responsibility for a data object.
The following figure illustrates an example.
Figure 133: Definition of responsibilities
METHOD MANUAL
145
4.4.2.1.3 Linking organization with function The fact that the organizational aspects are linked to the functional aspects defined at the design specification level basically answers the following questions:
Who (which organizational unit, position, person, etc.) is responsible for the application system types and module types specified in the function view at the design specification level, or who uses these systems?
Which locations (organization view) within the company use which application system types or module types?
Which platforms available in the company (hardware component types (organization view)) are suitable to run which application system types?
In order to answer the first question, connections can be drawn in the access diagram between the organizational units of the organizational chart (organizational units, positions, and persons) and the objects of the application system type diagram (application system type, module type, IT function, etc.). While doing this, the significance of this relationship can be specified more precisely. We distinguish the following:
An organizational unit may be responsible for an application system type as far as the technical aspects are concerned.
An organizational unit may be responsible for the development of an application system type.
An organizational unit may be a user of an application system type.
The question of location may be solved by assigning locations from the organization view to application system types, module types, and IT function types.
In the design specification we are not dealing with individual application systems in the sense of individual licenses, but with application system types. Therefore, no actual locations of application systems are defined by means of this relationship (this is realized at the implementation level), but possible locations of a particular application system type are pointed out.
The design specification of the organization view defines the hardware component types available in a company. In the control view, the relationship between these hardware component types and the application system types can be established. This is how the hardware platforms for running certain application system types, module types, or IT function types are determined. At this stage, the graphical user interface types, operating system types, and DBMS types included in the function view can be assigned to the hardware component types, as well.
A list of relationships that are available in an access diagram is provided in the ARIS Method Reference manual on your installation media.

METHOD MANUAL
146
The following figure shows examples of relationships.
Figure 134: Access diagram (excerpt)
4.4.2.2 Program flow chart In the access diagram, you can establish the relationships between the object types of the organization view and data view and the application system types, module types, and IT function types specified in the application system type diagram (see chapter Access diagram (page 143)). In this model type, you cannot directly represent the allocation of functions of the requirements definition. This allocation is realized in the application system type diagram. Similarly, possible chronological-logical operational sequences of application system types, module types, and IT function types cannot be illustrated directly. Strictly following the ARIS architecture, you can trace these links only by navigating through a number of model types.
However, in the system design environment, model types (for example, program flow charts (PF) (page 147)) have been established that allow an integral view of all aspects of the system design.
For this reason, ARIS provides the Program flow chart model type. It enables you to model all relationships to application system types, module types, and IT function types available in other ARIS model types, regardless of the ARIS breakdown into views. Moreover, you can represent the chronological-logical operational sequence of the object types mentioned. For this purpose, events are provided in this model type. Similar to arranging functions and events in the EPC, you can define module sequences in the program flow chart. In this context, the event is seen as a trigger that activates module types or application system types. Branches can be represented by the rules known from the EPC. Unlike in an EPC, you can also define operational sequences in the program flow chart without the use of events.
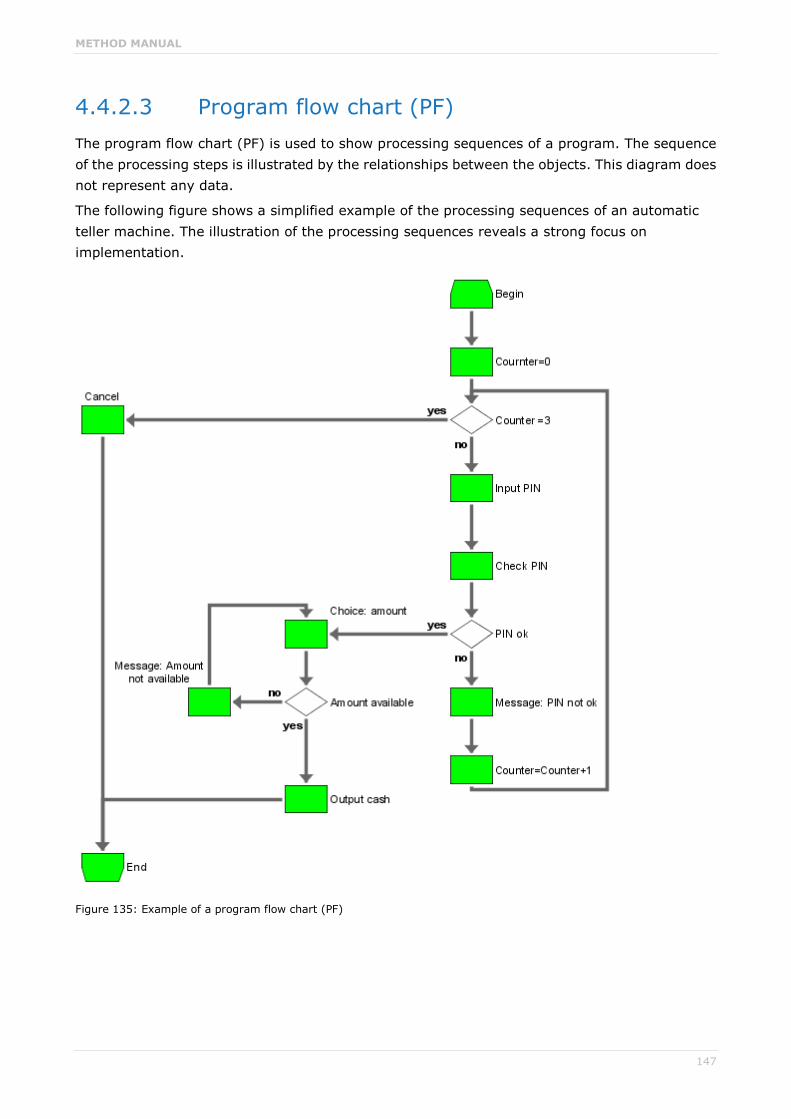
METHOD MANUAL
147
4.4.2.3 Program flow chart (PF) The program flow chart (PF) is used to show processing sequences of a program. The sequence of the processing steps is illustrated by the relationships between the objects. This diagram does not represent any data.
The following figure shows a simplified example of the processing sequences of an automatic teller machine. The illustration of the processing sequences reveals a strong focus on implementation.
Figure 135: Example of a program flow chart (PF)

METHOD MANUAL
148
4.4.2.4 Screen diagram A screen diagram describes screens used in software development. The aim is automatic derivation of screens from the screen diagram.
Thus, screen diagrams display the structure and to a certain degree the functionality of screens. From left to right and top to bottom, the screen diagram's structure corresponds to the geometry of the interface described.
The central symbol is the 'screen', which corresponds to a window in Windows terminology. This window can have multiple tabs (Page symbol). In general, the interface can be divided into areas using a table format (Section symbol for a row, and Column symbol for a column). The Section and Column symbols can be nested as required in order to form complex interfaces. You can place tables (Screen table symbol), text entry boxes (COT attribute symbol), graphics (Bitmap symbol), and text descriptions (Text symbol) on the interface. Using the Layout symbol you can assign representation properties to the Screen, Page, Section, Column, Screen table, COT attribute, and Text objects.
Additional symbols can be used to describe the screen interface.
The following figure shows an example of a screen diagram. The second figure illustrates the screen derived from the diagram.
Figure 136: Example of a screen diagram

METHOD MANUAL
149
Figure 137: Screen derived from the screen diagram of the previous figure

METHOD MANUAL
150
4.4.2.5 SAP integration process (XI) A model of the SAP integration process (XI) type represents business processes from the SAP® Exchange Infrastructure.
This kind of business process describes in detail the steps that need to be carried out for exchanging messages between applications.
Each integration process has exactly one start object and one process end.
In the course of the integration process, the following constructs can be created:
Receive
Send
Wait
Block limit (start)
Block limit (end)
Parallelism (start)
Parallelism (end)
Control
Receiver determination
Assignment
Transformation
Switch (start)
Switch (end)
Empty
Loop limit (start)
Loop limit (end)
If the path splits into multiple paths after the start of a block, a parallelism, a switch, or a loop, these paths need to be joined in a corresponding end symbol.

METHOD MANUAL
151
4.4.3 Implementation - Access diagram (physical) The questions considered in the design specification of the control view are also relevant for the implementation level. However, in contrast to the design specification level, concrete specimens of individual objects are examined, not object types. For example, the focus may be on relationships between concrete application systems and organizational units, not on relationships between application system types and organizational units.
The relationships illustrated in the following are modeled in the access diagram (physical).
4.4.3.1 Linking functions with data To show which data is exchanged between application systems, information flow objects can be created between application system objects of the function view. Unlike application system objects at the design specification level, these application system objects are no application system types, but concrete specimens (individual licenses). This means that application systems, modules, and program module types can be interlinked by data flow connections. If you defined at the design specification level that the Sales system SD version 2.1 module type can exchange data with the Material management system MM version 1.2 module type, the implementation level shows that the SD license no. 1234 module exchanges data with the MM license no. 2352 and MM license no. 34234 modules. Both MM modules are of the Material management system MM version 1.2 module type. This is illustrated in the following figure.
Figure 138: Data flow
To specify the data objects that are exchanged between systems in more detail, corresponding model types of the data view are assigned to the information flow objects.
Apart from the data flows between application systems, input/output data can also be specified for every application system. There are two reasons for the relationships to be represented in an access diagram (physical). In the first case, the data objects are objects of the table diagram (table, field, view (physical)) located in the data view of the implementation level. These data objects can be linked to application system objects of the design specification level or implementation level via input/output relationships. In the second case, the application system objects are concrete application systems or modules of the implementation level, which are linked to objects in the data view.

METHOD MANUAL
152
Therefore, the following general rule can be defined:
If one of the object types participating in an input/output relationship originates from the implementation level of the relevant view, the relationships in the process view are represented at the implementation level (access diagram (physical)), as well.
An example is shown in the following figure.
Figure 139: Input/Output relationships

METHOD MANUAL
153
4.4.3.2 Linking organization with data The focus is on the same questions dealt with in the design specification:
Which organizational units are responsible for data objects?
Who has access to which data objects?
Which data objects are stored on which hardware components?
Unlike the relationships in the design specification, the relationships established here form a link to the data objects shown at the implementation level of the data view.
This means that the responsibility for data objects is no longer defined for relations and attributes of the relations diagram, but for the physical structures, that is, tables, fields, and their specimens [table (specimen), field (specimen)].
To represent these dependencies, connections are drawn in the access diagram (physical) between the objects of the organization view (organizational unit, position, person, etc.) and the table diagram's objects mentioned earlier (table, field, view (physical), etc.).
When a connection is drawn between organizational units and tables and fields, the meaning of each relationship must be defined individually. For example, is responsible for means that an organizational unit is responsible for the contents of the relevant table or field, while accesses means that a position or person has access privileges for the data objects shown.
In addition to defining access privileges and responsibilities, you can use the hardware component object (organization view/implementation) to define on which of the available hardware components - which can be uniquely identified by the inventory number, for instance - certain information objects of the company are located. For this purpose, the Hardware component object may be linked to information objects of the implementation level (tables, fields, etc.), the design specification level (relations, attributes), or the requirements definition level (entity types, cluster/data models, etc.) in the access diagram (physical).
The figure below illustrates an example.
Figure 140: Assignments to hardware component
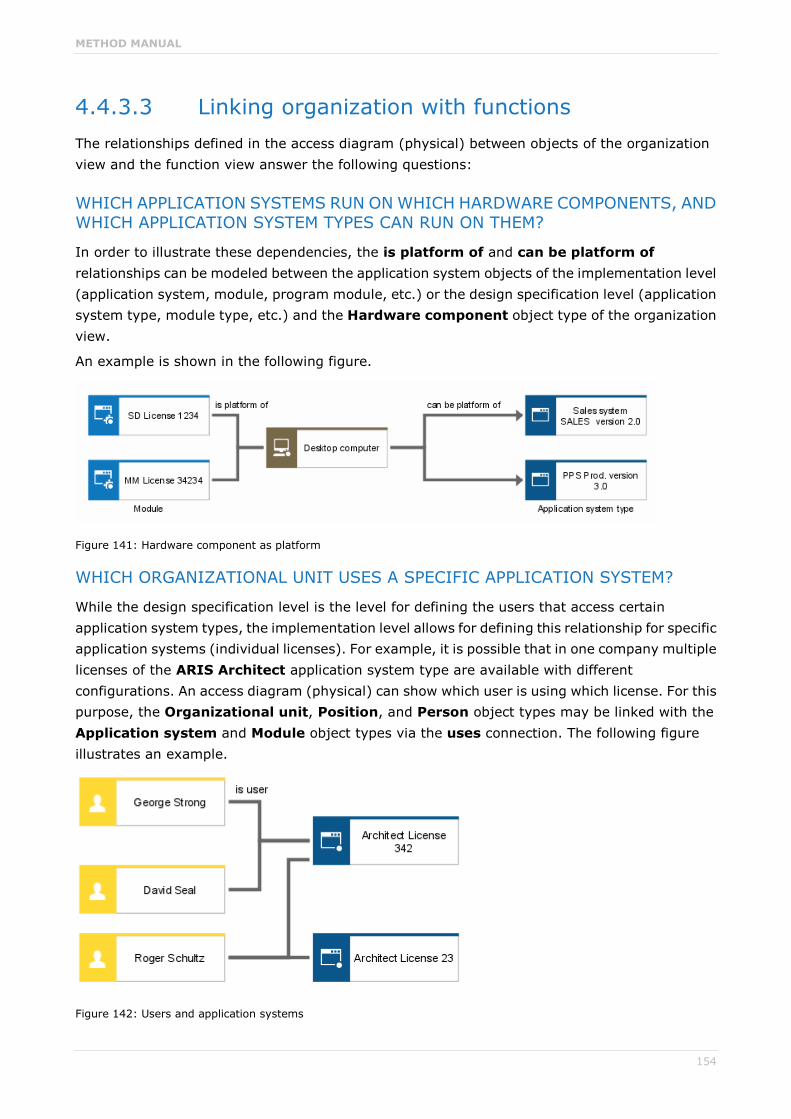
METHOD MANUAL
154
4.4.3.3 Linking organization with functions The relationships defined in the access diagram (physical) between objects of the organization view and the function view answer the following questions:
WHICH APPLICATION SYSTEMS RUN ON WHICH HARDWARE COMPONENTS, AND WHICH APPLICATION SYSTEM TYPES CAN RUN ON THEM?
In order to illustrate these dependencies, the is platform of and can be platform of relationships can be modeled between the application system objects of the implementation level (application system, module, program module, etc.) or the design specification level (application system type, module type, etc.) and the Hardware component object type of the organization view.
An example is shown in the following figure.
Figure 141: Hardware component as platform
WHICH ORGANIZATIONAL UNIT USES A SPECIFIC APPLICATION SYSTEM?
While the design specification level is the level for defining the users that access certain application system types, the implementation level allows for defining this relationship for specific application systems (individual licenses). For example, it is possible that in one company multiple licenses of the ARIS Architect application system type are available with different configurations. An access diagram (physical) can show which user is using which license. For this purpose, the Organizational unit, Position, and Person object types may be linked with the Application system and Module object types via the uses connection. The following figure illustrates an example.
Figure 142: Users and application systems

METHOD MANUAL
155
WHICH COMPANY LOCATIONS HAVE APPLICATION SYSTEMS?
The design specification can use the Application system type - Location relationship to define which application system types may be situated at specific locations in the company. For the purpose of specifying exactly where in the company individual licenses assigned to an application system type are used, the access diagram (physical) may serve to link locations with the Application system, Module, and IT function object types.
An example is shown in the following figure.
Figure 143: Location assignments
The ARIS Method Reference manual on your installation media lists all relationships available in the access diagram (phys.).
METHOD MANUAL
156
4.5 Product/Service modeling ARIS provides various model types for describing a company's products and services.
Products or services are generated or provided in the course of a value creation process. They are the result of a human act or a technical procedure. The term product/service refers to the supply of either services or goods.
Goods can be consumable products, material types, operating resource types, technical operating supply types, or packaging material types. The trigger for creating a product or service is always the demand of an organizational unit or a customer. Goods are offered to the customer in the form of tangible merchandise.
Services are intangible products standing out for the fact that they are simultaneously produced and consumed.
For example, typical providers of pure services are banks, insurance companies, or public authorities.
The stronger the customer orientation in the market segment of a product provider, the more important it is for that provider to closely observe and improve the services in the product environment.
Therefore, the various model types available in ARIS are designed for describing both individual products or services and a combination of products and services.
You can use the following model types for product/service modeling:
Product/Service exchange diagram
Product/Service tree
Product allocation diagram
Product tree
Product selection matrix
Competition model

METHOD MANUAL
157
4.5.1 Product/Service exchange diagram The product/service exchange diagram illustrates the creation of products/services and their exchange within the company. The term product/service refers to the supply of either services or products, each of which is represented by the corresponding symbol. Products can be material types, operating resource types, technical operating supply types, and/or packaging material types, all of which are familiar from the EPC (material flow), for example. Products/Services that are the input for and/or output of functions can be connected with the start and/or end events of these functions.
This product/service exchange between business management functions can be used to advantage at an abstraction level that ranges between the value-added chain diagram and the EPC. The product/service exchange relationships can be illustrated not only from a functional viewpoint, but also from an organizational viewpoint. The product/service exchange diagram provides various modeling options to serve this purpose.
The following figure illustrates an example of a product/service exchange diagram.
Figure 144: Example of product/service exchange in a software company

METHOD MANUAL
158
4.5.2 Product/Service tree Products or services can be looked at from different levels of abstraction. Therefore, it is useful to store the relationships in a model showing which product or service components are making up a complete product or service. This static aspect is represented in the product/service tree. For example, a complex product often contains several modules, each of which has various component parts. Each of these elements can be understood as a product or service.
The has relation with connection, which is also permitted between products or services in the product/service tree, can be used to describe other kinds of dependencies. These include the relationship between a consumer credit and the checking account through which the payments are effected.
Substitution relationships to other products or services such as (potential) replacement products or services can also be represented.
This static model also represents the interrelationship between products or services and the (business) objectives.
The following figure illustrates an example of a product/service tree.
Figure 145: Product/Service tree

METHOD MANUAL
159
4.5.3 Product allocation diagram Besides the general product/service diagrams, which belong to the graphic models, product models are recommended for realizing abstract representations. The product allocation diagram is primarily used to analyze product creation in public administration. Like the product/service exchange diagram, this model type can be used to show which organizational units provide or use which products, and which functions are required for the creation of the products, or for which functions the products provide an input. In addition, the (legal) order basis of each product is shown here. The objectives to be achieved with the various products can be represented as well.
The following figure shows part of a product allocation diagram for public authorities.
Figure 146: Example of a product allocation diagram
Finally, this model type can be used to describe aspects relating to product marketing.
In the following, a simplified example of banking products describes these aspects.
The growth of the Internet and the rising number of private Internet users over the past decades has been accompanied by the spread of online banking. At the same time, the financial power of adolescents has increased, making them more important as a target group.
As a result, the checking account service is now being offered in different forms:
For example, it can be offered as a 'senior citizen account', with the holder being supported by the staff at a branch of the bank. This product is geared particularly to older customers who are less familiar with the new technologies, attach importance to personal support and advice from people they know, and whose mobility is restricted due to their age. The fees charged for such an account may be above average.
Another variant of a checking account may be a low-fee online 'teenager account'. This product is aimed at adolescents aged 12 to 20 who are familiar with Internet technology, but have a lower budget. The fees should therefore be at the lower end of the range.

METHOD MANUAL
160
The following figures show product allocation diagrams for these two product variants:
Figure 147: Product allocation diagram - Checking account
Figure 148: Product allocation diagrams - Sales products
The Teenager account and Senior citizen account services have been created as object variants of the checking account and are identified by the Sales product attribute. A sales product is a product or service rendered by a company. It is offered under different names in

METHOD MANUAL
161
different market segments. Generally, different marketing instruments are used for different sales products.
The ARIS variants component can be used to develop any number of sales products from a given product.
4.5.4 Product tree The purpose of the product tree is to analyze the composition of products in public administration. This model essentially corresponds to the product/service tree, but does not provide the option of modeling replacement products. The product tree is located at the requirements definition level of the product/service view.
The following figure illustrates an example of a product tree.
Figure 149: Classification of the 'Resident and citizenship affairs' product group using a product tree

METHOD MANUAL
162
4.5.5 Product selection matrix In the product selection matrix, the focus is on an organizational unit and the products within its responsibility. The functions required for the products' creation can be allocated to the products. The model is suitable as a starting point enabling navigation to organizational charts, product trees, and processes relevant to the creation of products. The following figure shows an example of a product selection matrix.
Figure 150: Product selection matrix of the social welfare office

METHOD MANUAL
163
4.5.6 Competition model This model supports the analysis and evaluation of a company's competitive environment. The industry structure strongly influences the strategies potentially available to the company.
This model may be used to represent interrelationships between a company, the resulting products or services, and the market partners. It is possible to show which customers are using which products or services, which products or services are provided by suppliers, and which replacement products and services are offered by (potential) competitors. Thus, a view on the competitive situation of the company can be given.
The following figure illustrates an example of a competition model.
Figure 151: Competition in the sports car market
METHOD MANUAL
164
5 Unified Modeling Language (UML) in ARIS
5.1 Introduction UML (Unified Modeling Language) is an object-oriented modeling language whose language constructs are standardized by a working group of the OMG (Object Management Group). UML is based on the object-oriented approaches of OMT, Booch, and OOSE.
5.2 ARIS UML Designer - Supported UML standard ARIS UML Designer 9.x supports the entire UML standard 2.5.
The UML specification is available at http://www.omg.org/spec/UML/2.5/Beta2/PDF/.

METHOD MANUAL
165
6 Object Modeling Technique (OMT)
6.1 Introduction ARIS provides an additional option for object-oriented modeling, the graphic notation Object Modeling Technique (OMT) (cf. Rumbaugh, J.; Blaha, M.; Premerlani, W.; Eddy, F.; Lorensen, W.: Object-Oriented Modeling and Design, Munich et al. 1993). Meanwhile, OMT, along with the Booch and OOSE methods, has been integrated and refined into the Unified Modeling Language (UML), which is also offered in ARIS (see chapter Unified Modeling Language (UML) in ARIS (page 164)). OMT is still provided today to enable compatibility with older versions of ARIS. However, we recommend the use of Unified Modeling Language rather than OMT.
Below, the OMT methodology components are described. Furthermore, the use of the modeling techniques available in ARIS is explained. This description does not replace the detailed description of modeling techniques in the original literature. Its basic objective is to explain how the modeling techniques are handled within ARIS.
6.2 Summary of the OMT methodology The OMT methodology was designed to present different points of view when describing a system. For this purpose, the following methods are used:
Object modeling
Dynamic modeling
Functional modeling
These three views are orthogonal to each other, but cannot be viewed as being entirely independent of one another.
Object modeling represents the static, structural, and data-related aspects of a system. The structure of objects, their relationships to other objects, and their attributes are illustrated.
Dynamic modeling illustrates the aspects of a system that relate to time, behavior, and control. The sequence of operations is described by depicting the sequence of events.
Functional modeling shows the transitional and functional aspects of a system. The transformation of values is described here.
These models contain references to each other. For example, the object model describes data structures that are used in the dynamic model and functional model. The processes in the functional model correspond to the operations in the object model. A statechart diagram of the dynamic model describes - in whole or in part - the behavior of an object of a class in the object model.
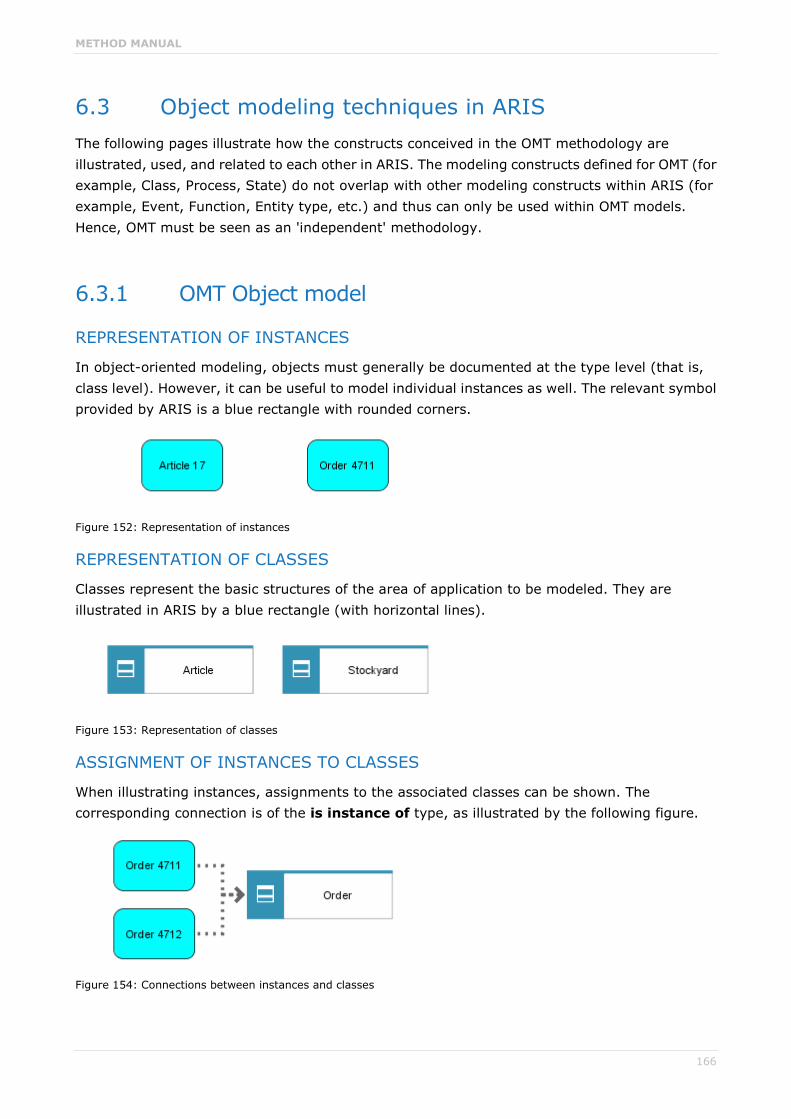
METHOD MANUAL
166
6.3 Object modeling techniques in ARIS The following pages illustrate how the constructs conceived in the OMT methodology are illustrated, used, and related to each other in ARIS. The modeling constructs defined for OMT (for example, Class, Process, State) do not overlap with other modeling constructs within ARIS (for example, Event, Function, Entity type, etc.) and thus can only be used within OMT models. Hence, OMT must be seen as an 'independent' methodology.
6.3.1 OMT Object model
REPRESENTATION OF INSTANCES
In object-oriented modeling, objects must generally be documented at the type level (that is, class level). However, it can be useful to model individual instances as well. The relevant symbol provided by ARIS is a blue rectangle with rounded corners.
Figure 152: Representation of instances
REPRESENTATION OF CLASSES
Classes represent the basic structures of the area of application to be modeled. They are illustrated in ARIS by a blue rectangle (with horizontal lines).
Figure 153: Representation of classes
ASSIGNMENT OF INSTANCES TO CLASSES
When illustrating instances, assignments to the associated classes can be shown. The corresponding connection is of the is instance of type, as illustrated by the following figure.
Figure 154: Connections between instances and classes

METHOD MANUAL
167
ASSIGNMENT OF ATTRIBUTES TO CLASSES
The characteristics of classes are described using attributes. When modeled in ARIS, these are separate objects (and thus also separate symbols) that are linked to the corresponding classes via connections of the has attribute type (see the following figure). The division into two different object types (classes and attributes) is necessary in order to take full advantage of the navigation and report creation capabilities of ARIS.
For each attribute, you can specify whether it is a class attribute (the value is relevant for all instances of the class) or an instance attribute.
Figure 155: Assignment of attributes to classes
ASSIGNMENT OF OPERATIONS TO CLASSES
The functionality assigned to classes is described by defining operations (methods). Here too, a separate object type is available that can be related to classes via a connection of the has operation type (see the following figure).
Figure 156: Assignment of operations to classes
ASSOCIATIONS BETWEEN INSTANCES
Individual instances can be linked to each other. These links are illustrated in ARIS using non-directed connections of the is linked to type.
Figure 157: Associations between instances

METHOD MANUAL
168
ASSOCIATIONS BETWEEN CLASSES
Links (associations) can also exist between classes. You are already familiar with these links from the entity relationship model. They are illustrated by their own symbol (yellow diamond), which enables you to illustrate n-relationships in the same way (see below). The connections are drawn from the class symbol to the diamond symbol and can be assigned degrees of complexity, for which the Multiplicity attribute of the connection is used. The following entries are possible for Multiplicity, some of which also result in a corresponding graphical representation of the connection:
1
c
cn
n
Figure 158: Associations between classes
N ASSOCIATIONS BETWEEN CLASSES
Three-figure (or even n) associations between classes are illustrated by linking a third class or even more classes with the diamond symbol defining the link.
Figure 159: Ternary relationship between classes

METHOD MANUAL
169
MODELING AN ASSOCIATION AS A CLASS
An association can also be understood as an independent object and interpreted as a class. This can be expressed by drawing a directed connection from the diamond symbol to one of the class symbols, where you can subsequently list all attributes and operations (see the following figure). Of course, this 'reinterpreted' class can in turn be associated with other classes.
Figure 160: Modeling an association as a class
REPRESENTATION OF QUALIFIED ASSOCIATIONS
A qualified association adds qualification information to a normal association. This information is a labeled attribute that reduces the cardinality of an association. This makes sense for 1:m and n:m associations since the objects on the m side of an association are differentiated in this manner.
A qualifying association is illustrated by adding the qualification information to the connection. For this purpose, the Qualifier attribute is provided. As with all attributes it can also be shown in the graphic.
Figure 161: Representation of qualified associations

METHOD MANUAL
170
REPRESENTATION OF ORDERS FOR ASSOCIATIONS
If objects on the n side of an association are arranged in a certain order, you can note this explicitly in the graphic. For this purpose, a separate attribute exists at the connection between the 'Class' and 'Association' symbols.
Figure 162: Representation of orders for associations
AGGREGATION BETWEEN CLASSES
An aggregation represents a part-whole relation and can be understood as a special form of association. This relation is modeled as a directed relationship between classes (with the aggregates connection type). In the graphic, a white diamond symbol is used for the class representing the 'whole' (component group).
Figure 163: Aggregation between classes

METHOD MANUAL
171
GENERALIZATION AND INHERITANCE
One basic construct of object-oriented modeling is the definition of hierarchies between classes, within which subordinate classes can inherit attributes and operations from superior classes. In ARIS, a separate object type exists for this purpose (green triangle). It is linked to the participating classes (see the following figure). Multiple inheritance can also be illustrated.
The generalization operator may be assigned an attribute indicating which aspect is used for generalization/specialization and whether the specialization is disjoint or non-disjoint.
Figure 164: Representation of the generalization/specialization relationship between classes

METHOD MANUAL
172
RESTRICTIONS (CONSTRAINTS) FOR CLASSES, ATTRIBUTES, AND ASSOCIATIONS
Restrictions (constraints) are functional relationships between classes, attributes, and associations of an OMT Object model. In ARIS, separate object types (dot) are defined for constraints on attributes. The following figure illustrates an example showing that the height-to-width ratio for windows can take values from 0.7 to 1.7.
Figure 165: Representation of attribute constraints
You can also define restrictions referring to associations. The example in the following figure shows that the set of persons forming the board of a committee naturally represents a subset of all committee members. This fact can be illustrated by drawing a directed connection between the association symbols.
Figure 166: Representation of association constraints

METHOD MANUAL
173
EXAMPLE OF AN OMT OBJECT MODEL
The following figure shows a typical example of an OMT Object model including the main modeling constructs.
Figure 167: Example of an OMT Object model
6.3.2 OMT Dynamic model The OMT Dynamic model is a set of transition diagrams where one transition diagram usually describes the behavior of one class. The states are interlinked by means of directed connections that represent events.
REPRESENTATION OF INITIAL STATES, FINAL STATES, AND TRANSITIONS
ARIS contains three symbols to differentiate between initial states, final states, and transitions.
Figure 168: Representation of initial states, final states, and transitions

METHOD MANUAL
174
TRANSITION BETWEEN STATES
Transitions between states are triggered by events. The connection between two states is of the has transition to type.
Figure 169: Representation of the transition between states
You can add further information to both states and transitions. The attributes do/action, entry/action, exit/action, and event/action can be used to describe the start, end, and internal actions of a state. The condition for a transition can also be described in more detail at the connection between two states.
Figure 170: Representation of additional transition information

METHOD MANUAL
175
EXAMPLE OF AN OMT DYNAMIC MODEL
The following figure illustrates a typical example of an OMT Dynamic model.
Figure 171: Example of an OMT Dynamic model

METHOD MANUAL
176
6.3.3 OMT Functional model With the help of data flow diagrams, the OMT Functional model shows how to derive output data from input data during a calculation.
REPRESENTATION OF DATA STORES
Data stores are used for passive data storage. In ARIS, they are represented by a symbol showing two horizontal lines.
Figure 172: Representation of data stores
REPRESENTATION OF PROCESSES
Processes transform data and are represented in ARIS as yellow ellipses.
Figure 173: Representation of processes
REPRESENTATION OF ACTORS
An actor is an object that activates the data flow by creating or consuming data values. Thus, actors can be understood as the sources and sinks of the graph and are represented by a square.
Figure 174: Representation of actors
REPRESENTATION OF DATA FLOWS
Data flows connect the input of a process or object with the input of another. They are modeled as objects of the Data value type between objects and are generally labeled with a description of the data.
Figure 175: Representation of data flows

METHOD MANUAL
177
DATA FLOW SPLITTING
If a data value is to be sent to different locations, the data flows can be split. ARIS uses its own symbols ('Connection') to represent such splits.
Figure 176: Representation of data flow splitting

METHOD MANUAL
178
EXAMPLE OF AN OMT FUNCTIONAL MODEL
The following figure illustrates a typical example of an OMT Functional model.
Figure 177: Example of an OMT Functional model

METHOD MANUAL
179
6.3.4 How to arrange objects in a hierarchy The Class object type can be arranged in a hierarchy using an OMT Dynamic model to
document transitions within this class.
The Class object type can be arranged in a hierarchy using an OMT Class description model to allocate attributes and operations to this class. The possible relationships in this model represent a subset of the OMT Object model.
The State, Final state, and Initial state object types can be refined in an OMT Dynamic model to enable state descriptions at various hierarchy levels.
The Process object type can be refined in an OMT Functional model to enable data flow descriptions at various hierarchy levels.
The Data store object type can be arranged in a hierarchy using an OMT Object model.
The connection types of the OMT Functional model can be illustrated more precisely by means of an OMT Object model or an OMT Data value decomposition model to document the details of a data flow.
METHOD MANUAL
180
7 Methods for knowledge management
7.1 Introduction The purpose of knowledge management is the systematic control of knowledge, an increasingly important company resource. It encompasses development, monitoring, support, and improvement of strategies, processes, organizational structures, and technologies for effective knowledge processing within a company. This includes all activities relating to acquisition, preparation, transmission, and utilization of knowledge. These knowledge management activities generally do not occur in isolation; they occur primarily in the operational and scheduling business processes of the company. Hence, an integrated view of business processes, knowledge processing, organizational structures, information systems, etc. is needed.
Most of these aspects can be depicted using established ARIS methods (for example, EPCs, organizational charts, function allocation diagrams, eERMs, etc.). However, accurate representation, analysis, and improvement of knowledge processing requires additional means of representation to identify and structure the content of relevant knowledge categories, to describe the distribution of knowledge within an organization, and to model knowledge creation and utilization in business processes.
For this reason, two new object types, Knowledge category and Documented knowledge, and two new model types, Knowledge structure diagram and Knowledge map, have been added. Furthermore, existing model types used for the representation of business processes (EPC, PCD, Office process, etc.) were extended to include constructs for handling knowledge creation and utilization. The new object and model types are methodically integrated into the main model types of the requirements definition (for example, eERM, organizational chart, function tree), thus ensuring an integrated perspective. For example, this would enable models from a business process optimization project to be used for the purpose of analyzing and improving knowledge processing.
The knowledge structure diagram is located in the data view of the requirements definition. The knowledge map, like the extended model types for business process modeling, belongs to the control view of the requirements definition.

METHOD MANUAL
181
7.2 Object types for modeling knowledge processing
7.2.1 Knowledge category The Knowledge category object type, represented by an oval thought bubble (see figure Knowledge structure diagram (page 183)), illustrates an object with content referring to specific knowledge. Examples of knowledge categories include project management knowledge, specific industry knowledge, specific technology knowledge, customer and competitor knowledge, etc. These categories assist in classifying a company's existing or required knowledge.
Knowledge assigned to a particular knowledge category can be either implicit knowledge, that is, knowledge that cannot be fully documented as it is available in the form of employee or group skills, or explicit knowledge that can be documented in the form of descriptions or technical drawings. Knowledge categories often contain both. For example, project management knowledge can include project managers' experiences on the one hand and information provided in a project management manual on the other.
In addition to general attributes like Description, Remark, Source, etc., the following specific attributes serve to describe knowledge categories in more detail:
Attribute name Value range Description/Example
Updating frequency Enumeration type: hourly, daily, weekly, monthly, annually, seldom, never
The updating frequency describes how often the knowledge of the relevant category must be refreshed to be up-to-date. For example, basic trigonometry knowledge needs to be updated rarely or, for practical purposes, never, whereas knowledge of certain stock prices must be updated daily or even hourly.
Significance Percentage: 0..100
The significance of the knowledge category for the company can range from 0% (totally unimportant) to 100% (extremely important).
Degree of coverage Percentage: 0..100
The current degree of coverage for the relevant knowledge in the company can range from 0% (not covered at all) to 100% (maximum possible coverage).
If the degree of coverage of a knowledge category is to be represented by a particular organizational unit or person, the corresponding attribute of the has at disposal connection type can be used to specify this in a knowledge map.

METHOD MANUAL
182
Attribute name Value range Description/Example
Knowlegde advantage
Percentage: 0..100
The relative advantage of your company over the competition in terms of knowledge can range from 0% (the competition has the greatest possible advantage over your company) to 100% (your company has the greatest possible advantage over the competition).
Knowledge usage Percentage: 0..100
The degree of utilization of a particular knowledge category can range from 0% (relevant knowledge is not utilized at all) to 100% (optimal utilization of relevant knowledge).
Desired degree of coverage
Percentage: 0..100
The desired degree of coverage for relevant knowledge can range from 0% (not covered at all) to 100% (maximum possible degree of coverage).
Future significance Enumeration type: sharply falling, falling, stable, rising, sharply rising
Future significance depicts the expected tendency of a knowledge category to change in significance for the company.
Structural
change speed
Percentage: 0..100
The structural change speed is a measure of how fast the methods applied to acquire relevant knowledge must change (0%: no change, 100% maximum change speed).
These attributes are used to assess the significance of the relevant knowledge category for the company. They can therefore serve as the basis for identifying important or urgent measures aimed at improving the company's knowledge management. It is often helpful to display such values graphically. Copying and pasting the values from the Attributes window into a table calculation program that can create the desired models is a simple way to do so. For example, it is possible to compare the current and desired degree of coverage in a bar chart for the knowledge categories under consideration.
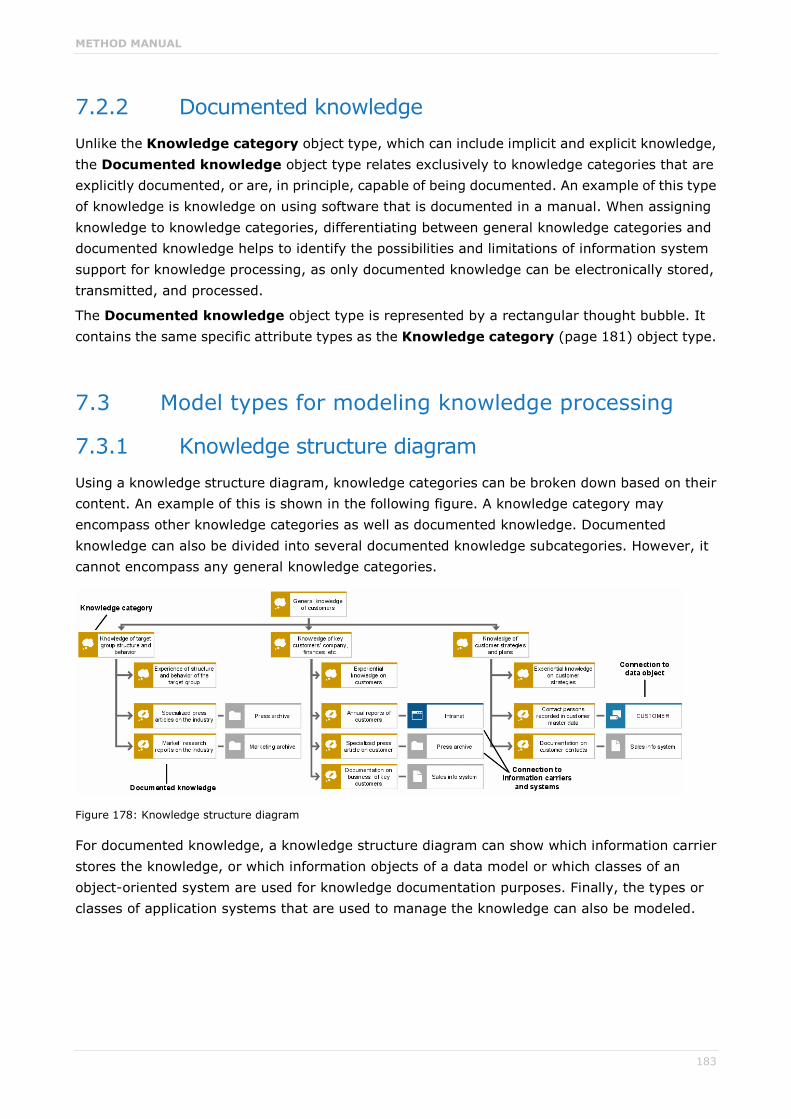
METHOD MANUAL
183
7.2.2 Documented knowledge Unlike the Knowledge category object type, which can include implicit and explicit knowledge, the Documented knowledge object type relates exclusively to knowledge categories that are explicitly documented, or are, in principle, capable of being documented. An example of this type of knowledge is knowledge on using software that is documented in a manual. When assigning knowledge to knowledge categories, differentiating between general knowledge categories and documented knowledge helps to identify the possibilities and limitations of information system support for knowledge processing, as only documented knowledge can be electronically stored, transmitted, and processed.
The Documented knowledge object type is represented by a rectangular thought bubble. It contains the same specific attribute types as the Knowledge category (page 181) object type.
7.3 Model types for modeling knowledge processing
7.3.1 Knowledge structure diagram Using a knowledge structure diagram, knowledge categories can be broken down based on their content. An example of this is shown in the following figure. A knowledge category may encompass other knowledge categories as well as documented knowledge. Documented knowledge can also be divided into several documented knowledge subcategories. However, it cannot encompass any general knowledge categories.
Figure 178: Knowledge structure diagram
For documented knowledge, a knowledge structure diagram can show which information carrier stores the knowledge, or which information objects of a data model or which classes of an object-oriented system are used for knowledge documentation purposes. Finally, the types or classes of application systems that are used to manage the knowledge can also be modeled.
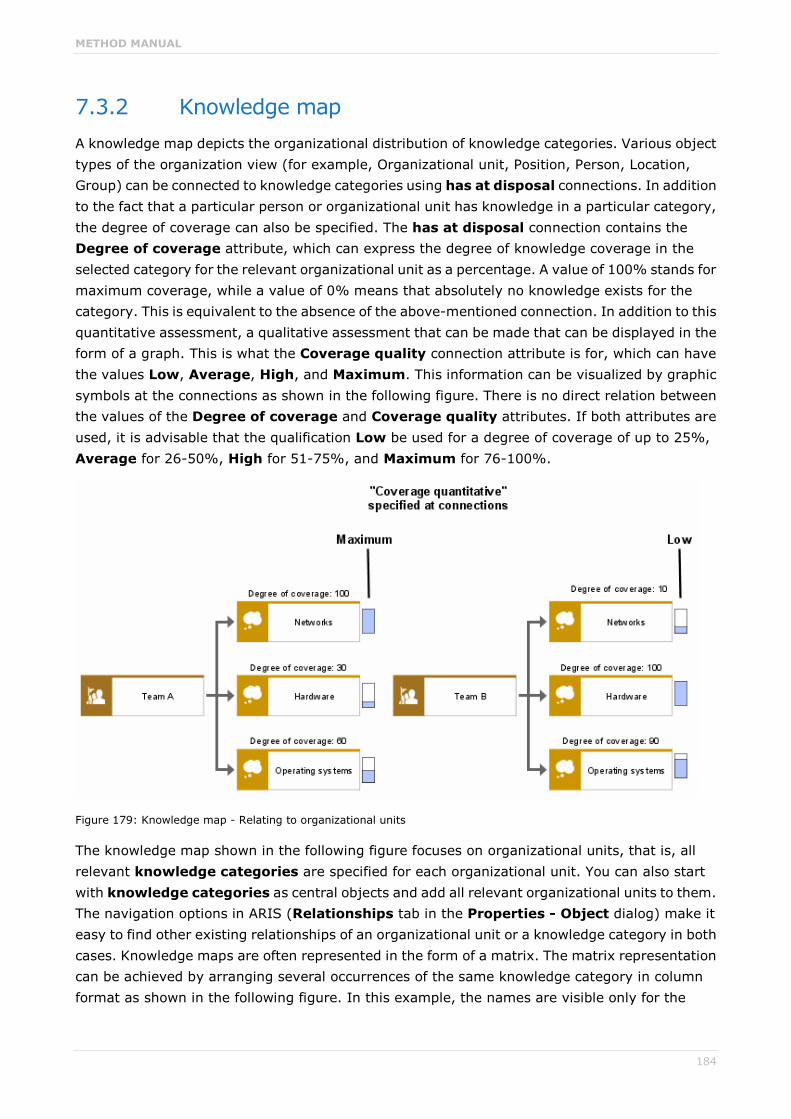
METHOD MANUAL
184
7.3.2 Knowledge map A knowledge map depicts the organizational distribution of knowledge categories. Various object types of the organization view (for example, Organizational unit, Position, Person, Location, Group) can be connected to knowledge categories using has at disposal connections. In addition to the fact that a particular person or organizational unit has knowledge in a particular category, the degree of coverage can also be specified. The has at disposal connection contains the Degree of coverage attribute, which can express the degree of knowledge coverage in the selected category for the relevant organizational unit as a percentage. A value of 100% stands for maximum coverage, while a value of 0% means that absolutely no knowledge exists for the category. This is equivalent to the absence of the above-mentioned connection. In addition to this quantitative assessment, a qualitative assessment that can be made that can be displayed in the form of a graph. This is what the Coverage quality connection attribute is for, which can have the values Low, Average, High, and Maximum. This information can be visualized by graphic symbols at the connections as shown in the following figure. There is no direct relation between the values of the Degree of coverage and Coverage quality attributes. If both attributes are used, it is advisable that the qualification Low be used for a degree of coverage of up to 25%, Average for 26-50%, High for 51-75%, and Maximum for 76-100%.
Figure 179: Knowledge map - Relating to organizational units
The knowledge map shown in the following figure focuses on organizational units, that is, all relevant knowledge categories are specified for each organizational unit. You can also start with knowledge categories as central objects and add all relevant organizational units to them. The navigation options in ARIS (Relationships tab in the Properties - Object dialog) make it easy to find other existing relationships of an organizational unit or a knowledge category in both cases. Knowledge maps are often represented in the form of a matrix. The matrix representation can be achieved by arranging several occurrences of the same knowledge category in column format as shown in the following figure. In this example, the names are visible only for the

METHOD MANUAL
185
knowledge categories displayed at the top, which look similar to the header of a table. For the other occurrences, the names were removed using the attribute placement function. This figure also shows an alternative visual representation option for differing degrees of coverage: the knowledge categories are scaled in different sizes.
Figure 180: Knowledge map - Matrix representation

METHOD MANUAL
186
7.3.3 Representation of knowledge processing in business processes
The utilization and creation of knowledge in the company's business processes is modeled using the model types available for representing business processes (EPC, EPC (material flow), Office process, Industrial process, PCD, PCD (material flow)). The Knowledge category and Documented knowledge object types are now available in these model types. It is possible to specify for a function which kind of knowledge (general or documented) is required for its execution and which knowledge is created and/or documented during its execution. This type of representation enables business processes to be examined in terms of the knowledge processing involved. For example, gaps in required knowledge can be revealed. Besides, the qualification profile needed to carry out a function can be determined.
Figure 181: Knowledge processing in an EPC

METHOD MANUAL
187
8 Balanced Scorecard method
8.1 Introduction If companies want to survive in the turbulent business environment and global competition of today's markets, they need the best possible business processes. However, it is just as important for them to be able to react to new developments in the business environment, quickly and in line with the strategic business objectives. This requires efficient management processes that enable consistent implementation of corporate strategies and achievement of strategic objectives in day-to-day business by means of operational initiatives.
Many traditional management approaches do not establish the connection between the formulation of corporate strategies and their implementation based on strategy-oriented initiatives, or consistent control of the achievement of strategic objectives.
In addition, many companies are still run purely on the basis of financial KPIs which are of limited use since they relate mainly to past performance and thus cannot provide much information relevant to future management. Only by looking at the reasons for financial success (customers, processes, innovation, etc.) it will be possible, at an early stage, to identify factors that might prevent the achievement of strategic objectives.
The Balanced Scorecard approach offers a methodology with a structure that is easy to understand and implement, and that helps to avoid weak points.
8.2 The Balanced Scorecard concept
8.2.1 Key elements of the BSC approach The Balanced Scorecard approach is a strategic management system first proposed by Robert Kaplan and David Norton in 1992 ('The Balanced Scorecard - Measures that drive Performance', Harvard Business Review, January/February 1992). It was developed from the results of research on the subject of Approaches to performance measurement. This research found that performance measurement systems geared exclusively to financial KPIs are likely to impede value-adding activities in many companies. Built on these findings, Kaplan and Norton set out to collaborate with innovative businesses to create a system of KPIs that would make it possible to optimally measure the realization of a company's visions and strategies.
The Balanced Scorecard approach associates KPIs with various views of the company (so-called perspectives). These include internal performance perspectives (for example, learning and growth perspective, process perspective) and external performance perspectives (for example, customer perspective, economic/financial perspective). Due to this arrangement of KPIs, a certain balance between short-term and long-term goals, financial and non-financial KPIs, leading and lagging indicators, and internal and external views can be achieved. The integration of industry-specific KPIs adds a further benchmarking component to the concept.
The pure performance measurement approach has evolved into a comprehensive management system for goal-oriented corporate management, starting from corporate vision and individual

METHOD MANUAL
188
competitive strategies to the formulation and control of initiatives using balanced KPIs. Therefore, the Balanced Scorecard approach is more than just a system of performance measurement KPIs. It assists companies in communicating and implementing their corporate strategy and supports the resulting strategic learning process (double-loop learning).
8.2.2 Strategic management process and Balanced Scorecard
Figure 182: BSC as a structure for strategic management
The strategic management process in the context of the Balanced Scorecard approach comprises two phases:
1. In the first phase, the company's strategy must be established on the basis of strategic analysis. Within the scope of this analysis, all data relating to competition are being recorded. The aim of this analysis is to identify and assess trends, opportunities, and risks pertaining to the development of the business environment, and to determine the company's own core competencies. At the end of this phase, the company's individual corporate strategy is defined.
2. The implementation of the corporate strategy takes place in the second phase. In this phase, the BSC method can help. The corporate strategy may be refined with partial strategies (for example, business segment-specific strategies). This leads to further strategic objectives. These are concretized on the basis of targets for particular measurement categories. An action program in the form of instructions on how to proceed determines how these objectives are to be achieved. Within the scope of business planning, this action program is broken down into various corporate divisions or departments. Budgeting can be used to put actions into more concrete terms. With the help of individual strategy-related scorecards, the achievement of objectives can be measured by the KPIs generated. Based on the scorecards
METHOD MANUAL
189
defined, a review process takes place during which further initiatives are specified or the strategy is 'reworked' due to possible deviations.
8.2.2.1 Formulation and realization of vision and strategy
The strategy of a company results from its vision.
The vision represents a superior mission statement for the company under consideration; as a general, but striking statement it is vague, yet serves as the prime principle of action and as such expresses a sort of short version of the company's philosophy.
Individual strategies are determined for different strategic business units. These strategies must be geared to the performance goals of the company. Therefore, it is necessary that prior to introducing a BSC, senior management holds a workshop to determine the vision and resulting strategies for the strategic business units. In most cases, this involves setting a financial target (financial perspective). The focus may vary: Possible objectives are particular values for return on capital employed, ROI, shareholder value, sales revenue, or cash flow. The financial objectives need to be realized through specific behavior on the relevant market (customer perspective). Therefore, after defining the objectives, appropriate market and customer segments are selected. This customer perspective also involves the definition of strategic objectives and the identification of relevant KPIs. For example, they may relate to market shares or growth rates in a given customer segment.
Appropriate company resources are required to implement specific market-oriented strategies. When establishing a Balanced Scorecard, resources are divided into two categories as follows:
1. Once the financial and customer objectives are defined, the main business processes (process perspective) are looked at, objectives determined, and initiatives and KPIs generated. The focus is usually on process times and costs.
2. As part of the so-called learning and growth perspective, strategic objectives for human resources development, information technology, and innovation are derived from the strategic objectives of the financial, customer, and process perspectives.
When setting up a Balanced Scorecard, all strategic objectives defined are mutually interactive, which is known as the cause-and-effect chain.
For the first step to be effective it is important that a general consensus on the vision, strategies, and resulting strategic objectives be reached at the management level.
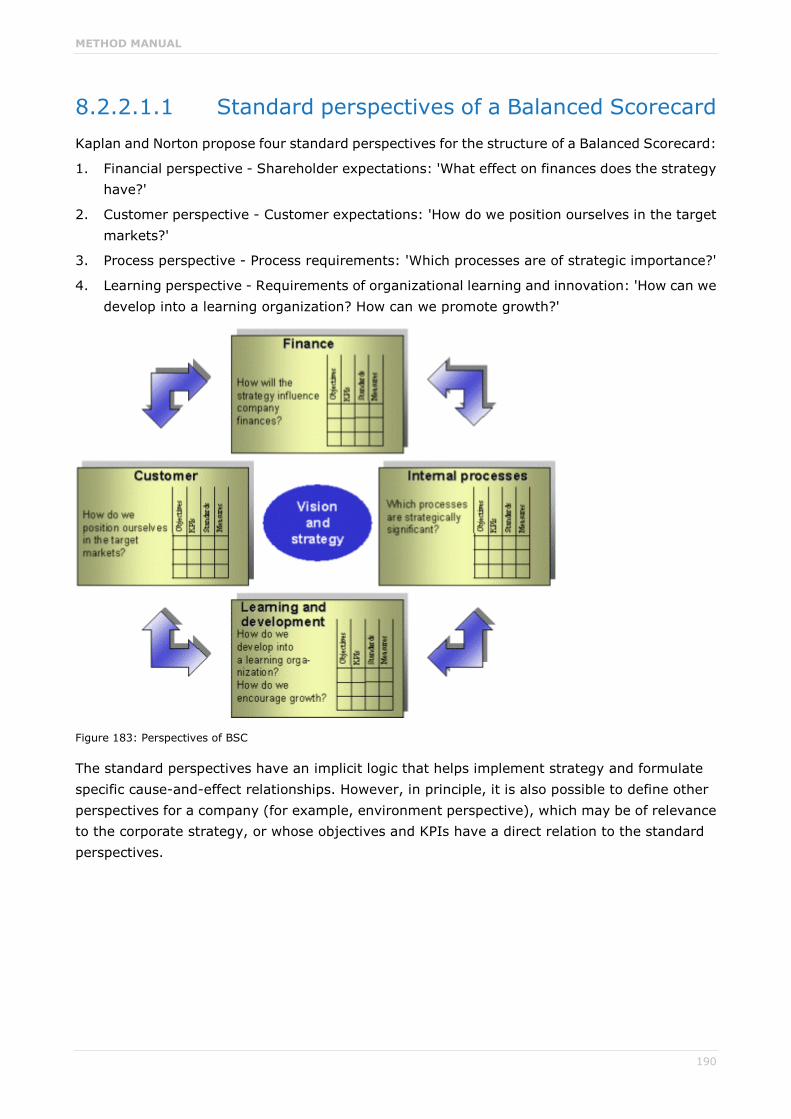
METHOD MANUAL
190
8.2.2.1.1 Standard perspectives of a Balanced Scorecard Kaplan and Norton propose four standard perspectives for the structure of a Balanced Scorecard:
1. Financial perspective - Shareholder expectations: 'What effect on finances does the strategy have?'
2. Customer perspective - Customer expectations: 'How do we position ourselves in the target markets?'
3. Process perspective - Process requirements: 'Which processes are of strategic importance?'
4. Learning perspective - Requirements of organizational learning and innovation: 'How can we develop into a learning organization? How can we promote growth?'
Figure 183: Perspectives of BSC
The standard perspectives have an implicit logic that helps implement strategy and formulate specific cause-and-effect relationships. However, in principle, it is also possible to define other perspectives for a company (for example, environment perspective), which may be of relevance to the corporate strategy, or whose objectives and KPIs have a direct relation to the standard perspectives.

METHOD MANUAL
191
8.2.2.1.2 Cause-and-effect chain The cause-and-effect chain defines the cause-and-effect relationships between individual objectives of a strategy, that is, across the defined perspectives of the KPIs. In other words, it describes how the objectives of the perspectives can be achieved. The perspectives themselves form the general conditions for the cause-and-effect chain ('force field of the company'). It can be assumed that improvements in the learning and growth perspective environment have a direct and positive effect on the objectives and KPIs of the internal process perspectives. Furthermore, developments in the process perspective also have a positive impact on the objectives and KPIs of the customer perspective, which in turn leads to an improvement in the financial objectives.
Within the scope of developing a Balanced Scorecard system that is to be valid throughout the company, objectives and KPIs are defined for each strategy, and the relationships between them are represented within and across the perspectives. Based on the objectives and KPIs specified in the financial perspective, corresponding 'positive agents' (performance drivers) are determined in the customer perspective. In a next step, these are broken down to the learning and growth perspective via the internal process perspective. This procedure allows strategies of a company or division to be split into subobjectives and KPIs, and corresponding operational initiatives to be derived from them.
By establishing a cause-and-effect chain and defining the KPIs, a balance is implicitly created between leading and lagging indicators.
8.2.2.1.3 Definition of leading and lagging indicators The establishment of cause-and-effect chains also produces a temporal connection between individual objectives and KPIs. Generally, performance drivers - so-called leading indicators - are part of the learning and growth perspective and the process perspective and come before the effects of the customer perspective and financial perspective. Most KPIs in the customer and financial perspectives are result indicators that measure business success; as so-called lagging indicators they focus on the past.
Both leading and lagging indicators should be defined in every Balanced Scorecard perspective so that the interrelationships between initiatives and the achievement of objectives can be represented. The leading indicators enable you to detect deviations from given objectives at an early stage.
METHOD MANUAL
192
8.2.2.2 Communication and derivation of further scorecards
The effectiveness of a corporate strategy and its realization using the Balanced Scorecard concept depends on the corporate scorecard's recognition and acceptance throughout the company. For this reason it is vital that corporate strategies and the corporate scorecard are promoted at all hierarchy levels of the company through a comprehensive communication campaign.
In a top-down approach, targets are derived from the superior corporate strategy (corporate scorecard) for the subordinate hierarchy levels of the company, and superior strategic objectives are adapted to match specific departmental goals. KPIs measuring the degree of goal accomplishment are generated for these objectives, too. Various initiatives are required in the different corporate divisions in order to achieve the objectives, and these initiatives are recorded in the scorecards of the underlying hierarchy levels. All targets must be based on long-term strategic considerations reaching beyond short-term results that may be inconsistent with the overall strategy. An example of a short-term result is a reduction in costs based on a short-term increase in the level of production.
8.2.2.3 Planning and targets The BSC can be used to combine the process of strategy implementation at the various corporate hierarchy levels with the budgeting process. The purpose of this combination is to align all resources with the corporate strategy.
The BSC is integrated in four steps into the long-term strategic planning and budgeting process.
1. Ambitious targets are set that are communicated to and accepted by the employees. The relevant KPIs relating to the results in the client and financial perspectives are identified by the cause-and-effect relationships between the KPIs.
2. Strategic initiatives must set out exactly at the KPIs with the greatest discrepancy between current value and target value. In the long term, this procedure aligns capital investments and action programs with strategically significant target values.
3. Critical, company-wide initiatives are identified to create synergies with the strategic objectives.
4. Based on budgets of varying maturities (5, 3, and 1-year plan), KPI plan values are linked to business planning.

METHOD MANUAL
193
8.2.2.4 Strategic learning and feedback The Balanced Scorecard concept contributes to strategic learning in the company and offers the possibility to give feedback on strategy realization.
Strategic learning is aimed at every single employee and at the entire company as a learning organization. Employees should be acquainted with the strategy and align their actions with it. During a defined feedback process, performance data is gathered to assess whether the strategy has been realized. Assumptions are checked by verifying previously established hypotheses on cause-and-effect relationships of strategic objectives.
This is how double-loop learning comes into being, where strategic targets are subjected to critical review in a bottom-up process, after which new cause-and-effect relationships are generated. These result in a more efficient pursuit of strategy due to a continuously growing information base.
Feedback is therefore extremely important as it represents the counterprocess to breaking down BSCs. Feedback comprises not only the reporting of KPIs in the form of plan progress figures, but also suggestions for further initiatives and new interrelations. It reveals potential inconsistencies in the pursuit of strategy.

METHOD MANUAL
194
8.2.3 Advantages and benefits of the Balanced Scorecard The advantage of the Balanced Scorecard method lies in its consistent, strategy-oriented corporate management, which includes the lowest levels of a company, where strategy-based operational initiatives are derived. All resources and all employees of a company are aligned with the corporate strategy. The strategy is consistently communicated and monitored through Balanced Scorecards.
The Balanced Scorecard method overcomes the disadvantages of traditional KPI systems in corporate management:
No limitation to financial KPIs
No pure focus on the past
Qualitative data also considered
Reduction of complexity, consensus building
Strategic objectives as the starting point of the Balanced Scorecard approach
Focus on management bottlenecks, not on existing data
Acceleration of required changes
The Balanced Scorecard method is ideal for strategy-oriented corporate management as it overcomes the following barriers:
Concretization barrier: In traditional management approaches, vision and strategy are theoretical formulations; the derivation of specific (operational) action plans is not consistently pursued.
Vision barrier: The strategy is often not understood by those employees who have to implement it.
Commitment barrier: Strategies are not associated with specific departmental or individual objectives.
Implementation barrier: Reporting is geared to operational-monetary objectives, rather than strategic objectives.
Operational barrier: The budgeting process is separated from the strategic planning process.

METHOD MANUAL
195
8.3 Developing a Balanced Scorecard with ARIS BSC
8.3.1 Terms and abbreviations Vision: A vision indicates the future strategic thrust and mission of a company and is realized through various strategies.
Strategy: Strategies are developed based on the vision. Strategies can be split into specific substrategies.
Strategic objective: Each strategy consists of a certain number of strategic objectives. Generally, management determines strategic objectives in workshops. Objectives are interconnected according to cause-and-effect relationships and chronology.
Success factor: A success factor influences the success of a company's business operations. It may interact with other success factors and direct them towards a specific behavior with a particular degree of effectiveness.
View/Perspective: A perspective puts a certain view of the company in more concrete terms. In principle, the selection of perspectives should include the following views of a company: human-oriented view, internal view, process-oriented view, and external view.
KPI: Each strategic objective or success factor is allocated KPIs to measure performance and achievement of objectives.
Actual value: Current value of a KPI, strategic objective, or success factor. Based on the actual value, the current degree of goal accomplishment can be derived by means of a planned-actual comparison.
Plan value: Plan value of a KPI, strategic objective, or success factor set as the target for a particular period. In the case of strategic objectives, this is usually a percentage derived from the weighted achievement of objectives of individual KPIs. A plan value can be broken down into individual periods and takes account of periodic fluctuations. Plan values represent a degree of goal accomplishment of 100 %.
Target value: Value set as the target for a period in the future. Generally, this value becomes the plan value once the target period is reached.
Minimum value: Smallest possible value that an objective, critical success factor, or KPI can have. In ARIS, the minimum value is set to 0 by default. However, it can be modified.
Maximum value: Highest possible value (upper limit) a strategic objective, a success factor, or a KPI can have. In ARIS, it is generally used to standardize the representation of multiple KPIs so that they can be compared.
Warning limit: The warning limit corresponds to the plan value, that is, the plan value corresponds to the limit at which the value of a KPI, strategic objective, or success factor falls short of an expected target.
Tolerance range: The tolerance range is the negative deviation from the plan value for a strategic objective, KPI, or success factor that can still be accepted.
Alarm limit: The alarm limit denotes the plan value minus the tolerance range. All values of a strategic objective, KPI, or success factor that fall below the alarm limit are no longer acceptable.

METHOD MANUAL
196
Initiative: An initiative influences a single objective or a number of strategic objectives. Generally, initiatives are assigned a person responsible for them, and they have a starting point, an end point, resources, etc.
Indicator type: A KPI can be of the Leading indicator or Lagging indicator type. A leading indicator measures a performance driver and is an indicator pointing to the future. A lagging indicator measures a result (result indicator) and is retrospective. Economic/Financial targets are generally lagging indicators, while the targets of process, learning, and growth perspectives are increasingly leading indicators. It is recommendable to include lagging indicators in the perspectives in order to represent cause-and-effect relationships between KPIs.
Data source: Each KPI has a data source from which it can be transferred to the Balanced Scorecard system.
8.3.2 Creating Balanced Scorecards with ARIS BSC
8.3.2.1 Specification of perspectives At the start of a Balanced Scorecard project, the perspectives should be specified within the strategic plan. These perspectives are valid for all corporate scorecards.
The Perspective object type is available for this purpose. Perspectives can be modeled in the BSC cause-and-effect diagram.
Perspectives are linked via the is influenced by connection. There is no need to define a specific sequence. However, establishing a logical structure (with the individual perspectives arranged in a sequence) considerably simplifies automatic generation of a model. Furthermore, the logical structure of the cause-and-effect chain becomes more transparent.

METHOD MANUAL
197
8.3.2.2 Balanced Scorecard system structure specification
The following models provide the framework for creating a Balanced Scorecard system:
Organizational chart
A Balanced Scorecard system can be structured in line with the organizational structure of a company. Any number of BSC cause-and-effect diagrams can be assigned to the objects of the organizational chart (for example, for variant creation, history management, etc.). This assignment establishes a connection between the objectives required for strategy implementation and the corresponding organizational units. Based on the organizational chart, the Balanced Scorecard system of a company can be broken down from the highest corporate level to the level of individual departments or employees.
Structuring model
If a company prefers to create its Balanced Scorecard system based on strategic business segments rather than the organizational chart, the structuring model is available as a starting model for the balanced scorecard structure. In this case, any number of BSC cause-and-effect diagrams can be assigned to a structuring object.
Value-added chain diagram or function tree
As the Balanced Scorecard is meant to be an instrument for performance management and performance measurement, the Balanced Scorecard system can be established in ARIS with a view to value-added criteria. The value-added chain diagram or the function tree can be used for this purpose.
8.3.2.3 Cause-and-effect relationship specification The objects of the organizational chart and the functions or structural elements of the structuring model, which determine the company-wide structure of the Balanced Scorecard, are assigned BSC cause-and-effect diagrams.
In the BSC cause-and-effect diagrams, the strategic objectives and success factors required for successful strategy implementation are defined, and their mutual influence is illustrated by means of the various Balanced Scorecard perspectives. First, the individual perspectives used in all cause-and-effect chains of the company are created as objects in ARIS.
The BSC cause-and-effect diagram is a lane model which allows the Perspective object types to be stored in the Relevant perspectives column and the Strategy object types to be stored in the Strategy row. The Objective, Success factor, and KPI object types can be modeled in the cause-and-effect columns. The degree of effectiveness of the strategic objectives and their success factors are described in the cause-and-effect column. The greater the effectiveness, the thicker the arrow that represents it.
Furthermore, success factors for a Balanced Scorecard can be defined in the BSC cause-and-effect diagram. By using the Success factors object type, you can include other

METHOD MANUAL
198
factors on which the company has no direct influence and their KPIs in the Balanced Scorecard (for example, market growth).
The BSC cause-and-effect diagram can be found at the requirements definition level of the control view.
Figure 184: BSC Cause-and-effect diagram
The Objective and Success factor object types in the modeling column of the BSC cause-and-effect diagram can be assigned a BSC KPI allocation diagram only.

METHOD MANUAL
199
The following symbols are used in the BSC cause-and-effect diagram:
Symbol Object type
Perspective
Strategy
Objective
Success factor
KPI instance
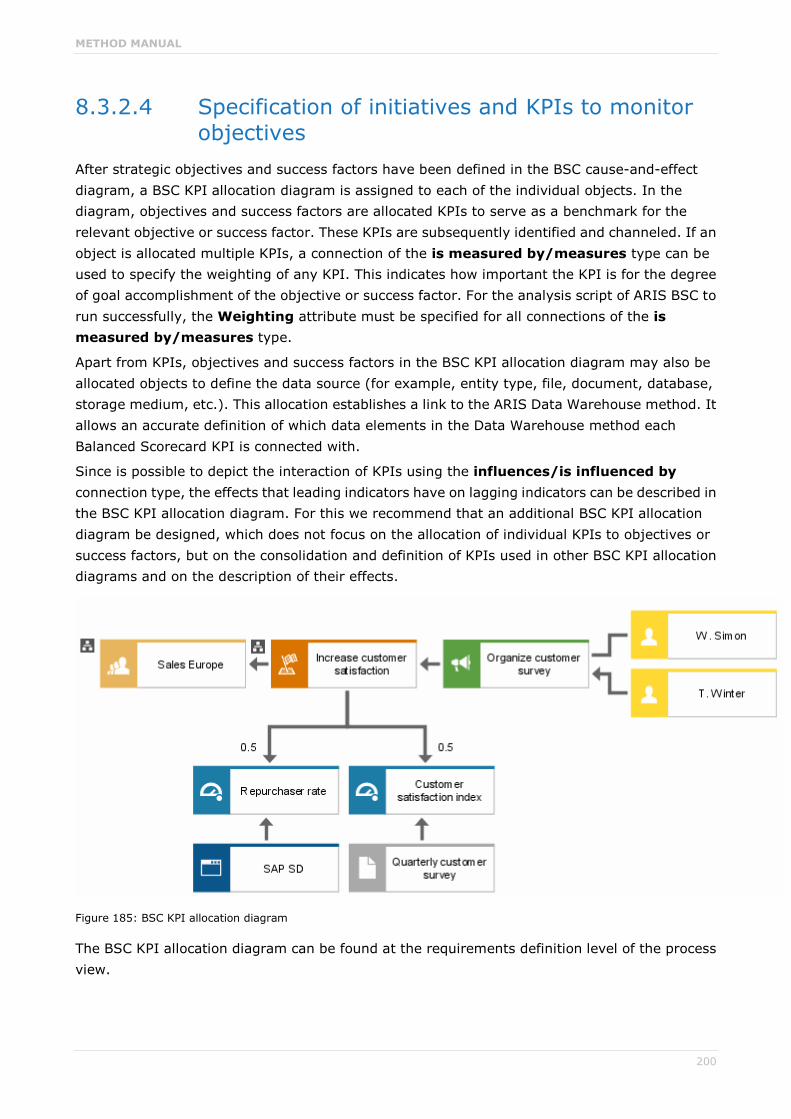
METHOD MANUAL
200
8.3.2.4 Specification of initiatives and KPIs to monitor objectives
After strategic objectives and success factors have been defined in the BSC cause-and-effect diagram, a BSC KPI allocation diagram is assigned to each of the individual objects. In the diagram, objectives and success factors are allocated KPIs to serve as a benchmark for the relevant objective or success factor. These KPIs are subsequently identified and channeled. If an object is allocated multiple KPIs, a connection of the is measured by/measures type can be used to specify the weighting of any KPI. This indicates how important the KPI is for the degree of goal accomplishment of the objective or success factor. For the analysis script of ARIS BSC to run successfully, the Weighting attribute must be specified for all connections of the is measured by/measures type.
Apart from KPIs, objectives and success factors in the BSC KPI allocation diagram may also be allocated objects to define the data source (for example, entity type, file, document, database, storage medium, etc.). This allocation establishes a link to the ARIS Data Warehouse method. It allows an accurate definition of which data elements in the Data Warehouse method each Balanced Scorecard KPI is connected with.
Since is possible to depict the interaction of KPIs using the influences/is influenced by connection type, the effects that leading indicators have on lagging indicators can be described in the BSC KPI allocation diagram. For this we recommend that an additional BSC KPI allocation diagram be designed, which does not focus on the allocation of individual KPIs to objectives or success factors, but on the consolidation and definition of KPIs used in other BSC KPI allocation diagrams and on the description of their effects.
Figure 185: BSC KPI allocation diagram
The BSC KPI allocation diagram can be found at the requirements definition level of the process view.
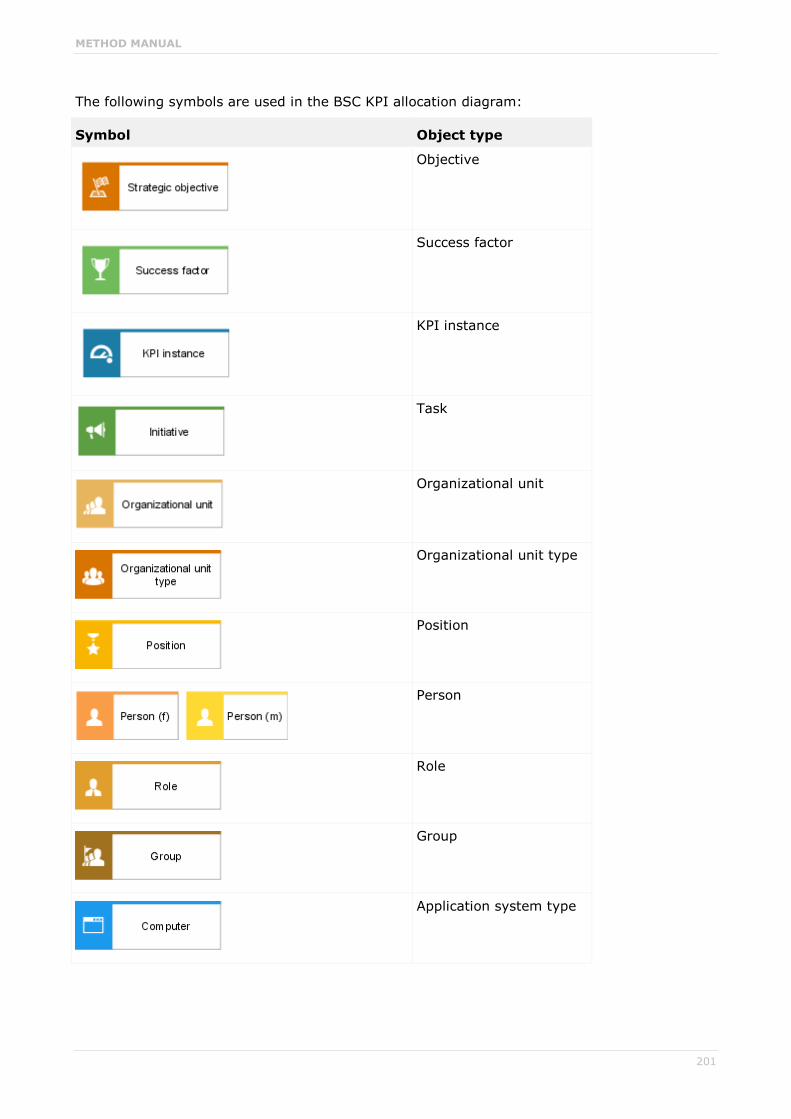
METHOD MANUAL
201
The following symbols are used in the BSC KPI allocation diagram:
Symbol Object type
Objective
Success factor
KPI instance
Task
Organizational unit
Organizational unit type
Position
Person
Role
Group
Application system type

METHOD MANUAL
202
Symbol Object type
Technical term
Entity type
Relationship type
ERM attribute
Cluster/Data model
Knowledge category
Documented knowledge
Class
Information carrier

METHOD MANUAL
203
8.3.2.5 Description of KPIs and their relationships After KPIs for measuring strategic objectives and critical success factors have been selected, these indicators and their relationships can be defined in more detail using the KPI tree model type.
A KPI tree arranges various KPIs in a hierarchy by means of the influences connection type. The Weighting attribute can be specified for these connections, thus enabling the calculation of an overall KPI within a KPI tree with the help of weights. The KPI tree is assigned to the KPI instance representing the overall KPI. This assignment is included in the Create BSC management view and Perform BSC planned-actual comparison evaluations.
Figure 186: KPI tree
The KPI tree uses the KPI instance object type only.
The KPI tree can be found at the requirements definition level of the data view.
8.3.3 Relationships to other models The objects of the Balanced Scorecard method can be associated with the following ARIS models:
EPC
Objective diagram
DW structure
DW transformation

METHOD MANUAL
204
9 E-Business scenario diagram
9.1 Introduction The smooth execution of inter-company business processes is increasingly gaining in significance. Here, the operational sequence of specific procedures at the interfaces between companies on the one hand and at the interfaces between companies and their customers on the other hand is in the center of interest. The contacts need to take place in a clear, quick, consistent, and direct manner.
Rapidly finding suitable business associates (from a corporate perspective) and providers (from a consumer point of view) is also of great relevance. Maximum optimization of these processes results in a competitive advantage. The ideal platform for supporting these multilateral relations is the Internet. As the processes in the above-mentioned environment are very complex, it is necessary to define the term 'e-business'.
E-business is a generic term for the use of information and communication technologies in support of a company's business activities. It includes the use of electronic media for the purpose of supporting relationships and processes involving business associates, employees, and customers (Herrmans, Sauter, 1999).
Thus, e-business can mean the creation of a Web site for a corporate presentation, the acquisition of an item via Internet, a highly complex project shared by two companies, or multilayered relationships between any number of business associates meeting in a marketplace.
It can be subdivided into the following concepts:
B2B (BUSINESS TO BUSINESS)
Business to Business describes the transactions taking place between companies. For example, this is enabled by linking the companies' supply chains.
B2C (BUSINESS TO CONSUMER)
Business to Consumer describes transactions taking place between companies and their customers. For example, this includes purchases by customers in online shops.

METHOD MANUAL
205
B2A/C2A (BUSINESS/CONSUMER TO ADMINISTRATION)
Business/Consumer to Administration describes all transactions between companies or individuals and public administration. Contacts between companies and administration are considered to be an area with great cost-cutting potential.
Figure 187: Transaction options in e-business
In addition to differentiating between various partners, a distinction can also be made regarding the scope of relationships between the partners: one to one, one to many, many to many. Especially the marketplace scenario is of major significance.
MARKETPLACES
Electronic marketplaces are virtual places where any number of people buy and sell products and services (openly) and exchange information.
To support these scenarios, the E-Business scenario diagram was developed. In conjunction with other methods and various components supplied by ARIS, it enables optimal support of the implementation of e-business projects. This chapter on e-business scenario diagrams first describes the method with all objects and evaluation options and then goes on to discuss interrelationships with other methods. At the end of the chapter, a use case demonstrates the complex possibilities.

METHOD MANUAL
206
9.2 E-Business scenario diagram method
9.2.1 The idea The possibility of viewing a value-added chain in its entirety, that is, from the end user to each of the companies involved in a procedure, provides a basis for developing optimization potential. The aim is, for example, the improvement of the supply chain, the reduction of procurement and distribution costs, or the optimization of the information system architecture. The e-business scenario diagram representation allows visualization of the content that is to be examined to achieve the designated objectives. Due to the column representation, the interfaces between very different process partners are depicted in an abstracted form by the column borders. Various reports supplement the models and offer important analysis capabilities.
9.2.2 The model and its objects The economic agents considered in the model are placed in the header and identified as business participants. They originate from the organization view and can be assigned organizational charts that may serve to describe the company structure or the relationships between the objects of the individual columns in more detail.
An economic agent's individual processes participating in the overall process and the interfaces between them are the central and structurally relevant objects of the model. An individual process is a business process that plays an important role in inter-company cooperation. A more precise representation and analysis of such an individual process can be obtained by assigning a process model. All processes running in a company are modeled in the row below the business participant, but in the same column. Inter-company coordination also requires precise analysis of application systems and hardware in use by the various economic agents in support of their individual processes (for example, ERP systems). These elements are represented by Business components. To coordinate the various components, responsibilities for the systems must be specified exactly. For this purpose, Organizational unit type objects are available. Even the roles of the employees involved in the process can be defined. These are referred to in the model as Employee role. The integration of interfaces is a particular requirement of e-business modeling. In this context the column borders are of crucial importance since they symbolize the interfaces between the process participants. They can be viewed from several perspectives.
One focus can be the transfer of process-specific information. That is the purpose of Business documents, which can assume the form of XML or HTML documents. The business document can be assigned a model of the data view, for example, a document type definition. Alternatively, the flow of money or goods can be displayed using the Money transaction or Goods shipment objects.
Another important aspect: data security must be ensured, especially the security of electronic payments sent via Internet. Different encoding techniques can be used for this purpose, for example, SET (Secure Electronic Transaction) or SSL (Secure Socket Layer). The security aspect

METHOD MANUAL
207
can be taken account of by using the Security protocol object. It is also possible to define persons responsible for the security of transactions, which can be represented by an Organizational unit type. Furthermore, the focus may be put on analyzing a more technical aspect, namely the technical design of the data transfer at the interfaces. For this purpose, the model uses various information carriers. Individual processes can be linked via intranet, extranet, or Internet. Data transfer can take place by e-mail. The mobile phone has also gained ground as a transmission medium.
Figure 188: Objects in the e-business scenario diagram

METHOD MANUAL
208
9.2.3 'Transmission type' attribute group Modeled objects can be further specified by their attributes. The relevant attributes are especially tailored to meet the e-business requirements.
Attention should be given to the Transmission type attribute group of the Business document, Money transaction, and Goods shipment objects. Specifying transmission type attributes not only identifies the transmission path, but also expresses the need for securing the transaction. In the case of an online transmission, for example, it is important not to omit the above-mentioned securing of confidential information and data.
9.3 Evaluations using reports Various evaluation options provide support for modeling e-business scenarios. These evaluations are performed in the form of reports. ARIS provides several predefined evaluation reports, but the creation of user-defined ones is possible as well. The following reports for e-business scenarios are provided.
9.3.1 Data security check The security of data transferred online is one of the most important issues influencing e-business acceptance. Protecting personal data or payments from access by unauthorized persons is an issue that must be resolved in order to avoid loss of confidence of customers and partners. A report allows all products/services exchanged (money transaction and goods shipment) and all data (business documents) to be verified in this regard. The Transmission type attribute group already mentioned is evaluated and, in the event that it is an online transmission, checked to determine if data encoding takes place. Thus, potential security gaps and obsolete encoding methods can be identified and eliminated.
9.3.2 System support A second important aspect in e-business projects is the harmonization of application systems. A company needs to consider many questions in this regard. Which processes must be supported by which systems? Who will be responsible for operating which systems? Where might training expenses be incurred? What adjustments of existing systems are necessary? Here too, the answers can be found in a report. Individual processes are listed along with the corresponding systems and the persons responsible for them.

METHOD MANUAL
209
9.3.3 Information flow In contrast to other process models, e-business scenarios focus on transactions. Special attention is given the data and products/services being exchanged. Therefore, evaluations are provided to monitor data and service exchange. Important questions are: What data and products/services are generated, where are they generated, and where are they used? The required information may be obtained by running the report that outputs the modeled data and products/services as well as the processes in which they are involved as input or output.
9.3.4 Collaborative business maps The collaborative business maps used by SAP constitute a special type of model. They emphasize the view of various partners. There are two views that focus on different target groups. The 'aggregated view' is designed for senior management and contains only business participants and processes, while the 'detailed view' is designed for operating departments and includes documents and roles of the process managers in charge. The reports enable a transfer of the information shown in the e-business scenario diagram to both views at any time.
9.4 Connection to other methods and components Using the various modeling methods in ARIS Architect information can be viewed from different perspectives and made available to various target groups with a special focus. The e-business scenario is the starting point of these views. Details for specific target groups can be specified in its objects. In this way, an e-business project can be represented in its entirety. In addition, the various components of ARIS can be used to perform evaluations for the models created to ensure optimal support of projects in the e-business environment.
EXAMPLE: CREATION OF AN ONLINE SHOP
The first step is defining the objectives that are to be achieved by the planned e-business activities. This step can be performed with the help of the ARIS component Balanced Scorecard (see the chapter Balanced Scorecard method (page 187)). This makes it possible to identify the processes that have to be optimized to achieve the objectives. In our example, the objective is identified as the development of a new distribution channel, namely the Internet. In order to pursue this new path optimally, precise documentation and planning are indispensable.
Not only must the process flow itself be taken into account, but also the organization of responsibilities, interfaces between various systems, and data security.

METHOD MANUAL
210
Starting point is the e-business scenario diagram. The business participants in our example are the company that implements the shop system and the customer who will use this offer. The entire process from 'entering the shop' to 'leaving' is broken down into subprocesses. The representation shows the view of the customer and that of the company. The e-business scenario diagram serves as an entry point to the implementation project. The following figure shows how the overall process is divided up.
Figure 189: Excerpt from the 'Online shop' e-business scenario
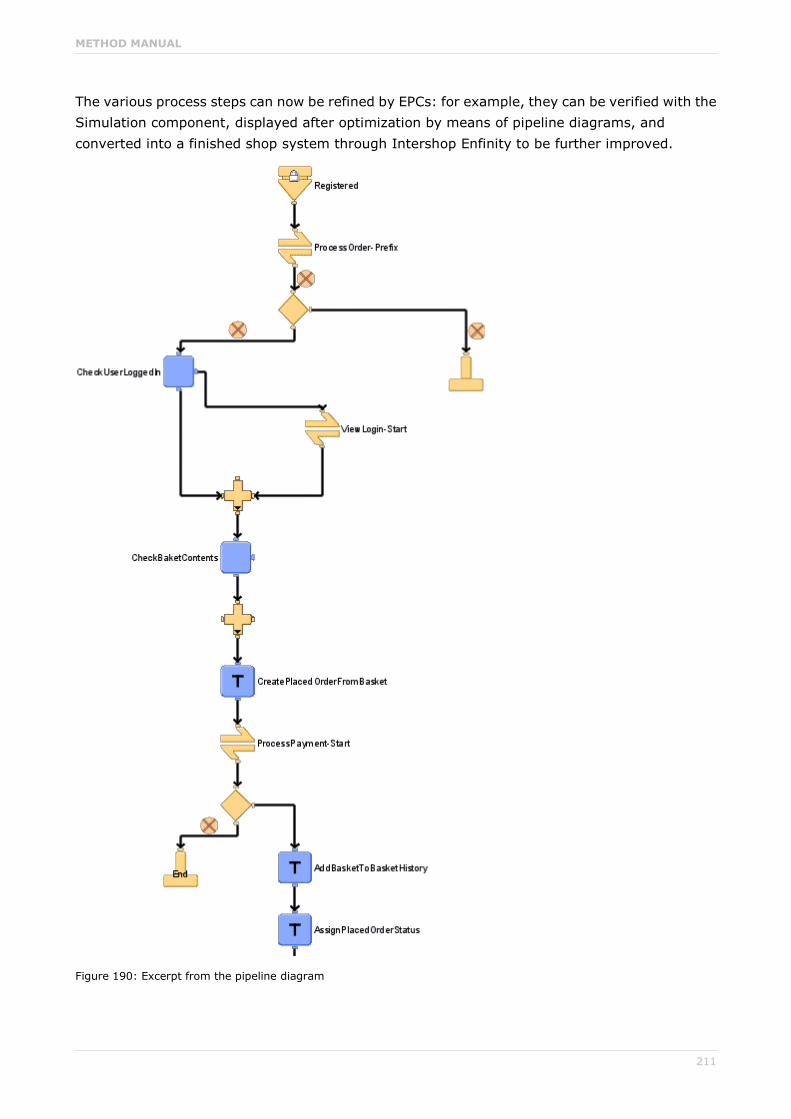
METHOD MANUAL
211
The various process steps can now be refined by EPCs: for example, they can be verified with the Simulation component, displayed after optimization by means of pipeline diagrams, and converted into a finished shop system through Intershop Enfinity to be further improved.
Figure 190: Excerpt from the pipeline diagram

METHOD MANUAL
212
If a shop is to be connected to an external ERP system (Enterprise Resource Planning system), the data to be transferred needs to be in the correct format. For this purpose, there are various ways of standardizing documents and data. One such standardization option is offered by the use of Extensible Markup Language (XML). When documents are created, DTDs can be assigned to help define their structure and required contents. Since XML is a language that is being developed along completely different paths, a uniform foundation is needed here. Different organizations, consisting of companies and scientific institutions, are involved in standardizing XML for various sectors.
The use of standardized XML documents facilitates the integration of ERP systems.
Figure 191: Excerpt from the DTD: Order
The problems arising from the need to harmonize various components have already been mentioned. The application system type diagram can serve to visualize the systems and can be assigned as a model to application systems or business components to explain the systems' interrelationships in more detail.
The new e-business activities will also affect the organizational structure. It may be necessary to define new responsibilities or make new allocations. The e-business scenario diagram can describe roles and organizational units for individual process steps. What position they take in the company's organization or in the process can be analyzed further by means of organizational charts.
Implementation begins with the realization of modeled content. If the Intershop method is used, the content modeled is converted into an operational system by means of Intershop Enfinity.
METHOD MANUAL
213
10 IT City Planning
10.1 Enterprise Architecture and IT City Planning IT City Planning is an architectural approach that was developed by the Frenchman Jacques Sassoon in the 1980s. The aim of IT City Planning is to bring harmony to a heterogeneous system landscape by thoroughly analyzing its interactions, that is, the exchange of information among the applications in that system.
Based on the approach used in town planning, the procedure for drawing up an IT city plan is driven by the idea of enabling long-term, strategic IT management that considers not only the present but also aspects of the past (legacy systems) and those of the future.
However, there is no need to redesign the entire system. Instead, a project-by-project, incremental approach is adopted.
As with Model Driven Architecture (MDA),which is supported by ARIS products, the subject of IT City Planning can be approached through models that describe the information system without reference to technology-related information. However, IT City Planning dispenses with UML, which simplifies familiarization with the subject for those with a less technical background, and increases its acceptance.
10.2 Which companies may benefit from IT City Planning? IT City Planning addresses the following companies:
Companies with a large portfolio of applications.
Companies that have a long history of using information technologies.
Companies for which information technology is of strategic importance.
Companies that are involved in a merger.
Aims of IT City Planning:
Reusing software resources to avoid the creation of further redundancies.
Reducing maintenance costs by 'block-by-block' overhaul and by defining new software resources that can replace existing resources and cover the various use cases.
Consolidating information systems.
Preparing the deployment of EAI software at a higher level.
Creating an IT city plan is the responsibility of the Integration Competence Center. The plan itself must address both the design pattern and the information and technology architecture.
EAI = Enterprise Application Integration. Company-wide integration of applications. EAI provides the e-business infrastructure. EAI software is the technical middleware required as a prerequisite for implementing an e-business strategy.

METHOD MANUAL
214
10.3 IT City Planning with ARIS ARIS provides the following views of an information system:
Data view
Function view
Organization view
Product/Service view
Process view
Each of these views is subdivided into the Requirements definition, Design specification, and Implementation descriptive levels. These are based on the lifecycle of an information system and their proximity to information technology.
The design specification and implementation levels essentially describe the software system. The concepts and terms of these levels are closely interrelated and their 'translation' is unproblematic.
This is not the case with the transition between the requirements definition and the design specification. When creating the design specification, the business management view must be aligned with the standard software. This requires both business management expertise and data processing knowledge (see Scheer, A.-W., ARIS - Business Process Frameworks, 1998, 3rd edition, p. 7).
The information system view (IS view) in IT City Planning can assist as a mediator between levels. In ARIS, the object types of the IS view are located at a level between functions and application systems, thus extending the function view in ARIS. Like functions, IS elements are associated with the various constructs from the familiar views of the ARIS House. These extensions mainly relate to process view and data view. In the following, the term IS view refers to the model types from the function and process views of the ARIS House, which describe relationships between IS elements or give a detailed description of IS elements seen in the context of the other ARIS views.

METHOD MANUAL
215
Application system types, IT function types, and sockets are considered as elements of the IT (information technology) view. In analogy to the IS view, the IT view includes all model types in which relationships between application system types, IT function types, and the new Socket object type are described, or which are used to describe one of these elements in detail.
Figure 192: Process view, IS view, IT view

METHOD MANUAL
216
10.4 Service view ARIS provides the following model types for describing the Service view:
Service architecture diagram
Service architecture diagram (column display)
Service allocation diagram
Service collaboration diagram
The two service architecture models arrange the structural elements of the information system in a hierarchy.
An IS hierarchy can include the following levels:
Zone
District
Building cluster
Functional block
Capability
IS service
Business service
Zone, District, Building cluster, Functional block, and Business service are Service type object types. Service types are used to organize an information system in independent units/blocks by function.
Each service type is characterized in that it is the 'owner' of the data it uses and of the associated processing methods. Other service types can access these data and processing methods only if they call a service of the 'owner service type'.
Within a service type, similar data is used and identical activities and business functions are carried out.
At the top level, the information system is divided into zones. A zone can correspond to an operational and development area, for example.
The following figure shows the zones into which a company's information system can be typically broken down.
Figure 193: Zones of a company's information system
Each zone, in turn, can contain one or more districts.
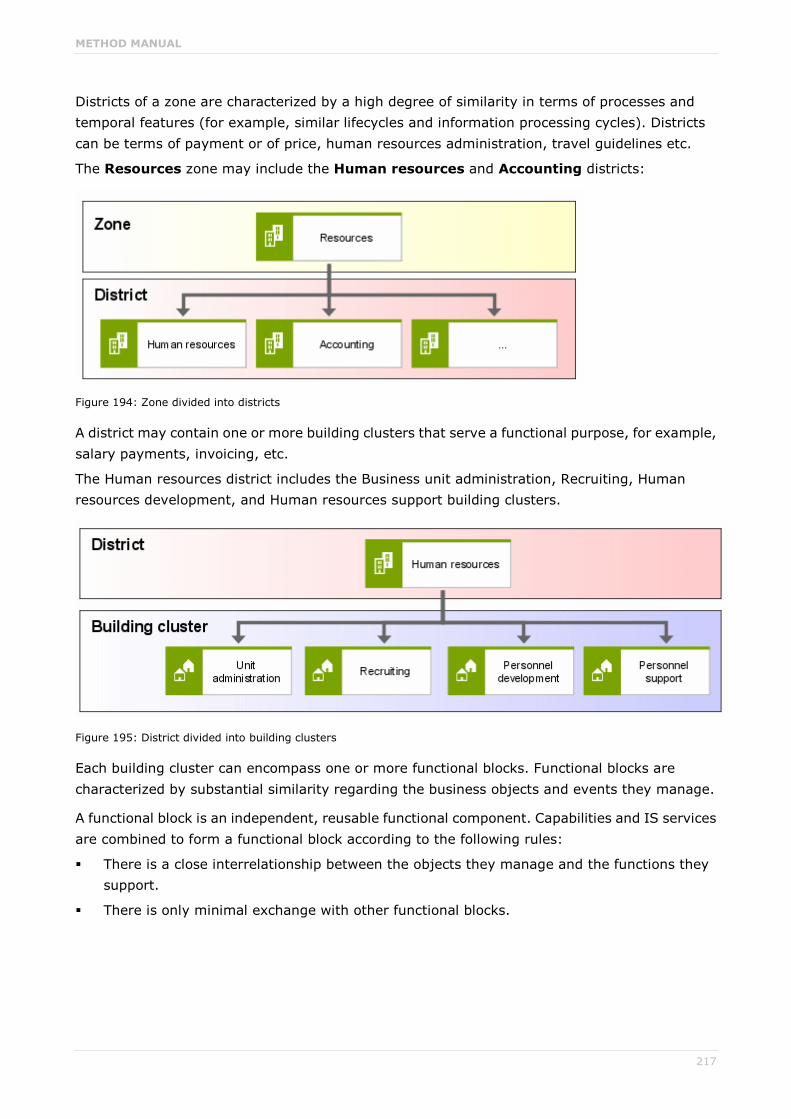
METHOD MANUAL
217
Districts of a zone are characterized by a high degree of similarity in terms of processes and temporal features (for example, similar lifecycles and information processing cycles). Districts can be terms of payment or of price, human resources administration, travel guidelines etc.
The Resources zone may include the Human resources and Accounting districts:
Figure 194: Zone divided into districts
A district may contain one or more building clusters that serve a functional purpose, for example, salary payments, invoicing, etc.
The Human resources district includes the Business unit administration, Recruiting, Human resources development, and Human resources support building clusters.
Figure 195: District divided into building clusters
Each building cluster can encompass one or more functional blocks. Functional blocks are characterized by substantial similarity regarding the business objects and events they manage.
A functional block is an independent, reusable functional component. Capabilities and IS services are combined to form a functional block according to the following rules:
There is a close interrelationship between the objects they manage and the functions they support.
There is only minimal exchange with other functional blocks.
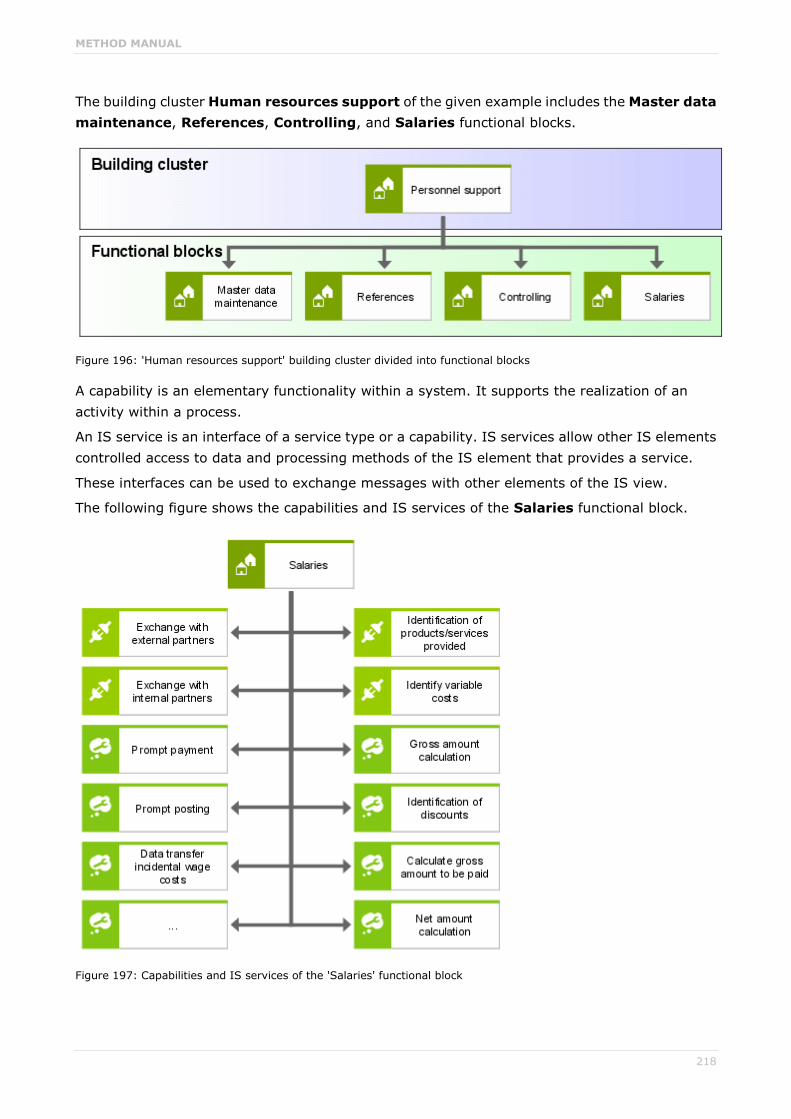
METHOD MANUAL
218
The building cluster Human resources support of the given example includes the Master data maintenance, References, Controlling, and Salaries functional blocks.
Figure 196: 'Human resources support' building cluster divided into functional blocks
A capability is an elementary functionality within a system. It supports the realization of an activity within a process.
An IS service is an interface of a service type or a capability. IS services allow other IS elements controlled access to data and processing methods of the IS element that provides a service.
These interfaces can be used to exchange messages with other elements of the IS view.
The following figure shows the capabilities and IS services of the Salaries functional block.
Figure 197: Capabilities and IS services of the 'Salaries' functional block

METHOD MANUAL
219
For describing the IS hierarchy it is not necessary to entirely model all levels described here. The Capability and IS service IS elements are not regarded as elements of the city plan in IT City Planning. The city planner's tasks end at the building block level. Capabilities and IS services are the responsibility of the architect (see Longépé, Christoph: Le projet d'urbanisation du système d'information, p. 18).
10.5 Service types and their data The eERM is used to describe which data belong to a service type or capability. In the context of the city planning approach, the eERM provides the IS view symbols. A connection of the is owner of type can be used to link these objects with relationship and entity types.
Figure 198: 'is owner of' connection between symbols of the IS view and relationship and entity types
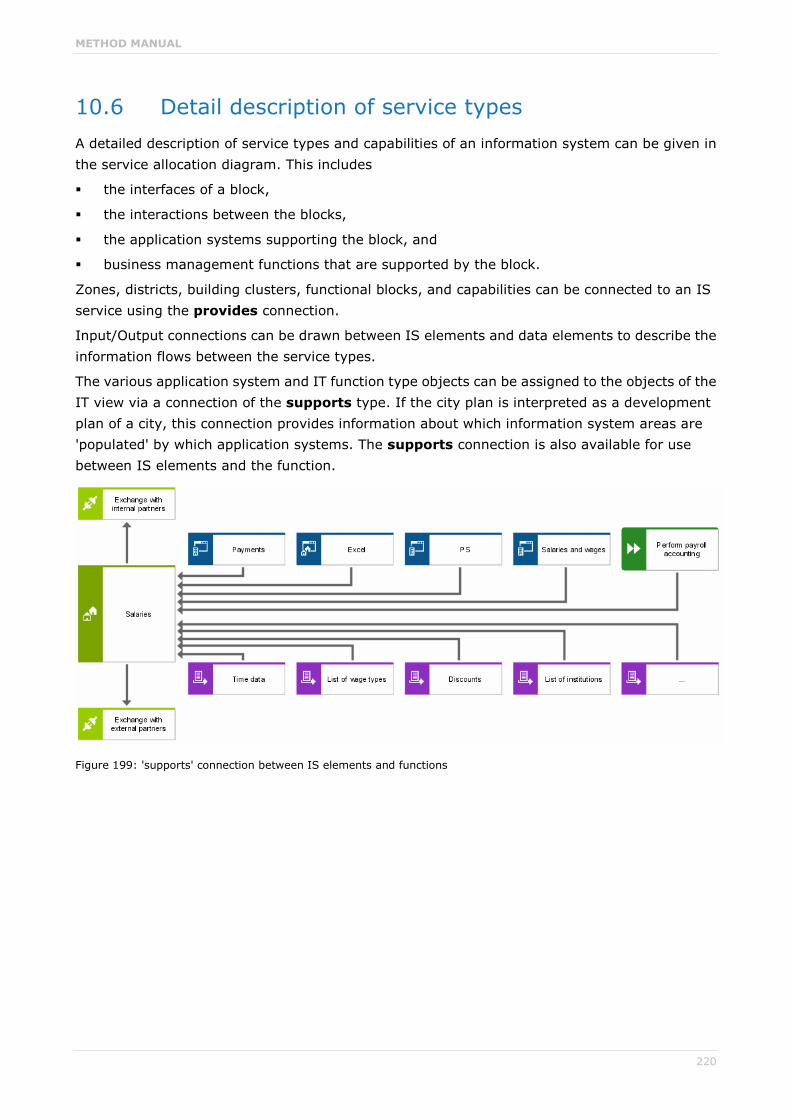
METHOD MANUAL
220
10.6 Detail description of service types A detailed description of service types and capabilities of an information system can be given in the service allocation diagram. This includes
the interfaces of a block,
the interactions between the blocks,
the application systems supporting the block, and
business management functions that are supported by the block.
Zones, districts, building clusters, functional blocks, and capabilities can be connected to an IS service using the provides connection.
Input/Output connections can be drawn between IS elements and data elements to describe the information flows between the service types.
The various application system and IT function type objects can be assigned to the objects of the IT view via a connection of the supports type. If the city plan is interpreted as a development plan of a city, this connection provides information about which information system areas are 'populated' by which application systems. The supports connection is also available for use between IS elements and the function.
Figure 199: 'supports' connection between IS elements and functions

METHOD MANUAL
221
10.7 Chronological-logical operational sequences of IS elements
In the service allocation diagram, the relationships to the object types of the organization, data, and process views can be created for the service types, capabilities, and IS services specified in the service architecture diagram. Possible chronological-logical operational sequences of IS elements cannot be represented.
In IT City Planning, the service collaboration diagram is used to illustrate chronological-logical operational sequences of IS elements, that is, to describe the dynamic aspects within the information system. As a model type it is equivalent to the program flow chart of the IT view (see chapter Program flow chart (page 146)). It provides events for displaying operational sequences. As with the allocation of IT elements and events in the program flow chart, events in the service collaboration diagram can serve to define the sequence of functional modules. In this context, the event is seen as a trigger that activates service types, capabilities, or IS services. Branches can be represented using the rules known from the EPC or the program flow chart. Operational sequences can also be defined without the use of events.

METHOD MANUAL
222
10.8 IT view The IT view contains the following model types:
Application system type diagram
Application system type diagram (column display)
Access diagram
Program flow chart
Application system hierarchy
In the context of city planning, the current application system hierarchy of a company is depicted using the application system type diagram or the application system type diagram (column display). The application system type diagram (column display) is a lane diagram (diagram in column or row display) that provides precisely those object types, symbols, and relationship types from the application system type diagram that are required for city planning.
The following levels of an application system type hierarchy can be depicted:
IT system
Subsystem
IT software
IT block
IT procedure
Socket
IT system, Subsystem, IT software, and IT block are symbols of the Application system type object type. The hierarchy is built using the encompasses relationship type.
IT systems are at the top level of the application system type hierarchy. An IT system is made up of a structured quantity of IT elements, usually subsystems. Administration and operation of an IT system are the task of a specified organizational unit.
A subsystem is a component of an IT system. The components of a subsystem are called IT software.
IT software supports a homogeneous set of functions. It is user-oriented and supports one or more business processes. IT blocks are components of IT software.
Generally, an IT block includes IT procedures that access the same data (databases, tables, files, etc.).
IT procedures are objects of the IT function type type. Each IT procedure supports a specific function.
A socket corresponds to the IS service, that is, it is an interface that an IT element provides for other IT elements so that these can access the IT element's data and processing methods.

METHOD MANUAL
223
The following figure shows an example of the subsystem structure of the DATEV system:
Figure 200: Subsystem structure of the DATEV system
10.9 IT elements and their data As with IS elements in the eERM, the is owner of connection is available, which can be drawn from application system types, IT function types, or sockets to entity types or relationship types to describe the data that belong to an IT element.
10.10 Detail description of IT elements IT elements of the IT city plan are described in detail in the access diagram. It corresponds to the service allocation diagram of the IS view.
The description may refer to:
input and output relationships of the IT element in question
supported business functions
supported IS elements
activation of other IT elements by the element under consideration
platform on which the IT element runs
users of the IT element
Figure 201: Detailed description of IT elements in the access diagram

METHOD MANUAL
224
10.11 Organizational aspects The detail description of an IT element also incorporates information from the organization view. This includes information about which organizational elements can be users of an IT element, and more. A network diagram can be used to show the influences and effects of the IT infrastructure.
Figure 202: Influences and effects of the technical infrastructure
10.12 Chronological-logical operational sequences of IT elements
In analogy to the service collaboration diagram, the program flow chart is used to describe the chronological-logical operational sequence of the Application system type, IT function type, and Socket IT elements.
Details of the program flow chart are available in the chapter System interface models - System attributes, System attribute domain (page 68).

METHOD MANUAL
225
10.13 Chronological-logical operational sequences within the architecture
Various process models (all variations of the EPC) and the program flow chart provide appropriate objects for illustrating how IS elements and IT elements are integrated into a chronological-logical operational sequence.
Figure 203: Integration of IS and IT elements into a chronological-logical operational sequence
METHOD MANUAL
226
10.14 Possible evaluations Based on the modeling options described in the sections above, evaluations are available to answer the following questions and help set up the information system:
What data is managed by a given IS element?
Which application systems support an IS element?
Which functions are supported by a given IS element?
What data is used by the IT elements of a given IS element?
What data is generated by the IT elements of a given IS element?
Which IS services are provided by an IS element and in which processes are they used?
On which hardware components do application systems of a particular IS element run?
The following evaluations are provided for selected application system types, IT function types, and sockets:
Data used by an IT element
IS elements supported by an IT element
Functions supported by an IT element
Data used by IS elements that are supported by an IT element
Data created by IS elements that are supported by an IT element
Hardware components on which an IT system is running
METHOD MANUAL
227
11 Business process modeling The interactions and transactions between companies and their partners, suppliers, and customers are becoming ever more complex, mostly due to new information and communication technologies. It is becoming more and more evident that the further development and performance of business processes depend on close cooperation between the various business associates.
On the one hand, it is important for a company to be able to better understand its own actions and those of its business associates; on the other hand, organizations should be given the ability to adapt faster to internal and market-driven changes. A standardized process modeling language can help companies to describe their internal and external business processes clearly and flexibly. Companies must also be in a position to communicate the modeled processes to their business associates appropriately, clearly, and comprehensibly. All parties involved should speak the same 'process language'.
To reach these goals, the Business Process Management Initiative (BPMI.org) offers a standardized modeling language: "Business Process Model and Notation (BPMN)". BPMN is a graphical notation for describing business processes.
The notation is required to be easily understood by all users. This makes it suitable not only for business process analysts and those who monitor and manage processes, but also for developers who implement the process execution technologies.
Furthermore, it is important to ensure that XML-based languages can be visualized with this notation for business process automation, for example, Business Process Execution Language for Web Services (BPEL4WS).
11.1 Process classes and the business process diagram Business Process Model and Notation (BPMN) uses the Business process diagram (BPD) model type for describing processes. This model depicts three classes of business processes and the relationships between them:
Private business processes (internal business processes)
Abstract business processes (public business processes)
Collaboration processes (global business processes)
Private business processes are business processes that are performed exclusively within an organization. They are generally known as workflow or BPM processes.
Various internal business processes are modeled as a sequence flow within individual pools (see chapter Implementation of BPMN in ARIS (page 229)) whose interactions are represented using message flows.
BPMN uses the terms Sequence flow and Message flow instead of Control flow because the process is controlled not only by events, but also by the messages exchanged.
Abstract business processes describe interactions between private processes of different pools, between objects of different pools, or combinations of both. Besides the sequence flow within the
METHOD MANUAL
228
private process, the message flow between the individual processes is particularly important. Interactions are modeled using message flows.
Abstract business processes are integrated in individual pools and can be modeled separately or as part of an entire BPMN diagram. If an abstract business process occurs in the same model as a corresponding private business process, they can be associated with each other.
Collaboration processes describe only interactions between two or more business entities (business associates). A sequence of activities is modeled to reflect the pattern of message exchanges between the various business associates. The sequence flow has no part in this.
Relevant languages for collaborations include bXML BPSS, RosettaNet, or W3C Choreography Working Group. The mapping specification is planned for later versions of the BPMN specification.
Collaboration processes can be integrated in pools. Interactions of the partners involved are described in individual lanes. This allows the processes to be modeled separately or as part of a comprehensive BPMN diagram. If a collaboration occurs in the same diagram as one of its internal processes, activities common in both can be associated with each other.
In turn, various types of business processes can be derived from the three process classes:
Private business processes at a higher level
Private business processes at a detail level (target or actual processes)
Processes running between detail processes and external entities
Processes running between detail processes
Processes running between detail processes and abstract processes
Processes running between detail processes and collaboration processes
Processes running between abstract processes
Processes running between abstract processes and collaborations
Processes running between collaborations
Processes running between multiple detail processes interacting through their abstract processes
Processes running between multiple detail processes interacting through a collaboration
Processes running between multiple detail processes interacting through their abstract processes and a collaboration

METHOD MANUAL
229
The following figure shows an example of a BPMN collaboration diagram with two business associates to which a separate process has been assigned. Both detail processes comprise a start event, activities, sequence flow connections, and an end event. Message flow connections are modeled between the activities of the two detail processes.
Figure 204: Two pools with sequence and message flow
As processes of multiple business associates can be shown in one BPMN collaboration diagram and each business associate has a different view of the same process, it is useful to specify a 'point of view'. The BPMN does not dictate how the point of view is to be emphasized in a BPMN collaboration diagram. The easiest way is to specify the names of the assigned business entities (business associates) in the Description/Definition attribute (see the figure).
11.2 Implementation of BPMN in ARIS Although BPMN supplies only the Business process diagram (BPD) model type, two model types can be used in ARIS: the EPC and the new Business process diagram (BPD) model type. In this way, processes existing in ARIS can be reused as private processes. The EPC has all the model attributes that are specified by BPMN for the business process diagram. By using the Business process diagram (BPD) model type, you keep existing models of the EPC type free of B2B-specific aspects. As a result, the complexity of EPC models does not rise due to additional relationship types.
The new business process diagram in turn inherits all BPMN-relevant model attributes from the EPC and all sequence flow-relevant objects, connections, and symbols. The new Business process diagram (BPD) model type allows sequence flow-relevant EPC concepts to be reused. It is also possible to depict pools, lanes, and message flows.
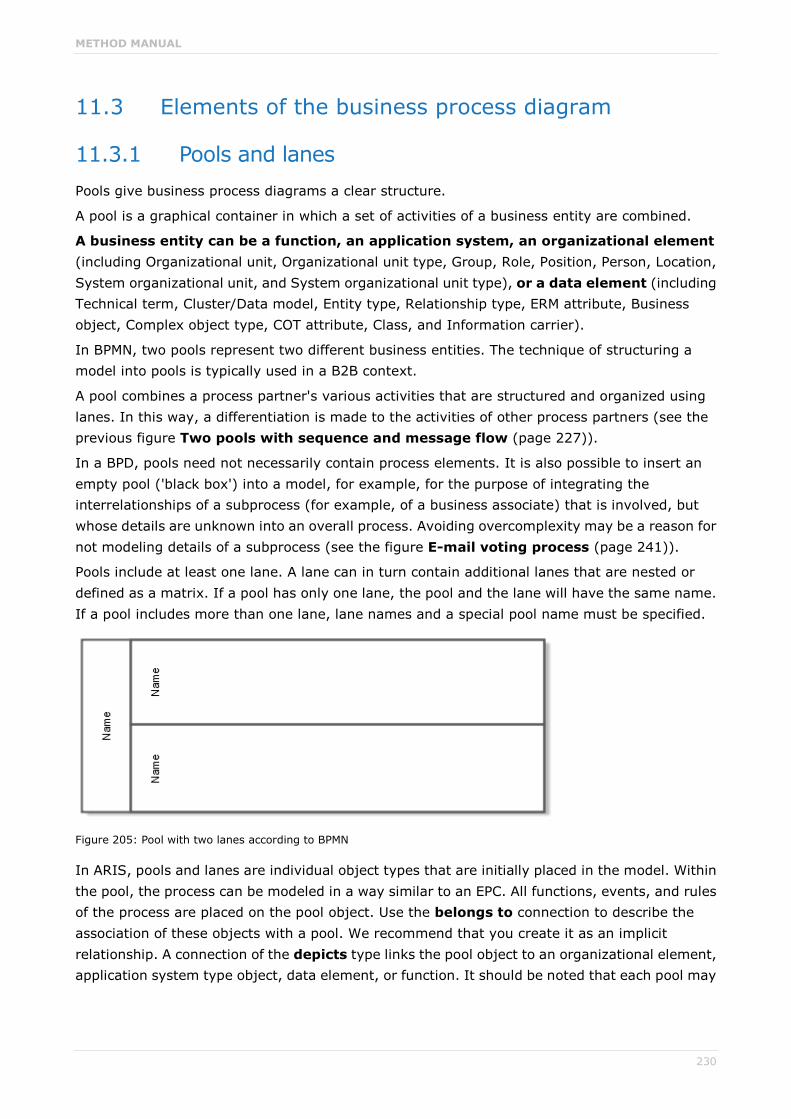
METHOD MANUAL
230
11.3 Elements of the business process diagram
11.3.1 Pools and lanes Pools give business process diagrams a clear structure.
A pool is a graphical container in which a set of activities of a business entity are combined.
A business entity can be a function, an application system, an organizational element (including Organizational unit, Organizational unit type, Group, Role, Position, Person, Location, System organizational unit, and System organizational unit type), or a data element (including Technical term, Cluster/Data model, Entity type, Relationship type, ERM attribute, Business object, Complex object type, COT attribute, Class, and Information carrier).
In BPMN, two pools represent two different business entities. The technique of structuring a model into pools is typically used in a B2B context.
A pool combines a process partner's various activities that are structured and organized using lanes. In this way, a differentiation is made to the activities of other process partners (see the previous figure Two pools with sequence and message flow (page 227)).
In a BPD, pools need not necessarily contain process elements. It is also possible to insert an empty pool ('black box') into a model, for example, for the purpose of integrating the interrelationships of a subprocess (for example, of a business associate) that is involved, but whose details are unknown into an overall process. Avoiding overcomplexity may be a reason for not modeling details of a subprocess (see the figure E-mail voting process (page 241)).
Pools include at least one lane. A lane can in turn contain additional lanes that are nested or defined as a matrix. If a pool has only one lane, the pool and the lane will have the same name. If a pool includes more than one lane, lane names and a special pool name must be specified.
Figure 205: Pool with two lanes according to BPMN
In ARIS, pools and lanes are individual object types that are initially placed in the model. Within the pool, the process can be modeled in a way similar to an EPC. All functions, events, and rules of the process are placed on the pool object. Use the belongs to connection to describe the association of these objects with a pool. We recommend that you create it as an implicit relationship. A connection of the depicts type links the pool object to an organizational element, application system type object, data element, or function. It should be noted that each pool may

METHOD MANUAL
231
have only one connection of this type throughout the given database. These relationships should also be implicit.
According to BPMN specifications, a pool does not need to be represented in the model by a symbol. Furthermore, the borders of a single pool may be hidden, especially if the diagram contains only one pool (see the figure E-mail voting process (page 241)). However, these options are not recommended for models containing multiple pools because this would affect the model's transparency.
11.3.2 Modeling guidelines for pools and lanes Only one pool may exist with invisible borders in a diagram.
If the Pool type attribute was set to Collaboration, no owner (Person responsible attribute) should be specified.
Each lane may have only one superior pool.
11.3.3 Sequence flow A process in the form of a sequence flow describes the sequence in which activities of a process are performed. The sequence flow combines the Event, Activity, and Gateway object types. Sequence flows are permitted only within pools and may not cross their borders (see the following figure).
The sequence flow is represented by a solid line with a black arrow head:
Figure 206: Sequence flow connection
Appropriate connection types, such as activates, is evaluated by, creates, links, or leads to are specified depending on the connection's source and target object type.
METHOD MANUAL
232
11.3.4 Modeling guidelines for sequence flow connections For sequence flows that follow an XOR (data-based) gateway or an inclusive gateway, a value
must be set for the Condition attribute.
If the value Expression is set in the Condition attribute, the diamond symbol is to be placed at the beginning of the connection.
If the Condition attribute is set to Default and the source object is a function, the \ (backslash) character is to be placed as a symbol at the beginning of the connection.
The \ (backslash) symbol must not be placed if the source object is a gateway.
No condition should be set if the source object is one of the following symbols:
Event-based gateway
Complex gateway
Parallel gateway
Start event
Intermediate event
If the Default value is enabled in the Condition attribute for a sequence flow connection, no condition must be specified.
The Condition attribute may be set to Default if the source object is a function or an XOR (data-based) gateway.
If the value Expression is set in the Condition attribute, the Expression attribute must also be specified.
11.3.5 Message flow A message flow describes the exchange of information between two pools. The message flow can be placed either directly between two pool objects, or between objects in the sequence flow of the processes in the corresponding pool. Only message flows are allowed to cross pool borders, and a message flow connection must not be placed between two objects of the same pool (see the figure Two pools with sequence and message flow (page 227)).
The connection is represented by a dashed line. The beginning of the line is marked by a circle, and the end is a white arrow head.
Figure 207: Message flow connection
Each message flow comprises a sender object, a connection of the sends type, a connection of the is received by type, and the recipient. No message flow connections may begin at a start event or intermediate event. However, an end event does not receive message flows, but can be a sender itself. Lanes, gateways, data objects, and text annotations do not have message flows.
METHOD MANUAL
233
11.3.6 Modeling guidelines for message flow connections Source and target objects must belong to different pools.
11.3.7 Association An association is used to provide the sequence or message flow components with information. This information can be of a textual or graphical nature. If multiple processes are part of the same diagram, their individual process elements can be associated with each other via connections.
An association is represented by a dotted line, to which open arrow heads may be added, if required. This applies in particular when assignments of artifacts of the Data object type are involved.
Figure 208: Association connections
Appropriate connection types, such as has as output, is input for, provides input for, or creates output to are specified depending on the connection's source and target object type.
In BPMN, the assignment of artifacts of the 'Data object' type to activities is of particular importance.
This assignment is directed and describes how information is used and changed within a process. It is implemented in the BPD (BPMN) using the following relationships:
Function - creates output to - data elements (especially information carriers)
Data element (especially information carrier) - provides input for - function

METHOD MANUAL
234
11.3.8 Events An event is a state that occurs in the course of the business process. Events influence the process flow. Normally, they represent triggers or effects within the processes. Depending on when an event occurs, it is either a start event, an intermediate event, or an end event. The three event categories are represented by their own symbols in BPMN:
Figure 209: Event categories
These categories are broken down into specialized subcategories. Additional symbols are added to the symbols of the three event categories when the Event type attribute is specified, as shown in the following three examples:
Figure 210: Examples of event types
All attributes relevant for the Event object type are combined in the BPMN attribute type group.

METHOD MANUAL
235
11.3.9 Modeling guidelines for events For start events, the Event type attribute type may have only one of the following values:
Message, Timer, Rule, Link, or Multiple.
For end events, the Event type attribute type may have only one of the following values: Message, Exception, Cancel, Compensation, Rule, Link, Multiple, or Terminate.
For intermediate events, the Event type attribute type may have only one of the following values: Message, Timer, Exception, Cancel, Compensation, Rule, Link, and Multiple.
Depending on the event type set, additional information must be specified in appropriate attributes.
A start event may have multiple outgoing sequence flow connections. No value must be set for the Condition attribute of these connections.
Intermediate events that indicate an exception or a compensation should be placed at the border of the function.
If an intermediate event is placed at the border of a function, a value other than Link must be specified.
The Multiple, Rule, and Cancel values must not be set for intermediate events that are located within a normal sequence flow of a process.
The value Cancel must not be set if
the intermediate event is placed at the border of a function and the Transaction attribute of the function is not enabled, or
the event is not part of a process that describes a transaction.
If an intermediate event is placed at the border of a function, it must not be the target object of a sequence flow connection.
If an intermediate event is located within the normal sequence flow of a process (that is, it is not placed at the border of a function), it may have exactly one incoming sequence flow connection. For the Event type attribute of the event, it is possible to specify no value or one of the following values: Message, Timer, Exception, Link, Compensation.
The value Link may be set for intermediate events in a normal sequence flow only if the source object is a gateway whose Gateway type attribute has the value XOR (event-based).
Each intermediate event must have exactly one outgoing sequence flow connection.
An intermediate event whose Event type attribute has the value Message may have an incoming message flow (incoming connection of the is received by type).
An intermediate event must not have an outgoing message flow (outgoing connection of the sends type).

METHOD MANUAL
236
11.3.10 Activities An activity is performed as part of a process. It can be atomic or non-atomic (compound). BPMN uses three categories of activities: Process, Subprocess, and Task.
BPMN provides the following symbols for activities:
Figure 211: Activities according to BPMN
In ARIS, activities are modeled as functions by default:
Figure 212: Assigned function as activity in ARIS
The function is provided with all attributes that BPMN defines for processes, subprocesses, and tasks. As with events, the BPMN attribute type group is used, which contains additional subgroups for the activity types.
In terms of BPMN, a process describes an activity that is performed within a company or organization. A process is described by a graph with flow objects that represent a set of different activities and control objects. Processes are hierarchically structured and can be defined at all levels of detail. In contrast to a process, a business process in BPMN describes a set of activities that are performed across corporate/organizational boundaries.
In terms of BPMN, a subprocess is a combined activity with a detailed description. A subprocess occurs as an object within a process flow.
Usually, a subprocess is assigned a detailed process. Unlike in BPMN, ARIS does not identify an assigned activity by a plus sign, but by an assignment icon.
Besides identifying an assigned function, BPMN also provides the ability to show the detail process at the next higher process level. This is done by clicking the plus sign.
METHOD MANUAL
237
11.3.11 Modeling guidelines for activities
PROCESS
If the Ad hoc attribute is = True, the Completion condition attribute must be specified.
If an ad hoc process is refined, no sequence flows must be modeled within the assigned model.
SUBPROCESS
If the value Independent is set for the Subprocess type attribute, the Process reference attribute must also be specified.
If the Transaction attribute is enabled for a subprocess, the Transaction ID attribute must also be available.
If the Loop type attribute is specified, the Loop condition attribute is also required.
If models are to be transferred to BPEL4WS, a check is recommended to determine whether the Loop type attribute is set to Maximum for processes with the value Standard.
If the value Standard is specified for the Loop type attribute, the Test before attribute is also required. The Test before attribute should be disabled by default.
If the value Multi-instance is specified for the Loop type attribute, the Parallel instance generation attribute is also required. The Parallel instance generation attribute should be disabled by default.
If the Loop type attribute of a subprocess has the value Multi-instance and, at the same time, the Parallel instance generation attribute is enabled, the Loop flow condition attribute must be specified as well.
If the value Complex is set for the Loop flow condition attribute in a process, an expression that determines when and how many process markers are passed on after the subprocess is complete must be specified for the Complex attribute.
TASK
If the value Receive is specified for the Task type attribute, the function should not have any outgoing message flow connections.
If the value Send is specified for the Task type attribute, the function should not have any incoming message flow connections.
If the Task type attribute is not specified or the values Script or Manual are set, the function should not have any incoming or outgoing message flow connections.
For functions whose Task type attribute is set to Abstract, the Abstract type attribute must also be specified. In addition, these functions may be used only in pools of the Abstract type or in Collaborations.

METHOD MANUAL
238
11.3.12 Gateway Gateways describe how sequence flows split or join within a process. They determine the behavior of incoming and outgoing connections. In ARIS they are represented as objects of the Rule type.
Similar to events, various types of gateways can be specified. Depending on the type, further symbols are shown in the center of the Gateway symbol.
A few differentiating gateway symbols:
Figure 213: Gateway types
The BPMN specification stipulates that a number of gates must be defined for each gateway. In ARIS the number of gates is determined by the number of incoming and outgoing connections. Therefore, gate-dependent attributes are specified for the incoming and outgoing sequence flow connections of the rule.
A special case is the complex gateway for which the Incoming condition and Outgoing condition attributes are defined. These attributes are required if there are multiple incoming or outgoing sequence flow connections for a given gateway. The attribute content of the incoming condition can contain sequence flow names and process properties (data). The outgoing condition contains references to sequence flow IDs and process characteristics (data).
METHOD MANUAL
239
11.3.13 Modeling guidelines for gateways Gateways of the XOR (data-based) type: For all outgoing connections of an XOR
(data-based) gateway, the value Expression must be set for the Condition attribute, and a valid expression must be used for the Condition expression attribute.
Sequence flow, especially after gateways:
For every XOR gateway of the XOR (data-based) type, the Default gateway attribute should be specified for exactly one outgoing sequence flow connection (activates connection type). Under no circumstances must multiple outgoing connections be marked with this attribute.
For each XOR gateway of the XOR (event-based) type there must be at least two outgoing sequence flow connections (activates or leads to type).
For all outgoing connections of an event-based XOR gateway, no value must be specified for the Condition attribute. The Condition expression attribute should not be specified.
The following target objects are permitted for outgoing sequence flow connections of an event-based XOR gateway:
Functions for which the Receive task type was set.
Intermediate events whose Event type attribute type has a value other than Compensation or Multiple.
If there is a function in the set of target objects, this set must not contain an event of the Message type.
If a gateway of the OR type has no or exactly one incoming sequence flow connection, there must be at least two outgoing sequence flow connections.
For all outgoing sequence flow connections of an OR gateway, the value Expression must be set for the Condition attribute, and a valid expression must be used for the Condition expression attribute. The expression must unambiguously relate to the current gateway.
If an OR gateway has exactly one outgoing sequence flow connection, no value must be specified for the Condition attribute of this connection.
If a gateway of the Complex type has no or exactly one incoming sequence flow connection, there must be at least two outgoing sequence flow connections.
For all outgoing connections of a complex gateway, the value None must be specified for the Condition attribute, especially if there is only one outgoing connection.
If a complex gateway has multiple incoming sequence flow connections, a condition that references the sequence flow names and process properties (data) must be specified for the Incoming condition attribute.
If a complex gateway has multiple outgoing sequence flow connections, a condition that references the sequence flow names and process properties (data) must be specified for the Outgoing condition attribute.
If an AND gateway has no or exactly one incoming sequence flow connection, there must be at least two outgoing sequence flow connections.

METHOD MANUAL
240
For all outgoing sequence flow connections of an AND gateway, no value must be specified for the Condition attribute.

METHOD MANUAL
241
11.3.14 Artifact Artifacts provide information about the process. This information does not belong to the sequence flow or message flow. A total of three artifact types are differentiated: Data objects, Groups, and Annotations (the type list can be extended as required).
Data objects are comparable to information carriers or data elements in ARIS. However, in the broadest sense they could encompass all assignments. Data objects influence neither the sequence flow nor the message flow, instead they supply information about what happens during the process. They show how documents, data, and other objects change during the process.
A Group is a graphical emphasis of associated process elements. In ARIS, graphic objects, such as rectangles or polygons are useful for this.
Alternatively, groupings may also serve this purpose. However, this only makes sense if the grouping includes a graphic.
Annotations correspond to remarks about objects or connections, as in the following example Time out [1week]. In ARIS they are often realized with the help of the Remark/Example attribute. It is important that this attribute be placed in the model, as shown in the following example with Yes and No.
Figure 214: E-mail voting process

METHOD MANUAL
242
This figure shows an example of how a business collaboration diagram is implemented in ARIS according to BPMN 2.0. The diagram contains two pools, with the boundaries of the upper pool hidden. The individual elements of the lower pool are not shown.
11.3.15 Sources of figures Figure Two pools with sequence and message flow (page 227):
Business Process Modeling Notation, Working Draft (1.0); BPMI.org; August 25, 2003; page 85.
Figure Pool with two lanes according to BPMN (page 230):
Business Process Modeling Notation, Working Draft (1.0); BPMI.org; August 25, 2003; page 87.
Figure Event categories (page 234) and figure Examples of event types (page 234):
Business Process Modeling Notation, Working Draft (1.0); BPMI.org; August 25, 2003; page 27.
Figure Activities according to BPMN (page 236):
Business Process Modeling Notation, Working Draft (1.0); BPMI.org; August 25, 2003; page 28.
Figure Gateway types (page 238):
Business Process Modeling Notation, Working Draft (1.0); BPMI.org; August 25, 2003; page 28.
METHOD MANUAL
243
12 Modeling BPMN 2.0
12.1 Introduction
12.1.1 Initial situation and objective BPMN (Business Process Modeling and Notation) has emerged as a widely adopted standard for process modeling. Its popularity is based on the fact that it is has been developed by the Object Management Group (OMG), a consortium of organizations that also released other important modeling standards like UML.
The primary goal of BPMN is to provide a notation that is understandable by all users: business analysts designing and documenting business processes, developers implementing these business processes, and business end users executing, managing and monitoring their business processes. Now, the OMG released a new version of BPMN 2.0. This standard shall be supported by ARIS. In a first step, the objective is to focus on process modeling conformance, one of four conformance types defined by the OMG.
The four conformance types are described in detail in the BPMN specification: Business Process Model and Notation (BPMN), version 2.0.
12.1.2 Purpose of this chapter Unfortunately the BPMN specification has increased an order of magnitude in technical complexity and fails to distinguish those elements needed for business process modeling from those required for process execution.
The purpose of this chapter is to describe the ARIS implementation of the BPMN 2.0 elements that are part of business process modeling documenting the process flow. Those parts that are needed for executable design are ignored. The elements relevant for business process modeling are essentially those displayed in a diagram.
The mapping described in the chapters of this document is based on the BPMN specification Business Process Model and Notation (BPMN), version 2.0 (http://www.bpmn.org).
The attribute and model association tables are also taken from the BPMN 2.0 specification and extended to describe the implementation in ARIS.

METHOD MANUAL
244
12.2 BPMN core elements and their implementation in ARIS
The BPMN core consists of four packages:
Foundation
Infrastructure
Common Elements as well as
Service
It provides the basis for modeling processes, collaborations, choreographies and conversations. These packages are described in detail in chapter 8 of the BPMN specification.
In the following sections the core constructs and their attributes and associations are mapped to ARIS constructs.
12.2.1 Infrastructure The infrastructure package consists of two elements which are particularly relevant for import and export. Thus, their attributes and model associations are not included in the current version of the BPMN 2.0 implementation.
See: Business Process Model and Notation (BPMN), Version 2.0.

METHOD MANUAL
245
12.2.2 Foundation The foundation package contains classes which are shared amongst other packages in the BPMN core. The foundation package consists of eight classes: BaseElement, Documentation, RootElement, Extension, Extension Definition, ExtensionAttributeDefinition, ExtensionAttributeValue and Relationship. See: Business Process Model and Notation (BPMN), version 2.0.
MAPPING THE ATTRIBUTES AND MODEL ASSOCIATIONS TO ARIS
Class BPMN attribute name Implementation in ARIS
BaseElement id: string The ARIS GUID of the corresponding modeling construct represents the BPMN ID. For imported BPMN elements an attribute type in the attribute type group Attributes of external systems will be used.
documentation: Documentation [0..*]
see below: Documentation
extensionDefinitions: ExtensionDefinition [0..*]
ARIS Method can be enhanced, for example, by user defined attributes.
extensionValues: ExtensionAttributeValue [0..*]
The ARIS method can be enhanced, for example, by user defined attributes.
Documentation inherits from BaseElement
text: string All ARIS attribute types assigned to model types, object types, and connection types can be used for documentation purposes. The attribute types Description/Definition (AT_DEC) and Remark/Example (AT_REM) should be used to for general information. Specific attribute types should be used to store specific information.
Extension mustUnderstand: boolean [0..1] = False
Currently not implemented.
definition: ExtensionDefinition
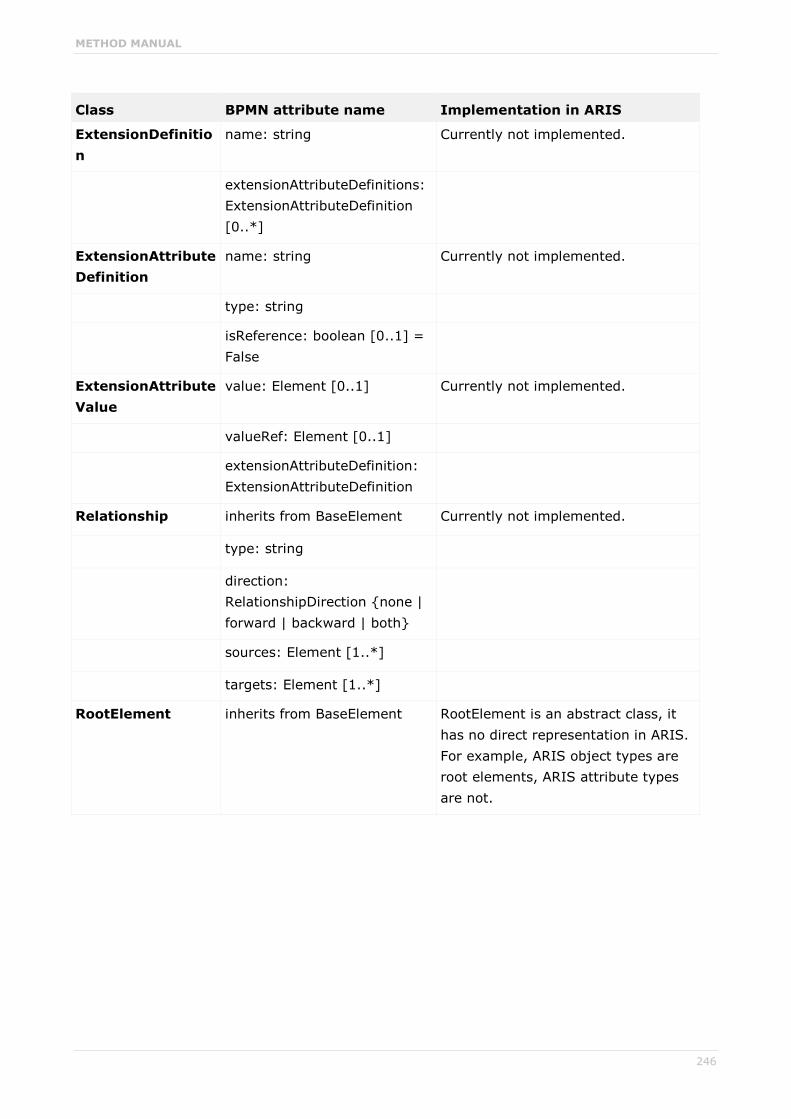
METHOD MANUAL
246
Class BPMN attribute name Implementation in ARIS
ExtensionDefinition
name: string Currently not implemented.
extensionAttributeDefinitions: ExtensionAttributeDefinition [0..*]
ExtensionAttribute Definition
name: string Currently not implemented.
type: string
isReference: boolean [0..1] = False
ExtensionAttribute Value
value: Element [0..1] Currently not implemented.
valueRef: Element [0..1]
extensionAttributeDefinition: ExtensionAttributeDefinition
Relationship inherits from BaseElement Currently not implemented.
type: string
direction: RelationshipDirection {none | forward | backward | both}
sources: Element [1..*]
targets: Element [1..*]
RootElement inherits from BaseElement RootElement is an abstract class, it has no direct representation in ARIS. For example, ARIS object types are root elements, ARIS attribute types are not.

METHOD MANUAL
247
12.2.3 Common Elements Common Elements are basic elements that may be used in more than one type of diagram, for example, Process, Collaboration, Conversation, and Choreography. The Common Elements are categorized into seventeen different groups.
12.2.3.1 Artifacts Artifacts are used to depict additional information in a BPMN process diagram (BPMN2.0) or BPMN collaboration diagram (BPMN2.0) that is not directly related to the sequence flow or message flow. BPMN 2.0 provides three standard artifacts:
Associations,
Groups, and
Text annotations
Data objects are no longer artifacts, they are concepts of their own (see chapter Items and Data (page 290)).
See: Business Process Model and Notation (BPMN), version 2.0.
MAPPING THE ATTRIBUTES AND MODEL ASSOCIATIONS TO ARIS
Class BPMN attribute name Implementation in ARIS
Association inherits from BaseElement various connection types
associationDirection: AssociationDirection = None {None | One | Both}
This attribute is represented by the direction and the style of the corresponding ARIS connection type.
sourceRef: BaseElement Corresponds to the source object type of the connection type representing the association.
targetRef: BaseElement Corresponds to the target object type of the connection type representing the association.
Group inherits from BaseElement Object type: Structural element (OT_STRCT_ELMT) Symbol: Structural element in model type Structuring model (MT_STRCT_DGM) Symbol: Group (ST_BPMN_GROUPING_1)
categoryValueRef: CategoryValue [0..1]
Attribute type Name (AT_NAME) of object type Structural element (OT_STRCT_ELMT)
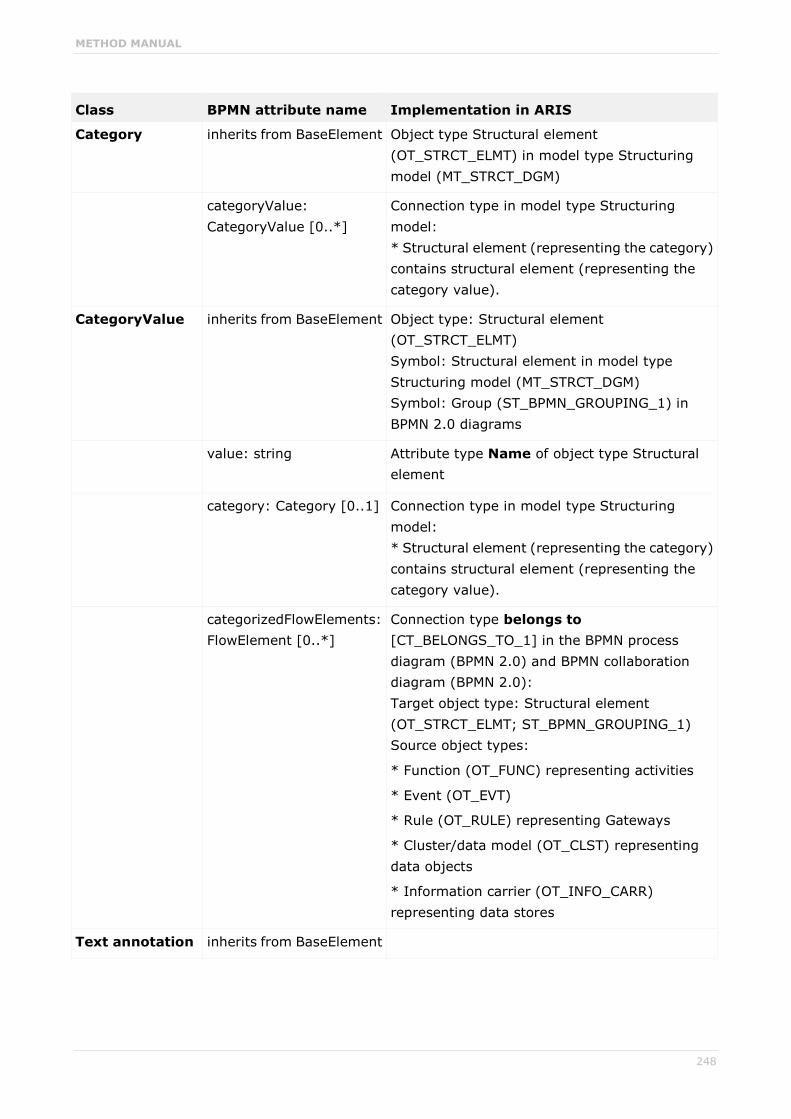
METHOD MANUAL
248
Class BPMN attribute name Implementation in ARIS
Category inherits from BaseElement Object type Structural element (OT_STRCT_ELMT) in model type Structuring model (MT_STRCT_DGM)
categoryValue: CategoryValue [0..*]
Connection type in model type Structuring model: * Structural element (representing the category) contains structural element (representing the category value).
CategoryValue inherits from BaseElement Object type: Structural element (OT_STRCT_ELMT) Symbol: Structural element in model type Structuring model (MT_STRCT_DGM) Symbol: Group (ST_BPMN_GROUPING_1) in BPMN 2.0 diagrams
value: string Attribute type Name of object type Structural element
category: Category [0..1] Connection type in model type Structuring model: * Structural element (representing the category) contains structural element (representing the category value).
categorizedFlowElements: FlowElement [0..*]
Connection type belongs to [CT_BELONGS_TO_1] in the BPMN process diagram (BPMN 2.0) and BPMN collaboration diagram (BPMN 2.0): Target object type: Structural element (OT_STRCT_ELMT; ST_BPMN_GROUPING_1) Source object types:
* Function (OT_FUNC) representing activities
* Event (OT_EVT)
* Rule (OT_RULE) representing Gateways
* Cluster/data model (OT_CLST) representing data objects
* Information carrier (OT_INFO_CARR) representing data stores
Text annotation inherits from BaseElement
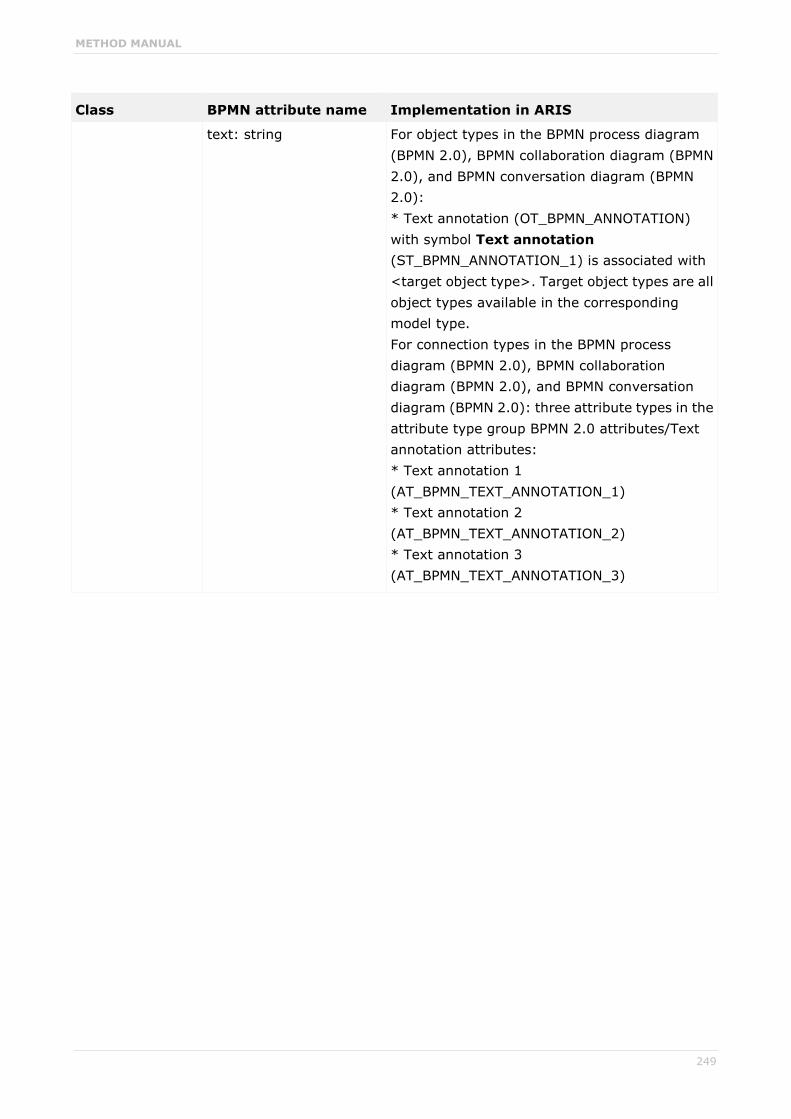
METHOD MANUAL
249
Class BPMN attribute name Implementation in ARIS
text: string For object types in the BPMN process diagram (BPMN 2.0), BPMN collaboration diagram (BPMN 2.0), and BPMN conversation diagram (BPMN 2.0): * Text annotation (OT_BPMN_ANNOTATION) with symbol Text annotation (ST_BPMN_ANNOTATION_1) is associated with <target object type>. Target object types are all object types available in the corresponding model type. For connection types in the BPMN process diagram (BPMN 2.0), BPMN collaboration diagram (BPMN 2.0), and BPMN conversation diagram (BPMN 2.0): three attribute types in the attribute type group BPMN 2.0 attributes/Text annotation attributes: * Text annotation 1 (AT_BPMN_TEXT_ANNOTATION_1) * Text annotation 2 (AT_BPMN_TEXT_ANNOTATION_2) * Text annotation 3 (AT_BPMN_TEXT_ANNOTATION_3)

METHOD MANUAL
250
12.2.3.1.1 Association Associations are used to associate information and artifacts with other BPMN elements. Thus, associations are (usually) represented by connection types in ARIS. The relevant connection types are described in the context of the object types being associated.
12.2.3.1.2 Group BPMN 2.0 uses three different classes to represent groupings, but there is only one symbol: Group. Thus, a group is the graphical representation of a category value.
Categories and their category values are modeled in an auxiliary model of type Structuring model.
Figure 215: Structuring model: Categories and their values
In ARIS the graphical element Group is an occurrence copy of a category value object and is depicted by a special symbol in the BPMN 2.0 models. The symbol name is Group.
Figure 216: Group symbol

METHOD MANUAL
251
12.2.3.1.3 Text annotation Text annotations are used to provide additional textual information for the reader of a BPMN model. They can be associated with graphical elements in a model, ARIS objects and connections.
Figure 217: Symbol representing text annotations
Text annotations are implemented in ARIS in 2 different ways:
TEXT ANNOTATIONS ASSOCIATED WITH ARIS OBJECTS
The object type Text annotation and the connection type is associated with is used to annotate objects (occurrences) in a model.
TEXT ANNOTATIONS ASSOCIATED WITH ARIS CONNECTIONS
Objects (here: Text annotation) cannot be assigned to connections. Thus, the program provides a new functionality: The modeler selects the text annotation symbol in the Symbols bar, places it on/near by the connection he/she wants to annotate and enters the text. The program draws a line looking like an association and stores the text in a Text annotation attribute of the corresponding connection. In the first step three text annotation attributes are provided in the attribute type group BPMN 2.0 attributes/BPMN text annotations:
Text annotation 1 (AT_BPMN_TEXT_ANNOTATION_1)
Text annotation 2 (AT_BPMN_TEXT_ANNOTATION_2)
Text annotation 3 (AT_BPMN_TEXT_ANNOTATION_3)

METHOD MANUAL
252
12.2.3.2 Callable Elements Callable Element is an abstract class and has four specialized classes: Process, Global task, Choreography, and Choreography task. Only processes and global tasks are relevant for business process modeling compliance. They are represented by the object type Function.
See: Business Process Model and Notation (BPMN), version 2.0.
MAPPING THE ATTRIBUTES AND MODEL ASSOCIATIONS TO ARIS
Class BPMN attribute name Implementation in ARIS
Callable Element inherits from BaseElement Object type: Function (OT_FUNC) Symbol: Call activity (ST_BPMN_CALL_ACTIVITY)
name: string [0..1] Attribute type Name (AT_NAME) of object type Function (OT_FUNC)
supportedInterfacesRefs: Interface [0..*]
Currently not implemented.
ioSpecification: InputOutputSpecification [0..1]
Currently not implemented.
ioBinding: InputOutputBinding [0..*]
Currently not implemented.
InputOutputBinding
inputData: DataInput Currently not implemented.
outputData: DataOutput Currently not implemented.
operationRef: Operation Currently not implemented.
12.2.3.3 Event Events are described in detail in the context of the BPMN process diagram (see chapter Events (page 293)).
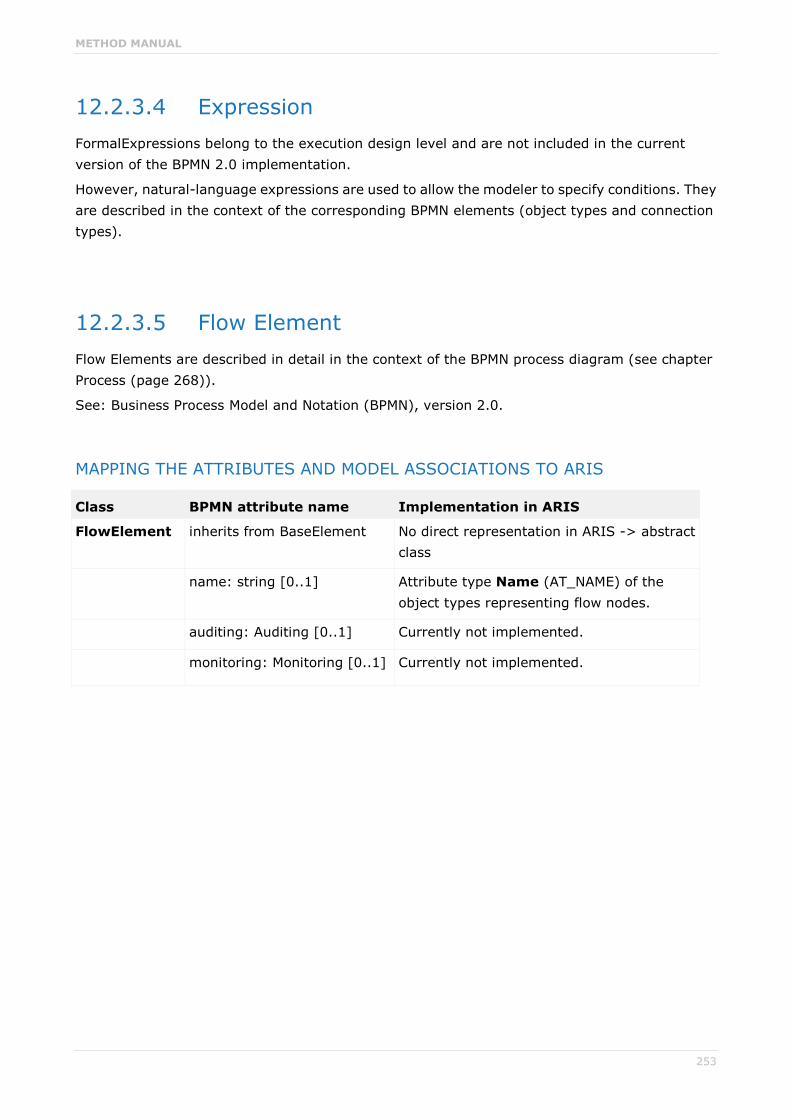
METHOD MANUAL
253
12.2.3.4 Expression FormalExpressions belong to the execution design level and are not included in the current version of the BPMN 2.0 implementation.
However, natural-language expressions are used to allow the modeler to specify conditions. They are described in the context of the corresponding BPMN elements (object types and connection types).
12.2.3.5 Flow Element Flow Elements are described in detail in the context of the BPMN process diagram (see chapter Process (page 268)).
See: Business Process Model and Notation (BPMN), version 2.0.
MAPPING THE ATTRIBUTES AND MODEL ASSOCIATIONS TO ARIS
Class BPMN attribute name Implementation in ARIS
FlowElement inherits from BaseElement No direct representation in ARIS -> abstract class
name: string [0..1] Attribute type Name (AT_NAME) of the object types representing flow nodes.
auditing: Auditing [0..1] Currently not implemented.
monitoring: Monitoring [0..1] Currently not implemented.

METHOD MANUAL
254
12.2.3.6 Flow Elements Container A FlowElementsContainer is an abstract super class for BPMN diagrams (or views). So, Processes and Subprocesses as well as Choreographies and Choreography subprocess are FlowElementsContainers.
The specific attributes and model associations of a process and subprocess are described in detail in the context of the BPMN process diagram.
See: Business Process Model and Notation (BPMN), version 2.0.
MAPPING THE ATTRIBUTES AND MODEL ASSOCIATIONS TO ARIS
Class BPMN attribute name Implementation in ARIS
FlowElementsContainer inherits from BaseElement Model type BPMN process diagram (BPMN 2.0) (MT_BPMN_PROCESS_DIAGRAM)
flowElements: FlowElement [0..*]
Occurrences of the object types and connection types allowed in a BPMN process diagram (BPMN 2.0).
artifacts: Artifact [0..*] Occurrences of the object types and attribute types representing groups and text annotations as well as their connection types allowed in the BPMN process diagram (BPMN 2.0).

METHOD MANUAL
255
12.2.3.7 Gateways Gateways are described in detail in the context of the BPMN process diagram (see chapter Gateways (page 306)).
See: Business Process Model and Notation (BPMN), version 2.0.
MAPPING THE ATTRIBUTES AND MODEL ASSOCIATIONS TO ARIS
Class BPMN attribute name Implementation in ARIS
Gateway inherits from FlowElement Object type: Rule (OT_RULE)
gatewayDirection: GatewayDirection = unspecified { unspecified | converging | diverging | mixed }
The number of incoming and outgoing sequence flows depends on the modeling context, that is, the position of the gateway in the process. Thus, there is no ARIS attribute type representing the gateway direction. Gateways whose direction is unspecified or mixed should be avoided.

METHOD MANUAL
256
12.2.3.8 Message Messages normally represent information exchanged between two participants in a BPMN collaboration diagram.
A message is represented by the symbol Message of the ARIS object type Message.
Figure 218: Message symbol
See: Business Process Modeling Notation (BPMN), version 2.0, page 93 and the following.
MAPPING THE ATTRIBUTES AND MODEL ASSOCIATIONS TO ARIS
Class BPMN attribute name Implementation in ARIS
Message inherits from BaseElement Object type: Message (OT_MSG_FLW) Symbol: Message (ST_BPMN_MESSAGE_2)
name: string Attribute type Name (AT_NAME) of object type Message (OT_MSG_FLW)
structureRef : ItemDefinition [0..1]
Currently not implemented.

METHOD MANUAL
257
12.2.3.9 Message flow The message exchange between participants is shown by a message flow that connects two pools or the objects within the pools.
Figure 219: Message flow between participants/pools
A message flow is represented in ARIS by the connection type message flow. If the message sent from one participant to another should be displayed in the diagram, the connection type message flow is replaced by the object type Message (symbol Message) and two connection types:
<Source object type> sends message.
Message is received from <target object type>.
More details can be found in chapter Message flow (page 314).
Message flow associations are used to map message flows modeled in two different diagrams, for example, in a conversation and a collaboration diagram. These associations are realized in ARIS by occurrence copies of the message flow connections.
Message flow is also described in the context of the BPMN collaboration diagram (chapter Message flow (page 314)) and the BPMN conversation diagram (chapter Message flow in a conversation (page 318)).
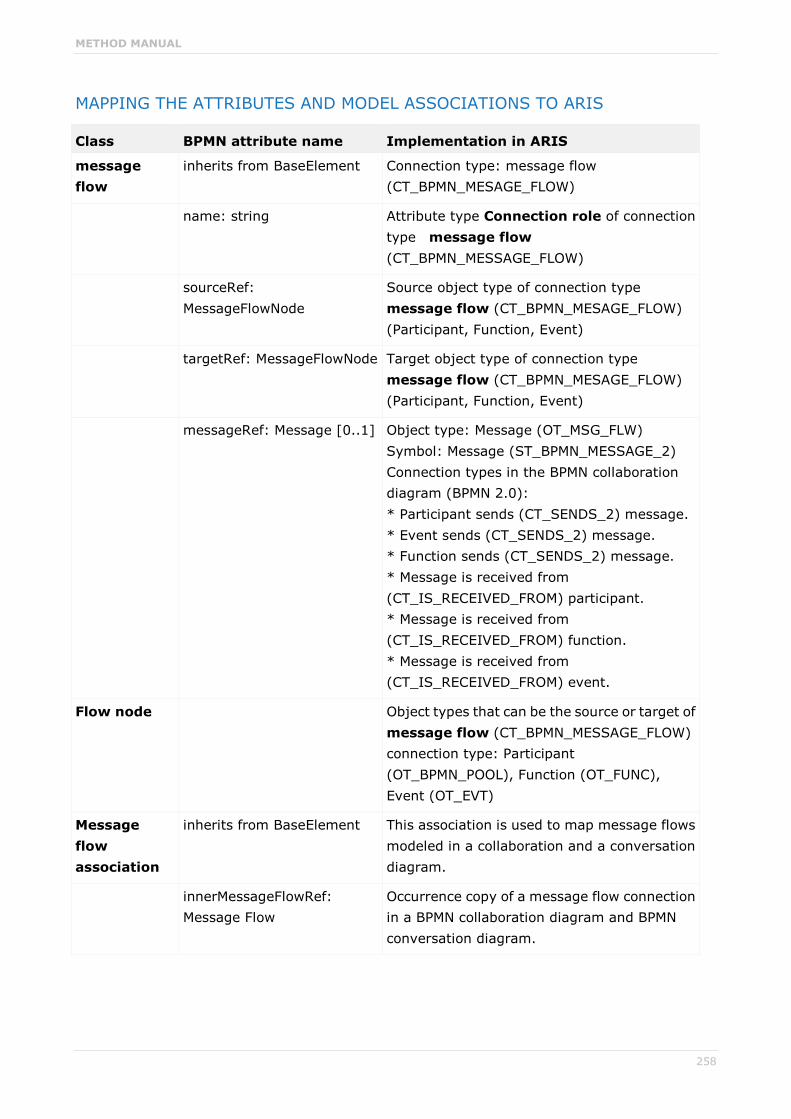
METHOD MANUAL
258
MAPPING THE ATTRIBUTES AND MODEL ASSOCIATIONS TO ARIS
Class BPMN attribute name Implementation in ARIS
message flow
inherits from BaseElement Connection type: message flow (CT_BPMN_MESAGE_FLOW)
name: string Attribute type Connection role of connection type message flow (CT_BPMN_MESSAGE_FLOW)
sourceRef: MessageFlowNode
Source object type of connection type message flow (CT_BPMN_MESAGE_FLOW) (Participant, Function, Event)
targetRef: MessageFlowNode Target object type of connection type message flow (CT_BPMN_MESAGE_FLOW) (Participant, Function, Event)
messageRef: Message [0..1] Object type: Message (OT_MSG_FLW) Symbol: Message (ST_BPMN_MESSAGE_2) Connection types in the BPMN collaboration diagram (BPMN 2.0): * Participant sends (CT_SENDS_2) message. * Event sends (CT_SENDS_2) message. * Function sends (CT_SENDS_2) message. * Message is received from (CT_IS_RECEIVED_FROM) participant. * Message is received from (CT_IS_RECEIVED_FROM) function. * Message is received from (CT_IS_RECEIVED_FROM) event.
Flow node Object types that can be the source or target of message flow (CT_BPMN_MESSAGE_FLOW) connection type: Participant (OT_BPMN_POOL), Function (OT_FUNC), Event (OT_EVT)
Message flow association
inherits from BaseElement This association is used to map message flows modeled in a collaboration and a conversation diagram.
innerMessageFlowRef: Message Flow
Occurrence copy of a message flow connection in a BPMN collaboration diagram and BPMN conversation diagram.

METHOD MANUAL
259
Class BPMN attribute name Implementation in ARIS
outerMessageFlowRef: Message Flow
Occurrence copy of a message flow connection in a BPMN collaboration diagram and BPMN conversation diagram.

METHOD MANUAL
260
12.2.3.10 Participant A participant represents a Partner entity and/or a Partner role that participates in a collaboration. Participants may be modeled in a BPMN collaboration diagram or a BPMN conversation diagram.
The assignment of a Partner entity and/or a Partner role to a participant is transferred to the BPMN allocation diagram (BPMN 2.0) assigned to the participant.
Figure 220: BPMN allocation diagram (BPMN 2.0): Participant and partner entity/partner role
The usage of participants is described in the context of the BPMN collaboration diagram (see chapter Pool and participant (page 313)) and the BPMN conversation diagram (see chapter Participant (page 317)).
Participant, Partner entity and Partner role inherit from base element
See: Business Process Model and Notation (BPMN), version 2.0.
MAPPING THE ATTRIBUTES AND MODEL ASSOCIATIONS TO ARIS
Class BPMN attribute name Implementation in ARIS
Participant inherits from BaseElement Object type: Participant (OT_BPMN_POOL)
Symbol: Pool (ST_BPMN_POOL_1)
name: string [0..1] Attribute type Name (AT_NAME) of object type Participant (OT_BPMN_POOL)
processRef: Process [0..1] BPMN process diagram (BPMN 2.0) assigned to the participant (OT_BPMN_POOL
Process displayed within in the pool
partnerRoleRef: PartnerRole [0..1]
Model type: BPMN allocation diagram (BPMN 2.0):
Object type: Role (OT_PERS_TYPE)
Symbol: Partner role (ST_BPMN_PARTNER_ROLE)
Connection type: depicts (CT_DEPICTS_1) Role

METHOD MANUAL
261
Class BPMN attribute name Implementation in ARIS
partnerEntityRef: PartnerEntity [0..1]
Model type: BPMN allocation diagram (BPMN 2.0):
Object type: Organizational unit (OT_ORG_UNIT)
Symbol: Partner entity (ST_BPMN_PARTNER_ENTITY)
Connection type: depicts (CT_DEPICTS_1) organizational unit
interfaceRef: Interface [0..*] Currently not implemented.
participantMultiplicity: participantMultiplicity [0..1]
Attribute type in the attribute type group BPMN 2.0 attributes/Participant multiplicity attributes of the object type Participant (OT_BPMN_POOL):
* Multi-instance participant (AT_BPMN_MI_PARTICIPANT)
The mini-symbol (three vertical lines) is displayed by the program if the value of the attribute type Multi-instance participant is set to true.
endpointRefs: EndPoint [0..*] Currently not implemented.
Partner entity inherits from BaseElement Object type: Organizational unit (OT_ORG_UNIT)
Symbol: Partner entity (ST_BPMN_PARTNER_ENTITY)
name: string Attribute type Name (AT_NAME) of object type Organizational unit (OT_ORG_UNIT)
Partner role inherits from BaseElement Object type: Role (OT_PERS_TYPE) Symbol: Partner role (ST_BPMN_PARTNER_ROLE)
name: string Attribute type Name of object type Role (OT_PERS_TYPE)
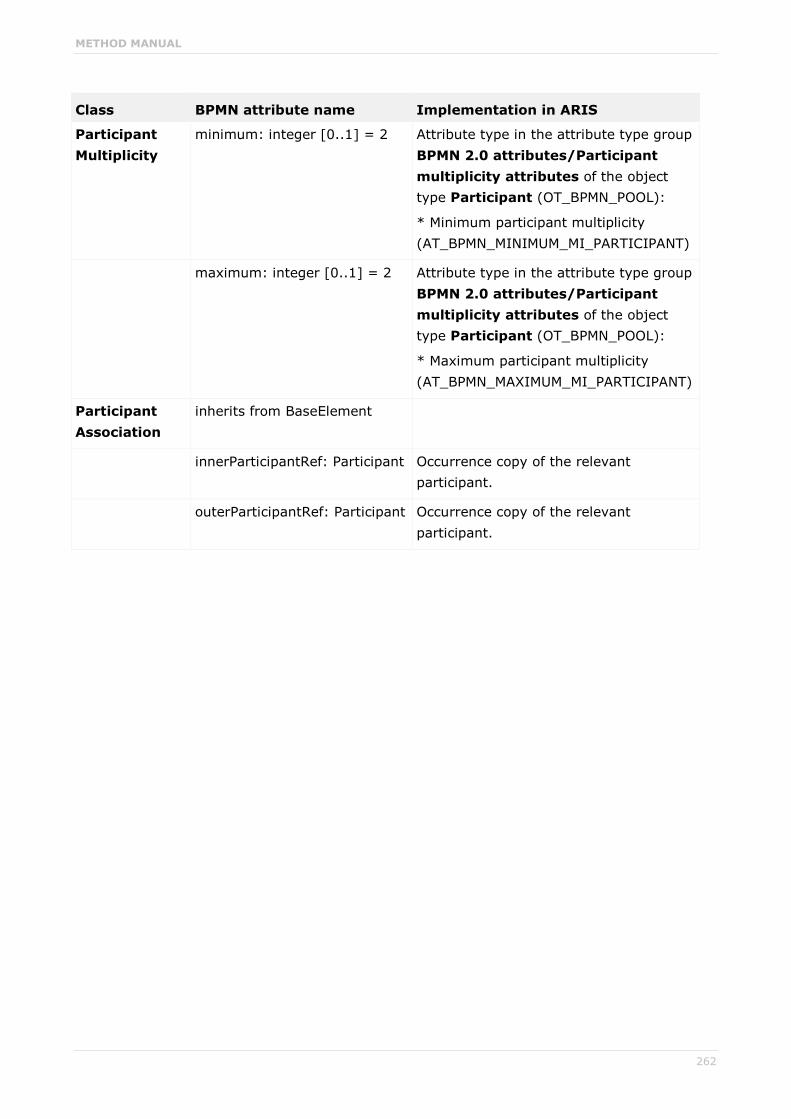
METHOD MANUAL
262
Class BPMN attribute name Implementation in ARIS
Participant Multiplicity
minimum: integer [0..1] = 2 Attribute type in the attribute type group BPMN 2.0 attributes/Participant multiplicity attributes of the object type Participant (OT_BPMN_POOL):
* Minimum participant multiplicity (AT_BPMN_MINIMUM_MI_PARTICIPANT)
maximum: integer [0..1] = 2 Attribute type in the attribute type group BPMN 2.0 attributes/Participant multiplicity attributes of the object type Participant (OT_BPMN_POOL):
* Maximum participant multiplicity (AT_BPMN_MAXIMUM_MI_PARTICIPANT)
Participant Association
inherits from BaseElement
innerParticipantRef: Participant Occurrence copy of the relevant participant.
outerParticipantRef: Participant Occurrence copy of the relevant participant.

METHOD MANUAL
263
12.2.3.11 Resource Resources can be human resources as well as any other resource assigned to activities during process execution. A direct mapping of the BPMN resources to ARIS constructs is not possible - due to the semantically different object types representing resources in ARIS. ARIS does not only provide different object types, but also different connection types.
BPMN 2.0 only knows one object type called Resource. The BPMN ActivityResource and its specialized sub-classes correspond to ARIS connection types in combination with object types. Therefore, resources are not included in the current version of the BPMN 2.0 implementation.
See: Business Process Model and Notation (BPMN), version 2.0.
12.2.3.12 Sequence flow The BPMN Sequence flow is mapped to nine different ARIS connection types, which are used to depict the control flow in traditional ARIS process models
See: Business Process Model and Notation (BPMN), version 2.0.
Source object type Connection type Target object type
Event occurs before Event
Event activates Function
Event is evaluated by Rule
Function creates Event
Function is predecessor of Function
Function leads to Rule
Rule leads to Event
Rule activates Function
Rule links Rule
BPMN distinguishes three types of sequence flow:
Unconditional sequence flow
The unconditional sequence flow means the normal flow, no specific conditions apply. In other words: its condition has always the value true. It is depicted by a solid line with a solid arrowhead.
Conditional sequence flow
The conditional sequence flow from an activity is drawn with a little diamond at the beginning of the connector, signifying a data condition. A conditional sequence flow from a gateway shares the same shape as a normal sequence flow.
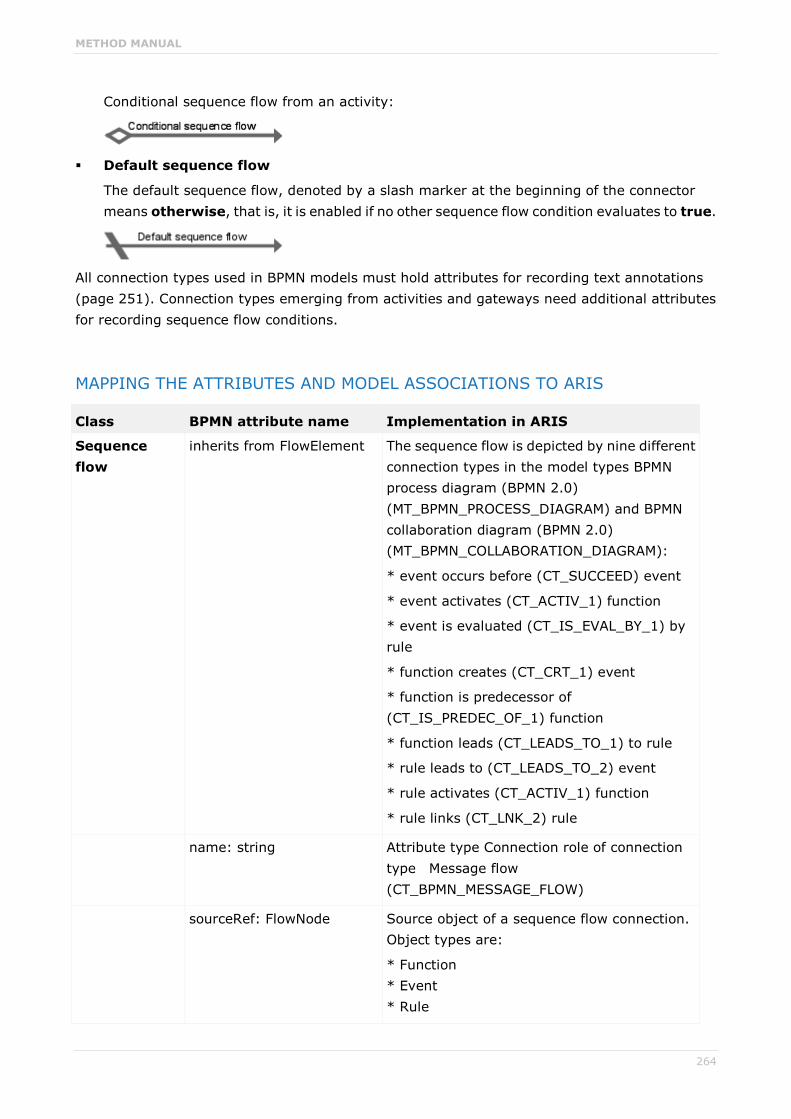
METHOD MANUAL
264
Conditional sequence flow from an activity:
Default sequence flow
The default sequence flow, denoted by a slash marker at the beginning of the connector means otherwise, that is, it is enabled if no other sequence flow condition evaluates to true.
All connection types used in BPMN models must hold attributes for recording text annotations (page 251). Connection types emerging from activities and gateways need additional attributes for recording sequence flow conditions.
MAPPING THE ATTRIBUTES AND MODEL ASSOCIATIONS TO ARIS
Class BPMN attribute name Implementation in ARIS
Sequence flow
inherits from FlowElement The sequence flow is depicted by nine different connection types in the model types BPMN process diagram (BPMN 2.0) (MT_BPMN_PROCESS_DIAGRAM) and BPMN collaboration diagram (BPMN 2.0) (MT_BPMN_COLLABORATION_DIAGRAM):
* event occurs before (CT_SUCCEED) event
* event activates (CT_ACTIV_1) function
* event is evaluated (CT_IS_EVAL_BY_1) by rule
* function creates (CT_CRT_1) event
* function is predecessor of (CT_IS_PREDEC_OF_1) function
* function leads (CT_LEADS_TO_1) to rule
* rule leads to (CT_LEADS_TO_2) event
* rule activates (CT_ACTIV_1) function
* rule links (CT_LNK_2) rule
name: string Attribute type Connection role of connection type Message flow (CT_BPMN_MESSAGE_FLOW)
sourceRef: FlowNode Source object of a sequence flow connection. Object types are:
* Function * Event * Rule
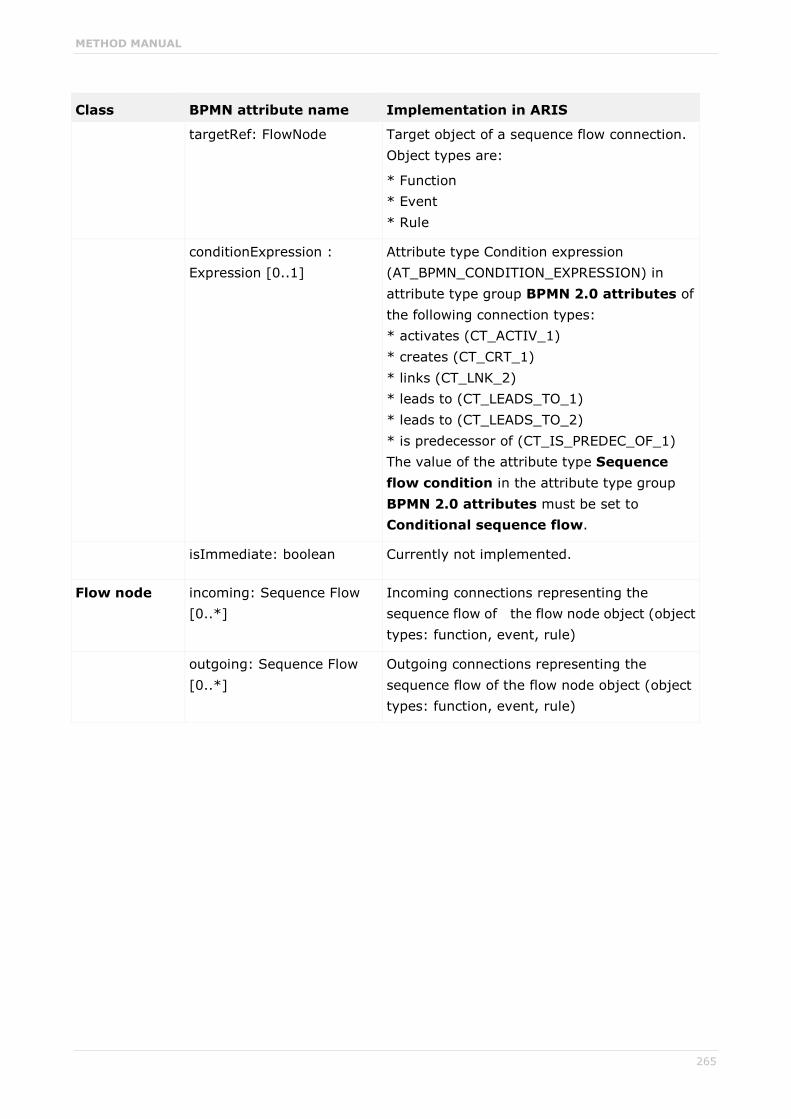
METHOD MANUAL
265
Class BPMN attribute name Implementation in ARIS
targetRef: FlowNode Target object of a sequence flow connection. Object types are:
* Function * Event * Rule
conditionExpression : Expression [0..1]
Attribute type Condition expression (AT_BPMN_CONDITION_EXPRESSION) in attribute type group BPMN 2.0 attributes of the following connection types: * activates (CT_ACTIV_1) * creates (CT_CRT_1) * links (CT_LNK_2) * leads to (CT_LEADS_TO_1) * leads to (CT_LEADS_TO_2) * is predecessor of (CT_IS_PREDEC_OF_1) The value of the attribute type Sequence flow condition in the attribute type group BPMN 2.0 attributes must be set to Conditional sequence flow.
isImmediate: boolean Currently not implemented.
Flow node incoming: Sequence Flow [0..*]
Incoming connections representing the sequence flow of the flow node object (object types: function, event, rule)
outgoing: Sequence Flow [0..*]
Outgoing connections representing the sequence flow of the flow node object (object types: function, event, rule)
METHOD MANUAL
266
12.2.3.13 Elements not included in the current implementation
The following elements belong to the execution design level and are not included in the current version of the BPMN 2.0 implementation.
Correlations (See: Business Process Modeling Notation (BPMN), version 2.0, page 136 and the following.)
Conversation Associations (See: Business Process Modeling Notation (BPMN), version 2.0, page 135 and the following.)
Error (See: Business Process Modeling Notation (BPMN), version 2.0, page 81 and the following.)
Interaction node (See: Business Process Modeling Notation (BPMN), version 2.0, page 123.)
Item definition (See: Business Process Modeling Notation (BPMN), version 2.0, page 91 and the following.)
Services (See: Business Process Modeling Notation (BPMN), version 2.0, page 104 and the following.)
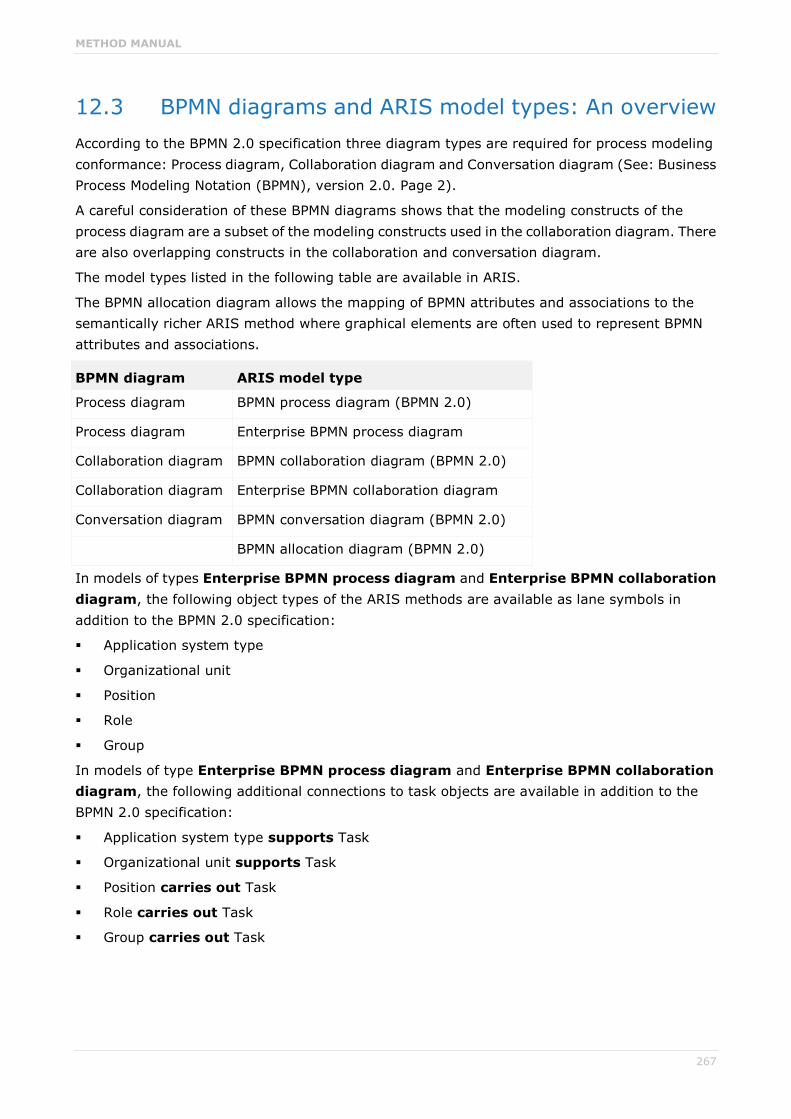
METHOD MANUAL
267
12.3 BPMN diagrams and ARIS model types: An overview According to the BPMN 2.0 specification three diagram types are required for process modeling conformance: Process diagram, Collaboration diagram and Conversation diagram (See: Business Process Modeling Notation (BPMN), version 2.0. Page 2).
A careful consideration of these BPMN diagrams shows that the modeling constructs of the process diagram are a subset of the modeling constructs used in the collaboration diagram. There are also overlapping constructs in the collaboration and conversation diagram.
The model types listed in the following table are available in ARIS.
The BPMN allocation diagram allows the mapping of BPMN attributes and associations to the semantically richer ARIS method where graphical elements are often used to represent BPMN attributes and associations.
BPMN diagram ARIS model type
Process diagram BPMN process diagram (BPMN 2.0)
Process diagram Enterprise BPMN process diagram
Collaboration diagram BPMN collaboration diagram (BPMN 2.0)
Collaboration diagram Enterprise BPMN collaboration diagram
Conversation diagram BPMN conversation diagram (BPMN 2.0)
BPMN allocation diagram (BPMN 2.0)
In models of types Enterprise BPMN process diagram and Enterprise BPMN collaboration diagram, the following object types of the ARIS methods are available as lane symbols in addition to the BPMN 2.0 specification:
Application system type
Organizational unit
Position
Role
Group
In models of type Enterprise BPMN process diagram and Enterprise BPMN collaboration diagram, the following additional connections to task objects are available in addition to the BPMN 2.0 specification:
Application system type supports Task
Organizational unit supports Task
Position carries out Task
Role carries out Task
Group carries out Task

METHOD MANUAL
268
12.4 Process See: Business Process Model and Notation (BPMN), version 2.0.
The BPMN process diagram depicts a BPMN process. A process is a specialization of a FlowElementsContainer. So, it contains the following elements:
flow nodes (event, activity, and gateway)
sequence flow
artifacts (see chapter Artifacts (page 247))
MAPPING THE ATTRIBUTES AND MODEL ASSOCIATIONS TO ARIS
Class BPMN attribute name Implementation in ARIS
Process inherits from CallableElement inherits from FlowElementsContainer
Model type: BPMN process diagram (BPMN 2.0)
processType: ProcessType = none { none | executable | non-executable | public }
Attribute type in the attribute type group BPMN 2.0 attributes of model type BPMN process diagram (BPMN 2.0): * Process type (AT_BPMN_PROCESS_TYPE) Attribute values: * Undefined (= none), * Executable process (AVT_BPMN_EXECUTABLE), * Non-executable process (AVT_BPMN_NON_EXECUTABLE) * Public process (AVT_BPMN_PUBLIC)
auditing: Auditing [0..1] Currently not implemented.
monitoring: Monitoring [0..1] Currently not implemented.
laneSets: LaneSet [0..*] Object type Lane (OT_BPMN_LANE) Symbol: Lane (ST_BPMN_LANE_1)
IsClosed: boolean = false Attribute type Is closed (AT_BPMN_IS_CLOSED) in attribute type group BPMN 2.0 attributes of the BPMN process diagram
supports: Process [0..*] Currently not implemented.
properties: Property [0..*] Currently not implemented.
definitionalCollaborationRef: Collaboration [0..1]
The BPMN collaboration diagram (BPMN 2.0) that contains the process

METHOD MANUAL
269
A process is a particular construct: On the one hand it is a model. On the other hand a process can be visualized within a pool in a collaboration. But a pool is not identical with a process, and vice versa. A pool represents a participant in a collaboration (see chapter Collaboration (page 312)). A pool may contain the process the participant uses in a specific collaboration.
The core elements for modeling a BPMN process are those constructs which can be connected to each other by sequence flow. They are called flow nodes. The corresponding ARIS object types and their symbols provided in the Symbols bar are listed in the table below.
BPMN element ARIS object type ARIS symbol API name
Event Event (OT_EVT) Start event
Intermediate event
End event
ST_BPMN_START_EVENT
ST_BPMN_INTERMEDIATE_EVENT
ST_BPMN_END_EVENT
Activity Function (OT_FUNC)
Task
Subprocess
Call activity
ST_BPMN_TASK
ST_BPMN_SUBPROCESS
ST_BPMN_CALL_ACTIVITY
Gateway Rule (OT_RULE) Gateway ST_BPMN_RULE_1
These constructs are described in detail in the separate chapters below.

METHOD MANUAL
270
12.4.1 Activities The BPMN activity is represented by the ARIS object type Function.
BPMN 2.0 differentiates three basic types of activities: task (atomic activity), subprocess (non-atomic activity) and call activity. The symbols depicting these activity types are provided in the ARIS Symbols bar.
Figure 221: Symbols representing activities in the Symbols bar
When the modeler places an activity symbol, the software sets the corresponding value of the ARIS attribute type Activity type (AT_BPMN_ACTIVITY_TYPE). This activity type controls the correct behavior of the symbol. For example: A subprocess may have embedded flow elements, a task must not; a call activity may reference another task or process, tasks and subprocesses must not.
MAPPING THE ATTRIBUTES AND MODEL ASSOCIATIONS TO ARIS
Class BPMN attribute name Implementation in ARIS
Activity inherits from FlowElement Object type: Function (OT_FUNC) Attribute type Activity type (AT_BPMN_ACTIVITY_TYPE) in the attribute type group BPMN 2.0 attributes of object type Function Attribute values: * Task (AVT_BPMN_TASK) * Subprocess (AVT_BPMN_SUBPROCESS) * Call activity (AVT_BPMN_CALL_ACTIVITY)

METHOD MANUAL
271
Class BPMN attribute name Implementation in ARIS
Compensation activity:: boolean = false
Attribute type Compensation activity: (AT_BPMN_COMPENSATION_ACTIVITY.TRM=Compensation activity) in the attribute type group BPMN 2.0 attributes of object type Function
loopCharacteristics: LoopCharacteristics [0..1]
see below: Loop characteristics
resources: ActivityResource [0..*]
Currently not implemented.
default: SequenceFlow [0..1] Attribute type Sequence flow condition (AT_BPMN_SEQ_FLOW_CONDITION) in the attribute type group BPMN 2.0 attributes of the following conenction types: * Activity creates ..., * Activity is predecessor of ..., * Activity leads to ... The attribute value must be set to Default sequence flow.
ioSpecification: InputOutputSpecification [0..1]
Currently not implemented.
properties: Property [0..*] Currently not implemented.
boundaryEventRefs: BoundaryEvent [0..*]
Connection type: Function can trigger event CT_BPMN_CAN_TRIGGER
dataInputAssociations: DataInputAssociation [0..*]
Currently not implemented.
dataOutputAssociations: DataOutputAssociation [0..*]
Currently not implemented.
startQuantity: integer = 1 Currently not implemented.
Class completionQuantity: integer = 1 Currently not implemented.
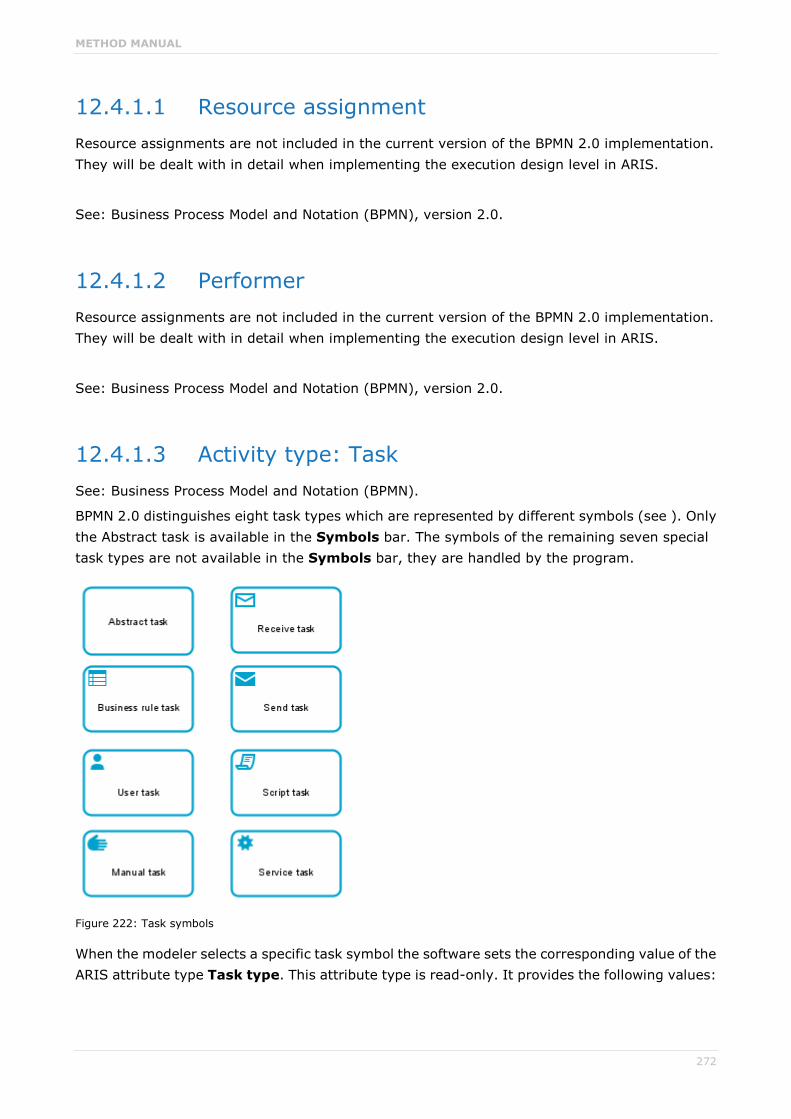
METHOD MANUAL
272
12.4.1.1 Resource assignment Resource assignments are not included in the current version of the BPMN 2.0 implementation. They will be dealt with in detail when implementing the execution design level in ARIS.
See: Business Process Model and Notation (BPMN), version 2.0.
12.4.1.2 Performer Resource assignments are not included in the current version of the BPMN 2.0 implementation. They will be dealt with in detail when implementing the execution design level in ARIS.
See: Business Process Model and Notation (BPMN), version 2.0.
12.4.1.3 Activity type: Task See: Business Process Model and Notation (BPMN).
BPMN 2.0 distinguishes eight task types which are represented by different symbols (see ). Only the Abstract task is available in the Symbols bar. The symbols of the remaining seven special task types are not available in the Symbols bar, they are handled by the program.
Figure 222: Task symbols
When the modeler selects a specific task symbol the software sets the corresponding value of the ARIS attribute type Task type. This attribute type is read-only. It provides the following values:

METHOD MANUAL
273
Abstract task, Business rule task, Manual task, Script task, Send task, Service task, Receive task, and User task.
MAPPING THE ATTRIBUTES AND MODEL ASSOCIATIONS TO ARIS
Class BPMN attribute name Implementation in ARIS
Task inherits from Activity The value of the attribute type Activity type (AT_BPMN_ACTIVITY_TYPE) is set to Task in the attribute type group BPMN 2.0 attributes of object type Function.
Object type: Function (OT_FUNC)
Symbol: Task (ST_BPMN_TASK) or a special task symbol (see below)
Service task
inherits from Activity The value of the attribute type Task type (AT_BPMN_TASK_TYPE) is set to Service task in the attribute type group BPMN 2.0 attributes/Task attributes of object type Function
Object type: Function (OT_FUNC) Symbol: Service task (ST_BPMN_SERVICE_TASK)
implementation: Implementation = Web Service {Web Service | Other | Unspecified}
Currently not implemented.
operationRef: Operation [0..1] Currently not implemented.
Send task inherits from Activity The value of the attribute type Task type (AT_BPMN_TASK_TYPE) is set to Send task in the attribute type group BPMN 2.0 attributes/Task attributes of object type Function. Object type: Function (OT_FUNC)
Symbol: Send task (ST_SEND_TASK)
messageRef: Message [0..1] Connection type in the BPMN collaboration diagram (BPMN 2.0)
* Function sends message.
operationRef: Operation [0..1] Currently not implemented.
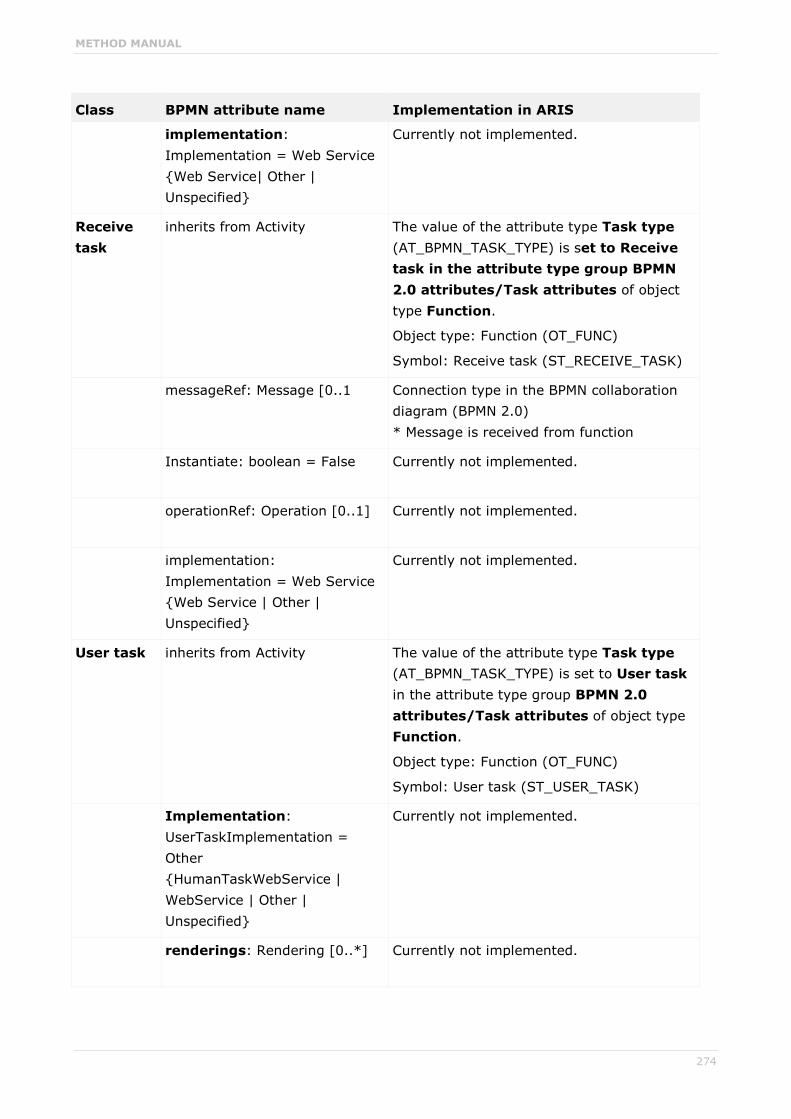
METHOD MANUAL
274
Class BPMN attribute name Implementation in ARIS
implementation: Implementation = Web Service {Web Service| Other | Unspecified}
Currently not implemented.
Receive task
inherits from Activity The value of the attribute type Task type (AT_BPMN_TASK_TYPE) is set to Receive task in the attribute type group BPMN 2.0 attributes/Task attributes of object type Function.
Object type: Function (OT_FUNC)
Symbol: Receive task (ST_RECEIVE_TASK)
messageRef: Message [0..1 Connection type in the BPMN collaboration diagram (BPMN 2.0) * Message is received from function
Instantiate: boolean = False Currently not implemented.
operationRef: Operation [0..1] Currently not implemented.
implementation: Implementation = Web Service {Web Service | Other | Unspecified}
Currently not implemented.
User task inherits from Activity The value of the attribute type Task type (AT_BPMN_TASK_TYPE) is set to User task in the attribute type group BPMN 2.0 attributes/Task attributes of object type Function.
Object type: Function (OT_FUNC)
Symbol: User task (ST_USER_TASK)
Implementation: UserTaskImplementation = Other {HumanTaskWebService | WebService | Other | Unspecified}
Currently not implemented.
renderings: Rendering [0..*] Currently not implemented.
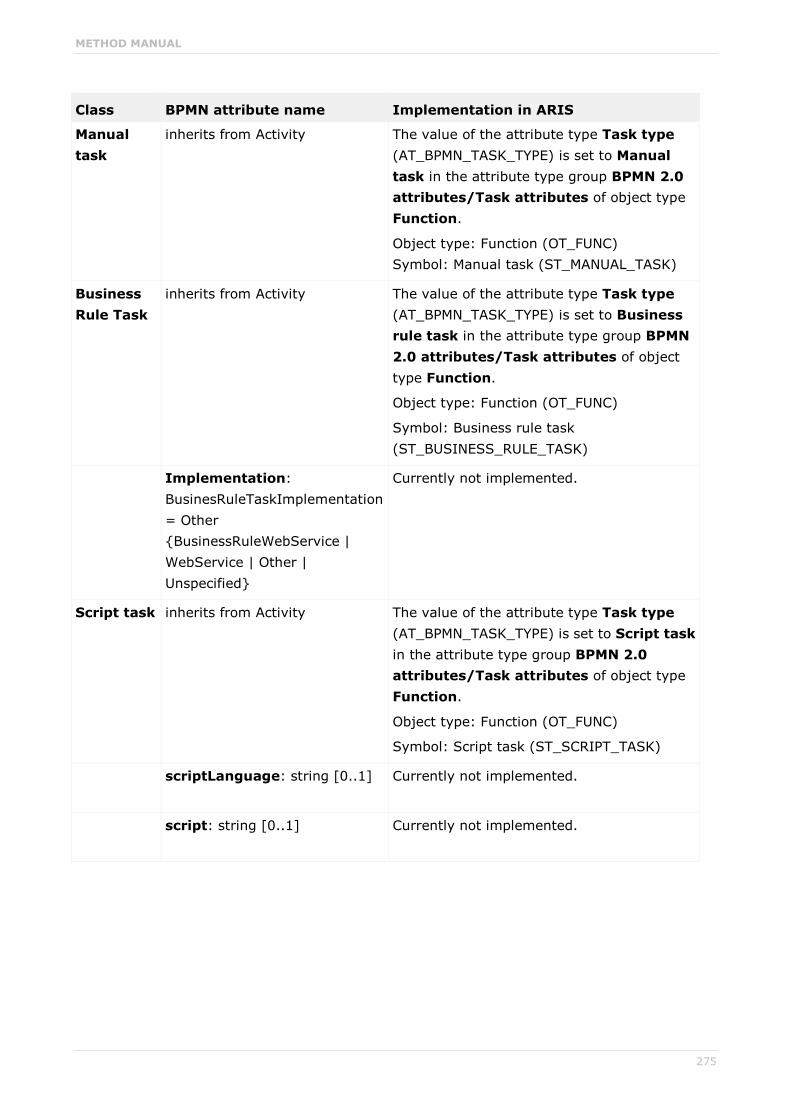
METHOD MANUAL
275
Class BPMN attribute name Implementation in ARIS
Manual task
inherits from Activity The value of the attribute type Task type (AT_BPMN_TASK_TYPE) is set to Manual task in the attribute type group BPMN 2.0 attributes/Task attributes of object type Function.
Object type: Function (OT_FUNC) Symbol: Manual task (ST_MANUAL_TASK)
Business Rule Task
inherits from Activity The value of the attribute type Task type (AT_BPMN_TASK_TYPE) is set to Business rule task in the attribute type group BPMN 2.0 attributes/Task attributes of object type Function.
Object type: Function (OT_FUNC)
Symbol: Business rule task (ST_BUSINESS_RULE_TASK)
Implementation: BusinesRuleTaskImplementation = Other {BusinessRuleWebService | WebService | Other | Unspecified}
Currently not implemented.
Script task inherits from Activity The value of the attribute type Task type (AT_BPMN_TASK_TYPE) is set to Script task in the attribute type group BPMN 2.0 attributes/Task attributes of object type Function.
Object type: Function (OT_FUNC)
Symbol: Script task (ST_SCRIPT_TASK)
scriptLanguage: string [0..1] Currently not implemented.
script: string [0..1] Currently not implemented.
METHOD MANUAL
276
12.4.1.4 Human interactions User tasks and manual tasks are relevant for modeling human interactions. Their attributes and model associations can also be found in chapter Activity type: Task (page 272). They will be dealt with in detail when implementing the execution design level in ARIS.
See: Business Process Model and Notation (BPMN), version 2.0.
12.4.1.5 Activity type: Subprocess See: Business Process Model and Notation (BPMN), version 2.0.
BPMN 2.0 knows four types of subprocesses:
Subprocess (standard) (A ([standard] subprocess corresponds to the embedded subprocess in BPMN 1.x.)
Event subprocess
Transaction, and
Ad hoc subprocess
Each type of a subprocess can be displayed as
Subprocess (collapsed) or
Subprocess (expanded)
Collapsed subprocesses have a special marker displayed at the bottom of the corresponding subprocess symbol:
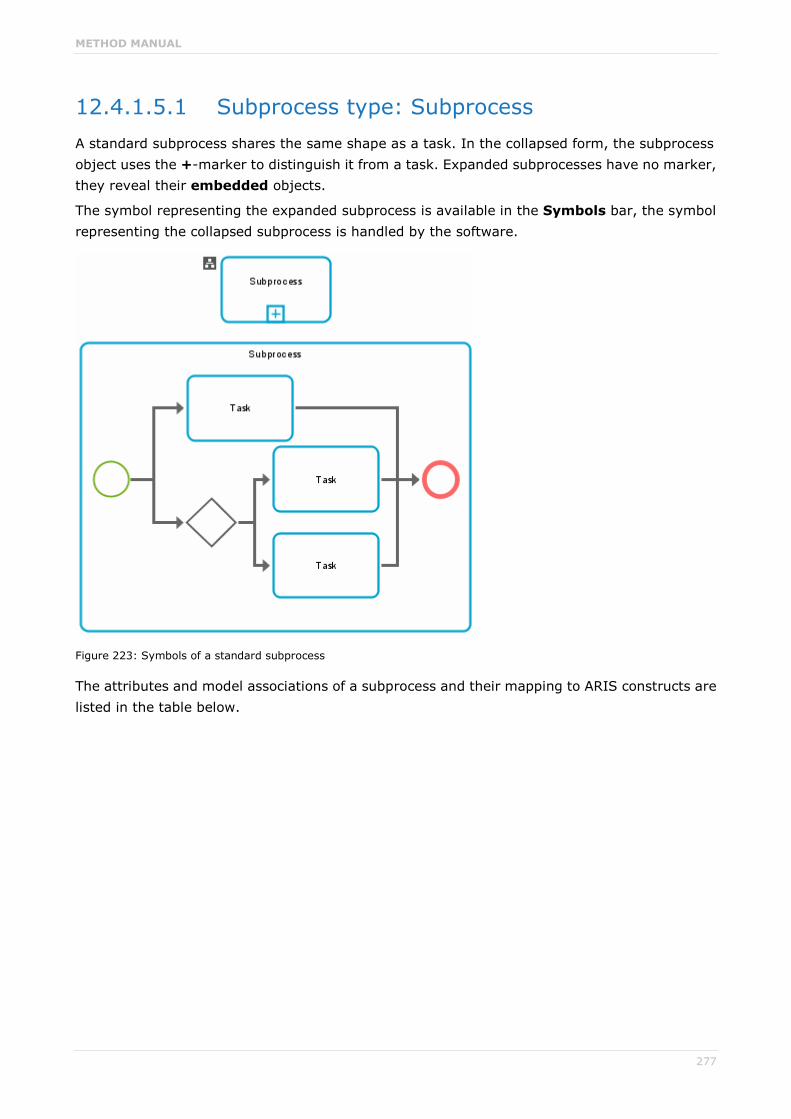
METHOD MANUAL
277
12.4.1.5.1 Subprocess type: Subprocess A standard subprocess shares the same shape as a task. In the collapsed form, the subprocess object uses the +-marker to distinguish it from a task. Expanded subprocesses have no marker, they reveal their embedded objects.
The symbol representing the expanded subprocess is available in the Symbols bar, the symbol representing the collapsed subprocess is handled by the software.
Figure 223: Symbols of a standard subprocess
The attributes and model associations of a subprocess and their mapping to ARIS constructs are listed in the table below.

METHOD MANUAL
278
MAPPING THE ATTRIBUTES AND MODEL ASSOCIATIONS TO ARIS
Class BPMN attribute name Implementation in ARIS
Subprocess inherits from Activity
inherits from FlowElementsContainer
The value of the attribute type Activity type (AT_BPMN_ACTIVITY_TYPE) is set to Subprocess in the attribute type group BPMN 2.0 attributes of object type Function.
Object type: Function (OT_FUNC) Symbols:
* Subprocess (ST_BPMN_SUB_PROCESS)
* Subprocess collapsed (ST_BPMN_SUB_PROCESS_COLLAPSED)
* or a special subprocess symbol (see below)
triggeredByEvent: boolean = false
Attribute type Event subprocess (AT_BPMN_EVENT_SUB_PROCESS) in the attribute type group BPMN 2.0 attributes/Subprocess attributes of object type Function.
Object type: Function (OT_FUNC) Symbols:
* Event subprocess (ST_BPMN_EVENT_SUBPROCESS)
* Event subprocess (collapsed) (ST_BPMN_EVENT_SUBPROCESS_COLLAPSED)
The symbols are rendered by the program.

METHOD MANUAL
279
12.4.1.5.2 Subprocess type: Event subprocess An event subprocess is a specialized subprocess that is used within a process or a subprocess. Unlike a standard subprocess which uses the flow of its parent process as a trigger, an event subprocess is not part of the normal flow of its parent process, there is no incoming and outgoing sequence flow. An event subprocess has a start event with a trigger. Each time the start event is triggered while the parent process is active, then the event subprocess will start.
The symbols of an event subprocess are shown below. If the event subprocess is collapsed, its start event is used as a marker in the upper left corner of the symbol. The software will render this marker.
Figure 224: Symbols of an event subprocess
There is a Boolean ARIS attribute type Event subprocess representing the BPMN attribute triggeredByEvent (see table under Subprocess type: Subprocess (page 277)). This attribute type is read-only and used by the software.

METHOD MANUAL
280
12.4.1.5.3 Subprocess type: Transaction A transaction subprocess, denoted with a double-lined boundary, is a specialized type of subprocess. In a transaction subprocess all activities must either complete successfully or the subprocess must be rolled back to its original consistent state. A transaction subprocess has a special behavior: It is associated with a transaction protocol that has to verify that all activities have been successfully completed. The symbols are not available in the Symbols bar, they are handled by the software. The program also sets the value of the ARIS attribute type Subprocess type to Transaction.
Figure 225: Symbol for a collapsed transaction
A transaction inherits from Activity. The attributes and model associations of a transaction subprocess and their mapping to ARIS constructs are shown in the table below.
MAPPING THE ATTRIBUTES AND MODEL ASSOCIATIONS TO ARIS
Class BPMN attribute name Implementation in ARIS
Transaction inherits from Activity The value of the attribute type Subprocess type (AT_BPMN_SUBPROCESS_TYPE) is set to Transaction in the attribute type group BPMN 2.0 attributes/Subprocess attributes of object type Function. Object type: Function (OT_FUNC) Symbols:
* Transaction (ST_BPMN_TRANSACTION)
* Transaction (collapsed) (ST_BPMN_TRANSACTION_COLLAPSED_1)
The symbols are rendered by the software.
protocol: string [0..1] Currently not implemented.
method: TransactionMethod = compensate { compensate | store | image }
Currently not implemented.

METHOD MANUAL
281
12.4.1.5.4 Subprocess type: Ad hoc subprocess A transaction subprocess, denoted with a double-lined boundary, is a specialized type of subprocess. In a transaction subprocess all activities must either complete successfully or the subprocess must An Ad hoc subprocess, denoted with a tilde marker, is a specialized type of subprocess. It contains a set of activities that could be performed. Sequence flow between activities is optional in an Ad hoc subprocess. What activities are performed as well as the sequence and the number of performances is determined by the performers of the activities. During execution of the (parent) process, any one or more of the activities may be active.
The ARIS method provides the tilde marker as mini-symbol for the value Ad hoc subprocess of the attribute Subprocess type. The program will render the symbols for the Ad hoc subprocess.
Figure 226: Symbol for a collapsed and expanded Ad hoc subprocess

METHOD MANUAL
282
MAPPING THE ATTRIBUTES AND MODEL ASSOCIATIONS TO ARIS
Class BPMN attribute name Implementation in ARIS
Ad hoc sub-process
inherits from Activity The value of the attribute type Subprocess type (AT_BPMN_SUB_PROCESS_TYPE) is set to Ad hoc subprocess in the attribute type group BPMN 2.0 attributes/Sub-process attributes of object type Function. Object type: Function (OT_FUNC) Symbols: The mini-symbol tilde is rendered by the program.
completionCondition: Expression
Attribute type Ad hoc completion condition (AT_BPMN_COMPLETION_CONDI) in the attribute type group BPMN 2.0 attributes/Subprocess attributes/Ad hoc subprocess attributes of object type Function.
ordering: AdHocOrdering = parallel { parallel | sequential }
Currently not implemented.
cancelRemainingInstances: Boolean = True
Currently not implemented.

METHOD MANUAL
283
12.4.1.6 Subprocess type: Call Activity A call activity represents the invocation of either a reusable global task or a process. The call activity represents the calling element, and the global task or process represents the called element.
The symbol Call activity is available in the Symbols bar. If the modeler places this symbol, the value of the attribute Activity type is set to Call activity and the software provides a dialog where the modeler selects the task or the process being called. Depending on this selection, the value of the attribute type Called element is set to Global task or Global process. The program renders the symbol for the call activity. It corresponds to the symbol for the called task or process, but it is drawn with a thick border.
If a task is selected the program automatically creates a connection (call activity invokes task) on definition level. If a process is selected, the related process diagram is assigned to the call activity.
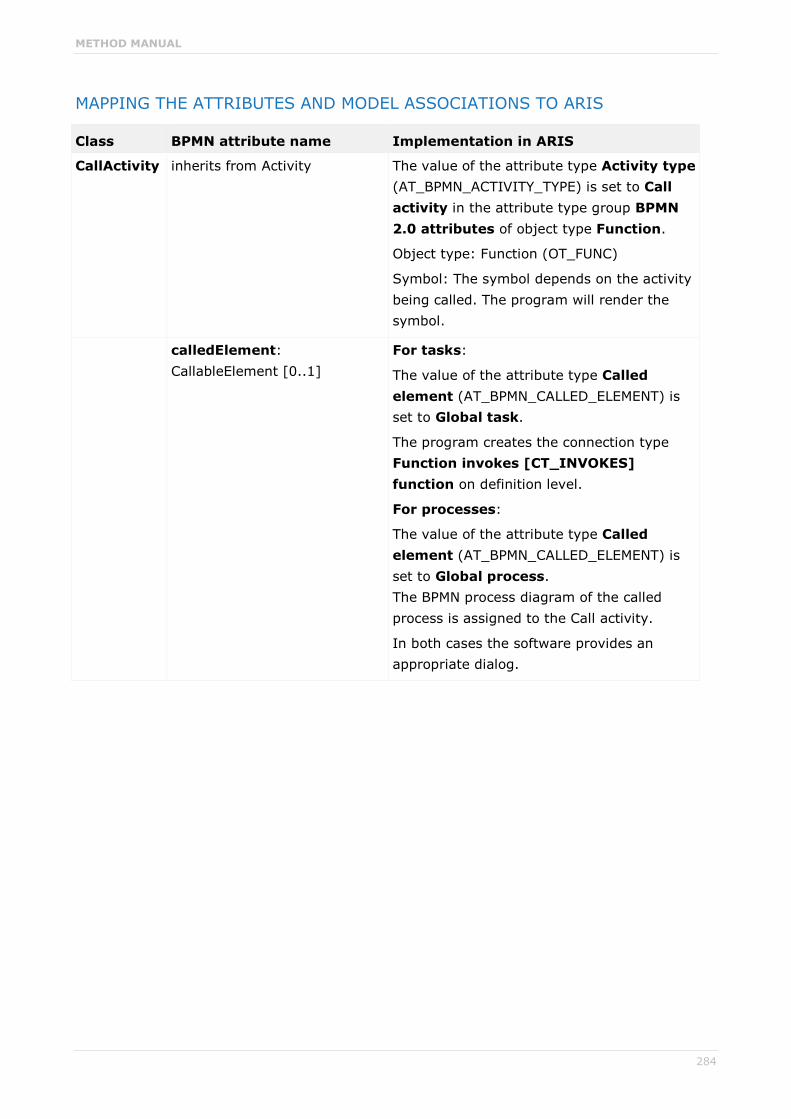
METHOD MANUAL
284
MAPPING THE ATTRIBUTES AND MODEL ASSOCIATIONS TO ARIS
Class BPMN attribute name Implementation in ARIS
CallActivity inherits from Activity The value of the attribute type Activity type (AT_BPMN_ACTIVITY_TYPE) is set to Call activity in the attribute type group BPMN 2.0 attributes of object type Function.
Object type: Function (OT_FUNC)
Symbol: The symbol depends on the activity being called. The program will render the symbol.
calledElement: CallableElement [0..1]
For tasks:
The value of the attribute type Called element (AT_BPMN_CALLED_ELEMENT) is set to Global task.
The program creates the connection type Function invokes [CT_INVOKES] function on definition level.
For processes:
The value of the attribute type Called element (AT_BPMN_CALLED_ELEMENT) is set to Global process. The BPMN process diagram of the called process is assigned to the Call activity.
In both cases the software provides an appropriate dialog.

METHOD MANUAL
285
12.4.1.7 Global task The global task is described in chapter Callable Elements (page 252).
A global task has no specific attributes and model associations, it inherits from callable elements.
12.4.1.8 Loop characteristics BPMN 2.0 provides two alternatives to model repeating activities (both tasks and subprocesses):
Loop activity (= standard loop)
Multi-instance activity
12.4.1.8.1 Loop characteristics representations An activity can be specified to repeat based on a condition. That is called standard loop activity in BPMN. A standard loop is equivalent to the do while and do until structure in programming. The number of iterations is unknown.
A multi-instance activity is another type of repeating activity useful for performing actions on a list of items. A multi-instance activity is equivalent with a for each structure in programming. The number of iterations is known when the activity starts. It is the number of items in the list. Iterations of a multi-instance activity can be performed concurrently or sequentially.
The marker for a standard loop is a circular arrow at the bottom center of the activity symbol.
Figure 227: Symbols of Standard loop activities
The markers for multi-instance activities are three bars at the bottom center of the task or subprocess symbol.
Vertical bars are used to represent concurrent/parallel performances:
Figure 228: Symbols of BPMN multi-instance (parallel) activities

METHOD MANUAL
286
Horizontal bars are used to represent sequential performances:
Figure 229: Symbols for activities of the BPMN multi-instance (parallel)
Loop characteristics has no specific attributes, it inherits the attributes and associations of base element. The attribute type Loop type is used in ARIS to specify whether the loop is a standard loop, a multi-instance parallel loop, or a multi-instance sequential loop. The attribute values are visualized by mini-symbols.

METHOD MANUAL
287
12.4.1.8.2 Standard and multi-instance loop characteristics and complex behavior definition
The attributes and model associations of standard activities, multi-instance loop activities, and complex behavior definition are summarized in the table below.
MAPPING THE ATTRIBUTES AND MODEL ASSOCIATIONS TO ARIS
Class BPMN attribute name
Implementation in ARIS
LoopCharacteristics
inherits from BaseElement
Attribute type group Loop characteristics (AT_BPMN_LOOP_CHARACTERISTICS) in attribute type group BPMN 2.0 attributes of object type Function (OT_FUNC).
StandardLoopCharacteristics
inherits from BaseElement
The value of the attribute type Loop type (AT_BPMN_LOOP_TYPE_2) is set to Standard loop (AVT_BPMN_STANDARD_LOOP) in the attribute type group BPMN 2.0 attributes/Loop characteristics of object type Function.
testBefore: boolean = False
Attribute type Test before (AT_BPMN_LOOP_TEST_TIME) in the attribute type group BPMN 2.0 attributes/Loop characteristics/Standard loop attributes of object type Function.
loopMaximum: Expression [0..1]
Attribute type Loop maximum (AT_BPMN_MAX_LOOP) in the attribute type group BPMN 2.0 attributes/Loop characteristics/Standard loop attributes of object type Function.
loopCondition: Expression [0..1]
Attribute type Loop condition (AT_BPMN_LOOP_CONDITION ) in the attribute type group BPMN 2.0 attributes/Loop characteristics/Standard loop attributes of object type Function.

METHOD MANUAL
288
Class BPMN attribute name
Implementation in ARIS
MultiInstanceLoop Characteristics
inherits from BaseElement
The value of the attribute type Loop type (AT_BPMN_LOOP_TYPE_2) is set to Multi-instance sequential loop (AVT_BPMN_MULTI_INSTANCE_SEQUENTIAL_LOOP) or Multi-instance parallel loop (AVT_BPMN_MULTI_INSTANCE_PARALLEL_LOOP) in the attribute type group BPMN 2.0 attributes/Loop characteristics of object type Function.
isSequential: boolean = False
isSequential = true corresponds to: Loop type = Multi-instance sequential loop isSequential = false corresponds to: Loop type = Multi-instance parallel loop
loopCardinality: Expression [0..1]
Attribute type Loop cardinality (AT_BPMN_LOOP_CARDINALITY) in the attribute type group BPMN 2.0 attributes/Loop characteristics/Multi-instance loop attributes of object type Function.
loopDataInput: DataInput [0..1]
Currently not implemented.
loopDataOutput: DataOutput [0..1]
Currently not implemented.
inputDataItem: Property [0..1]
Currently not implemented.
outputDataItem: Property [0..1]
Currently not implemented.
completionCondition: Expression [0..1]
Currently not implemented.
behavior: MultiInstanceBehavior = all { none | one | all | complex }
Currently not implemented.

METHOD MANUAL
289
Class BPMN attribute name
Implementation in ARIS
complexBehaviorDefinition: ComplexBehaviorDefinition [0..*]
Currently not implemented.
oneBehaviorEventRef: EventDefinition [0..1]
Currently not implemented.
noneBehaviorEventRef: EventDefinition [0..1]
Currently not implemented.
ComplexBehaviorDefinition
inherits from BaseElement
Currently not implemented.
condition: Formal Expression
event: ImplicitThrowEvent

METHOD MANUAL
290
12.4.2 Items and Data As mentioned above, the current implementation of BPMN 2.0 in ARIS focuses on the business process level. Therefore, only data objects and data stores are provided - as input or output of activities. Detailed data modeling aspects (for example data structures, data states, data associations) are omitted.
See: Business Process Model and Notation (BPMN), version 2.0.
12.4.2.1 Data object In BPMN 1.x data were considered as an artifact; in BPMN 2.0, data objects were upgraded to objects in the BPMN semantic model.
On the business level, where the data structures and mappings are not included, data objects are represented in ARIS by six symbols of the object type Cluster/Data model:
Data object
Data collection
Data input
Data input collection
Data output
Data output collection
When you place a Data object the object symbols Data object, Data input, and Data output are provided. You can select the object symbols Data collection, Data input collection, and Data output collection using the Object appearance page of the Object properties dialog.
Figure 230: Symbols of data objects

METHOD MANUAL
291
Only the Data object symbol is available in the Symbols bar.
Data objects can represent the input or output of activities by using the following connection types:
Cluster/Data model is input for function
Function has as output Cluster/Data model
The data input symbols must not be the target of a has as output connection, and the data output symbols must not be the source of an is input for connection. The software ensures this.
MAPPING THE ATTRIBUTES AND MODEL ASSOCIATIONS TO ARIS
Class BPMN attribute name Implementation in ARIS
ItemAwareElement
inherits from BaseElement
itemSubjectRef: ItemDefinition [0..1]
Currently not implemented.
dataState: DataState [0..1] Currently not implemented.
Data object inherits from FlowElement & ItemAwareElement
Object type: Cluster/Data model (OT_CLST)
Six symbols: * Data object (ST_BPMN_DATA_OBJECT)
* Data collection (ST_BPMN_DATA_COLLECTION)
* Data input (ST_BPMN_DATA_INPUT)
* Data input collection (ST_BPMN_DATA_INPUT_COLLECTION)
* Data output (ST_BPMN_DATA_OUTPUT)
* Data output collection (ST_BPMN_DATA_OUTPUT_COLLECTION)
isCollection: Boolean = False Represented by special symbols of the object type Cluster/Data model (OT_CLST)

METHOD MANUAL
292
12.4.2.2 Data store Unlike data objects, which live only as long as the process instance is running, a Data store represents information that persists beyond the lifetime of a particular process. On the business level, a Data store is represented by the symbol Data store of the ARIS object type Information carrier. This symbol is available in the Symbols bar.
On the business level, where the data structures and mappings are not included, data objects are represented in ARIS by six symbols of the object type Cluster/Data model:
Information carrier provides input for function
Function creates output to information carrier.
Figure 231: Symbol for a data store
A Data store inherits from FlowElement and ItemAwareElement.
MAPPING THE ATTRIBUTES AND MODEL ASSOCIATIONS TO ARIS
Class BPMN attribute name Implementation in ARIS
DataStore inherits from FlowElement and ItemAwareElement
Object type: Information carrier (OT_INFO_CARR) Symbol: Data store (ST_BPMN_DATA_STORE)
name: string Attribute type Name (AT_NAME) of object type Information carrier (OT_INFO_CARR)
capacity: Integer [0..1] Currently not implemented.
isUnlimited: Boolean = False Currently not implemented.
DataStoreReference
inherits from FlowElement and ItemAwareElement
dataStoreRef: DataStore Occurrence copies of the (referenced) data store.

METHOD MANUAL
293
12.4.3 Events BPMN events are represented in ARIS by the object type Event. Altogether there are sixty-three symbols available in BPMN 2.0. The main event types are:
Start event
Intermediate event
End event
Only these three events are provided in the Symbols bar in ARIS (see type = None). The remaining symbols are provided as symbols in the ARIS method.
BPMN events: (See: Business Process Modeling Notation (BPMN), version 2.0, page 233 and the following).
Types Start
Intermediate End
Top level
Event Sub- process Inter- rupting
Event Sub- process Non-Inter- rupting
Catching
Boundary Inter- rupting
Boundary Non-Inter- rupting
Throwing
None
Message
Timer
Error
Escalation
Cancel
Compensation
Conditional
Link

METHOD MANUAL
294
Types Start
Intermediate End
Signal
Terminate
Multiple
Parallel multiple
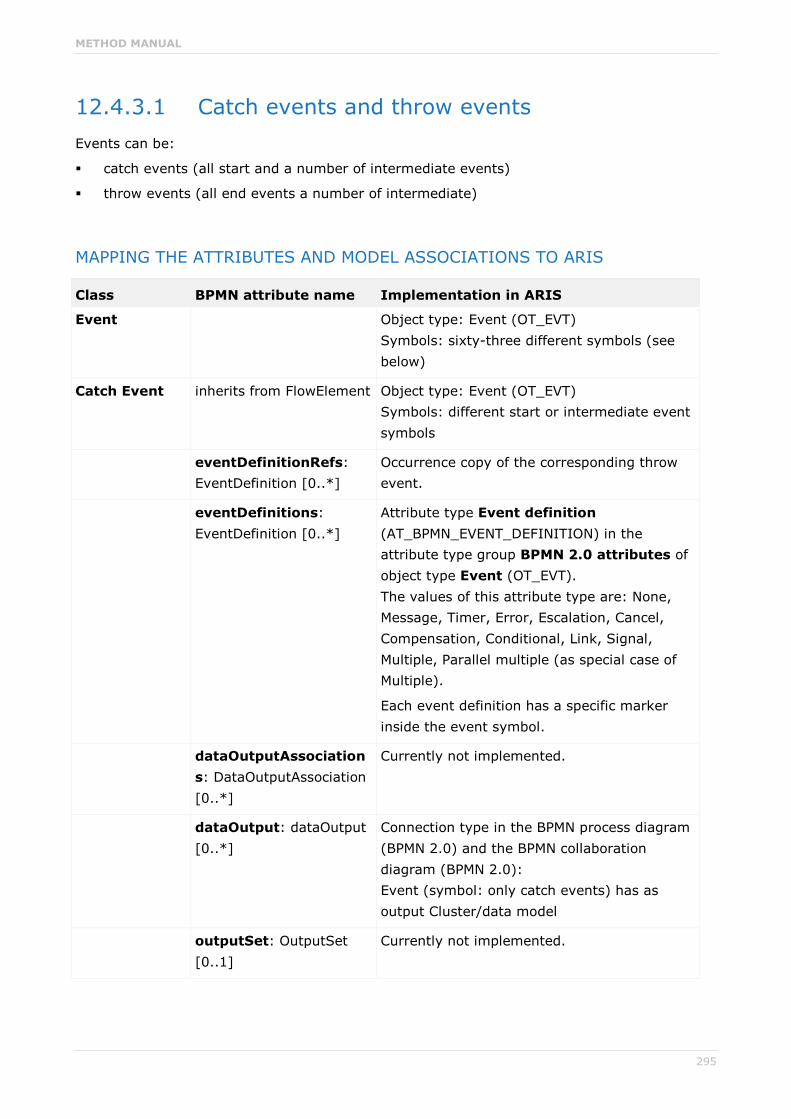
METHOD MANUAL
295
12.4.3.1 Catch events and throw events Events can be:
catch events (all start and a number of intermediate events)
throw events (all end events a number of intermediate)
MAPPING THE ATTRIBUTES AND MODEL ASSOCIATIONS TO ARIS
Class BPMN attribute name Implementation in ARIS
Event Object type: Event (OT_EVT) Symbols: sixty-three different symbols (see below)
Catch Event inherits from FlowElement Object type: Event (OT_EVT) Symbols: different start or intermediate event symbols
eventDefinitionRefs: EventDefinition [0..*]
Occurrence copy of the corresponding throw event.
eventDefinitions: EventDefinition [0..*]
Attribute type Event definition (AT_BPMN_EVENT_DEFINITION) in the attribute type group BPMN 2.0 attributes of object type Event (OT_EVT). The values of this attribute type are: None, Message, Timer, Error, Escalation, Cancel, Compensation, Conditional, Link, Signal, Multiple, Parallel multiple (as special case of Multiple).
Each event definition has a specific marker inside the event symbol.
dataOutputAssociations: DataOutputAssociation [0..*]
Currently not implemented.
dataOutput: dataOutput [0..*]
Connection type in the BPMN process diagram (BPMN 2.0) and the BPMN collaboration diagram (BPMN 2.0): Event (symbol: only catch events) has as output Cluster/data model
outputSet: OutputSet [0..1]
Currently not implemented.

METHOD MANUAL
296
Class BPMN attribute name Implementation in ARIS
Throw event inherits from FlowElement Object type: Event (OT_EVT) Symbols: different intermediate or end event symbols
eventDefinitionRefs: EventDefinition [0..*]
Occurrence copy of the corresponding catch event.
eventDefinitions: EventDefinition [0..*]
Attribute type Event definition (AT_BPMN_EVENT_DEFINITION) in the attribute type group BPMN 2.0 attributes of object type Event (OT_EVT). The values of this attribute type are: None, Message, Error, Escalation, Cancel, Compensation, Link, Signal, Terminate, Multiple. Each event definition has a specific marker inside the event symbol.
dataInputAssociations: DataInputAssociation [0..*]
Currently not implemented.
dataInput: DataInput [0..*]
Connection type in the BPMN process diagram (BPMN 2.0) and the BPMN collaboration diagram (BPMN 2.0): Cluster/data model is input for event (symbol: only throw events)
inputSet: InputSet [0..1] Currently not implemented.
Implicit Throw Event
inherits from ThrowEvent Currently not implemented.

METHOD MANUAL
297
12.4.3.2 Start event The symbols of start events are depicted in chapter events (page 293). Only the start event None is available in the Symbols bar. When placing this start event, the modeler is guided by a special functionality of the program.
MAPPING THE ATTRIBUTES AND MODEL ASSOCIATIONS TO ARIS
Class BPMN attribute name Implementation in ARIS
Start event inherits from CatchEvent Object type: Event (OT_EVT) Symbol: Start event (ST_BPMN_START_EVENT)
isInterrupting: boolean Interrupting start events are represented by specific event symbols.

METHOD MANUAL
298
12.4.3.3 Intermediate events The symbols of intermediate events are depicted in chapter events (page 293). Only the intermediate event None is available in the Symbols bar. When placing this start event, the modeler is guided by a special functionality of the program. Intermediate events have no specific attributes and associations.
MAPPING THE ATTRIBUTES AND MODEL ASSOCIATIONS TO ARIS
Class BPMN attribute name
Implementation in ARIS
IntermediateEvent Object type: Event (OT_EVT) Symbol: Intermediate event (ST_BPMN_INTERMEDIATE_EVENT)
Some types of intermediate events can be attached to the boundary of activities, they are called boundary events (see column Boundary Interrupting and Boundary Non-interrupting in chapter events (page 293).
Boundary events are always catch events. Their attributes and model associations are shown in the table below.
MAPPING THE ATTRIBUTES AND MODEL ASSOCIATIONS TO ARIS
Class BPMN attribute name
Implementation in ARIS
Boundary events inherits from CatchEvent
Boundary events are specific intermediate events.
AttachedTo: Activity Connection type in the BPMN process diagram (BPMN 2.0) and the BPMN collaboration diagram (BPMN 2.0): Function can trigger (CT_BPMN_CAN_TRIGGER) event (symbol: intermediate event)
CancelActivity: boolean
(Non-)Interrupting events are represented by specific event symbols.

METHOD MANUAL
299
12.4.3.4 End event The symbols of end events are depicted in chapter events (page 293). Only the none end event is available in the Symbols bar. When placing this start event, the modeler is guided by a special functionality of the program.
MAPPING THE ATTRIBUTES AND MODEL ASSOCIATIONS TO ARIS
Class BPMN attribute name Implementation in ARIS
EndEvent Object type: Event (OT_EVT) Symbol: End event (ST_BPMN_END_EVENT)
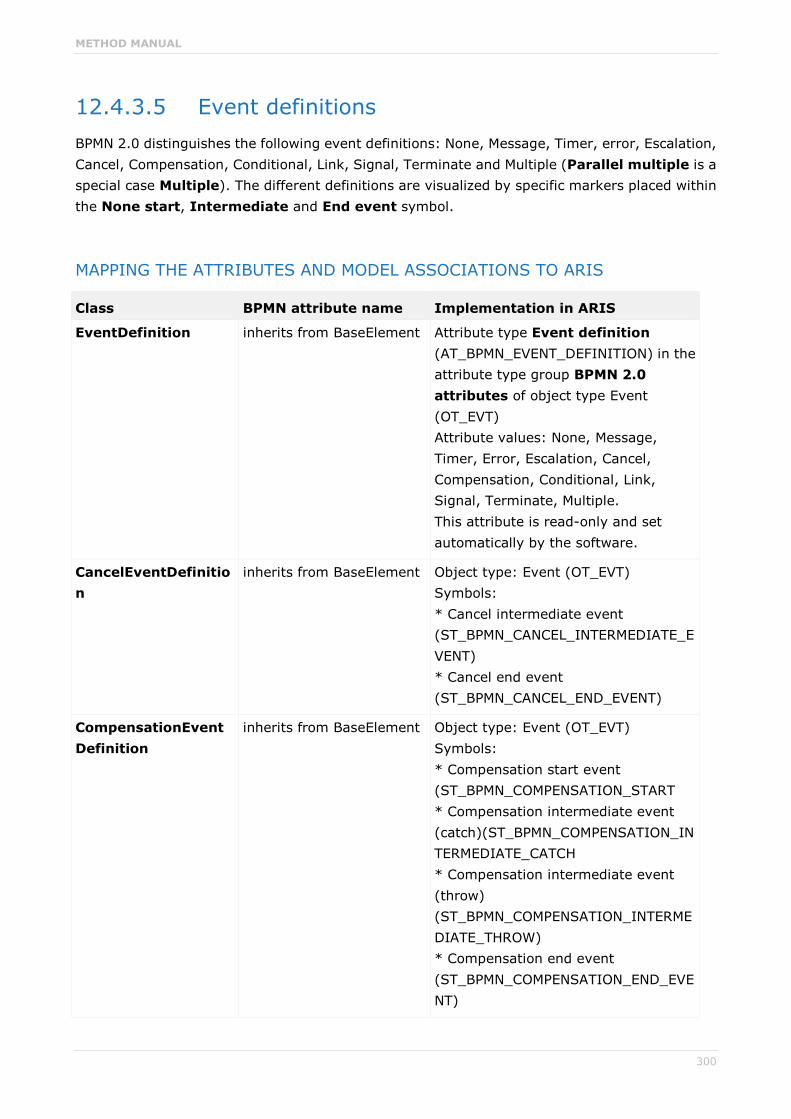
METHOD MANUAL
300
12.4.3.5 Event definitions BPMN 2.0 distinguishes the following event definitions: None, Message, Timer, error, Escalation, Cancel, Compensation, Conditional, Link, Signal, Terminate and Multiple (Parallel multiple is a special case Multiple). The different definitions are visualized by specific markers placed within the None start, Intermediate and End event symbol.
MAPPING THE ATTRIBUTES AND MODEL ASSOCIATIONS TO ARIS
Class BPMN attribute name Implementation in ARIS
EventDefinition inherits from BaseElement Attribute type Event definition (AT_BPMN_EVENT_DEFINITION) in the attribute type group BPMN 2.0 attributes of object type Event (OT_EVT) Attribute values: None, Message, Timer, Error, Escalation, Cancel, Compensation, Conditional, Link, Signal, Terminate, Multiple. This attribute is read-only and set automatically by the software.
CancelEventDefinition
inherits from BaseElement Object type: Event (OT_EVT) Symbols: * Cancel intermediate event (ST_BPMN_CANCEL_INTERMEDIATE_EVENT) * Cancel end event (ST_BPMN_CANCEL_END_EVENT)
CompensationEvent Definition
inherits from BaseElement Object type: Event (OT_EVT) Symbols: * Compensation start event (ST_BPMN_COMPENSATION_START * Compensation intermediate event (catch)(ST_BPMN_COMPENSATION_INTERMEDIATE_CATCH * Compensation intermediate event (throw) (ST_BPMN_COMPENSATION_INTERMEDIATE_THROW) * Compensation end event (ST_BPMN_COMPENSATION_END_EVENT)

METHOD MANUAL
301
Class BPMN attribute name Implementation in ARIS
activityRef: Activity [0..1] Attribute type Wait for completion (AT_BPMN_WAIT_FOR_COMPLETION) in the attribute type group BPMN 2.0 attributes/Compensation event attributes of object type Event (OT_EVT).
ConditionalEvent Definition
inherits from BaseElement Object type: Event (OT_EVT) Symbols: * Conditional start event (ST_BPMN_RULE_START_EVENT) * Conditional start event (non-interrupting) (ST_BPMN_CONDITIONAL_START_NI) * Conditional intermediate event (ST_BPMN_RULE_INTERMEDIATE_EVENT) * Conditional intermediate event (non-interrupting) (ST_BPMN_CONDITIONAL_INTERMEDIATE_NI)
condition: Expression Attribute type Condition (AT_BPMN_RULE_EXPRESSION) in the attribute type group BPMN 2.0 attributes/Conditional event attributes of object type Event (OT_EVT).
ErrorEventDefinition inherits from BaseElement Object type: Event (OT_EVT) Symbols: * Error start event (ST_BPMN_ERROR_START) * Error intermediate event (ST_BPMN_ERROR_INTERMEDIATE_EVENT * Error end event (ST_BPMN_ERROR_END_EVENT)
errorCode: string Currently not implemented.
error: Error [0..1] Currently not implemented.

METHOD MANUAL
302
Class BPMN attribute name Implementation in ARIS
EscalationEvent Definition
inherits from BaseElement Object type: Event (OT_EVT) Symbols: * Escalation start event (ST_BPMN_ESCALATION_START) * Escalation start event (non-interrupting) (ST_BPMN_ESCALATION_START_NI) * Escalation intermediate event (catch) (ST_BPMN_ESCALATION_INTERMEDIATE_CATCH) * Escalation intermediate event (non-interrupting) (ST_BPMN_ESCALATION_INTERMEDIATE_NI) * Escalation intermediate event_throw (ST_BPMN_ESCALATION_INTERMEDIATE_THROW) * Escalation end event (ST_BPMN_ESCALATION_END)
escalationCode: string Currently not implemented.
escalationRef: Escalation [0..1]
Currently not implemented.
LinkEventDefinition inherits from BaseElement Object type: Event (OT_EVT) Symbols: * Link intermediate event (catch) (ST_BPMN_LINK_INTERMEDIATE_CATCH) * Link intermediate event (throw) (ST_BPMN_LINK_INTERMEDIATE_THROW) Catch and throw link events are referred to each other by occurrence copies.
name: string Attribute type Name (AT_NAME) of object type Event (OT_EVT)
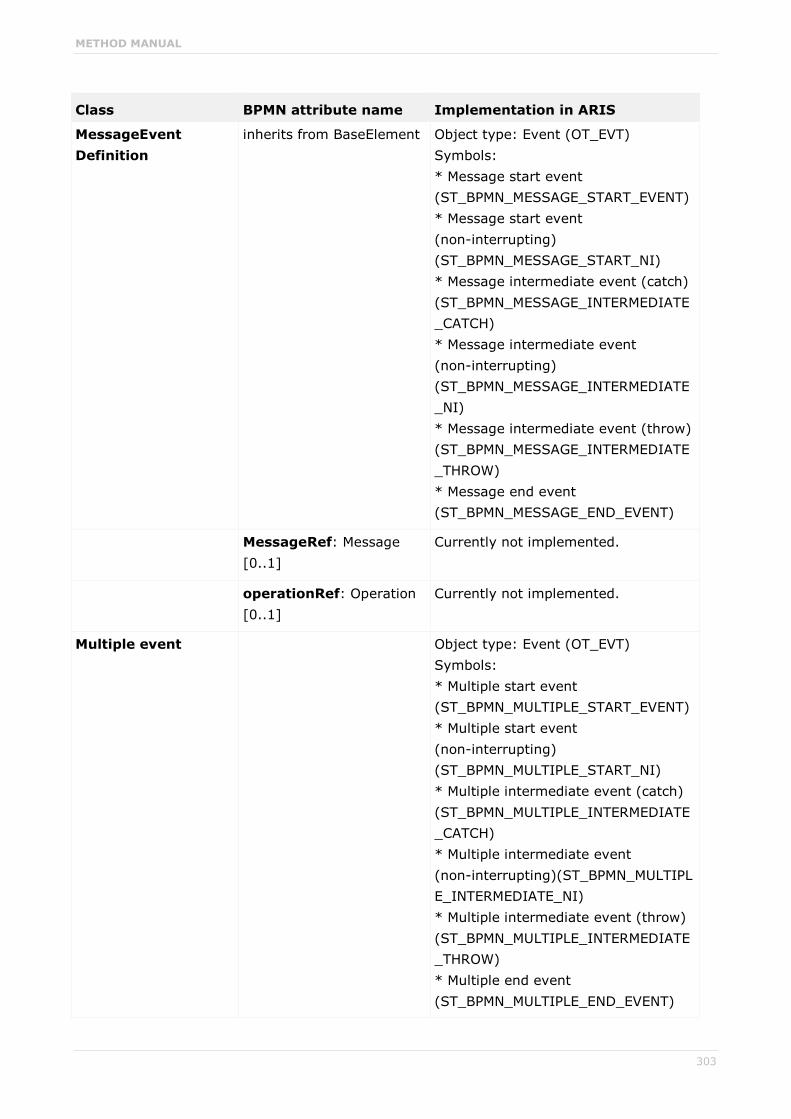
METHOD MANUAL
303
Class BPMN attribute name Implementation in ARIS
MessageEvent Definition
inherits from BaseElement Object type: Event (OT_EVT) Symbols: * Message start event (ST_BPMN_MESSAGE_START_EVENT) * Message start event (non-interrupting) (ST_BPMN_MESSAGE_START_NI) * Message intermediate event (catch) (ST_BPMN_MESSAGE_INTERMEDIATE_CATCH) * Message intermediate event (non-interrupting) (ST_BPMN_MESSAGE_INTERMEDIATE_NI) * Message intermediate event (throw) (ST_BPMN_MESSAGE_INTERMEDIATE_THROW) * Message end event (ST_BPMN_MESSAGE_END_EVENT)
MessageRef: Message [0..1]
Currently not implemented.
operationRef: Operation [0..1]
Currently not implemented.
Multiple event Object type: Event (OT_EVT) Symbols: * Multiple start event (ST_BPMN_MULTIPLE_START_EVENT) * Multiple start event (non-interrupting) (ST_BPMN_MULTIPLE_START_NI) * Multiple intermediate event (catch) (ST_BPMN_MULTIPLE_INTERMEDIATE_CATCH) * Multiple intermediate event (non-interrupting)(ST_BPMN_MULTIPLE_INTERMEDIATE_NI) * Multiple intermediate event (throw) (ST_BPMN_MULTIPLE_INTERMEDIATE_THROW) * Multiple end event (ST_BPMN_MULTIPLE_END_EVENT)

METHOD MANUAL
304
Class BPMN attribute name Implementation in ARIS
None event Object type: Event (OT_EVT) Symbols: * Start event (ST_BPMN_SE) * Intermediate event (ST_BPMN_IE) * End event (ST_BPMN_EE) These symbols are available in the Symbols bar.
Parallel multiple event
Object type: Event (OT_EVT) Symbols: * Parallel multiple start event (ST_BPMN_PARALLEL_MULTIPLE_START) * Parallel multiple start event (non-interrupting) (ST_BPMN_PARALLEL_MULTIPLE_START_NI) * Parallel multiple intermediate event (ST_BPMN_PARALLEL_MULTIPLE_INTERMEDIATE) * Parallel multiple intermediate event (non-interrupting) (ST_BPMN_PARALLEL_MULTIPLE_INTERMEDIATE_NI)
SignalEventDefinition
inherits from BaseElement Object type: Event (OT_EVT) Symbols: * Signal start event (ST_BPMN_SIGNAL_START_EVENT) * Signal start event (non-interrupting) (ST_BPMN_SIGNAL_START_NI) * Signal intermediate event (catch) (ST_BPMN_SIGNAL_INTERMEDIATE_EVENT) * Signal intermediate event (non-interrupting) (ST_BPMN_SIGNAL_INTERMEDIATE_NI) * Signal intermediate event (throw) (ST_BPMN_SIGNAL_INTERMEDIATE_THROW) * Signal end event (ST_BPMN_SIGNAL_END_EVENT)

METHOD MANUAL
305
Class BPMN attribute name Implementation in ARIS
signalRef: Signal Currently not implemented.
TerminateEvent Definition
inherits from BaseElement Object type: Event (OT_EVT) Symbol: * Terminate end event (ST_BPMN_TERMINATE_END_EVENT)
TimerEventDefini tion
inherits from BaseElement Object type: Event (OT_EVT) Symbols: * Timer start event (ST_BPMN_TIMER_START_EVENT) * Timer start event (non-interrupting) (ST_BPMN_TIMER_START_NI) * Timer intermediate event (ST_BPMN_TIMER_INTERMEDIATE_EVENT) * Timer intermediate event (non-interrupting) (ST_BPMN_TIMER_INTERMEDIATE_NI)
timeDate: Expression [0..1]
Attribute type Time date (AT_BPMN_TIMEDATE) in the attribute type group BPMN 2.0 attributes/Timer event attributes of object type Event (OT_EVT).
timeCycle: Expression [0..1]
Attribute type Time cycle (AT_BPMN_TIMECYCLE) in the attribute type group BPMN 2.0 attributes/Timer event attributes of object type Event (OT_EVT)

METHOD MANUAL
306
12.4.4 Gateways The ARIS object type Rule depicts BPMN gateways. Although BPMN 2.0 knows five different gateway types, only one symbol is available in the Symbols bar:
The remaining gateway symbols are handled by the program. The following figure depicts all (basic) gateway symbols.
Figure 232: BPMN gateway types
For event-based gateways there are two additional symbols which are used to start a process:
All in all the ARIS method will provide eight gateway symbols. Contrary to events, an ARIS attribute recording the gateway type is not required. It is up to the modeler to ensure that gateways are used in a semantically correct way. The modeler should not reuse gateways.
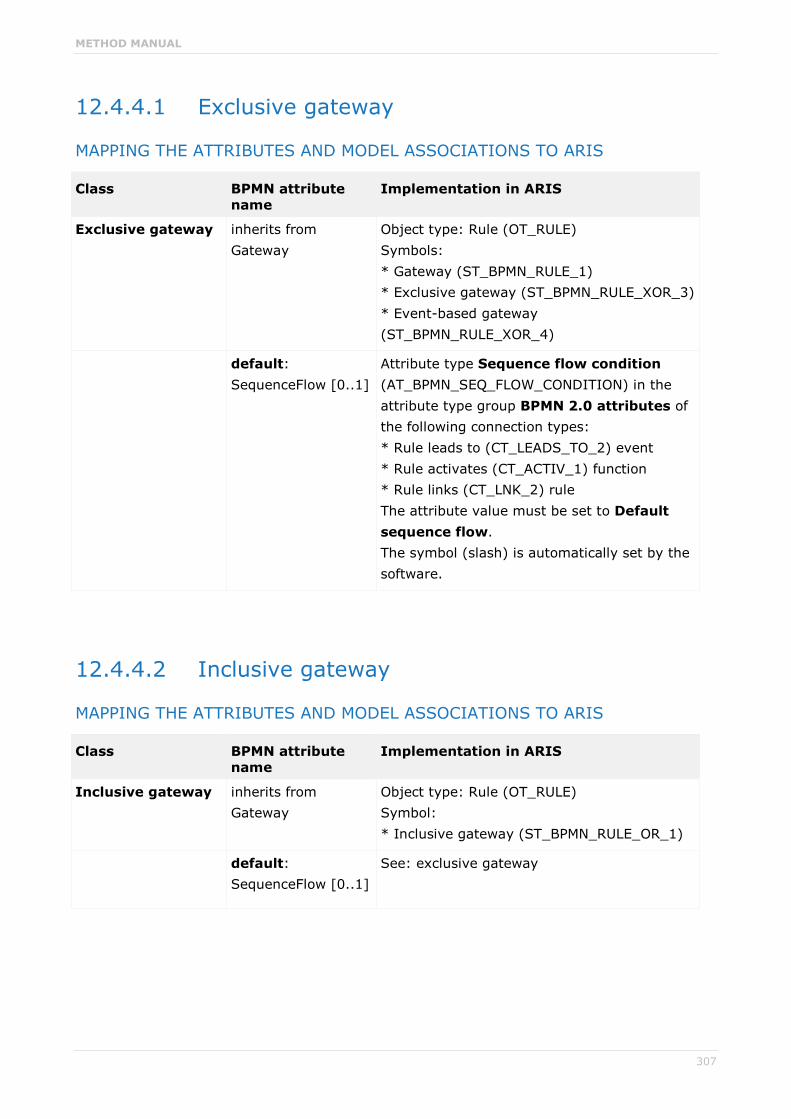
METHOD MANUAL
307
12.4.4.1 Exclusive gateway
MAPPING THE ATTRIBUTES AND MODEL ASSOCIATIONS TO ARIS
Class BPMN attribute name
Implementation in ARIS
Exclusive gateway inherits from Gateway
Object type: Rule (OT_RULE) Symbols: * Gateway (ST_BPMN_RULE_1) * Exclusive gateway (ST_BPMN_RULE_XOR_3) * Event-based gateway (ST_BPMN_RULE_XOR_4)
default: SequenceFlow [0..1]
Attribute type Sequence flow condition (AT_BPMN_SEQ_FLOW_CONDITION) in the attribute type group BPMN 2.0 attributes of the following connection types: * Rule leads to (CT_LEADS_TO_2) event * Rule activates (CT_ACTIV_1) function * Rule links (CT_LNK_2) rule The attribute value must be set to Default sequence flow. The symbol (slash) is automatically set by the software.
12.4.4.2 Inclusive gateway
MAPPING THE ATTRIBUTES AND MODEL ASSOCIATIONS TO ARIS
Class BPMN attribute name
Implementation in ARIS
Inclusive gateway inherits from Gateway
Object type: Rule (OT_RULE) Symbol: * Inclusive gateway (ST_BPMN_RULE_OR_1)
default: SequenceFlow [0..1]
See: exclusive gateway

METHOD MANUAL
308
12.4.4.3 Parallel gateway Parallel gateways have no specific attributes.
MAPPING THE ATTRIBUTES AND MODEL ASSOCIATIONS TO ARIS
Class BPMN attribute name
Implementation in ARIS
Parallel gateway inherits from Gateway Object type: Rule (OT_RULE) Symbol: * Parallel gateway (ST_BPMN_RULE_AND_1)
12.4.4.4 Complex gateway
MAPPING THE ATTRIBUTES AND MODEL ASSOCIATIONS TO ARIS
Class BPMN attribute name
Implementation in ARIS
Complex gateway inherits from Gateway
Object type: Rule (OT_RULE) Symbol: * Complex gateway (ST_BPMN_RULE_COMPLEX_1)
activationCondition: Expression [0..1]
Attribute type Activation condition (AT_ACTIVATION_CONDITION) in the attribute type group BPMN 2.0 attributes/Complex gateway attributes of object type Rule (OT_RULE)

METHOD MANUAL
309
12.4.4.5 Event-based gateways All attributes are represented by specific gateway symbols.
MAPPING THE ATTRIBUTES AND MODEL ASSOCIATIONS TO ARIS
Class BPMN attribute name Implementation in ARIS
Event-based gateway
inherits from Gateway Object type: Rule (OT_RULE) Symbols: * Event-based gateway (ST_BPMN_RULE_XOR_4) * Instantiating event-based gateway (ST_BPMN_RULE_XOR_START) * Instantiating parallel event-based gateway (ST_BPMN_RULE_XOR_PARALLEL)
instantiate: boolean = False
Represented by symbols. True if: * Instantiating event-based gateway (ST_BPMN_RULE_XOR_START) * Instantiating parallel event-based gateway (ST_BPMN_RULE_XOR_PARALLEL) False if: * Event-based gateway (ST_BPMN_RULE_XOR_4)
eventGatewayType: EventGatewayType = Exclusive { Exclusive | Parallel }
Represented by symbols: Exclusive if: * Event-based gateway (ST_BPMN_RULE_XOR_4) * Instantiating event-based gateway (ST_BPMN_RULE_XOR_START) Parallel if: * Instantiating parallel event-based gateway (ST_BPMN_RULE_XOR_PARALLEL)

METHOD MANUAL
310
12.4.5 Lanes A lane is a subdivision of a process or a pool. Lanes have no semantics in BPMN. BPMN 2.0 uses lanes as a way to categorizes Flow Elements. Most often lanes represent organizational elements, but in principle any categorization may be used for lanes. Lanes may contain nested sub-lanes. A lane set specifies the categorization represented by the lanes.
See: Business Process Model and Notation (BPMN), version 2.0.
Like a pool a lane is drawn as a rectangular box, its label is not boxed off.
Figure 233: Nested Lanes
MAPPING THE ATTRIBUTES AND MODEL ASSOCIATIONS TO ARIS
Class BPMN attribute name Implementation in ARIS
LaneSet inherits from BaseElement Object type: Lane (OT_BPMN_LANE) Symbol: Lane (ST_BPMN_LANE_1)
process: Process The BPMN process model that contains the lane(s).
lanes: Lane [0..*] Object type: Lane (OT_BPMN_LANE) Symbol: Lane (ST_BPMN_LANE_1) The source objects in the connection type: Lane belongs to (CT_BELONGS_TO_1) lane
parentLane: Lane [0..1] The target object in the connection type: Lane belongs to (CT_BELONGS_TO_1) lane CT: Lane belongs to lane
Lane inherits from BaseElement Object type: Lane (OT_BPMN_LANE) Symbol: Lane (ST_BPMN_LANE_1)
name: string Attribute type Name (AT_NAME) of object type Lane (OT_BPMN_LANE)

METHOD MANUAL
311
Class BPMN attribute name Implementation in ARIS
partitionElement: BaseElement [0..1]
Currently not implemented.
partitionElementRef: BaseElement [0..1]
Currently not implemented.
childLaneSet: LaneSet [0..1]
The source objects in the connection type: Lane belongs to (CT_BELONGS_TO_1) lane
flowElementRefs: FlowElement [0..*]
The source objects in the following belongs to (CT_BELONGS_TO_1) connection types: * Function belongs to lane * Event belongs to lane * Rule belongs to lane * Cluster/data model belongs to lane * Information carrier belongs to lane

METHOD MANUAL
312
12.5 Collaboration See: Business Process Model and Notation (BPMN), version 2.0.
A collaboration shows message exchanges between participants. A collaboration contains at least two pools representing the participants. A pool may include a process (white box) or may be shown as a black box with all details hidden. The message exchanges between the participants are represented by message flows that connect two pools (or the objects within the pools). Only one pool may be represented without a boundary.
The model type BPMN collaboration diagram (BPMN 2.0) has been introduced to model collaborations.
MAPPING THE ATTRIBUTES AND MODEL ASSOCIATIONS TO ARIS
Class BPMN attribute name Implementation in ARIS
Collaboration inherits from BaseElement and InteractionSpecification
Model type: BPMN collaboration diagram (BPMN 2.0) (MT_BPMN_COLLABORATION_DIAGRAM)
name: string Attribute type Name of the BPMN collaboration diagram (BPMN 2.0)
choreographyRef: Choreography [0..1]
Currently not implemented.
conversationAssociations: ConversationAssociation [0..*]
The relationships to conversations are represented by occurrence copies of participants (OT_BPMN_POOL; ST_BPMN_POOL_1), occurrence copies of message flow connections and the assignment of a BPMN collaboration model (BPMN 2.0) to the object type Conversation (OT_BPMN_CONVERSATION).
conversations: Conversation [0..*]
BPMN collaboration diagram (BPMN 2.0) assigned to the object type Conversation (OT_BPMN_CONVERSATION)
artifacts: Artifact [0..*] Artifacts (page 247)
participantAssociations: ParticipantAssociations [0..*]
The relationships to participants are represented by occurrence copies of participants (OT_BPMN_POOL; ST_BPMN_POOL_1)
messageFlowAssociations: Message flow association [0..*]
The relationships to message flows are represented by occurrence copies of message flow connections (and the involved participants).

METHOD MANUAL
313
Class BPMN attribute name Implementation in ARIS
IsClosed: boolean = false Attribute type Is closed in the attribute type group BPMN 2.0 attributes of model type the BPMN Collaboration diagram (BPMN 2.0).
The object types and connection types of the BPMN collaboration diagram are detailed in the following chapters.
12.5.1 Pool and participant Pools and participants play a central role in collaborations. They are described in detail in chapter Participant (page 260).
12.5.2 Object types and connection types reused from a process
As a pool may show a process (white box) all object types and connection types that are allowed in the BPMN process diagram (BPMN 2.0) are also available in the BPMN collaboration diagram (BPMN 2.0).
The object types and connection types taken over from the BPMN process diagram (BPMN 2.0) are described in detail in chapter Process (page 268).
The connection type belongs to is used to embed the object types of a visible process into a pool.
Source object type Connection type Target object type
Event (OT_EVT) belongs to (CT_BELONGS_TO_1)
Participant (OT_BPMN_POOL)
Function (OT_FUNC) belongs to (CT_BELONGS_TO_1)
Participant (OT_BPMN_POOL)
Rule (OT_RULE) belongs to (CT_BELONGS_TO_1)
Participant (OT_BPMN_POOL)
Lane (OT_BPMN_LANE)
belongs to (CT_BELONGS_TO_1)
Participant (OT_BPMN_POOL)
Cluster/data model (OT_CLST)
belongs to (CT_BELONGS_TO_1)
Participant (OT_BPMN_POOL)
Information carrier (OT_INFO_CARR)
belongs to (CT_BELONGS_TO_1)
Participant (OT_BPMN_POOL)

METHOD MANUAL
314
12.5.3 Message flow The message flow between different participants is represented by an ARIS connection type of the same name. It connects two pools or the objects within a pool. The attributes and model associations of message flow are described in chapter Message flow (page 257).
To show the messages being exchanged in message flows the ARIS object type message represented by a message symbol is used. The message flow connection type is replaced by two connection types: sends and is received from. This work around is required due to the fact that it is not possible in ARIS to assign object types to connection types.
The program will display the sends and is received from connection types like a normal message flow.

METHOD MANUAL
315
12.6 Conversation See: Business Process Modeling Notation (BPMN), version 2.0, page 124 and the following.
The BPMN conversation diagram has been introduced with BPMN 2.0 to provide a big picture of the interactions (in terms of related message exchanges) between collaborating participants.
The BPMN conversation diagram is similar to the BPMN collaboration diagram, but its pools are not allowed to contain a process and a choreography is not allowed between the pools.
The BPMN conversation diagram differentiates three basic elements.
Conversation nodes (Communication, Sub-conversation)
Participants (Pools)
Conversation links (message flow, participates in)
They are described in the next chapters.
12.6.1 Conversation container The attributes and model associations of a conversation and conversation container are summarized in the table below.
MAPPING THE ATTRIBUTES AND MODEL ASSOCIATIONS TO ARIS
Class BPMN attribute name Implementation in ARIS
Conversation inherits from CallableElement, InteractionSpecification, ConversationContainer
correlationKeys: CorrelationKey [0..*]
Currently not implemented.
messageFlowRefs: MessageFlow [0..*]
Occurrence copies of message flows (and the involved participants)
Conversation container
inherits from BaseElement Model type: BPMN conversation diagram (BPMN 2.0) MT_BPMN_CONVERSATION_DIAGRAM
conversationNodes: ConversationNode [0..*]
see below
artifacts: Artifact [0..*] see chapter Artifacts (page 247)
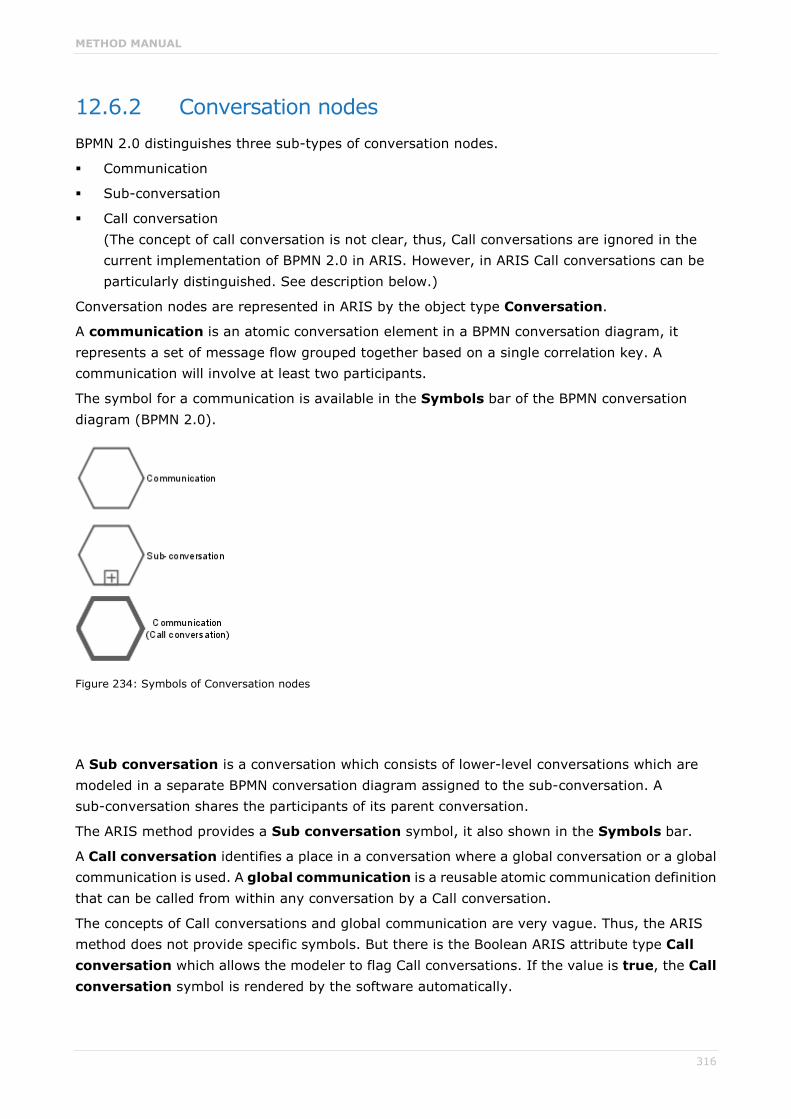
METHOD MANUAL
316
12.6.2 Conversation nodes BPMN 2.0 distinguishes three sub-types of conversation nodes.
Communication
Sub-conversation
Call conversation (The concept of call conversation is not clear, thus, Call conversations are ignored in the current implementation of BPMN 2.0 in ARIS. However, in ARIS Call conversations can be particularly distinguished. See description below.)
Conversation nodes are represented in ARIS by the object type Conversation.
A communication is an atomic conversation element in a BPMN conversation diagram, it represents a set of message flow grouped together based on a single correlation key. A communication will involve at least two participants.
The symbol for a communication is available in the Symbols bar of the BPMN conversation diagram (BPMN 2.0).
Figure 234: Symbols of Conversation nodes
A Sub conversation is a conversation which consists of lower-level conversations which are modeled in a separate BPMN conversation diagram assigned to the sub-conversation. A sub-conversation shares the participants of its parent conversation.
The ARIS method provides a Sub conversation symbol, it also shown in the Symbols bar.
A Call conversation identifies a place in a conversation where a global conversation or a global communication is used. A global communication is a reusable atomic communication definition that can be called from within any conversation by a Call conversation.
The concepts of Call conversations and global communication are very vague. Thus, the ARIS method does not provide specific symbols. But there is the Boolean ARIS attribute type Call conversation which allows the modeler to flag Call conversations. If the value is true, the Call conversation symbol is rendered by the software automatically.

METHOD MANUAL
317
12.6.3 Participant Participants are represented by the ARIS object type Participant. The Pool symbol is available in the Symbols bar. If the ARIS attribute type Multi-instance participant is set to true the program will render the symbol: three vertical lines are displayed at the bottom of the pool symbol.
Participants/pools are described in detail in chapter Participant (page 260).
12.6.4 Artifacts According to the metamodel artifacts are allowed in a conversation diagram. However, the relevance of groupings in a conversation diagram is not evident. For that reason only text annotations are implemented in the current version of the BPMN conversation diagram.
The symbol Text annotation is available in the Symbols bar. Artifacts and their usage are described in detail in chapter Artifacts (page 247).
12.6.5 Conversation link A conversation link is used to link participants with conversation nodes. A conversation node has at least two participants.
There is an inconsistency in the specification: Sometimes the name Communication links is used, sometimes the name Conversation link.
N-ary (n > 2) conversations are allowed.
In ARIS the connection type participates in (Participant participates in Conversation) has been introduced. The passive name of the connection type is has conversation link to (Conversation has conversation link to Participant). Specific attributes are not required.
Figure 235: Conversation link with Participant multiplicity
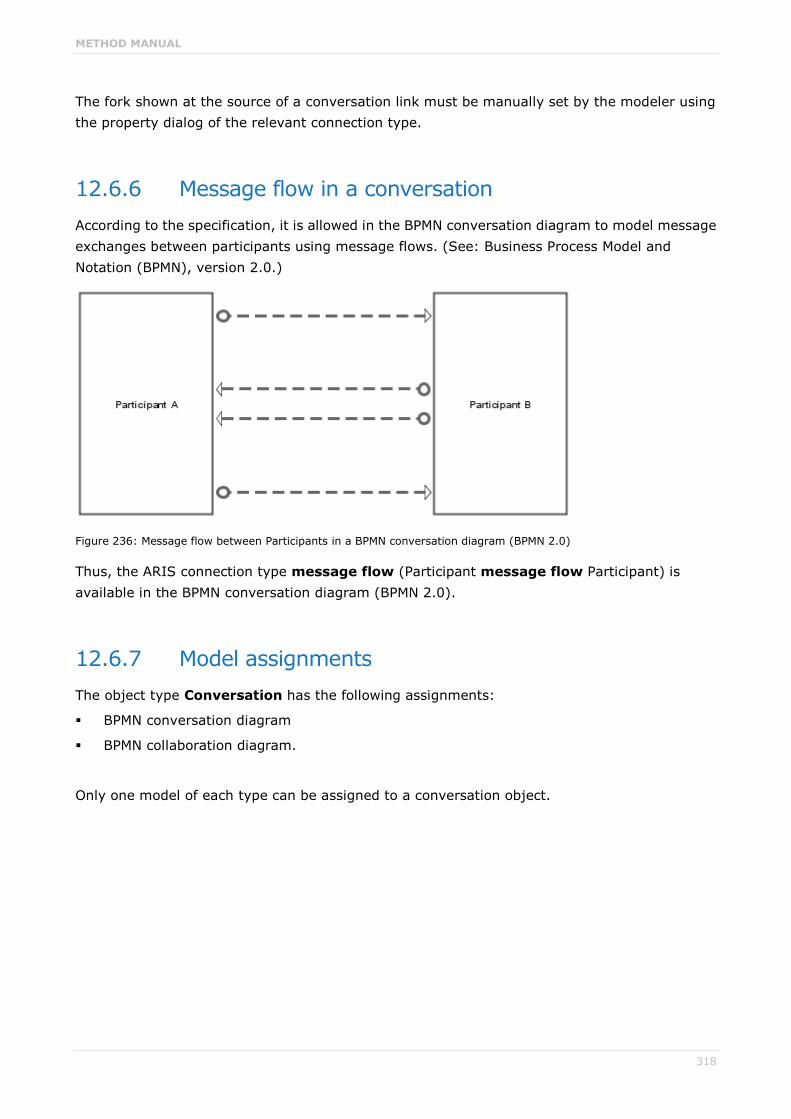
METHOD MANUAL
318
The fork shown at the source of a conversation link must be manually set by the modeler using the property dialog of the relevant connection type.
12.6.6 Message flow in a conversation According to the specification, it is allowed in the BPMN conversation diagram to model message exchanges between participants using message flows. (See: Business Process Model and Notation (BPMN), version 2.0.)
Figure 236: Message flow between Participants in a BPMN conversation diagram (BPMN 2.0)
Thus, the ARIS connection type message flow (Participant message flow Participant) is available in the BPMN conversation diagram (BPMN 2.0).
12.6.7 Model assignments The object type Conversation has the following assignments:
BPMN conversation diagram
BPMN collaboration diagram.
Only one model of each type can be assigned to a conversation object.

METHOD MANUAL
319
12.7 Enterprise BPMN collaboration diagram The model type Enterprise BPMN Collaboration Diagram is based on the BPMN Collaboration Diagram (BPMN 2.0).
It extents the BPMN Collaboration Diagram (BPMN 2.0) model type by ARIS constructs that are already available in the EPC, but that are out of scope in the BPMN specification. Thus, for example, the following object types can be (re-)used as lanes:
Application system type
Role
Organizational unit
Position
Group
The supports connection is used to nest tasks in a lane object of the object type Applications system type. The carries out connection is used to nest tasks in the lane objects of the Organizational object types.
For all other nestings known from the BPMN specification the belongs to connection is used.
Similar to the EPC, an assignment relationship of the connection type is process-oriented superior is available between a function assigned to an Enterprise BPMN collaboration diagram and the tasks occurring in the assigned model.

METHOD MANUAL
320
13 Customer Experience Management (CXM) As a result of digitization, consumers are spending ever-increasing amounts of time online, and customer processes are also increasingly incorporating digital interactions. Due to these developments, Customer Experience Management (CXM) is developing into one of the most important drivers of innovation and customer loyalty.
CXM has the objectives of positively influencing the consumer behavior of a company's customers and of providing all customers with the information they need at any time using the right channel.
ARIS enables the implementation of CXM projects using two different approaches. Firstly, a CXM project can be implemented using the top-down approach, whereby the CXM project starts with the definition of the customer journey landscape and the subsequent creation of the customer journey maps. Secondly, internal processes can be enhanced with customer touchpoints and these can then be specified in more detail in customer touchpoint allocation diagrams in an alternative, bottom-up approach to CXM project implementation.
13.1 Customer journey landscape The Customer journey landscape model enables the description of the customer lifecycle including the individual customer lifecycle stages and customer journeys. The model can be used either to model the customer lifecycle stages only and assign customer journeys to these, or to depict both the customer lifecycle stages and the corresponding customer journeys in one model.
Figure 237: Customer journey landscape
If using the top-down approach, you would start with the customer journey landscape, which provides a clear overview of all customer lifecycle stages and their associated customer journeys.
Furthermore, the Customer journey object type enables the customer journey owner, the business driver and business driver impact on transformation, as well as the overall customer experience to be represented using attributes.

METHOD MANUAL
321
If the corresponding CXM templates are activated, a traffic-light display can be used to visualize the relevant initiatives depending on the attribute values defined, so that the person in charge can immediately see which initiatives are required for which customer journeys.
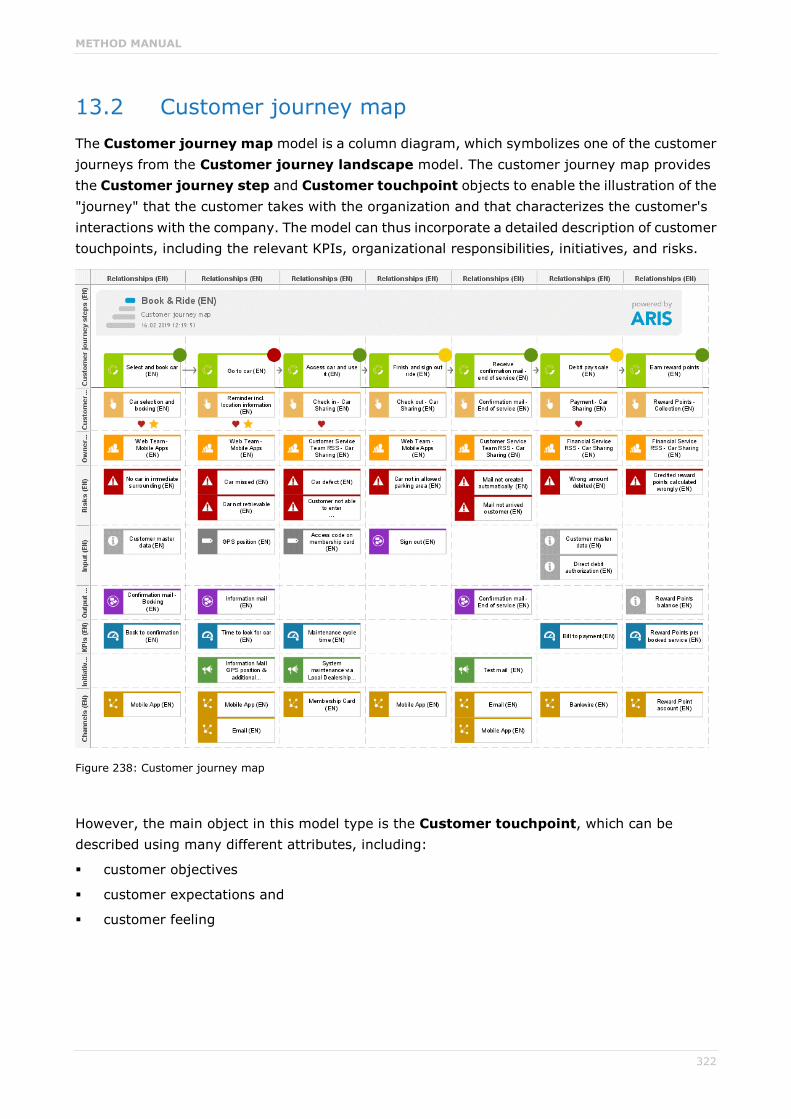
METHOD MANUAL
322
13.2 Customer journey map The Customer journey map model is a column diagram, which symbolizes one of the customer journeys from the Customer journey landscape model. The customer journey map provides the Customer journey step and Customer touchpoint objects to enable the illustration of the "journey" that the customer takes with the organization and that characterizes the customer's interactions with the company. The model can thus incorporate a detailed description of customer touchpoints, including the relevant KPIs, organizational responsibilities, initiatives, and risks.
Figure 238: Customer journey map
However, the main object in this model type is the Customer touchpoint, which can be described using many different attributes, including:
customer objectives
customer expectations and
customer feeling

METHOD MANUAL
323
It is also possible to specify whether the customer touchpoint is a moment of truth, a pain point, or a best practice. Given that this information is very important, it is displayed in the model using special symbols.
Figure 239: CXM symbols
Moment of truth (MoT) indicates that the touchpoint is a crucial and decisive touchpoint for the company and the process. An MoT can dictate whether the relationship between the customer and the company is either reinforced or broken. Identifying moments of truth should therefore be assigned a high priority because such touchpoints have a direct effect on business.
To make the modeling of the customer journey map as simple as possible, ARIS enables the placing of objects using drag and drop. In addition, it is not necessary to draw connections between objects because this model type automatically creates the required object relationships, with the exception of objects of the Customer journey step type. All objects in a column belong to the Customer touchpoint object, which, in turn, is related to the Customer journey step object.
If a customer journey step has more than one customer touchpoint because there are multiple channels, the individual touchpoints can be described in more detail by assigning a customer touchpoint allocation diagram. If you do not assign an allocation diagram to a given touchpoint, all objects below that customer touchpoint will be used for all touchpoints in the relevant step. In this way, it is only a general touchpoint specification.

METHOD MANUAL
324
13.3 Customer touchpoint allocation diagram The Customer touchpoint allocation diagram model type is used to describe a customer touchpoint in more detail including the relevant KPIs, organizational units, initiatives, risks, etc.
Figure 240: Customer touchpoint allocation diagram
Besides the option of assigning it to a customer touchpoint object in a customer journey map, this model type is particularly useful if companies already use ARIS and want to map customer touchpoints in their internal processes without mapping them additionally in customer journey map models. This model type offers the same object types as the Customer journey map model type for describing the customer touchpoint in more detail.
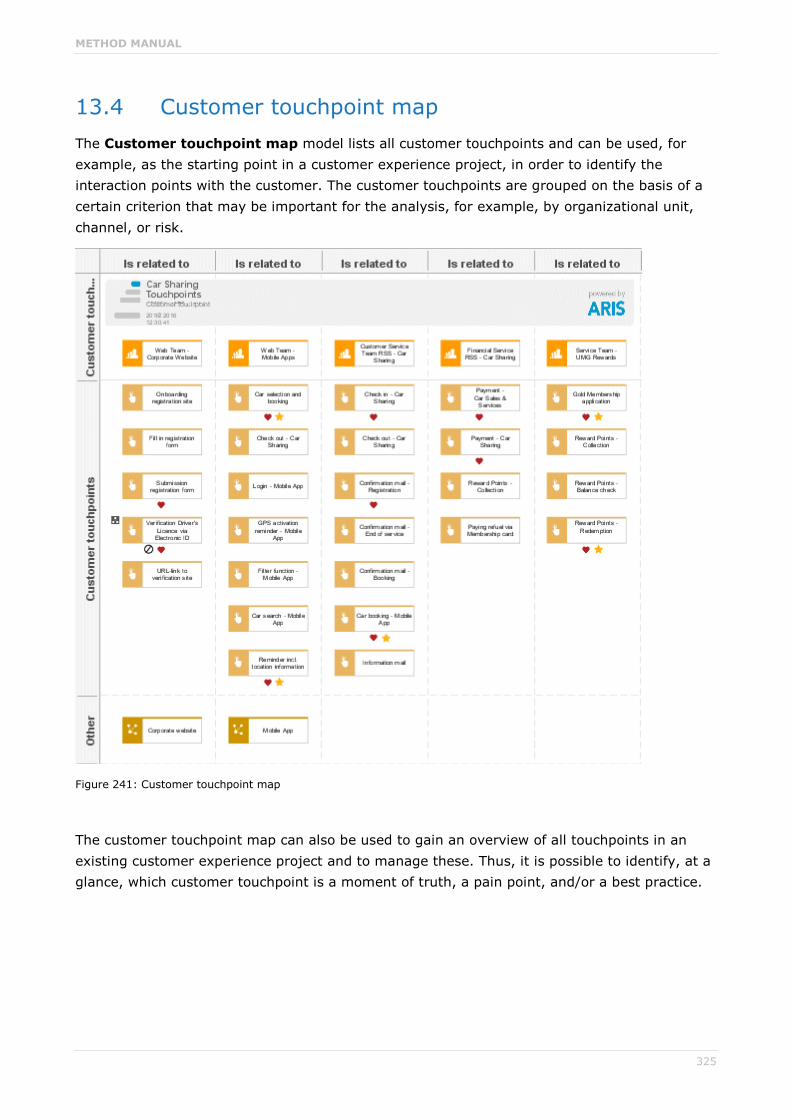
METHOD MANUAL
325
13.4 Customer touchpoint map The Customer touchpoint map model lists all customer touchpoints and can be used, for example, as the starting point in a customer experience project, in order to identify the interaction points with the customer. The customer touchpoints are grouped on the basis of a certain criterion that may be important for the analysis, for example, by organizational unit, channel, or risk.
Figure 241: Customer touchpoint map
The customer touchpoint map can also be used to gain an overview of all touchpoints in an existing customer experience project and to manage these. Thus, it is possible to identify, at a glance, which customer touchpoint is a moment of truth, a pain point, and/or a best practice.

METHOD MANUAL
326
13.5 Linking CXM and BPM ARIS enables the mapping of both the internal and external processes and perspectives and the creation of links between these using the Customer touchpoint object. If, for example, a company has defined a customer touchpoint in a customer journey map, the company can then create an occurrence of the touchpoint in an internal process and reuse it, for example, in an EPC that is important for the customer journey. With this option, the two models are linked with each other and you can, for example, run an analysis to very quickly obtain an overview of which internal processes are influenced by changes to the touchpoint.
Figure 242: Linking CXM and BPM

METHOD MANUAL
327
13.5.1 Analysis capabilities Besides the option of visualizing CXM data in the corresponding model types, it is possible to analyze these data in ARIS using reports or queries.
13.5.1.1 Report The Analyze customer experience report uses an infographic to visualize how customers experience their interaction with the company during a customer journey and is intended to help identify customer satisfaction as well as customer issues.
The following information is evaluated and displayed:
Customer journey steps with customer touchpoints
Moment of truth and pain points with description
Best practice
Importance to customer & customer feeling (satisfaction)
Percentage proportion of pain points in the customer journey map
Number of internal processes impacted
Percentage proportion of satisfied customers
Figure 243: CXM infographic

METHOD MANUAL
328
13.5.1.2 Queries Queries enable you to visualize, with just a few clicks of your mouse, the complex interrelationships within an ARIS database. The data and interrelationships are visualized graphically, but a table format can be provided also.
13.5.1.2.1 Get full customer journey overview The Get full customer journey overview query is started for objects of the Customer journey object type.
The query collects all customer journey maps assigned to the selected customer journey objects and returns all information available about the customer journey steps and the related customer touchpoints. The information belonging to a customer touchpoint describes the customer touchpoint in detail, for example, the risks associated with it.
Figure 244: Customer journey overview

METHOD MANUAL
329
In addition to the graphical display, this query also provides a table showing a complete overview of the customer journey, which can be used, for example, for data management.
Figure 245: Full overview – Customer journey table
The table contains information about the individual customer journey steps, for example, the overall customer experience, as well as all important details about the customer touchpoints of the selected customer journey, for example, which touchpoints represent a pain point for the customer and which do not.
In addition to providing an overview, this table also enables you to specify attributes.

METHOD MANUAL
330
13.5.1.2.2 Find customer touchpoints clustered by associated risk
This query is started for objects of the Risk object type. It shows all customer touchpoints belonging to a risk to provide you with a quick overview.
Figure 246: Customer touchpoints by risk (query)
13.5.1.2.3 Find customer touchpoints clustered by associated ownership
This query is started for objects of the Organizational unit object type and shows all customer touchpoints belonging to an area of responsibility in order to provide you with a quick overview.
Figure 247: Risks and initiatives for all customer touchpoints (query)

METHOD MANUAL
331
13.5.1.2.4 Find customer touchpoints clustered by associated channel
This query is started for objects of the Distribution channel object type and shows all customer touchpoints belonging to a distribution channel in order to provide you with a quick overview.
Figure 248: Find customer touchpoints clustered by associated channel (query)
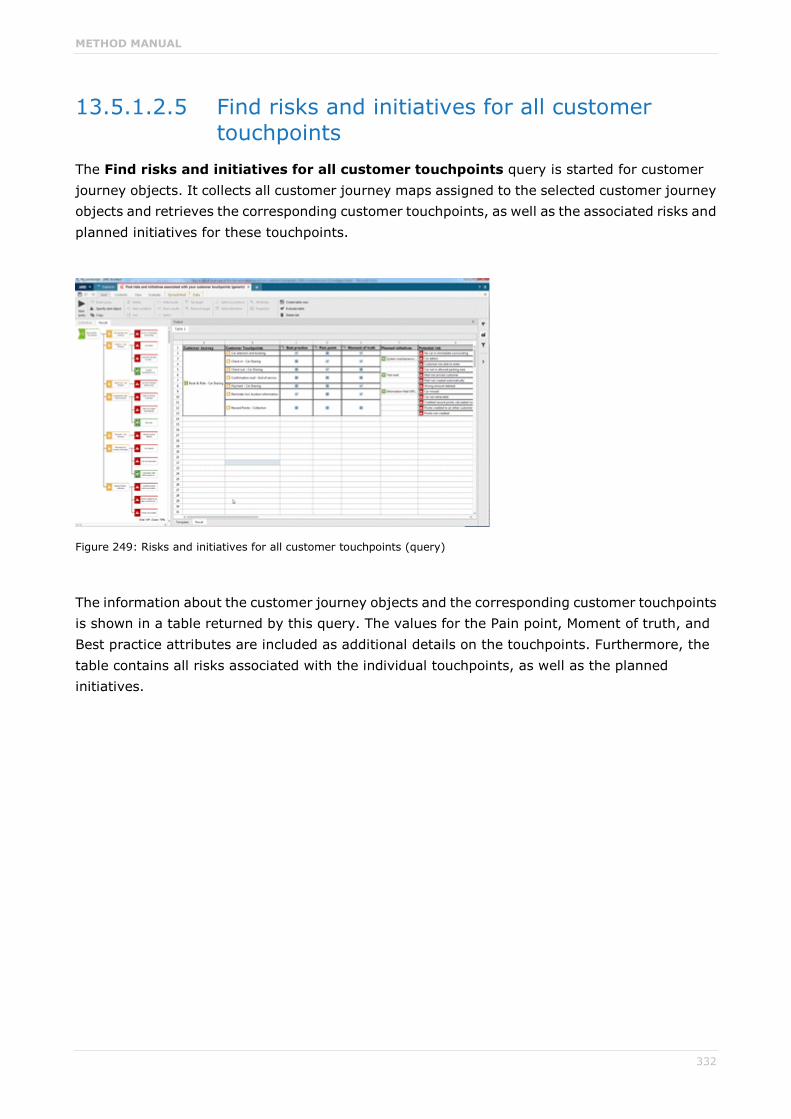
METHOD MANUAL
332
13.5.1.2.5 Find risks and initiatives for all customer touchpoints
The Find risks and initiatives for all customer touchpoints query is started for customer journey objects. It collects all customer journey maps assigned to the selected customer journey objects and retrieves the corresponding customer touchpoints, as well as the associated risks and planned initiatives for these touchpoints.
Figure 249: Risks and initiatives for all customer touchpoints (query)
The information about the customer journey objects and the corresponding customer touchpoints is shown in a table returned by this query. The values for the Pain point, Moment of truth, and Best practice attributes are included as additional details on the touchpoints. Furthermore, the table contains all risks associated with the individual touchpoints, as well as the planned initiatives.
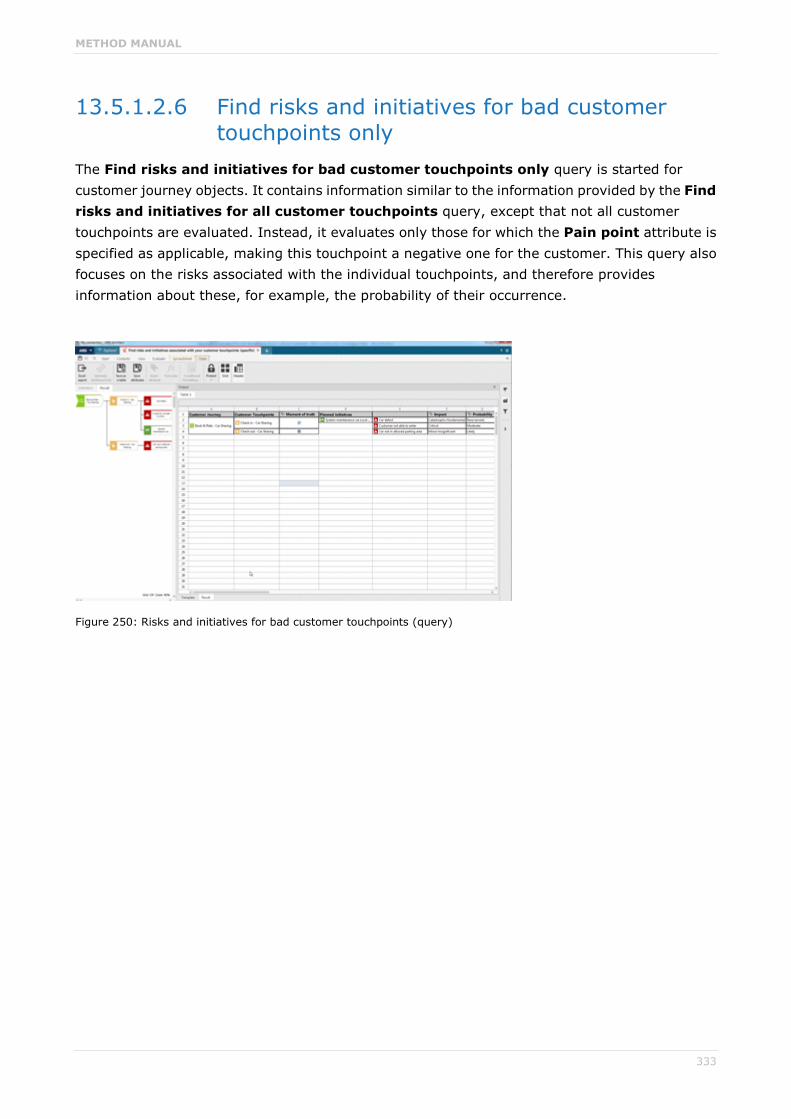
METHOD MANUAL
333
13.5.1.2.6 Find risks and initiatives for bad customer touchpoints only
The Find risks and initiatives for bad customer touchpoints only query is started for customer journey objects. It contains information similar to the information provided by the Find risks and initiatives for all customer touchpoints query, except that not all customer touchpoints are evaluated. Instead, it evaluates only those for which the Pain point attribute is specified as applicable, making this touchpoint a negative one for the customer. This query also focuses on the risks associated with the individual touchpoints, and therefore provides information about these, for example, the probability of their occurrence.
Figure 250: Risks and initiatives for bad customer touchpoints (query)

METHOD MANUAL
334
13.5.1.2.7 Find all processes related to customer journeys This query is started for functions of a value-added chain diagram (VACD).
You can use it to detect customer touchpoints in internal processes and, in this way, determine which customer journey map is connected with which internal process.
The query firstly shows all EPCs that are assigned to the selected functions. Then it shows all functions of the EPC that are related to customer touchpoints.
Figure 251: Find all processes related to customer journeys
Besides the graphical display of interrelationships, this query provides a table with the following information:
The relevant EPC
The process that is related to a customer touchpoint
The customer touchpoint
The specification whether the customer touchpoint is a pain point or a moment of truth
The name of the customer journey in which the customer touchpoint occurs

METHOD MANUAL
335
14 Use cases The purpose of this chapter is to assist you in finding the right ARIS support for specific business management problems. Therefore, the chapter is divided into use case scenarios (subchapters).
For each use case scenario the meaning of each scenario and the activities that are normally performed in the corresponding scenario are briefly described. Subsequently, typical tasks occurring in the scenario are described. For each task it is shown how ARIS can be used to perform the task.
The following table gives an overview of the use cases described along with the model types used:
Scenario Scenario tasks Model types
General company documentation
Documentation of business objectives
Documentation of company value added
Documentation of organizational structures
Documentation of company functions
Process documentation
Process warehousing
Objective diagram
Value-added chain diagram
Organizational chart
Function tree
Office process
Industrial process
EPC
PCD
Database management/Data warehousing (page 339)
Data structuring/Database design
Database management/Access management
ERM
SAP® SERM
SeDaM
IEF data model
Relations diagram
Table diagram
Class diagram
Class description diagram
PC hardware and network management (page 340)
Identification of IT infrastructure requirements
Documentation of IT infrastructure
Access privileges
Network topology
Network diagram
Process cost management (page 341)
Description of process and organizational structures
Cost center analysis
Process calculation
EPC
PCD
Organizational chart
CD diagram
Cost category diagram
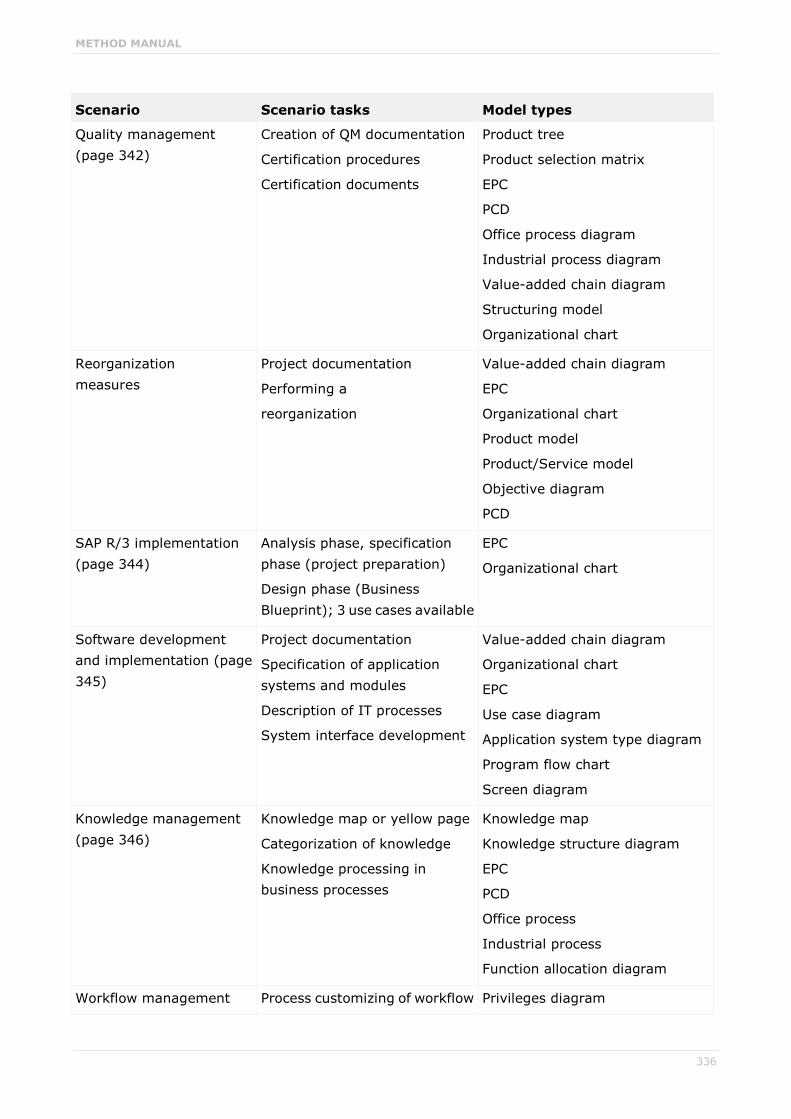
METHOD MANUAL
336
Scenario Scenario tasks Model types
Quality management (page 342)
Creation of QM documentation
Certification procedures
Certification documents
Product tree
Product selection matrix
EPC
PCD
Office process diagram
Industrial process diagram
Value-added chain diagram
Structuring model
Organizational chart
Reorganization measures
Project documentation
Performing a
reorganization
Value-added chain diagram
EPC
Organizational chart
Product model
Product/Service model
Objective diagram
PCD
SAP R/3 implementation (page 344)
Analysis phase, specification phase (project preparation)
Design phase (Business Blueprint); 3 use cases available
EPC
Organizational chart
Software development and implementation (page 345)
Project documentation
Specification of application systems and modules
Description of IT processes
System interface development
Value-added chain diagram
Organizational chart
EPC
Use case diagram
Application system type diagram
Program flow chart
Screen diagram
Knowledge management (page 346)
Knowledge map or yellow page
Categorization of knowledge
Knowledge processing in business processes
Knowledge map
Knowledge structure diagram
EPC
PCD
Office process
Industrial process
Function allocation diagram
Workflow management Process customizing of workflow Privileges diagram

METHOD MANUAL
337
Scenario Scenario tasks Model types (page 347) management systems EPC
Function allocation diagram
Application system diagram
Application system type diagram

METHOD MANUAL
338
14.1 General company documentation Company characteristics, such as processes, structures, and data can be documented in suitable form for training, presentation, and evaluation purposes of any kind. The most important tasks of company documentation are briefly described below.
TASK: DOCUMENTATION OF BUSINESS OBJECTIVES
ARIS support: Objective diagrams can be used for hierarchical alignment of business objectives and the corresponding success factors.
TASK: DOCUMENTATION OF THE COMPANY VALUE ADDED
Identification of the functions involved in value-adding activities of a company is the basis for many corporate decisions.
ARIS support: The company functions involved in the value added can be displayed using the value-added chain diagram. This model illustrates both the sequence of consecutive functions, and superior and subordinate functions.
TASK: DOCUMENTATION OF THE ORGANIZATIONAL STRUCTURE
ARIS support: The structure of a company can be documented in organizational charts illustrating the hierarchy and relationships of organizational units.
TASK: DOCUMENTATION OF COMPANY FUNCTIONS
ARIS support: A function tree can display an overview of a company's individual functions. The functions are divided into object-oriented, process-oriented, or execution-oriented functions.
TASK: PROCESS DOCUMENTATION
ARIS support: Depending on the industry sector or process type, business processes can be recorded in Office process or Industrial process diagrams without any need to resort to methods knowledge. If methods knowledge exists and further utilization of process models by SAP® applications, simulations, workflows, etc. is required, we recommend EPCs for modeling purposes or process chain diagrams (PCDs) for weak point analysis.
TASK: PROCESS WAREHOUSING
Process warehousing is the systematic recording, storage, and maintenance of business process knowledge in a repository.
ARIS support: For modeling process knowledge in decentralized units the use of office and industrial process diagrams is recommended, since operationally active employees usually have no methods expertise. For maintenance and administration in the central model repository, converting the models into EPCs is useful, supported by documents, images, and videos, so that the models can be used in more demanding evaluations, such as simulation or process cost management.
METHOD MANUAL
339
14.2 Database management/Data warehousing By storing company data in databases, redundant data storage is reduced and program-independent access to data used across the company is enabled. Data warehousing ensures quality, integrity, and consistency of the underlying data. The term 'Data Warehouse' generally designates a database that is isolated from operational IT systems and serves as a company-wide data basis for all forms of management support systems. It is characterized by strict separation from operational and decision-supporting data and systems. The focus of the Data Warehouse concept is on efficient provision and processing of large amounts of data to perform evaluations and analyses in decision-relevant processes.
TASK: DATA STRUCTURING/DATABASE DESIGN
The structure of databases is determined by the underlying data models.
ARIS support: The most widely used method of data modeling is the entity relationship model (ERM), which serves as the basis for the implementation of a relational database.
Product and/or company-specific variations of the ERM are the SAP®-ERM for information modeling by SAP AG, the SeDaM (Semantic Data Model) as a notation by BASF AG, and the IEF data model (Information Engineering Facility) for data modeling of the CASE Tool by Texas Instruments Inc.
For a concrete description of logical data structures the relations diagram can be used, which is added to the data structures designed in the ERM.
The tables and fields of a database system are described by the table diagram.
Object-oriented database systems can be designed using the Unified Modeling Language (UML) or the Object Modeling Technique (OMT). In UML, the class diagram can be used to show the static data relationships, while the class description diagram enables an additional representation of attributes, objects, interfaces, etc.
TASK: DATABASE MANAGEMENT/ACCESS MANAGEMENT
Assignment of users and system administrators to database systems.
ARIS support: The access diagram can be used in conjunction with relations and system components to determine the access privileges that organizational units, positions, and persons have for the database system.

METHOD MANUAL
340
14.3 PC hardware and network management Network management is the control, monitoring, and coordination of all (distributed) resources (data networks, processors, data, and applications) that enable communication in a computer network.
TASK: IDENTIFICATION OF IT INFRASTRUCTURE REQUIREMENTS
Based on an existing organizational structure, communication and information system infrastructures suitable for supporting it efficiently are to be derived.
ARIS support: The requirements of the information systems' structure can be depicted using the network topology model type. The representation of application systems, network types, and hardware components does not show individual, identifiable specimens (for example, PC with inventory number 3423), but typifications based on the same technology.
TASK: DOCUMENTATION OF IT INFRASTRUCTURE
The task is to depict an existing or planned installation of an IT infrastructure with specific hardware components, networks, and application systems.
ARIS support: An IT infrastructure can be illustrated using a network diagram as a concrete implementation of a network topology.
TASK: ACCESS PRIVILEGES
The task is to demonstrate which applications and users have access to which data and in which way.
ARIS support: The access diagram can be used to describe which applications or application modules are allowed what kind of access (write/read/change) to databases and information carriers, and whether the data acts as input or output. Furthermore, it can depict which user privileges and views specific users or user groups have for the applications or application modules.

METHOD MANUAL
341
14.4 Process cost management By recording and allocating the costs arising from the commercial provision of products and services, cost accounting provides a scheduling basis and a control instrument. Due to changes in the cost structures, in particular the increase in overhead costs, traditional cost accounting methods are replaced by process cost management. Process cost management determines the costs of processes across cost centers. Budgeting, cost transparency in the indirect performance areas, pricing, and support in make-or-buy decisions are the main advantages of process cost management.
Parts of the ARIS support described in the following can be provided with ARIS Optimizer only.
TASK: DESCRIPTION OF PROCESS AND ORGANIZATIONAL STRUCTURES
The task is to determine the processes to which process cost management applies and to describe cost centers.
ARIS support: Processes are illustrated using standard model types (for example, EPC and PCD). Specifying time attributes and assigning organizational units are important steps in process cost management.
The company organization is described in an organizational chart, in which the organizational units correspond to cost centers (with the Cost rate and Products/Services attributes).
TASK: COST CENTER ANALYSIS
ARIS support: Cost drivers defined in a CD diagram can be used in the context of cost center utilization.
The calculation can be performed for any number of cost categories. The cost category structure is depicted in a cost category diagram.
In addition, it is necessary to create cost category and function tables, in which the objects to be analyzed are described.
TASK: PROCESS CALCULATION
ARIS support: As a prerequisite, a complete cost center analysis must have been performed, including the determination of process cost rates. No additional models are required to perform process calculation. The results are shown in a calculation table.

METHOD MANUAL
342
14.5 Quality management The term 'Quality Management' (QM) applies to all activities that define a company's quality policy, objectives, and responsibilities. The means for implementing these activities include quality planning, quality control (process management), quality assurance, and quality improvement (quality promotion).
TASK: CREATION OF QM DOCUMENTATION
To ensure the quality of products and processes within a company, adequate documentation has to be produced that enables the company to evaluate, compare, and improve products and processes.
ARIS support: Product trees can be used for product documentation as they allow for efficient classification of products. This type of representation is increasingly used in the service industry, particularly in public administration. Furthermore, the product selection matrix enables a company to illustrate which of its functions are required for the creation of which products, and which organizational units are responsible for production.
Another main objective of QM documentation is to document processes that can be recorded by means of EPCs, PCDs, or office and industrial processes, be evaluated by reports, or refer to documents and applications within the company.
TASK: CERTIFICATION PROCEDURES
Use of procedure models to support project management in the certification process according to nationally and internationally recognized standards, such as ISO or VDA.
ARIS support: A procedure model describing certification (for example, the ARIS procedure model) can be represented using a value-added chain diagram. Individual steps can be described in more detail by assigning additional process models.
TASK: CERTIFICATION DOCUMENTS
Creation of quality documents required for certification.
ARIS support: The structuring model subdivides individual certification standards into their components. Individual items of a structuring model can be assigned company models for quality control. For example, these models can be process models in the form of EPCs, office or industrial processes, organizational charts, or value-added chain diagrams.
Using ARIS Architect, reports can be generated that are approved as a QM manual for certification purposes.

METHOD MANUAL
343
14.6 Reorganization measures Reorganization measures aimed at reducing costs or time or at improving the quality of results or work involve modification of business processes (process redesign) or their complete redevelopment (process reengineering).
TASK: PROJECT DOCUMENTATION
Documentation of reorganization measure planning, implementation, and results.
ARIS support: The main project phases of the reorganization process can be described as a procedure model by a value-added chain diagram.
Individual project activities of the reorganization project and their operational sequence can be documented by means of EPCs.
The organizational assignment of people and units involved in the project can be represented in organizational charts.
TASK: PERFORMING THE REORGANIZATION
A reorganization project involves project preparation and strategic planning, followed by an analysis of the actual situation, development of the target concept, and finally implementation of the solutions.
ARIS support: Product/Service models as well as objective diagrams serve to document general strategic conditions, so that the company's main business segments can be recorded along with their products, services, and customer groups, and the critical success factors and the objective hierarchy of the company can be depicted.
During the analysis of the actual situation, a framework containing the main business processes is developed using value-added chain diagrams. Based on employee interviews, these business processes are recorded in detail in the form of an EPC or a process chain diagram (PCD). The PCD is particularly suitable for identifying weak points caused by media breaks and changed process responsibilities.
Following a weak point analysis that takes into account throughput times, process costs, organizational breaks, system and media breaks, data redundancies, etc., alternative target processes are defined. As with actual data, these processes are modeled using EPCs.
Once the target concept is complete, the system, organizational, and data components are described in more detail, which facilitates implementation. For example, the application system construct Word processing can now be specified as Microsoft® Word.
Note: The weak point analysis phase can be supported by evaluations using Simulation and ARIS Optimizer.

METHOD MANUAL
344
14.7 SAP R/3 implementation The support capabilities of ARIS in the implementation of the R/3 standard software by SAP AG focus on the lifecycle of the ASAP implementation approach. However, in addition to ASAP, other approaches geared more towards business process optimization (in the broadest sense) are supported, as well. Parts of the ARIS support described in the following can be provided with ARIS Architect extension pack SAP® only.
TASK: ANALYSIS PHASE, SPECIFICATION (PROJECT PREPARATION)
The task is identifying the degree of coverage of the company-specific processes via the SAP® system, as well as timely identification of possible weak points.
ARIS support: If the analysis is not performed directly by the SAP R/3 reference model, the 'optimum business processes' to be supported can be modeled in ARIS (see general company documentation). By mapping the company model with the SAP R/3 reference model, an initial estimate of the degree of coverage can be obtained through reports.
TASK: DESIGN PHASE (BUSINESS BLUEPRINT)
Process and/or function deficits were identified in the SAP R/3 reference model.
ARIS support: Based on existing R/3 reference model components, new process and scenario variants can be developed in ARIS. Furthermore, new functions, events, and rules can be added to process and scenario components (that is, through the development of new SAP® ABAP functions, if required).
TASK: DESIGN PHASE (BUSINESS BLUEPRINT)
Design of interfaces between SAP® R/3 and non-SAP® applications.
ARIS support: The documentation of the attributes to be exchanged can be described in detail in process models in the ARIS Repository by assigning data or objects to functions and data models or object models. This information can also be output in the form of reports and establishes the basis for the development of interfaces.
TASK: DESIGN PHASE (BUSINESS BLUEPRINT)
Development of the organizational design of business processes and the SAP® system.
ARIS support: The company's social structure and the SAP® organizational structure can be described and juxtaposed using organizational charts.

METHOD MANUAL
345
14.8 Software development and implementation
TASK: PROJECT DOCUMENTATION
Documentation of the planning, process steps, and results of software development and implementation.
ARIS support: The main project phases can be described as a procedure model by a value-added chain diagram.
Individual project activities during development and implementation and their operational sequence can be documented by means of EPCs.
The organizational assignment of people and units involved in the project can be represented in organizational charts.
TASK: SPECIFICATION OF APPLICATION SYSTEMS AND MODULES
The task is to show the structure of an information system based on system requirements.
ARIS support: The use cases of the software system to be developed can be identified by means of the use case diagram. Furthermore, the system users can be defined and then assigned to individual use cases. Often, the use case diagram is the starting point for detailed process modeling. Process models can be assigned to individual use cases.
The application system type diagram may serve to describe the hierarchical structure of application systems at type level using module types and IT function types.
Concrete occurrences describing specific types in more detail can be represented in the application system diagram.
TASK: DESCRIPTION OF IT PROCESSES
The task is to describe the chronological-logical operational sequence of processes within and across modules.
ARIS support: IT processes can be modeled in program flow charts.
TASK: DEVELOPMENT OF THE SYSTEM INTERFACE
The task is to develop and document a user interface.
ARIS support: The structural and functional organization of a screen (window) can be described with a screen diagram. Similar to the transition from an ERM to a relations diagram, the screen diagram is the basis for deriving the program code.

METHOD MANUAL
346
14.9 Knowledge management The starting point for designing comprehensive knowledge management is the assumption that knowledge has become or is becoming the dominant production factor in companies. This results in the need to understand knowledge as a controllable element, just like the classic operational production factors.
Therefore, knowledge management focuses on acquisition, representation, and distribution of knowledge. Knowledge management is the sum of all methods, measures, and systems used by an organization to develop knowledge, render it transparent, and provide it regardless of time, people, and location. The aim of knowledge management is to increase knowledge and to apply existing knowledge in the company in an optimal way.
TASK: KNOWLEDGE MAP OR YELLOW PAGE
The objective is to show what knowledge is available in the company and where.
ARIS support: The Knowledge map model type can be used to display the organizational distribution of different knowledge categories. It shows which organizational unit, position, or employee has expertise in certain knowledge categories, and at what level of competence.
TASK: CATEGORIZATION OF KNOWLEDGE
The task is to analytically classify the intellectual capital of an organization, that is, to describe the various types and groups of knowledge in order to design a knowledge storage structure, for example.
ARIS support: The knowledge structure diagram can be used to show how the knowledge base of an organization is divided into different knowledge categories and how these are further broken down into knowledge categories and documented knowledge. For documented knowledge, it is also possible to depict the information carriers storing the knowledge.
TASK: KNOWLEDGE PROCESSING IN BUSINESS PROCESSES
The task is to show where knowledge is generated, modified, and required in business processes so that the most efficient use of the knowledge resource can be determined.
ARIS support: The EPC, Process chain diagram, Office process, Industrial process, and Function allocation diagram model types provide the Knowledge category and Documented knowledge objects. The knowledge structure and the organizational distribution of knowledge can be described separately by means of the knowledge structure diagram and the knowledge map.

METHOD MANUAL
347
14.10 Workflow management In the broadest sense, a workflow can be interpreted as a business process. The term 'workflow' describes processes that are based on the division of labor and initiated to carry out business transactions. This can include both very simple business processes and complex, cross-organizational processes. The focus of the analysis is on the dynamic process flow from start to completion. Workflow management is the sum of methods, measures, and systems used in order to develop, control, and optimize workflows.
A workflow management system is actively operating, flexibly designable software that works according to an organizational framework of rules and controls a process spanning several workstations and integrating existing basic technical components. Process control systems can be used to support complex tasks involving a large number of employees and positions.
TASK: PROCESS CUSTOMIZING OF WORKFLOW MANAGEMENT SYSTEMS
A special focus of ARIS is to support the transfer of general business process models into workflow models that can be used to configure various workflow management systems (semi-)automatically.
ARIS support: The privileges diagram can be used to describe which workflows (processes) exist and which persons or groups of persons may initiate them.
As with process modeling, the activity flow is depicted in an EPC. Modeling has to be done in strict adherence to the method! A function allocation diagram has to be created for each function, where a user as well as input and output data are allocated to the function - unless this has already been represented in the EPC.
In order for data-related applications to be launched automatically at runtime, files must be assigned to applications in an application system diagram or an application system type diagram.

METHOD MANUAL
348
15 Bibliography
15.1 General literature list Brombacher, R.; Bungert, W.: 'Praxis der Unternehmensmodellierung' [Enterprise modeling
practise], 1992.
Enterprise modeling practise, a seminar by IDS Prof. Scheer GmbH, Bad Soden/Taunus (Germany), November 12-13, 1992.
Chen, P. P.: Entity-Relationship Model, 1976
The entity-relationship model - toward a unified view of data, in: ACM Transactions on Database Systems, Volume 1 (1976), Issue 1, pages 9 - 36.
Hoffmann, W.; Kirsch, J.; Scheer, A.-W.: 'Modellierung mit Ereignisgesteuerten Prozeßketten' [Modeling with event-driven process chains], 1993
Modeling with event-driven process chains (Methods Manual, as of December 1992), in: Scheer, A.-W. (editor), Publication of the 'Institut für Wirtschaftsinformatik' [Institute for Information Systems], paper 101, Saarbrücken, January 1993.
Keller, G.; Hechler, H.-J.: 'Informationsmodell' [Information Model], 1991
'Konzeption eines integrierten Informationsmodells für die Kostenrechnung des SAP®-Systems' [Design of an integrated information model for cost accounting in the SAP® system], in: Scheer, A.-W. (editor): 'Rechnungswesen und EDV - 12. Saarbrücker Arbeitstagung 1991. Kritische Erfolgsfaktoren im Rechnungswesen und Controlling' [12th Saarbrücken conference for accounting and IT 1991. Critical success factors in accounting and controlling], Heidelberg 1991, pages 67 - 106.
Scheer, A.-W.: Architecture of Integrated Information Systems, 1992
Architecture of Integrated Information Systems - Foundations of Enterprise Modelling, 2nd edition, Berlin et al. 1992.
Scheer, A.-W.: 'EDV-orientierte Betriebswirtschaftslehre' [EDP-oriented business management], 1990
'EDV-orientierte Betriebswirtschaftslehre - Grundlagen für ein effizientes Informationsmanagement' [EDP-oriented business management - Foundations of efficient information management], 4th edition, Berlin et al. 1990.
Scheer, A.-W.: Business Process Engineering, 1994
Business Process Engineering - Reference Models for Industrial Enterprises, 5th edition, Berlin et al. 1994.
Schlageter, G.; Stucky, W.: 'Datenbanksysteme' [Database systems], 1983
'Datenbanksysteme - Konzepte und Modelle' [Database systems: Concepts and models], 2nd edition, Stuttgart 1983.
Seubert, M.: 'SAP®-Datenmodell' [SAP® data model], 1991
'Entwicklungsstand und Konzeption des SAP®-Datenmodells' [State of development and design of the SAP® data model], in: Scheer, A.-W. (editor): 'Datenbanken 1991 - Praxis relationaler Datenbanken: Vom Datenmodell zur Implementierung' [Databases 1991 -

METHOD MANUAL
349
Relational database practise: From data model to implementation (symposium 06/04-06/05 1991 in Saarbrücken/Germany)], Saarbrücken 1991, pages 87 - 109.
Sinz, E. J.: 'Entity-Relationship-Modell' [Entity Relationship Model], 1990
'Das Entity-Relationship-Modell (ERM) und seine Erweiterungen' [The Entity Relationship Model (ERM) and its extensions], in: 'HMD Theorie und Praxis der Wirtschaftsinformatik (1990)' [HMD magazine on the theory and practice of business process engineering (1990)], paper 152, pages 17 - 29.
Scheer, A.-W.: ARIS - Business Process Frameworks. 3. edition Berlin et al. 1998.
Scheer, A.-W.: ARIS - Business Process Modeling. 3. edition Berlin et al. 1998.
Scheer, A.-W., Jost, W.: 'ARIS in der Praxis' [ARIS in Practice], 2002
'Gestaltung, Implementierung und Optimierung von Geschäftsprozessen' [Design, Implementation and Optimization of Business Processes], Berlin, Heidelberg, New York 2002.
Scheer, A.-W., Abolhassan, F., Jost, W., Kirschmer, M.: Business Process Excellence, 2002
ARIS in Practice , Berlin, Heidelberg, New York 2002.

METHOD MANUAL
350
15.2 Topic-related bibliography
15.2.1 Unified Modeling Language in ARIS
15.2.1.1 UML specification UML specification: http://www.uml.org.
15.2.1.2 Using UML Burkhardt, R.: 'UML - Unified Modeling Language, Objektorientierte Modellierung für die
Praxis' [Object-Oriented Modeling in Practice], Bonn 1997.
Fowler, M.; Scott, K.: UML Distilled - Applying the Standard Object Modeling Language, Reading et al. 1997.
Oesterreich, B.: Developing Software with UML: Object-oriented analysis and design in practice, 3rd edition, Munich/Vienna 1997.
15.2.1.3 UML and business process modeling Ambler, S. W.: What's Missing from the UML? Techniques that can help model effective
business applications, Object Magazine 7(1997)8
Loos, P.; Allweyer, Th.: Process Orientation and Object-Orientation - An Approach for Integrating UML and Event-Driven Process Chains (EPC), Publication of the 'Institut für Wirtschaftsinformatik' [Institute for Information Systems], Paper 144, Saarbrücken 1998.
15.2.2 Object Modeling Technique (OMT) Rumbaugh, J.; Blaha, M.; Premerlani, W.; Eddy, F.; Lorensen, W.: Object-Oriented Modeling and Design. Munich et al.1993.

METHOD MANUAL
351
15.2.3 Methods for knowledge management
15.2.3.1 General knowledge management Probst, G.; Raub, S.; Romhardt, K.: Managing Knowledge - Building Blocks for Success.
Frankfurt/Wiesbaden 1998.
Bürgel, H. D. (editor): 'Wissensmanagement - Schritte zum intelligenten Unternehmen' [Knowledge management - Steps towards an intelligent company]. Berlin et al. 1998.
15.2.3.2 Using ARIS for knowledge management Allweyer, Th.: 'Modellbasiertes Wissensmanagement' [Model-based knowledge
management]. In: IM Information Management & Consulting 13 (1998) 1, pp. 37-45.
Allweyer, Th.: Using ARIS Models for Knowledge Management. In: Scheer, A.-W.: ARIS - Business Process Frameworks. 3. edition Berlin et al. 1998, p. 162-168.
15.2.4 Balanced Scorecard method Kaplan, Robert/Norton, David: The Balanced Scorecard - Measures that Drive Performance, Harvard Business Review January/February 1992.
15.2.5 IT City Planning Schulman, Jeff: A New View of Architectures Needed for New Business Drivers, Gartner
Briefing Presentations.
Longépé, Christoph: Le projet d'urbanisation du système d'information, Dunod, Paris, 2001
15.2.6 Business process modeling Business Process Modeling Notation, Working Draft (1.0); BPMI.org; August 25, 2003.

METHOD MANUAL
352
16 Legal information
16.1 Documentation scope The information provided describes the settings and features as they were at the time of publishing. Since documentation and software are subject to different production cycles, the description of settings and features may differ from actual settings and features. Information about discrepancies is provided in the Release Notes that accompany the product. Please read the Release Notes and take the information into account when installing, setting up, and using the product.
If you want to install technical and/or business system functions without Software AG's consulting services, you require extensive knowledge of the system to be installed, its intended purpose, the target systems, and their various dependencies. Due to the number of platforms and interdependent hardware and software configurations, we can only describe specific installations. It is not possible to document all settings and dependencies.
When you combine various technologies, please observe the manufacturers' instructions, particularly announcements concerning releases on their Internet pages. We cannot guarantee proper functioning and installation of approved third-party systems and do not support them. Always follow the instructions provided in the installation manuals of the relevant manufacturers. If you experience difficulties, please contact the relevant manufacturer.
If you need help installing third-party systems, contact your local Software AG sales organization. Please note that this type of manufacturer-specific or customer-specific customization is not covered by the standard Software AG software maintenance agreement and can be performed only on special request and agreement.
If a description refers to a specific ARIS product, the product is named. If this is not the case, names for ARIS products are used as follows:
Name Includes
ARIS products Refers to all products to which the license regulations of Software AG standard software apply.
ARIS Clients Refers to all programs that access shared databases via ARIS Server.
ARIS Download clients Refers to ARIS clients that can be accessed using a browser.
METHOD MANUAL
353
16.2 Data protection Software AG products provide functionality with respect to processing of personal data according to the EU General Data Protection Regulation (GDPR).
Where applicable, appropriate steps are documented in the respective administration documentation.
16.3 Disclaimer ARIS products are intended and developed for use by persons. Automated processes, such as the generation of content and the import of objects/artifacts via interfaces, can lead to an outsized amount of data, and their execution may exceed processing capacities and physical limits. For example, processing capacities are exceeded if models and diagrams transcend the size of the modeling area or an extremely high number of processing operations is started simultaneously. Physical limits may be exceeded if the memory available is not sufficient for the execution of operations or the storage of data.
Proper operation of ARIS products requires the availability of a reliable and fast network connection. Networks with insufficient response time will reduce system performance and may cause timeouts.
ARIS document storage was tested with 40.000 document items. This includes documents, document versions or folders. We recommend monitoring the number and overall size of stored document items and archiving some document items if needed.
If ARIS products are used in a virtual environment, sufficient resources must be available there in order to avoid the risk of overbooking.
The system was tested using scenarios that included 100,000 groups (folders), 100,000 users, and 1,000,000 modeling artifacts. It supports a modeling area of 25 square meters.
If projects or repositories are larger than the maximum size allowed, a powerful functionality is available to break them down into smaller, more manageable parts.
Some restrictions may apply when working with process administration, ARIS Administration, ARIS document storage, and ARIS Process Board, and when generating executable processes. Process Governance has been tested and approved for 1000 parallel process instances. However, the number may vary depending on process complexity, for example, if custom reports are integrated.
ARIS document storage was tested with 40.000 document items. This includes documents, document versions or folders. We recommend monitoring the number and overall size of stored document items and archiving some document items if needed.

METHOD MANUAL
I
17 Index
A
A2A • 204 A2B • 204 A2C • 204 Abstract business process • 227 Access diagram • 143 Access diagram (physical) • 151 Access privilege
Implementation - Table diagram • 70 PC hardware and network management •
340 Access privileges • 340 Achievement of objectives • 192 Action program • 192 Activity • 236 Activity flow • 347 Actual value • 195 Aggregation • 35 Aggregation operator • 35 Analysis
SAP R3 introduction • 344 Strategy • 188
Analysis phase, specification phase (project preparation) • 344
AND rule • 91 Annotation • 241 Application scenario • 335 Application system type
Definition • 27 Design specification - Application system
type diagram • 23 Information flows between application
system types • 143 Modular structure • 23 Specimens of an application system type
• 27 Application system type diagram • 23 Application system type hierarchy • 222 Applications • 340 Architecture of Integrated Information
Systems (ARIS) Company structure • 72 Concept • 3 Descriptive levels • 7 Introduction • 1 Organization view • 72 Overall view • 108
Architectures • 1 ARIS
Architecture of Integrated Information Systems • 1
SAP • 344 Artifact • 241 ASAP • 344 Attribute
Coverage quality • 184 Degree of coverage • 184 Design operators added • 35 Distinction from entity type • 30 Domain • 30 ERM base model • 30 Occurrences • 30 Passed on • 35 Relations diagram, Attribute allocation
diagram • 65 Requirements definition • 30 Value range • 30
Attribute allocation diagram • 65 Authorities • 75 Authorization • 135 Authorization concept • 122 Authorization conflict • 61 Authorization type • 135
B
B2A • 204 B2B • 204 B2C • 204 Balanced Scorecard (BSC)
Acceptance • 192 Advantages and benefits • 194 Approach • 187 Balanced Scorecard system structure
specification • 197 BSC KPI allocation diagram • 200 Cause-and-effect chain • 191 Cause-and-effect relationship
specification • 197 Concept • 187 Customer perspective • 190 E-business scenario • 209 Economic/Financial perspective • 187 External performance perspective • 187 Financial perspective • 190 Function tree • 197 Human-oriented perspective • 195 Internal performance perspective • 187 Learning and growth perspective • 187 Method • 187 Object relation to ARIS models • 203
METHOD MANUAL
II
Organizational chart • 197 Performance management • 197 Performance measurement • 197 Process perspective • 190 Recognition • 192 Stages • 188 Standard perspective • 190 Structuring model • 197 Value-added chain diagram • 197
Batch processing • 11 Bottom-up process • 193 BPMN
Activities • 270 Activity type - Subprocess • 276 Activity type - Task • 272 Artifacts • 247 Artifacts (conversation) • 317 Association • 250 Callable Elements • 252 Catch and throw events • 295 Collaboration • 312 Common Elements • 247 Conversation • 315 Conversation container • 315 Conversation link • 317 Conversation nodes • 316 Core elements • 244 Data object • 290 Data store • 292 Diagrams/model types overview • 267 End event • 299 Enterprise BPMN collaboration diagram •
319 Event • 252 Event definitions • 300 Event-based gateways • 309 Events • 293 Exclusive gateway • 307 Expression • 253 Flow element • 253 Flow element container • 254 Foundation • 245 Gateway • 255 Gateways • 306 Global task • 285 Group • 250 Human interactions • 276 Inclusive gateway • 307 Infrastructure • 244 Initial situation • 243 Intermediate events • 298 Items and Data • 290 Lanes • 310 Loop characteristics • 285 Loop characteristics representations •
285
Message flow • 257 Message flow (connection type) • 314 Message flow (conversation) • 318 Model assignments • 318 Not considered elements • 266 Parallel gateway • 308 Participant • 260 Participant (conversation) • 317 Performer • 272 Pool and participant • 313 Process • 268 Process classes/business process diagram
• 227 Purpose BPMN chapter • 243 Resource • 263 Resource assignment • 272 Reused types • 313 Sequence flow • 263 Standard and multi-instance loop
characteristics • 287 Start event • 297 Subprocess type - Ad hoc subprocess •
281 Subprocess type - Call Activity • 283 Subprocess type - Event subprocess • 279 Subprocess type - Subprocess • 277 Subprocess type - Transaction • 280 Text annotation • 251
Breakdown (organizational) • 72 Breaks
Media breaks • 11 Organizational • 343
BSC Cause-and-effect diagram Cause-and-effect relationship
specification • 197 Structure • 197 Symbols • 197
BSC KPI allocation diagram BSC KPI allocation diagram • 200 Symbols • 200
Budget Budgeting process • 192 Targets • 192
Budgeting • 341 Budgeting process • 194 Building cluster • 216 Business blueprint • 344 Business controls diagram • 123 Business documents • 206 Business objectives
Balanced Scorecard • 187 Hierarchical arrangement • 338 Objective diagram • 22 Organizational chart • 75
METHOD MANUAL
III
Process instantiation model • 131 Business participant
E-Business scenario diagram • 125 E-Business scenario diagram and its
objects • 206 Business process
Branches and processing loops • 91 Business management problem • 11 Chronological-logical operational
sequence • 11 Design • 344 Event and function columns • 91 Function tree • 15 Holistic view • 1 Introduction • 204 Knowledge • 338 Logical-chronological procedure • 91 Modeling • 1 Modeling objectives • 22 Models • 347 Optimization • 344 Requirements definition • 108 Views • 11
Business process automation • 227 Business process diagram
BPMN realization • 229 Business process modeling • 227 Process classes • 227
Business process modeling Communication technologies • 227 Information technologies • 227
Business to Business • 204 Business to Consumer • 204 Business units • 189 Business/Consumer to Administration • 204
C
C++ development environment • 139 C2A • 204 C2B • 204 c3 method • 137 Calculation table • 341 Capability • 216 Capital investment • 192 Cash flow • 189 Categorization of knowledge • 346 Cause-and-effect chain • 191 Cause-and-effect relationships
Balanced Scorecard • 190 Cause-and-effect chain • 191
CD diagram • 62 Certification
Documents • 342 Procedures • 342 Structuring model • 127
Change management project • 137 Chronological-logical operational sequence •
11 CIM • 72 Classification • 35 Classification diagram • 114 Cluster • 35 Cluster instance • 129 Collaboration processes • 227 Collaborative business maps • 209 Commercial • 341 Communication campaign • 192 Communication structure • 124 Communications diagram • 114 Company
In databases • 339 Mission statement • 189 Performance goal • 189 Perspectives • 187 Philosophy • 189 Strategy • 187, 189 Views • 187 Vision • 187
Company analysis • 131 Company documentation • 338 Company functions • 338 Company model • 344 Company value added • 338 Competition model • 163 Competitive situation • 163 Competitive strategy • 187 Complexity • 30 Complexity reduction • 194 Connection
'Is superior' type • 63 Types • 53
Consensus building • 194 Constraints • 166 Control flow • 11 Control instrument • 341 Control view
Access diagram • 143 ARIS • 91 ARIS House • 72
METHOD MANUAL
IV
Business management problem • 11 Descriptive views • 3 Requirements definition • 89
Core competence • 188 Corporate decisions • 338 Corporate management • 194 Cost accounting • 341 Cost category diagram • 62
Hierarchy • 63 Process cost management • 62
Cost center analysis • 341 Cost driver • 62 Cost reduction • 192 Costs
Reduction • 343 Structures • 341 Transparency • 341
CRM system • 213 Customer Experience Management (CXM)
Analysis capabilities • 327 Customer journey landscape • 320 Customer touchpoint map • 325 CXM • 320 Linking CXM and BPM • 326 Query – All processes related to customer
journeys • 334 Query – Customer touchpoints clustered
by associated channel • 331 Query – Customer touchpoints clustered
by associated ownership • 330 Query – Customer touchpoints clustered
by associated risk • 330 Query – Full overview • 328 Query – Risks for all customer touchpoints
• 332 Query – Risks for bad customer
touchpoints • 333 Report • 327
D
Data cluster • 35 Data model
Creation process • 46 Semantic • 30
Data object • 46, 241 Data redundancies • 343 Data source • 195, 200 Data structure • 339 Data structuring/Database design • 339 Data view
Design specification • 65 Implementation • 70
Problem • 11 Requirements definition • 30
Data Warehouse • 124 Data Warehouse data transformation
diagram • 124 Data Warehouse method • 200 Data Warehouse structure diagram • 60 Data warehousing • 339 Database management system • 23 Database management system type • 23 Database management/Access management
• 339 Database system
Implementation - Table diagram • 70 Object-oriented • 339
Decision-making power • 89 Definition • 59, 86 Degree of coverage
Knowledge category • 181 Knowledge map • 184
Degree of goal accomplishment • 195 Dependency
Identification and existence dependency • 42
SAP SERM • 46 Description of IT processes • 345 Description of the business management
problem • 11 Descriptive ERM attribute • 45 Descriptive level • 7 Design
Business processes • 344 Organizational design of business
processes • 344 Organizational design of the SAP System •
344 PC hardware and network management •
340 Design operator
eERM • 50 Types • 35
Design operators Design operators • 35 External • 56 Internal • 56 Occurrence level • 30 Type level • 30
Design phase (Business Blueprint) • 344 Design process • 35 Design specification
Control/Process view • 143

METHOD MANUAL
V
Data view • 65 Descriptive levels • 7 Descriptive views • 3 Function view • 23 Organization view • 80
Development of interfaces • 344 Dimension table • 60 Directed graph • 46 Direction of effect • 195 District • 216 Document
HTML • 125 XML • 125
Document type definition • 51 Documentation
Business objectives • 338 Company functions • 338 Company value added • 338 Organizational structure • 338
Documented knowledge • 180 Domain
ERM base model • 30 Implementation • 70
Double-loop learning • 187 Key elements of the BSC approach • 187 Strategic learning and feedback • 193
Draft list • 23 DTD
Attribute default • 56 Attribute types • 54 Connection type • 53 Connections • 209 Document type definition • 51 DTD model • 51 Element type • 51 External entity • 56 Internal entity • 56 Notation • 56 Parameter entity • 56 Uniform Resource Identifier • 56
DW structure Modeling • 60 Relationship to other models • 203
DW transformation • 203 Dynamic modeling • 165
E
E-business Definition • 204 Scenario diagram • 125
E-business scenario Balanced Scorecard • 209
Diagram • 125 Idea • 206 Introduction • 204 Model and object • 206 Protection • 208 Report • 208 Transaction protection • 208 Transmission path • 208
Economic agent • 125 eERM
Approach • 46 Design operators • 50 ERM attribute • 45 ERM attribute allocations • 45 ERM base model • 30 ERM relationship type • 45 Method • 46 Structural elements • 50 Terms and forms of representation • 50
eERM attribute allocation diagram • 45 Effectiveness • 195 Element
Application system • 119 Organizational • 119 Rule sheet • 91 XOR rule • 91
Elementary function • 15 Elementary process • 135 Elementary role • 135 E-mail • 206 Enterprise BPMN collaboration diagram • 319 Entity relationship model
Base model • 30 ERM • 30 Extensions • 35 Modeling • 30 Structured • 46
Entity set • 35 Entity type
Aggregation • 35 Distinction from attribute • 30 Examples • 30 Strong • 46 Weak • 46
Environment Organizational structure • 72 State description • 3
EPC Column/Row display • 119 Material flow • 116 Process selection matrix • 115 Product/Service exchange modeling • 157 Relationships to other models • 203

METHOD MANUAL
VI
Symbols • 128 EPC (material flow) • 59 EPC (row display) • 119 ERM base model
ERM base model • 30 Extension • 40 Lower limit • 40
ERP system Connection • 209 IT City Planning • 213 XML • 209
Evaluation scale • 135 Event
Function tree • 15 Graphical representation • 91 Operator • 91 Start and end events • 30
Event control • 108 Event diagram • 107 Event-driven process chain (EPC)
Branches and processing loops • 91 Event control • 91 Function tree • 15
Execution-oriented • 338 Existence dependency • 42 Extensible markup language (XML) • 209 Extranet • 206
F
Fact hierarchy • 127 Fact table • 60 Feedback process • 193 Field • 70 Field (specimen) • 70 Financial KPI • 187 Financial objective • 191 Focus on the past • 194 Form field • 140 Frame • 140 Function
Aggregation levels • 15 Assignment to data • 91 Automated • 15 Batch run • 15 Degree of integration • 89 Execution • 15 Execution specification • 11 Execution-oriented grouping • 15 Grouping criteria • 15 Hierarchy levels • 15 Integration • 72
Operational sequence (EPC) • 91 Operational sequence (Function tree) • 15 Orientation time • 15 Procedure • 3, 11 Processing time • 15 Process-oriented breakdown • 15 Quantity structure • 15 Rule • 91 Units of time • 15 Wait time • 15
Function allocation diagram • 102 Function tree
Execution-oriented • 15 Object-oriented • 15 Process-oriented • 15 Semantic • 15
Function view Business management problem • 11 Descriptive views • 3 Linking organization with functions • 89 Requirements definition • 14
Function/Organizational level diagram • 89 Functional block • 216 Functional modeling • 165 Future significance • 181
G
Gateway Complex gateway • 238 Symbols • 238 Types • 238
Generalization Generic term • 35 Occurrences • 35 Structuring model • 127 Subterm • 35
Goods shipment • 125 Graphical representation
Industrial process • 128 Office process • 128
Group • 241 Grouping • 35
H
Hierarchical arrangement Hierarchy model • 15 Success factors • 22

METHOD MANUAL
VII
Hierarchical arrangement of objects • 179 HTML document • 125 Human resource • 80 Human resources development • 189
I
Identification and existence dependency • 42 IE data model • 48 IE notation • 48 Implementation
Data view • 70 Function view • 27 Implementation • 7
Implicit relationship • 119 Indicator
Lagging indicator • 191 Leading indicator • 191 Type • 195
Individual process • 125 Industrial process
Graphical representation • 128 Production process • 128 Symbols • 128
Industry • 338 Influencing factor • 195 Info cube • 124 Information carrier • 11 Information carrier diagram • 64 Information carrier symbol • 114 Information flow diagram • 102 Information system
Business management problem • 11 Lifecycle • 7 Procedure model for development • 7 Support • 183
Information technology • 189 Initial, final, and transition states • 173 Initiative • 195 Innovations • 189 Input and output data • 11 Input data • 347 Input/Output diagram • 102 Integration concept • 3 Integration potential of information
technology • 131 Intellectual capital • 346 Interaction • 189, 195 Interactive processing • 11 Interfaces
SAP R/3 and non-SAP applications • 344 Interrelation • 193 Interviews • 343 IS service • 216 IS view • 216 ISO • 342 IT blocks • 222 IT City Planning report
Aim (detailed) • 213 Aim (superior) • 213 Companies affected • 213 Evaluation • 226 IT City Planning • 213 Views • 214
IT function • 23 IT function type (definition) • 23 IT procedures • 222 IT processes • 345 IT software • 222 IT support • 11 IT view • 222
K
Key Complex • 35 Simple • 35
Key attribute • 30 Knowledge
Degree of coverage • 181 Documented • 180
Knowledge management Knowledge category • 181 Term • 180 Usage • 346

METHOD MANUAL
VIII
Knowledge map • 184 Knowledge processing in business processes
• 346 Knowledge structure diagram • 183 Knowledge usage • 181 Knowlegde advantage • 181 KPI system • 194
L
Lagging indicator • 191 Lane • 230 Leading indicator • 191 Lean management • 72 Lean production • 72 Level or phase concept • 7 Life cycle concept • 3 Line position • 75 List • 23
M
Main process Process selection matrix • 115 SAP applications diagram • 21
Make-or-buy decisions • 341 Management bottleneck • 194 Management information • 187 Management process (strategy) • 188 Management support systems • 339 Manual processing • 11 Market growth • 197 Material diagram • 59 Material flow
EPC • 59 In process models • 59 Material flow (EPC) • 116 Material flow diagram • 116 PCD • 59
Material resource • 80 Material type (definition) • 59 Maximum value • 195 Media • 11 Media breaks • 343 Message flow • 227 Methods • 7 Minimum value • 195 Mission statement • 189 Mobile phone • 125 Model
Access diagram • 143 Access diagram (physical) • 151 Application system type diagram • 23, 27 Attribute allocation diagram • 65 Authorization hierarchy • 61 Business controls diagram • 123 c3 method • 137 Classification diagram • 114 Collaborative business maps • 209 Communications diagram • 114 Competition model • 163 Cost category diagram • 62 Cost driver diagram (CD diagram) • 62 Data Warehouse data transformation
diagram • 124 DTD • 51 DW structure • 60 E-Business scenario diagram • 125, 204 eERM • 35 eERM attribute allocation diagram • 45 EPC (column/row display) • 119 EPC (event-driven process chain) • 91,
108 EPC (material flow) • 116 EPC (row display) • 119 ERM base model • 30 Function allocation diagram • 102 Function tree • 15 Function/Organizational level diagram •
89 IE data model • 48 Industrial process • 128 Information carrier diagram • 64 Information flow diagram • 102 Input/Output diagram • 102, 114 Knowledge map • 184 Knowledge structure diagram • 183 Material diagram • 59 Material flow diagram • 116 Network diagram • 84 Network topology • 80 Objective diagram • 22 Office process • 128 OMT Class description model • 179

METHOD MANUAL
IX
OMT Data value decomposition • 179 OMT Dynamic model • 173 OMT Functional model • 176 Organizational chart • 75 PCD (process chain diagram) • 108 Privileges diagram • 347 Process instantiation model • 131 Process selection matrix • 115 Product allocation diagram • 159 Product selection matrix • 162 Product tree • 161 Product/Service exchange diagram • 157 Product/Service tree • 158 Program flow chart • 144 Program flow chart (PF) • 144 Project process chain (PPC) • 129 Quick model • 136 RAMS • 131 Relations diagram • 65 Role allocation diagram • 122 Role diagram • 135 Rule diagram • 113 SAP ALE filter model • 121 SAP ALE message flow model • 121 SAP ALE message type model • 121 SAP applications diagram • 21 SAP SERM • 46 Screen design • 139 Screen diagram • 148 Screen navigation • 140 SeDaM model • 49 Semantic • 7 Service allocation diagram • 220 Shift calendar • 80 Structuring model • 127 Swimlane • 1 System attribute domain • 68 System attributes • 68 Table diagram • 70 Technical resources • 86 Technical terms model • 43 Value-added chain diagram • 108 Y diagram • 20
Modeling Actual business situation • 1 Material flow • 115 Material flow in material diagram • 59 Methods • 1 Semantic • 7
Module (definition) • 27 Module type (definition) • 23 Money transaction
E-Business scenario diagram • 125 Object • 206
N
Network • 84 Network connection • 84 Network connection type • 80 Network diagram • 84 Network management • 340 Network node • 84 Network node type • 80 Network specimen • 80 Network topology • 80 Network type (definition) • 80 Notation
Identification and existence dependency • 42
O
Object Management Group • 164 Object modeling • 165 Object Modeling Technique • 339 Objective
Definition • 22 Departmental goal • 194 Economic/Financial • 195 Individual • 194 Operational-monetary • 194 Strategic • 187, 194
Objective diagram • 22 Objective hierarchies • 22 Object-oriented database systems • 339 Office process
Graphical representation • 128 Office processes • 128 Symbols • 128
OMT • 165 OMT Class description model • 179 OMT Data value decomposition • 179 OMT Dynamic model • 173 OMT Functional model
Data flow splitting • 176 Representation of actors • 176 Representation of data flows • 176 Representation of processes • 176
OMT methodology • 165 OMT Object model
Aggregation between classes • 166 Assignment of attributes to classes • 166 Assignment of instances to classes • 166 Assignment of operations to classes • 166 Associations between classes • 166 Generalization and inheritance • 166

METHOD MANUAL
X
Modeling an association as a class • 166 N associations between classes • 166 Representation of classes • 166 Representation of instances • 166 Representation of orders for associations
• 166 Representation of qualified associations •
166 Online shop
Example • 209 Model • 209
Operating resource EPC (material flow) • 116 Technical resource • 86
Operating resource type • 116 Operating system • 23 Operating system type • 23 Operator
AND • 91 Complex relationships • 91 Event • 91 Function • 91 General rule • 91 Logical AND operator • 91 Logical OR operator • 91 Logical XOR operator • 91 Operator • 11 OR • 91 Rules • 91 XOR • 91
OR operator • 91 OR rule • 91 Organization • 72 Organization view
Descriptive views • 3 Design specification • 80 Linking organization with functions • 89 Requirements definition • 72
Organizational • 72 Organizational
Breakdown • 72 Organizational units • 72 Structuring • 72 Unit • 72
Organizational Element • 119
Organizational Breaks • 343
Organizational chart • 75 Organizational complexity management • 72 Organizational form • 72 Organizational structure • 72
Area-based • 72
Balanced Scorecard systems • 197 General company documentation • 338 Organizational company structure • 72 Product-related • 72
Organizational unit Assignment to functions • 91 Business management problem • 11 Descriptive views • 3 Organizational chart • 75
Organizational unit type • 75, 206 Output data • 347
P
Packaging material type • 116 Packaging material type (definition) • 59 Parameter entity • 56 Partial strategy • 188 Path (specify) • 129 PCD
Business management problem • 11 Columns • 108 Material flow • 59, 116
Performance amount-induced • 62 Performance amount-neutral • 62 Performance driver • 191 Performance measurement
Approach • 187 Balanced Scorecard system • 197 System • 187
Performance scale • 63 Person responsible • 3 Person type • 75 Philosophy • 189 Pipeline diagram • 209 Plan progress figure • 193 Plan value • 195 Planned-Actual comparison • 195 Planning (strategic) • 343 Planning process • 194 Pool • 230 Position • 75 PPC • 129 Pricing • 341 Private business process • 227 Private process • 229 Privileges diagram • 347 Problem (business) • 335 Procedure
Bottom-up • 35

METHOD MANUAL
XI
Descriptive views • 3 Function tree • 15 Top-down • 35
Procedure concept • 1 Process
Costs • 189 Definition of process selection matrix •
115 Descriptive views • 3 Feedback • 193 Function tree • 15 Performance amount-induced • 62 Performance amount-neutral • 62 Prioritization • 131 Times • 189
Process and organizational structures • 341 Process and/or function deficits • 344 Process calculation • 341 Process chain
ARIS architecture • 3 Data flow • 108 EPC/PCD • 108 Event-driven • 91 Function tree • 15 Organizational structure of companies •
72 Process chain analysis • 11 Process cost management
Cost category diagram • 63 Performance scale • 63 Term • 341
Process cost rate • 341 Process customizing • 347 Process documentation • 338 Process knowledge • 338 Process management • 342 Process models • 59 Process organization • 72 Process reference model • 135 Process risks • 123 Process scenarios • 21 Process selection matrix • 115 Process type • 338 Process variants • 344 Process view
ARIS • 91 Requirements definition • 89
Process warehousing • 338 Process-oriented • 338 Product • 156 Product allocation diagram • 159 Product selection matrix • 162 Product tree • 161 Product/Service • 156 Product/Service exchange diagram • 157 Product/Service tree • 158 Production intensity • 192 Program code • 345 Program file • 27 Program flow chart • 144 Program module (definition) • 27 Program module type
Assignment to application system types • 27
Assignment to program modules • 27 Definition • 27
Programming language • 23 Project documentation
Reorganization measures • 343 Software development and
implementation • 345 Project preparation • 344 Project process chain • 129 Project structural element • 129
Q
QM documentation • 342 QM manual • 342 Quality
Assurance • 342 Control • 342 Criterion • 127 Documents • 342 Improvement • 342 Management • 342 Planning • 342 Policy • 342 Promotion • 342
Quick model • 136 Quick object • 136
R
RAD • 122 RAMS
Procedure model • 131 Requirements analysis for management
systems • 131

METHOD MANUAL
XII
Redundancy Data redundancies • 11 Duplicates • 11 Time delays • 11
Referential data integrity • 42 Reinterpreted relationship type • 35 Relation • 65 Relations diagram • 65 Relationship
Aggregating • 46 B2B • 125 B2C • 125 Complexity • 30 Existence • 30 Hierarchical • 46 Implicit • 1, 119 Referential • 46 Relationship • 30 Types • 30
Relationship complexity • 46 Relationship type
Formation • 35 Identification and existence dependency •
42 Requirements definition • 30 Types • 30 Weak • 46
Reorganization Execution • 343 Measures • 343
Report E-business scenario • 208
Reporting • 194 Requirements definition
Data view • 30 Descriptive levels • 7 Function view • 14 Organization view • 72
Requirements profile • 61 Resource
Human resource • 80 Information technology • 3 Material resource • 80 Object • 129 Record • 189 Shift calendar • 80
Resource view • 3 Result indicator • 192 Result quality • 343 Return on capital employed • 189 Risk
Process risks • 123 Risk • 123
Risk control • 123 Risk handling • 123 Risk resolution • 123
ROI • 189 Role • 122 Role allocation diagram • 122 Role assignment diagram • 122 Role diagram • 135 Role name • 30 Rule • 91 Rule diagram • 113
S
Sales revenue • 189 SAP ALE filter model • 121 SAP ALE message flow model • 121 SAP ALE message type model • 121 SAP applications • 338 SAP applications diagram • 21 SAP R/3 reference model • 21 SAP reference model • 122 SAP SERM • 46 SAP system • 344 Scenario
Definition in the process selection matrix • 115
Variants • 344 Scheduling basis • 341 SCM solution • 213 Screen design • 23, 139 Screen diagram • 148 Screen navigation • 140 Security protocol • 206 SeDaM model • 49 Semantic Generator • 136 Sequence flow • 227 SER
Approach • 46 Model • 46
Service • 156 Service allocation diagram
Cluster • 220 IT elements • 223

METHOD MANUAL
XIII
Service type • 216 Shareholder value • 189 Significance • 181 Similar entity • 30 Simulation • 338 Skill • 135 Sorting index • 70 Specialization
Completeness • 35 Disjunction • 35 Occurrences • 35
Specification • 344 Specification of application systems and
modules • 345 Staff position • 75 Standard perspective • 190 Star schema • 60 Start and end events • 91 State • 3 State change • 91 States (relevant process environment) • 3 Strategic objective • 195 Strategy
Analysis • 188 Business segment-specific • 188 Business units • 189 Competition • 187 Corporate strategy • 189 Formulation of actions • 194 Human resources development • 189 Implementation • 192 Inconsistency • 193 Information technology • 189 Innovations • 189 Learning • 193 Management process • 188 Market-oriented • 189 Objective • 195 Partial strategy • 188 Planning process • 194 Pursuit • 193 Superior • 192 Term • 195 Theoretical formulation • 194
Structural change speed • 181 Structural element • 127 Structural elements of the eERM • 50 Structuring model • 127
Generalization • 127 Specialization • 127
Subfunction • 15 Subobjective • 191 Substitution relationship • 158 Subsystem • 222 Success factor
Company documentation • 338 Definition • 22 Factors influencing success • 195 Hierarchical arrangement • 22 Interaction • 195
Synergy effect • 192 System
CRM • 213 ERP • 213 Management support • 339
System attribute domain • 68 System attributes • 68 System interface • 345 System interface development • 345 System interface models • 68
T
Table • 70 Table (specimen) • 70 Table diagram • 70 Tables and fields • 70 Target • 192 Target concept • 11 Target procedure • 11 Target time period • 195 Target value • 192, 195 Task
Access privileges • 340 Analysis phase, specification phase
(project preparation) • 344 Categorization of knowledge • 346 Certification documents • 342 Certification procedures • 342 Cost center analysis • 341 Creation of QM documentation • 342 Data structuring/Database design • 339 Database management/Access
management • 339 Description of IT processes • 345 Description of process and organizational
structures • 341 Design phase (Business Blueprint) • 344 Documentation of business objectives •
338 Documentation of company functions •
338
METHOD MANUAL
XIV
Documentation of company value added • 338
Documentation of IT infrastructure • 340 Documentation of organizational
structures • 338 Identification of IT infrastructure
requirements • 340 Knowledge map or yellow page • 346 Knowledge processing in business
processes • 346 Performing a reorganization • 343 Process calculation • 341 Process customizing of workflow
management systems • 347 Process documentation • 338 Process warehousing • 338 Reorganization measures • 343 Software development and
implementation • 345 Specification of application systems and
modules • 345 System interface development • 345
Task performer Linking functions with organization - EPC,
Function/Organizational level diagram • 89
Organizational structure of companies • 72
Task performer Organizational chart • 75 Techn. operating supply (definition) • 86 Techn. operating supply class (definition) •
86 Technical operating supply type
Definition • 86 Technical operating supply type • 116
Technical resources • 86 Technical terms model • 43 Term
Actual value • 195 Alarm limit • 195 Data source • 195 Indicator type • 195 Initiative • 195 KPI • 195 Maximum value • 195 Minimum value • 195 Perspective • 195 Plan value • 195 Strategic objective • 195 Strategy • 195 Success factor • 195 Target value • 195 Tolerance range • 195 Vision • 195
Warning limit • 195 Time interval • 80 Time reduction • 343 Tolerance range • 195 Top management • 189 Top-down approach • 192 Transaction steps • 23 Transfer structure • 124 Transformation rule • 124 Transport system (definition) • 86 Transport system class (definition) • 86 Type level • 30
U
Unified Modeling Language • 164 Uniform Resource Identifier • 56 Unit • 72 Updating frequency • 181 User groups • 340 User interface • 23 User privileges • 340 User profile • 122 Users • 340
V
Value added • 338 Value range • 65 Value-added chain • 125 Value-added chain diagram • 108 Variant • 159
Process • 344 Scenario • 344
VDA • 342 View
Breakdown • 3 Business process • 11 Definition • 65 Formation • 7 Human-oriented • 195 Physical • 70

METHOD MANUAL
XV
Virtual place • 204 Vision • 195
W
Warehouse equipment (definition) • 86 Warehouse equipment class (definition) • 86 Warning limit • 195 Weak point (problem solution) • 11 Weak point (SAP) • 344 Weak point analysis • 338 Web form • 139 Web services • 227 Work quality • 343 Workflow • 338 Workflow management systems • 347 Workflow model • 347 Workshop • 195
X
XML • 209 XML document • 125 XOR rule • 91, 129
Y
Y diagram • 20 Yellow page • 346
Z
Zone • 216