arizona state university institute of transportation ... - asu.pdf · arizona state university...
TRANSCRIPT

Arizona State University Institute of Transportation Engineers
Parking Demand and Trip Generation at Elementary Schools Final Report
For: Institute of Transportation Engineers Western District 5/27/2013

Parking Demand and Trip Generation at Elementary Schools May 27, 2013
1
INTRODUCTION
The Arizona State University student chapter of the Institute of Transportation Engineers (ASU-ITE) recently conducted a study on parking demand and trip generation at Elementary schools in the Maricopa County region. This study was undertaken to fulfill a contract between ASU-ITE and the Western District of the Institute of Transportation Engineers (WesternITE). The original proposal was made by ASU-ITE in response to an RFP administered by WesternITE. The RFP identified several land use types that were in need of updated data. The parking data collected will be used to update and improve ITE’s parking demand and trip generation manuals for the elementary school land use.
According to the U.S. Center for Disease Control and Prevention (CDC), 18% of children between ages 6 and 11 and another 18% of adolescents age 12 to 19 were obese in 2010.i The White House Task Force on Childhood Obesity, in their 2011 Report to the President, recommended the continuation and expansion of the Safe Routes to School program, as well as the encouragement of active travel modes for children’s travel between home, school, and other locations.ii These trends toward solving the problem of the childhood obesity epidemic will, if successful, help to bring about a mode shift for the journey-to-school trip for elementary school students. As such, it is important for ITE to continue to update the data on travel behavior to and from elementary schools. As travel behaviors to and from schools change, traffic conditions in the areas around those schools with also experience a shift.
The report below compares observed trip generation and parking demand from these studies to those reported in the ITE Parking Demand Trip Generation Manuals. According to the Parking Demand Manual, 3rd Edition, the average peak period parking demand is 0.28 per student at the school. This average is based on 6 school sites at which parking demand was studied. The studies took place in Norman, OK in 1992. The Trip Generation Manual, 6th Edition, provides trip generation statistics from several schools across the country between the mid-1970’s and mid-1990’s. The average daily trip generation rates reported are 13.13 trips per employee, 1.02 trips per student, 12.03 trips per 1000 sq. feet gross floor area of the school. These parking and trip rates and others are compared with the observed parking and trip rates from the ASU study herein.
In the following section of this report, the sites selected for data collection are described. The third section presents the methodology for collecting data, and the fourth section explains the results. Section five compares the findings from this study to those reported in existing ITE manuals. Finally, the report ends with some concluding remarks.
1. SITE SELECTION
The sites that were chosen for the parking demand and trip generation study were selected to meet certain criteria. They needed to be sites that were (1) located in an urban or suburban region in the Phoenix area, (2) connected to a dedicated parking lot, and (3) close enough to the university to accommodate student volunteers easily. The sites that were selected were Holdeman Elementary, Broadmor Elementary, and Scales Technology Academy, all located in the Tempe School District in

Parking Demand and Trip Generation at Elementary Schools May 27, 2013
2
Arizona. The Tempe Elementary School district consists of 19 elementary schools, all of which provide bus transportation to any student living more than 1 mile from his or her assigned elementary school. See Figures 1-3 for specific locations of each facility. At each location, data collection volunteers attempted to place themselves in or near the parking lots, where all access points and parked cars were clearly visible.
Figure 1 – Holdeman Elementary: A) Regional map of school location, B) Local map of school location, C) Microscopic view of school grounds. Holdeman Elementary is a new facility in Tempe, AZ. It is located near the corner of Priest Drive and Broadway Road, two major arterials in the area. Holdeman has three parking lots: one to the south, north, and east of the school. Employees use the north lot while visitors primarily use the south. School bus pick up and drop off takes place in the east parking lot. The school has rather large open areas for students to play during recess and after school hours, but there are no sports fields at the site that would be used for organized sports. The school is adjacent to apartment complexes to the south and east, a neighborhood of single-family homes to the north, and an office complex to the west, which
A
B C

Parking Demand and Trip Generation at Elementary Schools May 27, 2013
3
primarily consists of medical offices. The patrons of adjacent land uses did not use the Holdeman parking areas on the day of data collection. The elementary school has three access points, but the entrance on the south end of the eastern lot is roped off. Therefore, the school has only two usable access points. Both access points were visible to volunteers standing on the sidewalk at the southeast corner of the property. The school is an approximately 67.5 thousand square foot (KSF) building on a 366 KSF lot. It hosts 628 students and 74 employees with 34 classrooms.
Figure 2 – Broadmor Elementary: A) Regional map of school location, B) Local map of school location, C) Microscopic view of school grounds. Broadmor Elementary is also part of the Tempe, AZ school district. It is located near the corner of Broadway Road, a major arterial, and College Avenue, a collector street. Like Holdeman, Broadmor Elementary has a large open area for students to play, but no official sports fields. Broadmor has two parking lots: one to the south, and one to the north. Employees use the south lot while visitors primarily use the north. School bus pick up and drop off takes place in the south parking lot. The school is adjacent to a neighborhood of single-family homes on all sides, and is located very close to a middle
A
B C

Parking Demand and Trip Generation at Elementary Schools May 27, 2013
4
school into which its graduating students typically enroll. The elementary school has three access points, but the access point on the east side of the north parking lot is exit-only. Therefore, entrances can occur at two different locations while exits can occur at three. All access points were visible to volunteers standing on the sidewalk immediately west of the north parking lot. The school is an approximately 63.3 KSF building on a 381 KSF lot. It hosts 587 students and 71 employees with 32 classrooms.
Figure 3 – Scales Technology Academy: A) Regional map of school location, B) Local map of school location, C) Microscopic view of school grounds. Scales Technology Academy is part of the Tempe, AZ elementary school district. It is a public school like Holdeman and Broadmor, but this school is located in a more urban setting and is focused on
A
B
C

Parking Demand and Trip Generation at Elementary Schools May 27, 2013
5
incorporating technology into education. Although Scales places a high emphasis on technology by incorporating computers into student lessons, it does function as a typical elementary school. While Holdeman and Broadmor both have approximately 0.009 students per building square foot, Scales has approximately 0.01 students per building square foot. Otherwise, Scales operates on the same schedule and the same learning requirements as the other elementary schools in the district. It is located on 5th Street between Beck Avenue and Hardy Drive. Beck Ave. and 5th St. are both collector streets while Hardy drive is a minor arterial. Scales has two parking lots: one to the north, and one to the east. Employees use the east lot while visitors primarily use the north. School bus pick up and drop off takes place in the east parking lot. The school is adjacent to a neighborhood of apartment, condo, and townhome developments all sides, and is located very close to Arizona State University, a Hindu temple, and some small commercial spaces. The elementary school has two access points, both of which were visible to volunteers standing on the sidewalk north of the school. Scales is an approximately 64.5 KSF building on a 174 KSF lot, giving it the smallest parcel size of the three facilities selected for this study. It hosts 645 students and 80 employees with 36 classrooms.
2. DATA COLLECTION METHODOLOGY As stated in the proposed plan of study for this project, ASU-ITE collected parking and trip generation data on 3 separate weekdays (12 hours each day). Data collection dates and times are listed in Table 1. Data collection volunteers for this study were made up of members of the student chapter and students in CEE372, Introduction to Transportation Engineering. The CEE372 course was taught by Dr. Soyoung Ahn, who worked with the project’s student coordinator to make data collection a required assignment for the class. In addition, one student from the class volunteered to serve as an assistant project manager during the data collection effort in order to earn credit toward her requirements for graduation from the honors college. The student coordinator visited the CEE372 classroom on Monday, 3/4/2013 to give a presentation on how to collect data at each individual site. This was done in response to questions and confusion from volunteers during the first data collection episode at Holdeman. Table 1: Dates and Times of Data Collection Episodes Facility Date Day of Week Time Holdeman Elementary 2/27/2013 Wednesday 6:00 a.m. – 6:00 p.m. Broadmor Elementary 3/5/2013 Tuesday 6:00 a.m. – 6:00 p.m. Scales Technology Academy 3/7/2013 Thursday 6:00 a.m. – 6:00 p.m. During the 36 hours of data collection, two volunteers were placed at the site at all times. Of these two volunteers, one person – the “trip generation volunteer” – had the responsibility of recording the number of entering and exiting vehicles while the other person – the “parking demand volunteer” – had the responsibility of collecting parking demand counts every 15 minutes. In between parking demand counts, the parking demand volunteer was usually able to help the trip generation volunteer with his or her data. The trip generation volunteer counted incoming and outgoing vehicles at all access points, separating personal automobiles, school buses, commercial vehicles, pedestrians, and bicyclists. It is possible that some school visitors or employees who used non-motorized travel were not counted,

Parking Demand and Trip Generation at Elementary Schools May 27, 2013
6
however, it is unlikely that student pedestrians or cyclists were missed due to the requirement that all students enter and exit the school at designated areas. The parking demand volunteer counted the total number of vehicles parked in all parking lots at each 15-minute interval. This sometimes required the volunteer to walk to several different parking locations in order to make an accurate count. Understandably, the Tempe School District requires that any data collection taking place at a school is must first receive approval from the district superintendent. This task was completed in early February. The superintendent communicated the details of the project to each elementary school principal. While at the schools, volunteers were required to where orange vests and to have their ASU student identification with them at all times in order to distinguish themselves as participants in this study. Each school in the study has a designated drop-off and pick-up location that parents and guardians are required to use when escorting their children to or from the school. This means that during morning and evening peak times, the parking lots contained many vehicles that were stopped in the drop-off/pick-up location and not parked is a designated parking space. Parking demand volunteers included any vehicle that was stopped in the lot when they conducted their counts as part of the demand for parking. As a result, the number of parked cars could easily exceed the number of parking spaces during peak periods.
3. RESULTS The parking demand, measured as the number of vehicles parked at the facility at each 15-minute interval, and the trip generation results are reported below. After the dates for data collection had been set and arrangements made, the school district decided to make the week of March 4 through March 8 parent/teacher conference week. In order to accommodate those parent/teach conferences, every day during that week was an early dismissal day. During regular school days, Holdeman and Broadmor release students at 3:40 p.m. while Scales releases students at 3:00 p.m. During early dismissal days, students are released from Holdeman and Broadmor at 1:45 p.m. and from Scales at 1:05. The data collection at Broadmor and Scales, therefore, is slightly skewed. Afternoon peak times on a typical day should occur 2.5 hours later than they did on these dates. For this reason, the data collected at Broadmor and Scales after 12:00 pm is not reported here. Table 2 shows various size measures of each school that will be used in the following result analyses. Table 2: Various Size Measurements for each facility
Facility Land Area (KSF)
Building Size (KSF) # Students # Employees # Classrooms # Parking
Spaces Holdeman 366.0 67.7 628 74 34 118 Broadmor 381.5 63.3 587 71 32 102 Scales 173.8 64.6 645 80 36 79 Average 307.1 65.2 620 75 34 100

Parking Demand and Trip Generation at Elementary Schools May 27, 2013
7
Parking Demand Parking demand was measured every 15 minutes at these locations between 6:00 a.m. and 6:00 p.m. The demand curve at each of the data collection episodes in shown in Figure 4 (a) through (c) while the demand curves for all episodes are shown together in Figure 5. One can see clear peak periods in the morning at all facilities and in the afternoon at Holdeman. One will notice that there is some missing data at Holdeman in the afternoon and at Broadmor in the morning. This was due to some volunteer scheduling conflicts. However, at least one observation is available for every hour that data was collected. Since ITE Parking Demand data asks only for the maximum occupancy observed in each hour, the missing data in this case does not inhibit our ability to complete the parking demand report. Table 3 provides information on the peak hours, maximum vehicles, and parking ratio at each facility. Table 3: Parking Demand Summary Statistics for Typical Weekday Data
Facility Students AM Peak Hour
Vehicles in the AM Peak
AM Parking Ratio
PM Peak Hour
Vehicles in the PM Peak
PM Parking Ratio
Holdeman 628 8:00 - 9:00 66 0.105 2:30 – 3:30 84 0.134 Broadmor 587 8:30 – 9:30 86 0.147 - - - Scales 645 9:30 – 10:30 71 0.110 - - - The morning peak occupancy of all facility is within a range of 15 vehicles. This indicates that parking demand is not dependent on parking lot size. In alignment with the ITE Parking Demand manual, the parking ratio is calculated only as a factor of number of students at the facility and is shown in Table 3 above. In table 4, a detailed description of parking demand at each hour is shown as a percent of the peak parking demand. Tables like this are provided for some land uses in the ITE Parking Generation Manual, 3rd Edition, though it is not provided for the elementary school land use. Table 4: Parking Demand as Percent of Peak Period Based on Vehicles
per Student Typical Weekday
Hour Beginning Avg. Vehicles Avg. Parking Ratio Percent of Peak # Sites Included 6:00 a.m. 7 0.01 9% 3 7:00 a.m. 44 0.07 52% 3 8:00 a.m. 67 0.11 80% 3 9:00 a.m. 72 0.12 85% 3
10:00 a.m. 61 0.10 73% 3 11:00 a.m. 62 0.10 74% 3 12:00 p.m. 56 0.09 67% 1 1:00 p.m. 48 0.08 57% 1 2:00 p.m. 64 0.10 76% 1 3:00 p.m. 84 0.14 100% 1 4:00 p.m. 81 0.13 96% 1 5:00 p.m. 25 0.04 30% 1

Parking Demand and Trip Generation at Elementary Schools May 27, 2013
8
Figure 5 – Average Parking Demand Curve for Typical Weekdays
0
20
40
60
80
1006:
00
6:45
7:30
8:15
9:00
9:45
10:3
0
11:1
5
12:0
0
12:4
5
13:3
0
14:1
5
15:0
0
15:4
5
16:3
0
17:1
5
Holdemand Elementary
Total Vehicles in Lot
0
20
40
60
80
100
6:00
6:30
7:00
7:30
8:00
8:30
9:00
9:30
10:0
010
:30
11:0
011
:30
Broadmor Elementary
Total Vehicles in Lot
0
20
40
60
806:
00
6:30
7:00
7:30
8:00
8:30
9:00
9:30
10:0
0
10:3
0
11:0
0
11:3
0
Scales Technology Academy
Total Vehicles in Lot
0102030405060708090
100
Typical Weekday Parking Demand
Holdeman Broadmor Scales Average
A
B C
Figure 4 – Typical Weekday Parking Demand Curves: A) Holdeman Elementary on 2/27/13, B) Broadmor Elementary on 3/5/13, C) Scales Technology Academy on 3/7/13.
Parking Demand and Trip Generation at Elementary Schools May 27, 2013
9
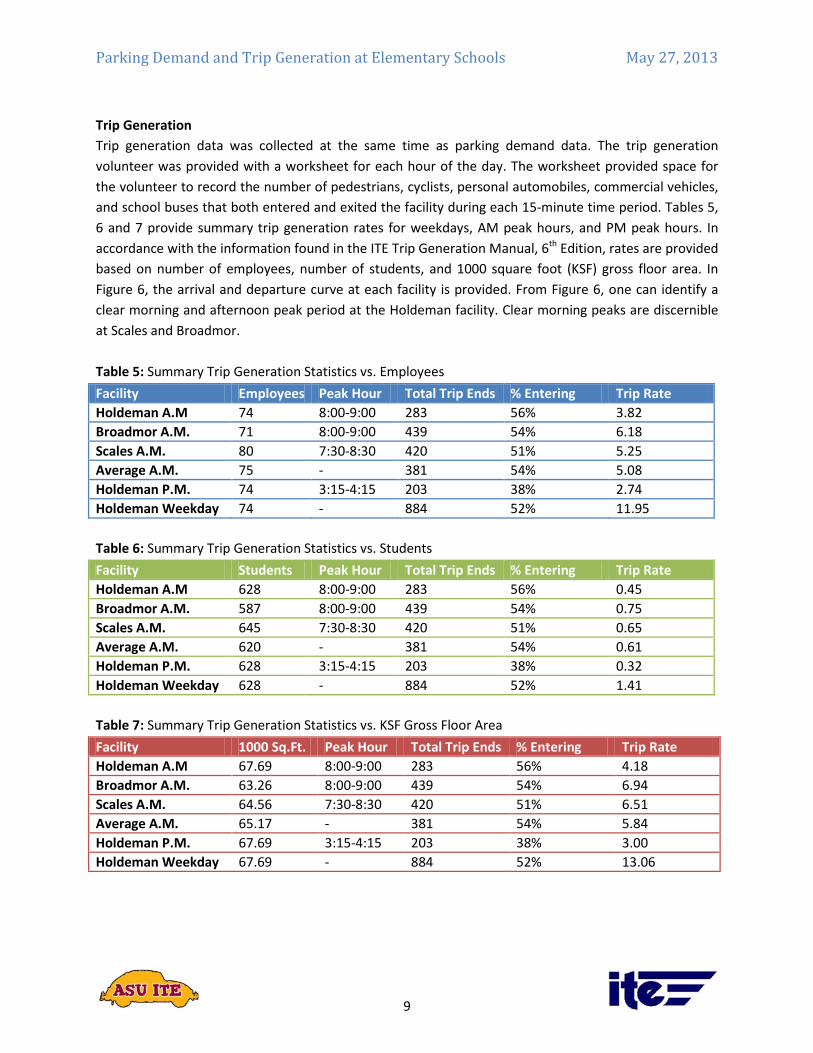
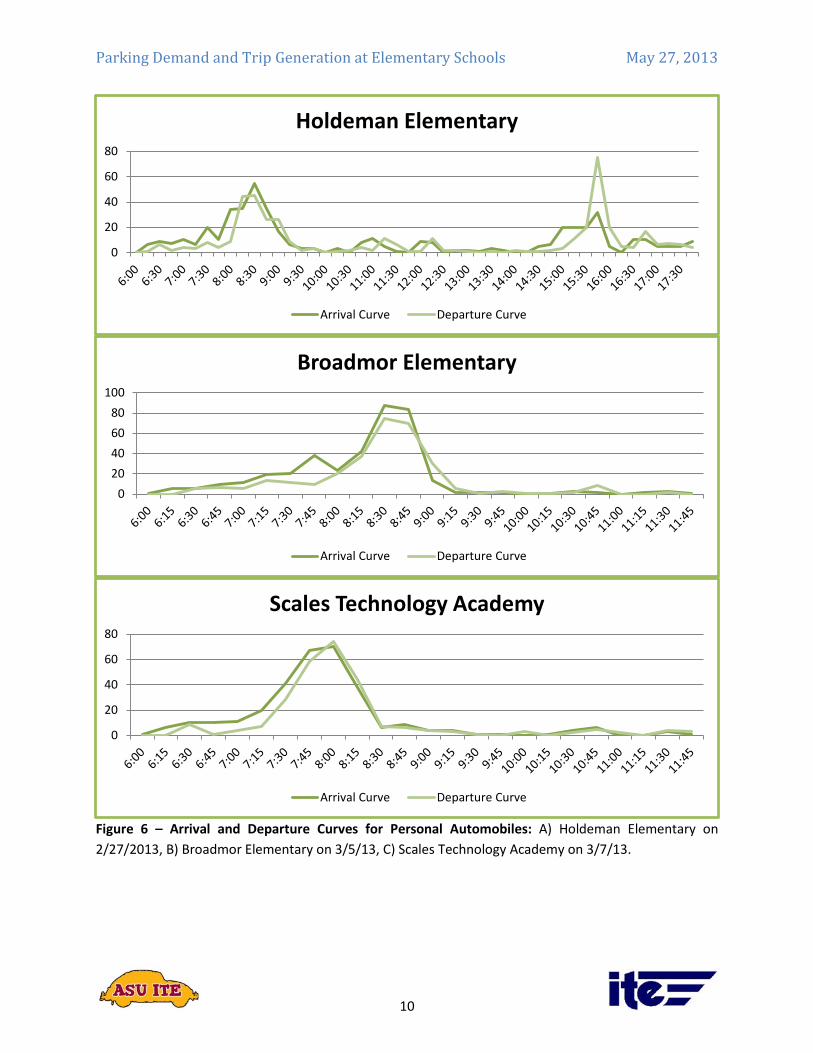
Trip Generation Trip generation data was collected at the same time as parking demand data. The trip generation volunteer was provided with a worksheet for each hour of the day. The worksheet provided space for the volunteer to record the number of pedestrians, cyclists, personal automobiles, commercial vehicles, and school buses that both entered and exited the facility during each 15-minute time period. Tables 5, 6 and 7 provide summary trip generation rates for weekdays, AM peak hours, and PM peak hours. In accordance with the information found in the ITE Trip Generation Manual, 6th Edition, rates are provided based on number of employees, number of students, and 1000 square foot (KSF) gross floor area. In Figure 6, the arrival and departure curve at each facility is provided. From Figure 6, one can identify a clear morning and afternoon peak period at the Holdeman facility. Clear morning peaks are discernible at Scales and Broadmor. Table 5: Summary Trip Generation Statistics vs. Employees Facility Employees Peak Hour Total Trip Ends % Entering Trip Rate Holdeman A.M 74 8:00-9:00 283 56% 3.82 Broadmor A.M. 71 8:00-9:00 439 54% 6.18 Scales A.M. 80 7:30-8:30 420 51% 5.25 Average A.M. 75 - 381 54% 5.08 Holdeman P.M. 74 3:15-4:15 203 38% 2.74 Holdeman Weekday 74 - 884 52% 11.95 Table 6: Summary Trip Generation Statistics vs. Students Facility Students Peak Hour Total Trip Ends % Entering Trip Rate Holdeman A.M 628 8:00-9:00 283 56% 0.45 Broadmor A.M. 587 8:00-9:00 439 54% 0.75 Scales A.M. 645 7:30-8:30 420 51% 0.65 Average A.M. 620 - 381 54% 0.61 Holdeman P.M. 628 3:15-4:15 203 38% 0.32 Holdeman Weekday 628 - 884 52% 1.41 Table 7: Summary Trip Generation Statistics vs. KSF Gross Floor Area Facility 1000 Sq.Ft. Peak Hour Total Trip Ends % Entering Trip Rate Holdeman A.M 67.69 8:00-9:00 283 56% 4.18 Broadmor A.M. 63.26 8:00-9:00 439 54% 6.94 Scales A.M. 64.56 7:30-8:30 420 51% 6.51 Average A.M. 65.17 - 381 54% 5.84 Holdeman P.M. 67.69 3:15-4:15 203 38% 3.00 Holdeman Weekday 67.69 - 884 52% 13.06
Parking Demand and Trip Generation at Elementary Schools May 27, 2013
10
Figure 6 – Arrival and Departure Curves for Personal Automobiles: A) Holdeman Elementary on 2/27/2013, B) Broadmor Elementary on 3/5/13, C) Scales Technology Academy on 3/7/13.
0
20
40
60
80
Holdeman Elementary
Arrival Curve Departure Curve
020406080
100
Broadmor Elementary
Arrival Curve Departure Curve
0
20
40
60
80
Scales Technology Academy
Arrival Curve Departure Curve

Parking Demand and Trip Generation at Elementary Schools May 27, 2013
11
4. COMPARISON: ASU DATA AND ITE MANUALS ITE land use number 520, elementary schools, is described in the ITE Parking Generation Manual, 3rd Edition, as servicing students in Kindergarten through 5th or 6th grade. The average peak period parking demand reported is 0.28 vehicles per student. The schools from which this metric is derived have an average student population of 520 and are all located in Norman, OK. The peak period reported, 3:00 – 4:00, lines up perfectly with the peak period from this study, as seen in Table 4. The average peak period parking demand calculated here, however, is only 0.14 vehicles per student, exactly half of that reported in the manual, even though the average student population from these three schools is higher at 620. The reason for this difference is most likely due to the differences between Norman, OK and Tempe, AZ. Norman is a suburban city located approximately 20 miles south of Oklahoma City with a population density of 629 people per sq. mile.iii Tempe, AZ, in comparison is a suburban city located approximately 13 miles southeast of Phoenix with a population density of 4044 people per sq. mile.iv With a population density more than 5 times that of Norman, it is reasonable that a great deal more students in Tempe will bus, bike, or walk to elementary school. This is most likely the cause of the much smaller parking demand found in this study as compared to that reported in the ITE Parking Generation Manual, 3rd Edition. The ITE Trip Generation Manual, 6th Edition, provides an overview of elementary school trips from a significant variation of school facilities and locations. Table 8 provides a comparison of trip generation rates in the manual and generation rates calculated from this study. In the table, “Manual Rate” refers to the trip rate reported in the ITE manual while “Calculated Rate” refers to the trip rate calculated from data collected in this study. The percent difference in the table is calculated as:
%𝐷𝑖𝑓𝑓 = 𝑀𝑎𝑛𝑢𝑎𝑙 𝑅𝑎𝑡𝑒 − 𝐶𝑎𝑙𝑐𝑢𝑙𝑎𝑡𝑒𝑑 𝑅𝑎𝑡𝑒
𝑀𝑎𝑛𝑢𝑎𝑙 𝑅𝑎𝑡𝑒× 100%
Therefore, any negative percent difference indicates that the calculated rate is greater than the manual rate. One can see that the majority of the calculated rates are less than the manual rates. All of the calculated rates, however, are firmly in the ranges of rates reported in the manual. It is likely that the relatively high density in Tempe contributes to a lower than average auto trip rate. Table 8: ITE Manual vs. ASU Study: Trip Generation Rates
Manual Rate Manual Range Calculated Rate % Difference
By Employees
Weekday 13.3 4.47 – 26.37 11.95 10% AM Peak 3.71 1.22 – 7.59 5.08 -37% PM Peak 3.50 1.03 – 10.28 2.74 22%
By Students
Weekday 1.02 0.45 – 2.12 1.41 -38% AM Peak 0.30 0.11 – 0.71 0.61 -103% PM Peak 0.26 0.09 – 0.90 0.32 -23%
By KSF Gross
Floor Area
Weekday 12.03 4.69 – 30.15 13.06 -9% AM Peak 3.36 1.33 – 7.38 5.84 -74% PM Peak 3.12 0.94 – 6.06 3.00 4%

Parking Demand and Trip Generation at Elementary Schools May 27, 2013
12
5. DISCUSSION
The ITE Student Chapter at Arizona State University has completed a thorough parking demand and trip generation study at elementary schools, land use 520, in the Tempe School District of Arizona. The sites selected for this study were located in northern Tempe near Arizona State University and each had multiple parking areas and access points. Schools close to ASU were chosen in order to facilitate the ease of access to the site by ASU student volunteers, who often did not have cars available during the day. Each facility is located close to public transit and is easily accessible from the university by bicycle. Information on school size was gathered from a combination of the school district website, the Maricopa County Assessor’s website, and the school officials themselves. Parking demand was recorded as the number of vehicles parked in every lot, even if the vehicles were not in designated parking spaces, but rather in the pick-up/drop-off location. Parking demand includes buses and commercial vehicles as well as personal automobiles. Volunteers observed a great deal of personal autos in the lots just before and after the start of school at Holdeman and Broadmor, to the point of creating traffic jams in the parking lots. At Scales, which is located in a slightly more urbanized neighborhood, a great deal more pedestrians were observed. Trip generation was recorded as the number of vehicles entering and exiting the site during each 15-minute time period. Entrances and exits were recorded separately for pedestrians, bicyclists, personal autos, commercial vehicles, and school buses. Though this report deals only with personal vehicle trips, trips made by other vehicle types are included on the ITE Trip Generation reporting documents, which are attached. i Center for Disease Control and Prevention (2/19/2013) Adolescent and School Health: Childhood Obesity Facts. Available online at http://www.cdc.gov/healthyyouth/obesity/facts.htm ii White House Task Force on Childhood Obesity (May 2010) Solving the Problem of Childhood Obesity within a Generation, Chapter 5, Section C, pp 78-82. Available online at http://www.letsmove.gov/sites/letsmove.gov/files/TaskForce_on_Childhood_Obesity_May2010_FullReport.pdf iii Norman, Oklahoma on City-Data.com, Available online at http://www.city-data.com/city/Norman-Oklahoma.html iv Tempe, Arizona on City-Data.com, Available online at http://www.city-data.com/city/Tempe-Arizona.html

Parking Demand Survey FormInstitute of Transportation Engineers(fill in all highlighted cells - * are required data)
Land Use Code* 520
Name of Site Holdeman Elementary School
Brief Description of Site
Transit* Yes Public elementary school abutting an arterial, area northeast of the site is residential
Area* SUB City Tempe
TMP* No State Arizona Country United States
Parking Price* -$ $ Hourly Rate
Site Size*365953 sqft Units* 34 classroomsOccupancy* 628 students
Site Size building: 67686 sqft Units Occupancy 74 employees
Site Size Units Occupancy
Site Size Units Occupancy
Number of Parking Spaces Provided at Site 118
Highest Observed Parking Demand for the following hours of the day (hour beginning)*
Date 2/27/2013
Day Wednesday
12 Mid
1:00 AM
2:00 AM
3:00 AM
4:00 AM
5:00 AM
6:00 AM 7
7:00 AM 35
8:00 AM 66
9:00 AM 63
10:00 AM 49
11:00 AM 60
12 Noon 56
1:00 PM 48
2:00 PM 64
3:00 PM 84
4:00 PM 81
5:00 PM 25
6:00 PM
7:00 PM
8:00 PM
9:00 PM
10:00 PM
11:00 PM
Person Ellie Volosin Organization ITE-ASU
Phone
Fax
Email [email protected]
Notes
Enter data on the web at www.ite.org Comments to: [email protected]
IF not entered on web site, please mail to:
Institute of Transportation Engineers, 1627 Eye Street, NW Suite 600; Washington, DC 20006
Form version 1.4
Land Use

Parking Demand Survey FormInstitute of Transportation Engineers(fill in all highlighted cells - * are required data)
Land Use Code* 520
Name of Site Broadmor Elementary School
Brief Description of Site
Transit* Yes Public elementary school in an all residential area
Area* SUB City Tempe
TMP* No State Arizona Country United States
Parking Price* -$ $ Hourly Rate
Site Size*381452 sqft Units* 32 classroomsOccupancy* 587 students
Site Size building: 63255 sqft Units Occupancy 71 employees
Site Size Units Occupancy
Site Size Units Occupancy
Number of Parking Spaces Provided at Site 102
Highest Observed Parking Demand for the following hours of the day (hour beginning)*
Date 3/5/2013
Day Tuesday
12 Mid
1:00 AM
2:00 AM
3:00 AM
4:00 AM
5:00 AM
6:00 AM 7
7:00 AM 13
8:00 AM 75
9:00 AM 86
10:00 AM 66
11:00 AM 62
12 Noon 63
1:00 PM 106
2:00 PM 103
3:00 PM 97
4:00 PM 92
5:00 PM 72
6:00 PM
7:00 PM
8:00 PM
9:00 PM
10:00 PM
11:00 PM
Person Ellie Volosin Organization ITE-ASU
Phone
Fax
Email [email protected]
Notes
Enter data on the web at www.ite.org Comments to: [email protected]
IF not entered on web site, please mail to:
Institute of Transportation Engineers, 1627 Eye Street, NW Suite 600; Washington, DC 20006
Form version 1.4
Land Use
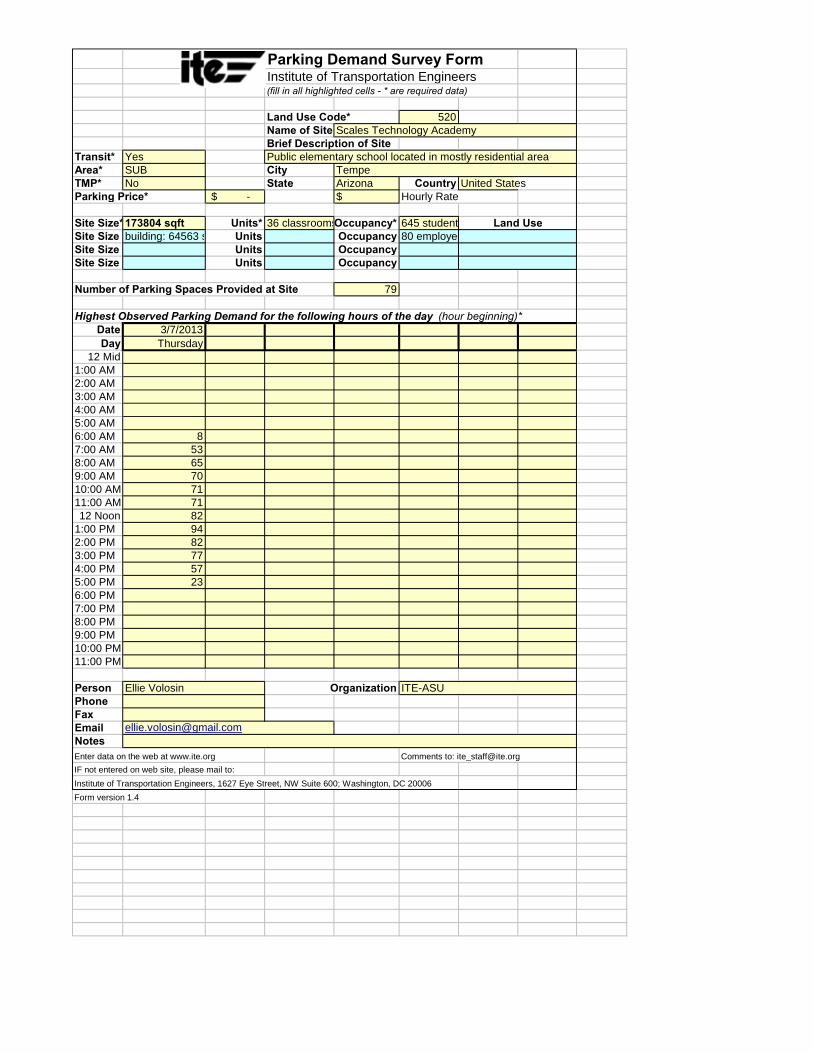
Parking Demand Survey FormInstitute of Transportation Engineers(fill in all highlighted cells - * are required data)
Land Use Code* 520
Name of Site Scales Technology Academy
Brief Description of Site
Transit* Yes Public elementary school located in mostly residential area
Area* SUB City Tempe
TMP* No State Arizona Country United States
Parking Price* -$ $ Hourly Rate
Site Size*173804 sqft Units* 36 classroomsOccupancy* 645 students
Site Size building: 64563 sqft Units Occupancy 80 employees
Site Size Units Occupancy
Site Size Units Occupancy
Number of Parking Spaces Provided at Site 79
Highest Observed Parking Demand for the following hours of the day (hour beginning)*
Date 3/7/2013
Day Thursday
12 Mid
1:00 AM
2:00 AM
3:00 AM
4:00 AM
5:00 AM
6:00 AM 8
7:00 AM 53
8:00 AM 65
9:00 AM 70
10:00 AM 71
11:00 AM 71
12 Noon 82
1:00 PM 94
2:00 PM 82
3:00 PM 77
4:00 PM 57
5:00 PM 23
6:00 PM
7:00 PM
8:00 PM
9:00 PM
10:00 PM
11:00 PM
Person Ellie Volosin Organization ITE-ASU
Phone
Fax
Email [email protected]
Notes
Enter data on the web at www.ite.org Comments to: [email protected]
IF not entered on web site, please mail to:
Institute of Transportation Engineers, 1627 Eye Street, NW Suite 600; Washington, DC 20006
Form version 1.4
Land Use

Lan
d U
se/B
uild
ing
Type
:1 IT
E L
and
Use
Cod
e:
Sou
rce:
S
ourc
e N
o. (
ITE
use
onl
y):
Nam
e of
Dev
elop
men
t: D
ay o
f the
Wee
k:
City
: S
tate
/Pro
vinc
e:
Zip/
Pos
tal C
ode:
D
ay:
Mon
th:
Year
:
Cou
ntry
: M
etro
polit
an A
rea:
Inst
itute
of
Tra
nspo
rtat
ion
Eng
inee
rs
Tri
p G
en
era
tio
n D
ata
Fo
rm (
Part
1)
1. F
or
fast
-fo
od
lan
d u
se,
ple
ase
spec
ify
if h
amb
urg
er-
or
no
nh
amb
urg
er-b
ased
.
2. D
efin
ition
s fo
r se
vera
l ind
epen
dent
var
iabl
es c
an b
e fo
und
in t
he T
rip
Gen
erat
ion,
Sec
ond
Edi
tion,
Use
r’s
Gui
de G
loss
ary.
3. P
leas
e pr
ovid
e al
l per
tinen
t in
form
atio
n to
des
crib
e th
e su
bjec
t pr
ojec
t, in
clud
ing
the
pres
ence
of
bicy
cle/
pede
stri
an f
acili
ties.
To
repo
rt b
icyc
le/p
edes
tria
n vo
lum
es, p
leas
e re
fer
to P
art
4 of
thi
s da
ta f
orm
.
Oth
er D
ata:
V
ehic
le O
ccup
ancy
(#)
:
____
__ A
.M.
____
__ P
.M.
P
erce
nt b
y Tr
ansi
t:
____
__ A
.M. %
___
___
P.M
. %
P
erce
nt b
y C
arpo
ol/V
anpo
ol:
__
____
A.M
. % _
____
_ P.
M. %
Tran
spor
tatio
n D
eman
d M
anag
emen
t (TD
M)
Info
rmat
ion:
At t
he ti
me
of th
is s
tudy
, was
ther
e a
TDM
pro
gram
(th
at m
ay h
ave
impa
cted
the
trip
gene
ratio
n ch
arac
teris
tics
of th
is s
ite)
unde
rway
?
N
o
Y
es (
If ye
s, p
leas
e ch
eck
appr
opria
te b
ox/b
oxes
, des
crib
e th
e na
ture
of t
he T
DM
pro
gram
(s)
and
prov
ide
a so
urce
for
any
stud
ies
that
m
ay h
elp
quan
tify
this
impa
ct. A
ttach
add
ition
al s
heet
s if
nece
ssar
y)
(
1) T
rans
it S
ervi
ce
(
5) E
mpl
oyer
Sup
port
Mea
sure
s
(9
) Tol
ls a
nd C
onge
stio
n P
ricin
g
(
2) C
arpo
ol P
rogr
ams
(
6) P
refe
rent
ial H
OV
Tre
atm
ents
(10
) Va
riabl
e W
ork
Hou
rs/C
ompr
esse
d W
ork
Wee
ks
(
3) V
anpo
ol P
rogr
ams
(
7) T
rans
it an
d R
ides
harin
g In
cent
ives
(11
) Tel
ecom
mut
ing
(
4) B
icyc
le/P
edes
trian
(8)
Par
king
Sup
ply
and
Pric
ing
(
12)
Oth
er _
____
____
____
____
____
____
____
____
Fa
cilit
ies
and
Site
Man
agem
ent
____
____
____
____
____
____
____
____
____
____
____
Im
prov
emen
ts
Plea
se C
ompl
ete
Form
on
Oth
er S
ide
Loca
tion
With
in A
rea:
D
etai
led
Des
crip
tion
of D
evel
opm
ent:3
(
1) C
BD
(3)
Sub
urba
n (N
on-C
BD
)
(5)
Rur
al
(
2) U
rban
(N
on-C
BD
)
(4)
Sub
urba
n C
BD
(6)
Fre
eway
Inte
rcha
nge
Are
a (R
ural
)
(7)
Not
Giv
en
Inde
pend
ent V
aria
ble:
(in
clud
e da
ta fo
r as
man
y as
pos
sibl
e)2
Act
ual
Est
imat
ed
A
ctua
l E
stim
ated
____
__ (
1) E
mpl
oyee
s (#
)
__
____
(9)
Par
king
Spa
ces
(% o
ccup
ied:
___
____
)
____
__ (
2) P
erso
ns (
#)
____
__ (
10)
Bed
s (%
occ
upie
d: _
____
____
____
___)
____
__ (
3) T
otal
Uni
ts (
#) (
indi
cate
uni
t:___
____
____
___)
__
____
(11
) S
eats
(#)
____
__ (
4) O
ccup
ied
Uni
ts (
#) (
indi
cate
uni
t:___
____
___)
__
____
(12
) S
ervi
cing
Pos
ition
s/Ve
hicl
e Fu
elin
g
____
__ (
5) G
ross
Flo
or A
rea
(gro
ss s
q. ft
.)
P
ositi
ons
(%
of d
evel
opm
ent o
ccup
ied
____
____
____
___)
__
____
(13
) S
hopp
ing
Cen
ter
% O
ut-p
arce
ls/p
ads
____
__ (
6) N
et R
enta
ble
Are
a (s
q. ft
.)
__
____
(14
) A
.M. P
eak
Hou
r Vol
ume
of A
djac
ent S
treet
Tra
ffic
____
__ (
7) G
ross
Lea
sabl
e A
rea
(sq.
ft.)
____
__ (
15)
P.M
. Pea
k H
our V
olum
e of
Adj
acen
t Stre
et T
raffi
c
(%
of d
evel
opm
ent o
ccup
ied
____
____
____
___)
__
____
(16
) O
ther
___
____
____
____
____
____
____
__
____
__ (
8) T
otal
Acr
es (
% d
evel
oped
: ___
____
____
____
)
____
__ (
17)
Oth
er _
____
____
____
____
____
____
____
____
_ 24
-hou
r %
____
_ 24
-hou
r %
____
_ 24
-hou
r %
Em
ploy
ees
by S
hift:
Firs
t Shi
ft:
Tim
e __
____
Ti
me
____
__
Em
ploy
ees
(#)
____
__
Sec
ond
Shi
ft:
Tim
e __
____
Ti
me
____
__
Em
ploy
ees
(#)
____
__
Third
Shi
ft:
Tim
e __
____
Ti
me
____
__
Em
ploy
ees
(#)
____
__
Par
king
Cos
t on
Site
: H
ourly
___
__
Dai
ly _
____
Sta
rt
End
Sta
rt
End
Sta
rt
End

A
vera
ge W
eekd
ay (
M-F
) S
atur
day
Sun
day
E
nter
E
xit
Tota
l E
nter
E
xit
Tota
l E
nter
E
xit
Tota
l
A
ll Tr
ucks
A
ll Tr
ucks
A
ll Tr
ucks
A
ll Tr
ucks
A
ll Tr
ucks
A
ll Tr
ucks
A
ll Tr
ucks
A
ll Tr
ucks
A
ll Tr
ucks
24-H
our V
olum
eA
.M. P
eak
Hou
r of A
djac
ent1
Stre
et T
raffi
c (7
– 9
)Ti
me
(ex.
: 7:1
5 -
8:15
):P.
M. P
eak
Hou
r of
Adj
acen
t1 S
treet
Tra
ffic
(4 –
6)
Tim
e:A
.M. P
eak
Hou
r G
ener
ator
2
Tim
e:P.
M. P
eak
Hou
r G
ener
ator
2 Ti
me:
Pea
k H
our
Gen
erat
or3
Tim
e (W
eeke
nd):
Inst
itute
of
Tra
nspo
rtat
ion
Eng
inee
rs
Tri
p G
en
era
tio
n D
ata
Fo
rm (
Part
2)
Sum
mar
y of
Dri
vew
ay V
olum
es
(All
= A
ll V
ehic
les
Cou
nted
, Inc
ludi
ng T
ruck
s; T
ruck
s =
Hea
vy D
uty
Truc
ks a
nd B
uses
)
Sur
vey
cond
ucte
d by
: N
ame:
___
____
____
____
____
____
____
____
____
____
____
____
____
____
____
____
____
____
____
____
____
____
____
____
____
____
Org
aniz
atio
n: __
____
____
____
____
____
____
____
____
____
____
____
____
____
____
____
____
____
____
____
____
____
____
____
____
Add
ress
: ___
____
____
____
____
____
____
____
____
____
____
____
____
____
____
____
____
____
____
____
____
____
____
____
____
__
City
/Sta
te/Z
ip: _
____
____
____
____
____
____
____
____
____
____
____
____
____
____
____
____
____
____
____
____
____
____
____
____
Te
leph
one
#:__
____
____
____
____
____
____
___
Fax
#:__
____
____
____
____
____
____
___
E-m
ail:_
____
____
____
____
____
____
____
_
Ple
ase
retu
rn to
: In
stitu
te o
f Tra
nspo
rtatio
n E
ngin
eers
Te
chni
cal P
roje
cts
Div
isio
n
1627
Eye
Stre
et, N
W, S
uite
600
W
ashi
ngto
n, D
C 2
0006
US
A
Te
leph
one:
+1
202-
785-
0060
Fa
x: +
1 20
2-78
5-06
09
ITE
on
the
Web
: ww
w.it
e.or
g
A.M
. Per
iod
Ent
er
Exi
t To
tal
Mid
-Day
Per
iod
Ent
er
Exi
t To
tal
P.M
. Per
iod
Ent
er
Exi
t To
tal
A
ll Tr
ucks
A
ll Tr
ucks
A
ll Tr
ucks
A
ll Tr
ucks
A
ll Tr
ucks
A
ll Tr
ucks
A
ll Tr
ucks
A
ll Tr
ucks
A
ll Tr
ucks
6:00
-7:0
0
11:0
0-12
:00
3:00
-4:0
06:
15-7
:15
11:1
5-12
:15
3:15
-4:1
5
6:
30-7
:30
11:3
0-12
:30
3:30
-4:3
06:
45-7
:45
11:4
5-12
:45
3:45
-4:4
57:
00-8
:00
12:0
0-1:
00
4:00
-5:0
07:
15-8
:15
12:1
5-1:
15
4:15
-5:1
57:
30-8
:30
12:3
0-1:
30
4:30
-5:3
07:
45-8
:45
12:4
5-1:
45
4:45
-5:4
58:
00-9
:00
1:00
-2:0
0 5:
00-6
:00
1. H
ighe
st h
ourly
vol
ume
betw
een
7 a.
m. a
nd 9
a.m
. (4
p.m
. and
6 p
.m.).
Ple
ase
spec
ify th
e pe
ak h
our.
2. H
ighe
st h
ourly
vol
ume
durin
g th
e a.
m. o
r p.m
. per
iod.
Ple
ase
spec
ify th
e pe
ak h
our.
3. H
ighe
st h
ourly
vol
ume
durin
g th
e en
tire
day.
Ple
ase
spec
ify th
e pe
ak h
our.
Plea
se re
fer t
o th
e T
rip
Gen
erat
ion
Use
r’s
Gu
ide
for f
ull d
efin
ition
of t
erm
s.
Hou
rly
Dri
vew
ay V
olum
es- A
vera
ge W
eekd
ay (
M-F
)
qC
heck
if P
art 3
, 4 a
nd/o
r add
ition
al in
form
atio
n is
atta
ched
.
A.M. Period Enter Exit Total P.M. Period Enter Exit Total
All Trucks All Trucks All Trucks All Trucks All Trucks All Trucks12:00-12:15 12:00-12:1512:15-12:30 12:15-12:3012:30-12:45 12:30-12:4512:45-1:00 12:45-1:001:00-1:15 1:00-1:151:15-1:30 1:15-1:301:30-1:45 1:30-1:451:45-2:00 1:45-2:002:00-2:15 2:00-2:152:15-2:30 2:15-2:302:30-2:45 2:30-2:452:45-3:00 2:45-3:00 3:00-3:15 3:00-3:153:15-3:30 3:15-3:303:30-3:45 3:30-3:45 3:45-4:00 3:45-4:004:00-4:15 4:00-4:154:15-4:30 4:15-4:304:30-4:45 4:30-4:454:45-5:00 4:45-5:005:00-5:15 5:00-5:155:15-5:30 5:15-5:305:30-5:45 5:30-5:455:45-6:00 5:45-6:006:00-6:15 6:00-6:156:15-6:30 6:15-6:306:30-6:45 6:30-6:456:45-7:00 6:45-7:007:00-7:15 7:00-7:157:15-7:30 7:15-7:307:30-7:45 7:30-7:457:45-8:00 7:45-8:008:00-8:15 8:00-8:158:15-8:30 8:15-8:308:30-8:45 8:30-8:458:45-9:00 8:45-9:009:00-9:15 9:00-9:159:15-9:30 9:15-9:309:30-9:45 9:30-9:459:45-10:00 9:45-10:0010:00-10:15 10:00-10:1510:15-10:30 10:15-10:3010:30-10:45 10:30-10:4510:45-11:00 10:45-11:0011:00-11:15 11:00-11:1511:15-11:30 11:15-11:3011:30-11:45 11:30-11:4511:45-12:00 11:45-12:00
Institute of Transportation Engineers
Trip Generation Data Form (Part 3)Name/Organization: City/State:
Telephone Number:
Detailed Driveway Volumes: Attach this sheet to Parts 1 and 2 if you are providing additional information.
Day of the week: (All = All Vehicles Counted, Including Trucks; Trucks = Heavy Duty Trucks and Buses)

A
vera
ge W
eekd
ay (
M-F
) S
atur
day
Sun
day
E
nter
E
xit
Tota
l E
nter
E
xit
Tota
l E
nter
E
xit
Tota
l
24-H
our V
olum
eA
.M. P
eak
Hou
r of A
djac
ent1
Stre
et T
raffi
c (7
– 9
)Ti
me
(ex.
: 7:1
5 -
8:15
):P.
M. P
eak
Hou
r of
Adj
acen
t1 S
treet
Tra
ffic
(4 –
6)
Tim
e:A
.M. P
eak
Hou
r G
ener
ator
2
Tim
e:P.
M. P
eak
Hou
r G
ener
ator
2 Ti
me:
Pea
k H
our
Gen
erat
or3
Tim
e (W
eeke
nd):
Inst
itute
of
Tra
nspo
rtat
ion
Eng
inee
rs
Tri
p G
en
era
tio
n D
ata
Fo
rm (
Part
4)
Sur
vey
cond
ucte
d by
: N
ame:
___
____
____
____
____
____
____
____
____
____
____
____
____
____
____
____
____
____
____
____
____
____
____
____
____
____
Org
aniz
atio
n: __
____
____
____
____
____
____
____
____
____
____
____
____
____
____
____
____
____
____
____
____
____
____
____
____
Add
ress
: ___
____
____
____
____
____
____
____
____
____
____
____
____
____
____
____
____
____
____
____
____
____
____
____
____
__
City
/Sta
te/Z
ip: _
____
____
____
____
____
____
____
____
____
____
____
____
____
____
____
____
____
____
____
____
____
____
____
____
Te
leph
one
#:__
____
____
____
____
____
____
___
Fax
#:__
____
____
____
____
____
____
___
E-m
ail:_
____
____
____
____
____
____
____
_
Ple
ase
retu
rn to
: In
stitu
te o
f Tra
nspo
rtatio
n E
ngin
eers
Te
chni
cal P
roje
cts
Div
isio
n
1627
Eye
Stre
et, N
W, S
uite
600
W
ashi
ngto
n, D
C 2
0006
US
A
Te
leph
one:
+1
202-
785-
0060
Fa
x: +
1 20
2-78
5-06
09
ITE
on
the
Web
: ww
w.it
e.or
g
1. H
ighe
st h
ourly
vol
ume
betw
een
7 a.
m. a
nd 9
a.m
. (4
p.m
. and
6 p
.m.)
as d
efin
ed in
Trip
Gen
erat
ion
Dat
a Fo
rm (P
art 2
). Pl
ease
spe
cify
the
peak
hou
r.2. H
ighe
st h
ourly
vol
ume
durin
g th
e a.
m. o
r p.m
. per
iod.
Ple
ase
spec
ify th
e pe
ak h
our.
3. H
ighe
st h
ourly
vol
ume
durin
g th
e en
tire
day.
Ple
ase
spec
ify th
e pe
ak h
our.
Plea
se a
ttach
sup
plem
enta
l hou
rly v
olum
es.
Plea
se re
fer t
o th
e T
rip
Gen
erat
ion
Use
r’s
Gu
ide
for f
ull d
efin
ition
of t
erm
s.
Sum
mar
y of
Ped
estr
ian
Vol
umes
Sum
mar
y of
Bic
ycle
Vol
umes
A
vera
ge W
eekd
ay (
M-F
) S
atur
day
Sun
day
E
nter
E
xit
Tota
l E
nter
E
xit
Tota
l E
nter
E
xit
Tota
l
24-H
our V
olum
eA
.M. P
eak
Hou
r of A
djac
ent1
Stre
et T
raffi
c (7
– 9
)Ti
me
(ex.
: 7:1
5 -
8:15
):P.
M. P
eak
Hou
r of
Adj
acen
t1 S
treet
Tra
ffic
(4 –
6)
Tim
e:A
.M. P
eak
Hou
r G
ener
ator
2
Tim
e:P.
M. P
eak
Hou
r G
ener
ator
2 Ti
me:
Pea
k H
our
Gen
erat
or3
Tim
e (W
eeke
nd):

Lan
d U
se/B
uild
ing
Type
:1 IT
E L
and
Use
Cod
e:
Sou
rce:
S
ourc
e N
o. (
ITE
use
onl
y):
Nam
e of
Dev
elop
men
t: D
ay o
f the
Wee
k:
City
: S
tate
/Pro
vinc
e:
Zip/
Pos
tal C
ode:
D
ay:
Mon
th:
Year
:
Cou
ntry
: M
etro
polit
an A
rea:
Inst
itute
of
Tra
nspo
rtat
ion
Eng
inee
rs
Tri
p G
en
era
tio
n D
ata
Fo
rm (
Part
1)
1. F
or
fast
-fo
od
lan
d u
se,
ple
ase
spec
ify
if h
amb
urg
er-
or
no
nh
amb
urg
er-b
ased
.
2. D
efin
ition
s fo
r se
vera
l ind
epen
dent
var
iabl
es c
an b
e fo
und
in t
he T
rip
Gen
erat
ion,
Sec
ond
Edi
tion,
Use
r’s
Gui
de G
loss
ary.
3. P
leas
e pr
ovid
e al
l per
tinen
t in
form
atio
n to
des
crib
e th
e su
bjec
t pr
ojec
t, in
clud
ing
the
pres
ence
of
bicy
cle/
pede
stri
an f
acili
ties.
To
repo
rt b
icyc
le/p
edes
tria
n vo
lum
es, p
leas
e re
fer
to P
art
4 of
thi
s da
ta f
orm
.
Oth
er D
ata:
V
ehic
le O
ccup
ancy
(#)
:
____
__ A
.M.
____
__ P
.M.
P
erce
nt b
y Tr
ansi
t:
____
__ A
.M. %
___
___
P.M
. %
P
erce
nt b
y C
arpo
ol/V
anpo
ol:
__
____
A.M
. % _
____
_ P.
M. %
Tran
spor
tatio
n D
eman
d M
anag
emen
t (TD
M)
Info
rmat
ion:
At t
he ti
me
of th
is s
tudy
, was
ther
e a
TDM
pro
gram
(th
at m
ay h
ave
impa
cted
the
trip
gene
ratio
n ch
arac
teris
tics
of th
is s
ite)
unde
rway
?
N
o
Y
es (
If ye
s, p
leas
e ch
eck
appr
opria
te b
ox/b
oxes
, des
crib
e th
e na
ture
of t
he T
DM
pro
gram
(s)
and
prov
ide
a so
urce
for
any
stud
ies
that
m
ay h
elp
quan
tify
this
impa
ct. A
ttach
add
ition
al s
heet
s if
nece
ssar
y)
(
1) T
rans
it S
ervi
ce
(
5) E
mpl
oyer
Sup
port
Mea
sure
s
(9
) Tol
ls a
nd C
onge
stio
n P
ricin
g
(
2) C
arpo
ol P
rogr
ams
(
6) P
refe
rent
ial H
OV
Tre
atm
ents
(10
) Va
riabl
e W
ork
Hou
rs/C
ompr
esse
d W
ork
Wee
ks
(
3) V
anpo
ol P
rogr
ams
(
7) T
rans
it an
d R
ides
harin
g In
cent
ives
(11
) Tel
ecom
mut
ing
(
4) B
icyc
le/P
edes
trian
(8)
Par
king
Sup
ply
and
Pric
ing
(
12)
Oth
er _
____
____
____
____
____
____
____
____
Fa
cilit
ies
and
Site
Man
agem
ent
____
____
____
____
____
____
____
____
____
____
____
Im
prov
emen
ts
Plea
se C
ompl
ete
Form
on
Oth
er S
ide
Loca
tion
With
in A
rea:
D
etai
led
Des
crip
tion
of D
evel
opm
ent:3
(
1) C
BD
(3)
Sub
urba
n (N
on-C
BD
)
(5)
Rur
al
(
2) U
rban
(N
on-C
BD
)
(4)
Sub
urba
n C
BD
(6)
Fre
eway
Inte
rcha
nge
Are
a (R
ural
)
(7)
Not
Giv
en
Inde
pend
ent V
aria
ble:
(in
clud
e da
ta fo
r as
man
y as
pos
sibl
e)2
Act
ual
Est
imat
ed
A
ctua
l E
stim
ated
____
__ (
1) E
mpl
oyee
s (#
)
__
____
(9)
Par
king
Spa
ces
(% o
ccup
ied:
___
____
)
____
__ (
2) P
erso
ns (
#)
____
__ (
10)
Bed
s (%
occ
upie
d: _
____
____
____
___)
____
__ (
3) T
otal
Uni
ts (
#) (
indi
cate
uni
t:___
____
____
___)
__
____
(11
) S
eats
(#)
____
__ (
4) O
ccup
ied
Uni
ts (
#) (
indi
cate
uni
t:___
____
___)
__
____
(12
) S
ervi
cing
Pos
ition
s/Ve
hicl
e Fu
elin
g
____
__ (
5) G
ross
Flo
or A
rea
(gro
ss s
q. ft
.)
P
ositi
ons
(%
of d
evel
opm
ent o
ccup
ied
____
____
____
___)
__
____
(13
) S
hopp
ing
Cen
ter
% O
ut-p
arce
ls/p
ads
____
__ (
6) N
et R
enta
ble
Are
a (s
q. ft
.)
__
____
(14
) A
.M. P
eak
Hou
r Vol
ume
of A
djac
ent S
treet
Tra
ffic
____
__ (
7) G
ross
Lea
sabl
e A
rea
(sq.
ft.)
____
__ (
15)
P.M
. Pea
k H
our V
olum
e of
Adj
acen
t Stre
et T
raffi
c
(%
of d
evel
opm
ent o
ccup
ied
____
____
____
___)
__
____
(16
) O
ther
___
____
____
____
____
____
____
__
____
__ (
8) T
otal
Acr
es (
% d
evel
oped
: ___
____
____
____
)
____
__ (
17)
Oth
er _
____
____
____
____
____
____
____
____
_ 24
-hou
r %
____
_ 24
-hou
r %
____
_ 24
-hou
r %
Em
ploy
ees
by S
hift:
Firs
t Shi
ft:
Tim
e __
____
Ti
me
____
__
Em
ploy
ees
(#)
____
__
Sec
ond
Shi
ft:
Tim
e __
____
Ti
me
____
__
Em
ploy
ees
(#)
____
__
Third
Shi
ft:
Tim
e __
____
Ti
me
____
__
Em
ploy
ees
(#)
____
__
Par
king
Cos
t on
Site
: H
ourly
___
__
Dai
ly _
____
Sta
rt
End
Sta
rt
End
Sta
rt
End

A
vera
ge W
eekd
ay (
M-F
) S
atur
day
Sun
day
E
nter
E
xit
Tota
l E
nter
E
xit
Tota
l E
nter
E
xit
Tota
l
A
ll Tr
ucks
A
ll Tr
ucks
A
ll Tr
ucks
A
ll Tr
ucks
A
ll Tr
ucks
A
ll Tr
ucks
A
ll Tr
ucks
A
ll Tr
ucks
A
ll Tr
ucks
24-H
our V
olum
eA
.M. P
eak
Hou
r of A
djac
ent1
Stre
et T
raffi
c (7
– 9
)Ti
me
(ex.
: 7:1
5 -
8:15
):P.
M. P
eak
Hou
r of
Adj
acen
t1 S
treet
Tra
ffic
(4 –
6)
Tim
e:A
.M. P
eak
Hou
r G
ener
ator
2
Tim
e:P.
M. P
eak
Hou
r G
ener
ator
2 Ti
me:
Pea
k H
our
Gen
erat
or3
Tim
e (W
eeke
nd):
Inst
itute
of
Tra
nspo
rtat
ion
Eng
inee
rs
Tri
p G
en
era
tio
n D
ata
Fo
rm (
Part
2)
Sum
mar
y of
Dri
vew
ay V
olum
es
(All
= A
ll V
ehic
les
Cou
nted
, Inc
ludi
ng T
ruck
s; T
ruck
s =
Hea
vy D
uty
Truc
ks a
nd B
uses
)
Sur
vey
cond
ucte
d by
: N
ame:
___
____
____
____
____
____
____
____
____
____
____
____
____
____
____
____
____
____
____
____
____
____
____
____
____
____
Org
aniz
atio
n: __
____
____
____
____
____
____
____
____
____
____
____
____
____
____
____
____
____
____
____
____
____
____
____
____
Add
ress
: ___
____
____
____
____
____
____
____
____
____
____
____
____
____
____
____
____
____
____
____
____
____
____
____
____
__
City
/Sta
te/Z
ip: _
____
____
____
____
____
____
____
____
____
____
____
____
____
____
____
____
____
____
____
____
____
____
____
____
Te
leph
one
#:__
____
____
____
____
____
____
___
Fax
#:__
____
____
____
____
____
____
___
E-m
ail:_
____
____
____
____
____
____
____
_
Ple
ase
retu
rn to
: In
stitu
te o
f Tra
nspo
rtatio
n E
ngin
eers
Te
chni
cal P
roje
cts
Div
isio
n
1627
Eye
Stre
et, N
W, S
uite
600
W
ashi
ngto
n, D
C 2
0006
US
A
Te
leph
one:
+1
202-
785-
0060
Fa
x: +
1 20
2-78
5-06
09
ITE
on
the
Web
: ww
w.it
e.or
g
A.M
. Per
iod
Ent
er
Exi
t To
tal
Mid
-Day
Per
iod
Ent
er
Exi
t To
tal
P.M
. Per
iod
Ent
er
Exi
t To
tal
A
ll Tr
ucks
A
ll Tr
ucks
A
ll Tr
ucks
A
ll Tr
ucks
A
ll Tr
ucks
A
ll Tr
ucks
A
ll Tr
ucks
A
ll Tr
ucks
A
ll Tr
ucks
6:00
-7:0
0
11:0
0-12
:00
3:00
-4:0
06:
15-7
:15
11:1
5-12
:15
3:15
-4:1
5
6:
30-7
:30
11:3
0-12
:30
3:30
-4:3
06:
45-7
:45
11:4
5-12
:45
3:45
-4:4
57:
00-8
:00
12:0
0-1:
00
4:00
-5:0
07:
15-8
:15
12:1
5-1:
15
4:15
-5:1
57:
30-8
:30
12:3
0-1:
30
4:30
-5:3
07:
45-8
:45
12:4
5-1:
45
4:45
-5:4
58:
00-9
:00
1:00
-2:0
0 5:
00-6
:00
1. H
ighe
st h
ourly
vol
ume
betw
een
7 a.
m. a
nd 9
a.m
. (4
p.m
. and
6 p
.m.).
Ple
ase
spec
ify th
e pe
ak h
our.
2. H
ighe
st h
ourly
vol
ume
durin
g th
e a.
m. o
r p.m
. per
iod.
Ple
ase
spec
ify th
e pe
ak h
our.
3. H
ighe
st h
ourly
vol
ume
durin
g th
e en
tire
day.
Ple
ase
spec
ify th
e pe
ak h
our.
Plea
se re
fer t
o th
e T
rip
Gen
erat
ion
Use
r’s
Gu
ide
for f
ull d
efin
ition
of t
erm
s.
Hou
rly
Dri
vew
ay V
olum
es- A
vera
ge W
eekd
ay (
M-F
)
qC
heck
if P
art 3
, 4 a
nd/o
r add
ition
al in
form
atio
n is
atta
ched
.

A.M. Period Enter Exit Total P.M. Period Enter Exit Total
All Trucks All Trucks All Trucks All Trucks All Trucks All Trucks12:00-12:15 12:00-12:1512:15-12:30 12:15-12:3012:30-12:45 12:30-12:4512:45-1:00 12:45-1:001:00-1:15 1:00-1:151:15-1:30 1:15-1:301:30-1:45 1:30-1:451:45-2:00 1:45-2:002:00-2:15 2:00-2:152:15-2:30 2:15-2:302:30-2:45 2:30-2:452:45-3:00 2:45-3:00 3:00-3:15 3:00-3:153:15-3:30 3:15-3:303:30-3:45 3:30-3:45 3:45-4:00 3:45-4:004:00-4:15 4:00-4:154:15-4:30 4:15-4:304:30-4:45 4:30-4:454:45-5:00 4:45-5:005:00-5:15 5:00-5:155:15-5:30 5:15-5:305:30-5:45 5:30-5:455:45-6:00 5:45-6:006:00-6:15 6:00-6:156:15-6:30 6:15-6:306:30-6:45 6:30-6:456:45-7:00 6:45-7:007:00-7:15 7:00-7:157:15-7:30 7:15-7:307:30-7:45 7:30-7:457:45-8:00 7:45-8:008:00-8:15 8:00-8:158:15-8:30 8:15-8:308:30-8:45 8:30-8:458:45-9:00 8:45-9:009:00-9:15 9:00-9:159:15-9:30 9:15-9:309:30-9:45 9:30-9:459:45-10:00 9:45-10:0010:00-10:15 10:00-10:1510:15-10:30 10:15-10:3010:30-10:45 10:30-10:4510:45-11:00 10:45-11:0011:00-11:15 11:00-11:1511:15-11:30 11:15-11:3011:30-11:45 11:30-11:4511:45-12:00 11:45-12:00
Institute of Transportation Engineers
Trip Generation Data Form (Part 3)Name/Organization: City/State:
Telephone Number:
Detailed Driveway Volumes: Attach this sheet to Parts 1 and 2 if you are providing additional information.
Day of the week: (All = All Vehicles Counted, Including Trucks; Trucks = Heavy Duty Trucks and Buses)

A
vera
ge W
eekd
ay (
M-F
) S
atur
day
Sun
day
E
nter
E
xit
Tota
l E
nter
E
xit
Tota
l E
nter
E
xit
Tota
l
24-H
our V
olum
eA
.M. P
eak
Hou
r of A
djac
ent1
Stre
et T
raffi
c (7
– 9
)Ti
me
(ex.
: 7:1
5 -
8:15
):P.
M. P
eak
Hou
r of
Adj
acen
t1 S
treet
Tra
ffic
(4 –
6)
Tim
e:A
.M. P
eak
Hou
r G
ener
ator
2
Tim
e:P.
M. P
eak
Hou
r G
ener
ator
2 Ti
me:
Pea
k H
our
Gen
erat
or3
Tim
e (W
eeke
nd):
Inst
itute
of
Tra
nspo
rtat
ion
Eng
inee
rs
Tri
p G
en
era
tio
n D
ata
Fo
rm (
Part
4)
Sur
vey
cond
ucte
d by
: N
ame:
___
____
____
____
____
____
____
____
____
____
____
____
____
____
____
____
____
____
____
____
____
____
____
____
____
____
Org
aniz
atio
n: __
____
____
____
____
____
____
____
____
____
____
____
____
____
____
____
____
____
____
____
____
____
____
____
____
Add
ress
: ___
____
____
____
____
____
____
____
____
____
____
____
____
____
____
____
____
____
____
____
____
____
____
____
____
__
City
/Sta
te/Z
ip: _
____
____
____
____
____
____
____
____
____
____
____
____
____
____
____
____
____
____
____
____
____
____
____
____
Te
leph
one
#:__
____
____
____
____
____
____
___
Fax
#:__
____
____
____
____
____
____
___
E-m
ail:_
____
____
____
____
____
____
____
_
Ple
ase
retu
rn to
: In
stitu
te o
f Tra
nspo
rtatio
n E
ngin
eers
Te
chni
cal P
roje
cts
Div
isio
n
1627
Eye
Stre
et, N
W, S
uite
600
W
ashi
ngto
n, D
C 2
0006
US
A
Te
leph
one:
+1
202-
785-
0060
Fa
x: +
1 20
2-78
5-06
09
ITE
on
the
Web
: ww
w.it
e.or
g
1. H
ighe
st h
ourly
vol
ume
betw
een
7 a.
m. a
nd 9
a.m
. (4
p.m
. and
6 p
.m.)
as d
efin
ed in
Trip
Gen
erat
ion
Dat
a Fo
rm (P
art 2
). Pl
ease
spe
cify
the
peak
hou
r.2. H
ighe
st h
ourly
vol
ume
durin
g th
e a.
m. o
r p.m
. per
iod.
Ple
ase
spec
ify th
e pe
ak h
our.
3. H
ighe
st h
ourly
vol
ume
durin
g th
e en
tire
day.
Ple
ase
spec
ify th
e pe
ak h
our.
Plea
se a
ttach
sup
plem
enta
l hou
rly v
olum
es.
Plea
se re
fer t
o th
e T
rip
Gen
erat
ion
Use
r’s
Gu
ide
for f
ull d
efin
ition
of t
erm
s.
Sum
mar
y of
Ped
estr
ian
Vol
umes
Sum
mar
y of
Bic
ycle
Vol
umes
A
vera
ge W
eekd
ay (
M-F
) S
atur
day
Sun
day
E
nter
E
xit
Tota
l E
nter
E
xit
Tota
l E
nter
E
xit
Tota
l
24-H
our V
olum
eA
.M. P
eak
Hou
r of A
djac
ent1
Stre
et T
raffi
c (7
– 9
)Ti
me
(ex.
: 7:1
5 -
8:15
):P.
M. P
eak
Hou
r of
Adj
acen
t1 S
treet
Tra
ffic
(4 –
6)
Tim
e:A
.M. P
eak
Hou
r G
ener
ator
2
Tim
e:P.
M. P
eak
Hou
r G
ener
ator
2 Ti
me:
Pea
k H
our
Gen
erat
or3
Tim
e (W
eeke
nd):