arousal and performance in a process monitoring task using signal ... et al._2015_arousal a… ·...
TRANSCRIPT

Arousal and performance in a process monitoring task using signal detection theory
Jung Hyup Kim, Ling Rothrock, and Jason Laberge
Department of Industrial and Manufacturing Systems Engineering, University of Missouri, Columbia, USA Department of Industrial and Manufacturing Engineering, Pennsylvania State University, University Park, USA
Alberta Health Services, Alberta, Canada
This study explored the use of signal detection theory (SDT) as an indicator of potential performance in order to understand the relationship between sensitivity and operator bias in a process monitoring task. Changes in sensitivity and bias levels could be linked with levels of arousal during a stimulating experience in a dynamic control work. We used the time window-based human-in-the-loop simulation as a tool to collect four decision outcomes of SDT: hits, false alarms, misses, and correct rejections. Participants were randomly assigned to either low, medium or high-density displays. Using this simulation, we were able to generate the display design of a particular domain such as a process monitoring task by console operators in oil and gas refinery plants. During the experiment, we used flow, level, pressure, and temperature gauges developed by Abnormal Situation Management® (ASM®) Consortium (www.asmconsortium.org).
INTRODUCTION
Advanced monitoring technologies provide operators with considerable data by increasing the bandwidth of information flow. However, the human ability to understand this much information is limited. For example, console operators in oil and gas refineries are responsible for monitoring at least 200 control loops (Tharanathan, Bullemer, Laberge, & Mclain, 2012). In addition, modern distributed process systems use parallel processing with a variety of control mechanisms (Noah, Kim, Rothrock, & Tharanathan, 2014). These complex monitoring environments make it difficult for operators to maintain the equal level of detectability for all pumps and gauges in real time. For that reason, understanding how various qualitative gauges influence the ability of operators to detect changes is important to improve process monitoring environments. In order to improve operators’ proactive monitoring abilities, developing the model for human performance based on arousal level will be beneficial to optimize console operators’ control performance. In this study, we used quantitative metrics to evaluate performance: sensitivity and bias from SDT (Stanislaw & Todorov, 1999) of different qualitative shapes in a process monitoring display.
In the original form of SDT, an observer attempts to determine whether a signal has been seen or not (Nevin, 1969). The observer’s decision breaks down into four outcomes: hits, false alarms, misses, and correct rejections. The relative frequencies of the signal and the four decision outcomes are used to calculate the difference between the average of the noise distribution and the signal-plus-noise distribution (Lehto & Landry, 2012). It is denoted as d’, the sensitivity. The SDT model also considers the bias of the decision-maker towards minimizing false alarms versus misses. It is denoted as β.
We used the time window-based human-in-the-loop (TWHITL) simulation as a tool to collect the four decision outcomes from participants and calculated d’ and β (Kim, Rothrock, & Laberge, 2014). During the experiment, the proactive monitoring was defined as detecting process deviations before alarms occur. We also used the ASM Consortium qualitative shapes (flow, level, pressure, and temperature gauges) as the basic design of the gauge
(Tharanathan, Laberge, Bullemer, & McLain, 2010). The details of the gauge shape in Table 1.
Table 1
Gauge shape and region
The key research question for this study is: how does display density influence the monitoring performance in terms of sensitivity and bias?
Arousal plays a significant role in the performance, as modeled in the Yerkes-Dodson Law (1908).The basic approach to maintaining a high level of arousal is providing more frequent rest breaks or providing operators with more feedback on their detection performance (Freivalds & Niebel, 2013). However, the process control room with multiple displays can become very dense when showing a large number of process parameters. Therefore, providing enough attentional resources to operators to remain alert over a long period of time is a very difficult challenging. Understanding the relationship between the monitoring performance and the number of stimulus on the display could help system engineers and designers to address this challenge. To answer our research question, the density of visual stimulus was manipulated based on changing the set size of the screen. The set size refers to the number of shapes on the screen. The TWHITL simulation provided different levels of display density (small, medium, and high). We hypothesized that the performance (e.g. sensitivity and operator’s bias) curve of the monitoring task is influenced by the display density.
Cop
yrig
ht 2
015
Hum
an F
acto
rs a
nd E
rgon
omic
s S
ocie
ty. D
OI:
10.1
177/
1541
9312
1559
1403
Proceedings of the Human Factors and Ergonomics Society 59th Annual Meeting - 2015 1865
at PENNSYLVANIA STATE UNIV on January 19, 2016pro.sagepub.comDownloaded from

METHOD
Study Design
Twenty undergraduate students participated in this between-subject experiment. The density of visual stimulus, also called set size, was an independent variable. The SDT result was a dependent variable. There were three density levels: low, medium, and high. The high-density display contained 96 gauges (24 flow gauges, 24 level gauges, 24 temperature gauges, and 24 pressure gauges). The medium-density display had total 64 gauges (16 flow gauges, 16 level gauges, 16 temperature gauges, and 16 pressure gauges). The low-density display contained 32 gauges (8 flow gauges, 8 level gauges, 8 temperature gauges, and 8 pressure gauges). Figure 1 shows the high-density condition (8 × 12 grid) as the example of the experimental setup.The 20” monitor on the left shows the control interface of the primary task. The other 15” computer screen is for a flag matching game. During the game, the participant must remove all flags by matching identical flags.
Figure 1. Experimental Setup
In oil and gas refinery plants, plant safety is top priority for console operators in a control room. Hence, participants were trained to focus on monitoring the current value of all gauges as their highest priority work during the experiment. We developed the time window-based HITL simulation for the primary task (Kim et al., 2014). The simulation was an interactive real-time system with participants. When a current gauge value exceeded the normal range, the participant had to click on the response button corresponding to the gauge as soon as possible. The normal ranges were set based on the variability observed in a process simulation of a crude distillation unit (CDU). Other ranges such as abnormal and alarm limits were also set based on a CDU configuration. The gauge monitoring task always began with a normal condition. This means that every gauge value was within its normal range when the simulation started. We designed the simulation for an inexperienced worker. Every gauge value was updated every second. The maximum change was up to ± 30% from the previous value. The total number of abnormal or alarm events was the same for all scenarios.
All gauge designs and functional specifications were based on Tharanathan’s previous research (2010). However, we excluded any color changes and flashing functions of the gauge from the original design. The reason for excluding these changes was because color and flashing indications can cause the participant to respond abnormal or alarm events rather than monitoring current gauge values. In other words, if we included the color change and indications, the participant’s attention would be influenced by the color and flashing indications rather than the current gauge values. Figure 2 a. shows the screenshot of the TWHITL simulation with 8 × 12 grid.
The participants also had to complete a secondary flag matching game while they were monitoring the gauges on the TWHITL simulation display. During this game, a 6×8 grid of numbered tiles was presented on a 15” computer screen. A country flag appeared on the display after a participant selected a tile using the mouse. If the participant identified all matching flags, these tiles disappeared from the grid. The game continued until the participant found all matching flags. The screenshot of the flag-matching application is represented in Figure 2 b.
(a) Primary Task: Gauge Monitoring Task
(b) Secondary Task: Flag-Matching Game
Figure 2. Screenshot of the Primary and Secondary Task
Proceedings of the Human Factors and Ergonomics Society 59th Annual Meeting - 2015 1866
at PENNSYLVANIA STATE UNIV on January 19, 2016pro.sagepub.comDownloaded from

Procedure
The experiment started with a general orientation about the TWHITL simulation, the process monitoring task in an oil & gas refinery and the flag matching game. The primary goal of this orientation was to explain to participants the work apparatus and its main interface. They were allowed to ask any questions during the orientation. The orientation took approximately 10 – 15 minutes. After that, the participants took a practice session. The training course was designed to teach participants the baseline conditions of the process monitoring task. The primary goal of this task was to detect and respond to multiple abnormal or alarm events. In addition, participants learned how to play the flag matching game. Every participant was asked to perform five practice trials, each lasting two minutes. Participants were free to ask questions throughout the practice tests. This training session took 10 – 15 minutes. The final step of the experiment was data collection. Each participant took part in three scenarios. All participants were randomly assigned to six different scenario orders. Each test scenario took about 8 minutes. The participants were not allowed to ask any questions during the data collection. The total experiment time was approximately 90 – 100 minutes.
RESULTS
Sensitivity (d’) and Operator Bias (β)
For the sensitivity (d’), a significant effect was found for the set size, F(2,14)=20.80, p<0.01. In addition, a substantial impact of operator bias (β) was found for the set size, F(2,14)=35.14, p<0.001. Comparisons of d’ and β means are shown in Figure 3. The plots showed that mean β values were quite high overall. A high β average indicated that participants allowed more misses to avoid false alarms. Because of this skewness of the data distribution, we used the Mann-Whitney U Test to verify the ANOVA results. We compared β scores between low, medium, and high set size in terms of ranks. The result showed that the sum of the average ranks for low set size (M rank=295.69, n=160) was significantly different from the medium set size (M rank=191.45, n=160) U=20302, p<0.0001 as well as the high set size (M rank=170.12, n=160) U=19107, p<0.0001. However, there was no significant difference between medium and high set size.
(a) Sensitivity (d’)
(b) Operator bias (β)
Figure 3. Mean Comparison for Set Size
Quadratic Models
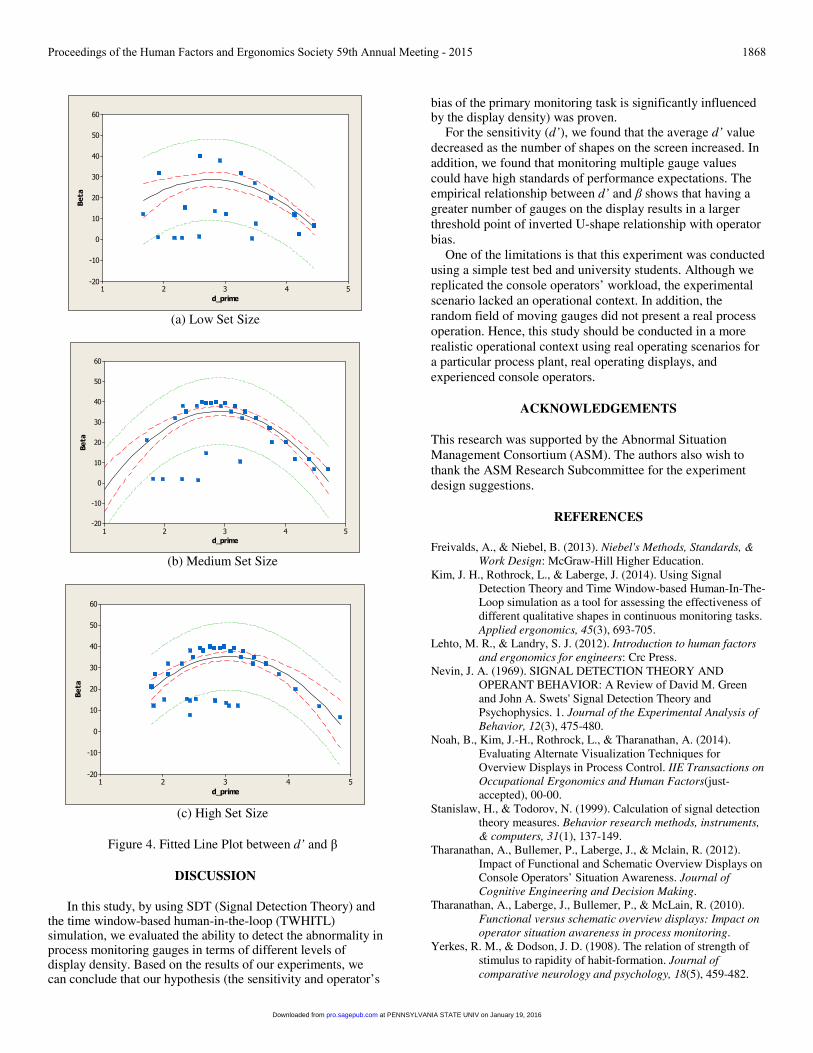
The quadratic models (black-solid lines) of the experimental data showed an empirical relationship between d’ and β in detail (see Figure 4). The lines indicated that the sensitivity (d’) increased with operator bias (β), but only up to a point. When the sensitivity became higher than the threshold point, operator bias decreased. Hence, participants were willing to find more abnormalities with fewer mistakes when they had greater than a certain level of d’ value. This threshold point was larger when the display density moved from low to medium to high set size. Compared with the Yerkes-Dodson Law (1908), in which the degree of arousal has an inverted U-shape relationship with performance, the higher the level of sensitivity (d’), the stronger the operator bias (β) until a threshold was reached. In Figure 4, the plots showed that there was a positive relationship between d’ and β until the threshold point was reached. For the low set size, it was 2.78. For the medium set size, it was 2.90. For the high set size, it was 3.05. After these threshold points were reached, the lines indicated there were negative relationships between d’ and β. These relationships explain that the display density of continuous monitoring tasks influences not only the operator’s sensitivity, but also the operator’s bias to detect the abnormality on the display. The R2 value for the quadratic models showed that participant’ d’ level accounted for the low set size: 51.2%, the medium set size: 56.5% and the high set size: 33.8% of the β value. The red-dashed lines were the 95% confidence limits for the β. The green-dashed lines were the 95% prediction limits for the new observations (p < 0.0001). Pearson correlations between d’ and β were the low set size: r = -0.580, p<0.001, the medium set size: r = -0.295, p<0.01, and the high set size: r = -0.452, p<0.001.
Proceedings of the Human Factors and Ergonomics Society 59th Annual Meeting - 2015 1867
at PENNSYLVANIA STATE UNIV on January 19, 2016pro.sagepub.comDownloaded from
54321
60
50
40
30
20
10
0
-10
-20
d_prime
Beta
(a) Low Set Size
54321
60
50
40
30
20
10
0
-10
-20
d_prime
Beta
(b) Medium Set Size
54321
60
50
40
30
20
10
0
-10
-20
d_prime
Beta
(c) High Set Size
Figure 4. Fitted Line Plot between d’ and β
DISCUSSION
In this study, by using SDT (Signal Detection Theory) and the time window-based human-in-the-loop (TWHITL) simulation, we evaluated the ability to detect the abnormality in process monitoring gauges in terms of different levels of display density. Based on the results of our experiments, we can conclude that our hypothesis (the sensitivity and operator’s
bias of the primary monitoring task is significantly influenced by the display density) was proven.
For the sensitivity (d’), we found that the average d’ value decreased as the number of shapes on the screen increased. In addition, we found that monitoring multiple gauge values could have high standards of performance expectations. The empirical relationship between d’ and β shows that having a greater number of gauges on the display results in a larger threshold point of inverted U-shape relationship with operator bias.
One of the limitations is that this experiment was conducted using a simple test bed and university students. Although we replicated the console operators’ workload, the experimental scenario lacked an operational context. In addition, the random field of moving gauges did not present a real process operation. Hence, this study should be conducted in a more realistic operational context using real operating scenarios for a particular process plant, real operating displays, and experienced console operators.
ACKNOWLEDGEMENTS
This research was supported by the Abnormal Situation Management Consortium (ASM). The authors also wish to thank the ASM Research Subcommittee for the experiment design suggestions.
REFERENCES
Freivalds, A., & Niebel, B. (2013). Niebel's Methods, Standards, & Work Design: McGraw-Hill Higher Education.
Kim, J. H., Rothrock, L., & Laberge, J. (2014). Using Signal Detection Theory and Time Window-based Human-In-The-Loop simulation as a tool for assessing the effectiveness of different qualitative shapes in continuous monitoring tasks. Applied ergonomics, 45(3), 693-705.
Lehto, M. R., & Landry, S. J. (2012). Introduction to human factors and ergonomics for engineers: Crc Press.
Nevin, J. A. (1969). SIGNAL DETECTION THEORY AND OPERANT BEHAVIOR: A Review of David M. Green and John A. Swets' Signal Detection Theory and Psychophysics. 1. Journal of the Experimental Analysis of Behavior, 12(3), 475-480.
Noah, B., Kim, J.-H., Rothrock, L., & Tharanathan, A. (2014). Evaluating Alternate Visualization Techniques for Overview Displays in Process Control. IIE Transactions on Occupational Ergonomics and Human Factors(just-accepted), 00-00.
Stanislaw, H., & Todorov, N. (1999). Calculation of signal detection theory measures. Behavior research methods, instruments, & computers, 31(1), 137-149.
Tharanathan, A., Bullemer, P., Laberge, J., & Mclain, R. (2012). Impact of Functional and Schematic Overview Displays on Console Operators’ Situation Awareness. Journal of Cognitive Engineering and Decision Making.
Tharanathan, A., Laberge, J., Bullemer, P., & McLain, R. (2010). Functional versus schematic overview displays: Impact on operator situation awareness in process monitoring.
Yerkes, R. M., & Dodson, J. D. (1908). The relation of strength of stimulus to rapidity of habit‐formation. Journal of comparative neurology and psychology, 18(5), 459-482.
Proceedings of the Human Factors and Ergonomics Society 59th Annual Meeting - 2015 1868
at PENNSYLVANIA STATE UNIV on January 19, 2016pro.sagepub.comDownloaded from