artifical intelligence - drdo
TRANSCRIPT


ContEnts
ArtificiAl intelligence1-7 AnEfficientGraphicalApproachforFrequentPatternMining
Anupriya Babbar, Anju Singh and Divakar Singh
8-12 AlgorithmGeneratorforArtificialIntelligence Ashwin Suresh Babu, Anandha Vignesh, Bala Kumar, Krishna Pokkuluri, and S Selvi
13-17 QualityAssessmentModelforWheatStorageWarehouseusingAnalyticHierarchyProcessandBPNeuralNetwork
Dudi Priyanka and Sharma Manmohan
18-23 IntrusionDetectionRateImprovementsandtheFalseAlarmRateminimisationUsingDendriticCellAlgorithmandDumpsterBeliefFunction
Anuj Gupta, Atul Kumar Jaiswal and Amit Saxena
24-30 WordSenseDisambiguationUsingMachineLearning:Timeline Neetu Sharma, Samit Kumar, and S. Niranjan
31-38 ConceptIntegrationusingEditDistanceandN-GramMatchVikram Singh, Pradeep Joshi, and Shakti Mandhan
39-43 TerrainPathOptimizationforAirborneLidarusingDijkstraAlgorithmAmitansu Pattanaik and Suraj Kumar
44-47 IntelligentMissileSystemBasedonModularProgrammableMatter:CubcatomicMissileSystemAlok A. Jadhav, Vishal S. Undre, and Rahul N. Dhole
48-52 ANewApproachofFuzzyObjectOrientedConceptualModellingforSpatialDatabasesRam Singar Verma, Shobhit Shukla, Gaurav Jaiswal, and Ajay Kumar Gupta
53-60 AspectofBio-InspiredRoboticsSystemDesign Ajay Kumar, Anurag Upadhyay, and Sachin Mishra, and Phuldeep Kumar
61-66 TechnicalAnalysisofNIFTY-50:AComparisionbetweenBPFFNandNARXAviral Sharma, Monit Kapoor, and Vipul Sharma
cryptAnAlysis67-69 HashFunctionsforMessageAuthentication
Richa Arora
70-75 CryptosystemsbasedonAsymmetricPairingsRajeev Kumar, S.K. Pal, and Arvind
76-80 IssuesinMigrationfromLegacyencodingstoUnicodeinDevanagariRachna Goel
81-85 SomeResultsonDesignParametersofLightweightBlockCiphersManoj Kumar, Saibal K. Pal and Anupama Panigrahi
Preface v-vi

86-91 FuzzyLogicQuantumKeyDistributionC.R. Suthikshn Kumar
92-96 PracticalApplicationsofHomomorphicEncryption O.P. Verma, Nitn Jain, Saibal Kumar Pal, and Bharti Manjwani
97-100 SurfandHarrisfeatureAnalysisforDynamicIndoorandOutdoorSceneforSurveillanceApplication Manisha Chahande and Vinaya Gohokar
101-105 RecentDevelopmentsinHomomorphicEncryptionMandeep Singh Sawhney, O. P. Verma, Nitin Jain, and Saibal Kumar Pal
106-110 BlindSteganalysis:Pixel-LevelFeatureExtractionBasedonColourModels,toIdentifyPayloadLocation
B. Yamini, and R. Sabitha
111-116 KeyManagementIssuesforIndustrialAutomationandControlSystemsPramod T.C. and N.R. Sunitha
communicAtion117-120 BasicPrinciplesofMobileCommunication
Shabana Parveen andNavneet Kumar Singh
221-229 OFDMandPAPRReductionusingClippingMethodArun Kumar and Manisha Gupta
130-133 EfficientResourceUtilizationinMobileDevicesUsingBayesianFrameworkBasedSaliencyMappingPraveen Kumar Yadav and N. Ramasubramanian
134-138 DigitalSignalProcessingforSpeechSignals Nilu Singh and R. A. Khan
139-142 SmartphoneBasedHomeAutomationSystemusingSL4AandRaspberryPiA. Sivsubramanyam and M. Vignesh
143-148 OptimisingSatelliteChannelCapacitybyUtilisingAppropriateTechniquesSuresh Kumar Jindal
149-152 ChallengesofDualCirculerPolarisedMimooverBentPipeSatellitesSuresh Kumar Jindal
153-158 BridgingtheGapbetweenDisabledPeopleandNewTechnologyinInteractiveWebApplicationwiththeHelpofVoice
Abhishek Sachan, Abhishek Bajpai, Ashutosh Kumar, and Neeraj Kumar Tiwari
networking 159-163 AnalysisofCongestionControlMechanismsofTCPFlavorsoverDifferentAd-hocRoutingProtocols
Aakash Goel and Aditya Goel
164-170 ANoveldistributedKeyManagementsystemforMobileAdhocNetworksusingCurveFittingK.R. Ramkumar and C.S. Ravichandran
171-183 ACurrentSurveyonIntrusionDetectionSystemsforWirelessSensorNetworksS. Geetha and Siva S. Sivatha Sindhu
184-189 ANovelTrustbasedRoutingAlgorithmforMobileAd-hocNetworksK. Mohaideen Pitchai, B. Paramasivan, and M. Bhuvaneswari
190-195 SeamlessIntegrationofKnowledgethroughNationalknowledgenetworkP. Geetha, Letha M.M.*, Wilson K. Cherukulath, R. Sivakumar, Deepna N., and T. Mukundan
196-200 FaultandPerformanceManagementinAir-gapWideAreaOrganizationalNetworks:ChallengesandMobileAgentApproach
Chaynika Taneja
201-209 DesignIssuesandTechniquesonDataCollectioninWSNs:ASurveyKoppala Guravaiah, and R. Leela Velusamy
cyber security210-214 CyberWarfare:IssuesandPerspectivesinIndia D S Bajia
215-220 IntelligentUnifiedModelforIntegratedCyberSecurity Rajesh Kumar Meena and Indu Gupta
221-225 CamouflagingHoneypotDeploymentAbhishek Sinha, and Lakshita Sejwal
226-230 SecuritywithServiceOrientedArchitectureinBankingNeha Manchanda
231-238 CyberSecurity-ASurveySmita Jhajharia and Vaishnavi Kannan
239-243 ChallengesinCyberSecurityRajesh Kumar Goutam
244-247 BridgingtheGapbetweenSecurityFactorsandOODesignConstructsShalini Chandra and Raees Ahmad Khan
248-254 DetectionofDistributedDenialofServiceAttacksUsingPanelofExperts Suriender Singh and S. Selvakumar
network security255-258 ImageSecurityinMultimedia:ASurvey
Shradha Bhardwaj and S.K. Pal
259-265 MatrixBasedKeyPre-distributionSchemesforWirelessSensorNetwork Pramod T.C., and N.R. Sunitha
266-272 ModifiedQ-LEACHProtocolforEnergyMinimizationusingProbabilisticEMModelforWirelessSensorNetwork
Vinay Dwivedi, Atul Kumar Jaiswal, and Amit Saxena
273-280 SpyMe:AnalysisofCrucialPlayersinCovertSocialNetworkS. Karthika and S. Bose
281-285 RFID:CreatingSmartObjectsSumit Malhotra
286-289 EvolutionofAntColonyOptimizationandSwarmIntelligenceinWirelessSensorNetworksAnkit Verma and Prem Chand Vashist
fu;fer iSVuZ ekbfuax ds fy, ,d izHkko”kkyh xzkfQdy ig¡qp An Efficient Graphical Approach for Frequent Pattern Mining
Anupriya Babbar, Anju Singh and Divakar Singh Barkatullah University Institute of Technology, Bhopal, India
E-mail: [email protected]
lkjka”k
MkVk ekbfuax cM+s MkVkcsl ls mi;ksxh tkudkjh fudkyus dh ,d fof/k gSA ;g oxhZdj.k] DyLVfjax] Hkfo’;ok.kh] la?k fo”ys’k.k tSls dbZ dk;Z djrk gSA MkVk ekbfuax ds {ks= esa vf/kdka”k “kks/kdrkZvksa dk ekStwnk /;ku dsUnz vko`frr iSVuZ [kuu gS tks mijksDr lHkh dk;ksZa esa egRoiw.kZ Hkwfedk fuHkkrk gSA vko`frr iSVuZ dh lcls cM+h [kkeh ;g gS fd blesa vkofrZr iSVuZ dks fMªy djus ds fy, ,d Qkby dks dbZ ckj Ldsfuax djus dh vko”;drk iM+rh gS vkSj fo”ks’k :i ls cM+s iSVuZ ds lkFk Hkkjh vkofrZr iSVuZ dk mRiknu gks ldrk gS] mijksDr leL;k dk ifj’—r lek/kku vf/kdre vko`frr iSVuZ ,e ,Q ih gS ;g vkofrZr iSVuZ ih<+h ds fy, ,d lcls NksVk izfr:i okyk lsV gS] ,Ek,Qih vkofrZr iSVuZ gSa ftldk lqijlsV vko`frr ugha gks ldrkA bl i= eas vko`frr iSVuZ dk mRiknu djus ds fy, ,d xzkfQdy fof/k dk izLrko gSA ;g fof/k nks u;s xq.kksa dks izLrqr djrh gS] ,d xzkQ lajpuk eq[; xzkQ dgykrh gS vkSj nwljk eq[; xzkQ ekbuj ,YxksfjFkeA izkbe xzkQ ,d ljy xzkQ lajpuk gS tks izkbEk la[;k fl)kar dk iz;ksx djds vuqizLFk }kjk ,d Ldsu ls [kqn xzkQ ds :i esa vko`frr iSVuZ mRikfnr djrs gq, vuqdwyu MkVk ifjorZu rduhd dk mi;ksx djds iwjh tkudkjh ys ldrk gSA
AbstrActData mining is a method to extract useful information from large databases. It performs many
tasks such as classification, clustering, prediction, association analysis1. Presently focused area of most of the researchers in data mining field is frequent pattern mining, which plays vital role in all the above mentioned tasks. One of the major drawback of frequent pattern mining is that it requires multiple scanning of a file to drill out the frequent patterns and may produce enormous frequent patterns especially with elongated patterns, the refined solution of the above problems is maximal frequent pattern (MFP) it is the smallest representative set for frequent pattern generation, MFP’s are the frequent patterns whose superset cannot be frequent2. This paper proposes a graphical method to produce frequent patterns. This method introduces two new properties; a graph structure called as Prime graph and a PG Miner algorithm. Prime graph is a simple graph structure by traversing it by one scan can produce frequent patterns as the graph itself captures the whole information about the transactions by using an optimizing data transformation technique which uses prime number theory. PG Miner is the proposed algorithm which traverses the prime graph and prunes the infrequent items. The efficiency of the proposed method is proved with the help of experimental results.
Keywords: Data mining, frequent pattern mining
Bilingual International Conference on Information Technology: Yesterday, Today, and Tomorrow, 19-21 February 2015, pp. 1-7© DESIDOC, 2015
1. IntroductIonWith large database there is a need of developing
a tool which can drill down the useful information from the database with ease. Knowledge discovery of data (KDD) is a process to extract useful patterns from the database. Data mining is an important step of KDD, which is used to drill out useful information and can be implemented in many areas like data bases, artificial intelligence, knowledge discovery in neural networks etc. Frequent pattern mining is used to extract frequent patterns based on minimum support or confidence value.
Interesting co-relations are mined with the help of Association rule, It comprises of two steps: first is Frequent pattern mining, in this the patterns which satisfy the threshold is frequent otherwise infrequent14. Many algorithms are been devised to mine frequent patterns. They basically fall in two categories: (a) With candidate generation (b) Pattern growth (without candidate generation). Methods with candidate generation like Apriori16, Partition based21, Incremental based17,19, suffers from many problems like multiple database scans and candidate generation. Many extensions are made to
ArTIFICIAl InTEllIGEnCE AnD nETWOrK SECurITY
2
the previous algorithm but still it encounters the above problems. And method without candidate generation like pattern growth20 or FP-growth is an improvement over candidate generation algorithms. Two scanning are required to extract the frequent patterns from the database; several optimizations are made to minimize the number of scanning and lessen the time taken and the search space to produce frequent patterns3.
This paper proposes a graphical method for mining frequent patterns. However, most of the times some changes are made in graph structure, pruning or traversal technique. This method uses simple graph structure to keep the transaction information and a graph miner algorithm to traverse the graph to find the frequent patterns and prunes the infrequent patterns. This method uses data transformation technique to convert data into prime number format which reduces the size of data sets significantly, then construction of prime-graph takes place and with the help of PG Miner algorithm frequent patterns can be mined and it prunes all in frequent item sets from the data set, in one database scan, as all the useful information related with the transaction is stored in prime-graph, by traversing the graph once only frequent patterns can be mined. Various experiments have been performed on the web log data set to justify the correctness of the proposed work.
2. ProblEMs And rElAtEd worK2.1 Problems of FPM Algorithms
In a data set the items which satisfies user defined threshold are frequent otherwise infrequent.
It is time consuming to find frequent patterns • especially when data set is highly populated.It is a tedious task to decide the threshold value • as low threshold may produce large number of patterns destroying the accuracy of mining and the high threshold will only produce very less patterns leaving even some of the frequent item sets.Algorithm with candidate generation may generate • large number of candidates to produce frequent patterns which require more space and database scans and make complete process expensive.The major problems with this algorithm are of • multiple database scan and the search space6.
2.2 related worksTo overcome the problem of previously proposed
algorithms many extensions are being made to increase the efficiency like Aclose10, CHArM8, Cobbler11, Carpenter11, AFOPT12 and etc, are the extensions of Apriori which is a method based on candidate generation. FP-growth20 is a method based on without candidate generation was proposed It is advancement over prefix tree. FP-tree merges the links which
have same value. It compacts the data and enhances the performance by increasing the speed. It requires large memory space for parsley populated data set where common path is very low. There is another method known ElCAT7 which uses vertical data format rather than horizontal data format, it prove much more efficient then Apriori as it uses Boolean power set lattice theory which requires less space to store information about the transaction. The refined solution proposed in our method is to derive frequent patterns from MFP, many algorithms have been devised which generates frequent patterns from MFP, But still they still require two database scans like Pincer search algorithm4,13. It makes use of both top-down and bottom-up traversal to mine MFP. Depth project is another method to mine MFP which uses depth first traversal15 and both pruning techniques and moves in lexicographic order to traverse. This is an efficient method to mine frequent patterns. The extension of depth project is MAFIA5. rymon’s set enumeration is used by above methods which avoid counting the support of all frequent patterns18,20.
But the major drawback is it needs the huge amount of memory to store the information about item sets.
3. MEthod ProPosEd3.1 data transformation technique
First and foremost step of data mining is data pre-processing. It comprise of data cleaning, data reduction and data transformation[22]. In the proposed method data transformation is used to reduce the size of data set significantly. In this method the web log dataset is transformed with prime based compaction which reduces the size of dataset. Each complete transaction is transformed into prime multiplied value (PMV) a positive integer. During prime graph construction transaction given T= (Pid, Z) where Pid is the ID of transaction and Z= {an……am} is the item set of Z. Prime Multiplied Value Pid is computed with the help of Eqn. 1
Mod [(PMV, Pr)] (1)Where Pr is the number of item set of Z.With the help of above Eqn. (1) data can be transformed
into contracted form. In fact data transformation is an abstracted form of transactions. This is explained with the help of an example in table 1 there shows eight transaction of website login and page number. In which page number is then transformed into prime numbers and then prime multiplied value is calculated.
When this transformation is applied to the real web log data result will be in drastic compaction. It reduces the size of data set more than half. This process is independent of size and type of data set, any data set can be reduced like P=(4,{8,6,20,11})
BABBAr: An EFFICIEnT GrAPHICAl APPrOACH FOr FrEquEnT PATTErn MInInG
3
form when same value of PMV is repeated more than one time i.e. same subset of item set is been repeated more than once in a whole set of transaction.
3.2.1 Working of Prime Graph for Elementary Page Logins
This can be easily illustrated with the help of table 2 Where PMV arrange in columns and pr in rows, putting value in the formula
Mod [(column, row)] If answer equals to 0 or no remainder than 1 will
be placed on the respective position otherwise 0. like Mod [(2310, 2)] =0 than 1 will be placed at a11.
and P0 = (4,{8884,990,7123,1234}) are transformed to the same value 770.
login Page no. Prime transformation PMV1 5, 8, 6, 11,20 3, 2, 11, 5, 7 23102 8, 9, 20, 11, 5 2, 13, 7, 5, 3 27303 5, 8, 6 3, 2, 11 664 8, 6, 20, 11 2, 11, 7, 5 7705 11, 9, 20 5, 13, 7 4556 20, 9, 8, 11 7, 13, 2, 5 9107 8, 20, 11 2, 7, 5 708 9, 11, 20 13, 5, 7 455
3.2 Prime Graph ConstructionGraph structures are efficient as they make use
of dual techniques that is compression of complete database and pruning of infrequent data.
Proposed method introduces a simple graph structure called prime graph (prime-number compressed graph). Prime graph uses the concept of prime number theory for transformation. This method improves the performance by reducing the number of scanning and also minimizes the time taken to extract frequent patterns.
A prime graph includes number of nodes which consist of prime number allotted to the item set of transaction (P1….n) and on the other hand some nodes consist of Prime multiplied value i.e. PMV1…m. There are different fields to store current state of transaction. PMV is getting stored in the variable field. During insertion of current PMV local field set by 1 if function [mod (PMVm,P1….n)] = 0 or no remainder. The global field keep track of all P’s which contained in particular PMV.
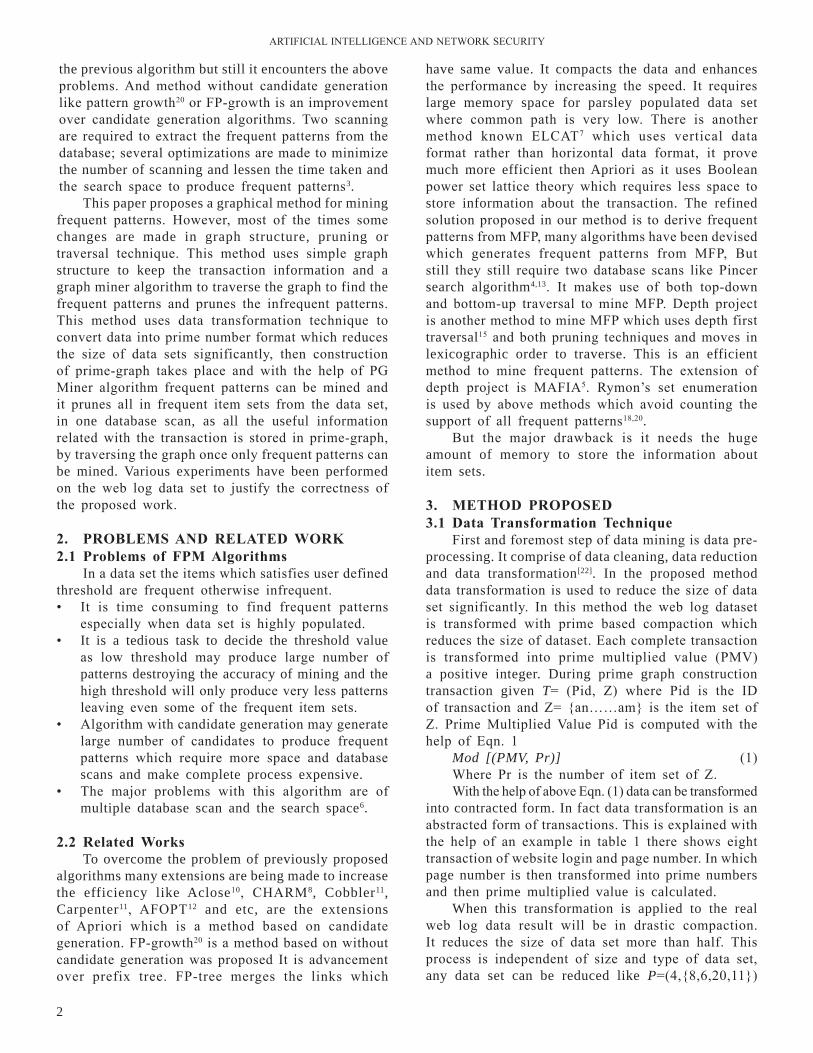
Global register keep track on all logins and hit pages to record the page count which can be further used for mining, according to the user defined threshold. Inward and outward edges of the node are tracked by link field; value of status field is oscillates between 0 or 1 depending upon the PMV’s and P’s. Fig. 1 & 2 shows the construction of Prime graph based on table 1 login data. The construction operation based on creating and inserting nodes PMV(s) and P1…n into prime graph based on definitions below:
Definition 1: links through PMV and Pn will be connected depending upon the formulated equation [mod (PMVn,P1…n)]=0 or 1. Each and every value of PMV get modulo divided by P. If there is no remainder or 0 that means PMV is completely divisible by P, then there will be a link form between from that P directed towards PMV and local-count increased by 1.
Definition 2: link from one PMV to other PMV is formed when one PMV is completely Divisible by other PMV.
Definition 3: A self loop to a node of PMV is Figure 1. Prime graph for elementary page logins.
The count of the edges which directed from P towards PMV’s or the out degree of a P is the total frequency of the appearance of P in complete set of page logins. It is shown with the help of a Fig. 1. And the calculated frequency is shown by the Table 3.
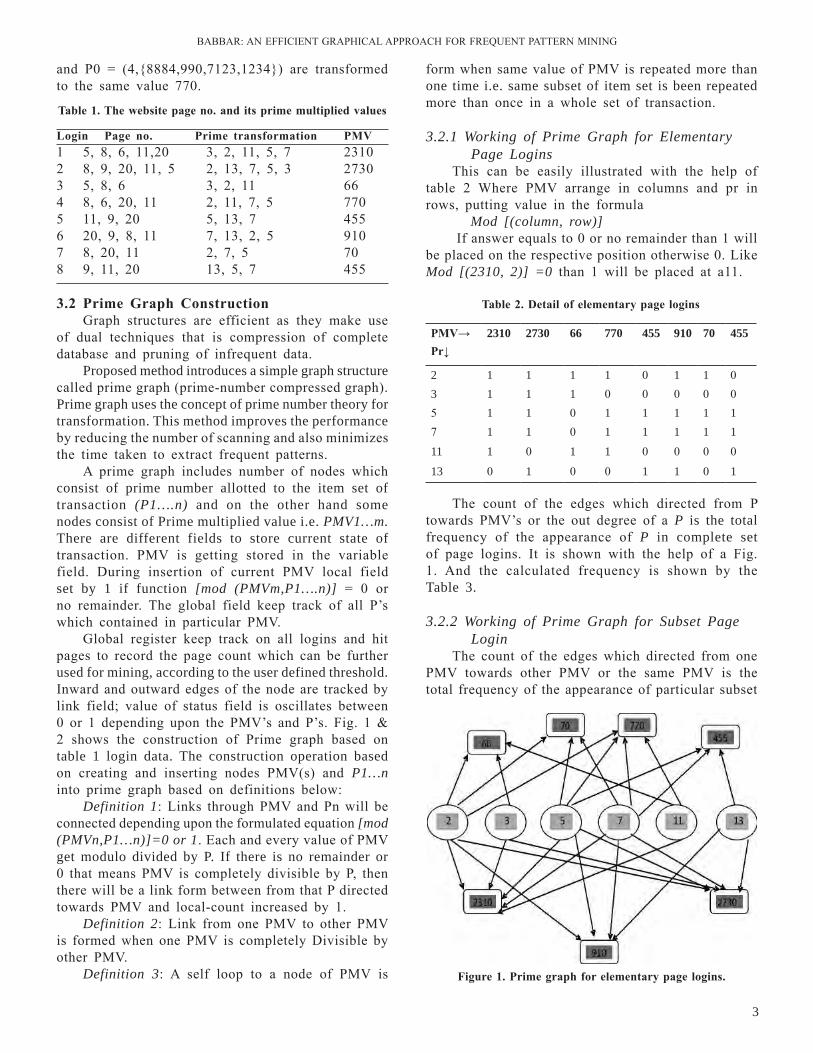
3.2.2 Working of Prime Graph for Subset Page Login
The count of the edges which directed from one PMV towards other PMV or the same PMV is the total frequency of the appearance of particular subset
PMV→Pr↓
2310 2730 66 770 455 910 70 455
2 1 1 1 1 0 1 1 03 1 1 1 0 0 0 0 05 1 1 0 1 1 1 1 17 1 1 0 1 1 1 1 111 1 0 1 1 0 0 0 0
13 0 1 0 0 1 1 0 1
table 2. detail of elementary page logins
table 1. the website page no. and its prime multiplied values
ArTIFICIAl InTEllIGEnCE AnD nETWOrK SECurITY
4
of pages in a complete set of login that is to find out the frequency that how many time a different users hit the same pages of a website in a sequence (subset of pages). It is shown below with the help of Fig. 2.
of graph for subset page login. Formula is used Mod [(PMV, UPMV)]
where uPMV is the unique prime multiplied value. Where row contains unique transactions arranged in ascending order and column contains the all PMV arranged in arbitrary order, putting values in the formula
Mod [(column, row)]If it equals to 0 or no remainder, then 1 will be
placed on particular position otherwise 0. like Mod [(2310, 66)] = 0, so 1 will be placed on a11 and so on.By counting number of 1’s in the row as shown in Table 4 (decrementing the total value by 1, as every number is divisible by itself) frequency of subset can be calculated and the calculated frequency is shown in Table 5.
table 3. Page frequency and prime transformation
Page no Prime transformation Page frequency5 3 3
6 11 38 2 69 13 311 5 620 7 6
table 4. detail of subset login
Prime multiplied value Page subset frequency
66 170 4455 3
770 1910 1
2310 0
2730 0
table 5. Frequency of website page login
PMV→UPMV↓
2310 2730 66 770 455 910 70 455
66 1 0 1 0 0 0 0 0
70 1 1 0 1 0 1 1 0
455 0 1 0 0 1 1 0 1
770 1 0 0 1 0 0 0 0
910 0 1 0 0 0 1 0 0
2310 1 0 0 0 0 0 0 0
2730 0 1 0 0 0 0 0 0
Figure 2. Prime graph construction for page subset login.
3.3 Prime graph Miner AlgorithmDifferent registers are used, during construction
of prime graph a) count- which stores the frequency of particular
items.b) local-count- Keeps the value of current PMV.c) Global-counting-keep track on the frequency of
frequent and infrequent items.d) Status
Step1.Traverses the graph in top-down directionStep2.Calculate the frequency of each elementary
transaction and Compare the frequency of the elementary itemset (pages) to the user defined threshold
Step3. Prunes the infrequent itemsetsStep4. Matches the subset of the transactions with
one another with the help of PMVStep5. Compares the frequency of repeated subset
transaction with the user defined threshold.Step6. results gives the frequent elementary
itemset of the frequent page numbers and the frequent subsets of the transactions that are same set of pages repeated in more than one transaction.
The PG Miner algorithm scans the constructed prime graph to drill out the frequent patterns from tip to toe. Hence, generation of frequent pattern is
Again, consider table 1 where PMV are calculated {2310, 2730, 66, 770, 455, 910, 70, 455}. However, it is noticeable that some of the values are repeated, this concept of repeated value is used for the construction
BABBAr: An EFFICIEnT GrAPHICAl APPrOACH FOr FrEquEnT PATTErn MInInG
5
completed in one scan as prime graph is capable enough to hold the information of complete data set. The miner algorithm prunes the infrequent itemsets, which increases the computation speed and enhances the efficiency.
4 ExPEriMEntAl rEsUltsAll experiments were performed in an Intel 2.80 GHz
PC in 2 GB rAM. All the algorithms are implemented using Matlab and Sql 6.0 on web log sparse dataset http://fimi.ua.ac.be/data/.
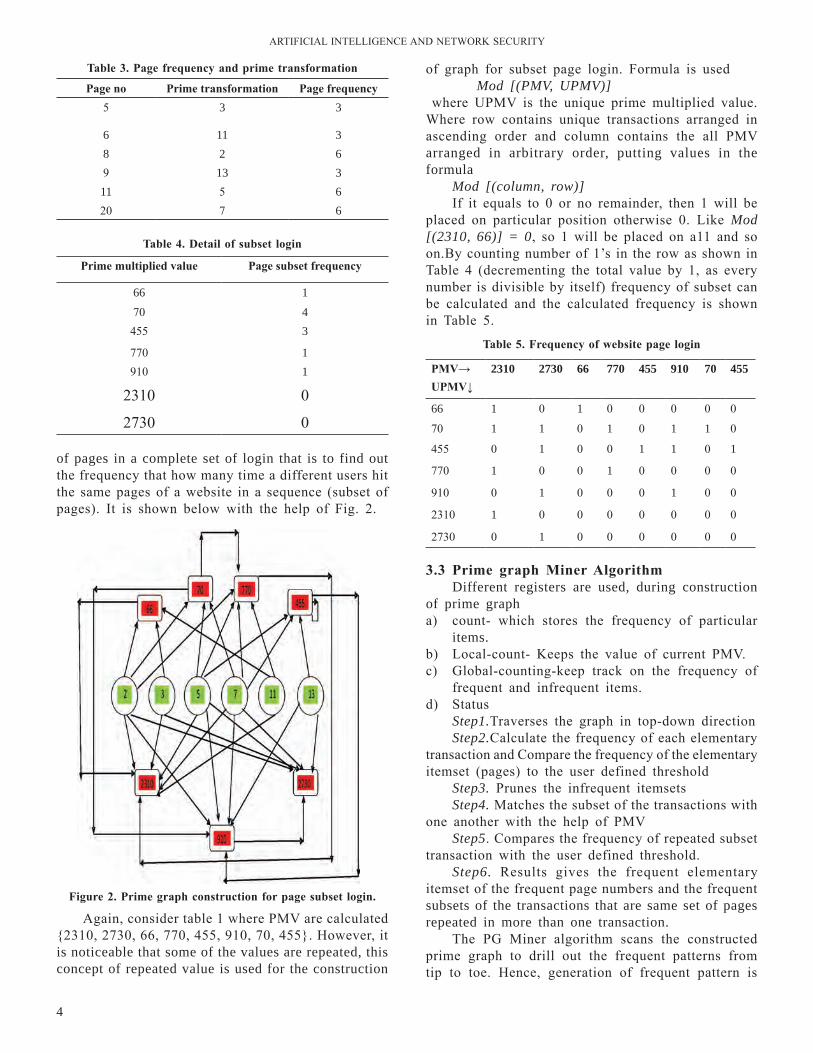
First experiment is performed on synthetic web log datasets. To reduce the complexity the complete transaction dataset is divided in the ratio of 50:12 that is the number of hit pages are 12, the average transaction page logins are 50 and the number of transaction increased from 50 to 100 to evaluate size reduction through data transformation. Fig.3 shows the comparative analysis of the size of original and transformed prime compressed dataset.
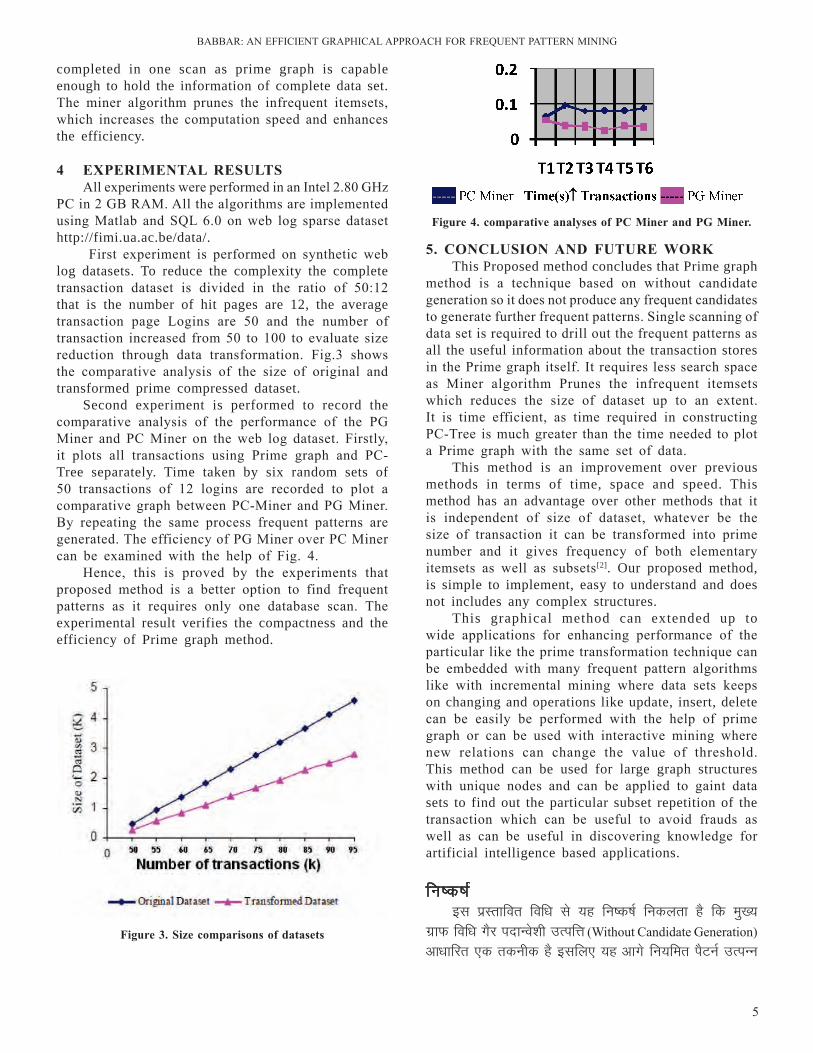
Second experiment is performed to record the comparative analysis of the performance of the PG Miner and PC Miner on the web log dataset. Firstly, it plots all transactions using Prime graph and PC-Tree separately. Time taken by six random sets of 50 transactions of 12 logins are recorded to plot a comparative graph between PC-Miner and PG Miner. By repeating the same process frequent patterns are generated. The efficiency of PG Miner over PC Miner can be examined with the help of Fig. 4.
Hence, this is proved by the experiments that proposed method is a better option to find frequent patterns as it requires only one database scan. The experimental result verifies the compactness and the efficiency of Prime graph method.
Figure 3. size comparisons of datasets
Figure 4. comparative analyses of PC Miner and PG Miner.
5. ConClUsion And FUtUrE worKThis Proposed method concludes that Prime graph
method is a technique based on without candidate generation so it does not produce any frequent candidates to generate further frequent patterns. Single scanning of data set is required to drill out the frequent patterns as all the useful information about the transaction stores in the Prime graph itself. It requires less search space as Miner algorithm Prunes the infrequent itemsets which reduces the size of dataset up to an extent. It is time efficient, as time required in constructing PC-Tree is much greater than the time needed to plot a Prime graph with the same set of data.
This method is an improvement over previous methods in terms of time, space and speed. This method has an advantage over other methods that it is independent of size of dataset, whatever be the size of transaction it can be transformed into prime number and it gives frequency of both elementary itemsets as well as subsets[2]. Our proposed method, is simple to implement, easy to understand and does not includes any complex structures.
This graphical method can extended up to wide applications for enhancing performance of the particular like the prime transformation technique can be embedded with many frequent pattern algorithms like with incremental mining where data sets keeps on changing and operations like update, insert, delete can be easily be performed with the help of prime graph or can be used with interactive mining where new relations can change the value of threshold. This method can be used for large graph structures with unique nodes and can be applied to gaint data sets to find out the particular subset repetition of the transaction which can be useful to avoid frauds as well as can be useful in discovering knowledge for artificial intelligence based applications.
fu"d"k Z bl izLrkfor fof/k ls ;g fu’d’kZ fudyrk gS fd eq[;
xzkQ fof/k xSj inkUos”kh mRifŸk (Without Candidate Generation) vk/kkfjr ,d rduhd gS blfy, ;g vkxs fu;fer iSVuZ mRiUu

ArTIFICIAl InTEllIGEnCE AnD nETWOrK SECurITY
6
djus ds fy, fdlh fu;fer mRifŸk dk mRiknu ugha djrhA fu;fer iSVuZ fMªy vkmV djus ds fy, MkVk lsV dh ,dy LdSfuax vko”;d gS pawfd lHkh dk;Z laiknu laca/kh vko”;d lwpuk,a Lo;a ew[; xzkQ eas lafpr gksrh gSaA ekbuj ,YxksfjFe izwUl vfu;fer vkbVselsV~l ds :Ik esa bls de vuqla/kku LFky dh vko”;drk gksrh gS tks ,d gn rd MkVklsV ds vkdkj dks de dj nsrk gSA MkVk ds ,d gh lsV ds lkFk ,d izeq[k xzkQ dh :ijs[kk cukus ds fy, vko”;d le; dh rqyuk esa vf/kd ihlh Vªh ds fuekZ.k esa visf{kr le; ds :i esa ;g fof/k le;&izHkkoh gSA
;g fof/k le;] LFkku vkSj xfr ds ekeys esa fiNyh fof/k;ksa ij ,d lq/kkj gSA bl fof/k dk vU; nwljh fof/k;ksa dh vis{kk ;g Qk;nk gS fd ;g MkVkcsl dk ,d Lora= vkdkj fy;s gq, gS] dk;Zlaiknu laca/kh tks Hkh vkdkj gS mUgsa izkbe la[;k esa rCnhy fd;k tk ldrk gS vkSj ;g izkFkfed vkbVelsV ds lkFk lkFk lclsV nksuksa dk gh vko`fr frequency nsrk gSA gekjh izLrkfor fof/k ykxw djus esa ljy vkSj le>us esa vklku gS vkSj fdlh Hkh tfVy <kaps dks “kkfey ugha djrhA
bl xzkfQd fof/k dks izkbe ifjorZu rduhd dh rjg izn”kZu dks c<+kus ds fy, O;kid vuqiz;ksxksa rd c<+k;k tk ldrk gS] izkbe ifjorZu rduhd dks o`f)”khy ekbfuad ds lkFk tSlh dbZ fu;fer ,YxksfjFe ds lkFk ,EcsMM fd;k tk ldrk gS tgka MkVkcsl dks cnyk tk ldrk gS vkSj v|ru djus] Mkyus vkSj gVkus tSls dk;kZsa dks izkbe xzkQ dh enn ls vklkuh ls fd;k tk ldrk gS ;k baVjsfDVo ekbfuax ds lkFk iz;ksx fd;k tk ldrk gS tgka u;s laca/k lhekjs[kk ds ewY;ksa dks cny ldrs gSaA bl fof/k dks vf}rh; uksM ds lkFk cM+s xzkQ lajpkukvksa ds fy, bLrseky fd;k tk ldrk gS vkSj dk;Zlaiknu dh fo”ks’k lclsV iqujko`fRr dk irk yxkus ds fy, cM+s MkVkcsl ij ykxw fd;k tk ldrk gS tks /kks[kk/kM+h ls cpus ds fy, mi;ksxh gksus ds lkFk lkFk vuqiz;ksx vk/kkfjr —f=e cqf) ds fy, Kku dh [kkst esa mi;ksxh gks ldrs gSaA
rEFErEnCEs1. Thashmee Karunaratne, Is frequent pattern mining
useful in building predictive models? Stockholm university, Forum 100, Se-164 40 Kista, Sweden.
2. norwati Mustapha, Mohammad-Hossein nadimi-Shahraki, Ali B Mamat, Md. nasir B Sulaiman A numerical Method For Frequent Patterns Mining Journal Of Theoretical And Applied Information Technology. Journal of Theoretical and Applied Information Technology, 2009.
3. nadimi-Shahraki M.H.; n. Mustapha, M. n.B.Sulaiman, And A. B. Mamat, A new method for mining maximal frequent item sets. Presented At International Ieee Symposium On Information Technology, 2008. Itsim 2008., Malaysia, 2008, pp. 309- 312.
4. Bayardo Jr R. J., Efficiently mining long patterns from databases. ACM Sigmod International Conference On Management Of Data, pp. 85-93, 1998.
5. Burdick D., M. Calimlim, And J. Gehrke, Mafia: A Maximal frequent itemset algorithm for transactional databases. 17th International Conference On Data Engineering, Pp. 443-452, 2001.
6. Jiawei Han ,Jian Pei , Iwen Yin , Mining frequent patterns without candidate generation: A Frequent-Pattern Tree Approach. received May 21, 2000; revised April 21, 2001.
7. Zaki, M. J. Scalable algorithms for association mining. IEEE Transactions on Knowledge and Data Engineering, 2000, pp. 372-390.
8. Bart Goethals, Memory issues in frequent item set mining. Sac’04, March 14–17, 2004.
9. Pei J, Han J, Mortazavi-Asl B, Pinto H, Chen q, Dayal u, Hsu M-C, Prefixspan: Mining sequential patterns efficiently by prefix-projected pattern growth. In: Proceeding of The 2001 International Conference On Data Engineering (Icde’01), Heidelberg, Germany, 2011,Database Technology, Valencia, Spain., 1998.
10. Wang J, Han J, Pei J., Closet+: Searching for the best strategies for mining frequent closed item sets. In: Proceeding of the 2003 ACM Sigkdd International Conference on Knowledge Discovery And Data Mining (Kdd’03), Washington, Dc, Pp 236–245, 2003.
11. Han J, Pei J, Yin Y, Mining frequent patterns without candidate generation. In: Proceeding of the 2000 Acm-Sigmod International Conference On Management Of Data (Sigmod’00), Dallas, Tx, Pp 1–12, 2000.
12. liu J, Paulsen S, Sun X, Wang W, nobel A, Prins J, Mining Approximate Frequent Itemsets In The Presence of noise: Algorithm And Analysis. In: Proceeding of The 2006 Siam International Conference On Data Mining (Sdm’06), Bethesda 2006.
13. lin D. I. And Z. M. Kedem, Pincer-Search: A new algorithm for discovering the maximum frequent set. Advances In Database Technology--Edbt’98: 6th International Conference on Extending
14. Sotiris-Kotsiantis, Dimitris, Association rules Mining: A recent Overview. International Transactions on Computer Science And Engineering, Vol.32 (1), 2006
15. Agarwal, r.C.; Aggarwal, C.C. and Prasad, V.V.V. Depth First Generation Of long Patterns. Sixth Acm Sigkdd International Conference on Knowledge Discovery and Data Mining, pp. 108-118, 2000.
16. Agrawal rakesh, Imilienski T., And Swami Arun. Mining Association rules Between Sets of Items In large Datasets. Sigmod, 207-216, 1993.
17. Cheung David W., lee S. D., and Kao Benjamin. A General incremental technique for maintaining discovered association rules. Proc. International Conference On Database Systems For Advanced Applications, April 1997
18. Rymon R., Search through systematic set enumeration. Third International Conference On Principles Of Knowledge representation and reasoning, pp. 539-550, 1992.
19. lee Chang Hung, lin Cheng ru, and Chen Ming Syan, Sliding window filtering: An efficient method for incremental mining on a time-variant database. Proceedings of 10 th International Conference On Information And Knowledge Management, 263-270, november 2001.

BABBAr: An EFFICIEnT GrAPHICAl APPrOACH FOr FrEquEnT PATTErn MInInG
7
20. Mustapha n., M.n. Sulaiman, M. Othman, and M. H. Selamat, Fast discovery of long patterns for association rules. International Journal of Computer Mathematics, Vol. 80, Pp. 967-976, 2003.
20. Pei Jian, Han Jiawei, nishio Shojiro, Tang Shiwei, And Yang Dongqing, H-Mine: Hyper-structure mining of frequent patterns in large databases. Proc.2001 Int. Conf. on Data Mining, San Jose, Ca, november 2001.
21. Savasere Ashok, Omiecinski Edward, and navathe Shamkant. An efficient algorithm for mining association rules in large databases. Proceedings Of The Very large Data Base Conference, September 1995.
22. Agrawal, r., and Psaila, G. Active Data Mining. In Proceedings on Knowledge Discovery And Data Mining (Kdd -95), 3–8. Menlo Park, 1995
vkfVZfQf”k;y baVsfytsal ds fy, ,YxksfjFe tujsVj Algorithm Generator for Artificial intelligence
Ashwin Suresh Babu, Anandha Vignesh*, Bala Kumar, Krishna Pokkuluri, and S SelviRMK Engineering College, RSM Nagar, Kavaraipettai-601 206, India
*E-mail: [email protected]
lkjka”k
;g ys[k ,d ,YxksfjFe tujsVj çksxzke ds ckjs esa fopkj nsrk gS] tks gekjs fnu&çfrfnu dh xfrfof/k;ksa dks djus ds fy, xkbM ds :i esa ,YxksfjFe dh x.kuk djrk gS vkSj lkekU; lax.kuk ds fy, Hkh ç;ksx gksrk gSA ik;Fku çksxzkfeax Hkk’kk ds dksM dks fy[kdj vkSj uSpqjy Hkk’kk çkslslj dh enn ls bldks dk;kZfUor fd;k tk ldrk gSA ge ,d vkokt dh buiqV nsrs gSa vkSj ifj.kke dke djus ds fy, funs”kksa dk ,d lsV gS ;k vadxf.krh; buiqV ds ekeys esa ,d la[;kRed ifj.kke gS ;k osclkbV ds lpZ ls lacaf/kr Dosjh gS rks osclkbV ds fy, fyad gks tkrk gSA
AbstrActThis paper gives an idea about an Algorithm Generator program which computes algorithm to act
as a guide for doing day-to-day activities and also for general computations. This can be implemented with the help of a natural language Processor and set of other codes written using Python Programming language. We give a voice input and the result is a set of instructions to do a task or a numerical result in case of an arithmetic input, or a link to a website if the query is related to the search of a website.
Keywords: Artificial intelligence, natural language processing, syntactic analysis, semantic analysis, pragmatic analysis, python programming language
Bilingual International Conference on Information Technology: Yesterday, Today, and Tomorrow, 19-21 February 2015, pp. 8-12(C) DESIDOC, 2015
1. IntroductIonThe information technology in the development of
mankind has brought many innovative changes leading to the growth of contemporary techno-world. People look upon technology which automatically senses their needs for reducing the burden and time spent for their jobs. With the technology growing day by day, people expect the machine, i.e., normally an artificial equipment to do something in favour of his/her well being. A computerized system with an automatic algorithm generator could make this come true.
Algorithm generator is based on the computation which acts as a guide for doing day-to-day activities and also for general computational problems. For example, a person who is suffering from certain discomfort can obtain a set of instructions on what to do. If the discomfort is manageable, then it lists a set of medicines that can cure his/her pain immediately, otherwise, it lists a set of doctors that the user can consult. Consider another example, a person who wants to search a piece of information in the internet can instead give his/her input to the Algorithm Generator
and the system gives a set of instructions and a link for the most appropriate website that contains necessary details for the user. Consider an example for performing numerical computation, if a user who is in need of generating Fibonacci series, gives his/her input. The system knows what input is required and prompts the user for the input. Then, it provides a set of instructions on how the computation was done and the numerical result. A great advantage of having this system is that it saves manual effort for obtaining a solution for a task. Based on the command given by the user, the system searches its library to find a more appropriate and easy solution.
This can be implemented with the help of a natural language Processor (nlP) and a set of other codes written using Python Programming language. It includes the three stages of syntactic, semantic, and pragmatic analyses on the voice detected. The possible tools used to bring out this advanced facility includes: A computerized voice recognition system, a hardcore processor, Python programming paradigm, and an embedded code.

BABu: AlGOrITHM GEnErATOr FOr ArTIFICIAl InTEllIGEnCE
9
2. litErAtUrE sUrVEYSiri in Apple IOS allows you to use your voice
to send messages, schedule meetings, place phone calls, and more. But the functionalities of Siri are less than what everyone would imagine. For example, we can’t ask Siri to compute an arithmetic value if a numerical input is given or ask for an optimised solution to a problem. Most importantly we can’t add new functions as needed in Siri but it is possible in our innovation. The book on the natural language Processing with Python by Steven Bird, Ewan Klein and Edward loper tells you how Python Programming language is simple and powerful for including excellent functionality for processing linguistic data.
3. MAtEriAls And MEthods3.1 Materials required and Feasible
EnvironmentThe Algorithm Generator utilized the following
components: a workable computer with Operating System that supports Python Programming language, a Python platform with version 3.4.2, which includes the library PyBrain for machine learning, a microphone and a Python program to implement the Algorithm Generator. This could be used in any environment which the computer prefers and also without any need for training. The instrument could be used anywhere from home, office, college and other institutions. no precautions are to be taken and people need not to memorise and speak the exact words. Instead, they can give a meaningful instruction for which we can get an answer [1].
3.2 Program designThe natural language toolkit, or more commonly
nlTK, is a suite of libraries and programs for symbolic and statistical natural language processing (nlP) for the Python programming language. It segments the sentences and tags these according to the part of speech. The program can be designed in the language that is suitable to the tablet device and which properly incorporates the natural language Processing Toolkit. The Bluetooth specification and characteristics are similar to the existing Bluetooth Technology. There are three major aspects of any natural language understanding theory: The syntax describes the form of the language. It is usually specified by a grammar. The semantics that provides the meaning of the utterances or sentences of the language. Although general semantic theories exist, when we build a natural language understanding system for a particular application, we try to use the simplest representation. The pragmatic component explains how the utterances relate to the world. To understand language, an agent should consider more than the sentence; it has to take into account the context
of the sentence, the state of the world, the goals of the speaker and the listener, special conventions, and the like.
Machine learning is the science of getting computers to act without being explicitly programmed.2 Machine learning is a scientific discipline that explores the construction and study of algorithms that can be learned from data. Such algorithms operate by building a model based on inputs and using that to make predictions or decisions, rather than following only explicitly programmed instructions. This plays a very important role in including different algorithms for implementation.
A useful data type built into Python is the dictionary. unlike sequences, which are indexed by a range of numbers, dictionaries are indexed by keys, which can be any immutable type; strings and numbers can always be keys. Tuples can be used as keys if they contain only strings, numbers, or tuples; if a tuple contains any mutable object either directly or indirectly, it cannot be used as a key. A pair of braces creates an empty dictionary: {}. Placing a comma-separated list of key: value pairs within the braces adds initial key: value pairs to the dictionary; this is also the way dictionaries are written on output. The main operations on a dictionary are storing a value with some key and extracting the value given the key. It is also possible to delete a key: value pair with DEl. If you store using a key that is already in use, the old value associated with that key is forgotten. It is an error to extract a value using a non-existent key. The keys() method of a dictionary object returns a list of all the keys used in the dictionary, in arbitrary order (if you want it sorted, just apply the sorted() function to it). To check whether a single key is in the dictionary, use the “in” keyword [3].
All machine learning algorithms (the ones that build the models) basically consist of the following three things:● A set of possible models to look thorough,● A way to test whether a model is good,● A clever way to find a really good model with
only a few test with which any function can be included4.
3.3 MethodologyThe computer is installed with a Python version
3.4.2 and tested. Then the following algorithm is employed for the Algorithm Generator.
procedure AlGOrITHMGEnErATOrbeginInput:Accept inputif input not clear then begin
ArTIFICIAl InTEllIGEnCE AnD nETWOrK SECurITY
10
Prompt the user to give the input again endelse goto Process
Process:
Syntactic Process:Do Tokenisationif successful then begin analyse the meaning of each words
tokenised if the meaning is unclear then begin goto Input end else goto Semantic Process endelse goto Syntactic Process
Semantic Process:Analyse the true meaning of the word and data
sufficiencyif data is insufficient then begin save the input goto Specific Input endelse goto Pragmatic Process
Specific Input:Accept input by prompting the user to give the
additional informationif input not clear then begin goto Specific Input endelse goto Process
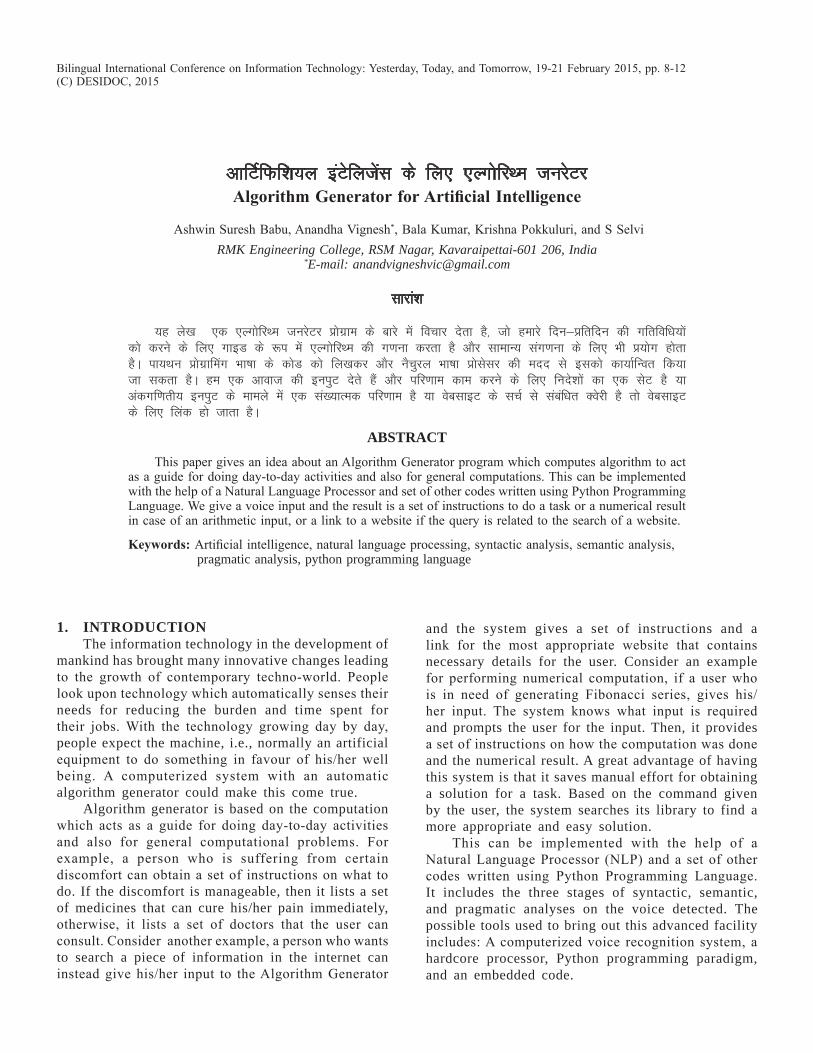
Pragmatic Process:Call the corresponding function based on the
given inputif found then begin do begin switch word of input case ‘Web search’: PrOVIDEWEBlInK case ‘numerical Operat ion’:
DOnuMErICAlOPErATIOn
default: PrInTSTATEMEnT end while( input!=’\0’ ) endelse goto Machine learning
procedure PrOVIDEWEBlInKbegin This function provides a set of instructions in
addition to the link to the webpages to the corresponding input and exits.
end{PrOVIDEWEBlInK}
procedure DOnuMErICAlOPErATIOnbegin This function provides a set of instructions
along with the result of the numerical computation and exits.
end{DOnuMErICAlOPErATIOn}
procedure PrInTSTATEMEnTbegin This function provides a general set of instructions
with some suggestions and exit.end{PrInTSTATEMEnT}
Machine Learning:Include the new case in the Dictionary using
Machine learning Modulesgoto Pragmatic Process
end{AlGOrITHMGEnErATOr}
This algorithm includes logic for the algorithm generator and the machine learning module and is implemented using the Python Programming language with the corresponding functions and cases for the
Figure 1. working diagram of algorithm generator.

BABu: AlGOrITHM GEnErATOr FOr ArTIFICIAl InTEllIGEnCE
11
dictionary included. This program can be executed in the computer and it can run in the computer or any mobile if additional coding is executed.
The input is given in the form of a voice or text. The program first tokenises the sentence into words. Then the meaning for each and every word is analysed. If the meaning of each words is correct, then it goes to semantic stage else it asks the input to be given properly again. In the semantic analysis, the words are collectively analysed for the true meaning and if the data given as input is sufficient to go forward then it proceeds to the pragmatic stage. The pragmatic stage fetches the necessary functions from the Python Dictionaries if the function is already present else the new function is generated using the Machine learning module implemented in python using the library PyBrain. If the function is found then a set of statements is printed with suggestions or a numerical result or a link to a webpage or a website.
3.4 Problems FacedThere are no major problems in the implementation
of the algorithm. But efficiency of natural language Processing in real world implementation is not exactly 100 percent perfect. But it is just about accurate for the system to understand and generate an algorithm. The few issues faced during this implementation are as follows. The easily or mostly solvable problems include Spam Detection, tagging, named entity recognition. Further problems include Sentiment analysis, Co-reference resolution problem, and Word sense disambiguation problem, Parsing, Machine Translation and Information Translation. These problems are solvable if proper research is done and corresponding implementation is included. Some of the problems which are almost impossible to solve are summarization of input and implementation of a dialog system that prompts a related query to the input if the input is ambiguous. Our system simply reacts by saying something like ‘I do not understand you. Come again’.
4. rEsUltsWe considered the input case ‘I am suffering from
cold’. It performed tokenisation and separated the words ‘suffering’ and ‘cold’ and meaning was found to be correct. Then the semantic analysis was carried out by the computer to realise the full meaning. The program realised that the information was insufficient to conclude the type of cold. So the syntactic and semantic process was repeated again to get the detailed information from the user. This time the computer asked ‘What is the severity?’ and the reply was ‘104 C’. Then the pragmatic analysis was carried out to call the function that prints the statements that instructs the user what to do along with the names of Doctors
within the region that the user can consult.It is also applicable in the area of Defence.
Figure 2. syntactic and semantic parse tree.
Suppose a soldier wants to find out the enemies within the region he is located. It employs a GPS Tracker to know the location of the terrorists (Many modern technologies employ thermal imaging for this purpose). And it provides a set of instructions to not only know the location of the terrorists but also specifies an optimised way of reaching them.
5. ConClUsionAn automated system with an algorithm generator
helps us in many ways. A person with disability, a person in urgency, a person who wishes to do his/her task with the aid of a machine and many more can be benefited with the evolution of this system. It is helpful for taking the world to the next level of technology where work is done according to the needs with automation and without manpower. In technical usage, the time spent on doing tasks manually and the computational work can be greatly reduced by the implementation of this system. The technique would even create revolution in the fields of medicine, engineering, mathematics, finance, tourism, Internet, and many more.
Moreover anything which is automated will save energy, resources and work on it which leads to a successful developing environment. It provides a basic platform for the in-depth development of Artificial Intelligence towards science. As Albert Einstein said “A creation which reduces man’s burden defines a true technological development”, this system would be a breakthrough in the world of competition and survival. It is clearly proved from the above facts and proofs that this system, which would be in full-existence in the near future, will be a landmark in the path of modern science.

ArTIFICIAl InTEllIGEnCE AnD nETWOrK SECurITY
12
fu"d"k Z l”kä iqLrdky; mi;ksxdrkZ vo/kkj.kk ,d okLrfodrk
gSA mi;ksxdrkZvksa dh vko”;drkvksa ij vf/kd /;ku fn;k tk jgk gS vkSj iqLrdky;k/;{kksa dks fofo/k çdkj ds mi;ksxdrkZvksa dh vkSj mudh c<rh gqbZ lwpuk lalk/kuksa dh ekax dks iwjk djus ds fy, Mksesu fo”ks’kKrk dks fodflr djuk gksxkA vkt vkSj dy dh leL;kvksa dks jk’Vªh; Lrj ij lalk/ku ds caVokjs ls gh gy fd;k tk ldrk gS vkSj eqä L=ksr lalk/ku lwpuk ds çpkj&çlkj esa egRoiw.kZ Hkwfedk fuHkkrs gSaA vkt lwpuk çkS|ksfxdh vk/kkfjr lsok,a iqLrdky; dfeZ;ksa ds fy, volj vkSj pqukSfr;k¡ nksuksa çnku dj jgs gSaA çeq[k vkbZVh lalk/kuksa esa u dsoy çkS|ksfxdh “kkfey gS vfirq yksx] daVsUV vkSj vFkZ”kkL= Hkh gSA iqLrdky; is”ksojksa dks çkS|ksfxdh vk/kkfjr f”k{kk vkSj lsokvksa dh {kerk le>dj orZeku vkbZVh ifj–”; esa iwjk ykHk mBkuk pkfg,A
ACKnowlEdGEMEntI would like to acknowledge Ms S Selvi and
other authors mentioned in the reference section for the development and the implementation of the above projects. Their continued support is mandatory.
rEFErEnCEs1. Steven Bird, Ewan Klein and Edward loper’s book
on “natural language Processing with Python”.2. https://www.coursera.org/course/ml3 https://docs.python.org/2/tutorial/datastructures.
html4. http://homes.cs.washington.edu/~pedrod/papers/cacm12.
fo”ys’k.kkRed inkuqØe izfØ;k dk mi;ksx djds xsgw¡ Hk.Mkju xksnke ds fy, xq.koŸkk ekWMy vkSj chih raf=dk usVodZ
Quality Assessment Model for wheat storage warehouse using Analytic hierarchy Process and bP neural network
Dudi Priyanka* and Sharma Manmohan#
Lovely Professional University, Phagwara, India *E-mail: [email protected]
lkjka”k
xsg¡w Hk.Mkju xksnke dh xq.koŸkk dk vf/kdkfj;ksa }kjk esU;qvy rjhds ls ewY;kadu fd;k x;k vkSj ;g ik;k x;k fd Hkkjr esa ,slk dksbZ oSKkfud ekWMy ekStwn ugha gSA bl ys[k esa geus fo”ys’k.kkRed inkuqØe izfØ;k ‘Analytical Hierarchy Process’ vkSj okil izpkj raf=dk usVodZ ‘Back Propagation neural network’ dk iz;ksx djrs gq, xq.koŸkk ds vkadyu ds fy, ,d ekWMy fodflr fd;k gSA esVysc MATlAB lks¶Vos;j esa vuqdj.k fd;k tk jgk gS vkSj vuqekfur ifj.kkeksa dk ckn esa irk pysxkA ifj.kke vkSj okLrfod ifj.kke ds chp l%lacaa/k vkSj vuqekfur ifj.kke fodflr ekWMy dh oS/krk dks fn[kkrs gSaA ;g de le; esa vkSj ,d fu/kkZfjr oSKkfud ekWMy ds lkFk xq.koŸkk dk vkadyu djus ds fy, ,d izHkkoh rjhdk iznku djrk gSA
AbstrAct
In India the quality of the wheat storage warehouse is assessed manually by officials and there is no scientific model present for the same. In this paper we have developed a model for the quality assessment using the Analytical Hierarchy Process and the Back Propagation neural network. The simulations are carried out in MATlAB software and the results are deduced thereafter. The results and the correlation between actual results and the deduced results show the validity of the developed model. It provides an effective way to assess the quality in short time and with a prescribed scientific model.
Keywords: Consistency ratio, analytic hierarchy process, AHP, back propagation neural network, BPnn
1. IntroductIonIndia is one of the largest wheat producing country
in the world, still hunger is prevalent in many parts of the country. One of the major factors is inefficient scientific storage warehouses, i.e., the quality of the warehouses is not considered good as per required parameters. There is not any scientific model in effect and the quality is assessed manually. But the shortage of officials is hindrance in the path.
So the paper first decides on the parameters affecting the quality. Then using the comparative analysis of AHP we have developed model by taking inputs from the industry experts. The comparative analysis leads in deciding the weights of the parameters to be included in the BPnn input and hidden layer. Then sample training data is provided to the BPnn and the trained neural network is used for depicting the results of the inputs given.
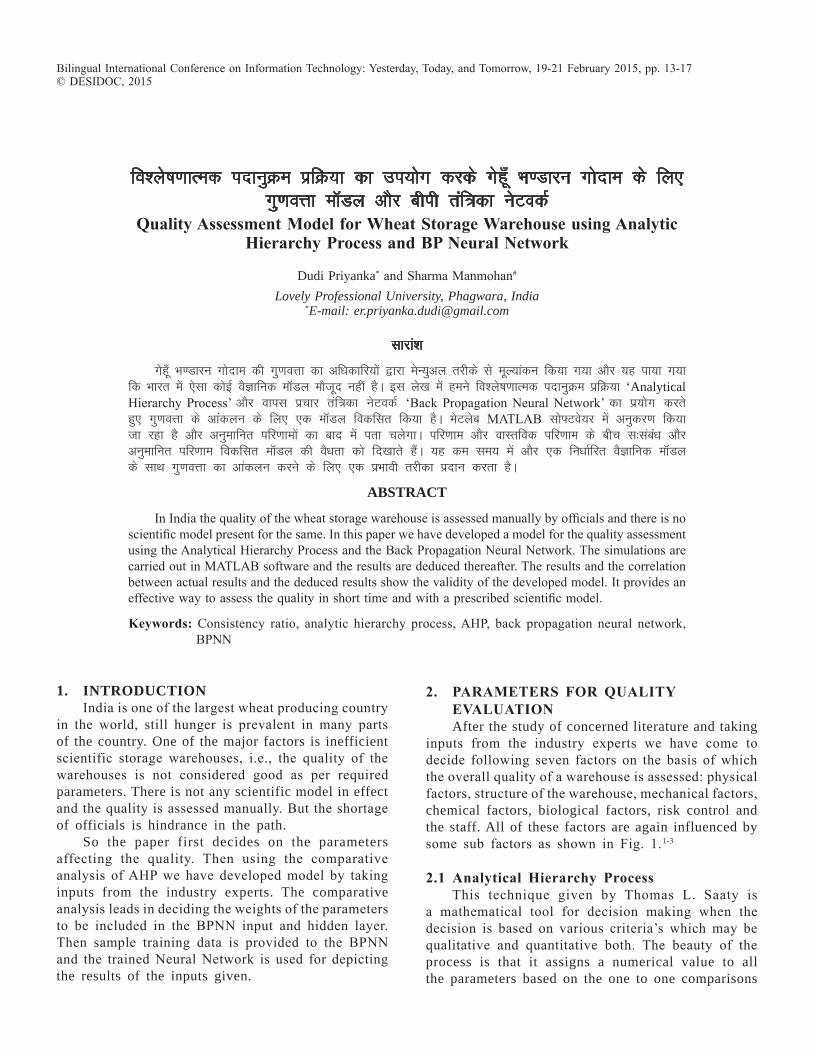
2. PArAMEtErs For QUAlitY EVAlUAtionAfter the study of concerned literature and taking
inputs from the industry experts we have come to decide following seven factors on the basis of which the overall quality of a warehouse is assessed: physical factors, structure of the warehouse, mechanical factors, chemical factors, biological factors, risk control and the staff. All of these factors are again influenced by some sub factors as shown in Fig. 1.1-3
2.1 Analytical hierarchy ProcessThis technique given by Thomas l. Saaty is
a mathematical tool for decision making when the decision is based on various criteria’s which may be qualitative and quantitative both. The beauty of the process is that it assigns a numerical value to all the parameters based on the one to one comparisons
Bilingual International Conference on Information Technology: Yesterday, Today, and Tomorrow, 19-21 February 2015, pp. 13-17© DESIDOC, 2015
ArTIFICIAl InTEllIGEnCE AnD nETWOrK SECurITY
14
made between them based on the Saaty scale. Then different alternatives to the final goal or decision are considered and they are compared with each other for different criteria involved which give the priority of the different alternatives. And the alternative having highest priority is selected.
The first step in AHP process is to decompose the problem at hand into sub problems and create a hierarchy. For instance as shown in Figure 1 for our case and the rest of the procedure discussed above then follows. AHP has been extensively used in decision making processes like health care, business, government, education and others4.
2.2 back Propagation neural networkneural networks is one of the most used soft
computing technique used for approximate reasoning with high optimum output rate. neural networks are the computing techniques inspired by working of biological neuron where learning takes place from experience which is training in artificial neural network. Among neural network the BPnn is most widely used technique because of its easy convergence with less error. The BPnn is applied on a feed forward neural network which consists of at least one hidden layer. literature review supports the fact that a single hidden layer is
enough for getting appropriate results when used with back propagation as it is sophisticated enough to map the non linearity of the inputs to the outputs and it is not very complex to understand or to take more time. In BPnn, the error is back propagated to the hidden layer and the layer weights are changed first. Then the error is propagated to the input layer and correspondingly the input weights are changed for better convergence to the minima where the error is minimum in mapping inputs to their respective targets. BPnn is most widely used because of the positive results it has shown so far5.
3. AhP bPnn ModEl For QUAlitY AssEssMEnt
3.1 AhP CalculationsAfter dividing the main goal of quality assessment
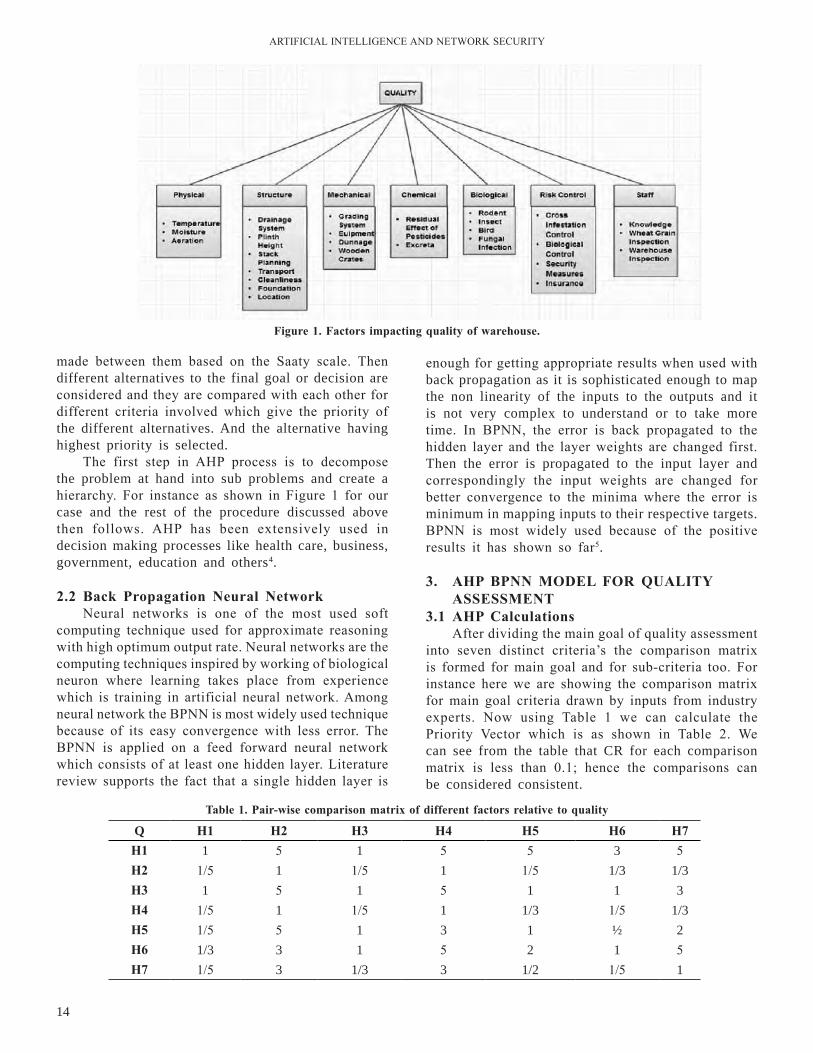
into seven distinct criteria’s the comparison matrix is formed for main goal and for sub-criteria too. For instance here we are showing the comparison matrix for main goal criteria drawn by inputs from industry experts. now using Table 1 we can calculate the Priority Vector which is as shown in Table 2. We can see from the table that CR for each comparison matrix is less than 0.1; hence the comparisons can be considered consistent.
Figure 1. Factors impacting quality of warehouse.
table 1. Pair-wise comparison matrix of different factors relative to quality
Q h1 h2 h3 h4 h5 h6 h7h1 1 5 1 5 5 3 5h2 1/5 1 1/5 1 1/5 1/3 1/3h3 1 5 1 5 1 1 3h4 1/5 1 1/5 1 1/3 1/5 1/3h5 1/5 5 1 3 1 ½ 2h6 1/3 3 1 5 2 1 5h7 1/5 3 1/3 3 1/2 1/5 1

PrIYAnKA: quAlITY ASSESSMEnT MODEl FOr WHEAT STOrAGE WArEHOuSE uSInG AnAlYTIC
15
have used this nn for calculating actual output with linear activation function at both hidden and output layer because of ease of calculation and saving time.
3.2.1 Input LayerThe input layer consists of 27 nodes as we have
27 parameters on the basis of which the quality is to be accessed. The input weights are decided in the basis of AHP method. The corresponding weights are shown as sub factor weights in Table 3.
3.2.2 Hidden LayerFor actual output calculation we have used 7 nodes
in hidden layer on the basis of AHPBPnn model. The corresponding layer weights are also calculated by AHP method and are shown as factor weights in Table 3. During simulation the hidden layer may vary depending upon the accuracy of output generated. We will be using hit and search method to find the number of hidden layer nodes.
3.2 AhP-bP neural network designThe neural network hence designed is as shown
in now the lambda (max) calculated is 7.4642. The CI (Consistency Index) and Cr (Consistency ratio) are 0.0774 and 0.0586 respectively. Since Cr<0.1, hence we consider the comparisons are consistent not any random value. now similarly carrying out the calculations for sub criteria, the neural network developed is shown in Table 3 and in Figure 2. We
table 2. Priority vector for different factors
table 3. weights for different factors
h1 0.3207h2 0.0409h3 0.2008h4 0.0398h5 0.1318h6 0.1893h7 0.0767
Goal Factors Factor weight sub factor sub factor weight AhP consistency test
quAlI TY
Physical Factors0.3207 Temperature 0.6150 λmax=3.0027
CI=0.0014Cr=0.0024
Moisture 0.2923Aeration 0.0926
Structure of the Warehouse 0.0409 Drainage System 0.1476 λmax=7.4453CI=0.0742Cr=0.0562
Plinth Height 0.1805Stack Planning 0.1626Transport 0.0685Cleanliness 0.1296Foundation 0.1988location 0.1124
Mechanical Factors 0.2008 Grading System 0.0595 λmax=4.1443CI=0.0481Cr=0.0534
Equipment Availability 0.1782Dunnage Material 0.5728Wooden Crates 0.1896
Chemical Factors 0.0398 Residual Effects of Pesticides 0.8333 λmax=2CI=0.0Cr=0.0
Excreta 0.1667
Biological Factors 0.1318 Rodent 0.2927 λmax=4.0806CI=0.0269Cr=0.0299
Insect 0.3382Bird 0.0991Fungal Infection 0.2700
Risk Control 0.1893 Cross Infestation Control 0.3000 λmax=3.999CI=0.0Cr=0.0
Biological Controls 0.3000Security Measures 0.3000Insurance 0.1000
Staff 0.0767 Knowledge 0.0909 λmax=3CI=0.0Cr=0.0
Food Grain Inspection 0.4545Warehouse Inspection 0.4545
ArTIFICIAl InTEllIGEnCE AnD nETWOrK SECurITY
16
70 per cent, 15 per cent and 15 per cent data is chosen for training, testing and validation respectively. Sim is used for simulation purpose and perform for checking the performance of the BPnn with respect to target outputs. The data is shown in Table 5.
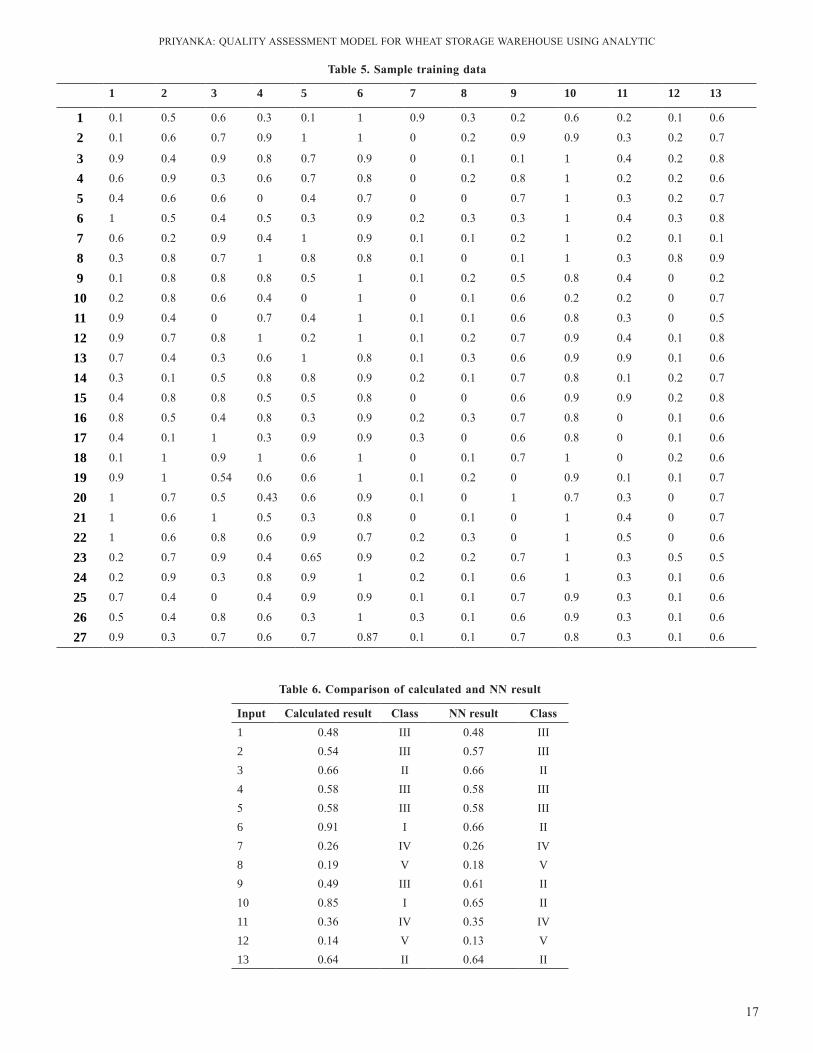
4.3 results ComparisonThe comparison of calculated result and nn result
is done in Table 6. We can see that there are some differences but the accuracy improves as we add more training data. The correlation coefficient of nn result relative to calculated result is 91.75 per cent which proves the validity of the model.
5. ConClUsionsIn this paper we have proposed a model for quality
assessment of wheat storage warehouse in India. The model is developed under the guidance of industry experts. The AHP technique is used to derive the weights for different parameters impacting the quality and then BPnn is used to test the validity of the model in MATlAB environment. The results proved the validity of the AHPBPnn model proposed.
fu’d’k Zbl ys[k ds ek/;e ls geus Hkkjr esa xsg¡w Hk.Mkju xksnku dh
xq.koŸkk dk vkadyu djus ds fy, ,d ekWMy dk izLrko j[kk gSA ekWMy dks m|ksx fo”ks’kKksa ds ekxZn”kZu ds rgr fodflr fd;k x;k gSA xq.koŸkk dks izHkkfor djus okys fofHkUu ekin.Mksa dk izHkko weights izkIr djus ds fy, ,,pih AHP rduhd dk iz;ksx fd;k tkrk gS vkSj fQj esVysc MATlAB okrkoj.k esa ekWMy dh oS/krk dk ijh{k.k djus ds fy, chih,u,u BPnn dk iz;ksx fd;k tkrk gSA ifj.kkeksa us izLrkfor ,,pihohih,u,u AHPBPnn ekWMy dh oS/krk dks lkfcr dj fn;k gSA
rEFErEnCEs1. Sontakay, K. r. Storage and Grading of Agriculture
Commodities, FCI.2. Pinglay, S. V. Handling and Storage of Food
Grains, FCI.3. System, Procedure and Practices of Scientific
Warehousing, CWC Volume 1 and Volume 2.4. Saaty, Thomas l. How to make a Decision: The
Analytic Hierarchy Process, European Journal of Operational Research, 1990, 48, 9–26
5. Dr S. n. Sivanadam, & Dr. S. n. Deepa. Principles of Soft Computing, 2nd Edition.
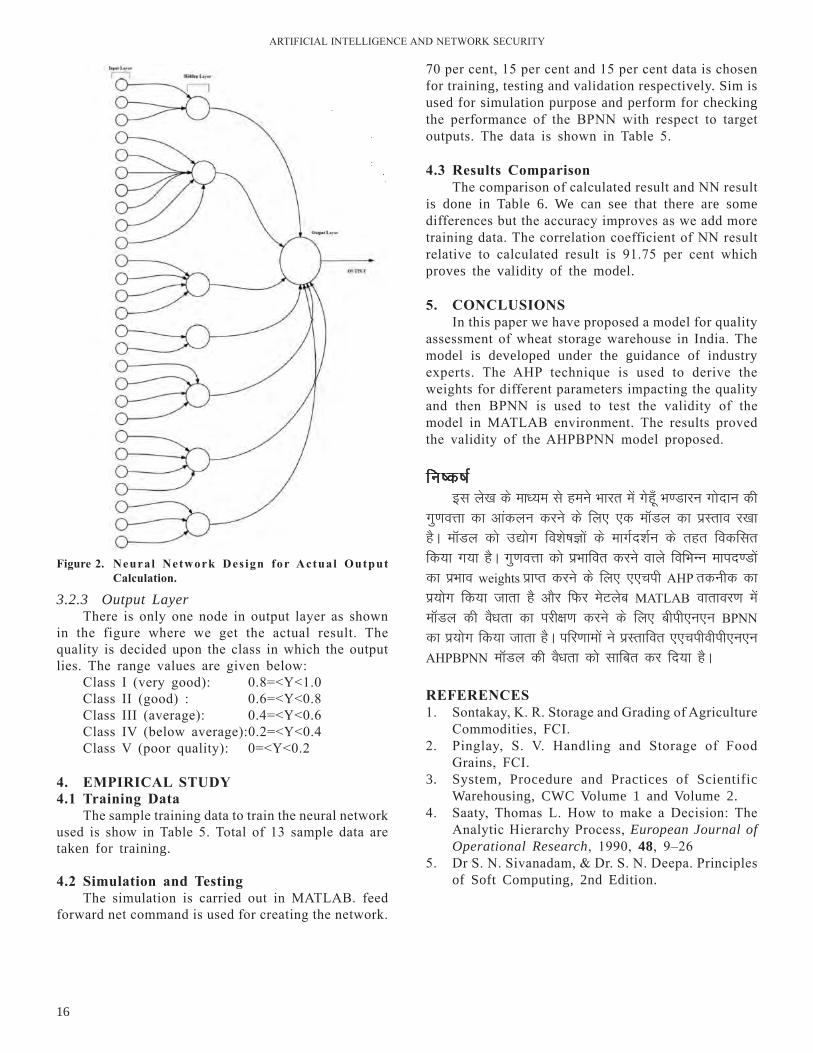
3.2.3 Output LayerThere is only one node in output layer as shown
in the figure where we get the actual result. The quality is decided upon the class in which the output lies. The range values are given below:
Class I (very good): 0.8=<Y<1.0Class II (good) : 0.6=<Y<0.8Class III (average): 0.4=<Y<0.6Class IV (below average):0.2=<Y<0.4Class V (poor quality): 0=<Y<0.2
4. EMPiriCAl stUdY4.1 training data
The sample training data to train the neural network used is show in Table 5. Total of 13 sample data are taken for training.
4.2 simulation and testingThe simulation is carried out in MATlAB. feed
forward net command is used for creating the network.
Figure 2. neural network des ign for Actual output Calculation.
PrIYAnKA: quAlITY ASSESSMEnT MODEl FOr WHEAT STOrAGE WArEHOuSE uSInG AnAlYTIC
17
1 2 3 4 5 6 7 8 9 10 11 12 13
1 0.1 0.5 0.6 0.3 0.1 1 0.9 0.3 0.2 0.6 0.2 0.1 0.6
2 0.1 0.6 0.7 0.9 1 1 0 0.2 0.9 0.9 0.3 0.2 0.7
3 0.9 0.4 0.9 0.8 0.7 0.9 0 0.1 0.1 1 0.4 0.2 0.8
4 0.6 0.9 0.3 0.6 0.7 0.8 0 0.2 0.8 1 0.2 0.2 0.6
5 0.4 0.6 0.6 0 0.4 0.7 0 0 0.7 1 0.3 0.2 0.7
6 1 0.5 0.4 0.5 0.3 0.9 0.2 0.3 0.3 1 0.4 0.3 0.8
7 0.6 0.2 0.9 0.4 1 0.9 0.1 0.1 0.2 1 0.2 0.1 0.1
8 0.3 0.8 0.7 1 0.8 0.8 0.1 0 0.1 1 0.3 0.8 0.9
9 0.1 0.8 0.8 0.8 0.5 1 0.1 0.2 0.5 0.8 0.4 0 0.2
10 0.2 0.8 0.6 0.4 0 1 0 0.1 0.6 0.2 0.2 0 0.7
11 0.9 0.4 0 0.7 0.4 1 0.1 0.1 0.6 0.8 0.3 0 0.5
12 0.9 0.7 0.8 1 0.2 1 0.1 0.2 0.7 0.9 0.4 0.1 0.8
13 0.7 0.4 0.3 0.6 1 0.8 0.1 0.3 0.6 0.9 0.9 0.1 0.6
14 0.3 0.1 0.5 0.8 0.8 0.9 0.2 0.1 0.7 0.8 0.1 0.2 0.7
15 0.4 0.8 0.8 0.5 0.5 0.8 0 0 0.6 0.9 0.9 0.2 0.8
16 0.8 0.5 0.4 0.8 0.3 0.9 0.2 0.3 0.7 0.8 0 0.1 0.6
17 0.4 0.1 1 0.3 0.9 0.9 0.3 0 0.6 0.8 0 0.1 0.6
18 0.1 1 0.9 1 0.6 1 0 0.1 0.7 1 0 0.2 0.6
19 0.9 1 0.54 0.6 0.6 1 0.1 0.2 0 0.9 0.1 0.1 0.7
20 1 0.7 0.5 0.43 0.6 0.9 0.1 0 1 0.7 0.3 0 0.7
21 1 0.6 1 0.5 0.3 0.8 0 0.1 0 1 0.4 0 0.7
22 1 0.6 0.8 0.6 0.9 0.7 0.2 0.3 0 1 0.5 0 0.6
23 0.2 0.7 0.9 0.4 0.65 0.9 0.2 0.2 0.7 1 0.3 0.5 0.5
24 0.2 0.9 0.3 0.8 0.9 1 0.2 0.1 0.6 1 0.3 0.1 0.6
25 0.7 0.4 0 0.4 0.9 0.9 0.1 0.1 0.7 0.9 0.3 0.1 0.6
26 0.5 0.4 0.8 0.6 0.3 1 0.3 0.1 0.6 0.9 0.3 0.1 0.6
27 0.9 0.3 0.7 0.6 0.7 0.87 0.1 0.1 0.7 0.8 0.3 0.1 0.6
table 5. sample training data
table 6. Comparison of calculated and nn result
input Calculated result Class nn result Class1 0.48 III 0.48 III2 0.54 III 0.57 III3 0.66 II 0.66 II4 0.58 III 0.58 III5 0.58 III 0.58 III6 0.91 I 0.66 II7 0.26 IV 0.26 IV8 0.19 V 0.18 V9 0.49 III 0.61 II10 0.85 I 0.65 II11 0.36 IV 0.35 IV12 0.14 V 0.13 V13 0.64 II 0.64 II
MsfUMªfVd lsy ,YxksfjFe vkSj fcyhQ QaD’ku dk ç;ksx dj vfrØe.k tkap dh nj esa lq/kkj vkSj >wBh psrkouh dh nj esa deh
intrusion detection rate improvements and the False Alarm rate minimisation Using dendritic Cell Algorithm and dumpster belief Function
Anuj Gupta*, Atul Kumar Jaiswal# and Amit SaxenaDepartment of CSE, TRUBA, Bhopal, India
#Defence Scientific Information and Documentation Centre, Delhi-110 054, India *E-mail: [email protected]
lkjka”k
bl 'kks/ki= esa] geus ,d la'kksf/kr Mhlh, ,YxksfjFe ij vk/kkfjr ,d Qhpj p;u vkSj Qhpjksa ¼lqfo/kkvksa½ esa deh dh fof/k dk çLrko j[kk gSA çLrkfor ,YxksfjFe de djus ds fy, dbZ Qhpjksa dk p;u djrk gS vkSj ?kVkus dk Qhpj çfrHkkxh dks irk yxkus dh çfØ;k ds fy, rS;kj djrk gSA usVodZ Qkby dh de djus dh fo'ks"krk dks Mhlh, oxhZdj.k ,YxksfjFe }kjk oxhZ—r fd;k tkrk gSA Mhlh, ,YxksfjFe esa vxj MsVk dk vkdkj c<+rk gS rks p;u dh lqfo/kk dh fo'ks"krk çfØ;k ds p;u ls lacaf/kr leL;k dks mBkrh gSA bl leL;k dks lqy>kus ds fy, lqfo/kk ds i{kikrh ewY; esa o`f) djus vkSj Qhpj lclsV dk p;u djus ds fy, MEiLVj fcyhQ QaD'ku dk bLrseky fd;k tkrk gS(1]2]A bl 'kks/ki= esa] geus vuko';d tkudkjh ;qä lqfo/kkvksa dks lekIr djus ds fy, rsth ls lqfo/kkvksa dk p;u djus dh fof/k dk çLrko j[kk gS] ftlds ifj.kke Lo:i deh djus okys Qhpj dks gVkus dh çfØ;k dks lh[kus esa rsth vkrh gSA geus lglaca/k xq.kkad] U;wure oxZ çfrxeu =qfV vkSj vf/kdre lwpuk laihM+u lwpdkad lfgr rhu lcls lQy lqfo/kk p;u ,YxksfjFeksa ds lkFk viuh çLrkfor fof/k dh rqyuk dh gS(3A çLrkfor ,YxksfjFe ds lR;kiu vkSj çn'kZu ewY;kadu ds fy, eSVySc l‚¶Vos;j vkSj 10 izfr'kr dsMhMhlh;wih 99 MsVklsV dk ç;ksx fd;k tkrk gSA bl MsVklsV esa yxHkx 5 yk[k mnkgj.k fufgr gSaA ifj.kke dh çfØ;k ls csgrj oxhZdj.k dk irk pyrk gS vkSj ;g fo'ks"krk esa deh djus dh ctk; le; esa deh djrk gSA
AbstrAct
In this paper, we proposed a feature selection and feature reduction method based on a modified DCA algorithm. The proposed algorithm selects multiple features for reduction and the reduce feature set participant for the process of detection. The reduce feature of network file is classified by DCA classification algorithm. In DCA algorithm, if the size of data is increasing, the selection of attribute process raises problem related to feature selection. For solving this problem Dumpster belief function is used to increase the biased value of feature and feature subset selection1,2. In this paper, we proposed a very simple and fast feature selection method to eliminate features with no helpful information, which results in faster learning in process of redundant feature omission. We compared our proposed method with three most successful feature selection algorithms, including Correlation Coefficient, least Square regression Error and Maximal Information Compression Index3. For the validation and performance evaluation of proposed algorithm, MATlAB software and KDDCuP99 dataset 10% was used. This dataset contains approx. 5 lacks number of instances. The process of result shows better classification and reduce time instead of another feature reduction.
Keywords: IDS, AIS, HIS, DCA
1. IntroductIonThe Internet has become a major surrounding for
disseminating malicious codes, in particular, through a web application. Internet Worms spread through computer networks by probing, attacking and infecting remote computers automatically. Computer security is defined as the protection of computer systems against
threats to confidentiality, integrity, and availability. Confidentiality means that information is disclosed only according to policy, integrity means that information is not destroyed or corrupted, and that the system performs correctly, availability means that system services are available when they are needed. The cyber-attack detection system also referred to as the
Bilingual International Conference on Information Technology: Yesterday, Today, and Tomorrow, 19-21 February 2015, pp. 18-23© DESIDOC, 2015
GuPTA: InTruSIOn DETECTIOn rATE IMPrOVEMEnTS AnD THE FAlSE AlArM rATE MInIMISATIOn uSInG DEnDrITIC CEll.....
19
intrusion detection system (IDS)9. It continuously monitors the computer/network system to identify the cyber attacks while they are attempting to attack on a computer/network system. Once an attack is detected, the cyber attack detection system alerts the corresponding security professional who then take a necessary action. In recent year, the computer systems using the principles of human immune system for the intrusion detection11. For half a century, some fairly successful IDSs have been implemented, but were not adapted due to issues of high false positive, poor adaptation and short self-monitored. A promising solution inspired by human immune system (HIS) is rising to meet this challenging problem.
2. hUMAn And ArtiFiCiAl iMMUnE sYstEMThe human immune system (HIS) is quite complex,
elaborate, a complicated collection of cells, organs and pathways. The defence of the HIS is organized in different layers, mainly the exterior defences, which are biochemical and physical barriers for example, skin or bronchi, the physiological barrier, where pH and temperature provide inappropriate living conditions for pathogen system3,4. Every layer has different defence mechanisms and acts on different types of pathogens. The working process of human immune system is the innate immune system The innate immune system, also known as non-specific immune system and first line of defence, comprises the cells and mechanisms that defend the host from infection by other organisms in a non-specific manner. And in another way, the adaptive immune system response provides the vertebrate immune system with the ability to recognize and remember specific pathogens to generate immunity and to mount stronger attacks each time the pathogen is encountered6. Artificial Immune System (AIS) is a new bio-divine model, which is applied to resolve various problems in the field of information security. Artificial Immune Systems in the literature can be defined as “Artificial immune systems (AIS) are adaptive systems, inspired by theoretical immunology and observed immune functions, principles and models, which are applied to problem solving”. There are two important terms that play an important role in Human immune system Antigens and antibodies. Antigens are foreign molecules on ‘intruders’ - that is, epitopes that are recognized by the immune system as foreigners. Antibodies are a part of the immune system which are responsible for detecting and binding to the antigens. The number of antibodies is very less than the number of antigens. In fact, the possible number of antigens is close to infinite; but the possible number of antibodies is not. Inspired by the success of biological immune systems, AIS-based systems also use the concept of
antigen and antibodies, in which a small number of antibodies can detect a large number of antigens. like HIS which protects the human body against the foreign pathogens, the AIS suggest a multilayered protection structure for protecting the computer networks against the unauthorized attacks.
There are similarities between AIS and IDS both of them use pattern recognition and anomaly detection which depends on them (respectively body and computer network) from security-based failures5. And this is the reason that IDS can be designed based on AIS. Both artificial immune system and intrusion detection system use signature and anomaly detection The signature detection part detects the known intrusions and the anomaly detection part is used to detect new types of intrusions. We can identify positive selection, negative selection and clonal algorithms as some pretexts for the artificial immune system. The most popular AIS models which used to design IDSs are negative selection models. An IDS which is based on AIS would be multilayered as we described before. This means that an intruder cannot be successful by crossing only one layer of IDS. Several layers will monitor on specific points of the computer network while each and every of them has a different architecture which makes it harder for intruders to attack12. Furthermore, a successful intrusion on one or more host will not help the intruder to get access to all hosts (because they use different configurations and the IDSs would be divers) and by this means, the speed of the attack will be reduced. Also an AIS based IDS would be disposable. It means that it is not dependent on a single component and its components can be replaced easily by other components.
3. ProPosEd MEthodloGYIn this paper, we proposed a feature selection
and reduction-based intrusion detection system. The process of feature reduction and selection improves the detection and classification ratio of intrusion detection system. The feature selection process used for finding common feature for attacker participant and feature reduction processes used for unwanted feature for those who are not involved in the attack and normal communication. Dendritic cell algorithm (DCA) is used for the reduction of feature. The DCA function work on common feature correlation and generates similar and dissimilar pattern with the help of ACP algorithm. The reduction process reduces the large number of attribute and improves the detection of intrusion detection system. In the process of feature reduction various algorithms are used such algorithm are based on principle of component analysis and neural network.
ArTIFICIAl InTEllIGEnCE AnD nETWOrK SECurITY
20
learning repository namely intrusion detection dataset. Out of these datasets, we created five datasets in total number of instances is 7000 and create five different model sets.
These are number of attacks falling into following categories
We have used parameters, i.e., Accuracy, Precision, recall for datasets. So we can calculate the false
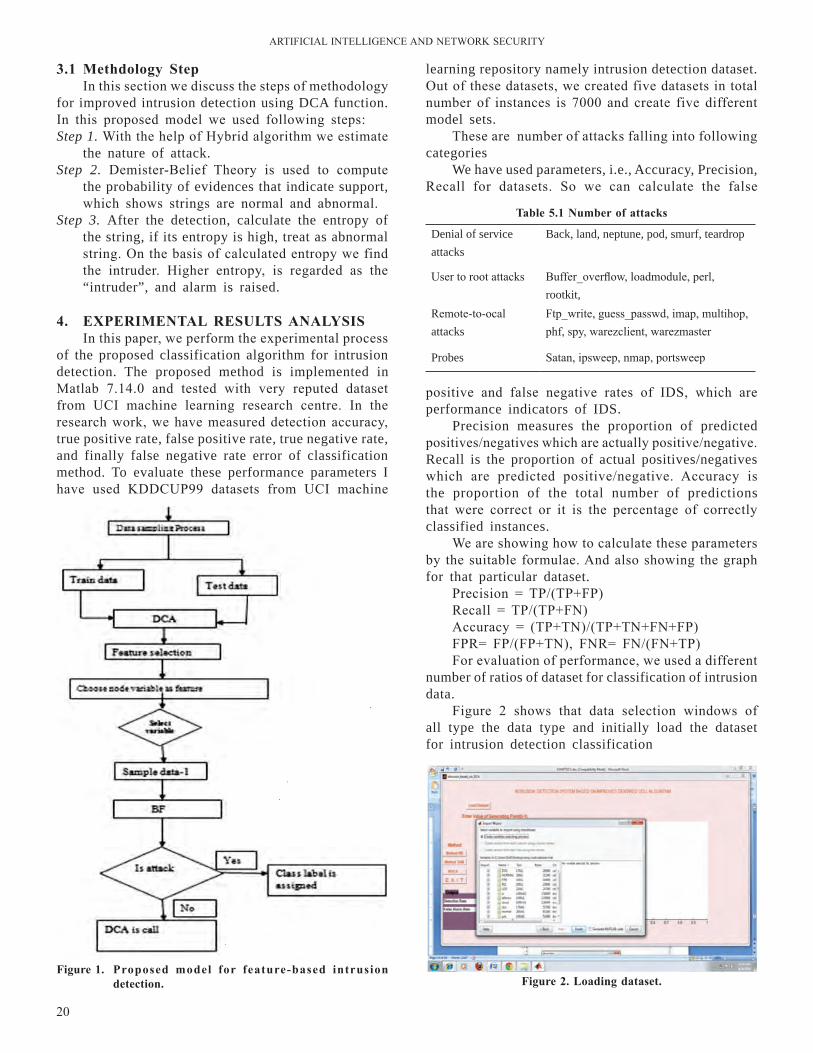
3.1 Methdology stepIn this section we discuss the steps of methodology
for improved intrusion detection using DCA function. In this proposed model we used following steps:Step 1. With the help of Hybrid algorithm we estimate
the nature of attack.Step 2. Demister-Belief Theory is used to compute
the probability of evidences that indicate support, which shows strings are normal and abnormal.
Step 3. After the detection, calculate the entropy of the string, if its entropy is high, treat as abnormal string. On the basis of calculated entropy we find the intruder. Higher entropy, is regarded as the “intruder”, and alarm is raised.
4. ExPEriMEntAl rEsUlts AnAlYsisIn this paper, we perform the experimental process
of the proposed classification algorithm for intrusion detection. The proposed method is implemented in Matlab 7.14.0 and tested with very reputed dataset from uCI machine learning research centre. In the research work, we have measured detection accuracy, true positive rate, false positive rate, true negative rate, and finally false negative rate error of classification method. To evaluate these performance parameters I have used KDDCuP99 datasets from uCI machine
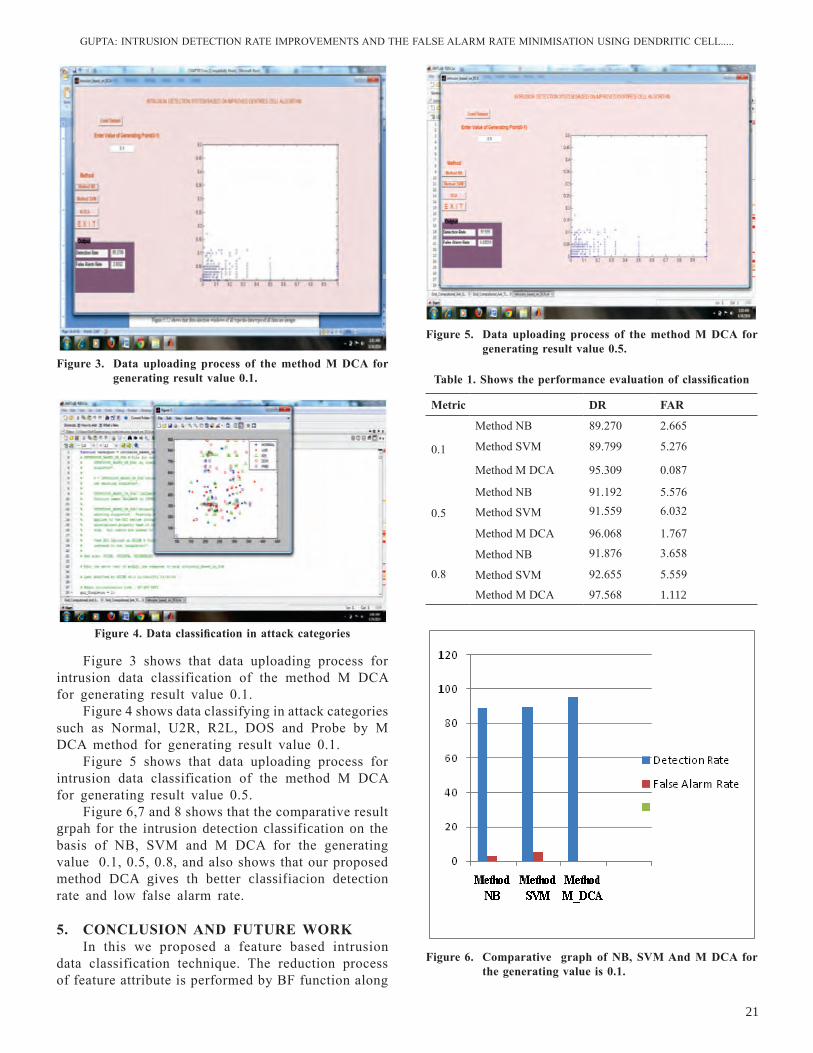
Figure 1. Proposed model for feature-based intrusion detection. Figure 2. loading dataset.
Denial of service attacks
Back, land, neptune, pod, smurf, teardrop
user to root attacks Buffer_overflow, loadmodule, perl, rootkit,
remote-to-ocal attacks
Ftp_write, guess_passwd, imap, multihop, phf, spy, warezclient, warezmaster
Probes Satan, ipsweep, nmap, portsweep
table 5.1 number of attacks
positive and false negative rates of IDS, which are performance indicators of IDS.
Precision measures the proportion of predicted positives/negatives which are actually positive/negative. Recall is the proportion of actual positives/negatives which are predicted positive/negative. Accuracy is the proportion of the total number of predictions that were correct or it is the percentage of correctly classified instances.
We are showing how to calculate these parameters by the suitable formulae. And also showing the graph for that particular dataset.
Precision = TP/(TP+FP)recall = TP/(TP+Fn)Accuracy = (TP+Tn)/(TP+Tn+Fn+FP)FPr= FP/(FP+Tn), Fnr= Fn/(Fn+TP)For evaluation of performance, we used a different
number of ratios of dataset for classification of intrusion data.
Figure 2 shows that data selection windows of all type the data type and initially load the dataset for intrusion detection classification
GuPTA: InTruSIOn DETECTIOn rATE IMPrOVEMEnTS AnD THE FAlSE AlArM rATE MInIMISATIOn uSInG DEnDrITIC CEll.....
21
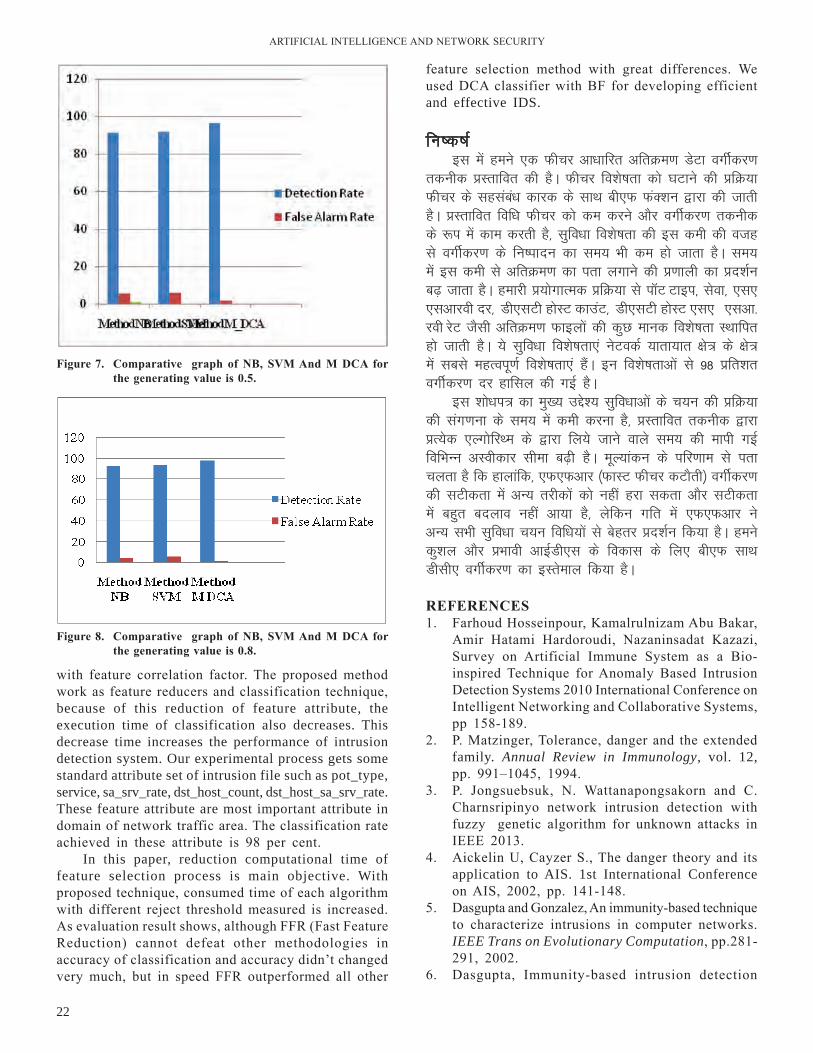
Figure 3. data uploading process of the method M dCA for generating result value 0.1.
Figure 5. data uploading process of the method M dCA for generating result value 0.5.
table 1. shows the performance evaluation of classification
Figure 6. Comparative graph of nb, sVM And M dCA for the generating value is 0.1.
Figure 3 shows that data uploading process for intrusion data classification of the method M DCA for generating result value 0.1.
Figure 4 shows data classifying in attack categories such as normal, u2r, r2l, DOS and Probe by M DCA method for generating result value 0.1.
Figure 5 shows that data uploading process for intrusion data classification of the method M DCA for generating result value 0.5.
Figure 6,7 and 8 shows that the comparative result grpah for the intrusion detection classification on the basis of nB, SVM and M DCA for the generating value 0.1, 0.5, 0.8, and also shows that our proposed method DCA gives th better classifiacion detection rate and low false alarm rate.
5. ConClUsion And FUtUrE worKIn this we proposed a feature based intrusion
data classification technique. The reduction process of feature attribute is performed by BF function along
Metric dr FAr
0.1
Method nB 89.270 2.665
Method SVM 89.799 5.276
Method M DCA 95.309 0.087
0.5
Method nB 91.192 5.576
Method SVM 91.559 6.032
Method M DCA 96.068 1.767
0.8
Method nB 91.876 3.658
Method SVM 92.655 5.559
Method M DCA 97.568 1.112
Figure 4. data classification in attack categories
ArTIFICIAl InTEllIGEnCE AnD nETWOrK SECurITY
22
feature selection method with great differences. We used DCA classifier with BF for developing efficient and effective IDS.
fu"d"k Z bl esa geus ,d Qhpj vk/kkfjr vfrØe.k MsVk oxhZdj.k
rduhd çLrkfor dh gSA Qhpj fo'ks"krk dks ?kVkus dh çfØ;k Qhpj ds lglaca/k dkjd ds lkFk ch,Q QaD'ku }kjk dh tkrh gSA çLrkfor fof/k Qhpj dks de djus vkSj oxhZdj.k rduhd ds :i esa dke djrh gS] lqfo/kk fo'ks"krk dh bl deh dh otg ls oxhZdj.k ds fu"iknu dk le; Hkh de gks tkrk gSA le; esa bl deh ls vfrØe.k dk irk yxkus dh ç.kkyh dk çn'kZu c<+ tkrk gSA gekjh ç;ksxkRed çfØ;k ls i‚V
Vkbi] lsok] ,l,
,lvkjoh nj] Mh,lVh
gksLV
dkmaV] Mh,lVh
gksLV
,l,
,lvk-
joh jsV tSlh vfrØe.k Qkbyksa dh dqN ekud fo'ks"krk LFkkfir
gks tkrh gSA ;s lqfo/kk fo'ks"krk,a usVodZ ;krk;kr {ks= ds {ks= esa lcls egRoiw.kZ fo'ks"krk,a gSaA bu fo'ks"krkvksa ls 98 izfr'kr oxhZdj.k nj gkfly dh xbZ gSA
bl 'kks/ki= dk eq[; mís'; lqfo/kkvksa ds p;u dh çfØ;k dh lax.kuk ds le; esa deh djuk gS] çLrkfor rduhd }kjk çR;sd ,YxksfjFe ds }kjk fy;s tkus okys le; dh ekih xbZ fofHkUu vLohdkj lhek c<+h gSA ewY;kadu ds ifj.kke ls irk pyrk gS fd gkykafd] ,Q,Qvkj ¼QkLV Qhpj dVkSrh½ oxhZdj.k dh lVhdrk esa vU; rjhdksa dks ugha gjk ldrk vkSj lVhdrk esa cgqr cnyko ugha vk;k gS] ysfdu xfr esa ,Q,Qvkj us vU; lHkh lqfo/kk p;u fof/k;ksa ls csgrj çn'kZu fd;k gSA geus dq'ky vkSj çHkkoh vkbZMh,l ds fodkl ds fy, ch,Q lkFk Mhlh, oxhZdj.k dk bLrseky fd;k gSA
rEFErEnCEs1. Farhoud Hosseinpour, Kamalrulnizam Abu Bakar,
Amir Hatami Hardoroudi, nazaninsadat Kazazi, Survey on Artificial Immune System as a Bio-inspired Technique for Anomaly Based Intrusion Detection Systems 2010 International Conference on Intelligent networking and Collaborative Systems, pp 158-189.
2. P. Matzinger, Tolerance, danger and the extended family. Annual Review in Immunology, vol. 12, pp. 991–1045, 1994.
3. P. Jongsuebsuk, n. Wattanapongsakorn and C. Charnsripinyo network intrusion detection with fuzzy genetic algorithm for unknown attacks in IEEE 2013.
4. Aickelin u, Cayzer S., The danger theory and its application to AIS. 1st International Conference on AIS, 2002, pp. 141-148.
5. Dasgupta and Gonzalez, An immunity-based technique to characterize intrusions in computer networks. IEEE Trans on Evolutionary Computation, pp.281-291, 2002.
6. Dasgupta, Immunity-based intrusion detection
Figure 7. Comparative graph of nb, sVM And M dCA for the generating value is 0.5.
Figure 8. Comparative graph of nb, sVM And M dCA for the generating value is 0.8.
with feature correlation factor. The proposed method work as feature reducers and classification technique, because of this reduction of feature attribute, the execution time of classification also decreases. This decrease time increases the performance of intrusion detection system. Our experimental process gets some standard attribute set of intrusion file such as pot_type, service, sa_srv_rate, dst_host_count, dst_host_sa_srv_rate. These feature attribute are most important attribute in domain of network traffic area. The classification rate achieved in these attribute is 98 per cent.
In this paper, reduction computational time of feature selection process is main objective. With proposed technique, consumed time of each algorithm with different reject threshold measured is increased. As evaluation result shows, although FFr (Fast Feature reduction) cannot defeat other methodologies in accuracy of classification and accuracy didn’t changed very much, but in speed FFr outperformed all other
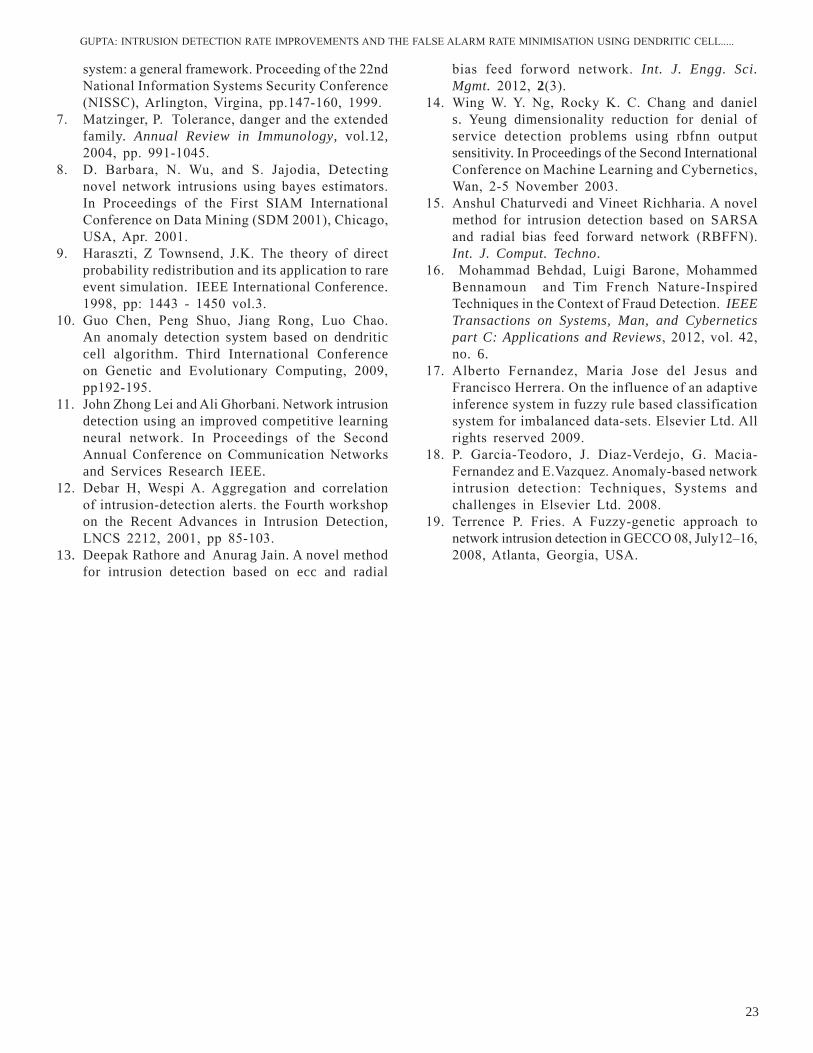
GuPTA: InTruSIOn DETECTIOn rATE IMPrOVEMEnTS AnD THE FAlSE AlArM rATE MInIMISATIOn uSInG DEnDrITIC CEll.....
23
system: a general framework. Proceeding of the 22nd national Information Systems Security Conference (nISSC), Arlington, Virgina, pp.147-160, 1999.
7. Matzinger, P. Tolerance, danger and the extended family. Annual Review in Immunology, vol.12, 2004, pp. 991-1045.
8. D. Barbara, n. Wu, and S. Jajodia, Detecting novel network intrusions using bayes estimators. In Proceedings of the First SIAM International Conference on Data Mining (SDM 2001), Chicago, uSA, Apr. 2001.
9. Haraszti, Z Townsend, J.K. The theory of direct probability redistribution and its application to rare event simulation. IEEE International Conference. 1998, pp: 1443 - 1450 vol.3.
10. Guo Chen, Peng Shuo, Jiang rong, luo Chao. An anomaly detection system based on dendritic cell algorithm. Third International Conference on Genetic and Evolutionary Computing, 2009, pp192-195.
11. John Zhong lei and Ali Ghorbani. network intrusion detection using an improved competitive learning neural network. In Proceedings of the Second Annual Conference on Communication networks and Services Research IEEE.
12. Debar H, Wespi A. Aggregation and correlation of intrusion-detection alerts. the Fourth workshop on the Recent Advances in Intrusion Detection, lnCS 2212, 2001, pp 85-103.
13. Deepak Rathore and Anurag Jain. A novel method for intrusion detection based on ecc and radial
bias feed forword network. Int. J. Engg. Sci. Mgmt. 2012, 2(3).
14. Wing W. Y. ng, rocky K. C. Chang and daniel s. Yeung dimensionality reduction for denial of service detection problems using rbfnn output sensitivity. In Proceedings of the Second International Conference on Machine learning and Cybernetics, Wan, 2-5 november 2003.
15. Anshul Chaturvedi and Vineet richharia. A novel method for intrusion detection based on SARSA and radial bias feed forward network (rBFFn). Int. J. Comput. Techno.
16. Mohammad Behdad, luigi Barone, Mohammed Bennamoun and Tim French nature-Inspired Techniques in the Context of Fraud Detection. IEEE Transactions on Systems, Man, and Cybernetics part C: Applications and Reviews, 2012, vol. 42, no. 6.
17. Alberto Fernandez, Maria Jose del Jesus and Francisco Herrera. On the influence of an adaptive inference system in fuzzy rule based classification system for imbalanced data-sets. Elsevier ltd. All rights reserved 2009.
18. P. Garcia-Teodoro, J. Diaz-Verdejo, G. Macia-Fernandez and E.Vazquez. Anomaly-based network intrusion detection: Techniques, Systems and challenges in Elsevier ltd. 2008.
19. Terrence P. Fries. A Fuzzy-genetic approach to network intrusion detection in GECCO 08, July12–16, 2008, Atlanta, Georgia, uSA.
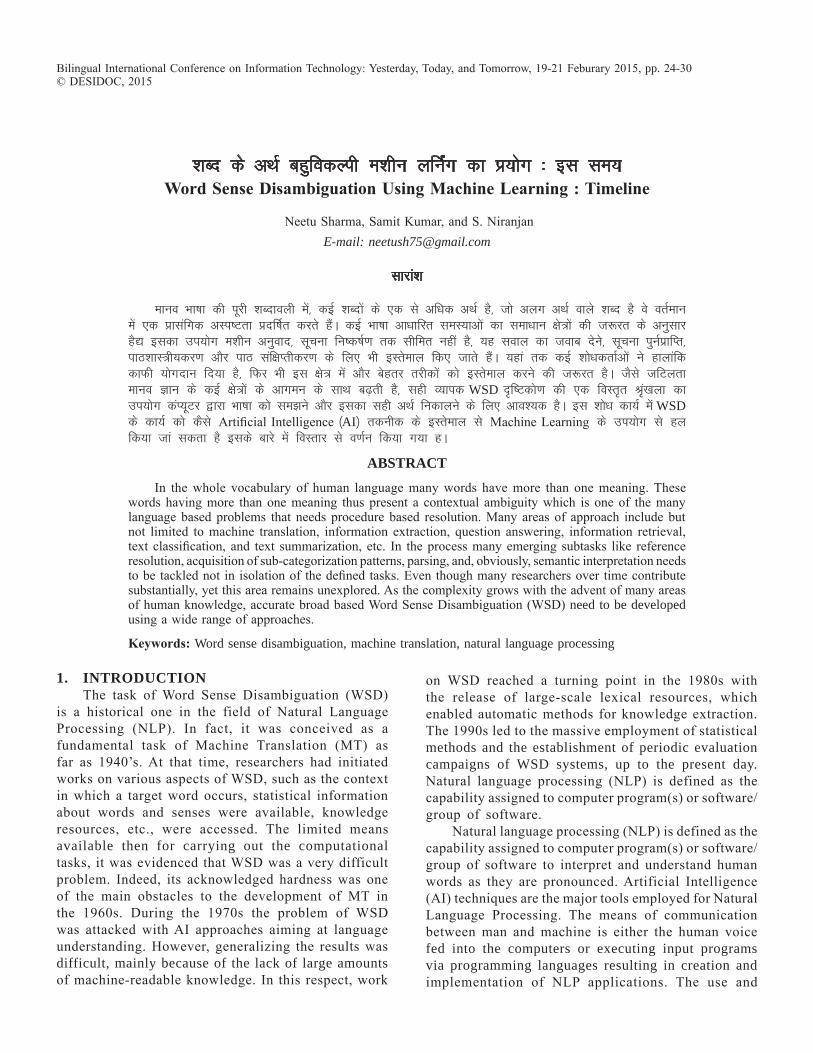
“kCn ds vFkZ cgqfodYih e”khu yfuaZx dk ç;ksx % bl le; word sense disambiguation Using Machine learning : timeline
neetu Sharma, Samit Kumar, and S. niranjanE-mail: [email protected]
lkjka”k
ekuo Hkk’kk dh iwjh “kCnkoyh esa] dbZ “kCnksa ds ,d ls vf/kd vFkZ gS] tks vyx vFkZ okys “kCn gS os orZeku esa ,d çklafxd vLi’Vrk çnf’kZr djrs gSaA dbZ Hkk’kk vk/kkfjr leL;kvksa dk lek/kku {ks=ksa dh t:jr ds vuqlkj gS| bldk mi;ksx e”khu vuqokn] lwpuk fu’d’kZ.k rd lhfer ugha gS] ;g loky dk tokc nsus] lwpuk iquZizkfIr] ikB”kkL=h;dj.k vkSj ikB laf{kIrhdj.k ds fy, Hkh bLrseky fd, tkrs gSaA ;gka rd dbZ “kks/kdrkZvksa us gkykafd dkQh ;ksxnku fn;k gS] fQj Hkh bl {ks= esa vkSj csgrj rjhdksa dks bLrseky djus dh t:jr gSA tSls tfVyrk ekuo Kku ds dbZ {ks=ksa ds vkxeu ds lkFk c<+rh gS] lgh O;kid WSD –f’Vdks.k dh ,d foLr`r J`a[kyk dk mi;ksx daI;wVj }kjk Hkk’kk dks le>us vkSj bldk lgh vFkZ fudkyus ds fy, vko”;d gSA bl “kks/k dk;Z esa WSD ds dk;Z dks dSls Artificial Intelligence ¼AI½ rduhd ds bLrseky ls Machine learning ds mi;ksx ls gy fd;k tka ldrk gS blds ckjs esa foLrkj ls o.kZu fd;k x;k gA
AbstrActIn the whole vocabulary of human language many words have more than one meaning. These
words having more than one meaning thus present a contextual ambiguity which is one of the many language based problems that needs procedure based resolution. Many areas of approach include but not limited to machine translation, information extraction, question answering, information retrieval, text classification, and text summarization, etc. In the process many emerging subtasks like reference resolution, acquisition of sub-categorization patterns, parsing, and, obviously, semantic interpretation needs to be tackled not in isolation of the defined tasks. Even though many researchers over time contribute substantially, yet this area remains unexplored. As the complexity grows with the advent of many areas of human knowledge, accurate broad based Word Sense Disambiguation (WSD) need to be developed using a wide range of approaches.
Keywords: Word sense disambiguation, machine translation, natural language processing
Bilingual International Conference on Information Technology: Yesterday, Today, and Tomorrow, 19-21 Feburary 2015, pp. 24-30 © DESIDOC, 2015
1. IntroductIonThe task of Word Sense Disambiguation (WSD)
is a historical one in the field of natural language Processing (nlP). In fact, it was conceived as a fundamental task of Machine Translation (MT) as far as 1940’s. At that time, researchers had initiated works on various aspects of WSD, such as the context in which a target word occurs, statistical information about words and senses were available, knowledge resources, etc., were accessed. The limited means available then for carrying out the computational tasks, it was evidenced that WSD was a very difficult problem. Indeed, its acknowledged hardness was one of the main obstacles to the development of MT in the 1960s. During the 1970s the problem of WSD was attacked with AI approaches aiming at language understanding. However, generalizing the results was difficult, mainly because of the lack of large amounts of machine-readable knowledge. In this respect, work
on WSD reached a turning point in the 1980s with the release of large-scale lexical resources, which enabled automatic methods for knowledge extraction. The 1990s led to the massive employment of statistical methods and the establishment of periodic evaluation campaigns of WSD systems, up to the present day. natural language processing (nlP) is defined as the capability assigned to computer program(s) or software/group of software.
natural language processing (nlP) is defined as the capability assigned to computer program(s) or software/group of software to interpret and understand human words as they are pronounced. Artificial Intelligence (AI) techniques are the major tools employed for natural language Processing. The means of communication between man and machine is either the human voice fed into the computers or executing input programs via programming languages resulting in creation and implementation of nlP applications. The use and
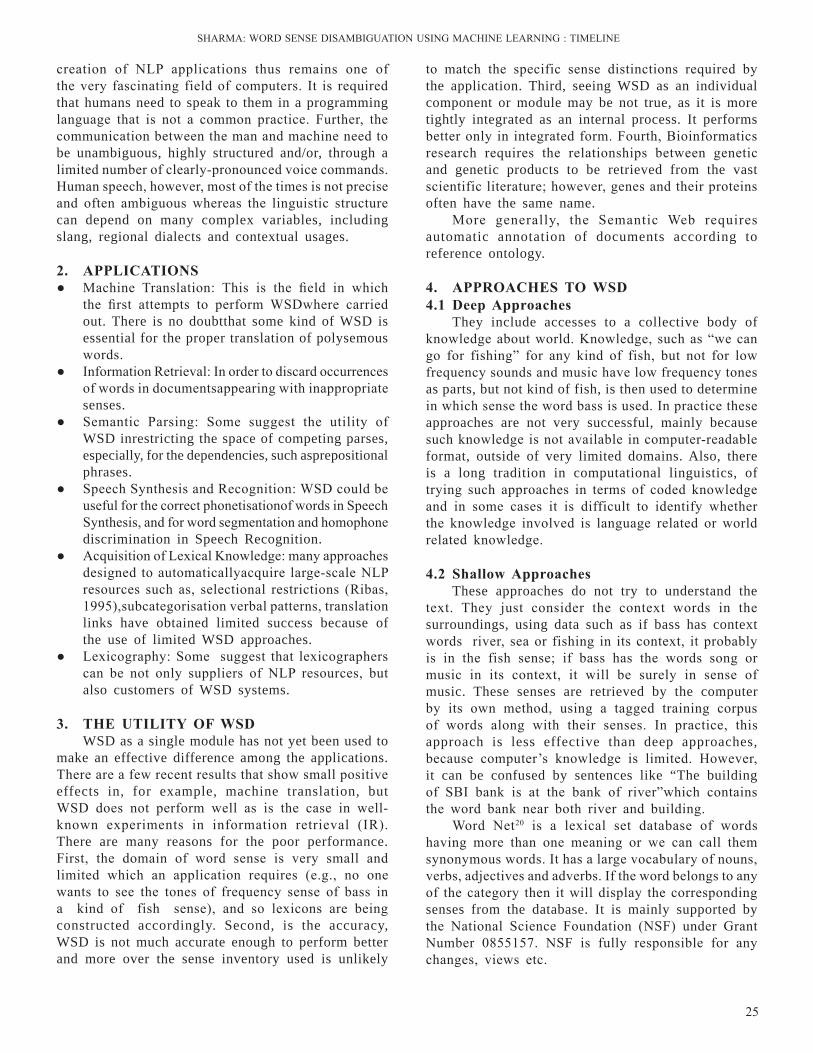
25
SHArMA: WOrD SEnSE DISAMBIGuATIOn uSInG MACHInE lEArnInG : TIMElInE
creation of nlP applications thus remains one of the very fascinating field of computers. It is required that humans need to speak to them in a programming language that is not a common practice. Further, the communication between the man and machine need to be unambiguous, highly structured and/or, through a limited number of clearly-pronounced voice commands. Human speech, however, most of the times is not precise and often ambiguous whereas the linguistic structure can depend on many complex variables, including slang, regional dialects and contextual usages.
2. APPliCAtions● Machine Translation: This is the field in which
the first attempts to perform WSDwhere carried out. There is no doubtthat some kind of WSD is essential for the proper translation of polysemous words.
● Information retrieval: In order to discard occurrences of words in documentsappearing with inappropriate senses.
● Semantic Parsing: Some suggest the utility of WSD inrestricting the space of competing parses, especially, for the dependencies, such asprepositional phrases.
● Speech Synthesis and recognition: WSD could be useful for the correct phonetisationof words in Speech Synthesis, and for word segmentation and homophone discrimination in Speech Recognition.
● Acquisition of lexical Knowledge: many approaches designed to automaticallyacquire large-scale nlP resources such as, selectional restrictions (ribas, 1995),subcategorisation verbal patterns, translation links have obtained limited success because of the use of limited WSD approaches.
● lexicography: Some suggest that lexicographers can be not only suppliers of nlP resources, but also customers of WSD systems.
3. thE UtilitY oF wsdWSD as a single module has not yet been used to
make an effective difference among the applications. There are a few recent results that show small positive effects in, for example, machine translation, but WSD does not perform well as is the case in well-known experiments in information retrieval (Ir). There are many reasons for the poor performance. First, the domain of word sense is very small and limited which an application requires (e.g., no one wants to see the tones of frequency sense of bass in a kind of fish sense), and so lexicons are being constructed accordingly. Second, is the accuracy, WSD is not much accurate enough to perform better and more over the sense inventory used is unlikely
to match the specific sense distinctions required by the application. Third, seeing WSD as an individual component or module may be not true, as it is more tightly integrated as an internal process. It performs better only in integrated form. Fourth, Bioinformatics research requires the relationships between genetic and genetic products to be retrieved from the vast scientific literature; however, genes and their proteins often have the same name.
More generally, the Semantic Web requires automatic annotation of documents according to reference ontology.
4. APProAChEs to wsd4.1 deep Approaches
They include accesses to a collective body of knowledge about world. Knowledge, such as “we can go for fishing” for any kind of fish, but not for low frequency sounds and music have low frequency tones as parts, but not kind of fish, is then used to determine in which sense the word bass is used. In practice these approaches are not very successful, mainly because such knowledge is not available in computer-readable format, outside of very limited domains. Also, there is a long tradition in computational linguistics, of trying such approaches in terms of coded knowledge and in some cases it is difficult to identify whether the knowledge involved is language related or world related knowledge.
4.2 shallow ApproachesThese approaches do not try to understand the
text. They just consider the context words in the surroundings, using data such as if bass has context words river, sea or fishing in its context, it probably is in the fish sense; if bass has the words song or music in its context, it will be surely in sense of music. These senses are retrieved by the computer by its own method, using a tagged training corpus of words along with their senses. In practice, this approach is less effective than deep approaches, because computer’s knowledge is limited. However, it can be confused by sentences like “The building of SBI bank is at the bank of river”which contains the word bank near both river and building.
Word net20 is a lexical set database of words having more than one meaning or we can call them synonymous words. It has a large vocabulary of nouns, verbs, adjectives and adverbs. If the word belongs to any of the category then it will display the corresponding senses from the database. It is mainly supported by the national Science Foundation (nSF) under Grant number 0855157. nSF is fully responsible for any changes, views etc.

26
ArTIFICIAl InTEllIGEnCE AnD nETWOrK SECurITY
and thus suitable for various kinds of knowledge.As in human learning the process of machine
learning is affected by the presence (or absence) of a teacher. In the supervised learning systems the teacher explicitly specifies the desired output (e.g., the class or the concept) when an example is presented to the system(i.e. the system uses pre-classified data).
In the reinforcement learning systems the exact output is unknown, rather an estimate of its quality (positive or negative) is used to guide the learning process. Conceptual clustering (category formation)and Database discovery are two instances of unsupervised learning. The aim of such systems is to analyze data and classify them in categories or find some interesting regularities in the data without using pre-classified training examples.
Machine learning studies computer algorithms for making the machine learn. For example, there are so many tasks which can be performed by the user like he/she might be interested in learning to complete a task, or to make predictions more precise, or to behave in intelligent manner. The learning that is being done is always based on some sort of observations or data, such as examples, experience, or instructions. So in general, machine learning is meant to do better in the future based on what was experienced in the past.
The importance of machine learning is based on automatic methods. In other words, the goal is to devise learning algorithms that do the learning automatically without human intervention or assistance. The machine learning paradigm can be viewed as programming by example. For a specific task in mind, such as E-mail filtering, rather than writing the programs to solve the task directly, in machine learning, the computer will work with its own program using the examples that already provided or feed. Machine learning is a main subfield of artificial intelligence. It is very unlikely that we will be able to build any kind of intelligent system capable of any of the facilities that we associate with intelligence, such as language or vision, without using learning to get there. These tasks are otherwise simply too difficult to solve. Further, we would not consider a system to be truly intelligent if it were incapable of learning since learning is at the core of intelligence. Although a subarea of AI, machine learning also intersects broadly with other fields, especially statistics, but also mathematics, physics, theoretical computer science and much more.
6. ExAMPlEs oF MAChinE lEArninG ProblEMsThere are many examples of machine learning
problems. Here are several examples:● Optical character recognition: To categorize
images of hand written characters by the letters
Figure 1. A word net for different languages.
5. MAChinE lEArninG learning can be defined as any change in a system
that allows it to perform better the second time on repetition of the same task or on another task drawn from the same population. Depending on the amount and type of knowledge available to the system before the learning phase (system’s a priori knowledge) it can be categorized in several situations as:● The first and simplest form of learning is the
situation when the full knowledge is available that is required for a particular type of task.
● Second type of learning is to store the data in the similar format and it is called rote learning. For example, filling a database.
● Third type is the process of knowledge acquisition in an expert system which is a kind of learning task where some predefined structures (rules, frames etc.) are filled with data specified or unspecified by an expert. In this case only the structure of the knowledge is known.
● Fourth type is the system in which a set of examples (training data) is given and it is required to generate a description of this set in terms of a particular language. This is advance knowledge of the system which is the syntax of any known language on syntactic basis. Possibly some characteristics of the domain from which the examples are drawn are taken (domain knowledge or semantic bias). This is a typical task for Inductive learning and is usually called Concept leaning or learning from examples.Another prevalent type of learning systems is
neural networks based which does not give a knowledge prior and can only react properly to the text. neural networks actually use a kind of a predefined structure of the knowledge to be represented (a network of neuron-like elements), which however is very general
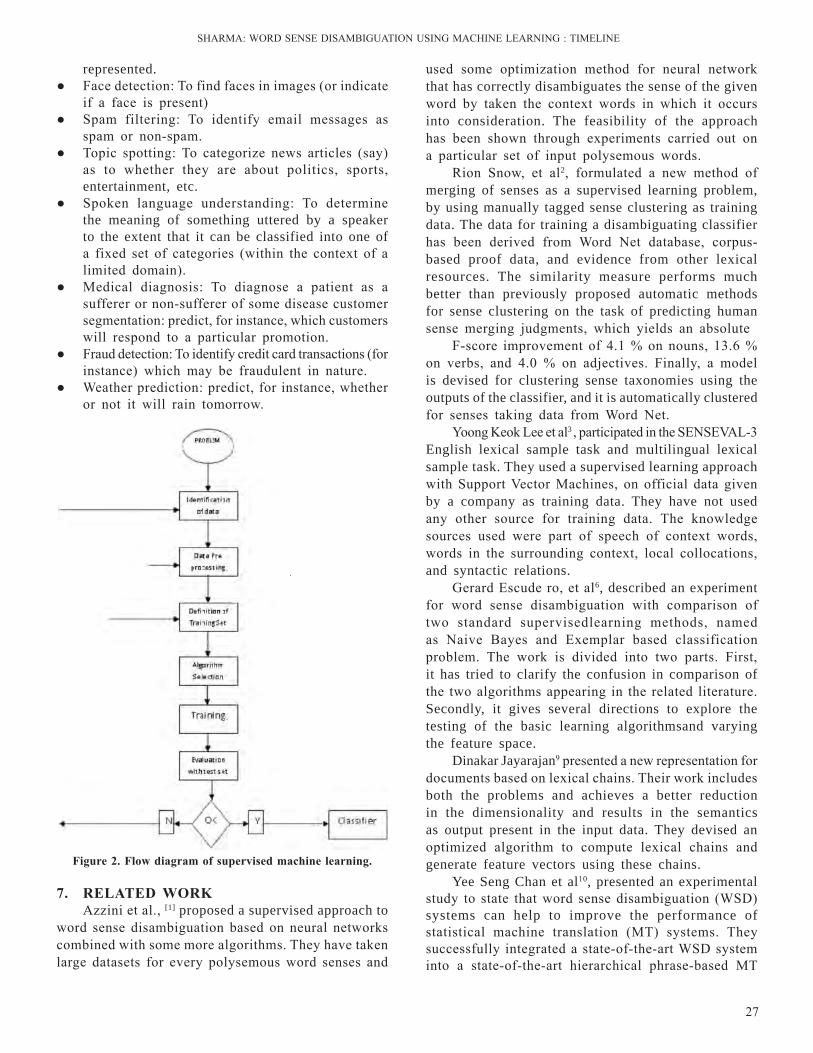
27
SHArMA: WOrD SEnSE DISAMBIGuATIOn uSInG MACHInE lEArnInG : TIMElInE
represented.● Face detection: To find faces in images (or indicate
if a face is present)● Spam filtering: To identify email messages as
spam or non-spam.● Topic spotting: To categorize news articles (say)
as to whether they are about politics, sports, entertainment, etc.
● Spoken language understanding: To determine the meaning of something uttered by a speaker to the extent that it can be classified into one of a fixed set of categories (within the context of a limited domain).
● Medical diagnosis: To diagnose a patient as a sufferer or non-sufferer of some disease customer segmentation: predict, for instance, which customers will respond to a particular promotion.
● Fraud detection: To identify credit card transactions (for instance) which may be fraudulent in nature.
● Weather prediction: predict, for instance, whether or not it will rain tomorrow.
used some optimization method for neural network that has correctly disambiguates the sense of the given word by taken the context words in which it occurs into consideration. The feasibility of the approach has been shown through experiments carried out on a particular set of input polysemous words.
rion Snow, et al2, formulated a new method of merging of senses as a supervised learning problem, by using manually tagged sense clustering as training data. The data for training a disambiguating classifier has been derived from Word net database, corpus-based proof data, and evidence from other lexical resources. The similarity measure performs much better than previously proposed automatic methods for sense clustering on the task of predicting human sense merging judgments, which yields an absolute
F-score improvement of 4.1 % on nouns, 13.6 % on verbs, and 4.0 % on adjectives. Finally, a model is devised for clustering sense taxonomies using the outputs of the classifier, and it is automatically clustered for senses taking data from Word net.
Yoong Keok lee et al3 , participated in the SEnSEVAl-3 English lexical sample task and multilingual lexical sample task. They used a supervised learning approach with Support Vector Machines, on official data given by a company as training data. They have not used any other source for training data. The knowledge sources used were part of speech of context words, words in the surrounding context, local collocations, and syntactic relations.
Gerard Escude ro, et al6, described an experiment for word sense disambiguation with comparison of two standard supervisedlearning methods, named as naive Bayes and Exemplar based classification problem. The work is divided into two parts. First, it has tried to clarify the confusion in comparison of the two algorithms appearing in the related literature. Secondly, it gives several directions to explore the testing of the basic learning algorithmsand varying the feature space.
Dinakar Jayarajan9 presented a new representation for documents based on lexical chains. Their work includes both the problems and achieves a better reduction in the dimensionality and results in the semantics as output present in the input data. They devised an optimized algorithm to compute lexical chains and generate feature vectors using these chains.
Yee Seng Chan et al10, presented an experimental study to state that word sense disambiguation (WSD) systems can help to improve the performance of statistical machine translation (MT) systems. They successfully integrated a state-of-the-art WSD system into a state-of-the-art hierarchical phrase-based MT
Figure 2. Flow diagram of supervised machine learning.
7. rElAtEd worKAzzini et al., [1] proposed a supervised approach to
word sense disambiguation based on neural networks combined with some more algorithms. They have taken large datasets for every polysemous word senses and
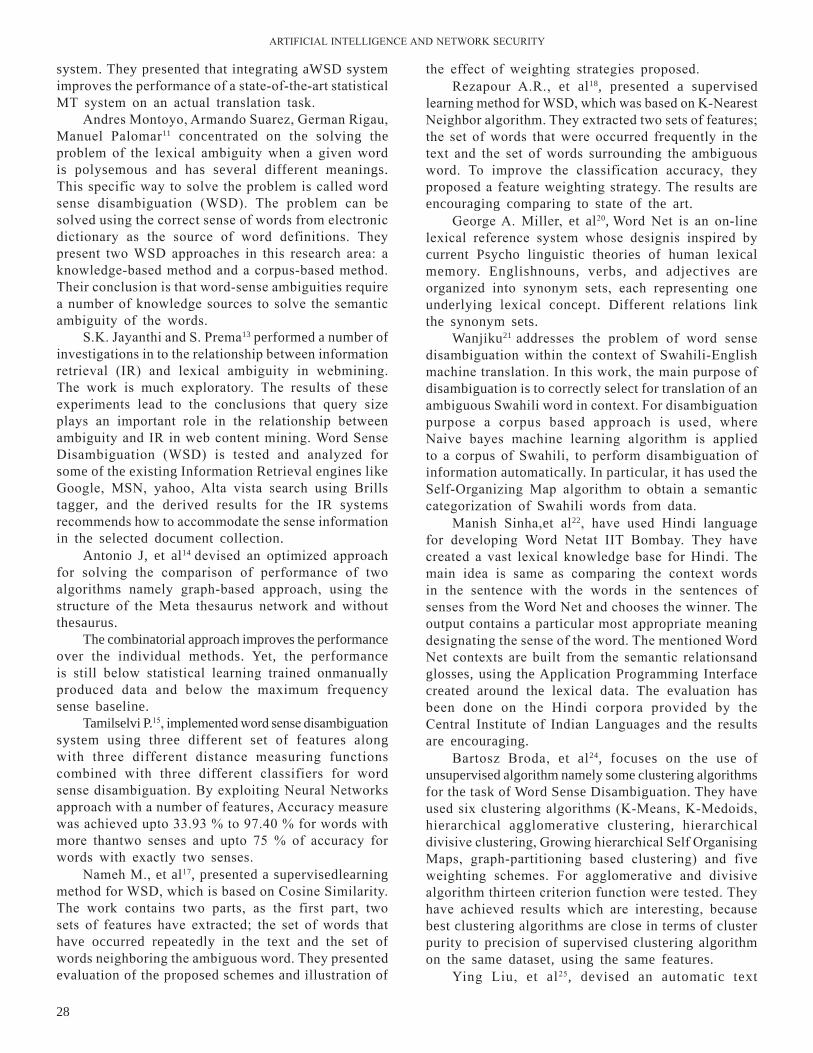
28
ArTIFICIAl InTEllIGEnCE AnD nETWOrK SECurITY
system. They presented that integrating aWSD system improves the performance of a state-of-the-art statistical MT system on an actual translation task.
Andres Montoyo, Armando Suarez, German rigau, Manuel Palomar11 concentrated on the solving the problem of the lexical ambiguity when a given word is polysemous and has several different meanings. This specific way to solve the problem is called word sense disambiguation (WSD). The problem can be solved using the correct sense of words from electronic dictionary as the source of word definitions. They present two WSD approaches in this research area: a knowledge-based method and a corpus-based method. Their conclusion is that word-sense ambiguities require a number of knowledge sources to solve the semantic ambiguity of the words.
S.K. Jayanthi and S. Prema13 performed a number of investigations in to the relationship between information retrieval (Ir) and lexical ambiguity in webmining. The work is much exploratory. The results of these experiments lead to the conclusions that query size plays an important role in the relationship between ambiguity and Ir in web content mining. Word Sense Disambiguation (WSD) is tested and analyzed for some of the existing Information Retrieval engines like Google, MSn, yahoo, Alta vista search using Brills tagger, and the derived results for the IR systems recommends how to accommodate the sense information in the selected document collection.
Antonio J, et al14 devised an optimized approach for solving the comparison of performance of two algorithms namely graph-based approach, using the structure of the Meta thesaurus network and without thesaurus.
The combinatorial approach improves the performance over the individual methods. Yet, the performance is still below statistical learning trained onmanually produced data and below the maximum frequency sense baseline.
Tamilselvi P.15, implemented word sense disambiguation system using three different set of features along with three different distance measuring functions combined with three different classifiers for word sense disambiguation. By exploiting neural networks approach with a number of features, Accuracy measure was achieved upto 33.93 % to 97.40 % for words with more thantwo senses and upto 75 % of accuracy for words with exactly two senses.
nameh M., et al17, presented a supervisedlearning method for WSD, which is based on Cosine Similarity. The work contains two parts, as the first part, two sets of features have extracted; the set of words that have occurred repeatedly in the text and the set of words neighboring the ambiguous word. They presented evaluation of the proposed schemes and illustration of
the effect of weighting strategies proposed.rezapour A.r., et al18, presented a supervised
learning method for WSD, which was based on K-nearest neighbor algorithm. They extracted two sets of features; the set of words that were occurred frequently in the text and the set of words surrounding the ambiguous word. To improve the classification accuracy, they proposed a feature weighting strategy. The results are encouraging comparing to state of the art.
George A. Miller, et al20, Word net is an on-line lexical reference system whose designis inspired by current Psycho linguistic theories of human lexical memory. Englishnouns, verbs, and adjectives are organized into synonym sets, each representing one underlying lexical concept. Different relations link the synonym sets.
Wanjiku21 addresses the problem of word sense disambiguation within the context of Swahili-English machine translation. In this work, the main purpose of disambiguation is to correctly select for translation of an ambiguous Swahili word in context. For disambiguation purpose a corpus based approach is used, where naive bayes machine learning algorithm is applied to a corpus of Swahili, to perform disambiguation of information automatically. In particular, it has used the Self-Organizing Map algorithm to obtain a semantic categorization of Swahili words from data.
Manish Sinha,et al22, have used Hindi language for developing Word netat IIT Bombay. They have created a vast lexical knowledge base for Hindi. The main idea is same as comparing the context words in the sentence with the words in the sentences of senses from the Word net and chooses the winner. The output contains a particular most appropriate meaning designating the sense of the word. The mentioned Word net contexts are built from the semantic relationsand glosses, using the Application Programming Interface created around the lexical data. The evaluation has been done on the Hindi corpora provided by the Central Institute of Indian languages and the results are encouraging.
Bartosz Broda, et al24, focuses on the use of unsupervised algorithm namely some clustering algorithms for the task of Word Sense Disambiguation. They have used six clustering algorithms (K-Means, K-Medoids, hierarchical agglomerative clustering, hierarchical divisive clustering, Growing hierarchical Self Organising Maps, graph-partitioning based clustering) and five weighting schemes. For agglomerative and divisive algorithm thirteen criterion function were tested. They have achieved results which are interesting, because best clustering algorithms are close in terms of cluster purity to precision of supervised clustering algorithm on the same dataset, using the same features.
Ying liu, et al25, devised an automatic text
29
SHArMA: WOrD SEnSE DISAMBIGuATIOn uSInG MACHInE lEArnInG : TIMElInE
classification method for word sense disambiguation. ‘hood’ algorithm is used to remove the ambiguities from the sentences so that each word is replaced by its correct sense in the context. The nearest neighbor of the word senses of all the non-stop words in a give document are selected as the classes for the given document. The algorithm is applied on Brown Corpus database for sentences. The effectiveness is evaluated by comparing the classification results with the classification results using manual disambiguation offered by Princeton university.
Samir Elmougy, et al24, used the rooting algorithm with naive Bayes Classifier to solve the ambiguity of non diacritics words in Arabic language. The Experimental studyproves that using of rooting algorithm with naive Bayes (nB) Classifier enhances the accuracy by 16% and also decreases the dimensionality of the training documents.
8. rEsEArCh issUEsWord Sense Disambiguation is very challenging
field of research. There are many researches challenges that have to solve out:● Different dictionaries and thesauruses provide
different division ofwords into sense. So it is difficult to choose a dictionary for the purpose.
● Sometimes the common sense is needed to disambiguate the meaning of words e.g.
Sita and Geeta are sisters-(they are sister to each other)
Sita and Geeta are mothers - (each is independently mother)
It is very difficult to prepare a system which can understand such common sense.
● Word meaning is infinitely variable and context sensitive. It does not divide up easily into distinct or discrete sub meanings.
● To date there is no large scale, broad coverage, much efficient WSD system exists. Accuracy achieved by previous research is up to 60
● In last few years Word net has been widely adopted as the senseinventory of choice in WSD, however sense inventory is too fine grained for many tasks and this makes the disambiguation very difficult.
● The comparative results of machine learning show that even most sophisticatedmethods have not been able to make a qualitative jump and get close to the solution of problem.
● The knowledge acquisition bottleneck is perhaps the major impediment to solving the WSD problem
● Word meaning does not divide up to discrete senses.
9. ConClUsions The above stated paper concludes that the problem
of word sense disambiguation(WSD) can be solved more effectively using Machine learning technique for finding best sense of ambiguous word. In some papers two algorithms are combined to get more accurate results. In one other paper clustering technique is used to first make clusters of similar senses and then find best sense. Still there is much to do in finding best sense of ambiguous words. For some group of words using machine learning algorithm for WSD gives 86.74 % accuracy that is still below the standard accuracy value. In future it is required to perform even better to improve the accuracy
fu"d"k Z Åij fyf[kr v/;;u dk fu’d’kZ ;g gS fd WSD dks
Machine learning rduhd ds }kjk vkSj Hkh vf/kd çHkkoh <ax ls lgh vFkZ çkIr djus ds fy, mi;ksx fd;k tkrk gSA dqN “kks/k esa os çn”kZu dk vuqdwyu djus ds fy, nks ,Yxksfjne la;qä #i ls bLrseky fd, x, gSaA dqN “kks/ki= esa os çn”kZu esa lq/kkj djus ds fy, DyLVfjax ¼clustering½ dk mi;ksx fd;k x;k gSA ysfdu fQj Hkh “kCn dk lgh vFkZ le>us esa lq/kkj djus ds fy, cgqr dqN djuk ckdh gS| “kCnksa ds dqN fof”k’V lewg ds fy, Machine learning Algorithm dk mi;ksx 86-74% lVhd Kku&vk/kkfjr –f’Vdks.k Hkh ekud WSD ekud ls uhps gS] Hkfo’; esa bl fo’k; ij vkSj “kks/kdk;Z fd vko”;drk gS ftlls fd bls vkSj csgrj ifj.kke çkIr fd, tka ldsA
rEFErEnCEs1. A. Azzini; C. da Costa Pereira; M. Dragoni, & A. G.
B. Tettamanzi, Evolving neural networks for Word Sense Disambiguation, Eighth International Conference on Hybrid Intelligent Systems, 2008.
2. rion Snow; Sushant Prakash; Daniel Jurafsky; Andrew Y. ng ; learning to Merge Word Senses, Computer Science Department Stanford university, 2007.
3. Yoong Keok lee; HweeTou ng & Tee Kiah Chia, Supervised Word Sense Disambiguation with Support Vector Machines and Multiple Knowledge Sources, Department of Computer Science national university of Singapore, 2004.
4. Dan Klein; Kristina Toutanova; TolgaIlhan H.; Sepandar D. Kamvar & Christopher D. Manning, Combining Heterogeneous Classifiers for Word-Sense Disambiguation, Computer Science Department Stanford university, 2002.
5. T. Theodosiou1; n. Darzentas; l. Angelis1 & C. A. Ouzounis, PureD-MCl: a graph-based PubMed document clustering methodology, Vol. 24, (17), 2008.
6. Gerard Escudero; llu´ısM`arquez & German rigau,
30
ArTIFICIAl InTEllIGEnCE AnD nETWOrK SECurITY
naive Bayes and Exemplar-Based approaches to Word Sense Disambiguation Revisited, Proceedings of th 14th European Conference, 2000.
7. David Martinez Iraolak; Supervised Word Sense Disambiguation: Facing Current Challenges, Informatikan Doktoretituluaeskuratzekoaurkezturiko Tesia Donostia, 2004.
8. rada Mihalcea; Word Sense Disambiguation, the 18th European Summer School in logic, language and Information 31 July - 11 August, 2006.
9. Dinakar Jayarajan; using Semantics in Document representation: A lexical Chain Approach, Department of Computer Science and Engineering Indian Institute of technology Madras, June 2009.
10. Yee Seng Chan ; Hwee Tou ng, & David Chiang Word Sense Disambiguation Improves Statistical Machine Translation, Department of Computer Science national university of Singapore, 2007.
11. Andres Montoyo; Armando Su´arez, & German rigau, Combining Knowledge and Corpus-based Word-Sense-Disambiguation Methods, Journal of Artificial Intelligence research, 2005.
12. Hwee Tou ng; Exemplar-Based Word Sense Disambiguation: Some Recent Improvements, DSO national laboratories 20 Science Park Drive Singapore, 1996.
13. Jayanthi S.K. & Prema S., Word Sense Disambiguation in Web Content Mining using Brill‘s Tagger Technique, International Journal of Computer and Electrical Engineering, Vol. 3, June 2011.
14. Antonio J Jimeno-Yepes; Alan r Aronson, Knowledge-based biomedical word sensedisambiguation: comparison of approaches, Jimeno-Yepes and Aronson BMC Bioinformatics 2010.
15. Tamilselvi P., Srivatsa S.K., Case Based Word Sense Disambiguation using Optimal Features, IPCSIT 2011 IACSIT Press, 16, Singapore.
16. David Martinez; Oier lopez de lacalle; Eneko Agirre; On the use of Automatically Acquired Examples for All-nouns Word Sense Disambiguation, university of the Basque Country 20018, Journal of Artificial Intelligence research 2008 33,79-107.
17. nameh M.; Fakhrahmad S.M.; ZolghadriJahromi M. A new Approach to Word Sense Disambiguation Based on Context Similarity, Proceedings of the World Congress on Engineering 2011 I, (July) 6 - 8.
18. rezapour A. r.; Fakhrahmad S. M. & Sadreddini M. H.; Applying Weighted Knn to Word Sense Disambiguation, Proceedings of the World Congress on Engineering 2011 III WCE 2011, (July) 6 - 8.
19. Arindam Chatterjee; SalilJoshii; Pushpak Bhattacharyya; Diptesh Kanojia & Akhlesh Meena, A Study of the Sense Annotation Process: Man v/s Machine, International Conference on Global Wordnets, Matsue, Japan,, Jan, 2012.
20. George A.; Miller, richard Beckwith; Christiane Fellbaum; Derek Gross, & Katherine Miller, Introduction to Wordnet: An On-line lexical Database,August,1993.
21. Wanjiku; Word Sense Disambiguation of Swahili, university of Helsinki Publications Department of General linguistics, university of Helsinki Finland.2010
22. Bartosz Broda,; WojciechMazur; Evaluation of Clustering Algorithms for Polish Word Sense Disambiguation, Institute of Informatics, Wroc law university of Technology, Poland, 2010.
23. Sinha Manish; reddy Mahesh Kumar; Bhattacharyya.r; Pushpak Pandey; Prabhakar Kashyap laxmi, Hindi Word Sense Disambiguation, Department of Computer Science and Engineering, Indian Institute of Technology Bombay, Mumbai, India,2008
25. Elmougy Samir; HamzaTaher; & noaman Hatem M.; Samire lmougy; taher hamza; naive Bayes Classifier for Arabic Word Sense Disambiguation, InFOS 2008, March, 2008 Cairo Egypt 2008 Faculty of Computers and Information-Cairo university,2008
25. Ying liu; Peter Scheuermann; Xingsen li, & Xingquan Zhu, using Wordnet to Disambiguate Word Senses for Text Classification, Y. Shi ICCS 2007, III, lnCS,2007. Springer-Verlag Berlin Heidelberg 2007.
,fMV fMLVsUl vkSj ,u&xzke eSp dk mi;ksx djds vo/kkj.kk ,dhdj.kConcept integration using Edit distance and n-Gram Match
Vikram Singh*, Pradeep Joshi, and Shakti MandhanNational Institute of Technology, Kurukshtra, India
*E-mail: [email protected]
lkjk'ak
lwpuk oyZ~M okbM osc ¼MCY;wMCY;wMCY;w½ ij vf/kdkf/kd rsth ls c<+ jgh lwpukvksa ds fy, ;g vko';d gks x;k gS fd bu lHkh lwpukvksa dks u dsoy yksxksa dks cfYd e'khuksa dks Hkh miyC/k djk;k tk,A vkadM+k lalk/ku ;k lwpuk lalk/ku esa 'kCnkFkZ foKku dks 'kkfey djus ds fy, O;kid :i ls v‚uVksykWth vkSj Vksdu dk mi;ksx fd;k tk jgk gSA bl vo/kkj.kk ls vkSipkfjd :i ls fof'k"Vrkvksa dk vFkZ vfHkçsr gS tks ,d rdZ&vk/kkfjr Hkk"kk esa dwVc) gksrk gS vkSj Li"Vr;k ,slh vo/kkj.kk,a] fo'ks"krk,a vfHkçsr gSa fd fof'k"Vrk,a e'khu }kjk iBuh; gks vkSj ;g vo/kkj.kkRed e‚My Hkh fd yksx fdlh [kkl fo"k; {ks= dh phtksa ds ckjs esa dSls lksprs gSaA vk/kqfud ifj–'; esa] fofHkUu vyx&vyx fo"k;ksa ij vkSj Hkh vkUVksykWth fodflr dh xbZ gSa] ftlds ifj.kkeLo:i fofHkUu v‚UVksykWth ds e/; fudk;ksa dh fofo/krk c< xbZ gSA vo/kkj.kk ,dhdj.k fiNys n'kd esa egRoiw.kZ cu x;k gS vkSj fofo/krk dks de djus vkSj vkadM+k lalk/ku dks l'kä cukus dk lk/ku cu x;k gSA 'kCnkFkZ ;k okD;&jpuk rqyu eku ds vk/kkj ij fofHkUu buiqV lzksrksa ls vo/kkj.kkvksa dks ,dh—r djus ds fy, vusd rduhdsa gSaA bl i= esa] vo/kkj.kksa dks ;qXe ds chp ,fMV fMLVsUl ;k ,u&xzke rqyu ekuksa dk mi;ksx djds vo/kkj.kk ¼v‚UVksykWth ;k Vksdu½ dks ,dh—r djus ds fy, ,d rjhdk çLrkfor fd;k x;k gS vkSj ,dhdj.k çfØ;k dks çHkkfor djus ds fy, vo/kkj.kk vko`fÙk dk ç;ksx fd;k tkrk gSA çLrkfor rduhd ds fu"iknu dh rqyuk vo/kkj.kkvksa ds fofHkUu vkdkjksa ds lanHkZ esa fjd‚y] lVhdrk] ,Q&estj ,oa ,dhdj.k n{krk tSls xq.koÙkk ekunaMksa ij 'kCnkFkZ lekurk vk/kkfjr ,dhdj.k rduhdksa ls dh tkrh gSA fo'ys"k.k n'kkZrk gS fd ,fMV fMLVsUl eku vk/kkfjr baVj,D'ku dk fu"iknu ,u&xzke ,dhdj.k vkSj 'kCnkFkZ lekurk rduhdksa ls csgrj gSA
AbstrAct
Information is growing more rapidly on the World Wide Web (WWW) has made it necessary to make all this information not only available to people but also to the machines. Ontology and token are widely being used to add the semantics in data processing or information processing. A concept formally refers to the meaning of the specification which is encoded in a logic-based language, explicit means concepts, properties that specification is machine readable and also a conceptualization model how people think about things of a particular subject area.In modern scenario more ontologies has been developed on various different topics, results in an increased heterogeneity of entities among the ontologies. The concept integration becomes vital over last decade and a tool to minimize heterogeneity and empower the data processing. There are various techniques to integrate the concepts from different input sources, based on the semantic or syntactic match values. In this paper, an approach is proposed to integrate concept (Ontologies or Tokens) using edit distance or n-gram match values between pair of concept and concept frequency is used to dominate the integration process. The proposed techniques performance is compared with semantic similarity based integration techniques on quality parameters like recall, Precision, F-Measure & integration efficiency over the different size of concepts. The analysis indicates that edit distance value based interaction outperformed n-gram integration and semantic similarity techniques.
Keyword: Concept integration,ontology integration, ontologymatching, n-gram, edit distance,token, concept mining
Bilingual International Conference on Information Technology: Yesterday, Today, and Tomorrow, 19-21 February 2015, pp. 31-38© DESIDOC, 2015
1. IntroductIonData mining is a process of extraction the utilizable
data from divergent perspective. Data mining also
called as data or knowledge discovery1. Data mining provides the different kinds of mining techniques for gathering, grouping, and extracting the information
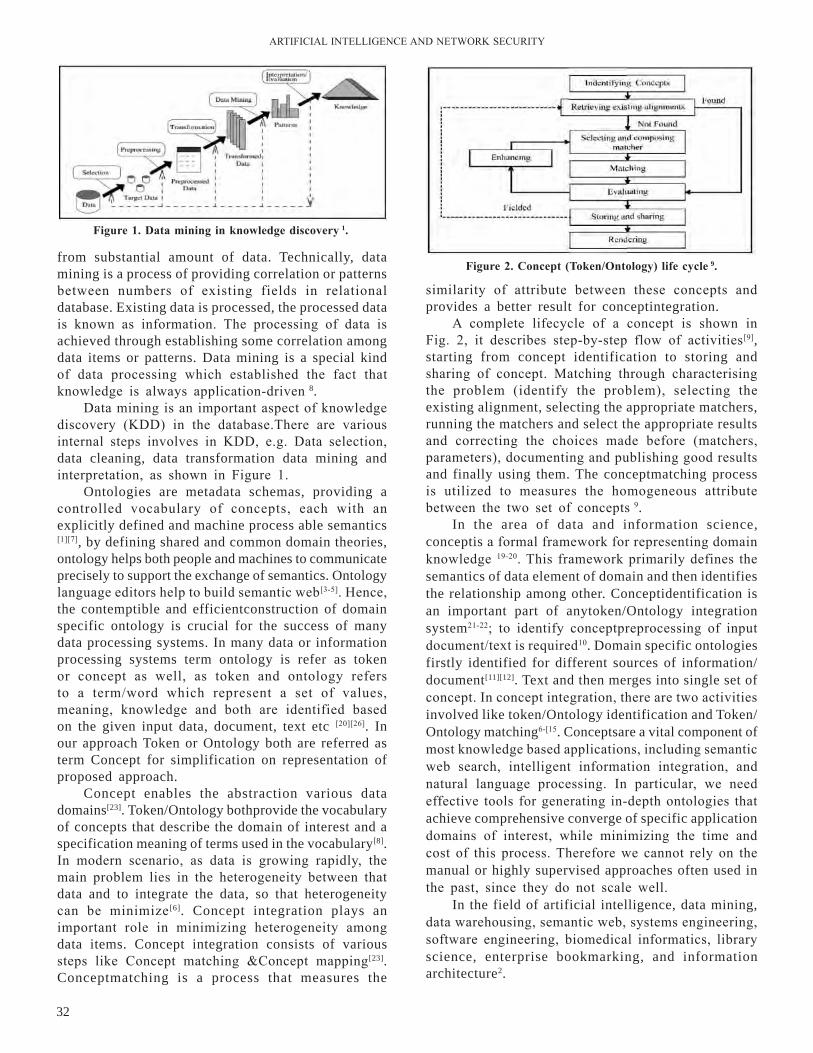
ArTIFICIAl InTEllIGEnCE AnD nETWOrK SECurITY
32
from substantial amount of data. Technically, data mining is a process of providing correlation or patterns between numbers of existing fields in relational database. Existing data is processed, the processed data is known as information. The processing of data is achieved through establishing some correlation among data items or patterns. Data mining is a special kind of data processing which established the fact that knowledge is always application-driven 8.
Data mining is an important aspect of knowledge discovery (KDD) in the database.There are various internal steps involves in KDD, e.g. Data selection, data cleaning, data transformation data mining and interpretation, as shown in Figure 1.
Ontologies are metadata schemas, providing a controlled vocabulary of concepts, each with an explicitly defined and machine process able semantics [1][7], by defining shared and common domain theories, ontology helps both people and machines to communicate precisely to support the exchange of semantics. Ontology language editors help to build semantic web[3-5]. Hence, the contemptible and efficientconstruction of domain specific ontology is crucial for the success of many data processing systems. In many data or information processing systems term ontology is refer as token or concept as well, as token and ontology refers to a term/word which represent a set of values, meaning, knowledge and both are identified based on the given input data, document, text etc [20][26]. In our approach Token or Ontology both are referred as term Concept for simplification on representation of proposed approach.
Concept enables the abstraction various data domains[23]. Token/Ontology bothprovide the vocabulary of concepts that describe the domain of interest and a specification meaning of terms used in the vocabulary[8]. In modern scenario, as data is growing rapidly, the main problem lies in the heterogeneity between that data and to integrate the data, so that heterogeneity can be minimize [6]. Concept integration plays an important role in minimizing heterogeneity among data items. Concept integration consists of various steps like Concept matching &Concept mapping[23]. Conceptmatching is a process that measures the
similarity of attribute between these concepts and provides a better result for conceptintegration.
A complete lifecycle of a concept is shown in Fig. 2, it describes step-by-step flow of activities[9], starting from concept identification to storing and sharing of concept. Matching through characterising the problem (identify the problem), selecting the existing alignment, selecting the appropriate matchers, running the matchers and select the appropriate results and correcting the choices made before (matchers, parameters), documenting and publishing good results and finally using them. The conceptmatching process is utilized to measures the homogeneous attribute between the two set of concepts 9.
In the area of data and information science, conceptis a formal framework for representing domain knowledge 19-20. This framework primarily defines the semantics of data element of domain and then identifies the relationship among other. Conceptidentification is an important part of anytoken/Ontology integration system21-22; to identify conceptpreprocessing of input document/text is required10. Domain specific ontologies firstly identified for different sources of information/ document[11][12]. Text and then merges into single set of concept. In concept integration, there are two activities involved like token/Ontology identification and Token/Ontology matching6-[15. Conceptsare a vital component of most knowledge based applications, including semantic web search, intelligent information integration, and natural language processing. In particular, we need effective tools for generating in-depth ontologies that achieve comprehensive converge of specific application domains of interest, while minimizing the time and cost of this process. Therefore we cannot rely on the manual or highly supervised approaches often used in the past, since they do not scale well.
In the field of artificial intelligence, data mining, data warehousing, semantic web, systems engineering, software engineering, biomedical informatics, library science, enterprise bookmarking, and information architecture2.
Figure 1. data mining in knowledge discovery 1.
Figure 2. Concept (token/ontology) life cycle 9.
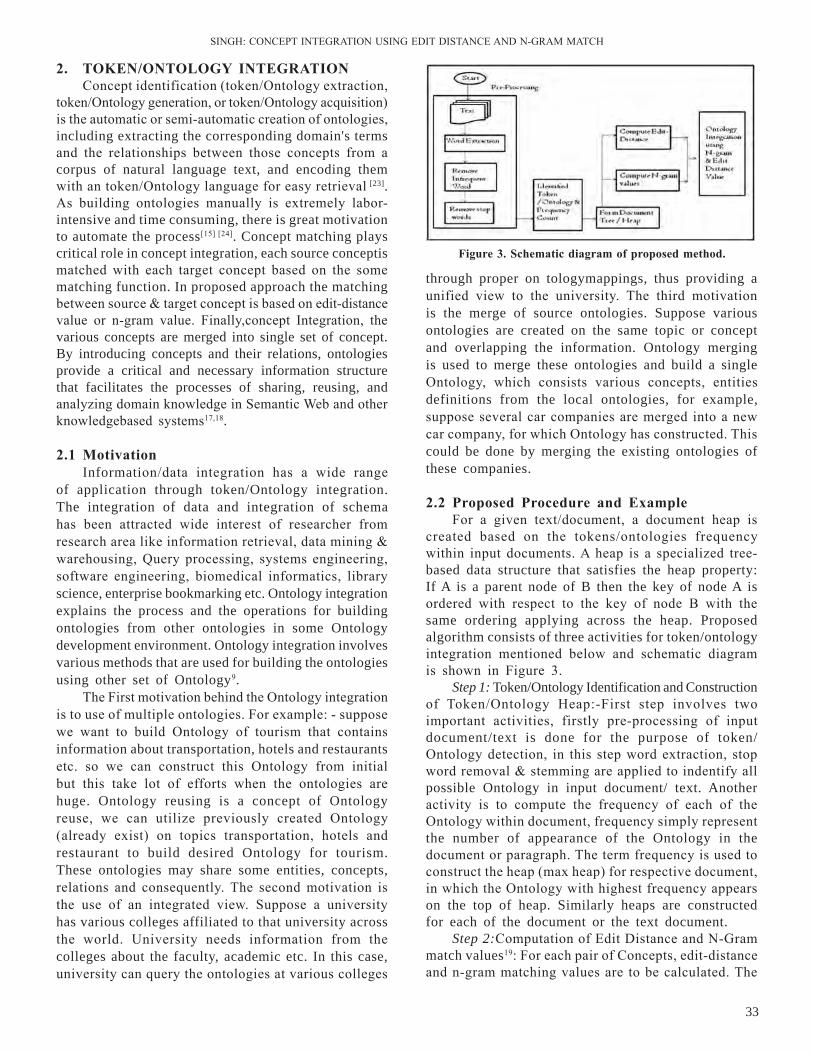
SInGH: COnCEPT InTEGrATIOn uSInG EDIT DISTAnCE AnD n-GrAM MATCH
33
2. toKEn/ontoloGY intEGrAtionConcept identification (token/Ontology extraction,
token/Ontology generation, or token/Ontology acquisition) is the automatic or semi-automatic creation of ontologies, including extracting the corresponding domain's terms and the relationships between those concepts from a corpus of natural language text, and encoding them with an token/Ontology language for easy retrieval [23]. As building ontologies manually is extremely labor-intensive and time consuming, there is great motivation to automate the process[15] [24]. Concept matching plays critical role in concept integration, each source conceptis matched with each target concept based on the some matching function. In proposed approach the matching between source & target concept is based on edit-distance value or n-gram value. Finally,concept Integration, the various concepts are merged into single set of concept. By introducing concepts and their relations, ontologies provide a critical and necessary information structure that facilitates the processes of sharing, reusing, and analyzing domain knowledge in Semantic Web and other knowledgebased systems17,18.
2.1 MotivationInformation/data integration has a wide range
of application through token/Ontology integration. The integration of data and integration of schema has been attracted wide interest of researcher from research area like information retrieval, data mining & warehousing, query processing, systems engineering, software engineering, biomedical informatics, library science, enterprise bookmarking etc. Ontology integration explains the process and the operations for building ontologies from other ontologies in some Ontology development environment. Ontology integration involves various methods that are used for building the ontologies using other set of Ontology9.
The First motivation behind the Ontology integration is to use of multiple ontologies. For example: - suppose we want to build Ontology of tourism that contains information about transportation, hotels and restaurants etc. so we can construct this Ontology from initial but this take lot of efforts when the ontologies are huge. Ontology reusing is a concept of Ontology reuse, we can utilize previously created Ontology (already exist) on topics transportation, hotels and restaurant to build desired Ontology for tourism. These ontologies may share some entities, concepts, relations and consequently. The second motivation is the use of an integrated view. Suppose a university has various colleges affiliated to that university across the world. university needs information from the colleges about the faculty, academic etc. In this case, university can query the ontologies at various colleges
Figure 3. schematic diagram of proposed method.
through proper on tologymappings, thus providing a unified view to the university. The third motivation is the merge of source ontologies. Suppose various ontologies are created on the same topic or concept and overlapping the information. Ontology merging is used to merge these ontologies and build a single Ontology, which consists various concepts, entities definitions from the local ontologies, for example, suppose several car companies are merged into a new car company, for which Ontology has constructed. This could be done by merging the existing ontologies of these companies.
2.2 Proposed Procedure and ExampleFor a given text/document, a document heap is
created based on the tokens/ontologies frequency within input documents. A heap is a specialized tree-based data structure that satisfies the heap property: If A is a parent node of B then the key of node A is ordered with respect to the key of node B with the same ordering applying across the heap. Proposed algorithm consists of three activities for token/ontology integration mentioned below and schematic diagram is shown in Figure 3.
Step 1: Token/Ontology Identification and Construction of Token/Ontology Heap:-First step involves two important activities, firstly pre-processing of input document/text is done for the purpose of token/Ontology detection, in this step word extraction, stop word removal & stemming are applied to indentify all possible Ontology in input document/ text. Another activity is to compute the frequency of each of the Ontology within document, frequency simply represent the number of appearance of the Ontology in the document or paragraph. The term frequency is used to construct the heap (max heap) for respective document, in which the Ontology with highest frequency appears on the top of heap. Similarly heaps are constructed for each of the document or the text document.
Step 2:Computation of Edit Distance and n-Gram match values19: For each pair of Concepts, edit-distance and n-gram matching values are to be calculated. The
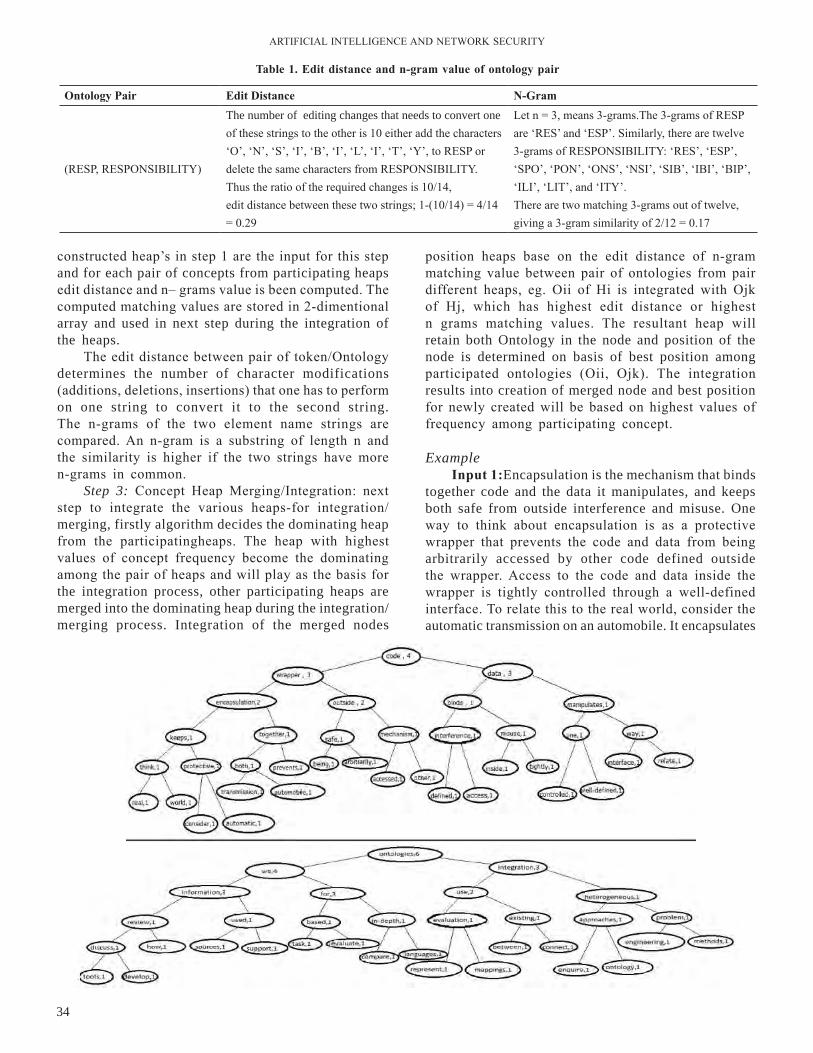
ArTIFICIAl InTEllIGEnCE AnD nETWOrK SECurITY
34
constructed heap’s in step 1 are the input for this step and for each pair of concepts from participating heaps edit distance and n– grams value is been computed. The computed matching values are stored in 2-dimentional array and used in next step during the integration of the heaps.
The edit distance between pair of token/Ontology determines the number of character modifications (additions, deletions, insertions) that one has to perform on one string to convert it to the second string. The n-grams of the two element name strings are compared. An n-gram is a substring of length n and the similarity is higher if the two strings have more n-grams in common.
Step 3: Concept Heap Merging/Integration: next step to integrate the various heaps-for integration/merging, firstly algorithm decides the dominating heap from the participatingheaps. The heap with highest values of concept frequency become the dominating among the pair of heaps and will play as the basis for the integration process, other participating heaps are merged into the dominating heap during the integration/merging process. Integration of the merged nodes
table 1. Edit distance and n-gram value of ontology pair
ontology Pair Edit distance n-Gram
(rESP, rESPOnSIBIlITY)
The number of editing changes that needs to convert one of these strings to the other is 10 either add the characters ‘O’, ‘n’, ‘S’, ‘I’, ‘B’, ‘I’, ‘l’, ‘I’, ‘T’, ‘Y’, to rESP or delete the same characters from rESPOnSIBIlITY. Thus the ratio of the required changes is 10/14,edit distance between these two strings; 1-(10/14) = 4/14 = 0.29
let n = 3, means 3-grams.The 3-grams of rESP are ‘rES’ and ‘ESP’. Similarly, there are twelve 3-grams of rESPOnSIBIlITY: ‘rES’, ‘ESP’, ‘SPO’, ‘POn’, ‘OnS’, ‘nSI’, ‘SIB’, ‘IBI’, ‘BIP’, ‘IlI’, ‘lIT’, and ‘ITY’.There are two matching 3-grams out of twelve, giving a 3-gram similarity of 2/12 = 0.17
position heaps base on the edit distance of n-gram matching value between pair of ontologies from pair different heaps, eg. Oii of Hi is integrated with Ojk of Hj, which has highest edit distance or highest n grams matching values. The resultant heap will retain both Ontology in the node and position of the node is determined on basis of best position among participated ontologies (Oii, Ojk). The integration results into creation of merged node and best position for newly created will be based on highest values of frequency among participating concept.
Example input 1:Encapsulation is the mechanism that binds
together code and the data it manipulates, and keeps both safe from outside interference and misuse. One way to think about encapsulation is as a protective wrapper that prevents the code and data from being arbitrarily accessed by other code defined outside the wrapper. Access to the code and data inside the wrapper is tightly controlled through a well-defined interface. To relate this to the real world, consider the automatic transmission on an automobile. It encapsulates
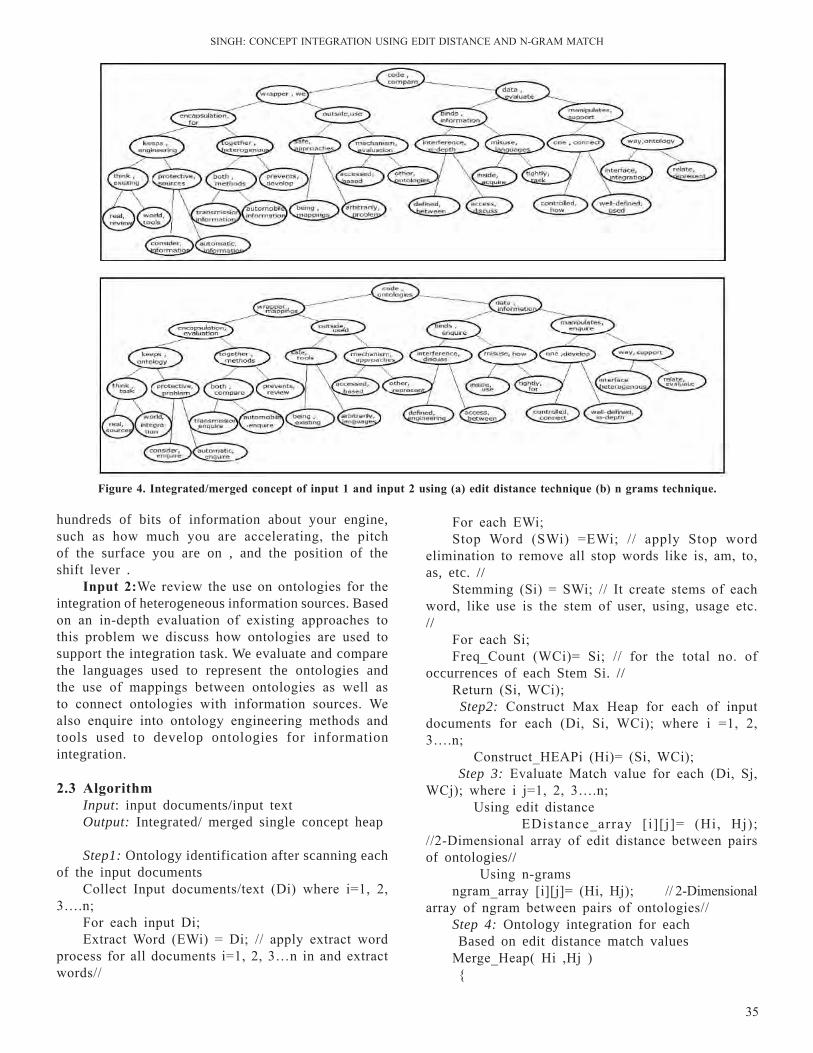
SInGH: COnCEPT InTEGrATIOn uSInG EDIT DISTAnCE AnD n-GrAM MATCH
35
For each EWi; Stop Word (SWi) =EWi; // apply Stop word
elimination to remove all stop words like is, am, to, as, etc. //
Stemming (Si) = SWi; // It create stems of each word, like use is the stem of user, using, usage etc. //
For each Si;Freq_Count (WCi)= Si; // for the total no. of
occurrences of each Stem Si. //return (Si, WCi); Step2: Construct Max Heap for each of input
documents for each (Di, Si, WCi); where i =1, 2, 3….n;
Construct_HEAPi (Hi)= (Si, WCi); Step 3: Evaluate Match value for each (Di, Sj,
WCj); where i j=1, 2, 3….n; using edit distance EDistance_array [i][j]= (Hi, Hj);
//2-Dimensional array of edit distance between pairs of ontologies//
using n-grams ngram_array [i][j]= (Hi, Hj); // 2-Dimensional
array of ngram between pairs of ontologies//Step 4: Ontology integration for each Based on edit distance match valuesMerge_Heap( Hi ,Hj ) {
hundreds of bits of information about your engine, such as how much you are accelerating, the pitch of the surface you are on , and the position of the shift lever .
input 2:We review the use on ontologies for the integration of heterogeneous information sources. Based on an in-depth evaluation of existing approaches to this problem we discuss how ontologies are used to support the integration task. We evaluate and compare the languages used to represent the ontologies and the use of mappings between ontologies as well as to connect ontologies with information sources. We also enquire into ontology engineering methods and tools used to develop ontologies for information integration.
2.3 AlgorithmInput: input documents/input textOutput: Integrated/ merged single concept heap
Step1: Ontology identification after scanning each of the input documents
Collect Input documents/text (Di) where i=1, 2, 3….n;
For each input Di; Extract Word (EWi) = Di; // apply extract word
process for all documents i=1, 2, 3…n in and extract words//
Figure 4. integrated/merged concept of input 1 and input 2 using (a) edit distance technique (b) n grams technique.
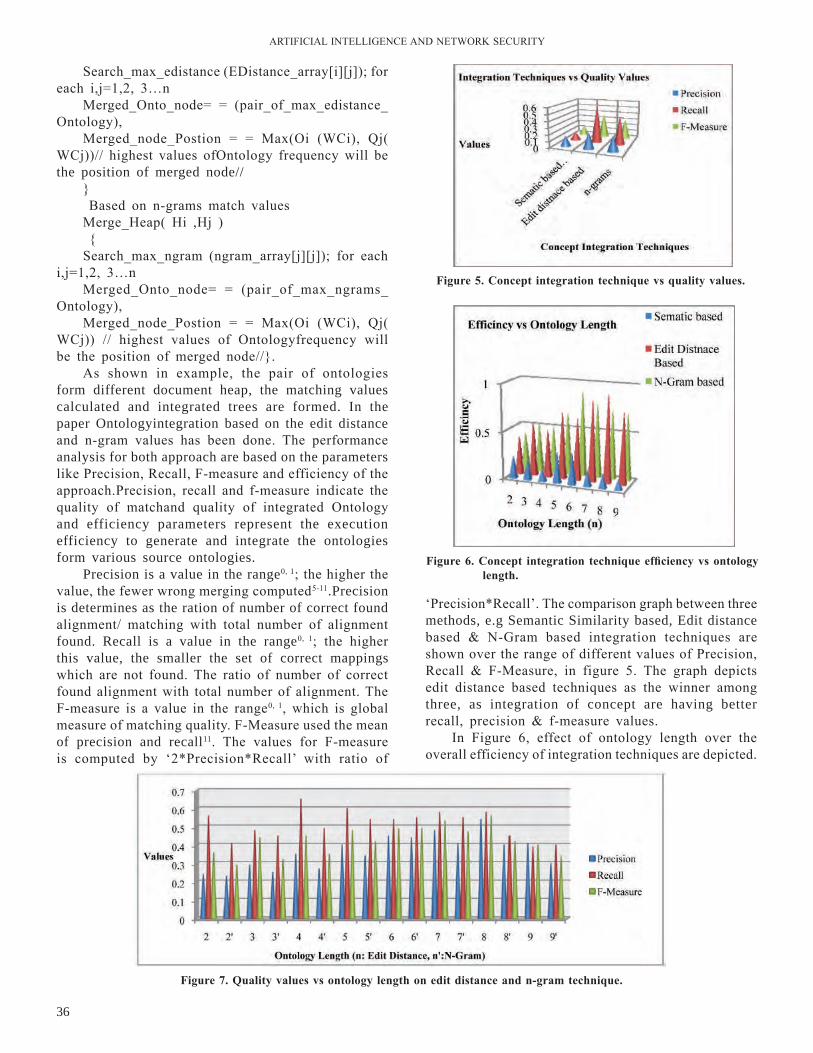
ArTIFICIAl InTEllIGEnCE AnD nETWOrK SECurITY
36
Search_max_edistance (EDistance_array[i][j]); for each i,j=1,2, 3…n
Merged_Onto_node= = (pair_of_max_edistance_Ontology),
Merged_node_Postion = = Max(Oi (WCi), qj( WCj))// highest values ofOntology frequency will be the position of merged node//
} Based on n-grams match valuesMerge_Heap( Hi ,Hj ) {Search_max_ngram (ngram_array[j][j]); for each
i,j=1,2, 3…nMerged_Onto_node= = (pair_of_max_ngrams_
Ontology),Merged_node_Postion = = Max(Oi (WCi), qj(
WCj)) // highest values of Ontologyfrequency will be the position of merged node//}.
As shown in example, the pair of ontologies form different document heap, the matching values calculated and integrated trees are formed. In the paper Ontologyintegration based on the edit distance and n-gram values has been done. The performance analysis for both approach are based on the parameters like Precision, recall, F-measure and efficiency of the approach.Precision, recall and f-measure indicate the quality of matchand quality of integrated Ontology and efficiency parameters represent the execution efficiency to generate and integrate the ontologies form various source ontologies.
Precision is a value in the range0, 1; the higher the value, the fewer wrong merging computed5-11.Precision is determines as the ration of number of correct found alignment/ matching with total number of alignment found. Recall is a value in the range0, 1; the higher this value, the smaller the set of correct mappings which are not found. The ratio of number of correct found alignment with total number of alignment. The F-measure is a value in the range0, 1, which is global measure of matching quality. F-Measure used the mean of precision and recall11. The values for F-measure is computed by ‘2*Precision*recall’ with ratio of
‘Precision*recall’. The comparison graph between three methods, e.g Semantic Similarity based, Edit distance based & n-Gram based integration techniques are shown over the range of different values of Precision, recall & F-Measure, in figure 5. The graph depicts edit distance based techniques as the winner among three, as integration of concept are having better recall, precision & f-measure values.
In Figure 6, effect of ontology length over the overall efficiency of integration techniques are depicted.
Figure 5. Concept integration technique vs quality values.
Figure 6. Concept integration technique efficiency vs ontology length.
Figure 7. Quality values vs ontology length on edit distance and n-gram technique.
SInGH: COnCEPT InTEGrATIOn uSInG EDIT DISTAnCE AnD n-GrAM MATCH
37
For ontology length 7 and 8, both edit distance and n-gram based integration method are close on their efficiency while semantic similarity based techniques is outperformed by the both techniques. Finally, in Figure 7is for comparative analysis is depicting the performance (quality values delivered) comparison between edit distance techniques & n-gram techniques while integrating ontology length. The comparison is performed under range of ontology length and quality parameters values are kept in the observation. The overall performance of edit distance techniques is consistent and significant performance is delivered on ontology of length 7 or 8 while for n-gram integration techniques the better result delivered for the ontology of length 6 or 5. Few conclusion from the experimental analysis is drawn like, edit distance perform better than n-gram & semanticsimilarity based integration techniques for different size of ontology. The edit distance technique performsbetter andshows potential to carry good values of all quality parameters, which affects the quality of results during processing.
3. ConClUsionIn the area of data and information science, token/
Ontology is a formal framework for representing domain knowledge. This framework primarily defines the semantics of data element of domain and then identifies the relationship among other. Information/data integration has a wide range of application through token/Ontology integration. The integration of data and integration of schema have been attracted wide interest of researcher from research area like information retrieval, data mining and warehousing, query processing, systems engineering, software engineering, biomedical informatics, library science, enterprise bookmarking, schema integration, E-r diagram integration, graph integration (web semantic based graph), etc.
Ontology integration explains the process and the operations for building ontologies from other ontologies in some Ontology development environment. There are various existing techniques for ontology integration, in this paper an approach is proposed for the ontology integration using match values based on the edit distance and n-gram. Edit distance determines match values among pair of concepts based on the changes required in participating concepts, in order to align them. In case of n-gram method, the matches are the count of n-length substrings of participating ontology are matching. Concept integration using both methods are implemented on wide range of input document/text. The performance comparison is through over the existing method, Semantic similarity based with edit distance and n-grams method is done.
The ontology length has proportional effect on overall efficiency of the techniques, as ontology of length 6 to 8 edit distances outperform all other integration techniques while for smaller length of ontology n-gram and semantic similarity perform better. Few conclusion from the experimental analysis is drawn like, edit distance perform better than n-gram and semantic similarity based integration techniques for different size of ontology. The edit distance technique performs better and shows potential to carry good values of all quality parameters, which affects the quality of results during processing.
fu’d’k ZvkadM+k vkSj lwpuk foKku {ks= esa] Vksdu@v‚UVksykWth Mksesu
Kku dks fu:fir djus ds fy, ,d vkSipkfjd lajpuk gSA ;g lajpuk eq[;r;k Mksesu ds vkadM+k rRo ds 'kCnkFkksaZ dks ifjHkkf"kr djrh gS vkSj rRi'pkr~ vU; ds chp laca/kksa dh igpku djrh gSA lwpuk@vkadM+k ,dhdj.k Vksdu@v‚UVksykWth ,dhdj.k ds ek/;e ls vuqç;ksxksa dk O;kid jsat j[krs gSaA vkadM+ksa ds ,dhdj.k vkSj <kaps ds ,dhdj.k us lwpuk iquiZzkfIr] vkadM+k [kuu ,oa HkaMkj.k] ç'u lalk/ku] ç.kkyh bathfu;fjax] l‚¶Vos;j bathfu;fjax] ck;ksesfMdy lwpuk foKku] iqLrdky; foKku] m|e cqdekfdaZx] <kapk ,dhdj.k] bZ&vkj vkjs[k ,dhdj.k] xzkQ ,dhdj.k ¼osc 'kCnkFkZ vk/kkfjr xzkQ½ bR;kfn tSls vuqla/kku {ks=ksa ls vuqla/kkudrkZvksa dh O;kid :fp dks vkdf"kZr fd;k gSA v‚UVksykWth ,dhdj.k fdlh v‚UVksykWth fodkl ifjos'k esa vU; v‚UVksykWftl ls v‚UVksykWftl dks cukus ds fy, çfØ;k vkSj çpkyuksa dh O;k[;k djrk gSA v‚UVksykWth ,dhdj.k ds fy, fofHkUu fo|eku rduhdsa gSa] bl i= esa ,fMV fMLVsUl ,oa ,u&xzke ij vk/kkfjr rqyu ekuksa dk mi;ksx djds v‚UVksykWth ,dhdj.k ds fy, ,d rjhds dk çLrko fd;k x;k gSA ,fMV fMLVsUl ç;qä vo/kkj.kkvksa esa visf{kr ifjorZuksa ds vk/kkj ij vo/kkj.kkvksa ds ;qXe ds e/; rqyu ekuksa dk fu/kkZj.k djrk gS rkfd mUgsa lajsf[kr fd;k tk ldsA ,u&xzke i)fr ds ekeys esa] ç;qä v‚UVksykWth ds ,u&yEckbZ ds lcfLVªaXl dh la[;k dh rqyuk dh tkrh gSA O;kid jsat ds buiqV nLrkost@ikB ij nksuksa i)fr;ksa dk mi;ksx djds vo/kkj.kk ,dhdj.k dks dk;kZfUor fd;k tkrk gSA fu"iknu rqyuk fo|eku i)fr ds ek/;e ls gksrh gS] ,fMV fMLVsUl vkSj ,u&xzke i)fr ij vk/kkfjr 'kCnkFkZ lekurk dh tkrh gSA rduhdksa dh lexz n{krk ij v‚UVksykWth dh yackbZ dk vkuqikfrd çHkko iM+rk gS D;ksafd 6 ls 8 ,fMV fMLVsUl dh v‚UVksykWth vU; lHkh ,dhdj.k rduhdksa ls csgrj fu"iknu djrh gS tcfd de yackbZ dh v‚UVksykWth ds fy, ,u&xzke vkSj 'kCnkFkZ lekurk csgrj fu"iknu djrs gSaA çk;ksfxd fo'ys"k.k ls dqN fu"d"kZ fudkys x, gSa tSls] ,fMV fMLVsUl fofHkUu vkdkj dh v‚UVksykWth ds fy, ,u&xzke vkSj 'kCnkFkZ lekurk vk/kkfjr ,dhdj.k rduhdksa ls csgrj fu"iknu
ArTIFICIAl InTEllIGEnCE AnD nETWOrK SECurITY
38
djrk gSA ,fMV fMLVsUl rduhd csgrj fu"iknu djrh gS vkSj lHkh xq.koÙkk ekunaMksa ds vPNs eku j[kus dh laHkkouk n'kkZrh gS] tks lalk/ku ds nkSjku ifj.kkeksa dh xq.koÙkk dks çHkkfor djrs gSaA
rEFErEnCEs1. J. Han, M.Kamber, and J. Pai, Data Mining
Concepts and Techniques, Morgan Kaufmann Publishers, uSA, Third Edition, Elsevier, 2011.
2. D. Kumar, D. Bhardwaj, rise of Data Mining: Current and Future Application Areas, International Journal of Computer Science Issues, 8(5), p.p 256-260, 2011.
3. Berners-lee T., Handler J., and lassila O, The Semantic Web, Scientific American, May 2001.
4. Jiang Huiping, Information retrieval and the Semantic Web, IEEE International Conference on Educational and Information Technology (ICEIT), Chongqing, China, 2010, 3, p.p 461-463.
5. Vikram Singh, BalwinderSaini, An Effective Tokenization Algorithm For Information retrieval Systems, in the 1st international Conference on data Mining, DMIn-2014, Banglore, 2014, pp. 109–119.
6. F. Giunchiglia, M. Yatskevich, and P. Shvaiko, Semantic matching: Algorithms and implementation, Journal on Data Semantics, 2007, 9, pp. 1–38.
7. Ontology Components: http://en.wikipedia.org/wiki/Ontology_components.
8. PavelShvaiko and Jerome Euzenat, Ontology matching: state of the art and future challenges, IEEE Transactions on Knowledge and Data Engineering, 2013, 25(1) p.p 158-176.
9. J. Euzenat and P. Shvaiko, Ontology matching, Springer, 2013.
10. C.ramasubramanian and r.ramya, Effective Pre-Processing Activities in Text Mining using Improved Porter’s Stemming Algorithm, International Journal of Advanced Research in Computer and Communication Engineering, December 2013, 2, Issue 12.
11. AnHai D, Jayant M, Pedro D et al., learning to map between ontologies on the semantic web, Eleventh International World Wide Web Conference, Honolulu Hawaii, uSA, 2005.
12. Tordai, A, On combining alignment techniques PhD thesis, Vrije universiteit Amsterdam, Amsterdam, The netherlands, 2012, 193, pp. 65.
13. A rodrfguez, M Egenhofer, Determining Semantic Similarity Among Entity Classes from Diferent Ontologies , IEEE Transactions on Knowledge and Data Engineering, 2003, 15 (2), 442-56.
14. D. Aum, H. H. Do, S. Mabmann, and E. rahm,
Schema and Ontology matching with COMA++, in Proceeding 24th International Conference on Management of Data (SIGMOD), Demo track, 2005, pp. 906–908.
15. Bin Ye, Hongyu Chai, Weiping He , Xiaoting Wang, Guangwei Song, Semantic similarity calculation method in Ontology mapping, 2nd International Conference on Cloud Computing and Intelligent Systems (CCIS), Hangzhou, 2012, 3, p.p1259-1262.
16. Hartung, M., Grob, A., rahm, E, COntoDiff: generation of complex evolution mappings for life science ontologies, J. Biomed. Inform. 2013, 46(1), p.p 15–32.
17. Kirsten, T., Groß, A., Hartung, M., rahm, E, GOMMA: a component-based infrastructure for managing and analyzing life science ontologies and their evolution, J. Biomed. Semant, 2011.
18. Doan, A., Halevy, A., Ives, Z, Principles of Data Integration, Morgan Kaufmann San Mateo. 2012, 497 pp. 5, 73.
19. M. Ozasu,P.Valduriez, Principles of Distributed Database Systems, PrenticeHall,1991.
20. S. Shehata, F. Karray, and M. S. Kamel, An Efficient Concept-Based Mining Model for Enhancing Text Clustering, IEEE Transactions On Knowledge And Data Engineering, October 2010. 22,10.
21. Algergawy, A., nayak, r., Siegmund, n., Köppen, V., Saake, Combining schema and level based matching for web service discovery,10th International Conference on WebEngineering (ICWE), Vienna, Austria, pp. 114–128, 2010.
22. Wache, H., Voegele, T., Visser, u., Stuckenschmidt, H., Schuster, G., neumann, H., Hübner, Ontology-based integration of information—a survey of existing approaches, 17th International Joint Conference on Artificial Intelligence (IJCAI), Seattle, WA, uSA, 2001 pp. 108–117.
23. Giuseppe Fenza, Vincenzo loia, and Sabrina Senatore, Concept Mining of Semantic Web Services By Means Of Extended Fuzzy Formal Concept Analysis (FFCA), IEEE, Feb. 2008.
24. Yang Zhe., Semantic similarity match of Ontology concept based on heuristic rules. Computer Applications, Vol. no. 12, Dec. 2007.
25. li Chun-miao, Sun jing-bo, The research of Ontology Mapping Method Based on Computing Similarity . Science & Technology Information, 2010, 1, p.p 552-554.
26. ShaliniPuri, A Fuzzy Similarity Based Concept Mining Model for Text Classification, International Journal of Advanced Computer Science and Applications, 2011, 2(11).
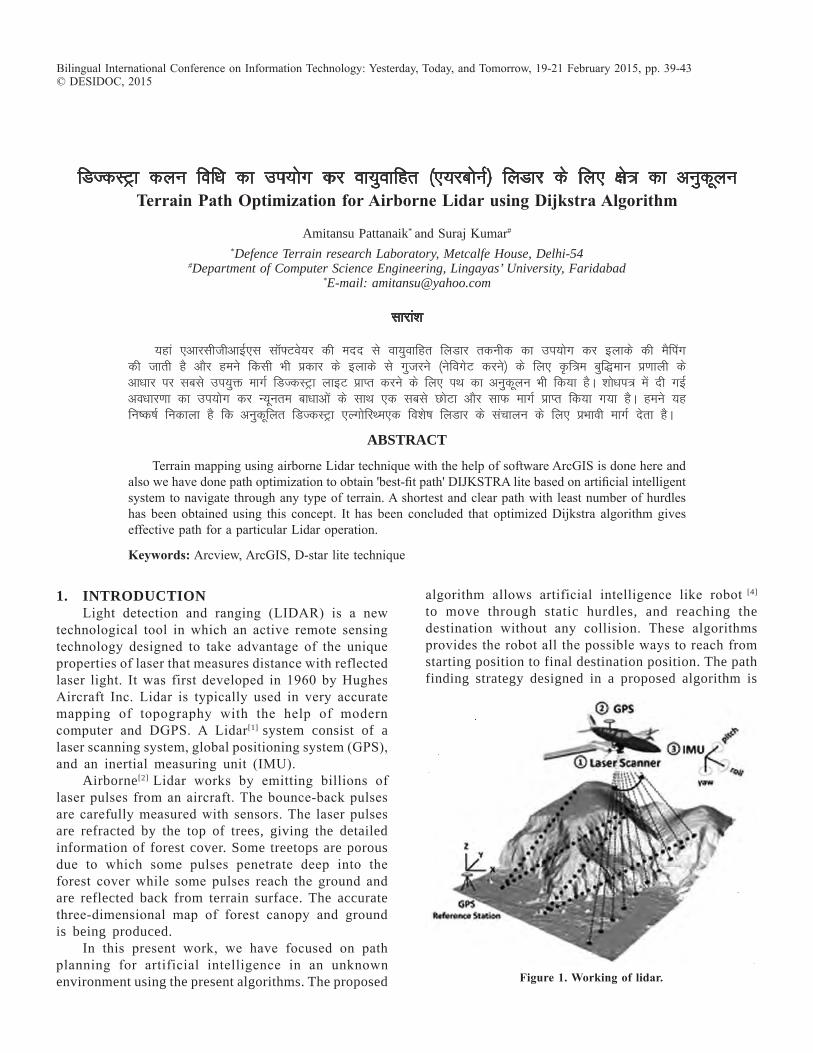
fMTdLVªk dyu fof/k dk mi;ksx dj ok;qokfgr ¼,;jcksuZ½ fyMkj ds fy, {ks= dk vuqdwyuterrain Path optimization for Airborne lidar using dijkstra Algorithm
Amitansu Pattanaik* and Suraj Kumar#
*Defence Terrain research Laboratory, Metcalfe House, Delhi-54 #Department of Computer Science Engineering, Lingayas’ University, Faridabad
*E-mail: [email protected]
lkjka”k
;gka ,vkjlhthvkbZ,l l‚¶Vos;j dh enn ls ok;qokfgr fyMkj rduhd dk mi;ksx dj bykds dh eSfiax dh tkrh gS vkSj geus fdlh Hkh çdkj ds bykds ls xqtjus ¼usfoxsV djus½ ds fy, —f=e cqf)eku ç.kkyh ds vk/kkj ij lcls mi;qä ekxZ fMTdLVªk ykbV çkIr djus ds fy, iFk dk vuqdwyu Hkh fd;k gSA 'kks/ki= esa nh xbZ vo/kkj.kk dk mi;ksx dj U;wure ck/kkvksa ds lkFk ,d lcls NksVk vkSj lkQ ekxZ çkIr fd;k x;k gSA geus ;g fu"d"kZ fudkyk gS fd vuqdwfyr fMTdLVªk ,YxksfjFe,d fo'ks"k fyMkj ds lapkyu ds fy, çHkkoh ekxZ nsrk gSA
AbstrAct
Terrain mapping using airborne lidar technique with the help of software ArcGIS is done here and also we have done path optimization to obtain 'best-fit path' DIJKSTrA lite based on artificial intelligent system to navigate through any type of terrain. A shortest and clear path with least number of hurdles has been obtained using this concept. It has been concluded that optimized Dijkstra algorithm gives effective path for a particular lidar operation.
Keywords: Arcview, ArcGIS, D-star lite technique
Bilingual International Conference on Information Technology: Yesterday, Today, and Tomorrow, 19-21 February 2015, pp. 39-43© DESIDOC, 2015
1. IntroductIonlight detection and ranging (lIDAr) is a new
technological tool in which an active remote sensing technology designed to take advantage of the unique properties of laser that measures distance with reflected laser light. It was first developed in 1960 by Hughes Aircraft Inc. lidar is typically used in very accurate mapping of topography with the help of modern computer and DGPS. A lidar[1] system consist of a laser scanning system, global positioning system (GPS), and an inertial measuring unit (IMu).
Airborne[2] lidar works by emitting billions of laser pulses from an aircraft. The bounce-back pulses are carefully measured with sensors. The laser pulses are refracted by the top of trees, giving the detailed information of forest cover. Some treetops are porous due to which some pulses penetrate deep into the forest cover while some pulses reach the ground and are reflected back from terrain surface. The accurate three-dimensional map of forest canopy and ground is being produced.
In this present work, we have focused on path planning for artificial intelligence in an unknown environment using the present algorithms. The proposed
algorithm allows artificial intelligence like robot [4]
to move through static hurdles, and reaching the destination without any collision. These algorithms provides the robot all the possible ways to reach from starting position to final destination position. The path finding strategy designed in a proposed algorithm is
Figure 1. working of lidar.
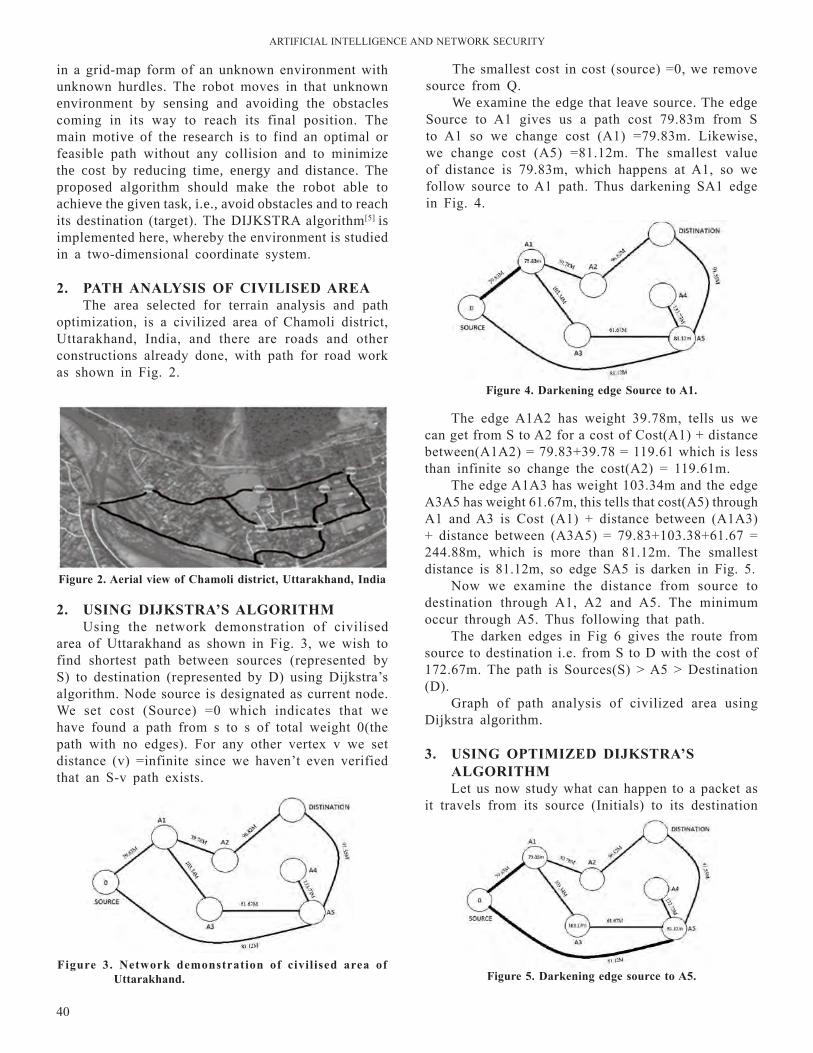
ArTIFICIAl InTEllIGEnCE AnD nETWOrK SECurITY
40
in a grid-map form of an unknown environment with unknown hurdles. The robot moves in that unknown environment by sensing and avoiding the obstacles coming in its way to reach its final position. The main motive of the research is to find an optimal or feasible path without any collision and to minimize the cost by reducing time, energy and distance. The proposed algorithm should make the robot able to achieve the given task, i.e., avoid obstacles and to reach its destination (target). The DIJKSTrA algorithm[5] is implemented here, whereby the environment is studied in a two-dimensional coordinate system.
2. PAth AnAlYsis oF CiVilisEd ArEAThe area selected for terrain analysis and path
optimization, is a civilized area of Chamoli district, uttarakhand, India, and there are roads and other constructions already done, with path for road work as shown in Fig. 2.
The smallest cost in cost (source) =0, we remove source from q.
We examine the edge that leave source. The edge Source to A1 gives us a path cost 79.83m from S to A1 so we change cost (A1) =79.83m. likewise, we change cost (A5) =81.12m. The smallest value of distance is 79.83m, which happens at A1, so we follow source to A1 path. Thus darkening SA1 edge in Fig. 4.
Figure 2. Aerial view of Chamoli district, Uttarakhand, india
Figure 3. network demonstration of civilised area of Uttarakhand. Figure 5. darkening edge source to A5.
Figure 4. darkening edge source to A1.
2. UsinG dijKstrA’s AlGorithMusing the network demonstration of civilised
area of uttarakhand as shown in Fig. 3, we wish to find shortest path between sources (represented by S) to destination (represented by D) using Dijkstra’s algorithm. node source is designated as current node. We set cost (Source) =0 which indicates that we have found a path from s to s of total weight 0(the path with no edges). For any other vertex v we set distance (v) =infinite since we haven’t even verified that an S-v path exists.
The edge A1A2 has weight 39.78m, tells us we can get from S to A2 for a cost of Cost(A1) + distance between(A1A2) = 79.83+39.78 = 119.61 which is less than infinite so change the cost(A2) = 119.61m.
The edge A1A3 has weight 103.34m and the edge A3A5 has weight 61.67m, this tells that cost(A5) through A1 and A3 is Cost (A1) + distance between (A1A3) + distance between (A3A5) = 79.83+103.38+61.67 = 244.88m, which is more than 81.12m. The smallest distance is 81.12m, so edge SA5 is darken in Fig. 5.
now we examine the distance from source to destination through A1, A2 and A5. The minimum occur through A5. Thus following that path.
The darken edges in Fig 6 gives the route from source to destination i.e. from S to D with the cost of 172.67m. The path is Sources(S) > A5 > Destination (D).
Graph of path analysis of civilized area using Dijkstra algorithm.
3. UsinG oPtiMizEd dijKstrA’s AlGorithMlet us now study what can happen to a packet as
it travels from its source (Initials) to its destination
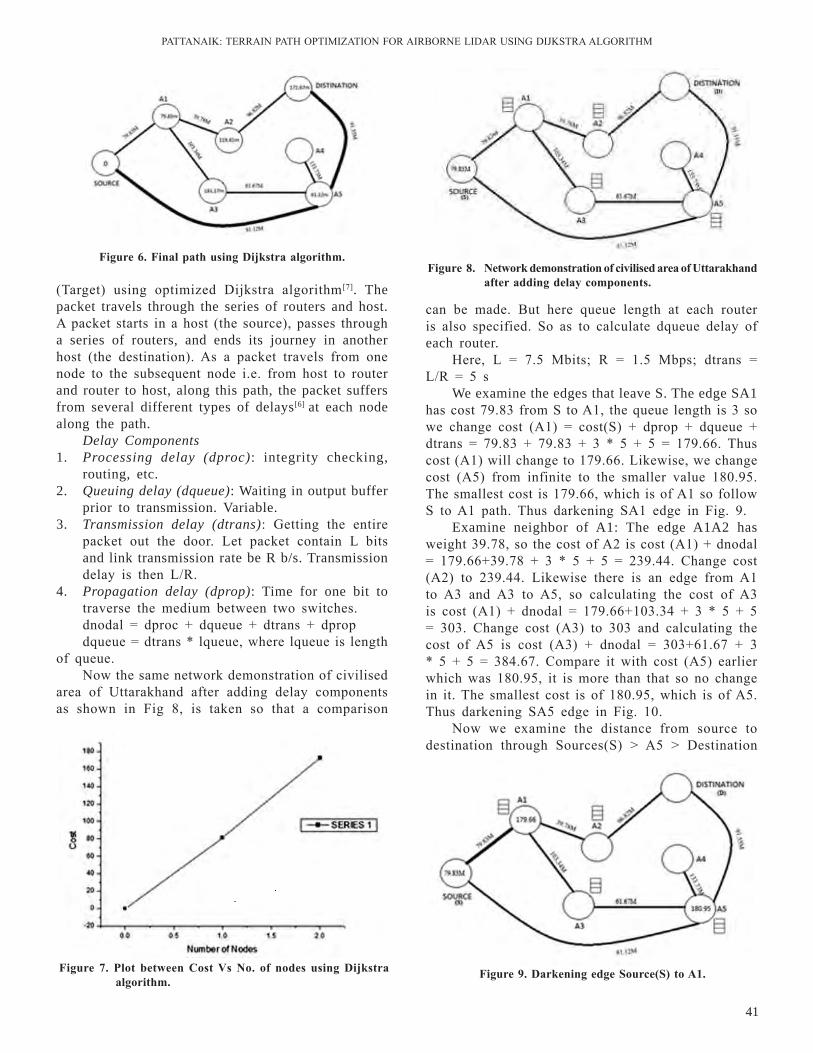
PATTAnAIK: TErrAIn PATH OPTIMIZATIOn FOr AIrBOrnE lIDAr uSInG DIJKSTrA AlGOrITHM
41
can be made. But here queue length at each router is also specified. So as to calculate dqueue delay of each router.
Here, l = 7.5 Mbits; r = 1.5 Mbps; dtrans = l/r = 5 s
We examine the edges that leave S. The edge SA1 has cost 79.83 from S to A1, the queue length is 3 so we change cost (A1) = cost(S) + dprop + dqueue + dtrans = 79.83 + 79.83 + 3 * 5 + 5 = 179.66. Thus cost (A1) will change to 179.66. likewise, we change cost (A5) from infinite to the smaller value 180.95. The smallest cost is 179.66, which is of A1 so follow S to A1 path. Thus darkening SA1 edge in Fig. 9.
Examine neighbor of A1: The edge A1A2 has weight 39.78, so the cost of A2 is cost (A1) + dnodal = 179.66+39.78 + 3 * 5 + 5 = 239.44. Change cost (A2) to 239.44. likewise there is an edge from A1 to A3 and A3 to A5, so calculating the cost of A3 is cost (A1) + dnodal = 179.66+103.34 + 3 * 5 + 5 = 303. Change cost (A3) to 303 and calculating the cost of A5 is cost (A3) + dnodal = 303+61.67 + 3 * 5 + 5 = 384.67. Compare it with cost (A5) earlier which was 180.95, it is more than that so no change in it. The smallest cost is of 180.95, which is of A5. Thus darkening SA5 edge in Fig. 10.
now we examine the distance from source to destination through Sources(S) > A5 > Destination
(Target) using optimized Dijkstra algorithm[7]. The packet travels through the series of routers and host. A packet starts in a host (the source), passes through a series of routers, and ends its journey in another host (the destination). As a packet travels from one node to the subsequent node i.e. from host to router and router to host, along this path, the packet suffers from several different types of delays[6] at each node along the path.
Delay Components 1. Processing delay (dproc): integrity checking,
routing, etc. 2. Queuing delay (dqueue): Waiting in output buffer
prior to transmission. Variable. 3. Transmission delay (dtrans): Getting the entire
packet out the door. let packet contain l bits and link transmission rate be R b/s. Transmission delay is then l/r.
4. Propagation delay (dprop): Time for one bit to traverse the medium between two switches.dnodal = dproc + dqueue + dtrans + dpropdqueue = dtrans * lqueue, where lqueue is length
of queue.now the same network demonstration of civilised
area of uttarakhand after adding delay components as shown in Fig 8, is taken so that a comparison
Figure 6. Final path using dijkstra algorithm.Figure 8. network demonstration of civilised area of Uttarakhand
after adding delay components.
Figure 7. Plot between Cost Vs no. of nodes using dijkstra algorithm.
Figure 9. darkening edge source(s) to A1.
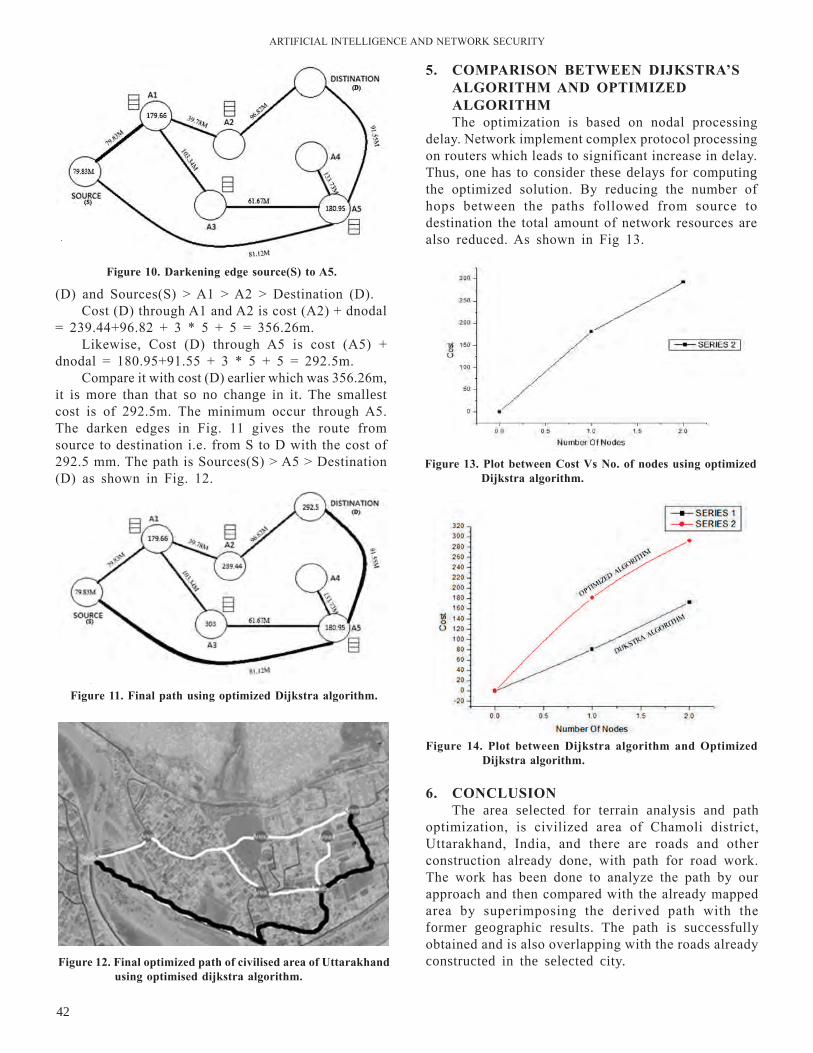
ArTIFICIAl InTEllIGEnCE AnD nETWOrK SECurITY
42
(D) and Sources(S) > A1 > A2 > Destination (D).Cost (D) through A1 and A2 is cost (A2) + dnodal
= 239.44+96.82 + 3 * 5 + 5 = 356.26m.likewise, Cost (D) through A5 is cost (A5) +
dnodal = 180.95+91.55 + 3 * 5 + 5 = 292.5m.Compare it with cost (D) earlier which was 356.26m,
it is more than that so no change in it. The smallest cost is of 292.5m. The minimum occur through A5. The darken edges in Fig. 11 gives the route from source to destination i.e. from S to D with the cost of 292.5 mm. The path is Sources(S) > A5 > Destination (D) as shown in Fig. 12.
Figure 10. darkening edge source(s) to A5.
Figure 11. Final path using optimized dijkstra algorithm.
Figure 12. Final optimized path of civilised area of Uttarakhand using optimised dijkstra algorithm.
5. CoMPArison bEtwEEn dijKstrA’s AlGorithM And oPtiMizEd AlGorithMThe optimization is based on nodal processing
delay. network implement complex protocol processing on routers which leads to significant increase in delay. Thus, one has to consider these delays for computing the optimized solution. By reducing the number of hops between the paths followed from source to destination the total amount of network resources are also reduced. As shown in Fig 13.
Figure 13. Plot between Cost Vs no. of nodes using optimized dijkstra algorithm.
6. ConClUsionThe area selected for terrain analysis and path
optimization, is civilized area of Chamoli district, uttarakhand, India, and there are roads and other construction already done, with path for road work. The work has been done to analyze the path by our approach and then compared with the already mapped area by superimposing the derived path with the former geographic results. The path is successfully obtained and is also overlapping with the roads already constructed in the selected city.
Figure 14. Plot between dijkstra algorithm and optimized dijkstra algorithm.
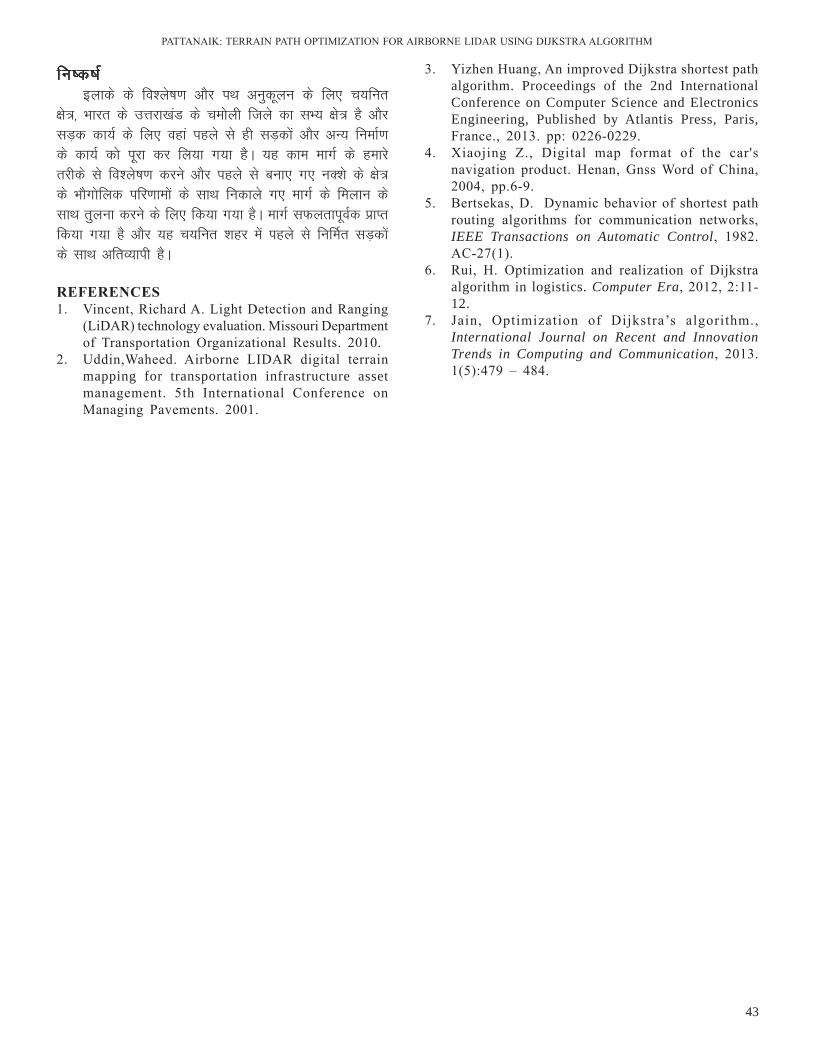
PATTAnAIK: TErrAIn PATH OPTIMIZATIOn FOr AIrBOrnE lIDAr uSInG DIJKSTrA AlGOrITHM
43
fu’d’k Zbykds ds fo'ys"k.k vkSj iFk vuqdwyu ds fy, p;fur
{ks=] Hkkjr ds mÙkjk[kaM ds peksyh ftys dk lH; {ks= gS vkSj lM+d dk;Z ds fy, ogka igys ls gh lM+dksa vkSj vU; fuekZ.k ds dk;Z dks iwjk dj fy;k x;k gSA ;g dke ekxZ ds gekjs rjhds ls fo'ys"k.k djus vkSj igys ls cuk, x, uD'ks ds {ks= ds HkkSxksfyd ifj.kkeksa ds lkFk fudkys x, ekxZ ds feyku ds lkFk rqyuk djus ds fy, fd;k x;k gSA ekxZ lQyrkiwoZd çkIr fd;k x;k gS vkSj ;g p;fur 'kgj esa igys ls fufeZr lM+dksa ds lkFk vfrO;kih gSA
rEFErEnCEs1. Vincent, richard A. light Detection and ranging
(liDAr) technology evaluation. Missouri Department of Transportation Organizational results. 2010.
2. uddin,Waheed. Airborne lIDAr digital terrain mapping for transportation infrastructure asset management. 5th International Conference on Managing Pavements. 2001.
3. Yizhen Huang, An improved Dijkstra shortest path algorithm. Proceedings of the 2nd International Conference on Computer Science and Electronics Engineering, Published by Atlantis Press, Paris, France., 2013. pp: 0226-0229.
4. Xiaojing Z., Digital map format of the car's navigation product. Henan, Gnss Word of China, 2004, pp.6-9.
5. Bertsekas, D. Dynamic behavior of shortest path routing algorithms for communication networks, IEEE Transactions on Automatic Control, 1982. AC-27(1).
6. rui, H. Optimization and realization of Dijkstra algorithm in logistics. Computer Era, 2012, 2:11-12.
7. Jain, Optimization of Dijkstra’s algorithm., International Journal on Recent and Innovation Trends in Computing and Communication, 2013. 1(5):479 – 484.
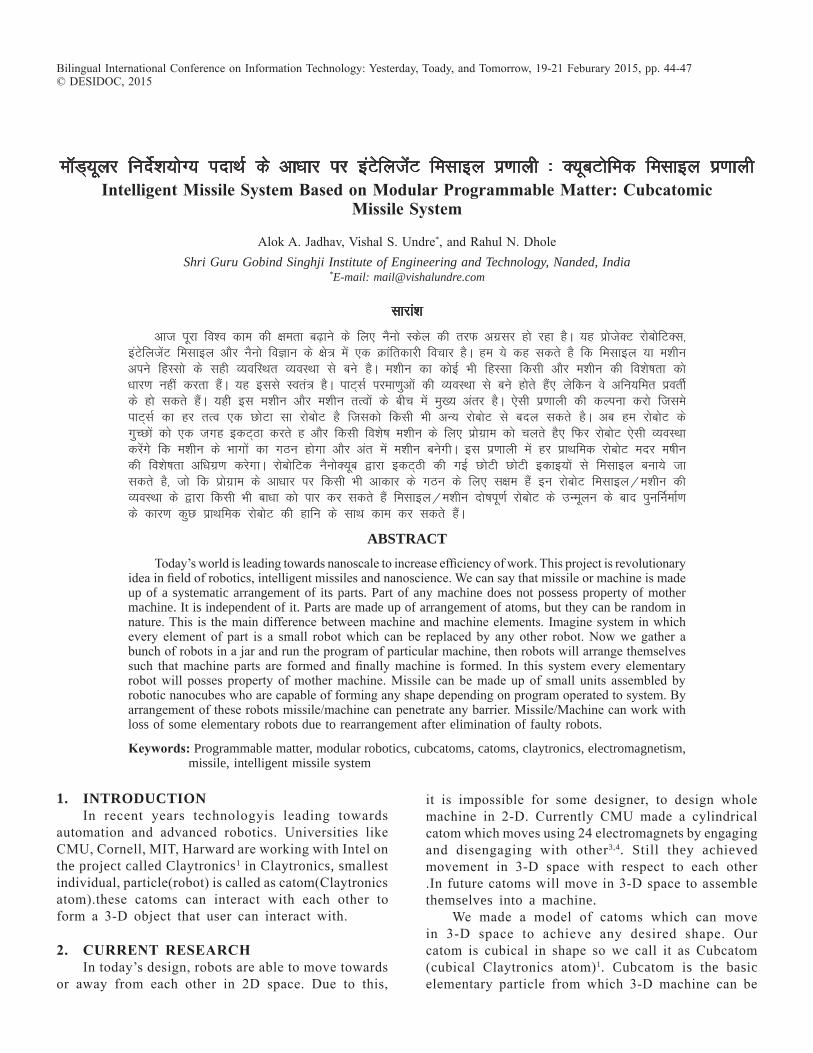
ekWM~;wyj funsZ”k;ksX; inkFkZ ds vk/kkj ij baVsfytsaV felkby iz.kkyh % D;wcVksfed felkby iz.kkyhintelligent Missile system based on Modular Programmable Matter: Cubcatomic
Missile system
Alok A. Jadhav, Vishal S. undre*, and rahul n. Dhole Shri Guru Gobind Singhji Institute of Engineering and Technology, Nanded, India
*E-mail: [email protected]
lkjka”k
vkt iwjk fo”o dke dh {kerk c<+kus ds fy, uSuks Ldsy dh rjQ vxzlj gks jgk gSA ;g izkstsDV jkscksfVDl] baVsfytsaV felkby vkSj uSuks foKku ds {ks= esa ,d Økafrdkjh fopkj gSA ge ;s dg ldrs gS fd felkby ;k e”khu vius fgLlks ds lgh O;ofLFkr O;oLFkk ls cus gSA e”khu dk dksbZ Hkh fgLlk fdlh vkSj e”khu dh fo”ks’krk dks /kkj.k ugha djrk gSaA ;g blls Lora= gSA ikV~lZ ijek.kqvksa dh O;oLFkk ls cus gksrs gSa, ysfdu os vfu;fer izorhZ ds gks ldrs gSaA ;gh bl e”khu vkSj e”khu rRoksa ds chp esa eq[; varj gSA ,slh iz.kkyh dh dYiuk djks ftles ikV~lZ dk gj rRo ,d NksVk lk jkscksV gS ftldks fdlh Hkh vU; jkscksV ls cny ldrs gSA vc ge jkscksV ds xqPNksa dks ,d txg bdV~Bk djrs g vkSj fdlh fo”ks’k e”khu ds fy, izksxzke dks pyrs gS, fQj jkscksV ,slh O;oLFkk djsaxs fd e”khu ds Hkkxksa dk xBu gksxk vkSj var esa e”khu cusxhA bl iz.kkyh esa gj izkFkfed jkscksV enj e’khu dh fo”ks’krk vf/kxz.k djsxkA jkscksfVd uSuksD;wc }kjk bdV~Bh dh xbZ NksVh NksVh bdkb;ksa ls felkby cuk;s tk ldrs gS] tks fd izksxzke ds vk/kkj ij fdlh Hkh vkdkj ds xBu ds fy, l{ke gSa bu jkscksV felkby@e”khu dh O;oLFkk ds }kjk fdlh Hkh ck/kk dks ikj dj ldrs gSa felkby@e”khu nks’kiw.kZ jkscksV ds mUewyu ds ckn iquÆuekZ.k ds dkj.k dqN izkFkfed jkscksV dh gkfu ds lkFk dke dj ldrs gSaA
AbstrActToday’s world is leading towards nanoscale to increase efficiency of work. This project is revolutionary
idea in field of robotics, intelligent missiles and nanoscience. We can say that missile or machine is made up of a systematic arrangement of its parts. Part of any machine does not possess property of mother machine. It is independent of it. Parts are made up of arrangement of atoms, but they can be random in nature. This is the main difference between machine and machine elements. Imagine system in which every element of part is a small robot which can be replaced by any other robot. now we gather a bunch of robots in a jar and run the program of particular machine, then robots will arrange themselves such that machine parts are formed and finally machine is formed. In this system every elementary robot will posses property of mother machine. Missile can be made up of small units assembled by robotic nanocubes who are capable of forming any shape depending on program operated to system. By arrangement of these robots missile/machine can penetrate any barrier. Missile/Machine can work with loss of some elementary robots due to rearrangement after elimination of faulty robots.
Keywords: Programmable matter, modular robotics, cubcatoms, catoms, claytronics, electromagnetism, missile, intelligent missile system
Bilingual International Conference on Information Technology: Yesterday, Toady, and Tomorrow, 19-21 Feburary 2015, pp. 44-47 © DESIDOC, 2015
1. IntroductIonIn recent years technologyis leading towards
automation and advanced robotics. universities like CMu, Cornell, MIT, Harward are working with Intel on the project called Claytronics1 in Claytronics, smallest individual, particle(robot) is called as catom(Claytronics atom).these catoms can interact with each other to form a 3-D object that user can interact with.
2. CUrrEnt rEsEArChIn today’s design, robots are able to move towards
or away from each other in 2D space. Due to this,
it is impossible for some designer, to design whole machine in 2-D. Currently CMu made a cylindrical catom which moves using 24 electromagnets by engaging and disengaging with other3,4. Still they achieved movement in 3-D space with respect to each other .In future catoms will move in 3-D space to assemble themselves into a machine.
We made a model of catoms which can move in 3-D space to achieve any desired shape. Our catom is cubical in shape so we call it as Cubcatom (cubical Claytronics atom)1. Cubcatom is the basic elementary particle from which 3-D machine can be

JADHAV: InTEllIGEnT MISSIlE SYSTEM BASED On MODulAr PrOGrAMMABlE MATTEr: CuBCATOMIC
45
contains strong electromagnet1.A. Mechanical movement:1. Whenever cube move independently from system it
can use metal plates to create a toppling effect.2. It moves by activating one of the four plates
connected to motor on face Fig.3. Whenever motor is activated cube starts to topple
independent of system4. Plate is moved till centre of mass rotates more
than 45 degrees wrt edge.5. Due to unbalanced torque cube is toppled. B. Electromagnetic movement:1. This movement is ‘movement of cube inside the
system.2. Whenever cube is near to another cube, electromagnet
between these will be activated such that plates get connected to each other.
3. After connecting right plates to ther motors connected to these gets activated so that cube can climb or move on other cube to obtain a 3-D figure.
4. By using this movement cube can climb, join, and replace other cube.
4. AlGorithMA computer algorithm is made to provide every
cube a particular number or name. After that every cube has its own unique identity. That can be used for communication of cubes among themselves. Every cube will contain sensor system which can determine distance between two cubes. Cubes can communicate with each other to form a particular shape depending upon requirement.
This algorithm works whenever reconstruction is required. Communication between cubes can be achieved by self-created wireless communication network.
5. ConClUsionThis project opens whole new area of r&D in
robotics and artificial intelligence. Application of this project:A. Barrierinvasion: Robot can pass through any obstacle independent of it’s shape. Missile can be divided into parts to pass through barrier and get assembled again. Missile can be made up of small elementary robots which are formed by assembly of Cubcatoms. Each elementary robot has its own power source as well as computing system. It will have self-flying system and control system. By using this, elementary robots get separated whenever needed. Missile’s every part can be made up of these tiny Cubcatoms.
Whenever it gets counter fired by another antimissile weapon, its algorithm of defence will get activated. Cubes will communicate with each other such that they
formed. Cubcatomic system is operated by advanced algorithm created for communication of cubes among themselves. By communicating with each other these can form desired shapes with desired cubes. It is a form of modular robotics (basic element).
2.1 Cubcatoms 1. 6 faces and 12 edges2. Every face contains 4 metal plate with electromagnet
in it3. Metal plate is connected to a brushless stepper
motor from which we can topple the cube from one face to another.
4. At every edge we connect motors from which plates can be rotated.
5. When two cubes come closer to each other electromagnets are activated such that these can attach to each other.
6. Cube can climb another cube by activating motor attached to connected plate.
3. IndEntAtIon And EQuAtIonMagnetic field created by electromagnets on plates,
B= µnI Condition for toppling of cube: centre of mass of cube must be tilted more than 45 degree with respect to fixed edge of cube.
Electromagnetism: It is found that whenever a current carrying conductor is placed in a magnetic field ,it experience a force which acts in a direction perpendicular to both the direction of the current and the field.
Working: smallest element of this system is cubical robot. This moves in 3-D using two way transmissions.A. Mechanical movementB. Electromagnetic movement
By assembling multiple robots we can form parts of a machine. The elementary robot is cubical containing 6 faces. Each face contains 4 plates with motor connected to each of these, centre of each plate
Figure 1. Cubcatoms.

ArTIFICIAl InTEllIGEnCE AnD nETWOrK SECurITY
46
form group of elementary flying robots. As antimissile weapon approaches to them they will move to make room for passing of weapon through system. Any kind of weapon will not be locked on system since system does not have centre point to get locked. Any part of system will not get effected due to this system.
For example, we can see the group of fish attacked by shark. Group moves in such a way that shark is unable to target a particular fish.B. Missile used as anti-weapon system:
Missile can be fired on incoming missile weapons to deviate from their path or to hack them. Whenever nuclear/chemical/hydrogen weapons approach to city we just can’t blow it up with antimissile weapons. That might lead to explosion of matter inside it. So to prevent that we need a system to deviate weapons from their tracks. This weapon system will be fired such that its deviation algorithm gets activated. Missile will follow the incoming missile and when it approaches near it, Cubcatoms will move from their positions such that these capture missile inside the whole system. After this by activating power source missile can be deviated from its path or destroyed at safe position.C. Other applications of this system: ● For making infrastructure in space: bunch of robots
can be carried to space with aerodynamic shape from earth to transform their shape into desired shape. e.g. space station, satellite.
● Can be used in medical robotics for operation or diagnosis purpose.
● used in surveillance purpose defence robotics. Big robot can be crawled in into any small
place.Machine is practically never going to fail due to
failure of any part as every part is made up of same replaceable elementary cubes. If any part is damaged, then it can be replaced by other cubes.
ACKnowlEdGMEntThe authors of express their gratitude towards
SGGSIE & T, nanded. This Project is funded by TEqIP-II of SGGSIE & T, nanded.
fu"d"k Zbl ifj;kstuk us jkscksfVDl vkSj vkÆVfQ+”;y baVsfytsal
esa vuqla/kku ,oa fodkl ds {ks= [kksy fn;s gaSA bl ifj;kstuk ds vuqiz;ksx% d½ cSfj;j vkØe.k%
jkscksV fdlh Hkh ck/kk dks Lora= :i ls fcuk mlds vkdkj ij vkfJr gq;s ikfjr dj ldrs gSaA ck/kk ds ek/;e dks ikfjr djus vkSj fQj ls bdV~Bk djus ds fy, felkby dks Hkkxks es ckaVk tkrk gSaA felk-by NksVs izkFkfed jkscksV ls cuk ldrs gSa] tks dqCd ,VEl
}kjk xfBr gksrs gSaA izR;sd izkFkfed jkscksV ds ikl viuh [kqn dh “kfä ds L=ksr lkFk gh lkFk daI;wÇVx iz.kkyh gksrh gSaA ;g vkRe mM+ku iz.kkyh vkSj fu;a=.k iz.kkyh gksxkA blds iz;ksx ls] izkFkfed jkscksV t:jr iM+us ij vyx gks tkrs gSaA felkby dk izR;sd NksVk fgLlk Hkh bUgh dqCd ,VEl ls cuk gSa Atc Hkh fdlh ,aVhfelkby gfFk;kj ls bls dkmaVj Qk;j djrs rks j{kk ds bldk ,YxksfjFe lfØ; gks tk,xkA D;wCl ,d nwljs ds lkFk bl rjg ls ckrphr djsaxs fd os izkFkfed mM+ku jkscks-Vksa ds lewg dks cukrs gSA tSls gh ,aVh&felkby gfFk;kj mu rd igq¡prh gS oSls gh os bl iz.kkyh ds ek/;e ls gfFk;kj ds xqtjus ds fy, txg cuk,¡xsA tc rd flLVe dk dsaæ Çcnq ykWd u gks rc rd fdlh Hkh rjg dk gfFk;kj iz.kkyh dks can ugha dj ik,xkA bl iz.kkyh dh ctg ls iz.kkyh dk dksbZ Hkh Hkkx izHkkfor ugha gksxkA
bl ckr ds mnkgj.k ds fy,] ge ns[k ldrs gSa fd “kkdZ us eNyh ds lewg ij geyk fd;k gksA eNyh dk lewg bl rjg ls pyrk gS fd “kkdZ ,d fo”ks’k eNyh dks yf{kr djus esa vleFkZ gksA[k½ felkby dk gfFk;kj&jks/kh ç.kkyh ds :i esa bLrseky%
felkby dks vkus okyh felkby gfFk;kjksa dks vius iFk ls fopfyr djus ds fy, ;k mUgsa gSd djus ds fy, NksM+k tk ldrk gSA tc Hkh dHkh ijek.kq@jklk;fud@ gkbMªkstu gfFk;kj “kgj dh rjQ vkrs gSa rks mudks ge ,afV felkby ds lkFk flQZ ,sls gh gok esa ugha NksM+ ldrsA ;g Hkh gks ldrk gS tks blls dksbZ foLQksV gks tk;sA ,slk u gks blfy, bls jksdus ds fy, ,slh ç.kkyh dh t:jr gS tks bu gfFk;kjksa dks muds iFk ls gVk nsA bl gfFk;kj ç.kkyh dks bl rjg ls Qk;j fd;k tk, fd bldk fopyu ,YxksfjFe lfØ; gks tk,A felkby vkus okyh felky dk ihNk djsxh vkSj tSlh gh mlds ikl igq¡psxh] D;wcVe viuh fLFkfr ls gVdj iwjs flLVe ds vanj tkdj felkby ij dCtk dj ysaxsA blds ckn “kfä L=ksr lfØ; dj] felkby dks mlds y{; ls vyx dj ldrs gSa ;k fdlh lqjf{kr LFkku ij tkdj u’V dj ldrs gaSAx½ bl ç.kkyh ds vU; vuqç;ksx%● varfj{k esa cqfu;knh <kaps cukus ds fy,% ,sjks&Mk;ukfed
vkdkj ds lkFk jkscksV ds xqPNksa dks muds vkdkj dks okafNr vkdkj esa cnyus ds fy, i`Foh ls varfj{k es ys tk ldrs gaSA tSls varfj{k LVs”ku] mixzgA
● v‚ijs”ku ;k funku ds mís”; ds fy, fpfdRlk jkscksfVDl esa ç;ksx fd;k tk ldrk gSA
● j{kk jkscksfVDl esa fuxjkuh mís”; esa bLrseky fd;k x;k gSA● fcx jkscksV fdlh Hkh NksVh lh txg esa jsax ldrs gaSA
e”khu O;kogkfjd :i ls dHkh fdlh Hkh Hkkx ds foQy gksus ls vlQy ugha gks ldrh D;ksafd gj ,d fgLlk çfrLFkkiu

JADHAV: InTEllIGEnT MISSIlE SYSTEM BASED On MODulAr PrOGrAMMABlE MATTEr: CuBCATOMIC
47
;ksX; çkFkfed D;wCl ls cuk gSA vxj dksbZ Hkkx u’V gks Hkh x;k rks mls vU; D;wCl ls çfrLFkkiu fd;k tk ldrk gSA
rEFErEnCEs1. Alok A. Jadhav, rahul n. Dhole, Vishal S. undre,
& l. M. Waghmare, Modular Programmable Matter Based on Mechanical and Electromagnetic System: Cubcatoms, Golden Joubly International Conference on Advances in Civil and Mechanical Engineering, 23-24 Dec.,2014 [unpublished].
2. ramprasad ravichandran & Geoffrey Gordon .A Scalable Distributed Algorithm for Shape Transformation in Multi-robot Systems”, IEEE/RSJ International Conference on Intelligent Robots and Systems, ISBn- 978-1-4244-0912-9, Oct.29, 2007.
3. http://www.cs.cmu.edu/~claytronics/hardware/planar.html.
4. http://www.eecs.harvard.edu/ssr/projects/progSA/kilobot.html
Likf”k;y MsVkcsl ds fy, vLi’V v‚CtsDV vksfj,afVM oSpkfjd e‚Mfyax dk u;k –f’Vdks.kA new Approach of Fuzzy object oriented Conceptual Modelling for spatial databases
Ram Singar Verma*, Shobhit Shukla#, Gaurav Jaiswal#, and Ajay Kumar GuptaInstitute of Engineering and Technology, Lucknow, India
#University of Lucknow, India *E-mail: [email protected]
lkjka”k
vLi’V rduhd cM+s iSekus ij vlaf{kIr vkSj vfuf”pr vkadM+ksa dks Li’Vrk ls o.kZu djus vkSj cnyus ds fy, fofHkUu MsVkcsl e‚My ds fy, ykxw dh x;h gSA v‚CtsDV vksfj,afVM MsVkcsl e‚Mfyax dk QTth foLrkj] vLi’V v‚CtsDV MsVkcsl ¼,QvksvksMh½ e‚Mfyax dgk tkrk gS] tks tfVy oLrqvksa vkSj MsVk v”kq)rk dks laHkkyus esa l{ke gSA bl vkys[k esa] v‚CtsDV vksfj,afVM fopkj ds lkFk bls o.kZu djus ds fy, fofHkUu çdkj dh vLi’Vrk dks] Hkko Lrj ij] v‚CtsDV vkSj Dykl ds chp] lc&Dykl vkSj lqij Dykl ds chp bR;kfn vLi’Vrk lfgr “kkfey fd;k vkSj [kkstk x;k gSA blds vykok] geus vkbZ,Q2vks vkSj vLi’V bZbZvkj MsVk e‚Mfyax rduhdksa dks “kkfey fd;k gS vkSj çn”kZu fo”ys’k.k vkSj n{krk dk rqyukRed v/;;u fd;k x;k gSA
AbstrAct
Fuzzy techniques have been extensively applied to various database models to explicitly represent and manipulate the imprecise and uncertain data precisely. The fuzzy extension of the object oriented database modeling, called Fuzzy Object Oriented Database (FOOD) Modeling is capable to handle complex objects as well as data inexactness. In this paper, multiple types of fuzziness have been introduced and investigated, including fuzziness at attribute level, between object and class, between sub class and super class etc to describe it with the concepts of object orientation. Also we have introduced IF2O and fuzzy EEr data modeling techniques and a comparison for performance analysis and efficiency has been carried out.
Keywords: Fuzzy object oriented database (FOODB), IF2O model, EEr model, aggregation, specialisation, generalisation, inheritance, uFO model
Bilingual International Conference on Information Technology: Yesterday, Today, and Tomorrow, 19-21 February 2015, pp. 48-52(C) DESIDOC, 2015
1. IntroductIonClassical database models often suffers from their
incapability to represent and manipulate imprecise and uncertain data that may be found in many real world and engineering applications. Since early 1980’s, Zadeh’s Fuzzy logic1 has been introduced to extend various classical data models to make these capable of handling information in exactness . Rapid advances in computing power have brought opportunities for databases in emerging applications, like CAD/CAM, multimedia, GIS applications, and spatial database. These applications characteristically require the modelling and manipulation of the complex objects and semantic relationships. Relational databases and their fuzzy extensions are not suitable to deal with complex objects needed for above applications. Such objects can be modelled and represented well using object-oriented modelling techniques.
2. rElAtEd worKsThe next generation of the development of data
modelling in databases have been concerned with the object oriented modelling and their fuzzy extensions. This section provides the latest review on different approaches regarding modelling and representing the imprecise and uncertain information in fuzzy object oriented databases. Yazici2 introduced an extended nested relational data model, also known as nF2 data model, for representing and manipulating complex and uncertain data in the database. The extended algebra and extended Sql like query languages were hereby defined. But it is very difficult for nF2 data model to represent complex relationships among objects and attributes. Some advanced and innovative features, like class hierarchy, inheritance, super class/sub-class and encapsulation are not supported by nF2 data model. Therefore, to model complex valued attributes as well as complex relationships among
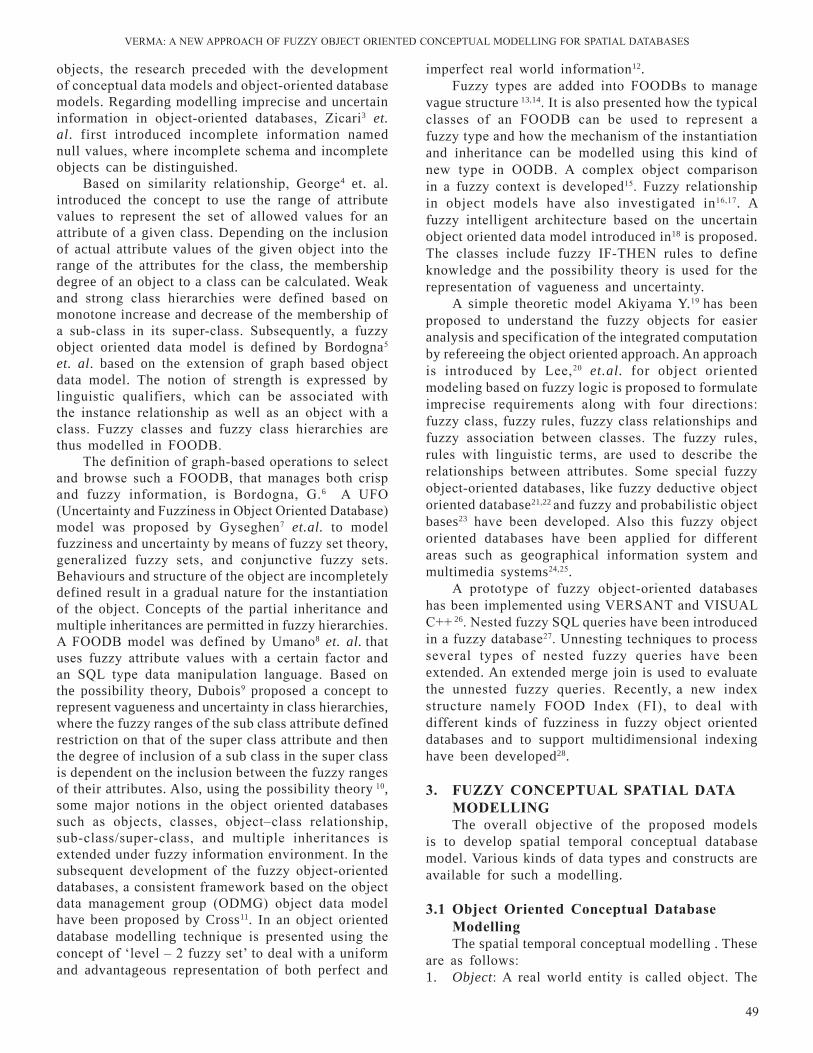
VErMA: A nEW APPrOACH OF FuZZY OBJECT OrIEnTED COnCEPTuAl MODEllInG FOr SPATIAl DATABASES
49
objects, the research preceded with the development of conceptual data models and object-oriented database models. Regarding modelling imprecise and uncertain information in object-oriented databases, Zicari3 et. al. first introduced incomplete information named null values, where incomplete schema and incomplete objects can be distinguished.
Based on similarity relationship, George4 et. al. introduced the concept to use the range of attribute values to represent the set of allowed values for an attribute of a given class. Depending on the inclusion of actual attribute values of the given object into the range of the attributes for the class, the membership degree of an object to a class can be calculated. Weak and strong class hierarchies were defined based on monotone increase and decrease of the membership of a sub-class in its super-class. Subsequently, a fuzzy object oriented data model is defined by Bordogna5 et. al. based on the extension of graph based object data model. The notion of strength is expressed by linguistic qualifiers, which can be associated with the instance relationship as well as an object with a class. Fuzzy classes and fuzzy class hierarchies are thus modelled in FOODB.
The definition of graph-based operations to select and browse such a FOODB, that manages both crisp and fuzzy information, is Bordogna, G.6 A uFO (uncertainty and Fuzziness in Object Oriented Database) model was proposed by Gyseghen7 et.al. to model fuzziness and uncertainty by means of fuzzy set theory, generalized fuzzy sets, and conjunctive fuzzy sets. Behaviours and structure of the object are incompletely defined result in a gradual nature for the instantiation of the object. Concepts of the partial inheritance and multiple inheritances are permitted in fuzzy hierarchies. A FOODB model was defined by umano8 et. al. that uses fuzzy attribute values with a certain factor and an Sql type data manipulation language. Based on the possibility theory, Dubois9 proposed a concept to represent vagueness and uncertainty in class hierarchies, where the fuzzy ranges of the sub class attribute defined restriction on that of the super class attribute and then the degree of inclusion of a sub class in the super class is dependent on the inclusion between the fuzzy ranges of their attributes. Also, using the possibility theory 10, some major notions in the object oriented databases such as objects, classes, object–class relationship, sub-class/super-class, and multiple inheritances is extended under fuzzy information environment. In the subsequent development of the fuzzy object-oriented databases, a consistent framework based on the object data management group (ODMG) object data model have been proposed by Cross11. In an object oriented database modelling technique is presented using the concept of ‘level – 2 fuzzy set’ to deal with a uniform and advantageous representation of both perfect and
imperfect real world information12.Fuzzy types are added into FOODBs to manage
vague structure 13,14. It is also presented how the typical classes of an FOODB can be used to represent a fuzzy type and how the mechanism of the instantiation and inheritance can be modelled using this kind of new type in OODB. A complex object comparison in a fuzzy context is developed15. Fuzzy relationship in object models have also investigated in16,17. A fuzzy intelligent architecture based on the uncertain object oriented data model introduced in18 is proposed. The classes include fuzzy IF-THEn rules to define knowledge and the possibility theory is used for the representation of vagueness and uncertainty.
A simple theoretic model Akiyama Y.19 has been proposed to understand the fuzzy objects for easier analysis and specification of the integrated computation by refereeing the object oriented approach. An approach is introduced by lee,20 et.al. for object oriented modeling based on fuzzy logic is proposed to formulate imprecise requirements along with four directions: fuzzy class, fuzzy rules, fuzzy class relationships and fuzzy association between classes. The fuzzy rules, rules with linguistic terms, are used to describe the relationships between attributes. Some special fuzzy object-oriented databases, like fuzzy deductive object oriented database21,22 and fuzzy and probabilistic object bases23 have been developed. Also this fuzzy object oriented databases have been applied for different areas such as geographical information system and multimedia systems24,25.
A prototype of fuzzy object-oriented databases has been implemented using VErSAnT and VISuAl C++ 26. nested fuzzy Sql queries have been introduced in a fuzzy database27. unnesting techniques to process several types of nested fuzzy queries have been extended. An extended merge join is used to evaluate the unnested fuzzy queries. recently, a new index structure namely FOOD Index (FI), to deal with different kinds of fuzziness in fuzzy object oriented databases and to support multidimensional indexing have been developed28.
3. FUzzY ConCEPtUAl sPAtiAl dAtA ModEllinGThe overall objective of the proposed models
is to develop spatial temporal conceptual database model. Various kinds of data types and constructs are available for such a modelling.
3.1 object oriented Conceptual database ModellingThe spatial temporal conceptual modelling . These
are as follows:1. Object: A real world entity is called object. The
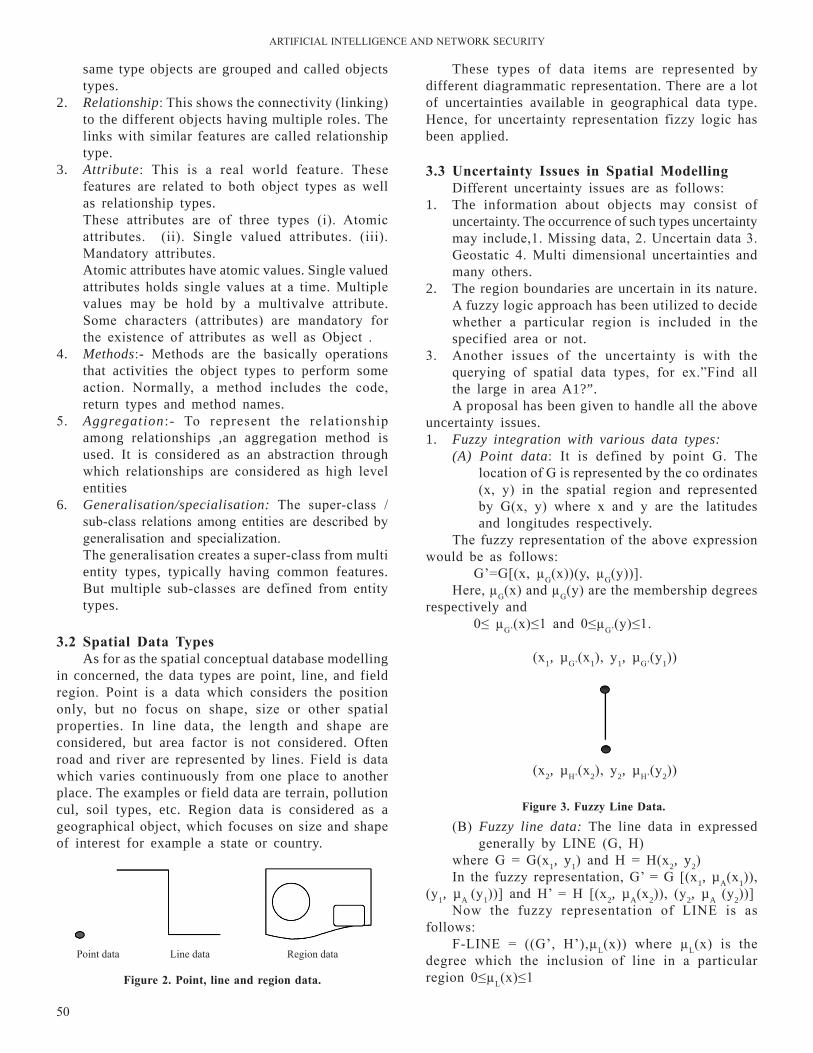
ArTIFICIAl InTEllIGEnCE AnD nETWOrK SECurITY
50
These types of data items are represented by different diagrammatic representation. There are a lot of uncertainties available in geographical data type. Hence, for uncertainty representation fizzy logic has been applied.
3.3 Uncertainty issues in spatial ModellingDifferent uncertainty issues are as follows:
1. The information about objects may consist of uncertainty. The occurrence of such types uncertainty may include,1. Missing data, 2. uncertain data 3. Geostatic 4. Multi dimensional uncertainties and many others.
2. The region boundaries are uncertain in its nature. A fuzzy logic approach has been utilized to decide whether a particular region is included in the specified area or not.
3. Another issues of the uncertainty is with the querying of spatial data types, for ex.”Find all the large in area A1?”.A proposal has been given to handle all the above
uncertainty issues.1. Fuzzy integration with various data types: (A) Point data: It is defined by point G. The
location of G is represented by the co ordinates (x, y) in the spatial region and represented by G(x, y) where x and y are the latitudes and longitudes respectively.
The fuzzy representation of the above expression would be as follows:
G’=G[(x, µG(x))(y, µG(y))].Here, µG(x) and µG(y) are the membership degrees
respectively and 0≤ µG’(x)≤1 and 0≤µG’(y)≤1.
(x1, µG’(x1), y1, µG’(y1))
(x2, µH’(x2), y2, µH’(y2))
Figure 3. Fuzzy line data.
(B) Fuzzy line data: The line data in expressed generally by lInE (G, H)
where G = G(x1, y1) and H = H(x2, y2)In the fuzzy representation, G’ = G [(x1, µA(x1)),
(y1, µA (y1))] and H’ = H [(x2, µA(x2)), (y2, µA (y2))]now the fuzzy representation of lInE is as
follows:F-lInE = ((G’, H’),µl(x)) where µl(x) is the
degree which the inclusion of line in a particular region 0≤µl(x)≤1
same type objects are grouped and called objects types.
2. Relationship: This shows the connectivity (linking) to the different objects having multiple roles. The links with similar features are called relationship type.
3. Attribute: This is a real world feature. These features are related to both object types as well as relationship types.
These attributes are of three types (i). Atomic attributes. (ii). Single valued attributes. (iii). Mandatory attributes.
Atomic attributes have atomic values. Single valued attributes holds single values at a time. Multiple values may be hold by a multivalve attribute. Some characters (attributes) are mandatory for the existence of attributes as well as Object .
4. Methods:- Methods are the basically operations that activities the object types to perform some action. normally, a method includes the code, return types and method names.
5. Aggregation:- To represent the relationship among relationships ,an aggregation method is used. It is considered as an abstraction through which relationships are considered as high level entities
6. Generalisation/specialisation: The super-class /sub-class relations among entities are described by generalisation and specialization.
The generalisation creates a super-class from multi entity types, typically having common features. But multiple sub-classes are defined from entity types.
3.2 spatial data types
As for as the spatial conceptual database modelling in concerned, the data types are point, line, and field region. Point is a data which considers the position only, but no focus on shape, size or other spatial properties. In line data, the length and shape are considered, but area factor is not considered. Often road and river are represented by lines. Field is data which varies continuously from one place to another place. The examples or field data are terrain, pollution cul, soil types, etc. Region data is considered as a geographical object, which focuses on size and shape of interest for example a state or country.
Figure 2. Point, line and region data.
Point data line data region data
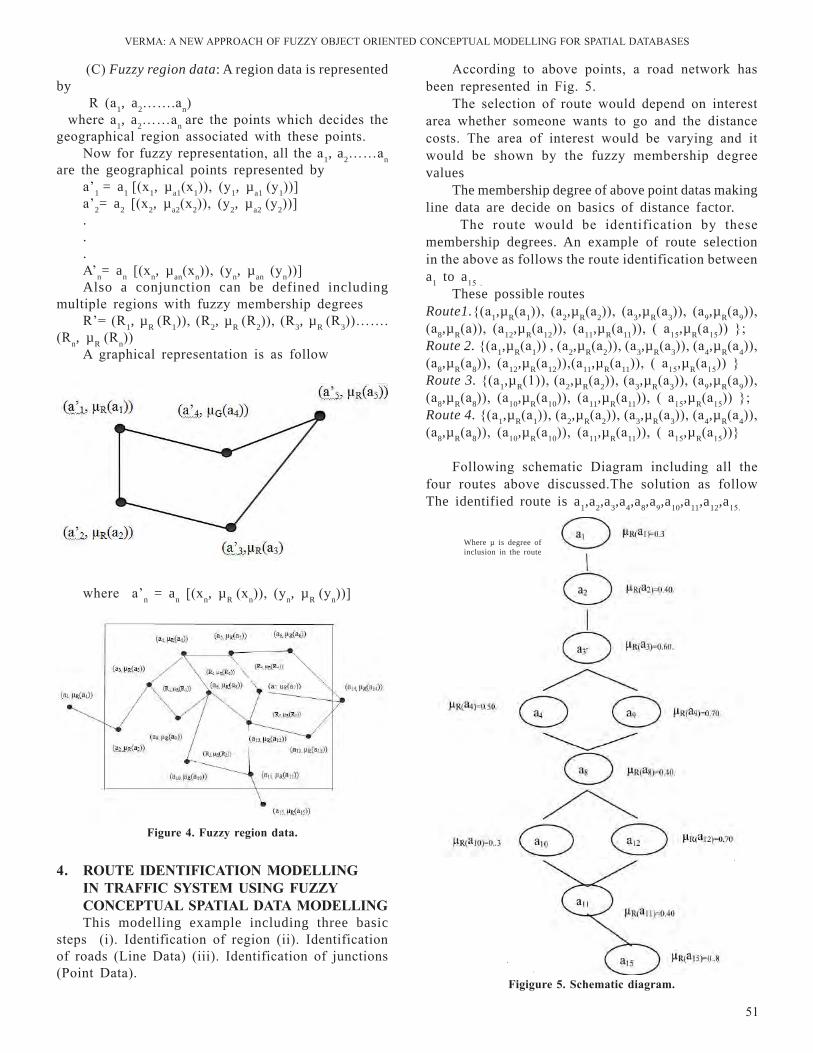
VErMA: A nEW APPrOACH OF FuZZY OBJECT OrIEnTED COnCEPTuAl MODEllInG FOr SPATIAl DATABASES
51
(C) Fuzzy region data: A region data is represented by
r (a1, a2…….an)where a1, a2……an are the points which decides the
geographical region associated with these points.now for fuzzy representation, all the a1, a2……an
are the geographical points represented bya’1 = a1 [(x1, µa1(x1)), (y1, µa1 (y1))]a’2= a2 [(x2, µa2(x2)), (y2, µa2 (y2))]...A’n= an [(xn, µan(xn)), (yn, µan (yn))]Also a conjunction can be defined including
multiple regions with fuzzy membership degreesr’= (r1, µR (r1)), (r2, µR (r2)), (r3, µR (r3))…….
(rn, µR (rn))A graphical representation is as follow
According to above points, a road network has been represented in Fig. 5.
The selection of route would depend on interest area whether someone wants to go and the distance costs. The area of interest would be varying and it would be shown by the fuzzy membership degree values
The membership degree of above point datas making line data are decide on basics of distance factor.
The route would be identification by these membership degrees. An example of route selection in the above as follows the route identification between a1 to a15 .
These possible routesRoute1.{(a1,µR(a1)), (a2,µR(a2)), (a3,µR(a3)), (a9,µR(a9)), (a8,µR(a )), (a12,µR(a12)), (a11,µR(a11)), ( a15,µR(a15)) };Route 2. {(a1,µR(a1)) , (a2,µR(a2)), (a3,µR(a3)), (a4,µR(a4)), (a8,µR(a8)), (a12,µR(a12)),(a11,µR(a11)), ( a15,µR(a15)) }Route 3. {(a1,µR(1)), (a2,µR(a2)), (a3,µR(a3)), (a9,µR(a9)), (a8,µR(a8)), (a10,µR(a10)), (a11,µR(a11)), ( a15,µR(a15)) };Route 4. {(a1,µR(a1)), (a2,µR(a2)), (a3,µR(a3)), (a4,µR(a4)), (a8,µR(a8)), (a10,µR(a10)), (a11,µR(a11)), ( a15,µR(a15))}
Following schematic Diagram including all the four routes above discussed.The solution as follow The identified route is a1,a2,a3,a4,a8,a9,a10,a11,a12,a15.
Figigure 5. schematic diagram.
Where µ is degree of inclusion in the route
Figure 4. Fuzzy region data.
where a’n = an [(xn, µR (xn)), (yn, µR (yn))]
4. roUtE idEntiFiCAtion ModEllinG
in trAFFiC sYstEM UsinG FUzzY ConCEPtUAl sPAtiAl dAtA ModEllinGThis modelling example including three basic
steps (i). Identification of region (ii). Identification of roads (line Data) (iii). Identification of junctions (Point Data).
ArTIFICIAl InTEllIGEnCE AnD nETWOrK SECurITY
52
usefulness in object-oriented database modeling, Fuzzy Sets and Systems, 140, 2003, 29-49.
13. n. Marín, J. M. Medina, O. Pons, D. Sánchez, and M. A. Vila, Complex object comparison in a fuzzy context, In-formation and Software Technology, 45, 2003, 431-444.
14. n. Marín, O. Pons, and M. A. Vila, A strategy for adding fuzzy types to an object oriented database system, Interna-tional Journal of Intelligent Systems, 16, 2001 863-880.
15. n. Marín, M. A. Vila, and O. Pons, Fuzzy types: A new concept of type for managing vague structures, Interna-tional Journal of Intelligent Systems, 15, 2000, 1061-1085.
16. V. Cross, Fuzzy extensions for relationships in a gener-alized object model, International Journal of Intelligent Systems, 16, 2001, 843-861.
17. V. Cross, Defining fuzzy relationships in object models: Abstraction and interpretation, Fuzzy Sets and Systems, 140, 2003, 5-27.
18. T. D. ndouse, Intelligent systems modeling with reusable fuzzy objects, International Journal of Intelligent Sys-tems, 12, 1997, 137-152.
19. Akiyama Y. and Higuchi K., A Simple Theoretic Model to understand fuzzy objects, IEEE International Conference on Systems, Man & Cybernetics, 1998, 20-40.
20. J. lee, n. l. Xue, K. H. Hsu, and S. J. H. Yang, Modeling imprecise requirements with fuzzy objects, Information Sciences, 118, 1999, 101-119.
21. M. Koyuncu and A. Yazici, IFOOD: an intelligent fuzzy object-oriented database architecture, IEEE Transactions on Knowledge and Data Engineering, Vol. 15 2003 1137-1154.
22. A. Yazici and M. Koyuncu, Fuzzy object-oriented data-base modeling coupled with fuzzy logic, Fuzzy Sets and Systems, 89, 1997, pp. 1-26.
23. T. H. Cao and J. M. rossiter, A deductive probabilistic and fuzzy object-oriented database language, Fuzzy Sets and Systems, Vol. 140 2003 129-150.
24. V. Cross and A. Firat, Fuzzy objects for geographical in-formation systems, Fuzzy Sets and systems, 1132000 19-36.
25. A. K. Majumdar, I. Bhattacharya, and A. K. Saha, An ob-ject-oriented fuzzy data model for similarity detection in image databases, IEEE Transactions on
Knowledge and Data Engineering, 14, 2002, 1186- 89.26. Firat. A., Cross V., lee T.C. Fuzzy set Theory in object
oriented databases: A prototype implementation using VErSAnT ODBMS & VISuAl C++, IEEE Conference of north American Fuzzy Information Society, 20-21 Aug 1998, 146-150.
27. Yang q., Zhang, W., Wu J., Yu C. na Kajima. H. rishe n.D. Efficient Processing of nested fuzzy Sql queries in fuzzy databases, IEEE Transaction on Knowledge and Data Engineering, 2001, 13(6), 884-901.
28. Yazici A. FOOD Index: A multi dimensional Index Struc-ture for Similarity based fuzzy object oriented database models, IEEE Transaction on Fuzzy Systems, 2008 ,16(4), 942-957.
5. ConClUsionSpatial data modelling has lot of in exactness
itself. To deal with the inexactness and to request it precisely a fuzzy-based conceptual modeling approach has been developed this paper. The application of proposed model is carried out in the route identification problem of traffic network.
fu’d’k ZLikf”k;y MsVk e‚Mfyax esa dbZ v”kq)rk gSA v’kq)rk
ls fuiVus ds fy, vkSj bls Bhd ls djus ds fy, QTth vk/kkfjr oSpkfjd e‚Mfyax bl vkys[k esa fodflr fd;k x;kA ,Iyhd”ku dks ;krk;kr usVodZ ds ekxZ igpkuus dh leL;k esa çLrkfor fd;k x;k gSA
rEFErEnCEs1. Zadeh, l.A. , Fuzzy Sets, Information & Control, 8 1965,
338-353.2. Yazici, A., Soysal, A., Buckles, B. P. and Petry, F. E.,
uncertainty in a nested relational database model, Data &Knowledge Engineering, 30(3) 1999 275-301.
3. Zicari, r. and Milano, P., Incomplete information in ob-ject-oriented databases, ACM SIGMOD record, 19(3) 1990, 5-16.
4. George, r., Srikanth, r., Petry, F. E. and Buckles, B. P., uncertainty management issues in the object-oriented data model, IEEE Transactions on Fuzzy Systems, 4(2) 1996, 179-92.
5. Bordogna, G., Pasi, G. and luearella, D., A fuzzy object-oriented data model for managing vague and uncertain information, International Journal of Intelligent Systems, 14 1999 623-651.
6. G. Bordogna and G. Pasi, Graph-based interaction in a fuzzy object oriented database, International Journal of Intelligent Systems, 16 ,2001, 821-841.
7. Gyseghem, n. V. and de Caluwe, r., Imprecision and un-certainty in uFO database model, Journal of the American Society for Information Science, 49 (3), 1998, 236-252.
8. M. umano, T. Imada, I. Hatono, and H. Tamura, Fuzzy object-oriented databases and implementation of its Sql-type data manipulation language, in Proceedings of the 7th IEEE International Conference on Fuzzy Systems, 2 1998, 1344-49.
9. 29. D. Dubois, H. Prade, and J. P. rossazza, Vagueness, typicality, and uncertainty in class hierarchies, Interna-tional Journal of Intelligent Systems, 6 1991 167-183.
10. Z. M. Ma, W. J. Zhang, and W. Y. Ma, Extending object-oriented databases for fuzzy information modeling, Infor-mation Systems, 29, 2004, 421- 35.
11. V. Cross, r. Caluwe, and n. van Gyseghem, A perspective from the fuzzy object data management group (FODMG), in Proceedings of the 6th IEEE International Conference on Fuzzy Systems, 2, 1997, 721-728.
12. G. de Tré and r. de Caluwe, level-2 fuzzy sets and their
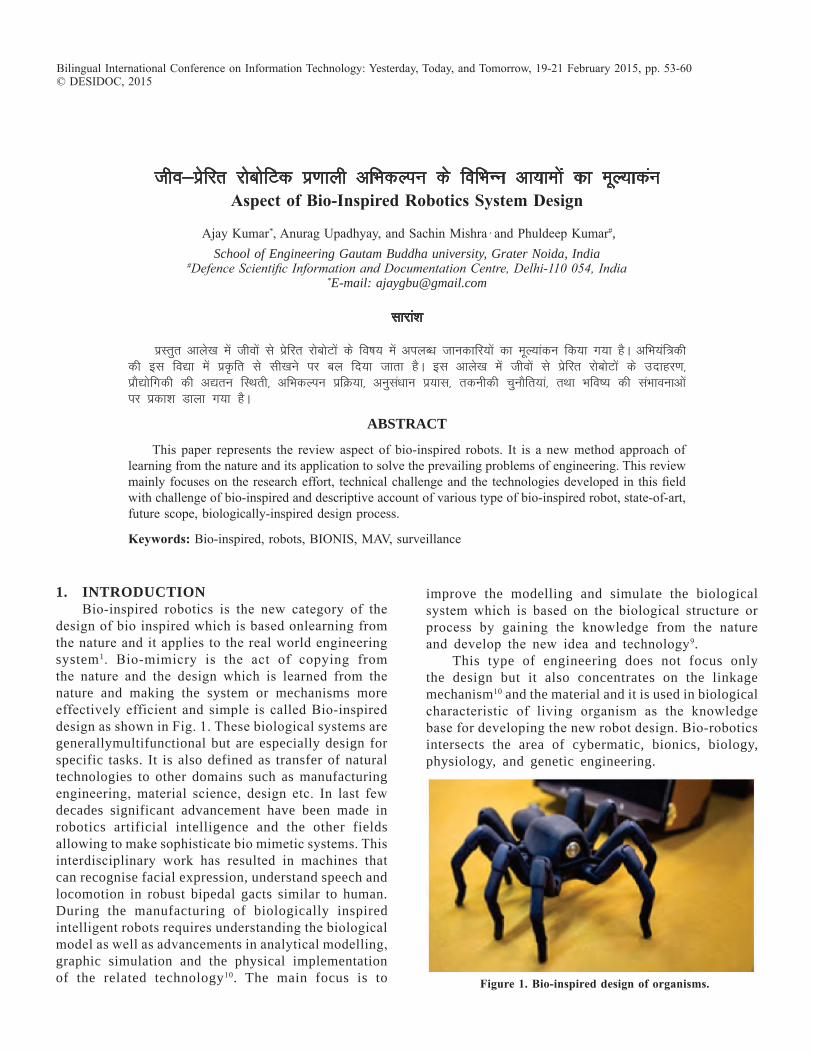
tho&izsfjr jkscksfVd iz.kkyh vfHkdYiu ds fofHkUu vk;keksa dk ewY;kdauAspect of bio-inspired robotics system design
Ajay Kumar*, Anurag upadhyay, and Sachin Mishra , and Phuldeep Kumar#,School of Engineering Gautam Buddha university, Grater Noida, India
#Defence Scientific Information and Documentation Centre, Delhi-110 054, India *E-mail: [email protected]
lkjka”k
izLrqr vkys[k esa thoksa ls izsfjr jkscksVksa ds fo"k; esa viyC/k tkudkfj;ksa dk ewY;kadu fd;k x;k gSA vfHk;af=dh dh bl fo|k esa izÑfr ls lh[kus ij cy fn;k tkrk gSA bl vkys[k esa thoksa ls izsfjr jkscksVksa ds mnkgj.k] izkS|ksfxdh dh v|ru fLFkrh] vfHkdYiu izfØ;k] vuqla/kku iz;kl] rduhdh pqukSfr;ka] rFkk Hkfo"; dh laHkkoukvksa ij izdk'k Mkyk x;k gSA
AbstrAct
This paper represents the review aspect of bio-inspired robots. It is a new method approach of learning from the nature and its application to solve the prevailing problems of engineering. This review mainly focuses on the research effort, technical challenge and the technologies developed in this field with challenge of bio-inspired and descriptive account of various type of bio-inspired robot, state-of-art, future scope, biologically-inspired design process.
Keywords: Bio-inspired, robots, BIOnIS, MAV, surveillance
Bilingual International Conference on Information Technology: Yesterday, Today, and Tomorrow, 19-21 February 2015, pp. 53-60© DESIDOC, 2015
1. IntroductIonBio-inspired robotics is the new category of the
design of bio inspired which is based onlearning from the nature and it applies to the real world engineering system1. Bio-mimicry is the act of copying from the nature and the design which is learned from the nature and making the system or mechanisms more effectively efficient and simple is called Bio-inspired design as shown in Fig. 1. These biological systems are generallymultifunctional but are especially design for specific tasks. It is also defined as transfer of natural technologies to other domains such as manufacturing engineering, material science, design etc. In last few decades significant advancement have been made in robotics artificial intelligence and the other fields allowing to make sophisticate bio mimetic systems. This interdisciplinary work has resulted in machines that can recognise facial expression, understand speech and locomotion in robust bipedal gacts similar to human.During the manufacturing of biologically inspired intelligent robots requires understanding the biological model as well as advancements in analytical modelling, graphic simulation and the physical implementation of the related technology10. The main focus is to
improve the modelling and simulate the biological system which is based on the biological structure or process by gaining the knowledge from the nature and develop the new idea and technology9.
This type of engineering does not focus only the design but it also concentrates on the linkage mechanism10 and the material and it is used in biological characteristic of living organism as the knowledge base for developing the new robot design. Bio-robotics intersects the area of cybermatic, bionics, biology, physiology, and genetic engineering.
Figure 1. bio-inspired design of organisms.
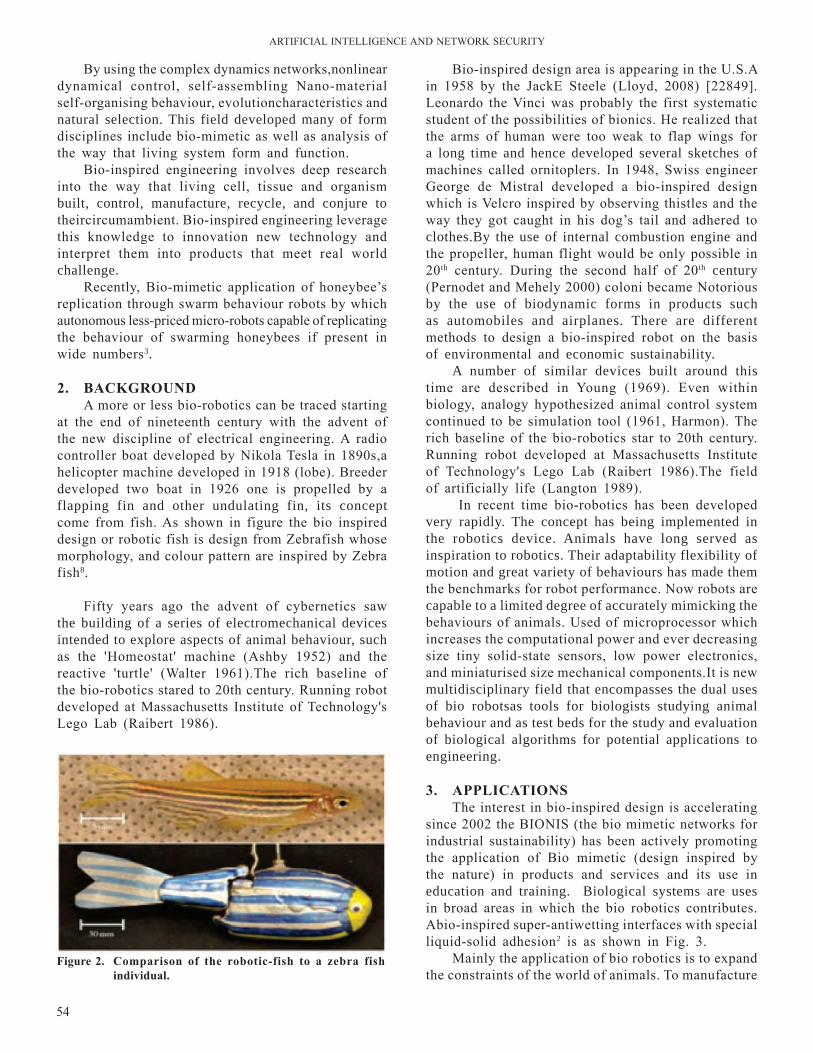
ArTIFICIAl InTEllIGEnCE AnD nETWOrK SECurITY
54
By using the complex dynamics networks,nonlinear dynamical control, self-assembling nano-material self-organising behaviour, evolutioncharacteristics and natural selection. This field developed many of form disciplines include bio-mimetic as well as analysis of the way that living system form and function.
Bio-inspired engineering involves deep research into the way that living cell, tissue and organism built, control, manufacture, recycle, and conjure to theircircumambient. Bio-inspired engineering leverage this knowledge to innovation new technology and interpret them into products that meet real world challenge.
recently, Bio-mimetic application of honeybee’s replication through swarm behaviour robots by which autonomous less-priced micro-robots capable of replicating the behaviour of swarming honeybees if present in wide numbers3.
2. bACKGroUndA more or less bio-robotics can be traced starting
at the end of nineteenth century with the advent of the new discipline of electrical engineering. A radio controller boat developed by nikola Tesla in 1890s,a helicopter machine developed in 1918 (lobe). Breeder developed two boat in 1926 one is propelled by a flapping fin and other undulating fin, its concept come from fish. As shown in figure the bio inspired design or robotic fish is design from Zebrafish whose morphology, and colour pattern are inspired by Zebra fish8.
Fifty years ago the advent of cybernetics saw the building of a series of electromechanical devices intended to explore aspects of animal behaviour, such as the 'Homeostat' machine (Ashby 1952) and the reactive 'turtle' (Walter 1961).The rich baseline of the bio-robotics stared to 20th century. running robot developed at Massachusetts Institute of Technology's lego lab (raibert 1986).
Bio-inspired design area is appearing in the u.S.A in 1958 by the JackE Steele (lloyd, 2008) [22849].leonardo the Vinci was probably the first systematic student of the possibilities of bionics. He realized that the arms of human were too weak to flap wings for a long time and hence developed several sketches of machines called ornitoplers. In 1948, Swiss engineer George de Mistral developed a bio-inspired design which is Velcro inspired by observing thistles and the way they got caught in his dog’s tail and adhered to clothes.By the use of internal combustion engine and the propeller, human flight would be only possible in 20th century. During the second half of 20th century (Pernodet and Mehely 2000) coloni became notorious by the use of biodynamic forms in products such as automobiles and airplanes. There are different methods to design a bio-inspired robot on the basis of environmental and economic sustainability.
A number of similar devices built around this time are described in Young (1969). Even within biology, analogy hypothesized animal control system continued to be simulation tool (1961, Harmon). The rich baseline of the bio-robotics star to 20th century. running robot developed at Massachusetts Institute of Technology's lego lab (raibert 1986).The field of artificially life (langton 1989).
In recent time bio-robotics has been developed very rapidly. The concept has being implemented in the robotics device. Animals have long served as inspiration to robotics. Their adaptability flexibility of motion and great variety of behaviours has made them the benchmarks for robot performance. now robots are capable to a limited degree of accurately mimicking the behaviours of animals. used of microprocessor which increases the computational power and ever decreasing size tiny solid-state sensors, low power electronics, and miniaturised size mechanical components.It is new multidisciplinary field that encompasses the dual uses of bio robotsas tools for biologists studying animal behaviour and as test beds for the study and evaluation of biological algorithms for potential applications to engineering.
3. APPliCAtionsThe interest in bio-inspired design is accelerating
since 2002 the BIOnIS (the bio mimetic networks for industrial sustainability) has been actively promoting the application of Bio mimetic (design inspired by the nature) in products and services and its use in education and training. Biological systems are uses in broad areas in which the bio robotics contributes.Abio-inspired super-antiwetting interfaces with special liquid-solid adhesion2 is as shown in Fig. 3.
Mainly the application of bio robotics is to expand the constraints of the world of animals. To manufacture
Figure 2. Comparison of the robotic-fish to a zebra fish individual.
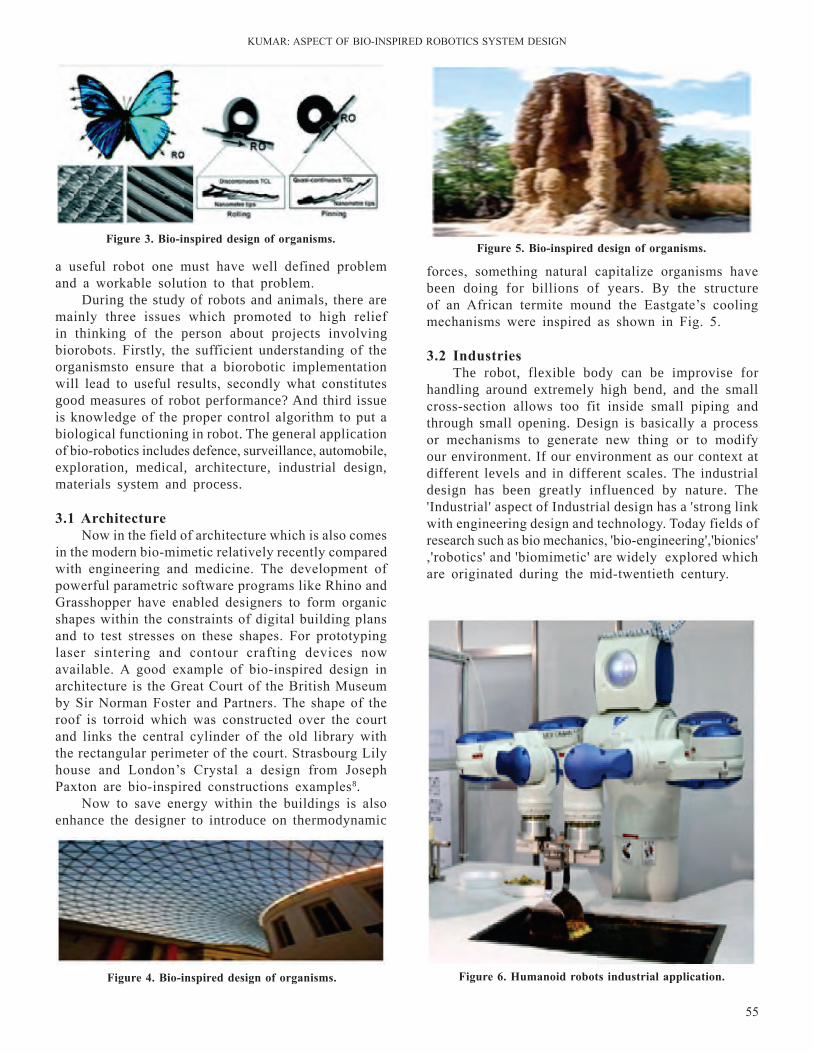
KuMAr: ASPECT OF BIO-InSPIrED rOBOTICS SYSTEM DESIGn
55
a useful robot one must have well defined problem and a workable solution to that problem.
During the study of robots and animals, there are mainly three issues which promoted to high relief in thinking of the person about projects involving biorobots. Firstly, the sufficient understanding of the organismsto ensure that a biorobotic implementation will lead to useful results, secondly what constitutes good measures of robot performance? And third issue is knowledge of the proper control algorithm to put a biological functioning in robot. The general application of bio-robotics includes defence, surveillance, automobile, exploration, medical, architecture, industrial design, materials system and process.
3.1 Architecturenow in the field of architecture which is also comes
in the modern bio-mimetic relatively recently compared with engineering and medicine. The development of powerful parametric software programs like rhino and Grasshopper have enabled designers to form organic shapes within the constraints of digital building plans and to test stresses on these shapes. For prototyping laser sintering and contour crafting devices now available. A good example of bio-inspired design in architecture is the Great Court of the British Museum by Sir norman Foster and Partners. The shape of the roof is torroid which was constructed over the court and links the central cylinder of the old library with the rectangular perimeter of the court. Strasbourg lily house and london’s Crystal a design from Joseph Paxton are bio-inspired constructions examples8.
now to save energy within the buildings is also enhance the designer to introduce on thermodynamic
Figure 3. bio-inspired design of organisms.Figure 5. bio-inspired design of organisms.
forces, something natural capitalize organisms have been doing for billions of years. By the structure of an African termite mound the Eastgate’s cooling mechanisms were inspired as shown in Fig. 5.
3.2 industriesThe robot, flexible body can be improvise for
handling around extremely high bend, and the small cross-section allows too fit inside small piping and through small opening. Design is basically a process or mechanisms to generate new thing or to modify our environment. If our environment as our context at different levels and in different scales. The industrial design has been greatly influenced by nature. The 'Industrial' aspect of Industrial design has a 'strong link with engineering design and technology. Today fields of research such as bio mechanics, 'bio-engineering','bionics' ,'robotics' and 'biomimetic' are widely explored which are originated during the mid-twentieth century.
Figure 4. bio-inspired design of organisms. Figure 6. humanoid robots industrial application.
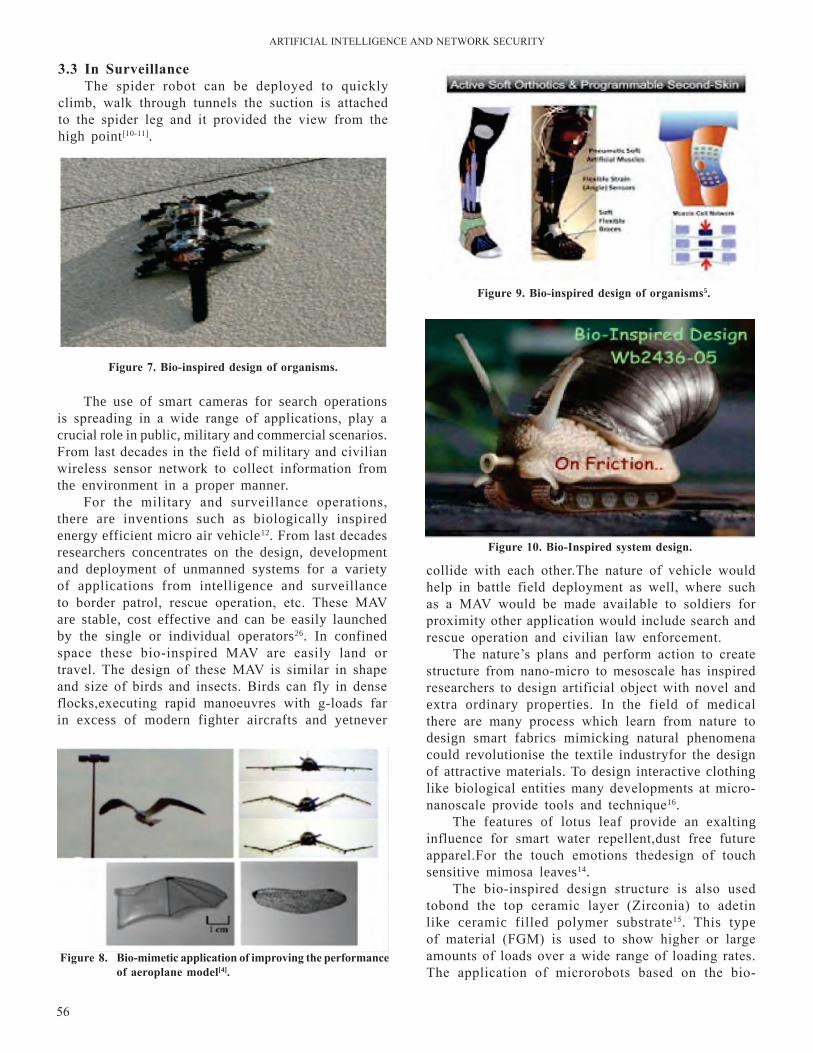
ArTIFICIAl InTEllIGEnCE AnD nETWOrK SECurITY
56
3.3 in surveillanceThe spider robot can be deployed to quickly
climb, walk through tunnels the suction is attached to the spider leg and it provided the view from the high point[10-11].
Figure 7. bio-inspired design of organisms.
Figure 9. bio-inspired design of organisms5.
The use of smart cameras for search operations is spreading in a wide range of applications, play a crucial role in public, military and commercial scenarios.From last decades in the field of military and civilian wireless sensor network to collect information from the environment in a proper manner.
For the military and surveillance operations, there are inventions such as biologically inspired energy efficient micro air vehicle12. From last decades researchers concentrates on the design, development and deployment of unmanned systems for a variety of applications from intelligence and surveillance to border patrol, rescue operation, etc. These MAV are stable, cost effective and can be easily launched by the single or individual operators26. In confined space these bio-inspired MAV are easily land or travel. The design of these MAV is similar in shape and size of birds and insects. Birds can fly in dense flocks,executing rapid manoeuvres with g-loads far in excess of modern fighter aircrafts and yetnever
collide with each other.The nature of vehicle would help in battle field deployment as well, where such as a MAV would be made available to soldiers for proximity other application would include search and rescue operation and civilian law enforcement.
The nature’s plans and perform action to create structure from nano-micro to mesoscale has inspired researchers to design artificial object with novel and extra ordinary properties. In the field of medical there are many process which learn from nature to design smart fabrics mimicking natural phenomena could revolutionise the textile industryfor the design of attractive materials. To design interactive clothing like biological entities many developments at micro-nanoscale provide tools and technique16.
The features of lotus leaf provide an exalting influence for smart water repellent,dust free future apparel.For the touch emotions thedesign of touch sensitive mimosa leaves14.
The bio-inspired design structure is also used tobond the top ceramic layer (Zirconia) to adetin like ceramic filled polymer substrate15. This type of material (FGM) is used to show higher or large amounts of loads over a wide range of loading rates.The application of microrobots based on the bio-
Figure 8. bio-mimetic application of improving the performance of aeroplane model[4].
Figure 10. bio-inspired system design.
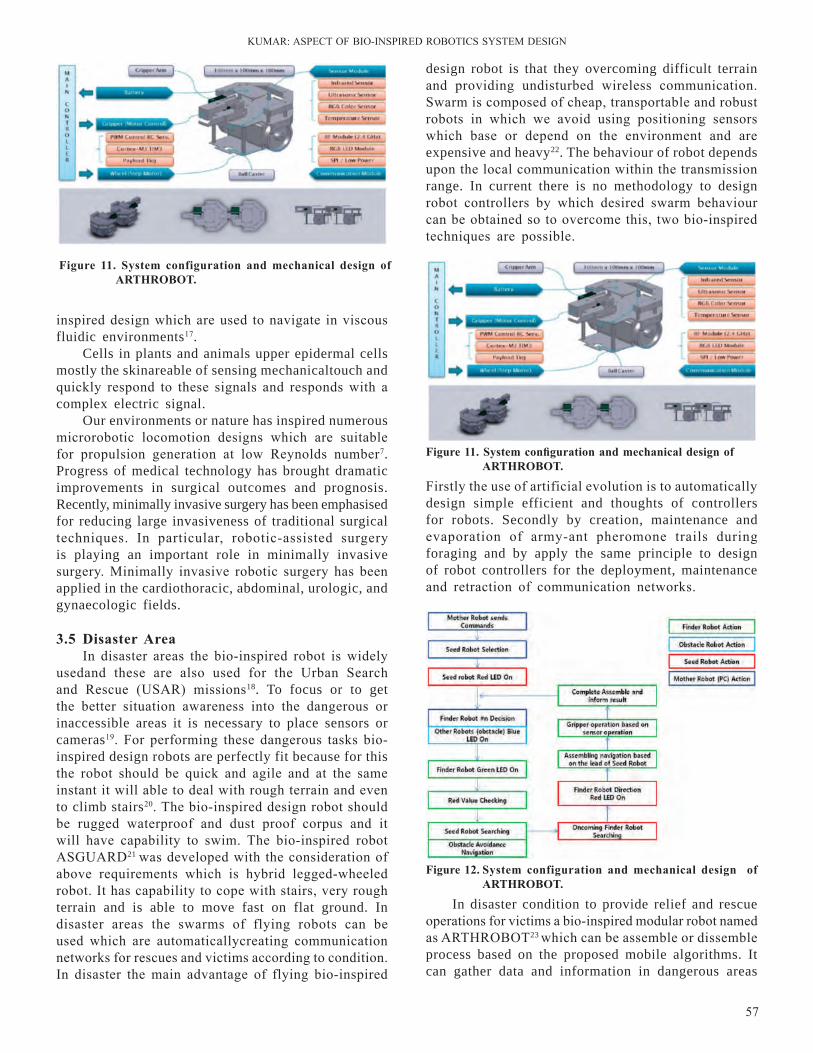
KuMAr: ASPECT OF BIO-InSPIrED rOBOTICS SYSTEM DESIGn
57
design robot is that they overcoming difficult terrain and providing undisturbed wireless communication. Swarm is composed of cheap, transportable and robust robots in which we avoid using positioning sensors which base or depend on the environment and are expensive and heavy22. The behaviour of robot depends upon the local communication within the transmission range. In current there is no methodology to design robot controllers by which desired swarm behaviour can be obtained so to overcome this, two bio-inspired techniques are possible.
Figure 11. system configuration and mechanical design of Arthrobot.
Firstly the use of artificial evolution is to automatically design simple efficient and thoughts of controllers for robots. Secondly by creation, maintenance and evaporation of army-ant pheromone trails during foraging and by apply the same principle to design of robot controllers for the deployment, maintenance and retraction of communication networks.
Figure 12. system configuration and mechanical design of Arthrobot.
In disaster condition to provide relief and rescue operations for victims a bio-inspired modular robot named as ArTHrOBOT23 which can be assemble or dissemble process based on the proposed mobile algorithms. It can gather data and information in dangerous areas
inspired design which are used to navigate in viscous fluidic environments17.
Cells in plants and animals upper epidermal cells mostly the skinareable of sensing mechanicaltouch and quickly respond to these signals and responds with a complex electric signal.
Our environments or nature has inspired numerous microrobotic locomotion designs which are suitable for propulsion generation at low reynolds number7. Progress of medical technology has brought dramatic improvements in surgical outcomes and prognosis. Recently, minimally invasive surgery has been emphasised for reducing large invasiveness of traditional surgical techniques. In particular, robotic-assisted surgery is playing an important role in minimally invasive surgery. Minimally invasive robotic surgery has been applied in the cardiothoracic, abdominal, urologic, and gynaecologic fields.
3.5 disaster AreaIn disaster areas the bio-inspired robot is widely
usedand these are also used for the urban Search and rescue (uSAr) missions18. To focus or to get the better situation awareness into the dangerous or inaccessible areas it is necessary to place sensors or cameras19. For performing these dangerous tasks bio-inspired design robots are perfectly fit because for this the robot should be quick and agile and at the same instant it will able to deal with rough terrain and even to climb stairs20. The bio-inspired design robot should be rugged waterproof and dust proof corpus and it will have capability to swim. The bio-inspired robot ASGuArD21 was developed with the consideration of above requirements which is hybrid legged-wheeled robot. It has capability to cope with stairs, very rough terrain and is able to move fast on flat ground. In disaster areas the swarms of flying robots can be used which are automaticallycreating communication networks for rescues and victims according to condition. In disaster the main advantage of flying bio-inspired
Figure 11. system configuration and mechanical design of Arthrobot.
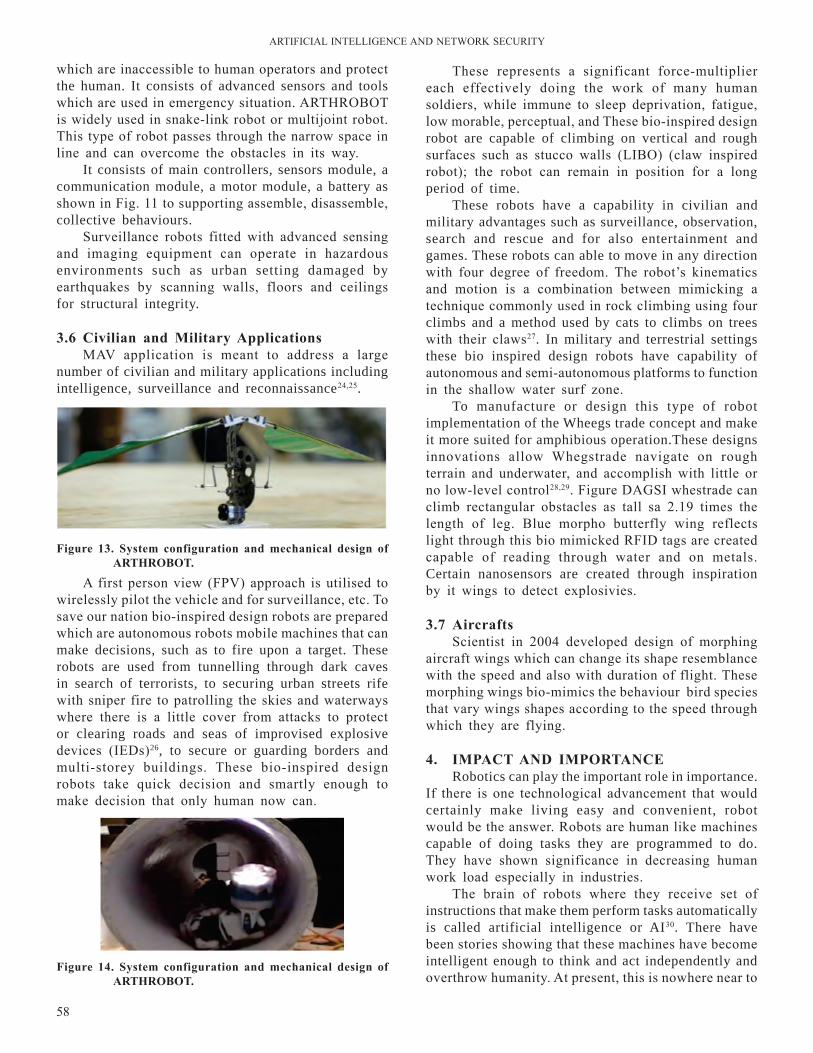
ArTIFICIAl InTEllIGEnCE AnD nETWOrK SECurITY
58
which are inaccessible to human operators and protect the human. It consists of advanced sensors and tools which are used in emergency situation. ArTHrOBOT is widely used in snake-link robot or multijoint robot. This type of robot passes through the narrow space in line and can overcome the obstacles in its way.
It consists of main controllers, sensors module, a communication module, a motor module, a battery as shown in Fig. 11 to supporting assemble, disassemble, collective behaviours.
Surveillance robots fitted with advanced sensing and imaging equipment can operate in hazardous environments such as urban setting damaged by earthquakes by scanning walls, floors and ceilings for structural integrity.
3.6 Civilian and Military ApplicationsMAV application is meant to address a large
number of civilian and military applications including intelligence, surveillance and reconnaissance24,25.
Figure 13. system configuration and mechanical design of Arthrobot.
A first person view (FPV) approach is utilised to wirelessly pilot the vehicle and for surveillance, etc. To save our nation bio-inspired design robots are prepared which are autonomous robots mobile machines that can make decisions, such as to fire upon a target. These robots are used from tunnelling through dark caves in search of terrorists, to securing urban streets rife with sniper fire to patrolling the skies and waterways where there is a little cover from attacks to protect or clearing roads and seas of improvised explosive devices (IEDs)26, to secure or guarding borders and multi-storey buildings. These bio-inspired design robots take quick decision and smartly enough to make decision that only human now can.
Figure 14. system configuration and mechanical design of Arthrobot.
These represents a significant force-multiplier each effectively doing the work of many human soldiers, while immune to sleep deprivation, fatigue, low morable, perceptual, and These bio-inspired design robot are capable of climbing on vertical and rough surfaces such as stucco walls (lIBO) (claw inspired robot); the robot can remain in position for a long period of time.
These robots have a capability in civilian and military advantages such as surveillance, observation, search and rescue and for also entertainment and games. These robots can able to move in any direction with four degree of freedom. The robot’s kinematics and motion is a combination between mimicking a technique commonly used in rock climbing using four climbs and a method used by cats to climbs on trees with their claws27. In military and terrestrial settings these bio inspired design robots have capability of autonomous and semi-autonomous platforms to function in the shallow water surf zone.
To manufacture or design this type of robot implementation of the Wheegs trade concept and make it more suited for amphibious operation.These designs innovations allow Whegstrade navigate on rough terrain and underwater, and accomplish with little or no low-level control28,29. Figure DAGSI whestrade can climb rectangular obstacles as tall sa 2.19 times the length of leg. Blue morpho butterfly wing reflects light through this bio mimicked rFID tags are created capable of reading through water and on metals. Certain nanosensors are created through inspiration by it wings to detect explosivies.
3.7 AircraftsScientist in 2004 developed design of morphing
aircraft wings which can change its shape resemblance with the speed and also with duration of flight. These morphing wings bio-mimics the behaviour bird species that vary wings shapes according to the speed through which they are flying.
4. iMPACt And iMPortAnCERobotics can play the important role in importance.
If there is one technological advancement that would certainly make living easy and convenient, robot would be the answer. robots are human like machines capable of doing tasks they are programmed to do. They have shown significance in decreasing human work load especially in industries.
The brain of robots where they receive set of instructions that make them perform tasks automatically is called artificial intelligence or AI30. There have been stories showing that these machines have become intelligent enough to think and act independently and overthrow humanity. At present, this is nowhere near to
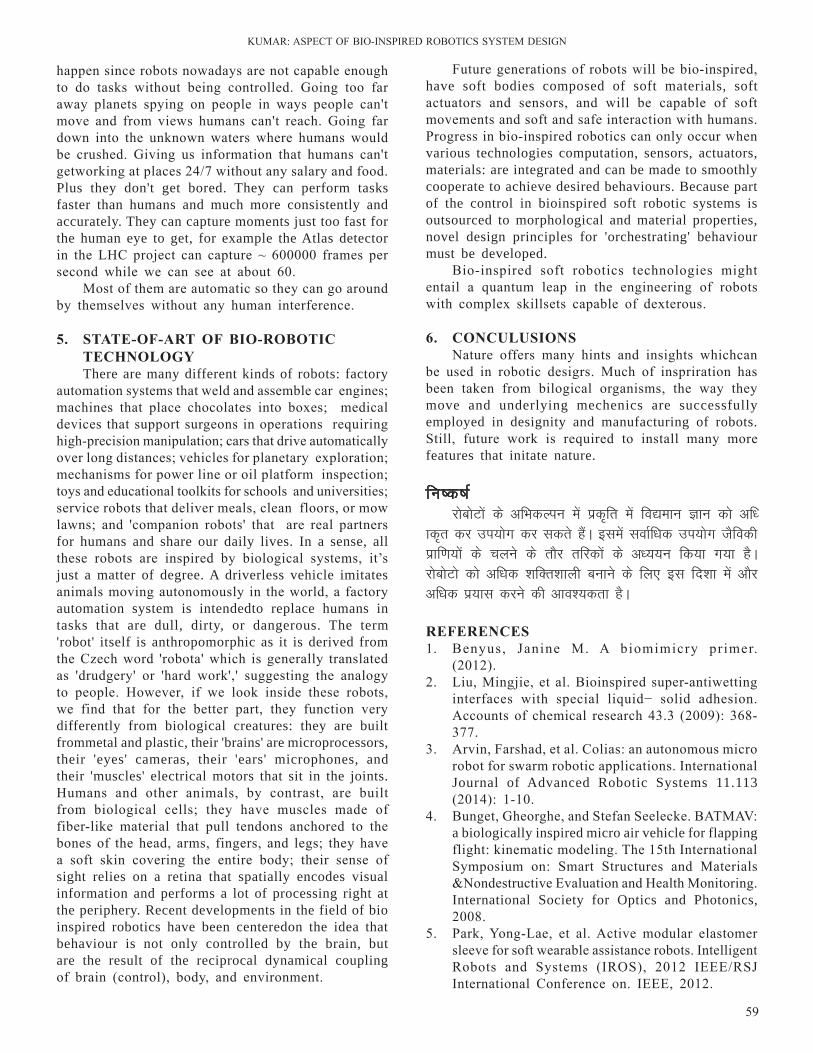
KuMAr: ASPECT OF BIO-InSPIrED rOBOTICS SYSTEM DESIGn
59
happen since robots nowadays are not capable enough to do tasks without being controlled. Going too far away planets spying on people in ways people can't move and from views humans can't reach. Going far down into the unknown waters where humans would be crushed. Giving us information that humans can't getworking at places 24/7 without any salary and food. Plus they don't get bored. They can perform tasks faster than humans and much more consistently and accurately. They can capture moments just too fast for the human eye to get, for example the Atlas detector in the lHC project can capture ~ 600000 frames per second while we can see at about 60.
Most of them are automatic so they can go around by themselves without any human interference.
5. stAtE-oF-Art oF bio-robotiC tEChnoloGYThere are many different kinds of robots: factory
automation systems that weld and assemble car engines; machines that place chocolates into boxes; medical devices that support surgeons in operations requiring high-precision manipulation; cars that drive automatically over long distances; vehicles for planetary exploration; mechanisms for power line or oil platform inspection; toys and educational toolkits for schools and universities; service robots that deliver meals, clean floors, or mow lawns; and 'companion robots' that are real partners for humans and share our daily lives. In a sense, all these robots are inspired by biological systems, it’s just a matter of degree. A driverless vehicle imitates animals moving autonomously in the world, a factory automation system is intendedto replace humans in tasks that are dull, dirty, or dangerous. The term 'robot' itself is anthropomorphic as it is derived from the Czech word 'robota' which is generally translated as 'drudgery' or 'hard work',' suggesting the analogy to people. However, if we look inside these robots, we find that for the better part, they function very differently from biological creatures: they are built frommetal and plastic, their 'brains' are microprocessors, their 'eyes' cameras, their 'ears' microphones, and their 'muscles' electrical motors that sit in the joints. Humans and other animals, by contrast, are built from biological cells; they have muscles made of fiber-like material that pull tendons anchored to the bones of the head, arms, fingers, and legs; they have a soft skin covering the entire body; their sense of sight relies on a retina that spatially encodes visual information and performs a lot of processing right at the periphery. Recent developments in the field of bio inspired robotics have been centeredon the idea that behaviour is not only controlled by the brain, but are the result of the reciprocal dynamical coupling of brain (control), body, and environment.
Future generations of robots will be bio-inspired, have soft bodies composed of soft materials, soft actuators and sensors, and will be capable of soft movements and soft and safe interaction with humans.Progress in bio-inspired robotics can only occur when various technologies computation, sensors, actuators, materials: are integrated and can be made to smoothly cooperate to achieve desired behaviours. Because part of the control in bioinspired soft robotic systems is outsourced to morphological and material properties, novel design principles for 'orchestrating' behaviour must be developed.
Bio-inspired soft robotics technologies might entail a quantum leap in the engineering of robots with complex skillsets capable of dexterous.
6. ConCUlUsionsnature offers many hints and insights whichcan
be used in robotic desigrs. Much of inspriration has been taken from bilogical organisms, the way they move and underlying mechenics are successfully employed in designity and manufacturing of robots. Still, future work is required to install many more features that initate nature.
fu’d’k ZjkscksVksa ds vfHkdYiu esa izd`fr esa fo|eku Kku dks vf/
kd`r dj mi;ksx dj ldrs gSaA blesa lokZf/kd mi;ksx tSfodh izkf.k;ksa ds pyus ds rkSj rfjdksa ds v/;;u fd;k x;k gSA jkscksVks dks vf/kd 'kfDr'kkyh cukus ds fy, bl fn'kk esa vkSj vf/kd iz;kl djus dh vko';drk gSA
rEFErEnCEs1. Benyus, Janine M. A biomimicry primer.
(2012).2. liu, Mingjie, et al. Bioinspired super-antiwetting
interfaces with special liquid− solid adhesion. Accounts of chemical research 43.3 (2009): 368-377.
3. Arvin, Farshad, et al. Colias: an autonomous micro robot for swarm robotic applications. International Journal of Advanced Robotic Systems 11.113 (2014): 1-10.
4. Bunget, Gheorghe, and Stefan Seelecke. BATMAV: a biologically inspired micro air vehicle for flapping flight: kinematic modeling. The 15th International Symposium on: Smart Structures and Materials &nondestructive Evaluation and Health Monitoring. International Society for Optics and Photonics, 2008.
5. Park, Yong-lae, et al. Active modular elastomer sleeve for soft wearable assistance robots. Intelligent robots and Systems (IrOS), 2012 IEEE/rSJ International Conference on. IEEE, 2012.
ArTIFICIAl InTEllIGEnCE AnD nETWOrK SECurITY
60
6. Yang, Heemin Y., and rahul Sarpeshkar. A bio-inspired ultra-energy-efficient analog-to-digital converter for biomedical applications. Circuits and Systems I: Regular Papers, IEEE Transactions on 53.11 (2006): 2349-2356.
7. Peyer, Kathrin E., li Zhang, and Bradley J. nelson. Bio-inspired magnetic swimming microrobots for biomedical applications. nanoscale 5.4 (2013): 1259-1272.
8. Kopman, Vladislav, et al. Closed-loop control of zebrafish response using a bioinspired robotic-fish in a preference test. Journal of the Royal Society Interface 10.78 (2013): 20120540.
9. lepora, nathan F., Paul Verschure, and Tony J. Prescott. The state of the art in biomimetics. Bioinspiration&biomimetics 8.1 (2013): 013001.
10. neubauer, Werner. A spider-like robot that climbs vertically in ducts or pipes.Intelligent Robots and Systems' 94.'Advanced robotic Systems and the real World', IrOS'94. Proceedings of the IEEE/rSJ/GI International Conference on. Vol. 2. IEEE, 1994.
11. Xiao, Jizhong, et al. Design of mobile robots with wall climbing capability.Advanced Intelligent Mechatronics. Proceedings, 2005 IEEE/ASME International Conference on. IEEE, 2005.
12. Davis, William r., et al. Micro air vehicles for optical surveillance. lincoln laboratory Journal 9.2 (1996): 197-214.
13. Dario, Paolo, Eugenio Guglielmelli, and Benedetto Allotta. Robotics in medicine. Intelligent Robots and Systems' 94.'Advanced robotic Systems and the real World', IrOS'94. Proceedings of the IEEE/rSJ/GI International Conference on. Vol. 2. IEEE, 1994.
14. Singh, Ajay V., et al. Bio-inspired approaches to design smart fabrics.Materials& Design 36 (2012): 829-839.
15. niu, Xinrui, et al. Bio-inspired design of dental multilayers: Experiments and model. Journal of the mechanical behavior of biomedical materials 2.6 (2009): 596-602.
16. Singh, Ajay V., et al. Bio-inspired approaches to design smart fabrics.Materials& Design 36 (2012): 829-839.
17. Peyer, Kathrin E., li Zhang, and Bradley J. nelson. Bio-inspired magnetic swimming microrobots for biomedical applications. nanoscale 5.4 (2013): 1259-1272.
18. Onosato, Masahiko, et al. Aerial robots for quick information gathering in uSAr. SICE-ICASE, 2006. International Joint Conference. IEEE, 2006.
19. rao, Jinjun, et al. robotic small unmanned aerial vehicle system for disaster information gathering.
International Journal of Advanced Mechatronic Systems 2.1 (2010): 81-89.
20. Bourbakis, n., and I. Papadakis-Ktistakis. Design ground bio-inspired micro-robot structures for detecting humans in disasterus regions. Aerospace and Electronics Conference (nAECOn), Proceedings of the 2011 IEEE national. IEEE, 2011.
21. Eich, Markus, Felix Grimminger, and Frank Kirchner. A versatile stair-climbing robot for search and rescue applications. Safety, Security and Rescue robotics, 2008. SSrr 2008. IEEE International Workshop on. IEEE, 2008.
22. Hauert, Sabine, et al. Communication-based swarming for flying robots.International Workshop on Self-Organized Systems. no. lIS-POSTEr-2010-001. 2010.
23. Son, Byungrak, et al. A bio-inspired modular robot for mutual position detection based on relative motion recognition. International Journal of Hybrid Information Technology 5.2 (2012): 103-108.
24. Watts, Adam C., Vincent G. Ambrosia, and Everett A. Hinkley. unmanned aircraft systems in remote sensing and scientific research: Classification and considerations of use. remote Sensing 4.6 (2012): 1671-1692.
25. Gupta, Suraj G., Mangesh M. Ghonge, and P. M. Jawandhiya. review of unmanned aircraft system (uAS). technology 2.4 (2013).
26. Khan, Zaeem A., and Sunil K. Agrawal. Study of biologically inspired flapping mechanism for micro air vehicles. AIAA journal 49.7 (2011): 1354-1365.
27. Sintov, Avishai, TomerAvramovich, and Amir Shapiro. Design and motion planning of an autonomous climbing robot with claws. robotics and Autonomous Systems 59.11 (2011): 1008-1019.
28. Boxerbaum, Alexander S., et al. Design of an autonomous amphibious robot for surf zone operation: Part I mechanical design for multi-mode mobility.Advanced Intelligent Mechatronics. Proceedings, 2005 IEEE/ASME International Conference on. IEEE, 2005.
29. Harkins, richard, et al. Design of an autonomous amphibious robot for surf zone operations: part II-hardware, control implementation and simulation.Advanced Intelligent Mechatronics. Proceedings, 2005 IEEE/ASME International Conference on. IEEE, 2005.
30. Arkin, ronald C. Behavior-based robotics. MIT press, 1998.
31. Bar-Cohen, Yoseph, and Cynthia l. Breazeal, eds. Biologically inspired intelligent robots. Vol. 122. Spie Press, 2003.
fu¶Vh&50 dk rduhdh fo”ys’k.k % chih,Q,Q,u vkSj ,u,vkj,Dl ds chp rqyuk technical Analysis of niFtY-50 : A Comparision between bPFFn and nArx
Aviral Sharma*, Monit Kapoor, and Vipul SharmaCollege of Information Technology, University of Petroleum and Energy Studies, Dehradun, India
*E-mail:[email protected]
lkjka”k
le; Ja`[kyk le; ij nh x;h fVIif.k;ksa dk ,d vkns”k lsV gSA le; J`a[kyk fo”ys’k.k dk HkkSfrd foKku] lkekftd foKku vkSj vFkZ”kkL= vkfn tSls dbZ {ks=ksa esa egŸoiw.kZ LFkku gSA le; Ja`[kyk ls gesa ,sls dbZ {ks=ksa esa enn feyrh gS tgka fiNys MkVk dk fo”ys’k.k fd;k tk lds vkSj Hkkoh ifj.kkeksa ds ckjs esa Hkfo’;ok.kh dh tk ldrh gSA bu fnuksa izca/kdksa dks cktkj ds vkdkj dh Hkkoh ifj;kstukvksa ds fy, ,d jkLrk vkSj fodkl dh vk”kkoknh njksa dks [kkstus ds fy, dBksj ifjJe djuk iM+ jgk gSA Bhd blh izdkj yksx “ks;jcktkj esa dEifu;ksa ds “ks;jksa dh Hkfo’;kok.kh tkuus ds fy, ,d jkLrk [kkstus ds fy, dksf”k”k dj jgs gS rkfd mudk ykHk iksVZiksfy;k ij igaqp tk,A vkadM+ksa esa dqN ,sls rjhds gSa tks fiNys MkVk dks fo”ys’k.k dj nsrs gaS vkSj ml ij vk/kkfjr vkmViqV ns nsrs gSaA ;s dEiuh ds _.k dk foŸkh; fo”ys’k.k vkSj LVkWd dk rduhdh fo”ys’k.k gSA MkVk vkSj iwokZuqeku ds fo”ys’k.k djus dk ,d u;k rjhdk —f=e raf=dk usVodZ ds :i esa tkuk tkrk gSA blls dEiuh ds fiNys MkVk dk fo”ys’k.k fd;k tkrk gS vkSj mlh ds vk/kkj ij Hkfo’; ds ewY;ksa dk iwokZuqeku fd;k tk ldrk gSA muesa MkVk dks Li’V fd;s fcuk gh varfuZfgr tfVyrkvksa dks le>us dh {kerk gSA raf=dk usVodZ dk ;g xq.k fiNys ewY;ksa ls lh[krs gq, le; Ja`[kyk ds O;ogkj dh Hkfo’;ok.kh esa enn djrk gSA
AbstrAct
Time series is an ordered set of observations in time. Time series analysis is important in many fields of physical science, social science, economics, etc.. The time series help us to in many fields where past data can be analyzed and prediction about future outcome be found. These days managers are striving hard to find a way to project the future of market size, expected growth rates, etc. Similarly in stock market people are trying to find a way to make predictions about shares of company so that their profit portfolio will go up. There are some methods in statistics which analyze the past data and give output based on it. These are financial analysis of a company’s health and technical analysis of a stock. A new way of analyzing the data and forecasting is known as artificial neural networks. They analyze the past data and can forecast the future value according to it. They have the capacity that they can understand the underlying complexity without be explicitly given to them. This property of neural network helps in forecasting the behavior of time series by learning from the past values.
Keywords: Artificial neural networks, financial markets, forecasting, technical analysis, nIFTY, data mining
Bilingual International Conference on Information Technology: Yesterday, Today, and Tomorrow, 19-21 February 2015, pp. 61-66© DESIDOC, 2015
1. IntroductIonFinancial Markets are places where trading of
financial securities, commodities, etc. take place. This trading of securities in these market reflect various concepts of economy like demand and supply, investor sentiment in the economy, etc. Securities include things like shares, stocks, etc., and commodity market comprises of bullions, agricultural products, etc. The financial markets for these transactions are either general in nature, i.e., where securities and commodities both are traded or specialized in nature
where only either securities (shares or bonds, etc.) or for commodity (like a bullion market). Markets help the players in the following :• Raising capital• Risk transfer• Discovery of price• liquidity transaction• International trade, etc.
In financial markets, the data is available in the form of time series. Time series data is a special for of data in the values are spaced over a regular interval
ArTIFICIAl InTEllIGEnCE AnD nETWOrK SECurITY
62
3.3 weak Efficient hypothesisIt assets that the informational which is publically
available is reflected in the share prices.Apart from the theoretical considerations, we
also have a number of Statistical techniques which are used in economics to forecast the share prices. There are two main approaches towards forecasting in standard economics literature:1. Financial analysis2. Technical analysis
Financial analysis is used in long term forecasting of the market. In financial analysis, we analyze the security into consideration for long stability, growth, return on investment, etc. over a horizon of years. This helps one to find the potential growth of a commodity over time and growth of his/her investment. It is even used for analyzing business, projects, etc. as well. If the analysis for investment has to be company specific, then the points taken into consideration are the things like income statement, cash flow statement, balance statement, etc.
Technical analysis which is for short term forecasting is highly dependent upon the moment oscillators of the commodity/security into consideration. In Technical analysis the previous trends of a graph is analyzed to find the potential movement of the thing into consideration. This trend analysis is based upon few parameters like the movement, Relative strength index, stochastic, etc.
A new tool inspired from human intelligence, has come up which is known as artificial neural network. This tools learns the underlying complexity in the data being supplied to it. This gives an added advantage to the analysis of time series which formulated because of actions of many people which are governed by different aspects like sentiments, beliefs, monetary policy, federal policy, interactions among parties into consideration, etc. Because of this capacity to learn the underlying complexity of data the artificial neural networks are coming up as very powerful statistical tool for modeling such type of series. Artificial neural network have many properties which make it highly suited for analyzing a financial time series which are:
Artificial neural networks are capable of analyzing non-linear data and the price is in itself a highly complex non-linear data4,5.
Artificial neural networks have the capacity to act as a universal approximators for different functions. now, the functional behavior of financial markets itself comprises of many different factors which range from sentiments to demand-and-supply. Thus in a scenario like this artificial neural networks are highly suited6.
of time. In our work, we are analyzing a special form of data which is happens to be a time series but is highly volatile one and is related to share market. The data on stock markets contain may forms of noise into it which may be because of local or global factor1. This noise can be dealt with a number of different techniques like FIr filters, etc.1. This type of time series has following features :• Highly intense data• unstructured data• Degree of uncertainty is very high• Relationships are implicit.
This data is highly complex in nature and needs to analyzed to find meaningful statistical interferences. The standard statistical methods of forecasting the share markets have reached their limits in applications with the nonlinearities in the data set of the markets2,3.Time series forecasting is the use of any model to forecast the value of a commodity based upon past trend of the value of commodity. Time series data is different from other type of data as it consists of natural temporal ordering.
2. thE stoCKs MArKEtsThe forecasting of future for a financial market in
economics has been done since many decades. There are a two main hypothesis about the profitability from the share market. These are:1. random Walk Hypothesis, and2. Efficient market Hypothesis.
The random Walk Hypothesis states that “Stocks follow a random walk and hence, cannot be predicted”. While there are opponents of random Walk of Hypothesis state that this can be done which in return can return in making huge profits.
The Efficient Market Hypothesis States that Markets fully reflect the freely available information and prices are adjusted fully and immediately once the new information comes in the public domain. In other words, it states that the markets informationally efficient. There are 3 variations in this hypothesis being.
2.1 hard Efficient Market hypothesisIt states that information of any form, i.e., public or
private is reflected in the share prices and this reflection of information in the price is instantaneous.
2.2 semi hard hypothesisIt states that the public information which was
in the public domain is historically is reflected in the price and if any new information comes into the domain it is reflected into the share price as soon as the people become aware of it.
SHArMA: TECHnICAl AnAlYSIS OF nIFTY-50 : A COMPArISIOn BETWEEn BPFFn AnD nArX
63
Mathematically:Step 1: we 1st need to calculate the simple moving
average for the specified period:MA = (p1 +p2 + …..+pn)/nStep 2: now to calculate the moving average
for the day into consideration we use the following formulas:
MAt= MAt-1 –Pm-n/n + Pm/nThus, our moving averages which are for 50, 100
and 200 days are represented as :-Case 1: MA50M A 5 0 = ( p 1 + p 2 + … . . + p 5 0) / 5 0 a n d
subsequentlyMA50 = MAprevious–Pm-n/50 + Pm/50Case 2: MA100MA100 = (p1 +p2 + …..+p100)/100MA100 =MAprevious–Pm-n/100 + Pm/100Case 3: MA200MA200 =(p1 +p2 + …..+p200)/200MA200 =MAprevious–Pm-n/200 + Pm/200Where MA = moving averagesPt= closing price for that dayn = no of days the average is soughtm = is the day at which the average is sought
3.3 relative strength index It was designed to show the current and historical
strength or weakness of a share based on the closing prices of a recent trading period. It also shows the buying and selling conditions of the stock. Mostly, it is calculated for a period of 14 days.
Calculation:Step 1: Start by calculating the simple moving
average for a period offirst14 days, only once as this is used in exponentially moving average.
Step 2: Calculate the exponentially moving average (EMA) form now. For the 1st step in this EMt-1 is replaceable by MA14.
EMA=αPt+(1–α) EMAt–1Where α =2/(v+1)Step 3: Calculate the relative strength rS = EMA(u,14)/EMA(D,14)Where u is positive momentum changes, D is negative momentum changes.Step 4: Calculate the relative strength index,
RSI rSI = 100-100/(1+rS).Importance of rSI: relative strength index always
lie between 0 to 100. Its value indicates the criterion of cases like overbought and oversold. If its value falls below 30 it shows that the stock is oversold and its value indicates the degree of selling in this case. If its value is above 70, it indicates that the stock is overbought. These indicators are important in decision making in the share markets as one of the most important points in share market is the time in and time out.
Artificial neural networks have the capacity to generalize the pattern which is supplied to it. Technical analysis is based upon the assumption that share price movement must form some pattern which can be exploited to make money6.
Artificial neural networks are used in isolation or with combination to other artificial intelligence techniques like the genetic algorithms to produce more efficient results7,8.
2.1 niFtYnifty is the national Stock Exchange of India’s
benchmark index for the Indian equity market. It is also known as nIFTY-50 or CnX nIFTY. India Index Services and Products limited owns and managed nIFTY. nIFTY is an index value reflecting shares of 50 different companies dealing in 22 different sectors of Indian Economy. It is a free float market capitalization weighted index and was initially calculated on full market capitalization methodology. From 26 June 2009, the computation was changed to free float methodology. The base period for the CnX nifty index is november 3, 1995, which marked the completion of one year of operations of national Stock Exchital Market Segment. The base value of the index has been set at 1000, and a base capital of rs 2.06 trillion. The developers of CnX nifty Index are Ajay Shah and Susan Thomas.
3. tEChniCAl AnAlYsisTechnical analysis of a share for short term
forecasting is completely dependent upon the analysis of the curve of the stock under consideration. Technical analysis has a number of parameters which depict the curve movement. The one selected for our study are as follow:
3.1 Momentum of share,M It is the difference between current closing price
and the closing price n days ago.Mathematically: M = Ct – Ct-n Where Ct is the closing price for the day under
considerationand Ct-n is the closing price n days ago.
3.2 simple Moving Averages (MA)It is calculation of different data points to make
series of averages over different subsets of same series. It shows the un-weight average over different time intervals. Our data set in total was from 1995 to 2013 comprising of roughly 4500 daily values. Thus, owing this huge data set we selected the moving average for 50 days, 100 days and 200 days. It indicates the support in raising markets and resistance in falling markets.

ArTIFICIAl InTEllIGEnCE AnD nETWOrK SECurITY
64
target value supplied to the system was the closing price of next day for the period of which the data was available. The data available to us had quite huge political noise in it as the country saw a number of changes in its political and economical environment after liberalization of the market economy in 1991. Table 1 shows the data usage of date wise usage of data and its supply to the system.
4.1.1 NARXIt stands for non-linear auto-regression exogenous
model. In time series modeling, it refers to a nonlinear autoregressive system which has some parameters coming in it from outside the system and effecting it. This means that the model relates the present value of interest in a time series with the following:
previous values of the same series; and present and previous values of the external series — that is, of the externally determined series that influences the series of interest.
Mathematicallyyt = F (yt-1, yt-2, yt-3… … …, ut, ut-1, ut-2, ut-3, … ….., ) + et
where y is the variable of interest, u is the external variable and e is the error term.
4.1.2 BPFFNIt stands for back-propagation feed forward neural
network. It is a type of artificial neural network where there is no cycle formation between the connections and information only flows in one direction.
3.4 stochastic The term stochastic depicts to the placement of a
present price in relation to its price range over a time period. This indicator tries to forecast price turning points by comparing the closing price of a security to its price range.
Mathematically:%K = 100*(C-l5)/(H5-l5)%D = 100*H3/l3Where %k is the stochastic C is the current closing pricel5 is the lowest low of past 5 daysH5 is the highest high of past 5 daysH3 is the highest high of past 3 days.l3 is the lowest low of past 3 days.Importance: Stochastic oscillator is an highly
sensitive oscillator. It shows a reversal of trend before it actually happens.
3.5 rate of Change
It shows the relative change of the stock over time.
Mathematically: rate of Change, roC = (Ct –Ct-n)/Ct-nWhere Ct is present closing priceCt-n is the closing price n (n= 100) days age.
4. ExPEriMEntAl sEtUP4.1 data
The data was taken from the nSE website directly which comprised of the opening price, closing price, High, low, number of shares traded and total turnover for each day. The data consisted of roughly 4000 value with start date being 29-Oct-1997 and last date being 30-Aug-2013. The daily data was taken and used as the input and target values in the neural networks. The input parameters were current closing price, closing price on yesterday, momentum of change, Moving averages for 50 days, 100 days and 200 days, relative strength index, stochastics and rate of change. The
Purpose days start date End date start value End Value
Training 2769 (70% of total data) 30-oct-1997 17-nov-2008 1085.25 2799.55
Validation 593(15% of total data) 18-nov-2008 11-Apr-2011 2798.5 5785.7
Testing 593 (15% of total data) 13-Apr-2008 26-Aug-2013 5911.5 5476.5
Purpose Days Start Date End Date Start value End Value
Training 2769 (70% of total data) 30-oct-1997 17-nov-2008 1085.25 2799.55
Validation 593(15% of total data) 18-nov-2008 11-Apr-2011 2798.5 5785.7
Testing 593 (15% of total data) 13-Apr-2008 26-Aug-2013 5911.5 5476.5
Training 2769 (70% of total data) 30-oct-1997 17-nov-2008 1085.25 2799.55
Validation 593(15% of total data) 18-nov-2008 11-Apr-2011 2798.5 5785.7
Testing 593 (15% of total data) 13-Apr-2008 26-Aug-2013 5911.5 5476.5
Figure 1. nArx system.table 1. data usage of system
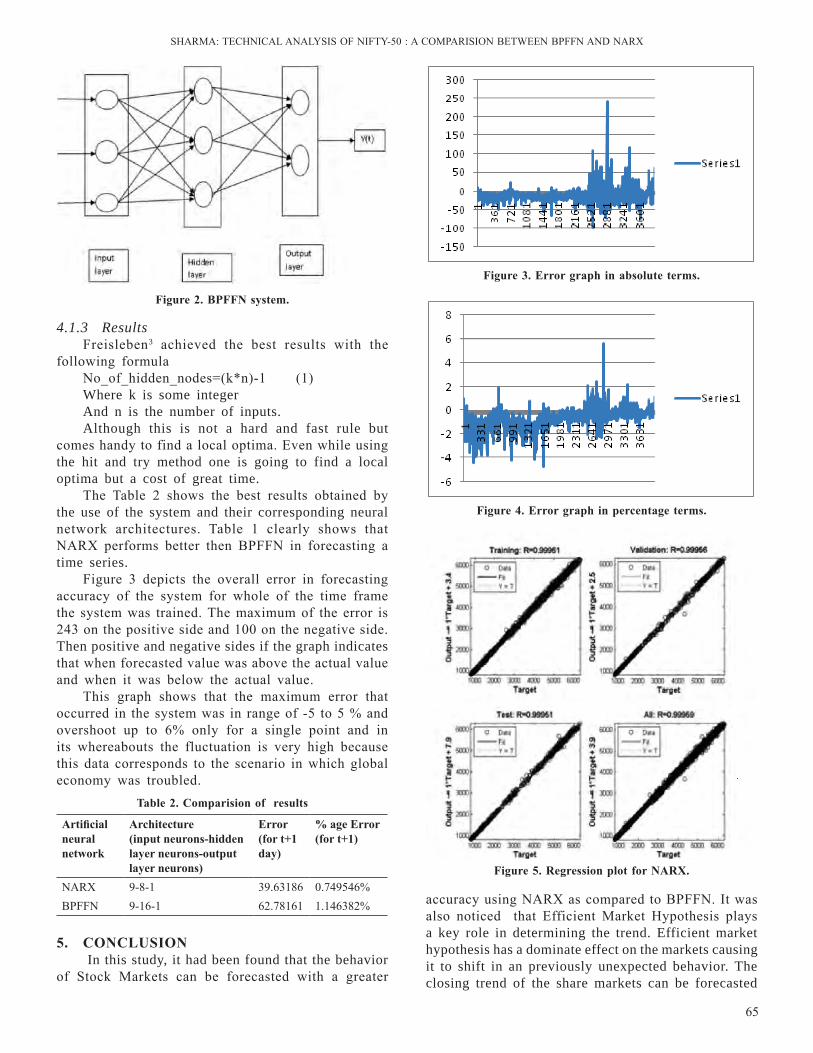
SHArMA: TECHnICAl AnAlYSIS OF nIFTY-50 : A COMPArISIOn BETWEEn BPFFn AnD nArX
65
accuracy using nArX as compared to BPFFn. It was also noticed that Efficient Market Hypothesis plays a key role in determining the trend. Efficient market hypothesis has a dominate effect on the markets causing it to shift in an previously unexpected behavior. The closing trend of the share markets can be forecasted
Figure 2. bPFFn system.
Figure 3. Error graph in absolute terms.
Figure 4. Error graph in percentage terms.
4.1.3 ResultsFreisleben3 achieved the best results with the
following formulano_of_hidden_nodes=(k*n)-1 (1)Where k is some integerAnd n is the number of inputs.Although this is not a hard and fast rule but
comes handy to find a local optima. Even while using the hit and try method one is going to find a local optima but a cost of great time.
The Table 2 shows the best results obtained by the use of the system and their corresponding neural network architectures. Table 1 clearly shows that nArX performs better then BPFFn in forecasting a time series.
Figure 3 depicts the overall error in forecasting accuracy of the system for whole of the time frame the system was trained. The maximum of the error is 243 on the positive side and 100 on the negative side. Then positive and negative sides if the graph indicates that when forecasted value was above the actual value and when it was below the actual value.
This graph shows that the maximum error that occurred in the system was in range of -5 to 5 % and overshoot up to 6% only for a single point and in its whereabouts the fluctuation is very high because this data corresponds to the scenario in which global economy was troubled.
Artificial neural network
Architecture(input neurons-hidden layer neurons-output layer neurons)
Error (for t+1 day)
% age Error (for t+1)
nArX 9-8-1 39.63186 0.749546%BPFFn 9-16-1 62.78161 1.146382%
table 2. Comparision of results
Figure 5. regression plot for nArx.
5. ConClUsion In this study, it had been found that the behavior
of Stock Markets can be forecasted with a greater
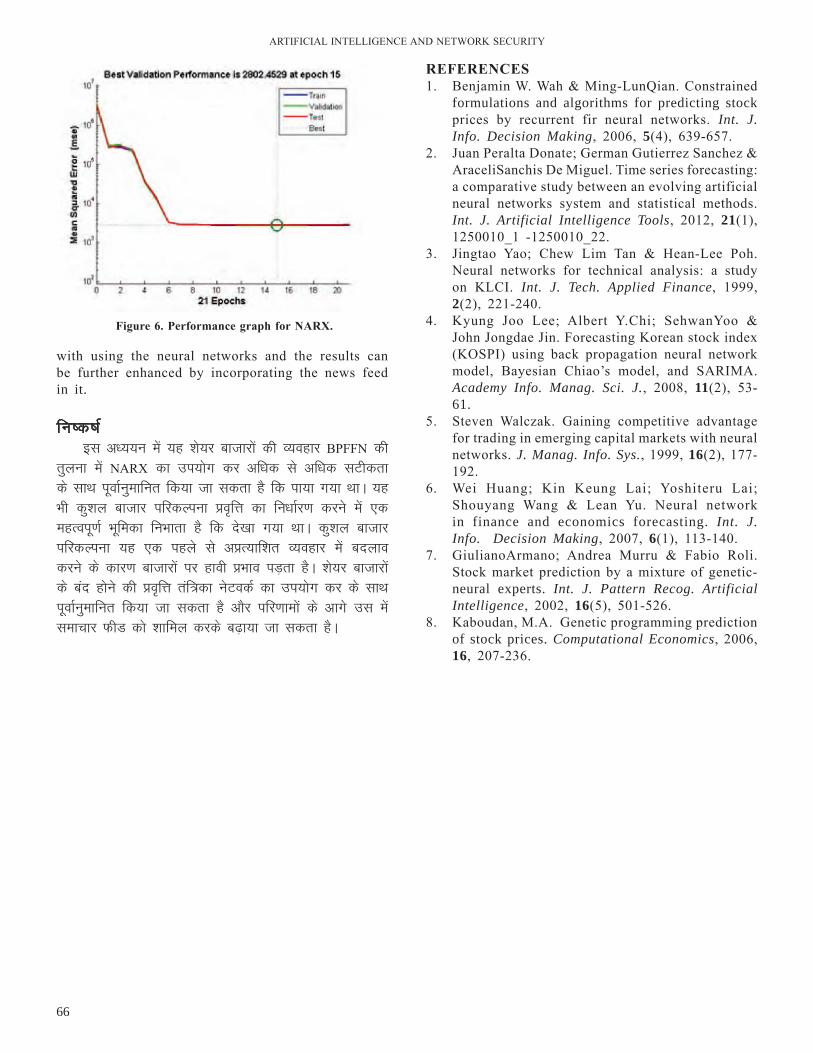
ArTIFICIAl InTEllIGEnCE AnD nETWOrK SECurITY
66
with using the neural networks and the results can be further enhanced by incorporating the news feed in it.
fu’d’k Zbl v/;;u esa ;g “ks;j cktkjksa dh O;ogkj BPFFn dh
rqyuk esa nArX dk mi;ksx dj vf/kd ls vf/kd lVhdrk ds lkFk iwokZuqekfur fd;k tk ldrk gS fd ik;k x;k FkkA ;g Hkh dq”ky cktkj ifjdYiuk ço`fÙk dk fu/kkZj.k djus esa ,d egRoiw.kZ Hkwfedk fuHkkrk gS fd ns[kk x;k FkkA dq”ky cktkj ifjdYiuk ;g ,d igys ls vçR;kf”kr O;ogkj esa cnyko djus ds dkj.k cktkjksa ij gkoh çHkko iM+rk gSA “ks;j cktkjksa ds can gksus dh ço`fÙk raf=dk usVodZ dk mi;ksx dj ds lkFk iwokZuqekfur fd;k tk ldrk gS vkSj ifj.kkeksa ds vkxs ml esa lekpkj QhM dks “kkfey djds c<+k;k tk ldrk gSA
rEFErEnCEs1. Benjamin W. Wah & Ming-lunqian. Constrained
formulations and algorithms for predicting stock prices by recurrent fir neural networks. Int. J. Info. Decision Making, 2006, 5(4), 639-657.
2. Juan Peralta Donate; German Gutierrez Sanchez & AraceliSanchis De Miguel. Time series forecasting: a comparative study between an evolving artificial neural networks system and statistical methods.Int. J. Artificial Intelligence Tools, 2012, 21(1), 1250010_1 -1250010_22.
3. Jingtao Yao; Chew lim Tan & Hean-lee Poh. neural networks for technical analysis: a study on KlCI. Int. J. Tech. Applied Finance, 1999, 2(2), 221-240.
4. Kyung Joo lee; Albert Y.Chi; SehwanYoo & John Jongdae Jin. Forecasting Korean stock index (KOSPI) using back propagation neural network model, Bayesian Chiao’s model, and SArIMA. Academy Info. Manag. Sci. J., 2008, 11(2), 53-61.
5. Steven Walczak. Gaining competitive advantage for trading in emerging capital markets with neural networks. J. Manag. Info. Sys., 1999, 16(2), 177-192.
6. Wei Huang; Kin Keung lai; Yoshiteru lai; Shouyang Wang & lean Yu. neural network in finance and economics forecasting. Int. J. Info. Decision Making, 2007, 6(1), 113-140.
7. GiulianoArmano; Andrea Murru & Fabio roli. Stock market prediction by a mixture of genetic-neural experts. Int. J. Pattern Recog. Artificial Intelligence, 2002, 16(5), 501-526.
8. Kaboudan, M.A. Genetic programming prediction of stock prices. Computational Economics, 2006, 16, 207-236.
Figure 6. Performance graph for nArx.
lans”k izekihdj.k ds fy, nqzrkUos’k.k dk;Z hash Functions for Message Authentication
Richa Arora Ludhiana, India
E-mail: [email protected]
lkjka”k
;g ys[k nqzrkUos’k.k lans”k izek.khdj.k dksM ds ckjs esa crkrk gS tks nzqrkUos’k.k dk;kZsa dk mi;ksx djds lans”k izek.khdj.k ds fy, iz;ksx fd;k tkrk gSA bleas can nzqrkUos’k.k dk;kZsa vkSj fMftVy gLrk{kj ds ckjs esa Hkh ifjppkZ dh tkrh gSA
AbstrAct This paper talks about hash message authentication code which is used for message authentication using Hash functions. It also discusses about keyed-hash functions and digital signatures
Keywords: Hash functions, HMAC, digital signatures
1. IntroductIonMessage authentication deals with processes which
are used to ensure integrity of a message and identity of the sender. When a message is sent over some network, authenticator details, signature and message authentication code (MAC) are also sent along. MAC is an authentication process in which secret key is used to generate cryptographic checksum which is sent along with the message. This cryptographic check sum is known as MAC. In this process a common secret key is shared by both sender and receiver. If a message M is to be sent from Sender Cathy to receiver George using Key K, then MAC will be calculated as MAC=E(K,M).
2. E is thE MAC FUnCtionMessage and MAC will be sent to the receiver.
MAC can be of any size, sometimes hash function is used in place of authentication scheme to fix the size. In order to identify the problem with MAC, timestamp and message sequence number are required. Various methods are used to authenticate the message
Session-Key – Session key is used to authenticate the message. Cathy and George create their session key. The session key is known to both sender and receiver. Session keys are transmitted in encrypted format to prevent the compromise of these keys.
Block Cipher- This is another method which is used for message authentication. Block ciphers treats
the complete block of message as individual unit and creates an encrypted message of length equal to that of the block. This method uses the combination of substitution and transposition techniques. Encryption of the data is repeated multiple times in case of the block ciphers. CFB and CBC modes can be used to send the final block of data and this final block will depend on the previous blocks which are given as input to each advancing stage.
3. E-MAil MEssAGE EnCrYPtion Every e-mail message that a sender sends travels
a large distance before reaching the receiver. It travels through many networks which may be monitored, insecure or making other kinds of passive or interception attacks onto the message. In such a scenario if a message is being sent in plaintext – anyone could read that message, provide he has access to any of these servers.
Pretty Good Privacy (PGP)- a phenomenon developed by Phill Zimmermann. PGP is used for email and file storage apps to provide confidentiality and authentication services.
PGP is comprised of five different services – authentication, confidentiality, compression, email compatibility and segmentation. PGP makes email encryption easy offers strong protection against spying eyes.
Bilingual International Conference on Information Technology: Yesterday, Today, and Tomorrow, 19-21 February 2015, pp. 67-69© DESIDOC, 2015

ArTIFICIAl InTEllIGEnCE AnD nETWOrK SECurITY
68
4. ConFiGUrE PGP in thUndEr birdMozilla’s email program, Thunderbird with the
Enigmail extension is the easiest tool to use. 1. Install the add-on which will integrate into
Thunderbird the ability to use PGP encryption in your mails.
4. now you’ll need to generate your public/private key pair. From the OpenPGP menu item, choose Key Management. From the Generate menu choose new Key Pair.
5. Choose the email address you want to create a key for, and set a passphrase. Hit the “Generate Key” button, and relax - it can take a few minutes.
6. MEssAGE AUthEntiCAtion CodEs hMAC And CbC-MACHash-based message authentication code is created
to calculate a message involving a cryptographic hash function with private key. HMAC-MD% or HMAC-SHA1 have been used for calculating HMAC. Cryptographic strength of the hash function used determines the strength of HMAC.
CBC-MAC: Technique to build message authentication code from block cipher. Cipher block chaining mode creates a chain of blocks in which each block is dependent on the previous block’s encryption.
6.1 Cryptographic hash FunctionsA user transmitting a message would never want
the message to be tampered or analysed in any way. In such scenarios message authentication is a great tool to validate the messages. Hash function can be used for message authentication. MD-5 and SHA-1 are such hash functions. Generally hash functions are sent along with digital signatures. The Major point of consideration here is that hash functions don’t use any key.
Cryptographic hash function is a deterministic procedure – that takes arbitrary blocks of data and returns fixed size data. The data encoded using Hash functions is called the message digest.
6.2 Keyed hash FunctionsA secret key is used along with cryptographic
hash function in case of keyed hash function. The cryptographic key is known only to sender and receiver, which introduces more security features.
6.3 digital signatureDigital signatures are used to ensure authentication.
It is an authentication mechanism that enables the creator of a message to attach a code that acts as a signature. The signature is formed by taking the hash of a message and encrypting the message with the creator’s private key. The signature guarantees the source and integrity of the message7. They are used to ensure that the original content of the message remains unchanged. user is given two different keys-private key and public key. Public key can be known to anyone who needs it but private key lies only with the desired users. Anyone with the public key can
2. Search for enigmail: In the Add-ons window.
3. Out of many add ons available-install Enigma.
4. Click Install button, then restart Thunderbird to apply Add-on configuration.
5. PGP libraries for Windows must be installed.
5. instAllinG GnUPGP1. run the GPGP Installer, GnuPGP will appear
under Program Files directory.2. Once you’ve downloaded Enigmail, in Thunderbird
open Tools -> Options -> Extensions -> Install new Extension, and then choose the Enigmail extension file.
3. When you’ve restarted Thunderbird with Enigmail installed, you will see an OpenPGP menu item. Open it and go to Preferences. There you’ll find a dialog to point to your Gnu PGP binary. Click Browse. It will be installed under Program Files\Gnu\GnuPG\gpg.exe.

ArOrA: HASH FunCTIOnS FOr MESSAGE AuTHEnTICATIOn
69
biblioGrAPhY1. en.wikipedia.org/wiki/Message_authentication_code 2. www.webopedia.com/TErM/E/encryption.html 3. www.cs.princeton.edu/courses/archive/fa ll07/cos433/lec8.pdf 4. x5.net/faqs/crypto/q94.html 5. www.digitalsignature.in/ 6. en.wikipedia.org/wiki/Digital_signature7. www.phrozenblog.com/?p=5128. Stallings William. Cryptography and network Security
Principles and Practices, Fourth Edition.
encrypt the message but it cannot be decrypted without the private key. Thus data is pretty useless without the private key, as it cannot be decrypted without the private key. With private key an authentic user can put digital signatures over a document. Digital signature is a tamp which is very difficult to forge. During the process of signing, the data is crunched down into few lines via a process called hashing. The crunched down data is called message digest, which cannot be changed v\back to original data.
vlefer ;qXeuksa ¼vlesfVªd is;fjax½ ij vk/kkfjr fØIVksflLVe Cryptosystems based on Asymmetric Pairings
rajeev Kumar*, S.K. Pal#, and Arvind$
#Scientific Analysis Group, Delhi-110054
*,$University of Delhi, Delhi--110054 *E-mail: [email protected]
lkjka”k
;qXeu vk/kkfjr fØIVksxzkQh] vkSj lwpuk lqj{kk esa uohu vuqla/kku fn'kkvksa esa ls ,d gSA ;qXeu vk/kkfjr fØIVksxzkQh esa dbZ vuqla/kkudrkZ ;qXeu dks ,d ÞCySd c‚Dlß ds :i esa ekurs gSaA os ;qXeu dh fofHkUu fo'ks"krkvksa dk mi;ksx djds fØIVksxzkfQd Ldheksa dks cukrs gSaA ,d ;qXeu vlefer ;qXeu dgykrk gS ;fn gks] tgka vkSj lewg lajpuk,a gSA ,slk vlefer ;qXeu ftlds fy, ,d n{krk ls lax.kuh; vkblkse‚fQZLe Kkr gksrk gS] Vkbi 2 ;qXeu dgykrs gSa vkSj ;fn ,slk vkblkse‚fQZLe ugha Kkr gksrk gS] rks e dks Vkbi 3 ;qXeu dgk tkrk gSA vlefer ;qXeu esa dbZ fØIVksxzkfQd çksVksd‚y gksrs gSa tks vius lqj{kk gzkl ds fy, vkblksekfQZLe dh ekStwnxh ij fuHkZj djrs gSa vkSj dbZ ,sls gksrs gSa tks [kqn çksVksd‚y esa gh dk mi;ksx djrs gSaA bl i= esa ge fØIVksxzkfQd lanHkZ esa ;qXeuksa ds çdkjksa dks çLrqr dj jgs gSaA ge vlefer ;qXeuksa ij vk/kkfjr fØIVksflLVe dh leh{kk djsaxsA ge mu fØIVksxzkfQd çksVksd‚yksa ds dk;kZUo;u vkSj lqj{kk igyqvksa ij /;ku dsfUær djsaxs tks nh?kZo`Ùkh; oØksa ij Vkbi 2 vkSj Vkbi 3 ;qXeuksa dk mi;ksx djrs gSaA ge bu çksVksd‚yksa esa vkblkse‚fQZLe Hkwfedk dks js[kkafdr djsaxsA ge n'kkZrs gSa fd fdl çdkj Vkbi 2 ;qXeu dsoy Vkbi 3 ;qXeuksa dk vn{k dk;kZUo;u ek= gS vkSj ;g dk;Z'kSyh] lqj{kk vkSj fu"iknu dh –f"V ls vlefer ;qXeuksa ij vk/kkfjr çksVksd‚yksa ds fy, dksbZ ykHk çnku djrk çrhr ugha gksrk gSA
AbstrAct
Pairing based cryptography is one of the recent research directions in cryptography and information security. Many researchers in pairing based cryptography treat pairings as a 'black box'. They build cryptographic schemes making use of various properties of pairings. A pairing e: G1×G2→GT is called asymmetric pairing if G1 ≠ G2, where G1, G2 and GT are group structures. Asymmetric pairings for which an efficiently-computable is omorphism ψ: G2→G1 is known are called type 2 pairings and if such an isomorphism is not known then e is called type 3 pairing. There are many cryptographic protocols in the asymmetric pairing which rely on the existence of isomorphism ψ for their security reduction and there are many which use ψ in the protocol itself. In this paper, we present types of the pairings in cryptographic context. We review cryptosystems based on asymmetric pairings. We focus on the implementation and security aspects of cryptographic protocols that use type 2 and type 3 pairings on elliptic curves. We highlight the role of isomorphism ψ in these protocols. We show how type 2 pairings are merely inefficient implementation of type 3 pairings and appear to offer no benefit for protocols based on asymmetric pairings from view of functionality, security and performance.
Keywords: Elliptic curves, pairing based cryptography, asymmetric pairing, weil pairing, tate pairing
Bilingual International Conference on Information Technology: Yesterday, Today, and Tomorrow, 19-21 February 2015, pp. 70-75© DESIDOC, 2015
1. IntroductIonPublic-key cryptography1 is perhaps the most
celebrated contribution of modern cryptography. It is hard to imagine what the world would belike without their revolutionary approach to key distribution. Public key cryptography was publicly introduced by Whitefield Diffie and Martin Hellman in 1976. In a public key cryptosystems there are two keys. The public key which is published in a directory allows encryption and the
private key which is kept secret allows decryption. ronald rivest, Adi Shamir and leonard Adleman proposed a scheme in 1977, which became the most widely used public key cryptographic scheme, rSA. ElGamal cryptosystem is a non-rSA public key cryptosystem based on discrete logarithms.
Elliptic curves over finite fields had played an important role in public key cryptography. The first use of elliptic curves for cryptography2 was suggested
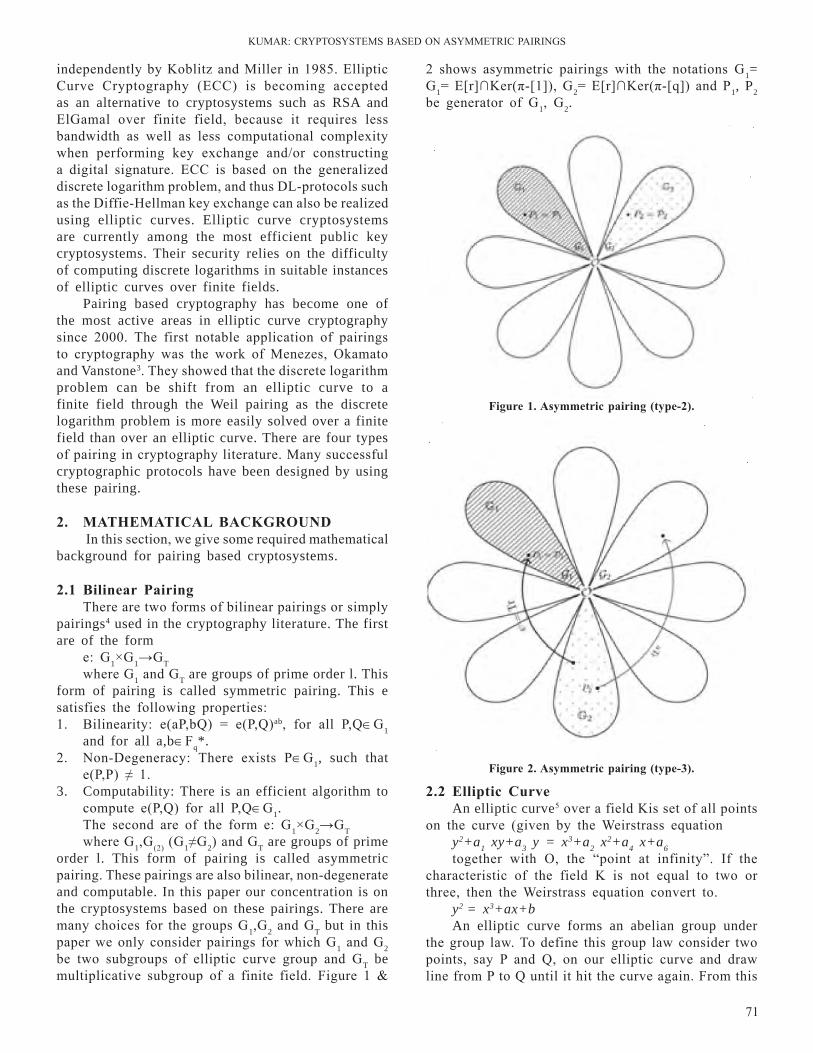
KuMAr: CrYPTOSYSTEMS BASED On ASYMMETrIC PAIrInGS
71
2 shows asymmetric pairings with the notations G1= G1= E[r]∩Ker(π-[1]), G2= E[r]∩Ker(π-[q]) and P1, P2 be generator of G1, G2.
independently by Koblitz and Miller in 1985. Elliptic Curve Cryptography (ECC) is becoming accepted as an alternative to cryptosystems such as RSA and ElGamal over finite field, because it requires less bandwidth as well as less computational complexity when performing key exchange and/or constructing a digital signature. ECC is based on the generalized discrete logarithm problem, and thus Dl-protocols such as the Diffie-Hellman key exchange can also be realized using elliptic curves. Elliptic curve cryptosystems are currently among the most efficient public key cryptosystems. Their security relies on the difficulty of computing discrete logarithms in suitable instances of elliptic curves over finite fields.
Pairing based cryptography has become one of the most active areas in elliptic curve cryptography since 2000. The first notable application of pairings to cryptography was the work of Menezes, Okamato and Vanstone3. They showed that the discrete logarithm problem can be shift from an elliptic curve to a finite field through the Weil pairing as the discrete logarithm problem is more easily solved over a finite field than over an elliptic curve. There are four types of pairing in cryptography literature. Many successful cryptographic protocols have been designed by using these pairing.
2. MAthEMAtiCAl bACKGroUnd In this section, we give some required mathematical
background for pairing based cryptosystems.
2.1 bilinear Pairing There are two forms of bilinear pairings or simply
pairings4 used in the cryptography literature. The first are of the form
e: G1×G1→GTwhere G1 and GT are groups of prime order l. This
form of pairing is called symmetric pairing. This e satisfies the following properties:1. Bilinearity: e(aP,bq) = e(P,q)ab, for all P,q∈G1
and for all a,b∈Fq*.2. non-Degeneracy: There exists P∈G1, such that
e(P,P) ≠ 1.3. Computability: There is an efficient algorithm to
compute e(P,q) for all P,q∈G1.The second are of the form e: G1×G2→GTwhere G1,G(2) (G1≠G2) and GT are groups of prime
order l. This form of pairing is called asymmetric pairing. These pairings are also bilinear, non-degenerate and computable. In this paper our concentration is on the cryptosystems based on these pairings. There are many choices for the groups G1,G2 and GT but in this paper we only consider pairings for which G1 and G2 be two subgroups of elliptic curve group and GT be multiplicative subgroup of a finite field. Figure 1 &
Figure 1. Asymmetric pairing (type-2).
Figure 2. Asymmetric pairing (type-3).
2.2 Elliptic Curve An elliptic curve5 over a field Kis set of all points
on the curve (given by the Weirstrass equationy2+a1 xy+a3 y = x3+a2 x2+a4 x+a6together with O, the “point at infinity”. If the
characteristic of the field K is not equal to two or three, then the Weirstrass equation convert to.
y2 = x3+ax+b An elliptic curve forms an abelian group under
the group law. To define this group law consider two points, say P and q, on our elliptic curve and draw line from P to q until it hit the curve again. From this
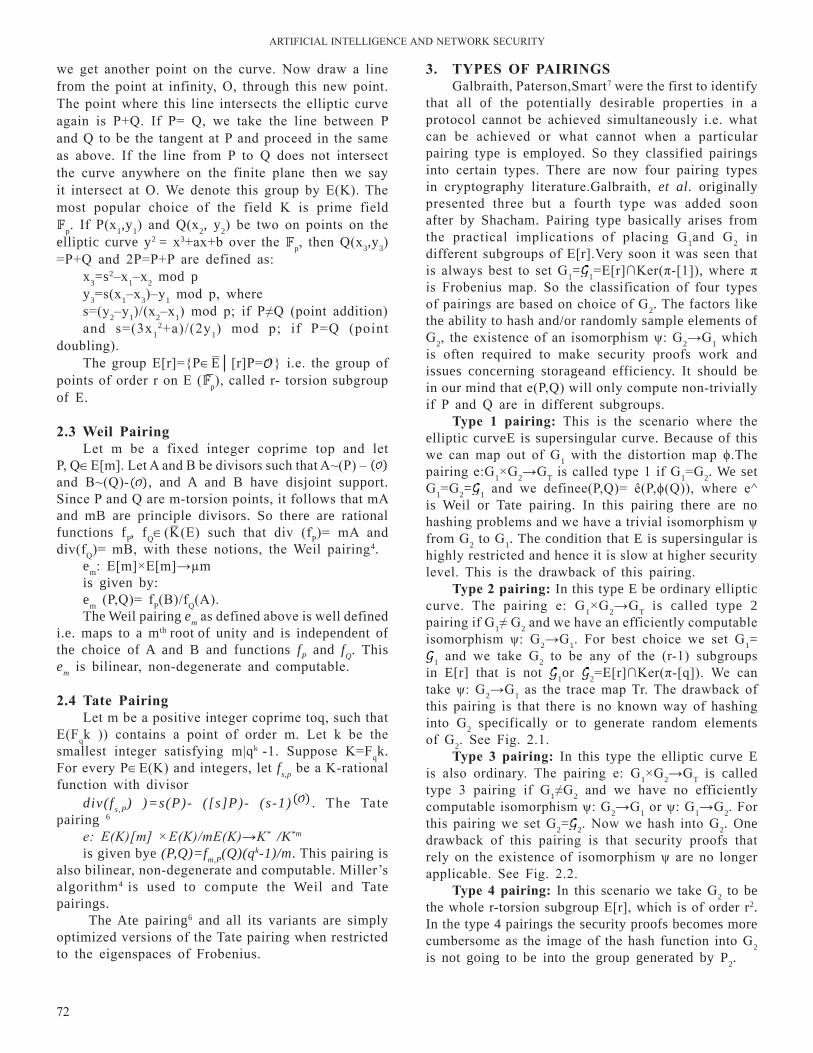
ArTIFICIAl InTEllIGEnCE AnD nETWOrK SECurITY
72
we get another point on the curve. now draw a line from the point at infinity, O, through this new point. The point where this line intersects the elliptic curve again is P+q. If P= q, we take the line between P and q to be the tangent at P and proceed in the same as above. If the line from P to q does not intersect the curve anywhere on the finite plane then we say it intersect at O. We denote this group by E(K). The most popular choice of the field K is prime field 𝔽p. If P(x1,y1) and q(x2, y2) be two on points on the elliptic curve y2 = x3+ax+b over the 𝔽p, then q(x3,y3) =P+q and 2P=P+P are defined as:
x3=s2–x1–x2 mod py3=s(x1–x3)–y1 mod p, wheres=(y2–y1)/(x2–x1) mod p; if P≠q (point addition)and s=(3x1
2+a)/(2y1) mod p; if P=q (point doubling).
The group E[r]={P∈E│[r]P= } i.e. the group of points of order r on E (��p), called r- torsion subgroup of E.
2.3 weil Pairinglet m be a fixed integer coprime top and let
P, q∈E[m]. let A and B be divisors such that A~(P) – and B~(q)- , and A and B have disjoint support. Since P and q are m-torsion points, it follows that mA and mB are principle divisors. So there are rational functions fP, fq∈(K(E) such that div (fP)= mA and div(fq)= mB, with these notions, the Weil pairing4. em: E[m]×E[m]→µm
is given by: em (P,q)= fP(B)/fq(A).The Weil pairing em as defined above is well defined
i.e. maps to a mth root of unity and is independent of the choice of A and B and functions fP and fQ. This em is bilinear, non-degenerate and computable.
2.4 tate Pairing let m be a positive integer coprime toq, such that
E(Fqk )) contains a point of order m. let k be the smallest integer satisfying m|qk -1. Suppose K=Fqk. For every P∈E(K) and integers, let fs,p be a K-rational function with divisor
div(f s,P) )=s(P)- ([s]P)- (s-1) . The Tate pairing 6
e: E(K)[m] ×E(K)/mE(K)→K* /K*m
is given bye (P,Q)=fm,P(Q)(qk-1)/m. This pairing is also bilinear, non-degenerate and computable. Miller’s algorithm4 is used to compute the Weil and Tate pairings.
The Ate pairing6 and all its variants are simply optimized versions of the Tate pairing when restricted to the eigenspaces of Frobenius.
3. tYPEs oF PAirinGsGalbraith, Paterson,Smart7 were the first to identify
that all of the potentially desirable properties in a protocol cannot be achieved simultaneously i.e. what can be achieved or what cannot when a particular pairing type is employed. So they classified pairings into certain types. There are now four pairing types in cryptography literature.Galbraith, et al. originally presented three but a fourth type was added soon after by Shacham. Pairing type basically arises from the practical implications of placing G1and G2 in different subgroups of E[r].Very soon it was seen that is always best to set G1= 1=E[r]∩Ker(π-[1]), where π is Frobenius map. So the classification of four types of pairings are based on choice of G2. The factors like the ability to hash and/or randomly sample elements of G2, the existence of an isomorphism ψ: G2→G1 which is often required to make security proofs work and issues concerning storageand efficiency. It should be in our mind that e(P,q) will only compute non-trivially if P and q are in different subgroups.
type 1 pairing: This is the scenario where the elliptic curveE is supersingular curve. Because of this we can map out of G1 with the distortion map ϕ.The pairing e:G1×G2→GT is called type 1 if G1=G2. We set G1=G2= 1 and we definee(P,q)= e(P,ϕ(q)), where e^ is Weil or Tate pairing. In this pairing there are no hashing problems and we have a trivial isomorphism ψ from G2 to G1. The condition that E is supersingular is highly restricted and hence it is slow at higher security level. This is the drawback of this pairing.
type 2 pairing: In this type E be ordinary elliptic curve. The pairing e: G1×G2→GT is called type 2 pairing if G1≠ G2 and we have an efficiently computable isomorphism ψ: G2→G1. For best choice we set G1=
1 and we take G2 to be any of the (r-1) subgroups in E[r] that is not 1or 2=E[r]∩Ker(π-[q]). We can take ψ: G2→G1 as the trace map Tr. The drawback of this pairing is that there is no known way of hashing into G2 specifically or to generate random elements of G2. See Fig. 2.1.
type 3 pairing: In this type the elliptic curve E is also ordinary. The pairing e: G1×G2→GT is called type 3 pairing if G1≠G2 and we have no efficiently computable isomorphism ψ: G2→G1 or ψ: G1→G2. For this pairing we set G2= 2. now we hash into G2. One drawback of this pairing is that security proofs that rely on the existence of isomorphism ψ are no longer applicable. See Fig. 2.2.
type 4 pairing: In this scenario we take G2 to be the whole r-torsion subgroup E[r], which is of order r2. In the type 4 pairings the security proofs becomes more cumbersome as the image of the hash function into G2 is not going to be into the group generated by P2.
KuMAr: CrYPTOSYSTEMS BASED On ASYMMETrIC PAIrInGS
73
4. CrYPtosYstEMs bAsEd on PAirinGsSecurity of a pairing- based protocol is based on
some hard problems in the respective pairing groups. There are many hard assumptions in the asymmetric setting. For example, as shown in8, security of Boneh-lynn-Shacham (BlS) scheme in type-2 setting is based on computational Diffie Hellman problem (co-DHP) problem (i.e. compute hz given h∈G1and g2
'z ∈G2'), whereas security of BlS scheme in the type 3 setting is based on the co-DHP* problem (i.e. compute hz
given h, g1z ∈ G1 and g2
z ∈ G2). The Bilinear Diffie-Hellman assumption in type 2 pairing (BDH-2),Bilinear Diffie-Hellman assumption in type 3 pairing (BDH-3) with all versions are some more examples of hard assumptions in asymmetric setting. In this section we presentsome existing cryptographic protocols based on type 2 and type 3 pairings. We will see some of these protocols employ the isomorphism ψ in the protocol itself and some use it in security only. In this presentation we investigate two thing, first investigation is to determine the exact role played by isomorphism ψ in functionality and security of these protocols, secondly we investigate whether it is possible to avoid the use of ψ altogether9.
4.1 boneh-Franklin identity based encryption (bF-ibE)This scheme was originally described in the
symmetric setting but latter also implemented in asymmetric setting10,11. We elaborate both BF-IBE based on type2 (BF-IBE-2) pairings and BF-IBE based on type 3 pairings (BF-IBE-3).
bF-ibE-2: In this scheme the master secret key is x∈R Zn and the corresponding public key is gpub=g'2
x
∈G'2. Given a user identity id ∈{0,1}*, the public key of the user is hid=H1 (id) ∈G1 where H1:{0,1}*→G1 is publicly computable hash function. The corresponding private key is did=hid
x. now to encrypt a message M∈{0,1}n,a sender chooses r∈R Zn and sends<g2
'r, M H2 (e2 (hid, gpub)
r) >, where H2: GT→{0,1}n another publicly computable hash function. The receiver computes H2 (e2 (did, g2
'r)) and then xors it with the second component of the ciphertext to obtain M. We can decrypt the massage because of the property of pairing e2(did, g2
'r)= e2 (hxid, g'2)
r =e2 (hid, gpub)r.
bF-ibE-3:The above BF-IBE-2 scheme can be directly implemented in type 3. In this KGC’s public key is gpub= gx
2 ∈G2 and the ephemeral key in the
ciphertext will be gr2∈G2. This study9 show that type
3 is a better choice than type 2 for BF-IBE, i.e. BF-IBE-3 is a better choice than BF-IBE-2.
4.2 the boneh-lynn-shacham (bls) signature schemeThis BlS short signature scheme12 is also an example
of asymmetric pairing. let Γ=(q, G1, G2, GT, P1,P2, p) be a problem instance on which our pairing based protocol be defined. The BlS scheme requires the following three elements of the groups G1, and G2 to be defined.1. The public key of the user is defined to be R=xPi,
for i∈{1, 2}, and some secret key x∈Fq.2. The hash of a massage M is defined to be
qM=H(M)∈Gj, for j∈{1,2},and H:{0,1}*→ Gj is a cryptographic hash function.
3. The signature is given by S∈Gk, where either S=xqM or S=ψ(xqM).From theabove step three steps we can instantly
notice a number of points. Due to point 2 the group G1 and G2 must be randomly samplable; otherwise one would never be able to implement such a hash function.Due to point 3 we must have either j=k, or if there is an oracle to compute ψ we may also have (j,k)= (2,1).4. To verify a signature we need to compute the
pairing of either qM and r, or qM and ψ(r), or ψ(qM ) and r. This implies that either i≠j, or if there is an oracle to compute ψ we may also have i=j=2.We also need to compute the pairing of either S and Pi,or S and ψ(Pi), or ψ(S) andPi. This implies that either k≠i,or if there is an oracle to compute ψ we may also have i=k=2.There are also some other well known cryptosystems
from type-2 and type-3 pairings. For example Boneh-Boyen short signature scheme13, Boneh-Boyen-Shachamshort group signature scheme 14, SCK identity-based encryption scheme15 and ring signature scheme of Boneh, Gentry, lynn and Shacham (BGlS-2 & BGlS-3)16 etc. The ring signature scheme originally was in type-2 setting but it can be modify to allow in type-3 pairing.
In this section we have seen that some known protocols are in both, type-2 and type-3 setting. Chatterjee and Menezes9 argued that an arbitrary type-2 setting protocol can be transformed to the type-3 setting protocol without affecting the functionality or security of the protocol. For this transformation they propose some guidelines.
5. sECUritY AnAlYsisFollowing the paper proposed by Boneh and
Franklin in 2001, many cryptographic schemes, based on bilinear pairings were proposed. Because of at higher security levels, type-1 pairings are expected to be slower on many platforms. So type-2 and type-3 pairings are considered better choices. Security of a pairing-based protocol is based on some hard problem in the respective pairing groups. The standard practice is to argue the security of the protocol in terms of a reduction from the hard problem to breaking the protocol in an appropriate security model. For example security of BlS scheme in the type-2 setting is based on co-
ArTIFICIAl InTEllIGEnCE AnD nETWOrK SECurITY
74
DHP problem, whereas the security of BlS scheme in type-3 setting is based on the co-DHP* problem. In [17] the authors observed that the efficiently-computable isomorphism ψ: G2→G1 is essential for the security of the protocol and can be avoided only at the cost of making a stronger complexity assumption.
From the analysis of BlS signature scheme11, we can say that if ψ is not efficiently computable then one needs to select (i, j, k)=(2,1,1) and the security proof of the scheme in this relative to the hardness of the CDHψ
2,1,1 problem. In other words, although the scheme in this instance may not require an efficiently computable ψthe security proof is relative to an adversary which has oracle access to ψ. And if ψ is efficiently computable then one needs to select (i,j,k) from one of the(2,1,1), (2,2,1), (2,2,2). now security proof is relative to the hardness of CDHψ
i,j,k except that ψ is not only given as oracle access to the adversary it is actually computable, hence the hardness is relative to the standard CDHψ
i,j,k problem. So from this discussion, we can say that if there is no efficiently computable isomorphism ψ: G2→G1, we have to make complex assumption on CDH problem. A similar analysis can be done for Boneh-Franklin encryption scheme.
6. ConClUsion Many pairing-based cryptosystems in the asymmetric
setting rely on the existence of efficiently-computable isomorphism ψfrom G2 to G1, i.e., the type-2 setting. Some initial works in pairing-based cryptography gave the impression that such an isomorphism is necessary for the functionality or the security of the cryptosystems or for both. But later it was argued that relying on such an isomorphism is more of an artifact of initial research in this area rather than an actual necessity as far as the functionality and security of the cryptosystems are concerned. In this paper we presented various types of pairing in cryptographic context. We reviewed cryptosystems based on asymmetric pairings and discussed implementation and security aspects of these cryptographic protocols. We have elaborated on the role of isomorphism ψ in these protocols. We have also elaborated on practical application of pairing based schemes for encryption and digital signatures. With the recent developments in cryptanalysis of discrete logarithm based schemes we would focus on security of practical pairing based cryptosystems.
fu’d’k Zvlefer O;oLFkk esa dbZ ;qXeu vk/kkfjr fØIVksflLVe
n{krk ls lax.kuh; vkblkse‚fQZLe vFkkZRk] Vkbi 2 O;oLFkk ij fuHkZj djrs gSaA ;qXeu vk/kkfjr fØIVksxzkQh esa dqN çkjafHkd dk;ksaZ ls ,slk yxk fd ,slk vkblkse‚fQZLe fØIVksflLVe dh
dk;Z'kSyh ;k lqj{kk ;k nksuksa ds fy, vko';d gSA ysfdu ckn esa ;g nyhy nh xbZ fd ,slk vkblksekfQZLe ij fuHkZjrk bl {ks= esa] tgka rd fØIVksflLVe dh dk;Z'kSyh vkSj lqj{kk dk laca/k gS] ,d okLrfod vko';drk gksus ds ctk, çkjafHkd vuqla/kku dh ,d f'kYi—fr vf/kd gSA bl i= esa geus fØIVksxzkfQd lanHkZ esa fofHkUu çdkj ds ;qXeuksa dks çLrqr fd;k gSA geus vlefer ;qXeuksa ij vk/kkfjr fØIVksflLVe dh leh{kk dh vkSj bu fØIVksxzkfQd çksVksd‚yksa ds dk;kZUo;u vkSj lqj{kk igyqvksa ij ppkZ dhA geus bu çksVksd‚yksa esa vkblksekfQZLe dh Hkwfedk dh foLr`r O;k[;k dh gSA geus bufØI'ku vkSj fMftVy gLrk{kjksa ds fy, ;qXeu vk/kkfjr Ldheksa ds O;kogkfjd vuqç;ksx dh Hkh O;k[;k dh gSA vlrr y‚xfjFe vk/kkfjr Ldheksa ds fØIVk,ukfyfll esa gq, gky ds fodklksa ds lkFk ge O;kogkfjd ;qXeu vk/kkfjr fØIVksflLVe dh lqj{kk ij /;ku dsfUær djsaxsA
rEFErEnCEs1. W. Diffie; M. Hellman, Directions in Cryptography,
IEEE Transactions on Information Theory,1976. 22, 644-654.
2. V.S. Miller, use of elliptic curves in cryptography, Advanced in Cryptology-Crypto 85 pp. 417-426, Springer-Verlag, new York, 1985.
3. A.J. Menezes; T.T. Okamoto & S.A. Vanstone- reducing elliptic curve logarithms in a finite field, IEEE Transactions on information theory,1993. 39, pp.1639-1639.
4. Ben lynn, On the implementation of pairing-based cryptosystems, 2007.
5. William Stallings, Cryptography and network Security, Principles and Practice. PrenticeHall, new Jersey.2003
6. Andreas Enge, Bilinear pairings on elliptic curves. Kluwer Academic Publishers, 2014.
7. S. Galbraith, K. Paterson & n. Smart, Pairings for cryptographers, Discrete Applied Mathematics,156, 3113–3121, 2008.
8. S. Chatterjee, D. Hankerson, E. Knapp and A. Menezes, “Comparing two pairing-based aggregate signature schemes”, Designs, Codes and Cryptography, 55, 141–167, 2010.
9. S. Chatterjee, A. Menezes, On Cryptographic protocols Employing Asymmetric Pairing-The role of ψ revisited, 2011.
10. D. Galindo, Boneh-franklin identity-based encryption revisited, Automata, language and Programming – ICAlP 2005, lnCS 3580, 2005, 791–802.
11. n. Smart & F. Vercauteren, On computable isomorphisms in efficient pairing-based systems, Discrete Applied Mathematics, 2007. 155, 538–547.
12. D. Boneh, B. lynn & H. Shacham, Short signatures

KuMAr: CrYPTOSYSTEMS BASED On ASYMMETrIC PAIrInGS
75
from the Weil pairing, Advances in cryptology – ASIACrYPT 2001, Springer-Verlag lnCS 2248, 514–532, 2001.
13. D. Boneh & X. Boyen, Short signatures without random oracles”, Advances in Cryptology – EurOCrYPT 2004, lnCS 3027, 2004, 56–73.
14. D. Boneh, X. Boyen and H. Shacham, “Short group signatures”, Advances in Cryptology – CrYPTO 2004, lnCS 3152, 2004, 41–55.
15. l. Chen and C. Kudla,“Identity-based authenticated key agreement from pairings”, IEEE Computer Security Foundations Workshop, 219–233, 2003.
16. D. Boneh, C. Gentry, B. lynn & H. Shacham, Aggregate and verifiably encrypted signatures from bilinear maps, Advances in Cryptology –EurOCrYPT 2003, lnCS 2656, 2003, 416–432.
17. D. Boneh, B. lynn & H. Shacham, Short signatures from the Weil pairing, J. Cryptology, 2004. 17, 297–319.
nsoukxjh esa fojklrh dwVys[ku ls ;wuhdksM esa çoztu laca/kh eqísissues in Migration from legacy encodings to Unicode in devanagari
rachna GoelC-DAC Pune, India
E-mail: [email protected]
lkjka”k
;wuhdksM vfHkdyukRed Hkk"kkfoKku ds fy, lokZf/kd ialnhnk dwVys[ku i)fr ds :i esa mHkjk gS] cgqr lkjs bafMd Hkk"kk vkadM+s 8 fcV xSj&ekud fXyQ vk/kkfjr dwVys[ku esa gSaA cgqr cM+h ek=k esa fojklrh vkadM+sa ekStwn gSa ftUgsa ;wuhdksM ekud esa ifjofrZr djus dh t:jr gSA vr%] mu fojklrh vkadM+ksa dks d‚jil cukus] [kkstus] NkaVus@ifjrqyu Øe bR;kfn ds fy, mi;ksx djuk O;kogkfjd :i ls vlaHko gSA bl i= esa nsoukxjh ds fy, fojklrh dwVys[ku ;kstukvksa esa ekStwn ikB dks ;wuhdksM esa ifjofrZr djus dh leL;kvksa ij ppkZ dh xbZ gSA fojklrh Q‚UV fof'k"V :i ls bafMd fyfi;ksa dh fo'ks"krkvksa dks bu rjhdksa ls dwVc) djrs gSa tks rkfdZd dwVys[ku ls vR;f/kd vlaxr gksrs gSaA cU/k ¼fyxspj½ dk fXyQ fu:i.k fojklrh dwVys[ku ;kstuvksa esa ,d lkekU; ifjikVh gSA ;g i= fofHkUu Q‚UV osaMjksa ls fojklrh vkadM+ksa dk ;wfudksM esa çoztu djus ds fy, l‚¶Vos;j fMtkbu djus gsrq fd, x, v/;;u ij vk/kkfjr gS vkSj ,sls ekeyksa ij çdk'k Mkyrk gS ftUgsa fojklrh dwVys[ku ls ;wfudksM esa çoztu djrs le; /;ku esa j[kuk pkfg,A bls blds fy, ,d fn'kkfunsZ'k ds :i esa mi;ksx fd;k tk ldrk gS vkSj bl i= esa ppkZ fd, x, eqíksa dks vU; bafMd fyfi;ksa ds fy, Hkh lkekU;h—r fd;k tk ldrk gSA
AbstrAct
unICODE has emerged as most favoured encoding system for computational linguistics, lots of Indic language data is in 8-bit non-standard glyph-based encoding. There is huge legacy data which needs conversion to unicode standard. It is therefore practically impossible to use that legacy data for corpus generation, searching, sorting / collation order etc. This Paper discusses problems of converting text in legacy encoding schemes for Devanagari to unicode. legacy fonts typically encode features of Indic scripts in ways that are highly incompatible with logical encodings. Glyph representation of ligatures is a common practice in legacy encoding schemes. This Paper is based on study that was carried out for designing software for migrating legacy data from various font vendors to unicodeand throw some light on cases that one must take into account when migrating from legacy encodings to unICODE.It can be used as a guideline for same and the issues discussed in this paper can be generalised for other Indic scripts.
Keywords: unicode, font, devanagari, legacytext, encoding, conjunct, vowel diacritic, logical encodings
Bilingual International Conference on Information Technology: Yesterday, Today, and Tomorrow, 19-21 February 2015, pp. 76-80© DESIDOC, 2015
1. IntroductIonMajor challange faced when processing of Indian
language data for corpus generation and other similar fields is the existence of Indic data in non standard encodings. This paper mainly focuses on Devanagari script issues ,it may be anticipated that issues in other indic script are comparable.
Since there was no text editor who could fully support unicode, lack of awareness about unicode and lack of support at OS level, people opted to work with font based 8 bit encodings or legacy encodings. Font vendors started to use the ASCII codes 128-255 for their own purposes while some vendors also used lower 128 also.
Because of very delayed support from operating systems and web browsers web publishers were quite hesitant to use any standard such as unICODE.
Atext oriented solution to delivery of Indic text has been given in the form of legacy encodings or in house fonts encoding.These encodings introduced inconsistencies and anomalies in Indic text of same script where these two data could not be used for same purpose and carrying font everywhere was not a good solution.and they are indeed big problem when one wants to have multi-script data in a single database or when question comes of resource sharing. (rajesh Chandrakar, (2002)).
GOEl: ISSuES In MIGrATIOn FrOM lEGACY EnCODInGS TO unICODE In DEVAnAGArI
77
2. lEGACY EnCodinGs For dEVAnAGAriFirst standard of encoding of all Indian language
scripts was ISCII (Indian Standard Codefor Information Interchange; see Bureau of Indian Standards, 1991) and PASCII(Perso Arabic standard Code for Information Interchange)which are storage standards and not suitable for display.
However these encodings were rarely used by font vendors who used their own approach to encode the script. These font vendors chose to construct a8-bit font. These are also known as “graphical encodings” as these encodings are based upon representing graphical form of a particular letter of a script with out emphasizing on abstract value of letterIn this context non Standard effectively means “not unicode.”
ISCII provide a quite transparent relationship between characters and their unicodeequivalents which contains only basic alphabets required by Indic scripts and provide one to one character mapping between ISCII code and its unicode equivalent.
logical encodings such as unicode marks a difference between glyph and character.Visualrepresentaion of same character on paper or any screen will be called glyph. Encoding which emphasizes on encoding character such as unICODE and ISCII does not define glyphs or images.
Where as graphical encodings emphasizes on representing glyphs of various characters of a script.
“Devanagari letter KA” may be visually different in two different 8-bit encodings.In Shivaji font this letter has been assigned code point 0x6B while in DV-TTYogesh font it has been assigned code point B4.
It seems clear that both vendors assigned two different code points for same character "Devanagari letter KA".
If we observe same case in two different open type fonts used for unicode, In Mangalfont
character code: 0915while in DV-OT Yogesh it wil look like Character Code : 0915It is clear that Visual Representaion of one character
may differ in unicode but encoded value for that character will remain fixed. As logical Encoding does not define glyphs or images ,but abstract value or code point will remain same in both cases which is 0915.
When “u+20B9 Indian rupee Sign” was introduced in unicode 6.0 ,Various font vendors started to add this symbol in their respective fonts.As most of 128 positions were already occupied in their fonts, this lead to either removing the existing glyph from font and supporting rupee symbol at that vacant position. Complexity of this case can be understood taking example of Shivaji Font.
To support rupee symbol in Shivaji font vendors chose to removeexisting glyph, half consonant form of “t”
Which is “Devanagari letter nya” and was at code point 0x48 and glyph for rupee symbol added at same position. This solution has many ill consequences.It will produce problems for users who are accustomed to typing in previous version of font and also exists possibilities of data loss . Data generated with previous version of Shivaji Font will have compatibility issues with data of new font .
Some vendors could not delete any glyph from existing font,So designed a new font only for rupee symbol. Foradian Technologiesdesigned a new font rupee.ttf which will display rupee symbol at code point 60. However, code point 60 can be assigned to a different character inanother font. For instance in Shree-dev-0708 font rupee symbol will be visible as ;.
While for unicode this process consisted of supporting rupee sumbol glyph at code point 20B9 in open type font and OS vendors releasing updates which can be downloaded and installed freely.
3. diFFiCUltiEs in MAPPinG 8 bit EnCodinGs to UniCodE
3.1 Vowel symbolsDevanagari and other ancient Indian scripts that
have originated from Brahmi Script represent vowels in two forms, as–
Independent Vowels and Dependent VowelsIn unicode, code points(0904-0914)represent
Independent Vowels.While Dependent vowel letters can not stand alone
. In Devanagari unicode Code chart dependent vowels cover range from 093E to 094C. There are equivalent matras for all vowels except aa vowel. (0904).
Dependent vowels and Independent vowels has been assigned separate code points in both ISCII and unicode. But that is not certainly case with legacy encodings. To look briefly at an example in Devanagari, in word “Deye” in Aps-DV Priyanka Font,“0905 Devanagari letter A” is formed with two Character codes 0x44 and0x65 while this letter is represented in unicode with a single code point.
unicode-equivalent: 0905 Rendered as: vSimilarly independent vowels letters AA, O, Au
are formed in font APS DV-Priyanka as–“0906 Devanagari letter AA” is formed in this
font asCharacter codes0x44 0x65 0x65Rendered as: vkSimilarly “ 0913 Devanagari letter O” is formed

ArTIFICIAl InTEllIGEnCE AnD nETWOrK SECurITY
78
with character codes“0914 Devanagari letter Au” is also formed with
four character codesIt seems clear that there is one glyph representing
half form of independent vowel letter “u+0905 Devanagari letter A” which will form other independent vowels “AA”, “O” and “Au” when juxtaposed with one or more glyphs of vertical stem which is at code point 0x65 and glyphs representing independent vowels forms of O and Au.
Thing to be noted is that neither vertical stem has been assigned a code point in unicode nor half form of “u+0905 Devanagari letter A”.
When data contains such vowel sequences, we can not have one to one mapping from such sequences as they are considered invalid because virarma sign can be applied only to consonants.We can not have virama sign applied to vowel itself as language orthography does not permit this.
3.2 one Code Point for Multiple Characters In some legacy fonts, same code point is used to
represent two or more consonants. In APS-DV Priyanka Font, Code points are assigned to glyphs representing tail of various consonants ka, pha andva. In this font consonantka is formed with 3 character codes.
Character Codes: 0x6B 0x650xE2unicode-equivalent: 0915 Rendered as: dFormation of dead consonant (“u+0915 Devanagari letter
KA”) in this font is with three character codes.Character Codes :0x6B0x650xE4unicode-equivalent 0915+094D Rendered as d~Formation of consonant (“u+092B Devanagari
letter PHA”) is also with two character codes in this legacy font.
Character Codes:0x480x65 0xE2unicode-equivalent:092B Rendered as : QIt may be depicted with above visual representations
that various glyphs when joined in sequence form a single consonant in legacy encoding while consonants have been assigned separate code points in unicode. legacy encodings do not follow any standard for representation of consonants also and may encode glyphs for half or quarter of a consonant and same code point is used to form two or more different consonants.
3.3 no separate Code Point for Visargano separate code point for Visarga:Some vendors
do not assign separate glyph for Devanagari sign visarga. Devanagari Sign Visarga (0903 in unicode) has visual similarity to ASCII colon sign(0x3A) . Some
font vendors take advantage of this fact and does not provide separate code point for visarga sign and use ASCII colon sign wherever visarga sign is required in text. In APS-DV Priyanka font there has been incorrect use of ASCII character colon to represent Visarga Sign in Devanagari.
Value 3A which is Ascii value of colon has been used to represent Visarga. When migrating to unicode in such type of data colon value can not be kept intact, it must be mapped to Visarga. Though how actual character colon will be represented in migrating from such encoding is an another issue.One solution in this scenario could be to insert Devnagri Sign Visarga (0903) wherever colon character was used to represent Visraga in legacy data during migration process. There are scenarios when people do this in another different way i.e using visarga in place of colon.
3.4 juxtaposing dependent Vowels signs to dead ConsonantIn logical encodings such as unicode and iscii,
Dependent Vowel Signs can not be applied to dead consonant.
In Indic text generated with Shivajifont,there are several instances where a matra has been juxtaposed on a dead consonant .
Half forms of consonnats, ligatures have not been assigned code points in unicode. However they can be formed using zero width joiner, if such glyph has been provided in font itself.
However in above scenario when dependent vowel signs are juxtaposed on dead consonant. In migration process to unicode virama Sign can be omitted to make sequence logically correct as per script orthography and considering this as typo error in data generation with legacy encodings.In another way dead consonant can be displayed as half consonant with use of zero width joiner and omit mapping of dependent vowel sign aye, but this method will result in data loss.
3.5 Formation of ligatures There are no separate code points assigned to
ligatures in logical encodings however same is not true with glyph based encodings. In unicode, ligatures are glyphs not characters. One may provide glyphs for ligatures in open type font, but they do not have separate code points. In contrary to this legacy encodings encode most ligatures with a single code point.
In APS-DV-Priyanka font Glyphs are assigned for various ligatures. One instance is ligature DnKHA which is encoded at code point 0x93. While unicode equivalent is
unicode equivalent:095C + 094D + 0916Rendered as: M+ ~[k in mangal font on windows
xp.

GOEl: ISSuES In MIGrATIOn FrOM lEGACY EnCODInGS TO unICODE In DEVAnAGArI
79
Mapping seems to be simple for ligatures during migration process. Half ligatures are also assigned unique code points in some legacy encodings and as they do not have unique code point in unicode and for representation of them one need to use zero width joiner in unicode.
In AkrutiDev Yogini font half ligature form kSha(Devanagari consonant ka+Virama+Devanagari letter SSA) is represented with a single Character code 0x23 whose unicode sequence is:
unicode sequence:0915+094D +0937+ 094D + ZWJ
rendered as: {k n mangal font on windows XP.One may have to use zero width joiners when
migrating to unicode from such encodings in half ligatures scenario and need to have same glyph in open type font.
4. ConClUsionlegacy encodings that may be found in Indic
text vary greatly.While most of legacy encodings are based upon graphical representation of characters thus diacritics,ligatures, contextual variations and other language primitives have great variation in terms of encoding used. Most of 8-bit encodings are based upon graphical representaion of characters. Mapping from an logical encoding like ISCII can be easy while same can not be true for mapping from glyph based encoding for a number of reasons as mentioned in Section 3 and in short as following - a. A single code point being used for different
characters in different encoding schemesb. The purpose of a code point is determined by the
value of one or more other nearby code pointsc. Incorrect code point values d. Missing code pointse. Multiple code points for a single characterf. Various representations of the characterg. Insufficient documentation of the encoding
mechanismBut before start with migration of such legacy data
to unICODE, first step should be to understand the scope of the challenge, compare and contrast common problems that are likely to be encountered.
Although this is a fairly time-consuming process , but the benefits can be worth the cost for bringing out the valuable legacy data in the most favorable Encoding scheme unICODE.
5. ACKnowlEdGEMEntsI would like to thank my collagues Smita unde
and Mr. Vainateya Koratkar whose assistance has been invaluable. I would also like to thank Dr. raimond Doctor, Ms. ruchi Garg for their valuableinputs and feedback.
fu’d’k Zfojklrh dwVys[ku] tks bafMd ikB esa ik;k tk ldrk gS]
cgqr fHkUu&fHkUu gksrk gSA tgka vf/kdrj fojklrh dwVys[ku ladsrk{kjksa ds xzkQh; fu:i.k ij vk/kkfjr gksrs gS] vr% Mk;fØfVDl] fyxsplZ] lanHkZxr fHkUurk,a vkSj vU; :f<+ 'kCn ç;qä dwVys[ku dh –f"V ls vR;f/kd fHkUurk,a j[krs gSaA vf/kdrj 8 fcV dwVys[ku ladsrk{kjksa ds xzkQh; fu:i.k ij vk/kkfjr gksrs gSaA vkbZ,llhvkbZvkbZ tSls ,d rkfdZd dwVys[ku ls eSfiax vklku gks ldrh gS tcfd dbZ dkj.kksa ls] tSlkfd [kaM 3 esa mYys[k fd;k x;k gS vkSj la{ksi esa uhps fn;k x;k gS] fXyQ vk/kkfjr dwVys[ku ls eSfiax ds laca/k esa ;g ckr lR; ugha gks ldrh gSA1- fHkUu&fHkUu dwVys[ku Ldhe esa fofHkUu ladsrk{kjksa ds fy,
,d ,dy dwV fcanq dk mi;ksx fd;k tk jgk gS2- fdlh dwV fcanq dk ç;kstu ,d ;k vf/kd vU; utnhdh
dwV fcanqvksa ds eku }kjk fu/kkZfjr fd;k tkrk gS3- xyr dwV fcanq eku4- yqIr dwV fcanq5- ,d ,dy ladsrk{kj ds fy, vusd dwV fcanq6- ladsrk{kj ds fofHkUu fu:i.k7- dwVys[ku ra= dk vi;kZIr çys[ku
fdarq ,sls fojklrh vkadM+ksa ds ;wfudksM esa çoztu dks 'kq: djus ls igys] igyk dne pqukSrh ds nk;js dks le>us vkSj mu lkekU; leL;kvksa dh rqyuk vkSj foHksn djus dk gksuk pkfg, ftuds is'k vkus dh laHkkouk gSA ;fn~i ;g dkQh le;&[kikÅ çfØ;k gS] fdarq blds ykHk lokZf/kd vuqdwyuh; dwVys[ku Ldhe ;wfudksM esa cgqewY; fojklrh vkadM+ksa dks ykus dh ykxr ls dgha vf/kd gks ldrk gSA
rEFErEnCEs1. A. Hardie. From legacy encodings to unicode: the
graphical and logical principles in the scripts of South Asia. Language Resources and Evaluation, 2007, 41(1), pp. 1–25.
2. P. Baker, A. Hardie, T. McEnery, r. Xiao, K. Bontcheva, H. Cunningham, r. Gaizauskas, O. Hamza, D. Maynard, V. Tablan, and others. Corpus linguistics and South Asian languages: Corpus creation and tool development. Literary and Linguistic Computing, 2004, 19(4), pp. 509–524.
3. A. McEnery, P. Baker, r. Gaizauskas, and H. Cunningham. EMIllE: Building a corpus of South Asian languages. Vivek-Bombay, 2000, 13(3), pp. 22–28.
4. S. T. nandasara, S. Kodama, C. Y. Choong, r. Caminero, A. Tarcan, H. riza, r. l. nagano, and Y. Mikami. An analysis of asian language web pages. International Journal on Advances in ICT for Emerging regions (ICTer). 2009, 1(1), pp.
ArTIFICIAl InTEllIGEnCE AnD nETWOrK SECurITY
80
12–23. 5. A. M. McEnery and r. Z. Xiao, Character
encoding in corpus construction., 2005. [Online]. Available: http://eprints.lancs.ac.uk/60/. [Accessed: 22-Aug-2012].
6. P. Baker, A. Hardie, T. McEnery, r. Xiao, K. Bontcheva, H. Cunningham, r. Gaizauskas, O. Hamza, D. Maynard, V. Tablan, Corpus linguistics and South Asian languages: Corpus creation and tool development. Literary and Linguistic Computing, 2004, 19(4), pp. 509–524.
7. D. B. Choudhary, S. A. Tamhane, and r. K. Joshi, A survey of fonts and encodings for Indian language scripts.
8. R. Ishida. An introduction to indic scripts. in Proceedings of the 22nd Int. unicode Conference. 2002
9. r. M. K. Sinha. A journey from Indian scripts processing to Indian language processing. Annals of the History of Computing, IEEE, 2009, 31(1), pp. 8–31.
10. G. Dias and G. Balachandran, Keyboards for Indic languages.
11. T. McEnery, P. Baker, and l. Burnard. Corpus resources and minority language engineering. in Proceedings of lrEC.2000
12. P. Baker, A. Hardie, T. McEnery, H. Cunningham, and r. Gaizauskas. 2002.
13. P. Pingali, J. Jagarlamudi, and V. Varma. WebKhoj: Indian language IR from multiple character encodings. In Proceedings of the 15th international conference on World Wide Web, new York, nY, uSA, 2006 pp. 801–809.
14. Gupta, r. andunde, S. Towards evolution of localisation standards in Indian scenario. in the Proceedings of 3rd International Conference for TrAnSlATIOn, Technology and Globalization in Multilingual Context, new Delhi, India. 2012.
15. EMIllE, a 67-million word corpus of Indic languages: data collection, mark-up and harmonisation. in Proceedings of 3rd language resources and Evaluation Conference (lrEC’2002), pp. 819–825.
16. unicode :http://www.unicode.org/versions/unicode6.1.0/ch01.pdf [Accessed: 12-Aug-2012]
17. unicode:http://www.unicode.org/versions/unicode6.1.0/ch15.pdf[Accessed: 10-Aug-2012].
18 unicode:http://www.unicode.org/unicode/ [Accessed: 10-Aug-2012].
gYds otu okys Cy‚d lkbQlZ ds fMtkbu ekunaMksa ls lacaf/kr dqN ifj.kkesome results on design Parameters of lightweight block Ciphers
Manoj Kumar*, Saibal K. Pal, and Anupama Panigrahi*Scientific Analysis Group, Delhi-110 054, India
Department of Mathematics, University of Delhi, Delhi *E-mail: [email protected]
lkjka”k
bl i= esa] ge gYds otu okys Cy‚d lkbQlZ ,QbZMCY;w esa ç;qä ekunaMksa ij fo'ks"k /;ku nsrs gq, Cy‚d lkbQlZ ds fMtkbu ekunaMksa ls lacaf/kr dqN ifj.kkeksa dks çLrqr dj jgs gSaA i=ksa esa vkt rd çdkf'kr Cy‚d lkbQlZ T;knkrj nks lajpukvksa ij vk/kkfjr gksrs gS% QkbLVsy vkSj lcfLVVîw'ku ieZ~;wVs'ku usVodZA ge ,QbZMCY;w ds jkmaM QaD'ku esa ç;qä 'kk[kk la[;k ds egRo ij ppkZ djsaxsA blds dkj.k] ,QbZMCY;w fØIVk,uSfyfVd geyksa ds fo#) vU; lkbQlZ ls vf/kd lqjf{kr gksus dk nkok fd;k tkrk gSA ge çR;sd 4 fcV ds NksVs vkdkj dks ysus okys QaD'kuksa gsrq 16 fcV buiqV ij f'k¶V vkSj ,Dlvksvkj ds lHkh laHkkfor la;kstuksa ds laca/k esa vius ç;ksx ds ifj.kke Hkh çLrqr dj jgs gSaA ge 'kk[kk la[;k dk vf/kdre eku mRiUu djus ds fy, jSf[kd ijrksa esa ç;qä f'k¶Vksa vkSj ,Dlvksvkj ds 4 vyx&vyx la;kstu ikrs gSaA ge 4&'kk[kk lkekU;h—r QkbLVy lajpukvksa dks Hkh oxhZ—r djrs gSa vkSj dqN fMtkbu ekunaMksa esa ekStwn nksguh; nqcZyrk dks n'kkZrs gSaA
AbstrAct
In this paper, we present some results on design parameters of block ciphers with specific attention to the parameters used in lightweight block cipher FeW. Block ciphers published in literature till date are mostly based on two structures: Feistel and Substitution Permutation network. We discuss the importance of branch number used in the round function of FeW. Due to which, FeW is claimed to be more secure than other ciphers against cryptanalytic attacks. We also give the results of our experiment on all possible combinations of shift and XOrs on 16-bit input to the functions which are taking the nibble size of 4 bit each. We find out 4 distinct combinations of shifts and XOrs used in linear layers to produce the maximum value of the branch number. We also classify 4-branch generalized Feistel structures and show the exploitable weakness present in some design parameters.
Keyword: Block cipher, branch number, feistel structure, lightweight cryptography, SPn structure
Bilingual International Conference on Information Technology: Yesterday, Today, and Tomorrow, 19-21 February 2015, pp. 81-85© DESIDOC, 2015
1. IntroductIonBlock ciphers are among the oldest and widely
used cryptographic primitives known in the history of cryptography. Starting from the era of classical cryptography, there are various examples of old ciphers which perform encryption on the blocks of data e.g. Vigenere, Hill cipher etc. Block ciphers of today`s era are evolved to encounter the problem of key management occurred in codebook based ciphers. The first widely used block cipher is Data Encryption Standard (DES)[4] which was adopted as an encryption standard in 1975 after an announcement of nBS (today`s nIST) for designing a Data Encryption Standard for commercial applications. This cipher was being used for two and a half decade and variety of cryptanalytic attacks were also published on DES including the very famous differential[4] and linear attacks [10] in
1990`s. After some real time cryptanalytic attacks on full round DES, there was an initiative by nIST for establishing a new Advance Encryption Standard in 1998. As an outcome of the competition held over 3 years, Rijndael[5] was selected as AES in 2001. After the acceptance of AES, some cryptographers started saying that cryptography is almost dead and it is not possible to design a cipher better than AES. This was the time when most of the new designs in symmetric key cryptography were using design parameters already used in AES. Some of them were using the MDS layers and some of them were relying on the S-box of AES to design a secure and efficient cryptography primitive. At the same time the IT industry was also growing at the very fast pace and security applications were being made available to the common public[2][9]. Due to the urgent requirement of security requirements

ArTIFICIAl InTEllIGEnCE AnD nETWOrK SECurITY
82
in the new technologies, industry came up with some new proprietary cryptography primitives like Keeloq used in the key of cars to cater the demand[2] [9]. Some of these algorithms were badly broken and thereafter academia started research in the direction of lightweight Cryptography[8] somewhere in the beginning of 21st century. The first remarkable lightweight block cipher design is the ultra-lightweight block cipher PrESEnT [3], which is also chosen as a lightweight encryption standard by ISO and Electro-technical Commission (ISO/IEC 29192-2). After the popularity of PrESEnT, new lightweight block cipher designs started raining in crypto conferences and journals. There were almost 10-20 new designs being published yearly and all of them used a tailored cryptography in some or the other way to design a new lightweight block cipher. Majority of them are based on Feistel and SPn structure and designed using modifications or combinations of the previously published designs.
2. dEsiGn PArAMEtErsThere are mainly two types of reliable design
structures to design a secure and efficient block cipher. The first one is Feistel Structure named after the Horst Feistel, the designer of lucifer and the second is Substitution Permutation network (SPn) structure whose origin lies in the famous paper written by Shannon in 1949 and it is used in the design of the current encryption standard AES. In this paper, we focus on the Feistel based design parameters that are used to design a new lightweight block cipher. DES was the first widely known and used Feistel based block cipher. There are two main categories in Feistel structure: balance Feistel and unbalance Feistel [2] [11]. In balance Feistel, the whole block size is divided into equal parts (Fig 1) and unbalance Feistel divide the block into unequal parts. Feistel structure based designs rely on the first structure i.e. balanced Feistel. The classical Feistel structure proceeds by dividing the whole block length into two equal parts. If the branches (equal size) in the structure are more than two then this is called a generalized Feistel structure. There are several lightweight block cipher designs[2] [9] based on Feistel and generalised Feistel structure. These are lBlock [15], ClEFIA [14], TWInE [13] etc. recently we have proposed one new category in Feistel structure which we have called Feistel-M (Mix) structure[7]. In this structure, we perform mixing operation on the data between generalised Feistel branches. We have designed a lightweight block cipher called FeW based on Feistel-M structure.
2.1 Generalized Feistel structures (4-branch)In generalised Feistel structure, some branches
are used to modify other branches and some remain
Figure 1. Feistel structure.
unchanged for the next round. In this section, we analyze the 4-branch generalized Feistel structures in detail. We define the branches used to modify other branches as the source branches and the branches to be modified as the target branches. We categorize 4-branch generalized Feistel based designs in the following three categories on the basis of number of round functions used:
There is only one round function used to design a block cipher and it modifies only one branch out of the 4 branches. We are using one round function to modify one branch using either 1st or 2nd or 3rd branch out of the remaining three branches.I. Only one source branch is used to modify one
target branch (Fig 2).
Figure 2. one source and one target branch.
Figure 3. two source and one target branch.
II. Two source branches are used to modify one target branch (Fig 3).
III. All three source branches are used to modify one target branch (Fig. 4).Two round functions are used in the design and
these two round functions may be the same or different functions. These modify one target branch separately by using one source branch resp. There is only one possibility for this type (Fig. 5).

KuMAr: SOME rESulTS On DESIGn PArAMETErS OF lIGHTWEIGHT BlOCK CIPHErS
83
(ffff ffff 0000 0000) Pr.1 (ffff ffff 0000 0000)
We use r-1 round differential trail of probability 1 to recover the last round subkey of r-round block cipher. We can use these distinguihers to distinguish between the ciphertext obtained from the ciphers using these types of structures and the random data.
4. brAnCh nUMbErKanda [6] has discussed about branch number of
differnet type of functions used in linear layers of round functions. We describe the branch number of the functions used in 4-branch generalised Fesitel and Feistel-M structures. If a functions F takes n bits as input (Ip) and produces n bits as output (Op) as follows:
F: {0,1}n→ {0,1}n
then its branch number β(n)for some non zero input (Ip) is defined as:
min( ) ( ( ) ( ))0, {0,1}N nF Hw Ip Hw Ip
Ip Ipβ = +
≠ ∈
where Hw(Ip) is the number of non zero bits in Input (Ip) and Hw(F(Ip)) is the number of non zero bits in the output (Op) of the function F.
We apply shifts with xores on branches of Feistel by dividing these in some group of bits called nibbles to achieve a better diffusion. Therefore we modify the definition of branch number according to our input and output requirement. We divide n-bit input X and n-bit output Y in m number of nibbles, where each nibble is of fix size b-bit. We redefine the branch number of a function with some non zero input X to the function F, where X consists m nibbles with b bits in each nibble.
Figure 4. three-source and one target branch.
Figure 7. weak design parameter type-i.
Figure 8. weak design parameter type-ii.
Figure 5. two-source and two target branches (resp.).
Figure 6. two-source and two target branches (Feistel-M).
Two round functions are used within F and these two round functions communicate between each other and swap some data between them before processing. This is called Feistel-M structure, a mix between Feistel and generalized Feistel structures (Fig. 6).
3. wEAK dEsiGn PArAMEtErsWe are describing now two design parameters
(Figs. 7 & 8) which are very weak and can be broken easily. If we use two round functions with 2 source braches as input and it uses these branches to modify other two target branches. We also assume that we XOr both the inputs and key materials to produce same size of output.
These type of design structures (Figs. 7 & 8) are prone to full round differential attack. We present differential distinguisher for the above two types of design structures.
Differential distinguisher for type-I structures is:(ffff ffff ffff ffff) Pr.1 (ffff ffff ffff ffff)Differential distinguishers for type-II structures are:(ffff ffff ffff ffff) Pr.1 (ffff ffff ffff ffff)(0000 0000 ffff ffff) Pr.1 (0000 0000 ffff ffff)
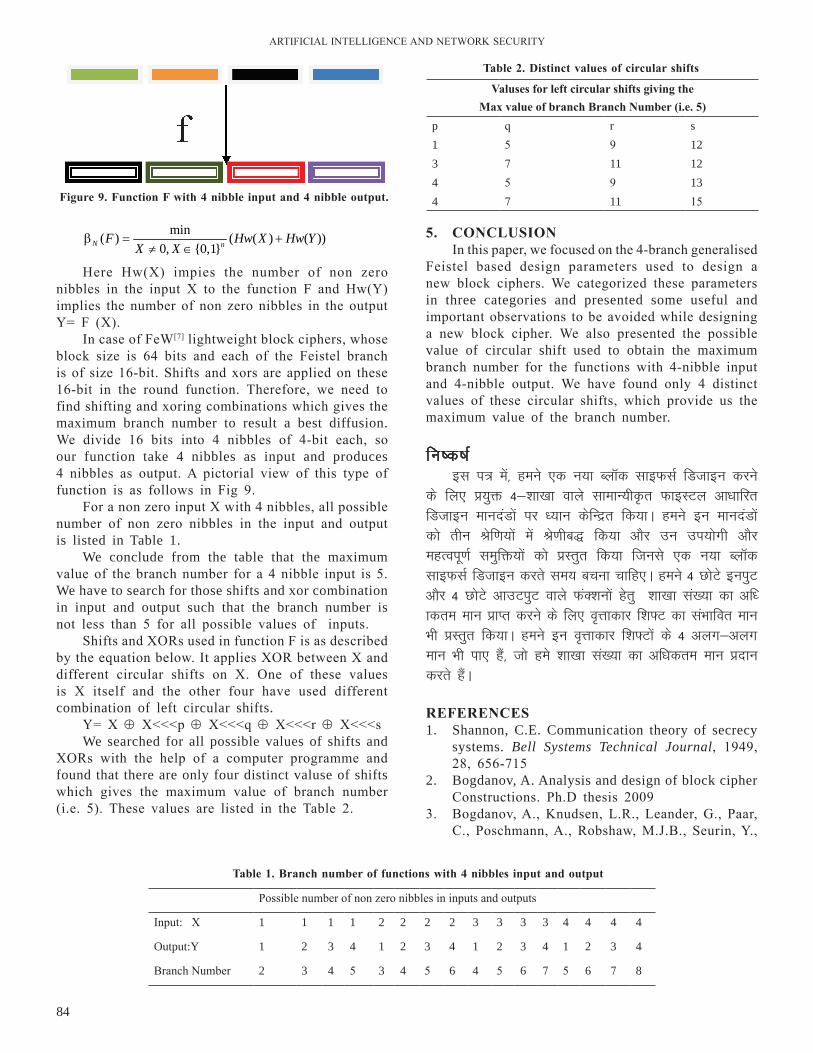
ArTIFICIAl InTEllIGEnCE AnD nETWOrK SECurITY
84
Figure 9. Function F with 4 nibble input and 4 nibble output.
table 1. branch number of functions with 4 nibbles input and output
min( ) ( ( ) ( ))0, {0,1}N nF Hw X Hw Y
X Xβ = +
≠ ∈
Here Hw(X) impies the number of non zero nibbles in the input X to the function F and Hw(Y) implies the number of non zero nibbles in the output Y= F (X).
In case of FeW[7] lightweight block ciphers, whose block size is 64 bits and each of the Feistel branch is of size 16-bit. Shifts and xors are applied on these 16-bit in the round function. Therefore, we need to find shifting and xoring combinations which gives the maximum branch number to result a best diffusion. We divide 16 bits into 4 nibbles of 4-bit each, so our function take 4 nibbles as input and produces 4 nibbles as output. A pictorial view of this type of function is as follows in Fig 9.
For a non zero input X with 4 nibbles, all possible number of non zero nibbles in the input and output is listed in Table 1.
We conclude from the table that the maximum value of the branch number for a 4 nibble input is 5. We have to search for those shifts and xor combination in input and output such that the branch number is not less than 5 for all possible values of inputs.
Shifts and XOrs used in function F is as described by the equation below. It applies XOr between X and different circular shifts on X. One of these values is X itself and the other four have used different combination of left circular shifts.
Y= X ⊕ X<<<p ⊕ X<<<q ⊕ X<<<r ⊕ X<<<sWe searched for all possible values of shifts and
XOrs with the help of a computer programme and found that there are only four distinct valuse of shifts which gives the maximum value of branch number (i.e. 5). These values are listed in the Table 2.
Possible number of non zero nibbles in inputs and outputs
Input: X 1 1 1 1 2 2 2 2 3 3 3 3 4 4 4 4
Output:Y 1 2 3 4 1 2 3 4 1 2 3 4 1 2 3 4
Branch number 2 3 4 5 3 4 5 6 4 5 6 7 5 6 7 8
Valuses for left circular shifts giving theMax value of branch branch number (i.e. 5)
p q r s1 5 9 123 7 11 124 5 9 134 7 11 15
table 2. distinct values of circular shifts
5. ConClUsionIn this paper, we focused on the 4-branch generalised
Feistel based design parameters used to design a new block ciphers. We categorized these parameters in three categories and presented some useful and important observations to be avoided while designing a new block cipher. We also presented the possible value of circular shift used to obtain the maximum branch number for the functions with 4-nibble input and 4-nibble output. We have found only 4 distinct values of these circular shifts, which provide us the maximum value of the branch number.
fu’d’k Zbl i= esa] geus ,d u;k Cy‚d lkbQlZ fMtkbu djus
ds fy, ç;qä 4&'kk[kk okys lkekU;h—r QkbLVy vk/kkfjr fMtkbu ekunaMksa ij /;ku dsfUær fd;kA geus bu ekunaMksa dks rhu Jsf.k;ksa esa Js.khc) fd;k vkSj mu mi;ksxh vkSj egRoiw.kZ leqfä;ksa dks çLrqr fd;k ftuls ,d u;k Cy‚d lkbQlZ fMtkbu djrs le; cpuk pkfg,A geus 4 NksVs buiqV vkSj 4 NksVs vkmViqV okys QaD'kuksa gsrq 'kk[kk la[;k dk vf/kdre eku çkIr djus ds fy, o`Ùkkdkj f'k¶V dk laHkkfor eku Hkh çLrqr fd;kA geus bu o`Ùkkdkj f'k¶Vksa ds 4 vyx&vyx eku Hkh ik, gSa] tks ges 'kk[kk la[;k dk vf/kdre eku çnku djrs gSaA
rEFErEnCEs1. Shannon, C.E. Communication theory of secrecy
systems. Bell Systems Technical Journal, 1949, 28, 656-715
2. Bogdanov, A. Analysis and design of block cipher Constructions. Ph.D thesis 2009
3. Bogdanov, A., Knudsen, l.r., leander, G., Paar, C., Poschmann, A., robshaw, M.J.B., Seurin, Y.,
KuMAr: SOME rESulTS On DESIGn PArAMETErS OF lIGHTWEIGHT BlOCK CIPHErS
85
Vikkelsoe, C.: PrESEnT: An ultra-lightweight Block Cipher. CHES 2007, lnCS, vol. 4727, pp. 450-466.
4. Biham, E., Shamir, A.: Differential Cryptanalysis of DES-like Cryptosystems. Journal of Cryptology, 1991, vol. 4, no. 1, pp. 372,
5. Daemen, J., rijmen, V. The Design of rijndael. Berlin: Springer-Verlag (2002)
6. Kanda, M. Practical security evaluation against differential and linear cryptanalysis for Feistel Ciphers with SPn round Function Kanda. SAC 2000, lnCS 2012, pp. 324-338, Springer-Verlag 2001
7. Kumar, M.; Pal, S.K.; Panigrahi, A.: FeW: A lightweight Block Cipher Cryptology ePrint Archive, report 2014/326, http://eprint.iacr.org
8. Kumar, M., Pal, S.K., Yadav, P.: Mathematical constructs of lightweight block ciphers-A Survey. American Jr. of Mathematics and Sciences, Vol. 2, no. 1, 2013.
9. Knudsen, l., robshaw, MJB: Block cipher companion. Book Springer
10. Matsui, M.: linear cryptanalysis method for des cipher. Advances in Cryptology EurOCrYPT
1993, lnCS 765, pp. 386-397.11. nyberg, K: Perfect nonlinear S-boxes. Eurocrypt
1991, lnCS 547, 199112. Schneier, B., Kelsey, J.: unbalanced Feistel networks
and Block-Cipher Design. FSE 1996, pp. 121-144, 1996
13. Suzaki, T., Minematsu, K., Morioka, S., Kobayashi, E.: Twine: A lightweight, Versatile Blockcipher. ECrYPT Workshop on lightweight Cryptography 2011, http://www.uclouvain.be/crypto/ecrypt lc11/static/post proceedings.pdf. 2011
14. Shirai, T., Shibutani, K., Akishita, T., Moriai, S., Iwata, T.: The 128-bit Block cipher ClEFIA (Extended Abstract), FSE 2007, lnCS, vol. 4593, pp. 181-195.
15. Wu, W., Zhang, l.: lBlock: lightweight Block Cipher. Cryptology ePrint Archive, report 2011/345, http://eprint.iacr.org.
16. Zhang, W., Bao, Z., lin, D., rijmen, V., Yang, B. Verbauwhede, I.: rECTAnGlE: A bitslice ultra-lightweight block cipher for multiple platforms, Cryptology ePrint Archive, report 2014/084, http://eprint.iacr.org.
QTth y‚ftd DokUVe dh fMfLVªC;w'ku Fuzzy logic Quantum Key distribution
C.r. Suthikshn KumarDefence Institute of Advanced Technology, Pune - 411 025, India
E-mail: [email protected]
lkjka”k
DokUVe fØIVksxzkQh cgqr vkd"kZd cu xbZ gS D;ksafd ;g dqath forj.k ds fy, fcuk 'krZ lqj{kk çnku djrh gSA DokUVe fØIVksxzkQh vfHkdyuksa vkSj lapkj ds fy,] tks fØIVksxzkQh ls lacaf/kr gksrs gSa] u, voljksa dh ryk'k djus ds fy, DokUVe eSdsfUdl esa vo/kkj.kkvksa dk mi;ksx djrh gS% çkbe QSDVjkbts'ku ds fy, 'k‚j dk ,y‚xfjn~e vkSj DokUVe dh fMfLVªC;w'ksu ds fy, chch 84 çksVksd‚y dqN çeq[k mnkgj.k gSaA bl i= esa] DokUVe fØIVksxzkQh dh vk/kkjHkwr ckrksa ij ppkZ djus ds ckn] geus uohure fodklksa dh leh{kk dh gS vkSj QTth y‚ftd DokUVe dh fMfLVªC;w'ku ¼,Q,yD;wdsMh½ dks çLrqr fd;k gSA QTth y‚ftd DokUVe dh fMfLVªC;w'ku ¼,Q,yD;wdsMh½ fcV =qfV nj dks de dj nsrk gS vkSj bl çdkj ekfir /#ohdj.k ij vk/kkfjr çkIr fcV~l dks fu/kkZfjr djus esa vfuf'prrk dk fujkdj.k dj nsrk gSA QTth y‚ftd DokUVe dh fMfLVªC;w'ku ¼,Q,yD;wdsMh½ fcuk 'krZ lqj{kk vkSj iw.kZ xksiuh;rk çnku djus ds fy, ,ddkfyd iSM ¼vksVhih½ ds lkFk la;ksftr fd;k tkrk gSA
AbstrAct
quantum cryptography has become very attractive as it offers unconditional security for key distribution. quantum cryptography utilizes the concepts in quantum mechanics for exploring new avenues for computations and communication related to cryptography. Shor’s algorithm for prime factorization and BB84 protocol for quantum key distribution are some prime examples. In this paper, after discussing the basics of quantum cryptography, we review the latest developments and present the Fuzzy logic quantum Key Distrbution (FlqKD). FlqKD reduces bit error rate and hence resolves the uncertainity in determining the received bits based on the measured polarization. The FlqKD is combined with One Time Pad (OTP) to provide unconditional security and perfect secrecy.
Keywords: Fuzzy logic, quantum mechanics, quantum cryptography, key distribution, encryption, decryption, unconditional security, perfect secrecy, otp
Bilingual International Conference on Information Technology: Yesterday, Today, and Tomorrow, 19-21 February 2015, pp. 86-91© DESIDOC, 2015
1. IntroductIonCryptography has benefitted from various fields
such as number Theory, Information Theory, Probability Theory, Complexity Theory, Fractal Theory etc. While pushing the frontiers of research in cryptography, researchers have left no stones unturned. In this direction, modern physics with quantum mechanics has been explored to find possibilities for crypto tasks1. quantum cryptography originated from the use of quantum mechanical effects (i.e., quantum communication and quantum computation). Classical Physics has found extensive applications and resulted in the present day high performance computers and cryptographic algorithms. quantum cryptography has found applications in crypto tasks such as key distribution and prime factoring. However, current applications of quantum computing is limited to these2,4.
The major advantage of quantum cryptography is in providing unconditional security in case of (qKD) and speedup in computation of prime factors of large numbers. The further advances in quantum cryptography can usher in whole new array of cryptographic protocols. While conventional cryptography fails to detect the eavesdropping on the communication channels, quantum cryptography is able to detect eavesdropping in quantum channel5,6. While speech encryption based approaches have been developed for anti-tapping mobile phones9, quantum cryptography would facilitate secure communication with unconditional security.
Current quantum cryptography techniques such as BB84 quantum Key Distribution have several limitations6,7. Fuzzy logic based techniques have been successfully applied for solving several problems with uncertainity10. In this paper we introduce fuzzy
KuMAr: FuZZY lOGIC quAnTuM KEY DISTrIBuTIOn
87
of group physical properties such as position, momentum, spin, polarization, etc. performed on entangled sub-atomic particles are found to be correlated. For example, if a pair of electrons is generated in such a way that their total spin is known to be zero and if one electron is found to have upward spin, then the spin of the other electron, will be found to be downward.quantum computers are based on the principles
of quantum mechanics. They are designed to exploit the quantum mechanics for computing problems which any conventional computer would find it impossible. quantum computers would solve set of computing problems, such as factoring integers, faster than conventional computers. However, for most of the computing problems, quantum computers may not add value. quantum computer uses qubits instead of bits, unlike in a conventional computer. A qubit may be a particle such as an photon or electron whose polarization or spin direction encodes the information. For example, for a photon, the vertical polarization can be used for representing 1, horizontal polarization for representing 0. The quantum states called super-positions that consist of both the states simultaneously. Elementary particles such as photons or electrons in superposition states can carry an enormous amount of information. For example: 100 particles can be in a superposition that represents every number from 1 to 2100 . A quantum computer is designed to manipulate all those numbers concurrently by mechanisms such as lases bombardments. Such designs can operate on the particles, and can solve certain problems such as prime factoring of large number instantaneously.
One of the most striking quantum computing algorithm is the Shor’s Algorithm1. This is a quantum computing algorithm for prime factoring large numbers developed by Peter Shor of MIT. The computational difficulty of prime factoring large numbers is the basis of RSA algorithm. The successful implementation of Shor’s algorithm using quantum computer will threaten the RSA algorithm by making it easy to compute private keys The efficiency of Shor's algorithm is due to the efficiency of the quantum Fourier transform, and modular exponentiation by repeated squarings. However, the factorization requires huge numbers of quantum gates. In 2001, a group at IBM implemented Shor’s algorithm on quantum computer and factored 15 into 3 × 5, using an nMr implementation of a quantum computer with 7 qubits.
3. QUAntUM KEY distribUtionquantum cryptography has been successful with the
development of qKD. qKD uses quantum communication to establish a shared key. The qKD key distribution is highly secure and makes it impossible for the
logic block to facilitate resolution of uncertainity in decision making in qKD. The innovation of combining qKD and fuzzy logic has several benefits such as reduced bit error rates while transmitting the keys over quantum channel.
This paper is structured as follows: we discuss the basic concepts of quantum cryptography in the next section. The key quantum crypto algorithms i.e., Shor’s algorithm and qKD protocols are discussed in section 3. In section 4, further discussion on implementation of qKD protocols is presented. In Section 5, we discuss the fuzzy logic applications in qKD. Summary and conclusions are presented in section 6.
2. QUAntUM CrYPtoGrAPhYquantum cryptography is based on the principles
of quantum mechanics1. quantum mechanics (qM) is a part of modern physics and deals with physical phenomena at sub-atomic particle levels.quantum mechanics provides a theoretical explanation of the dual wave-particle behavior and interactions of energy and matter.
quantum mechanics has been instrumental in explaining various sub-atomic phenomenon and also helpful in development of many new technologies. Some of the important concepts of quantum mechanics which are further useful in discussing quantum cryptography are as follows8:• Uncertainty Principle: This principle states that
the two complementary properties such as positon and momentum of a sub-atomic particle cannot be accurately determined. While one of the properties is measured accurately, there will be uncertainity about the other and vice-versa.
• Wave-Particle Duality: light was earlier thought either to consist of waves or of photons. The current view based on the quantum mechanics is that sub-atomic particles such as photons, electrons, protons etc. also have a wave nature. This phenomenon has been verified not only for elementary particles, but also for compound particles like atoms and even molecules.
• Quantum Super-position: This is a basic principle that holds an elementary sub-atomic particle such as an electron to exist partly in all its particular theoretically possible states (i,e., Spin directions) simultaneously. However, when measured, the result corresponding to only one of the possible states is observed.
• quantum Entanglement: This is a physical phenomenon that occurs when groups of particles are generated or interact in ways such that the quantum state of each particle cannot be described independently. A quantum state may be given for the system as a whole rather than individual particles. Measurements
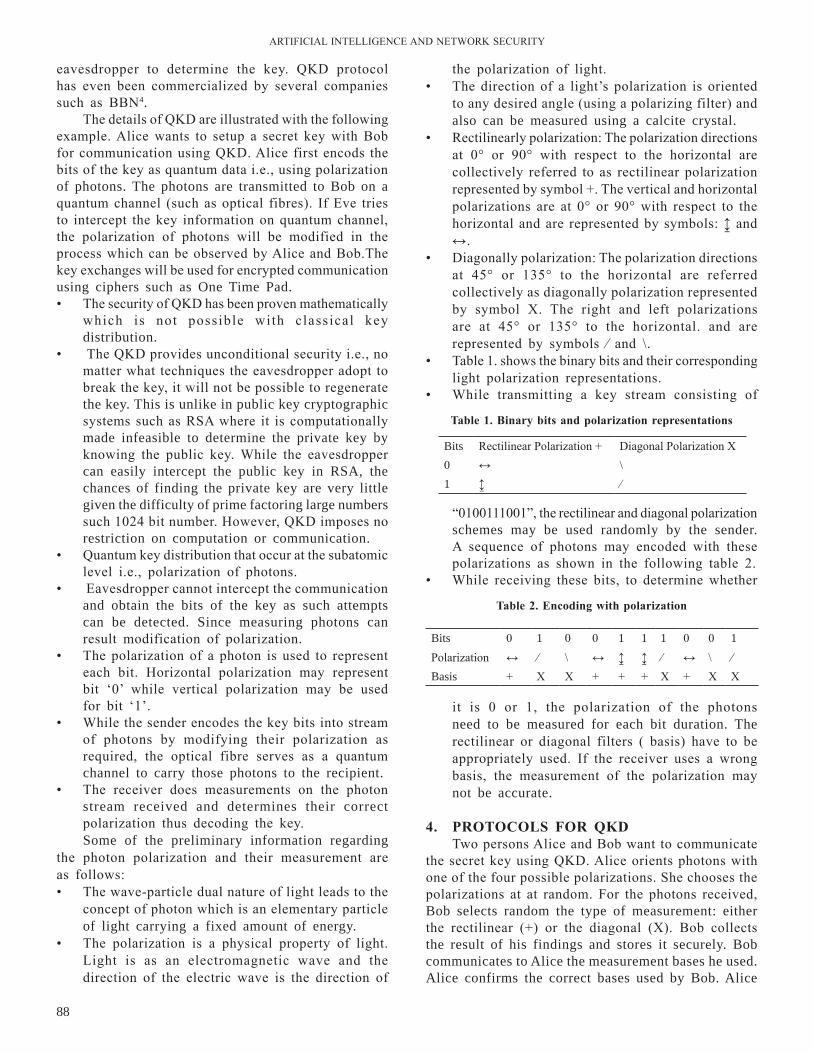
ArTIFICIAl InTEllIGEnCE AnD nETWOrK SECurITY
88
eavesdropper to determine the key. qKD protocol has even been commercialized by several companies such as BBn4.
The details of qKD are illustrated with the following example. Alice wants to setup a secret key with Bob for communication using qKD. Alice first encods the bits of the key as quantum data i.e., using polarization of photons. The photons are transmitted to Bob on a quantum channel (such as optical fibres). If Eve tries to intercept the key information on quantum channel, the polarization of photons will be modified in the process which can be observed by Alice and Bob.The key exchanges will be used for encrypted communication using ciphers such as One Time Pad.• The security of qKD has been proven mathematically
which is not possible with classical key distribution.
• The qKD provides unconditional security i.e., no matter what techniques the eavesdropper adopt to break the key, it will not be possible to regenerate the key. This is unlike in public key cryptographic systems such as rSA where it is computationally made infeasible to determine the private key by knowing the public key. While the eavesdropper can easily intercept the public key in RSA, the chances of finding the private key are very little given the difficulty of prime factoring large numbers such 1024 bit number. However, qKD imposes no restriction on computation or communication.
• quantum key distribution that occur at the subatomic level i.e., polarization of photons.
• Eavesdropper cannot intercept the communication and obtain the bits of the key as such attempts can be detected. Since measuring photons can result modification of polarization.
• The polarization of a photon is used to represent each bit. Horizontal polarization may represent bit ‘0’ while vertical polarization may be used for bit ‘1’.
• While the sender encodes the key bits into stream of photons by modifying their polarization as required, the optical fibre serves as a quantum channel to carry those photons to the recipient.
• The receiver does measurements on the photon stream received and determines their correct polarization thus decoding the key. Some of the preliminary information regarding
the photon polarization and their measurement are as follows:• The wave-particle dual nature of light leads to the
concept of photon which is an elementary particle of light carrying a fixed amount of energy.
• The polarization is a physical property of light. light is as an electromagnetic wave and the direction of the electric wave is the direction of
the polarization of light. • The direction of a light’s polarization is oriented
to any desired angle (using a polarizing filter) and also can be measured using a calcite crystal.
• rectilinearly polarization: The polarization directions at 0° or 90° with respect to the horizontal are collectively referred to as rectilinear polarization represented by symbol +. The vertical and horizontal polarizations are at 0° or 90° with respect to the horizontal and are represented by symbols: ↨ and ↔.
• Diagonally polarization: The polarization directions at 45° or 135° to the horizontal are referred collectively as diagonally polarization represented by symbol X. The right and left polarizations are at 45° or 135° to the horizontal. and are represented by symbols ⁄ and \.
• Table 1. shows the binary bits and their corresponding light polarization representations.
• While transmitting a key stream consisting of
“0100111001”, the rectilinear and diagonal polarization schemes may be used randomly by the sender. A sequence of photons may encoded with these polarizations as shown in the following table 2.
• While receiving these bits, to determine whether
it is 0 or 1, the polarization of the photons need to be measured for each bit duration. The rectilinear or diagonal filters ( basis) have to be appropriately used. If the receiver uses a wrong basis, the measurement of the polarization may not be accurate.
4. ProtoCols For QKdTwo persons Alice and Bob want to communicate
the secret key using qKD. Alice orients photons with one of the four possible polarizations. She chooses the polarizations at at random. For the photons received, Bob selects random the type of measurement: either the rectilinear (+) or the diagonal (X). Bob collects the result of his findings and stores it securely. Bob communicates to Alice the measurement bases he used. Alice confirms the correct bases used by Bob. Alice
Bits rectilinear Polarization + Diagonal Polarization X0 ↔ \1 ↨ ⁄
table 1. binary bits and polarization representations
Bits 0 1 0 0 1 1 1 0 0 1Polarization ↔ ⁄ \ ↔ ↨ ↨ ⁄ ↔ \ ⁄Basis + X X + + + X + X X
table 2. Encoding with polarization
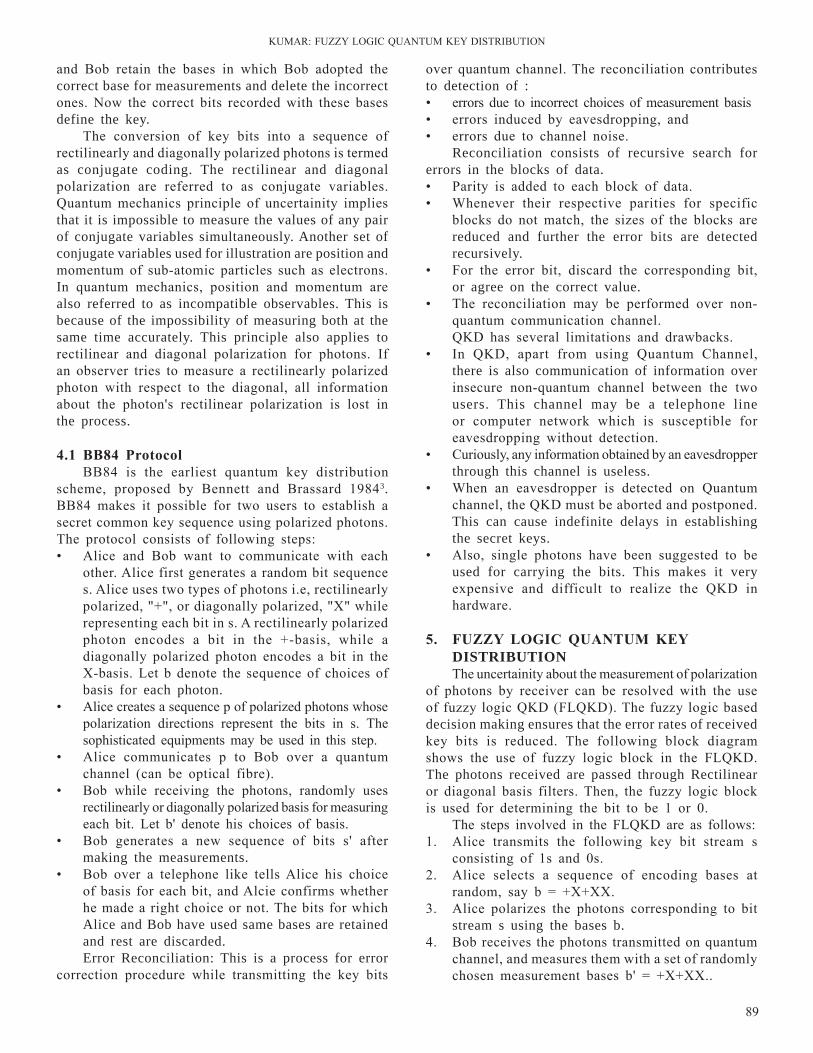
KuMAr: FuZZY lOGIC quAnTuM KEY DISTrIBuTIOn
89
and Bob retain the bases in which Bob adopted the correct base for measurements and delete the incorrect ones. now the correct bits recorded with these bases define the key.
The conversion of key bits into a sequence of rectilinearly and diagonally polarized photons is termed as conjugate coding. The rectilinear and diagonal polarization are referred to as conjugate variables. quantum mechanics principle of uncertainity implies that it is impossible to measure the values of any pair of conjugate variables simultaneously. Another set of conjugate variables used for illustration are position and momentum of sub-atomic particles such as electrons. In quantum mechanics, position and momentum are also referred to as incompatible observables. This is because of the impossibility of measuring both at the same time accurately. This principle also applies to rectilinear and diagonal polarization for photons. If an observer tries to measure a rectilinearly polarized photon with respect to the diagonal, all information about the photon's rectilinear polarization is lost in the process.
4.1 bb84 ProtocolBB84 is the earliest quantum key distribution
scheme, proposed by Bennett and Brassard 19843. BB84 makes it possible for two users to establish a secret common key sequence using polarized photons. The protocol consists of following steps:• Alice and Bob want to communicate with each
other. Alice first generates a random bit sequence s. Alice uses two types of photons i.e, rectilinearly polarized, "+", or diagonally polarized, "X" while representing each bit in s. A rectilinearly polarized photon encodes a bit in the +-basis, while a diagonally polarized photon encodes a bit in the X-basis. let b denote the sequence of choices of basis for each photon.
• Alice creates a sequence p of polarized photons whose polarization directions represent the bits in s. The sophisticated equipments may be used in this step.
• Alice communicates p to Bob over a quantum channel (can be optical fibre).
• Bob while receiving the photons, randomly uses rectilinearly or diagonally polarized basis for measuring each bit. let b' denote his choices of basis.
• Bob generates a new sequence of bits s' after making the measurements.
• Bob over a telephone like tells Alice his choice of basis for each bit, and Alcie confirms whether he made a right choice or not. The bits for which Alice and Bob have used same bases are retained and rest are discarded. Error Reconciliation: This is a process for error
correction procedure while transmitting the key bits
over quantum channel. The reconciliation contributes to detection of :• errors due to incorrect choices of measurement basis • errors induced by eavesdropping, and• errors due to channel noise.
Reconciliation consists of recursive search for errors in the blocks of data. • Parity is added to each block of data.• Whenever their respective parities for specific
blocks do not match, the sizes of the blocks are reduced and further the error bits are detected recursively.
• For the error bit, discard the corresponding bit, or agree on the correct value.
• The reconciliation may be performed over non-quantum communication channel. qKD has several limitations and drawbacks.
• In qKD, apart from using quantum Channel, there is also communication of information over insecure non-quantum channel between the two users. This channel may be a telephone line or computer network which is susceptible for eavesdropping without detection.
• Curiously, any information obtained by an eavesdropper through this channel is useless.
• When an eavesdropper is detected on quantum channel, the qKD must be aborted and postponed. This can cause indefinite delays in establishing the secret keys.
• Also, single photons have been suggested to be used for carrying the bits. This makes it very expensive and difficult to realize the qKD in hardware.
5. FUzzY loGiC QUAntUM KEY dIstrIbutIonThe uncertainity about the measurement of polarization
of photons by receiver can be resolved with the use of fuzzy logic qKD (FlqKD). The fuzzy logic based decision making ensures that the error rates of received key bits is reduced. The following block diagram shows the use of fuzzy logic block in the FlqKD. The photons received are passed through Rectilinear or diagonal basis filters. Then, the fuzzy logic block is used for determining the bit to be 1 or 0.
The steps involved in the FlqKD are as follows:1. Alice transmits the following key bit stream s
consisting of 1s and 0s. 2. Alice selects a sequence of encoding bases at
random, say b = +X+XX. 3. Alice polarizes the photons corresponding to bit
stream s using the bases b.4. Bob receives the photons transmitted on quantum
channel, and measures them with a set of randomly chosen measurement bases b' = +X+XX..
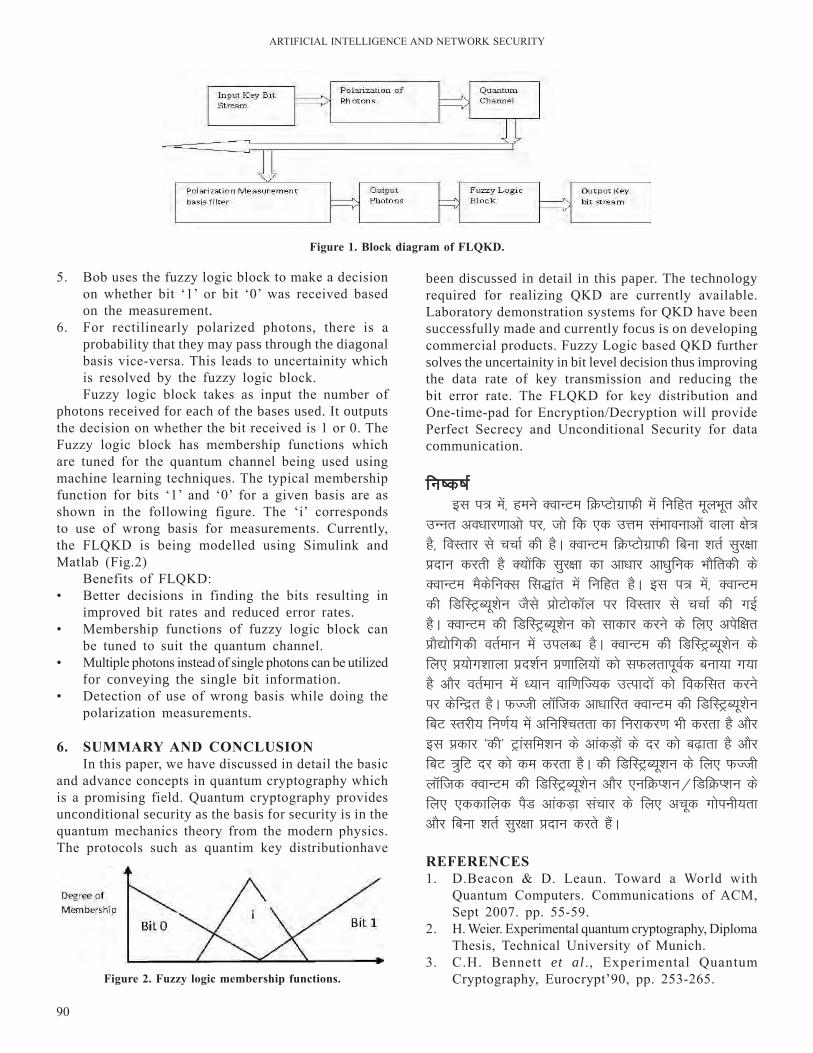
ArTIFICIAl InTEllIGEnCE AnD nETWOrK SECurITY
90
been discussed in detail in this paper. The technology required for realizing qKD are currently available. laboratory demonstration systems for qKD have been successfully made and currently focus is on developing commercial products. Fuzzy logic based qKD further solves the uncertainity in bit level decision thus improving the data rate of key transmission and reducing the bit error rate. The FlqKD for key distribution and One-time-pad for Encryption/Decryption will provide Perfect Secrecy and unconditional Security for data communication.
fu’d’k Zbl i= esa] geus DokUVe fØIVksxzkQh esa fufgr ewyHkwr vkSj
mUur vo/kkj.kkvks ij] tks fd ,d mÙke laHkkoukvksa okyk {ks= gS] foLrkj ls ppkZ dh gSA DokUVe fØIVksxzkQh fcuk 'krZ lqj{kk çnku djrh gS D;ksafd lqj{kk dk vk/kkj vk/kqfud HkkSfrdh ds DokUVe eSdsfuDl fl)kar esa fufgr gSA bl i= esa] DokUVe dh fMfLVªC;w'ksu tSls çksVksd‚y ij foLrkj ls ppkZ dh xbZ gSA DokUVe dh fMfLVªC;w'ksu dks lkdkj djus ds fy, visf{kr çkS|ksfxdh orZeku esa miyC/k gSA DokUVe dh fMfLVªC;w'ksu ds fy, ç;ksx'kkyk çn'kZu ç.kkfy;ksa dks lQyrkiwoZd cuk;k x;k gS vkSj orZeku esa /;ku okf.kfT;d mRiknksa dks fodflr djus ij dsfUær gSA QTth y‚ftd vk/kkfjr DokUVe dh fMfLVªC;w'ksu fcV Lrjh; fu.kZ; esa vfuf'prrk dk fujkdj.k Hkh djrk gS vkSj bl çdkj ^dh* Vªkalfe'ku ds vkadM+ksa ds nj dks c<+krk gS vkSj fcV =qfV nj dks de djrk gSA dh fMfLVªC;w'ku ds fy, QTth y‚ftd DokUVe dh fMfLVªC;w'ksu vkSj ,ufØI'ku@fMfØI'ku ds fy, ,ddkfyd iSM vkadM+k lapkj ds fy, vpwd xksiuh;rk vkSj fcuk 'krZ lqj{kk çnku djrs gSaA
rEFErEnCEs1. D.Beacon & D. leaun. Toward a World with
quantum Computers. Communications of ACM, Sept 2007. pp. 55-59.
2. H. Weier. Experimental quantum cryptography, Diploma Thesis, Technical university of Munich.
3. C.H. Bennett et al., Experimental quantum Cryptography, Eurocrypt’90, pp. 253-265.
Figure 1. block diagram of FlQKd.
5. Bob uses the fuzzy logic block to make a decision on whether bit ‘1’ or bit ‘0’ was received based on the measurement.
6. For rectilinearly polarized photons, there is a probability that they may pass through the diagonal basis vice-versa. This leads to uncertainity which is resolved by the fuzzy logic block.Fuzzy logic block takes as input the number of
photons received for each of the bases used. It outputs the decision on whether the bit received is 1 or 0. The Fuzzy logic block has membership functions which are tuned for the quantum channel being used using machine learning techniques. The typical membership function for bits ‘1’ and ‘0’ for a given basis are as shown in the following figure. The ‘i’ corresponds to use of wrong basis for measurements. Currently, the FlqKD is being modelled using Simulink and Matlab (Fig.2)
Benefits of FlqKD:• Better decisions in finding the bits resulting in
improved bit rates and reduced error rates.• Membership functions of fuzzy logic block can
be tuned to suit the quantum channel. • Multiple photons instead of single photons can be utilized
for conveying the single bit information.• Detection of use of wrong basis while doing the
polarization measurements.
6. sUMMArY And ConClUsionIn this paper, we have discussed in detail the basic
and advance concepts in quantum cryptography which is a promising field. quantum cryptography provides unconditional security as the basis for security is in the quantum mechanics theory from the modern physics. The protocols such as quantim key distributionhave
Figure 2. Fuzzy logic membership functions.

KuMAr: FuZZY lOGIC quAnTuM KEY DISTrIBuTIOn
91
4. C. Elliott, quantum Cryptography, IEEE Security and Privacy, July/Aug 2004. pp. 57-61.
5. n. Gisin,et al., quantum Cryptography, reviews of Modern Physics, 2002. 74, pp. 145-192.
6. M.S. Sharbaf. quantum cryptography: A new generation of information technology security system, In Proc of 2009 Sixth International Conference on Information Technology, pp. 1644- 1648.
7. S. Aronson. limits of quantum, scientific American, March 2008, pp. 62-69.
8. S. Singh. Code Book: The Science of Secrecy from Ancient Egypt to quantum Cryptography, Anchor Books, 1999.
9. C.r.S. Kumar. Speech Encryption based Anti-Tapping Device, AES 135th Convention, new York, Oct 2013.
10. C.r.S. Kumar, Smart Volume Tuner for Cellular Phones, IEEE Wireless Communications Magazine, June 2004.
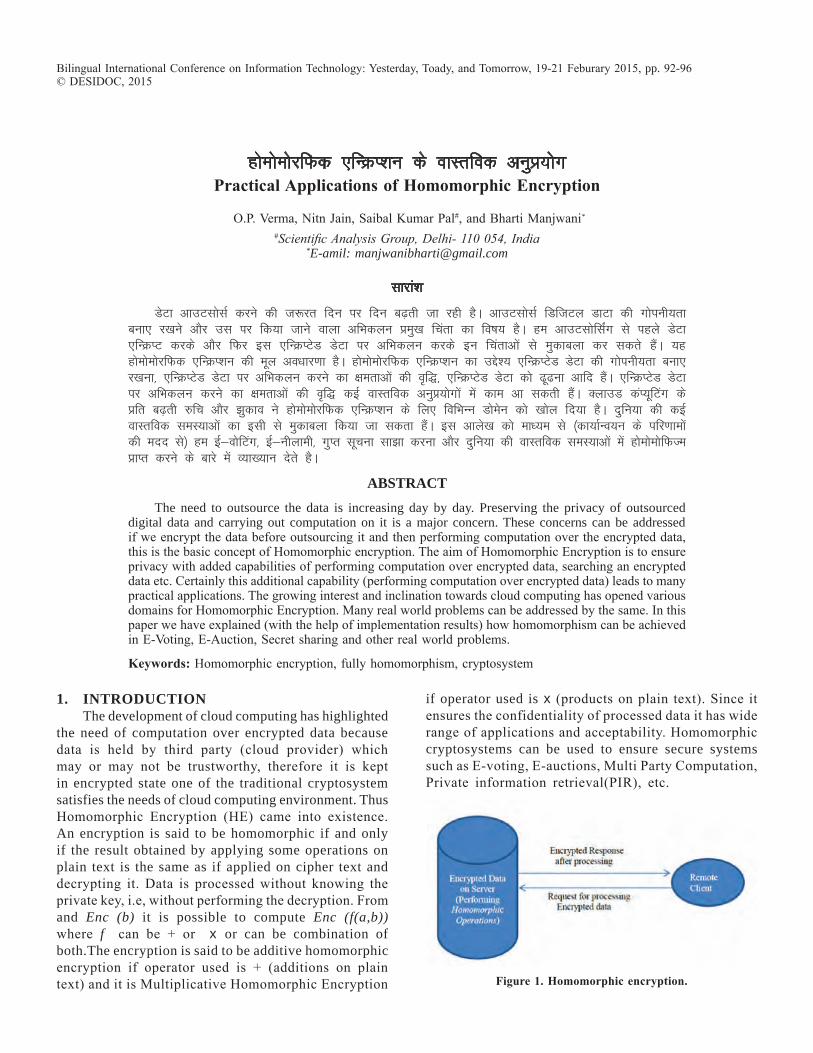
gksekseksjfQd ,fUØI”ku ds okLrfod vuqç;ksxPractical Applications of homomorphic Encryption
O.P. Verma, nitn Jain, Saibal Kumar Pal#, and Bharti Manjwani*
#Scientific Analysis Group, Delhi- 110 054, India *E-amil: [email protected]
lkjka”k
MsVk vkmVlkslZ djus dh t:jr fnu ij fnu c<+rh tk jgh gSA vkmVlkslZ fMftVy MkVk dh xksiuh;rk cuk, j[kus vkSj ml ij fd;k tkus okyk vfHkdyu çeq[k fpark dk fo’k; gSA ge vkmVlksflaZx ls igys MsVk ,fUØIV djds vkSj fQj bl ,fUØIVsM MsVk ij vfHkdyu djds bu fparkvksa ls eqdkcyk dj ldrs gSaA ;g gksekseksjfQd ,fUØI”ku dh ewy vo/kkj.kk gSA gksekseksjfQd ,fUØI”ku dk mís”; ,fUØIVsM MsVk dh xksiuh;rk cuk, j[kuk] ,fUØIVsM MsVk ij vfHkdyu djus dk {kerkvksa dh o`f)] ,fUØIVsM MsVk dks <w<uk vkfn gSaA ,fUØIVsM MsVk ij vfHkdyu djus dk {kerkvksa dh o`f) dbZ okLrfod vuqç;ksxksa esa dke vk ldrh gSaA DykmM daI;wfVax ds çfr c<+rh #fp vkSj >qdko us gksekseksjfQd ,fUØI”ku ds fy, fofHkUu Mksesu dks [kksy fn;k gSA nqfu;k dh dbZ okLrfod leL;kvksa dk blh ls eqdkcyk fd;k tk ldrk gSaA bl vkys[k dks ek/;e ls ¼dk;kZUo;u ds ifj.kkeksa dh enn ls½ ge bZ&oksfVax] bZ&uhykeh] xqIr lwpuk lk>k djuk vkSj nqfu;k dh okLrfod leL;kvksa esa gksekseksfQTe çkIr djus ds ckjs esa O;k[;ku nsrs gSA
AbstrActThe need to outsource the data is increasing day by day. Preserving the privacy of outsourced
digital data and carrying out computation on it is a major concern. These concerns can be addressed if we encrypt the data before outsourcing it and then performing computation over the encrypted data, this is the basic concept of Homomorphic encryption. The aim of Homomorphic Encryption is to ensure privacy with added capabilities of performing computation over encrypted data, searching an encrypted data etc. Certainly this additional capability (performing computation over encrypted data) leads to many practical applications. The growing interest and inclination towards cloud computing has opened various domains for Homomorphic Encryption. Many real world problems can be addressed by the same. In this paper we have explained (with the help of implementation results) how homomorphism can be achieved in E-Voting, E-Auction, Secret sharing and other real world problems.
Keywords: Homomorphic encryption, fully homomorphism, cryptosystem
Bilingual International Conference on Information Technology: Yesterday, Toady, and Tomorrow, 19-21 Feburary 2015, pp. 92-96 © DESIDOC, 2015
1. IntroductIonThe development of cloud computing has highlighted
the need of computation over encrypted data because data is held by third party (cloud provider) which may or may not be trustworthy, therefore it is kept in encrypted state one of the traditional cryptosystem satisfies the needs of cloud computing environment. Thus Homomorphic Encryption (HE) came into existence. An encryption is said to be homomorphic if and only if the result obtained by applying some operations on plain text is the same as if applied on cipher text and decrypting it. Data is processed without knowing the private key, i.e, without performing the decryption. From and Enc (b) it is possible to compute Enc (f(a,b)) where f can be + or x or can be combination of both.The encryption is said to be additive homomorphic encryption if operator used is + (additions on plain text) and it is Multiplicative Homomorphic Encryption
if operator used is x (products on plain text). Since it ensures the confidentiality of processed data it has wide range of applications and acceptability. Homomorphic cryptosystems can be used to ensure secure systems such as E-voting, E-auctions, Multi Party Computation, Private information retrieval(PIr), etc.
Figure 1. homomorphic encryption.
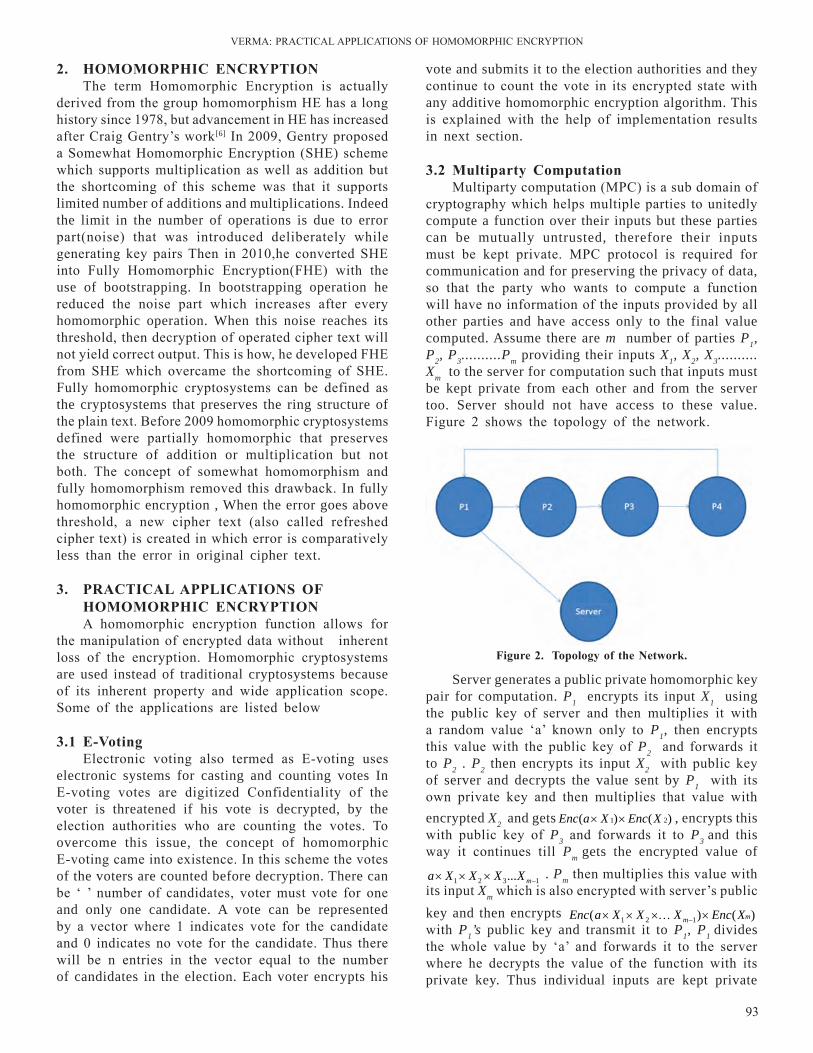
VErMA: PrACTICAl APPlICATIOnS OF HOMOMOrPHIC EnCrYPTIOn
93
vote and submits it to the election authorities and they continue to count the vote in its encrypted state with any additive homomorphic encryption algorithm. This is explained with the help of implementation results in next section.
3.2 Multiparty ComputationMultiparty computation (MPC) is a sub domain of
cryptography which helps multiple parties to unitedly compute a function over their inputs but these parties can be mutually untrusted, therefore their inputs must be kept private. MPC protocol is required for communication and for preserving the privacy of data, so that the party who wants to compute a function will have no information of the inputs provided by all other parties and have access only to the final value computed. Assume there are m number of parties P1, P2, P3..........Pm providing their inputs X1, X2, X3..........Xm to the server for computation such that inputs must be kept private from each other and from the server too. Server should not have access to these value. Figure 2 shows the topology of the network.
2. hoMoMorPhiC EnCrYPtionThe term Homomorphic Encryption is actually
derived from the group homomorphism HE has a long history since 1978, but advancement in HE has increased after Craig Gentry’s work[6] In 2009, Gentry proposed a Somewhat Homomorphic Encryption (SHE) scheme which supports multiplication as well as addition but the shortcoming of this scheme was that it supports limited number of additions and multiplications. Indeed the limit in the number of operations is due to error part(noise) that was introduced deliberately while generating key pairs Then in 2010,he converted SHE into Fully Homomorphic Encryption(FHE) with the use of bootstrapping. In bootstrapping operation he reduced the noise part which increases after every homomorphic operation. When this noise reaches its threshold, then decryption of operated cipher text will not yield correct output. This is how, he developed FHE from SHE which overcame the shortcoming of SHE. Fully homomorphic cryptosystems can be defined as the cryptosystems that preserves the ring structure of the plain text. Before 2009 homomorphic cryptosystems defined were partially homomorphic that preserves the structure of addition or multiplication but not both. The concept of somewhat homomorphism and fully homomorphism removed this drawback. In fully homomorphic encryption , When the error goes above threshold, a new cipher text (also called refreshed cipher text) is created in which error is comparatively less than the error in original cipher text.
3. PrACtiCAl APPliCAtions oF hoMoMorPhiC EnCrYPtionA homomorphic encryption function allows for
the manipulation of encrypted data without inherent loss of the encryption. Homomorphic cryptosystems are used instead of traditional cryptosystems because of its inherent property and wide application scope. Some of the applications are listed below
3.1 E-VotingElectronic voting also termed as E-voting uses
electronic systems for casting and counting votes In E-voting votes are digitized Confidentiality of the voter is threatened if his vote is decrypted, by the election authorities who are counting the votes. To overcome this issue, the concept of homomorphic E-voting came into existence. In this scheme the votes of the voters are counted before decryption. There can be ‘ ’ number of candidates, voter must vote for one and only one candidate. A vote can be represented by a vector where 1 indicates vote for the candidate and 0 indicates no vote for the candidate. Thus there will be n entries in the vector equal to the number of candidates in the election. Each voter encrypts his
Figure 2. topology of the network.
Server generates a public private homomorphic key pair for computation. P1 encrypts its input X1 using the public key of server and then multiplies it with a random value ‘a’ known only to P1, then encrypts this value with the public key of P2 and forwards it to P2 . P2 then encrypts its input X2 with public key of server and decrypts the value sent by P1 with its own private key and then multiplies that value with encrypted X2 and gets 1 2( ) ( )Enc a X Enc X× × , encrypts this with public key of P3 and forwards it to P3 and this way it continues till Pm gets the encrypted value of
1 2 3 1... ma X X X X −× ×× . Pm then multiplies this value with its input Xm which is also encrypted with server’s public key and then encrypts
1 2 1 )( ) ( mm EnEnc X X ca XX −× …× × × with P1’s public key and transmit it to P1, P1 divides the whole value by ‘a’ and forwards it to the server where he decrypts the value of the function with its private key. Thus individual inputs are kept private
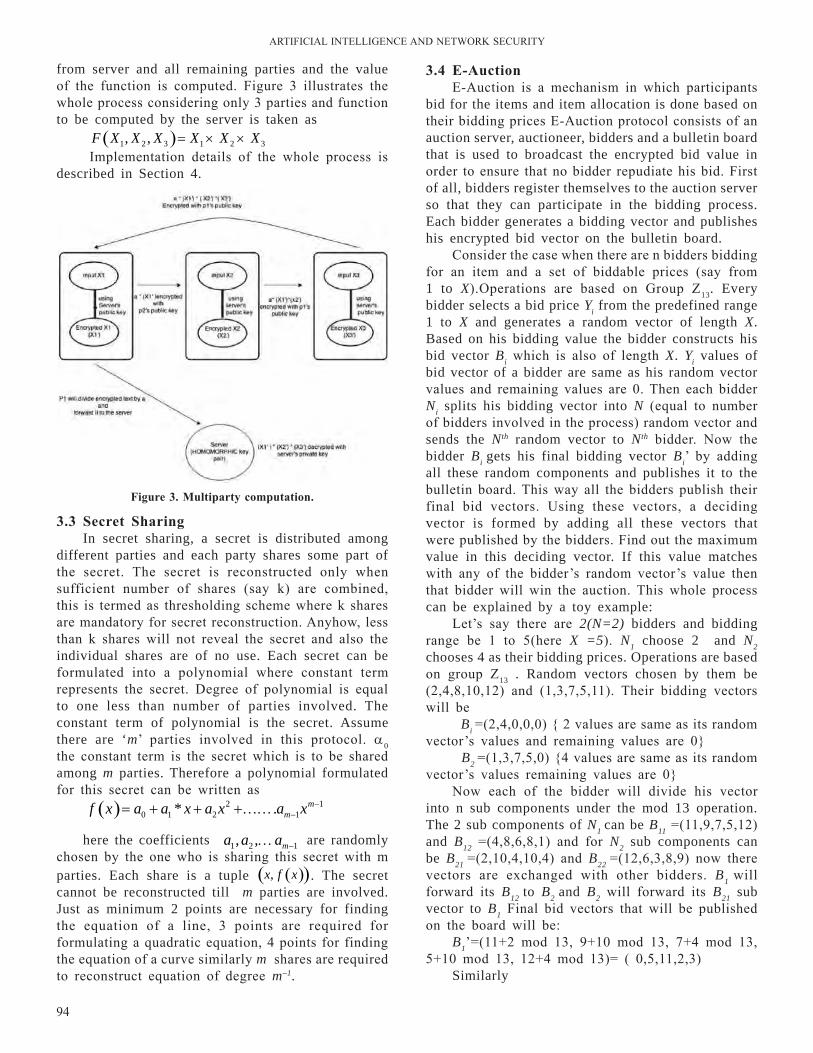
ArTIFICIAl InTEllIGEnCE AnD nETWOrK SECurITY
94
from server and all remaining parties and the value of the function is computed. Figure 3 illustrates the whole process considering only 3 parties and function to be computed by the server is taken as
( )1 2 3 1 2 3, , F X X X X X X× ×= Implementation details of the whole process is
described in Section 4.
3.4 E-AuctionE-Auction is a mechanism in which participants
bid for the items and item allocation is done based on their bidding prices E-Auction protocol consists of an auction server, auctioneer, bidders and a bulletin board that is used to broadcast the encrypted bid value in order to ensure that no bidder repudiate his bid. First of all, bidders register themselves to the auction server so that they can participate in the bidding process. Each bidder generates a bidding vector and publishes his encrypted bid vector on the bulletin board.
Consider the case when there are n bidders bidding for an item and a set of biddable prices (say from 1 to X).Operations are based on Group Z13. Every bidder selects a bid price Yi from the predefined range 1 to X and generates a random vector of length X. Based on his bidding value the bidder constructs his bid vector Bi which is also of length X. Yi values of bid vector of a bidder are same as his random vector values and remaining values are 0. Then each bidder Ni splits his bidding vector into N (equal to number of bidders involved in the process) random vector and sends the Nth random vector to Nth bidder. now the bidder Bi gets his final bidding vector Bi’ by adding all these random components and publishes it to the bulletin board. This way all the bidders publish their final bid vectors. using these vectors, a deciding vector is formed by adding all these vectors that were published by the bidders. Find out the maximum value in this deciding vector. If this value matches with any of the bidder’s random vector’s value then that bidder will win the auction. This whole process can be explained by a toy example:
let’s say there are 2(N=2) bidders and bidding range be 1 to 5(here X =5). N1 choose 2 and N2 chooses 4 as their bidding prices. Operations are based on group Z13 . Random vectors chosen by them be (2,4,8,10,12) and (1,3,7,5,11). Their bidding vectors will be
Bi =(2,4,0,0,0) { 2 values are same as its random vector’s values and remaining values are 0}
B2 =(1,3,7,5,0) {4 values are same as its random vector’s values remaining values are 0}
now each of the bidder will divide his vector into n sub components under the mod 13 operation. The 2 sub components of N1 can be B11 =(11,9,7,5,12) and B12 =(4,8,6,8,1) and for N2 sub components can be B21 =(2,10,4,10,4) and B22 =(12,6,3,8,9) now there vectors are exchanged with other bidders. B1 will forward its B12 to B2 and B2 will forward its B21 sub vector to B1 Final bid vectors that will be published on the board will be:
B1’=(11+2 mod 13, 9+10 mod 13, 7+4 mod 13, 5+10 mod 13, 12+4 mod 13)= ( 0,5,11,2,3)
Similarly
Figure 3. Multiparty computation.
3.3 secret sharingIn secret sharing, a secret is distributed among
different parties and each party shares some part of the secret. The secret is reconstructed only when sufficient number of shares (say k) are combined, this is termed as thresholding scheme where k shares are mandatory for secret reconstruction. Anyhow, less than k shares will not reveal the secret and also the individual shares are of no use. Each secret can be formulated into a polynomial where constant term represents the secret. Degree of polynomial is equal to one less than number of parties involved. The constant term of polynomial is the secret. Assume there are ‘m’ parties involved in this protocol. a0 the constant term is the secret which is to be shared among m parties. Therefore a polynomial formulated for this secret can be written as
( ) 2 10 1 2 1 * . m
mf x a a x a x a x −−= + + +……
here the coefficients 1 2 1, , ma a a −… are randomly chosen by the one who is sharing this secret with m parties. Each share is a tuple ( )( ),x f x . The secret cannot be reconstructed till m parties are involved. Just as minimum 2 points are necessary for finding the equation of a line, 3 points are required for formulating a quadratic equation, 4 points for finding the equation of a curve similarly m shares are required to reconstruct equation of degree m–1.
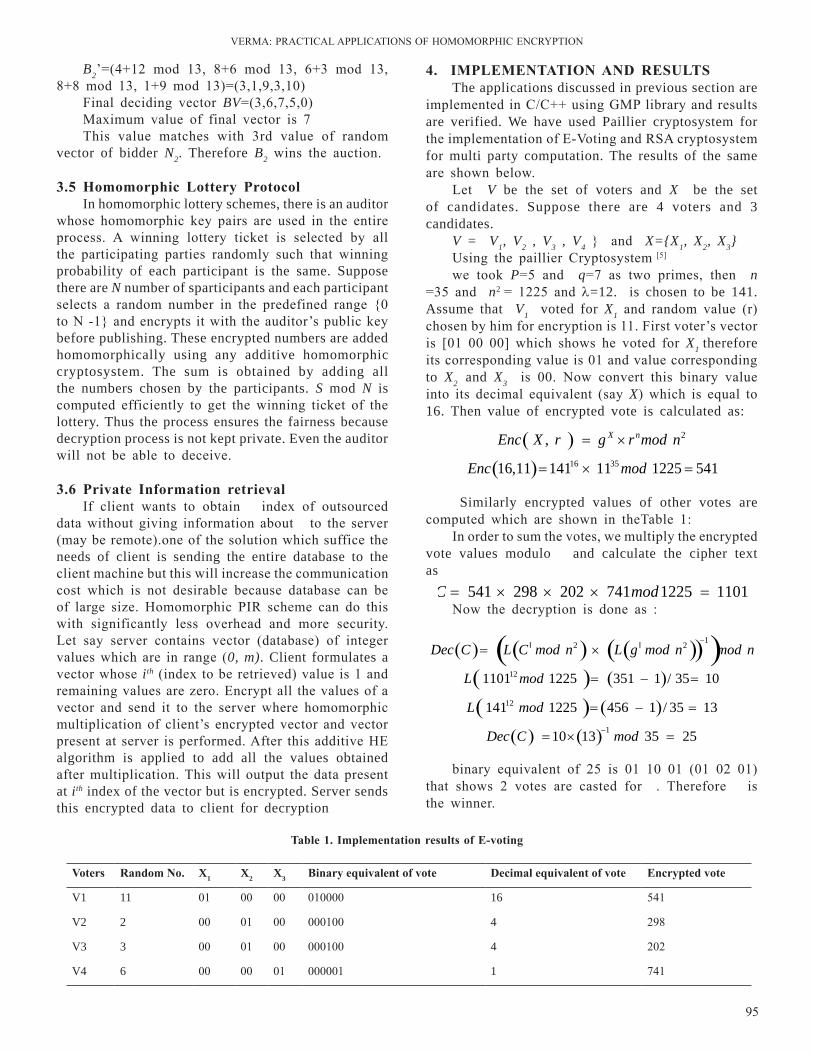
VErMA: PrACTICAl APPlICATIOnS OF HOMOMOrPHIC EnCrYPTIOn
95
4. iMPlEMEntAtion And rEsUltsThe applications discussed in previous section are
implemented in C/C++ using GMP library and results are verified. We have used Paillier cryptosystem for the implementation of E-Voting and rSA cryptosystem for multi party computation. The results of the same are shown below.
let V be the set of voters and X be the set of candidates. Suppose there are 4 voters and 3 candidates.
V = V1, V2 , V3 , V4 } and X={X1, X2, X3} using the paillier Cryptosystem [5]
we took P=5 and q=7 as two primes, then n =35 and n2 = 1225 and l=12. is chosen to be 141. Assume that V1 voted for X1 and random value (r) chosen by him for encryption is 11. First voter’s vector is [01 00 00] which shows he voted for X1 therefore its corresponding value is 01 and value corresponding to X2 and X3 is 00. now convert this binary value into its decimal equivalent (say X) which is equal to 16. Then value of encrypted vote is calculated as:
( ) 2 , X nEnc X r g r mod n×=
( ) 16 35 16,11 141 11 1225 541Enc mod= =× Similarly encrypted values of other votes are
computed which are shown in theTable 1:In order to sum the votes, we multiply the encrypted
vote values modulo and calculate the cipher text as 541 298 202 741 1 225 1101C mod= × × × =
now the decryption is done as :
( ) ( ) ( )( )( )12 2 Dec C L C mod n L g mod n mod nll−
= ×
( ) ( )12 1101 1225 351 – 1 35 0/ 1L mod = =
( ) ( )12 141 1225 456 1 / 35 13L mod = − =
( ) ( ) 1 10 13 35 25Dec C mod−= × =
binary equivalent of 25 is 01 10 01 (01 02 01) that shows 2 votes are casted for . Therefore is the winner.
B2’=(4+12 mod 13, 8+6 mod 13, 6+3 mod 13, 8+8 mod 13, 1+9 mod 13)=(3,1,9,3,10)
Final deciding vector BV=(3,6,7,5,0)Maximum value of final vector is 7This value matches with 3rd value of random
vector of bidder N2. Therefore B2 wins the auction.
3.5 homomorphic lottery ProtocolIn homomorphic lottery schemes, there is an auditor
whose homomorphic key pairs are used in the entire process. A winning lottery ticket is selected by all the participating parties randomly such that winning probability of each participant is the same. Suppose there are N number of sparticipants and each participant selects a random number in the predefined range {0 to n -1} and encrypts it with the auditor’s public key before publishing. These encrypted numbers are added homomorphically using any additive homomorphic cryptosystem. The sum is obtained by adding all the numbers chosen by the participants. S mod N is computed efficiently to get the winning ticket of the lottery. Thus the process ensures the fairness because decryption process is not kept private. Even the auditor will not be able to deceive.
3.6 Private information retrievalIf client wants to obtain index of outsourced
data without giving information about to the server (may be remote).one of the solution which suffice the needs of client is sending the entire database to the client machine but this will increase the communication cost which is not desirable because database can be of large size. Homomorphic PIr scheme can do this with significantly less overhead and more security. let say server contains vector (database) of integer values which are in range (0, m). Client formulates a vector whose ith (index to be retrieved) value is 1 and remaining values are zero. Encrypt all the values of a vector and send it to the server where homomorphic multiplication of client’s encrypted vector and vector present at server is performed. After this additive HE algorithm is applied to add all the values obtained after multiplication. This will output the data present at ith index of the vector but is encrypted. Server sends this encrypted data to client for decryption
Voters random no. X1 X2 X3 binary equivalent of vote decimal equivalent of vote Encrypted vote
V1 11 01 00 00 010000 16 541
V2 2 00 01 00 000100 4 298
V3 3 00 01 00 000100 4 202
V4 6 00 00 01 000001 1 741
table 1. implementation results of E-voting

ArTIFICIAl InTEllIGEnCE AnD nETWOrK SECurITY
96
4.2 Multiparty ComputationWe present here a toy example using RSA cryptosystem
(multiplicative homomorphism) to illustrate the whole process. Considering there are 3 parties which are providing their data to the server for computation. let P be a vector containing data of all the parties that includes randomly selected 2 prime numbers, public key and the private key.
P = { 1st prime number, 2nd prime number, public key, private key}
The public key and private key selected by all the 3 parties and the server using RSA cryptosystem[7] are:
P1 = {7, 19, 37, 73}P2 = {23, 29, 47, 367}P3 = {11, 31, 71, 131}S = {11, 17, 23, 7}Function to be computed by the server is
( )1 2 3 1 2 3, , F X X X X X X× ×=
And input of the 3 parties are X2 =2 , X2 =3 and X3 =4. The parties will encrypt their input using public key of the server. Their values after encryption are:
X1’=162 X2’=181 and X3’=641st party P1 will multiply encrypted input by
a random variable say ‘a’ ( let value of ‘a’ be 1) and encrypt the whole value by P2’s public key and forward it to P2.
( )( )1 ’ 70Enc a X× =
P2 will decrypt 70 using its private key and will get 162 back. now P2 will find the product of Enc(a ( X1’)) and Enc (X2’) whose value will be 29322. P2 will encrypt this value by P3’s public key and transmit it to P3 . Then P3 decrypt it with its private key and follow the same procedure as followed by P2 and transmit the same to P1. now P1 will decrypt it and divide it by ‘a’ and forward it to the server. Server will get the solution of the function by decrypting the output by its private key.
5. ConClUsionThe field of homomorphic encryption is attracting
many of the researchers these days and they are taking keen interest in developing homomorphic cryptosystem that can be deployed practically. The focus is on its practical applicability and on how real world problems can be solved easily preserving the privacy of the client. In our paper, we have implemented and shown how homomorphic encryption can be helpful in some of the practical problems and also shown how these problems can be dealt with. Applying homomorphic encryption to the traditional approaches makes them more secure and reliable. In future, we will like to focus on designing or modifying existing homomorphic
cryptosystems we will also attempt to extend the usability and practicality of Homomorphic Encryption Scheme. Homomorphism is a growing field and there is much more to explore in it.
fu"d"k ZgksekseksjfQd ,fUØI”ku dk {ks= bu fnuksa “kks/kdrkZvksa dks
vkdf’kZr dj jgk gS vkSj os okLrfod :i esa yxus okys gksekseksjfQd fØiVksflLVe dks fodflr djus esa :fp ys jgs gSaA gekjk /;ku bldh okLrfod vuqç;ksxrk vkSj miHkksäk dh xksiuh;rk cjdjkj j[krs gq, nqfu;k ds leL;k,¡ dSls lekIr gks ij jgsxkA gekjs vkys[k esa geus gksekeksjfQd ,fUØI”ku dks dk;kZfUor fd;k vkSj fn[kk;k gSa fd ;g dqN okLrfod leL;kvksa esa ennxkj gks ldrk gS vkSj buls dSls fuiVk tk ldrk gSA ikjaifjd i)fr;ksa ds LFkku ij gksekseksjfQd ,fUØI”ku ykxw djds bls vf/kd lqjf{kr vkSj fo”oluh; cuk;k tk ldrk gSaA Hkfo’; esa] ges u, eksjfQd ,fUØI”ku dh fMtkbu ij ;k bu ekStwnk gksekseksjfQd ,fUØI”ku fØIVksflLVe dks la”kksf/kr djus ij /;ku dsafær djuk gksxkA ge gksekseksjfQd ,fUØI”ku ;kstuk dh mi;ksfxrk vkSj okLrfodrk ds foLrkj dk ç;kl djsxsaA gksekseksjfQTe ,d c<+rk gqvk {ks= gS vkSj ml esa irk yxkus ds fy, cgqr dqN gSA
rEFErEnCEs1. Shantanu rane, Wei Sun & Anthony Vetro Secure
Function Evaluation based on Secret Sharing and Homomorphic Encryption Mitsubishi Electric research laboratories Forty-Seventh Annual Allerton Conference Allerton House, uIuC, Illinois, uSA September 30-October 2, 2009
2. Jianfeng Sun Secure Electronic Auction ECE, university of California, Santa Barbara
3. Maha tebba, Said el-hajji, Abdellatif el ghazi Homomorphic Encryption Applied to the Cloud Computing Security , Proceedings of the World Congress on Engineering 2012 Vol I WCE 2012, July 4 - 6, 2012, london, u.K.
4. Iti Sharma A fully homomorphic encryption scheme with symmetric keys..university College of Engineering, rajasthan Technical university, Kota Mtech thesis,august 2013.
5. Pascal Paillier. Public-key cryptosystems based on composite degree residuosity Classes. In Eurocrypt 99, lnCS 1592, pages 223–238, 1999.
6. C. Gentry. A fully homomorphic encryption scheme. Stanford university, Sep 2009. PhD thesis.
7. r. rivest, A. Shamir, and l. Adleman. A method for obtaining digital signatures and public key cryptosystems. Communications of the ACM, 21(2) :120-126, 1978. Computer Science, pages 223-238. Springer, 1999.
fuxjkuh vuqç;ksx ds lfØ; vkarfjd vkSj ckgjh –”; gsrq lQZ vkSj gSfjl xq.k fo”ys’k.k surf and harris feature Analysis for dynamic indoor and outdoor scene for surveillance
Application
Manisha Chahande* and Vinaya Gohokar *Amity University, Noida, India
M.I.T. Pune, India *E-mail: [email protected]
lkjka”k
fuxjkuh vuqç;ksxksa esa –f”;r oLrq ij utj j[kuk daI;wVj –f’V esa ,d egRoiw.kZ dk;Z gSA lfØ; vkSj tfVy –”;ksa dh Lopkfyr ohfM;ks fuxjkuh daI;wVj –f’V esa lcls vf/kd lfØ; vuqla/kku fo’k;ksa esa ls ,d gSA daI;wVj –f’V vkSj ohfM;ks vk/kkfjr fuxjkuh ç.kkyh lkoZtfud lykerh vkSj lqj{kk cuk, j[kus esa lgk;rk çnku djrh gSaA fdlh oLrq dks igpkuus esa ,d eq[; dfBukbZ y{; dks igpkuus vkSj VªSfdax ds fy, mi;qä xq.kksa vkSj e‚My dks pquuk gSA lQZ ¼lihMhM vi jkscLV Qhpj½ ,YxksfjFe dk ç;ksx ohfM;ks esa fujarj Nfo igpku ds fy, fd;k tkrk gSA lQZ xq.k o.kZudrkZ Nfo fijkfeM ds vanj [kkstuh; txg esa yksdfç; fcUnq dks de dj nsrk gSaA lQZ gj dne esa dkQh xq.kksa dks tksMdj xfr esa rsth çnku djrk gSaA ifj.kkeh yksdfç; fcUnq vf/kd nksgjkus ;ksX; vkSj “kksj ls eqä gSaA lQZ /kqa/kyh vkSj ?kqekonkj vk—fr;ksa ij lapyu djusa esa vPNk gSA ;g dksuksa dks igpkudj vk—fr;ksa ds xq.kksa dks çkIr dj oLrqvksa dks igpkuus vkSj utj j[kus esa vPNk gSA fdlh vk—fr esa yksdfç; fcUnq dh igpku dksus fMVsDVj ls irk dh tkrh gSaA gSfjl dksuZj igpku ,YxksfjFe vkSj lQZ xq.k o.kZudrkZ ds mi;ksx ls utj j[kus dh n{krk esa csgrjh dh tk ldrh gSaA ;g vkys[k ekudh; ewY;kdau vkarfjd vkSj cká –”; ij ç;ksxkRed ifj.kke çLrqr djrk gSA lQZ vkSj gSfjl vkarfjd xfr”khy –”;ksa ij etcwr dk;ZUou djrs gSaA
AbstrAct
Visual object tracking for surveillance applications is an important task in computer vision. Automatic video surveillance of dynamic and complex scenes is one of the most active research topics in computer vision. Computer vision and video-based surveillance have the potential to assist in maintaining public safety and security. One main difficulty in object tracking is to choose suitable features and models for recognising and tracking the target. Speeded up robust Features (SurF) algorithm is used for continuous image recognition in video. The SurF feature descriptor operates by reducing the search space of possible interest points inside of the scale space image pyramid. SurF adds a lot of features to improve the speed in every step. The resulting tracked interest points are more repeatable and noise free. SurF is good at handling images with blurring and rotation. Corner detection is good for obtaining image features for object tracking and recognition. Interest points in an image are located using corner detector. By using Harris corner detection algorithm along SurF feature descriptor, tracking efficiency is improved. This paper presents experimental results on a standard evaluation set of Indoor and outdoor scene. SurF & Harris shows strong performance on indoor dynamic scene.
Keywords: SurF, Harris, video surveillance, object tracking, object recognition, feature extraction
Bilingual International Conference on Information Technology: Yesterday, Today, and Tomorrow, 19-21 Feburary 2015, pp. 97-100 ©DESIDOC, 2015
1. IntroductIon Video tracking is the process of locating a moving
object (or multiple objects) over time using a camera. In video tracking an algorithm analyzes sequential video frames. Two major components of visual tracking are target representation and localization. Video tracking is a time consuming process depending the amount of data that is contained in given video. The main objective of video tracking is to associate target objects
in consecutive video frames. locating and tracking the target object depends on the algorithm. Robust feature descriptors such as Scale Invariant Feature Transform (SIFT), Speeded up robust Features (SurF), and Gradient localization Oriented Histogram (GlOH) have become a core component in applications such as image recognition. As name suggests, SurF is a speeded-up version of SIFT. SurF descriptor is three times as fast as SIFT feature descriptor. SurF descriptor
ArTIFICIAl InTEllIGEnCE AnD nETWOrK SECurITY
98
is preferred for its fast feature extraction. quality of object recognition is important to the real-time tracking requirement, and the tracking algorithm should not interfere with the recognition performance.
SurF1 algorithm is used for feature extraction and continuous image recognition and in video. It reduces the search space of possible interest points inside of the scale space image pyramid. The interest points tracked by SurF are resilient to noise. SurF is based on sums of 2D Haar wavelet responses and makes an efficient use of integral images. SurF feature tracks the objects by interest point matching and updating. It then continuously extracts feature for recognition.7 The association can be especially difficult when the objects are moving fast relative to the frame rate. When the tracked object changes orientation over time, complexity increases. For these situations video tracking systems usually employ a motion model. The motion model describes how the image of the target might change for different possible motions of the object. Motion estimation is done through Harris corners and object recognition is done through robust features such as SurF feature descriptor. Harris corner detection is used for its computation speed. Harris corner detector is rotation and scale invariant. using SurF descriptor along with Harris corner detection improves tracking efficiency and is invariant to illumination changes in images.
2. sUrF AlGorithM oVErViEw A correspondence matching is one of the important
tasks in computer vision, and it is not easy to find corresponding points in variable environment where a scale, rotation view point and illumination are changed. A SurF algorithm have been widely used to solve the problem of the correspondence matching because it is faster than SIFT(Scale Invariant Feature Transform) with closely maintaining the matching performance6.
SIFT uses visual pyramids to find candidate points and filters each layer according to the Gauss law with increased Sigma values and finds differences. SurF on other hand uses Hessian Matrix to select the candidate points in different sizes. SurF uses Haar wavelet filters and the integral of the image to speed up the filtering operation. SurF is good at handling images with blurring and rotation. The method is very fast because of the use of an integral image where the value of a pixel (x,y) is the sum of all values in the rectangle defined by the origin and (x,y). SurF uses integer approximation. To detect features the Hessian matrix (H) is assembled, where lxx is the convolution of the second derivative of a Gaussian with the image at the point. Hessian matrix is represented as,
L xx LxyH
Lxy Lyy
= (1)
SurF uses different scales of Gaussian masks, while the scale of image is always unaltered.
3. hArris CornEr dEtECtion AlGorithM Corner detection is an approach used to extract certain
kinds of features and image contents. Corner detection is used in motion detection, image registration, video tracking, panorama stitching, and object recognition etc. The corner detection block finds corners in an image using the Harris corner detection. Harris detector considers the differential of the corner score with respect to direction directly, instead of using shifted patches.
Harris corner detector2 is based on the local autocorrelation function of a signal. The local auto-correlation function measures the local changes of the signal by patches shifted in different directions. Algorithm of Harris corner detector is to:• Find partial derivatives from intensity of an
image • Compute corner response(r) • Find local maxima in the corner response
In harris corner detection x and y derivatives is computed for an image. Product of derivative is determined for each pixel. next sum of product is computed. Harris matrix in defined at each pixel (x,y). Corner response is computed and local maxima in corner response is found out. Auto correlation function is also called as summed square difference (SSD). For a point (x.y), its auto correlation function is represented as,
S(x,y)=∑u∑v w(u,v) (I(u+x,v+y) I(u,v))2 (2)where I(u+x,v+y) is approximated by taylor
expansion. IX and IY are known are partial derivatives such that
I(u+x,v+y)=I(u,v) + Ix(u,v)x + Iy (u,v)y (3)The partial derivate can be calculated from image
with a filter as [-1,0,1] and [-1,0,1]. let Ω1 and Ω2 be two eigen values of autocorrelation function S(x, y). Auto-correlation matrix (H) captures intensity structure of the local neighborhood and it measure intensity based on the eigenvalues.
Three cases arrives: • If both eigen values are high=>Interest point (corner) is detected • If one eigenvalue is high=>Then it is contour • If both eigen values are small=>It is uniform
region Corner response is characterized based on eigen
values. Corner reponse is represented as,
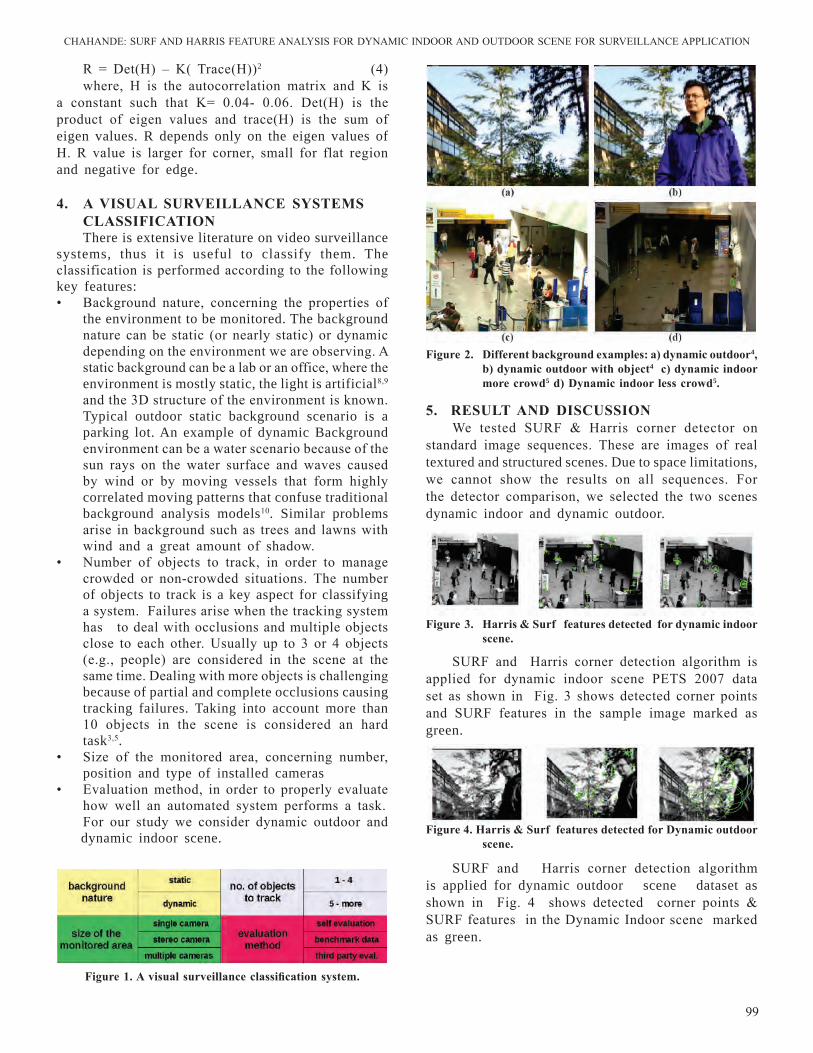
CHAHAnDE: SurF AnD HArrIS FEATurE AnAlYSIS FOr DYnAMIC InDOOr AnD OuTDOOr SCEnE FOr SurVEIllAnCE APPlICATIOn
99
r = Det(H) – K( Trace(H))2 (4)where, H is the autocorrelation matrix and K is
a constant such that K= 0.04- 0.06. Det(H) is the product of eigen values and trace(H) is the sum of eigen values. R depends only on the eigen values of H. r value is larger for corner, small for flat region and negative for edge.
4. A VisUAl sUrVEillAnCE sYstEMs ClAssiFiCAtion There is extensive literature on video surveillance
systems, thus it is useful to classify them. The classification is performed according to the following key features:• Background nature, concerning the properties of
the environment to be monitored. The background nature can be static (or nearly static) or dynamic depending on the environment we are observing. A static background can be a lab or an office, where the environment is mostly static, the light is artificial8,9 and the 3D structure of the environment is known. Typical outdoor static background scenario is a parking lot. An example of dynamic Background environment can be a water scenario because of the sun rays on the water surface and waves caused by wind or by moving vessels that form highly correlated moving patterns that confuse traditional background analysis models10. Similar problems arise in background such as trees and lawns with wind and a great amount of shadow.
• number of objects to track, in order to manage crowded or non-crowded situations. The number of objects to track is a key aspect for classifying a system. Failures arise when the tracking system has to deal with occlusions and multiple objects close to each other. usually up to 3 or 4 objects (e.g., people) are considered in the scene at the same time. Dealing with more objects is challenging because of partial and complete occlusions causing tracking failures. Taking into account more than 10 objects in the scene is considered an hard task3,5.
• Size of the monitored area, concerning number, position and type of installed cameras
• Evaluation method, in order to properly evaluate how well an automated system performs a task.For our study we consider dynamic outdoor and
dynamic indoor scene.
5. rEsUlt And disCUssionWe tested SurF & Harris corner detector on
standard image sequences. These are images of real textured and structured scenes. Due to space limitations, we cannot show the results on all sequences. For the detector comparison, we selected the two scenes dynamic indoor and dynamic outdoor.
Figure 1. A visual surveillance classification system.
Figure 3. harris & surf features detected for dynamic indoor scene.
Figure 4. harris & surf features detected for dynamic outdoor scene.
Figure 2. different background examples: a) dynamic outdoor4, b) dynamic outdoor with object4 c) dynamic indoor more crowd5 d) dynamic indoor less crowd5.
SurF and Harris corner detection algorithm is applied for dynamic indoor scene PETS 2007 data set as shown in Fig. 3 shows detected corner points and SurF features in the sample image marked as green.
SurF and Harris corner detection algorithm is applied for dynamic outdoor scene dataset as shown in Fig. 4 shows detected corner points & SurF features in the Dynamic Indoor scene marked as green.
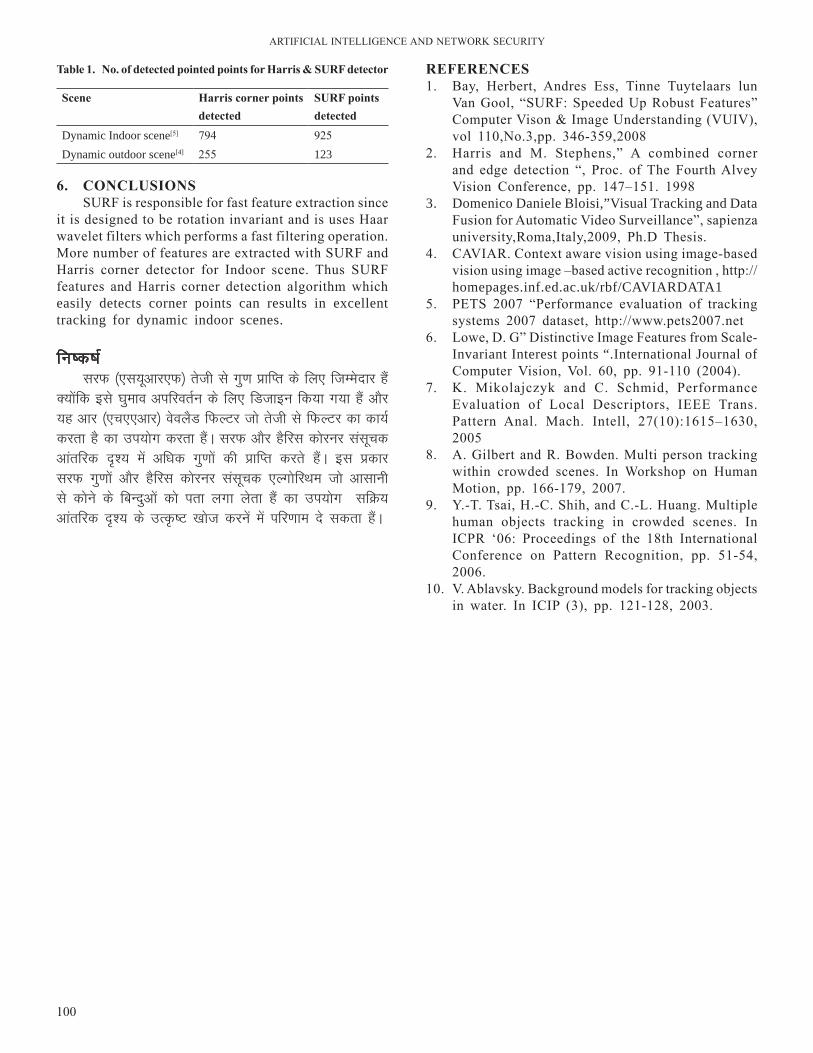
ArTIFICIAl InTEllIGEnCE AnD nETWOrK SECurITY
100
6. ConClUsionsSurF is responsible for fast feature extraction since
it is designed to be rotation invariant and is uses Haar wavelet filters which performs a fast filtering operation. More number of features are extracted with SurF and Harris corner detector for Indoor scene. Thus SurF features and Harris corner detection algorithm which easily detects corner points can results in excellent tracking for dynamic indoor scenes.
fu"d"k Z ljQ ¼,l;wvkj,Q½ rsth ls xq.k çkfIr ds fy, ftEesnkj gSa
D;ksafd bls ?kqeko vifjorZu ds fy, fMtkbu fd;k x;k gSa vkSj ;g vkj ¼,p,,vkj½ osoySM fQYVj tks rsth ls fQYVj dk dk;Z djrk gS dk mi;ksx djrk gSaA ljQ vkSj gSfjl dksjuj lalwpd vkarfjd –”; esa vf/kd xq.kksa dh çkfIr djrs gSaA bl çdkj ljQ xq.kksa vkSj gSfjl dksjuj lalwpd ,YxksfjFke tks vklkuh ls dksus ds fcUnqvksa dks irk yxk ysrk gSa dk mi;ksx lfØ; vkarfjd –”; ds mR—’V [kkst djusa esa ifj.kke ns ldrk gSaA
rEFErEnCEs1. Bay, Herbert, Andres Ess, Tinne Tuytelaars lun
Van Gool, “SurF: Speeded up robust Features” Computer Vison & Image understanding (VuIV), vol 110,no.3,pp. 346-359,2008
2. Harris and M. Stephens,” A combined corner and edge detection “, Proc. of The Fourth Alvey Vision Conference, pp. 147–151. 1998
3. Domenico Daniele Bloisi,”Visual Tracking and Data Fusion for Automatic Video Surveillance”, sapienza university,roma,Italy,2009, Ph.D Thesis.
4. CAVIAr. Context aware vision using image-based vision using image –based active recognition , http://homepages.inf.ed.ac.uk/rbf/CAVIARDATA1
5. PETS 2007 “Performance evaluation of tracking systems 2007 dataset, http://www.pets2007.net
6. lowe, D. G” Distinctive Image Features from Scale-Invariant Interest points “.International Journal of Computer Vision, Vol. 60, pp. 91-110 (2004).
7. K. Mikolajczyk and C. Schmid, Performance Evaluation of local Descriptors, IEEE Trans. Pattern Anal. Mach. Intell, 27(10):1615–1630, 2005
8. A. Gilbert and r. Bowden. Multi person tracking within crowded scenes. In Workshop on Human Motion, pp. 166-179, 2007.
9. Y.-T. Tsai, H.-C. Shih, and C.-l. Huang. Multiple human objects tracking in crowded scenes. In ICPr ‘06: Proceedings of the 18th International Conference on Pattern recognition, pp. 51-54, 2006.
10. V. Ablavsky. Background models for tracking objects in water. In ICIP (3), pp. 121-128, 2003.
table 1. no. of detected pointed points for harris & sUrF detector
scene harris corner points detected
sUrF points detected
Dynamic Indoor scene[5] 794 925Dynamic outdoor scene[4] 255 123

SAWHnEY: rECEnT DEVElOPMEnTS In HOMOMOrPHIC EnCrYPTIOn
101
1. IntroductIonCryptography refers to the branch of computer
science that deals with the study and practice of secure communication schemes amidst third parties. The field of cryptography originated much before the advent of computers. Earlier versions included transposition ciphers and substitution ciphers. As the computers began to store and process on large scale basis, the need of secure communication arose. This led to the formation of more robust and reliable cryptographic methods to make information sharing safer.
Further to make data processing in the presence of third parties secure, we needed methods that could process on encrypted data. This led to the development of homomorphic encryption that allowed two or more parties to communicate with each other without exposing the unencrypted data to any of them. During the past decades, homomorphic encryption schemes have been applied in different cryptographic protocols over untrusted channels. These channels compute on encrypted data without decrypting it.
Ron Rivest1 et al. presented the first homomorphic encryption scheme. Their privacy homomorphism had security flaws as discussed by Brickell and Yacobi[2]. In 1991, Feigenbaum and Merritt3 raised an important question: Whether an encrypting function is additive or multiplicative homomorphic, if it’s values at two input parameters and are known? There was a little progress in investigating and designing an algebraically homomorphic encryption schemes. Breakthrough was achieved when Craig Gentry4 (2009) in his PhD. thesis demonstrated how to construct homomorphic encryption scheme. Gentry5 used a bootstrappable somewhat homomorphic scheme and made a fully homomorphic scheme over integers.
2. FUndAMEntAl tErMs2.1 Encryption
Encryption refers to decoding a plain text in such a way that it is not easily understood by the interceptors. Encryption doesn’t guarantee to not reveals information, but provides a way so that even if
gksekseksjfQd ,fUØI”ku esa gky gh esa fd, x, fodklrecent developments in homomorphic Encryption
Mandeep Singh Sawhney,* O. P. Verma, nitin Jain, and Saibal Kumar Pal# #Scientific Analysis Group, Delhi- 110 054, India
*E-mail: [email protected]
lkjka”k
gksekseksjfQd ,fUØI”ku ds dbZ vuqç;ksxksa ds dkj.k gksekseksjfQd ,fUØI”ku orZeku fØIVksxzkQh leqnk; esa yksdfç; “kCn cu x;k gSA dqN vuqç;ksxksa ds uke gSa&bySDVª‚fud oksfVax] cgqnyh; vfHkdyu] LiSe fQYVj] çfrc)rk ;kstuk vkfnA gksekseksjfQd ,fUØI”ku MsVk ij LoNUn vfHkdyu djus dh vuqefr nsrk gS tcfd ;g MsVk ,fUØIVsM :i esa gksrk gSA ;fn vfHkdyu dsoy tksM vkSj xq.kk rd lhfer gS rks ;g ;kstuk dqN gksekseksjfQd gksxh vU;Fkk ;g iw.kZ gksekseksjfQd dgh tk,xhA gksekseksjfQd ;kstuk,a 2009 esa Øsx tsUVªh dh dk;Z lQyrk ds ckn dkQh c< x;kA bl vkys[k esa gekjk y{; gksekseksjfQd ;kstuk esa gky esa gq, fodkl dks n”kkZuk gSaA ge gksekseksjfQd ;kstuk ds lQyrkiwoZd LFkkiu ds dkj.k gqbZ dqN okLrfod vuqiz;ksxkas dks n”kkZrs gSaA
AbstrActHomomorphic encryption has become a buzzword in present cryptography community, as there
are numerous applications of homomorphic encryption. To name a few – Electronic voting, multiparty computation, spam filters, commitment scheme etc. Homomorphic encryption allows performing arbitrary computation on data while it remains in encrypted form. If the computations are limited to addition or multiplication, the scheme is said to be somewhat homomorphic, otherwise it is said to be fully homomorphic. Construction of homomorphic schemes boosted up after the breakthrough work of Craig Gentry in 2009. Since then, community is working hard to design a scheme for practical applications. Our aim in this paper is to showcase recent developments in homomorphic schemes. We have also shown some practical applications which can be catered upon a successful development of homomorphic scheme.
Keywords: Homomorphic encryption
Bilingual International Conference on Information Technology: Yesterday, Toady, and Tomorrow, 19-21 Feburary 2015, pp. 101-105 © DESIDOC, 2015

ArTIFICIAl InTEllIGEnCE AnD nETWOrK SECurITY
102
information is somehow revealed to irrelevant authorities, they can’t easily understand the contents. The strength of the encryption depends upon the secrecy of key used for encrypting the piece of information. On the basis of key management, encryption schemes can be classified into two types: Symmetric Encryption and Asymmetric Encryption.
2.1.1 Symmetric EncryptionIn symmetric encryption, both the sender and receiver
upon mutual consent use the same key to encrypt the plain text as well as to decrypt the cipher text. These schemes are generally faster but their efficiency reduces as number of parties in a communication increases because they will require different keys for secure communication. Furthermore, the shared key also needs to be exchanged in a secure way. Due to its secret nature, symmetric-key cryptography is sometimes referred as secret-key cryptography.
2.1.2 Asymmetric EncryptionIn asymmetric encryption, two keys are required.
One key is used to encrypt the data while another is used to decrypt it. The main feature of asymmetric is that only public key can be used to encrypt the data while corresponding private key is used in decryption. It is impossible to determine the private key even if public key is revealed. These schemes are generally slower than symmetric ones due to much larger mathematical computations. Asymmetric key cryptography is sometimes referred to as public key cryptography.
2.2 decryptionDecryption refers to the process of decoding cipher
text correctly to obtain back the original plain text. Decryption techniques depend on the mathematical hard problem upon which a cryptographic scheme has been established.
3. hoMoMorPhiC EnCrYPtionIn recent decades, cryptographic schemes particularly
homomorphic schemes, have been studied extensively because of their important property of performing mathematical operations on encrypted data and get the same operation done on actual plaintext. If we have two plaintexts P1 and P2 and their corresponding ciphertext are C1 and C2, then homomorphic encryption allows computation of P1 Ѳ P2 from C1 Ѳ C2 without revealing P1 or P2.
Homomorphic encryption schemes consist of following four algorithms:Keygen (λ)
• Input – security parameter λ.• Output – pair (sk,pk) ∈ , where sk ,pk,K denotes
secret key, public key and Key Space respectively.Encrypt (pk,π)• Input – a public key pk and a plaintext π.• Output – a ciphertext ψ.Decrypt (sk,ψ)• Input – secret key sk and ciphertext ψ.• Output – the corresponding plaintext π.Evaluate (pk,C,ψ)• Input – a public key pk, a circuit C with t
inputs and a set ψ of t ciphertext ψ1,ψ2,…,ψt.• Output – a ciphertext ψ.If ψ_i is a ciphertext corresponding to the plaintext
for i = 1 … t and ψ= (ψ_1 ,.....,ψ_t ), then Evaluate (pk,C,ψ) shall return a ciphertext ψ corresponding to the plaintext C (π_1 ,......,π_t ) for a circuit C with t inputs.
A homomorphic encryption scheme is said to correctly evaluate (a set of circuits), if the correctness-condition on the algorithm Evaluate from above holds for all circuits C ∈ C.
4. PrEsEnt hoMoMorPhiC EnCrYPtion sChEMEs
4.1 Goldwasser-Micali schemeGoldwasser-Micali Scheme7,8 (1982) is considered
as the first probabilistic public-key encryption scheme that is proved to be secure under standard cryptographic assumptions. In the Goldwasser–Micali cryptosystem, if the public key is the modulus m and quadratic non-residue x, then the encryption of a bit b is ε(b)= xb r2 mod m for some random r {0,…,m-1}. The homomorphic property is then
ε(b1).ε(b2)= xb1 r12 xb2 r2
2= x(b1+b2) (r1 r2)(2)= ε(b1
⨁ b2)where ⨁ denotes addition modulo 2, (i.e. exclusive-
or).
4.2 benaloh CryptosystemBenaloh cryptosystem9 (1988) is an extension of
Goldwasser-Micali cryptosystem with nearly same encryption cost but with an increased decryption cost.
In the Benaloh cryptosystem, if the base is g and public key is modulus m with a block size of c, then the encryption of a message x is, ε(x)= gx rc mod m for some random r{0,…,m-1}. The homomorphic property is then
ε(x1 ).ε(x2 )=(gx1 r1c )(gx2 r2
c )=gx1+x2(r1 r2)2=ε(x1+
x2 mod c)
4.3 naccahe-stern scheme nacche & Stern10 (1998) presented an improvement
to Benaloh’s9 scheme. This scheme gave much more efficiency when the parameter k used in Benaloh’s scheme was chosen to be of greater value. The proposed
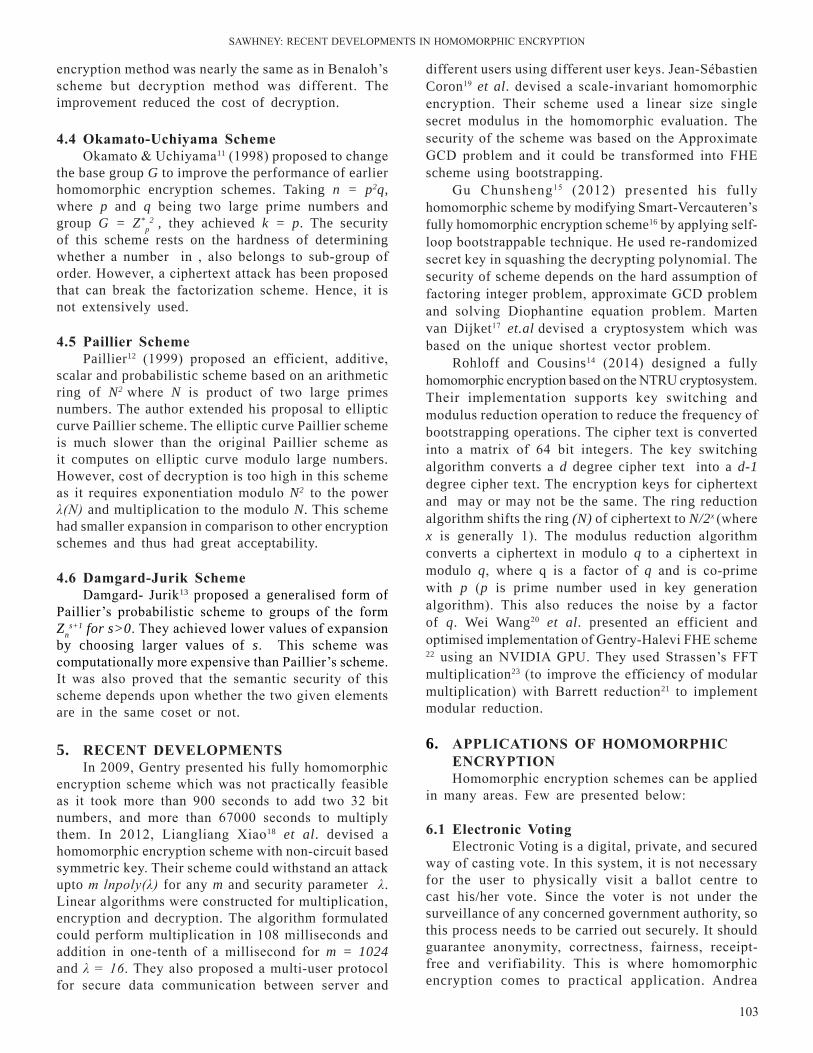
SAWHnEY: rECEnT DEVElOPMEnTS In HOMOMOrPHIC EnCrYPTIOn
103
encryption method was nearly the same as in Benaloh’s scheme but decryption method was different. The improvement reduced the cost of decryption.
4.4 okamato-Uchiyama schemeOkamato & uchiyama11 (1998) proposed to change
the base group G to improve the performance of earlier homomorphic encryption schemes. Taking n = p2q, where p and q being two large prime numbers and group G = Z*
p2 , they achieved k = p. The security
of this scheme rests on the hardness of determining whether a number in , also belongs to sub-group of order. However, a ciphertext attack has been proposed that can break the factorization scheme. Hence, it is not extensively used.
4.5 Paillier schemePaillier12 (1999) proposed an efficient, additive,
scalar and probabilistic scheme based on an arithmetic ring of N2 where N is product of two large primes numbers. The author extended his proposal to elliptic curve Paillier scheme. The elliptic curve Paillier scheme is much slower than the original Paillier scheme as it computes on elliptic curve modulo large numbers. However, cost of decryption is too high in this scheme as it requires exponentiation modulo N2 to the power λ(N) and multiplication to the modulo N. This scheme had smaller expansion in comparison to other encryption schemes and thus had great acceptability.
4.6 damgard-jurik schemeDamgard- Jurik13 proposed a generalised form of
Paillier’s probabilistic scheme to groups of the form Zn
s+1 for s>0. They achieved lower values of expansion by choosing larger values of s. This scheme was computationally more expensive than Paillier’s scheme. It was also proved that the semantic security of this scheme depends upon whether the two given elements are in the same coset or not.
5. rECEnt dEVEloPMEntsIn 2009, Gentry presented his fully homomorphic
encryption scheme which was not practically feasible as it took more than 900 seconds to add two 32 bit numbers, and more than 67000 seconds to multiply them. In 2012, liangliang Xiao18 et al. devised a homomorphic encryption scheme with non-circuit based symmetric key. Their scheme could withstand an attack upto m lnpoly(λ) for any m and security parameter λ. linear algorithms were constructed for multiplication, encryption and decryption. The algorithm formulated could perform multiplication in 108 milliseconds and addition in one-tenth of a millisecond for m = 1024 and λ = 16. They also proposed a multi-user protocol for secure data communication between server and
different users using different user keys. Jean-Sébastien Coron19 et al. devised a scale-invariant homomorphic encryption. Their scheme used a linear size single secret modulus in the homomorphic evaluation. The security of the scheme was based on the Approximate GCD problem and it could be transformed into FHE scheme using bootstrapping.
Gu Chunsheng15 (2012) presented his fully homomorphic scheme by modifying Smart-Vercauteren’s fully homomorphic encryption scheme16 by applying self-loop bootstrappable technique. He used re-randomized secret key in squashing the decrypting polynomial. The security of scheme depends on the hard assumption of factoring integer problem, approximate GCD problem and solving Diophantine equation problem. Marten van Dijket17 et.al devised a cryptosystem which was based on the unique shortest vector problem.
Rohloff and Cousins14 (2014) designed a fully homomorphic encryption based on the nTru cryptosystem. Their implementation supports key switching and modulus reduction operation to reduce the frequency of bootstrapping operations. The cipher text is converted into a matrix of 64 bit integers. The key switching algorithm converts a d degree cipher text into a d-1 degree cipher text. The encryption keys for ciphertext and may or may not be the same. The ring reduction algorithm shifts the ring (N) of ciphertext to N/2x (where x is generally 1). The modulus reduction algorithm converts a ciphertext in modulo q to a ciphertext in modulo q, where q is a factor of q and is co-prime with p (p is prime number used in key generation algorithm). This also reduces the noise by a factor of q. Wei Wang20 et al. presented an efficient and optimised implementation of Gentry-Halevi FHE scheme 22 using an nVIDIA GPu. They used Strassen’s FFT multiplication23 (to improve the efficiency of modular multiplication) with Barrett reduction21 to implement modular reduction.
6. APPliCAtions oF hoMoMorPhiC EnCrYPtionHomomorphic encryption schemes can be applied
in many areas. Few are presented below:
6.1 Electronic VotingElectronic Voting is a digital, private, and secured
way of casting vote. In this system, it is not necessary for the user to physically visit a ballot centre to cast his/her vote. Since the voter is not under the surveillance of any concerned government authority, so this process needs to be carried out securely. It should guarantee anonymity, correctness, fairness, receipt-free and verifiability. This is where homomorphic encryption comes to practical application. Andrea
ArTIFICIAl InTEllIGEnCE AnD nETWOrK SECurITY
104
Huszti24 presented a homomorphic scheme that can be used in electronic voting.
6.2 spam FilterSpam filter is an automatic program designed to
check an incoming e-mail for unwanted, unsolicited and fraudulent content and prevent it from getting in user’s inbox. The basic idea is to scan the encrypted incoming message for certain keywords. More efficient implementation requires Bayesian and other heuristic filters. Khedr, Gulak and Vaikuntanathan25 constructed a spam filter based on HElib26 which efficiently implemented a multiple keyword search.
6.3 Multiparty ComputationIn multiparty computation, the need is to compute
a framework which can evaluate function while keeping the inputs private. Ivan Damgård27 et al. constructed a multiparty computation using some what homomorphic encryption.
7. ConClUsion And FUtUrE worKThe f ield of Homomorphic encrypt ion is
continuously evolving. The present schemes are not so developed that they could cater to current needs. The community is working on much improved and practical implementations.
fu’d’k Z gksekseksjfQd ,fUØI”ku dk {ks= yxkrkj fodflr gks jgk
gSA orZeku ;kstuk,saa bruh fodflr ugha gSa fd os ekStwnk t:jrksa dks iwjk dj ldsA bldk leqnk; T;knk csgrj vkSj okLrfod dk;kZUo;u ij dke ij dkQh dke dj jgk gSA
rEFErEnCEs rivest, r.; Shamir, A.; and Adleman, l. A Method 1. for obtaining digital signatures and public-key cryptosystems. MIT Memo MIT/lCS/TM-82, 1977. Brickell, E.; & Yacobi, Y.; (1987). On privacy 2. homomorphisms”, Advances in Cryptology (EUROCRYPT ’87), volume 304 of lecture notes in Computer Science, Springer, new York, uSA, pp.117– 26.Feigenbaum, J.& Merritt, M. Open questions, Talk 3. Abstracts, and Summary of Discussions. DIMACS series in discrete mathematics and theoretical computer science,1991. Vol. 2, pp. 1-45.Craig Gentry, (2009). A fully homomorphic encryption 4. scheme. Stanford university,2009, PhD Thesis.Marten van Dijk; Craig Gentry; Shai Halevi & Vinod 5. Vaikuntanathan, Fully Homomorphic Encryption over the Integers, IACr Cryptology,2009. e-Print Archive.
Gentry, C. Fully Homomorphic Encryption using Ideal 6. lattices. In: Proceedings of the 41st Annual ACM Symposium on Theory of Computing (STOC’09), pp.169-178, ACM Press, new York, nY, uSA, 2009.Goldwasser S.& Micali S. Probabilistic encryption, 7. Journal of Computer and System Sciences,1984. Vol. 28,(2), pp. 270– 299.Goldwasser S.; Micali S., (1982). Probabilistic 8. encryption & how to play mental poker keeping secret all partial information, In Proceedings of the 14th ACM Symposium on the Theory of Computing (STOC ’82),1982. new York, uSA, pp. 365–377.Benaloh J. Verifiable secret-ballot elections, thesis, 9. Yale university, Department of Computer Science, new Haven, Conn, uSA, 1988. PhD Thesisnaccache D.; Stern J., (1998). “A new public-10. key cryptosystem based on higher residues”, In Proceedings of the 5th ACM Conference on Computer and Communications Security, San Francisco, Calif, uSA, pp. 59–66.Okamoto T.; uchiyama S., and E. Fujisaki, 2000. 11. Epoc: efficient probabilistic public key encryption, Tech. Rep., Proposal to IEEE P1363a.Paillier P., (1999). “Public-key cryptosystems 12. based on composite degree residuosity classes”, In Advances in Cryptology (EurOCrYPT ’99), Vol. 1592 of lecture notes in Computer Science, Springer, new York, nY, uSA, pp. 223–238.Damgard, I.; Jurik, M. (2001). A Generalisation, a 13. Simplification and Some Applications of Paillier’s Probabilistic Public-Key System. In: Proceedings of the 4th International Workshop on Practice and Theory in Public Key Cryptography (PKC’01), lecture notes in Computer Science (lnCS), Vol 1992, Springer-Verlag, pp.119-136.K. rohloff; D. B. Cousins, A Scalable Implementation 14. of Fully Homomorphic Encryption Built on nTru. 2nd Work-shop on Applied Homomorphic Cryptography and Encrypted Computing (WAHC). Mar. 7, 2014.Chunsheng, G. More practical fully homomorphic 15. encryption. Inter. Journal of Cloud Computing and Services Science, 2012. Vol 1,(4), pp.199-201.Smart, n. P. & Vercauteren, F. Fully homomorphic 16. encryption with relatively small key and ciphertext sizes. In: Public Key Cryptography - Proceedings of the 13th International Conference on Practice and Theory in Public Key Cryptography (PKC’10), lecture notes in Computer Science (lnCS),2010. Vol 6056, Springer-Verlag, pp. 420-443.Marten van Dijk.; Craig Gentry.; Shai Halevi. &Vinod 17. Vaikuntanathan. Fully Homomorphic Encryption over the Integers Advances in Cryptology–EurOCrYPT
SAWHnEY: rECEnT DEVElOPMEnTS In HOMOMOrPHIC EnCrYPTIOn
105
2010, lecture notes in Computer Science Vol.6110, 2010, pp. 24-43l. Xiao.; O. Bastani. & I.-l. Yen, An efficient 18. homomorphic encryption protocol for multi-user systems. IACr Cryptology e-Print Archive, Vol. 2012, p. 193, 2012.Jean-S´ebastien Coron.; Tancr`ede lepoint, & 19. Mehdi Tibouchi. Scale-invariant fully homomorphic encryption over the integers. Cryptology e-Print Archive, report 2014/032, 2014.W. Wang.; Y. Hu.; l. Chen.; X. Huang & B. 20. Sunar, Accelerating fully homomorphic encryption using gpu. in 2012 IEEE Conference on High Performance Extreme Computing (HPEC). IEEE, 2012, pp. 1–5P. Barrett, Implementing the rivest shamir and 21. adleman public key encryption algorithm on a standard digital signal processor, in Advances in Cryptology: (CrYPTO 1986). Springer, 1987, pp. 311–323.C. Gentry and S. Halevi, Implementing Gentry’s 22. fully-homomorphic encryption scheme, Advances
in Cryptology–EurOCrYPT 2011, pp. 129–148, 2011.A. Schönhage & V. Strassen, Schnelle multiplikation 23. grosser zahlen, Computing, Vol. 7(3), pp. 281–292, 1971.Andrea Huszti. A homomorphic encryption-based secure 24. electronic voting scheme. Faculty of Informatics. university of Debrecen. Hungary.Alhassan Khedr and Glenn Gulak & Vinod 25. Vaikuntanathan. Scalable homomorphic implementation of encrypted data-classifiers, Cryptology e-Print Archive, report 2014/838Halevi, S. & Shoup, V. Design and Implementation 26. of a Homomorphic-Encryption library, 2013. researcher.ibm.com/researcher/files/us-shaih/he-library.pdfIvan Damgård. & Jesper B. nielsen, Multiparty 27. Computation from Somewhat Homomorphic Encryption. in CrYPTO 2012, Springer (lnCS 7417), pages 643-662, 2012.
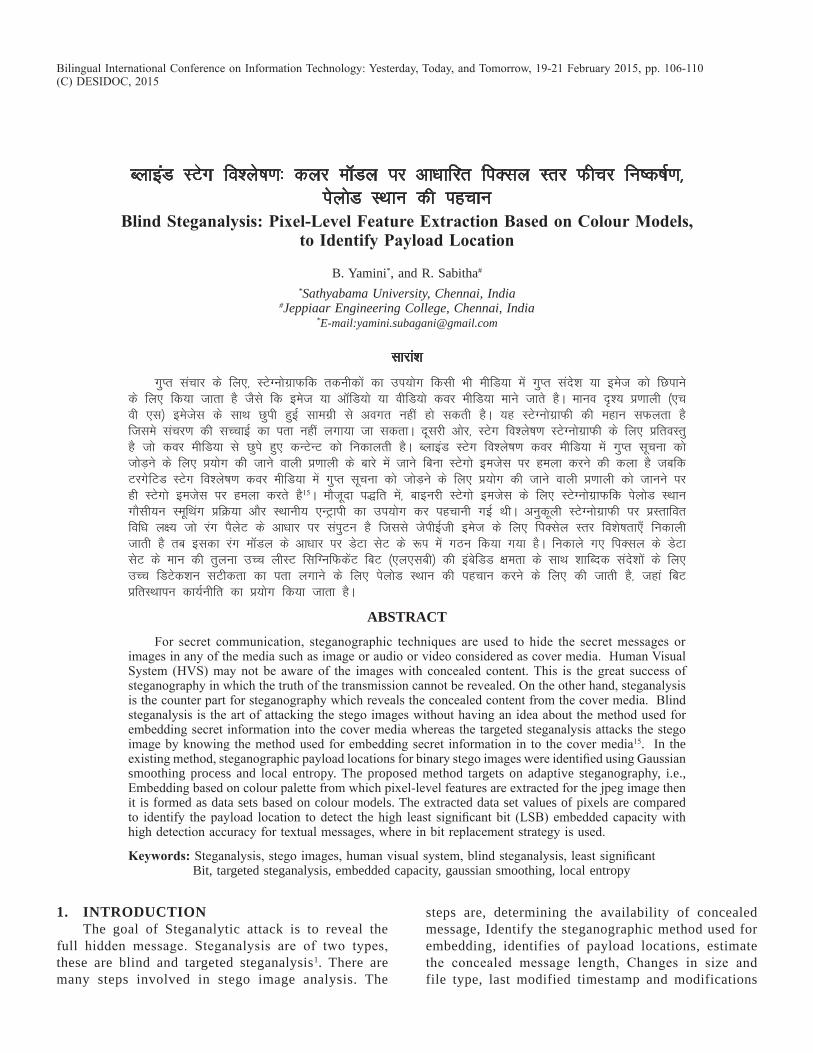
CykbaM LVsx fo”ys’k.k% dyj e‚My ij vk/kkfjr fiDly Lrj Qhpj fu’d’kZ.k] isyksM LFkku dh igpku
blind steganalysis: Pixel-level Feature Extraction based on Colour Models, to identify Payload location
B. Yamini*, and R. Sabitha# *Sathyabama University, Chennai, India
#Jeppiaar Engineering College, Chennai, India *E-mail:[email protected]
lkjka”k
xqIr lapkj ds fy,] LVsXuksxzkQfd rduhdksa dk mi;ksx fdlh Hkh ehfM;k esa xqIr lans”k ;k best dks fNikus ds fy, fd;k tkrk gS tSls fd best ;k v‚fM;ks ;k ohfM;ks doj ehfM;k ekus tkrs gSA ekuo –”; ç.kkyh ¼,p oh ,l½ bestsl ds lkFk Nqih gqbZ lkexzh ls voxr ugha gks ldrh gSA ;g LVsXuksxzkQh dh egku lQyrk gS ftles lapj.k dh lPpkbZ dk irk ugha yxk;k tk ldrkA nwljh vksj] LVsx fo”ys’k.k LVsXuksxzkQh ds fy, çfroLrq gS tks doj ehfM;k ls Nqis gq, dUVsUV dks fudkyrh gSA CykbaM LVsx fo”ys’k.k doj ehfM;k esa xqIr lwpuk dks TkksM+us ds fy, ç;ksx dh tkus okyh ç.kkyh ds ckjs esa tkus fcuk LVsxks betsl ij geyk djus dh dyk gS tcfd VjxsfVM LVsx fo”ys’k.k doj ehfM;k esa xqIr lwpuk dks TkksM+us ds fy, ç;ksx dh tkus okyh ç.kkyh dks tkuus ij gh LVsxks betsl ij geyk djrs gS15A ekStwnk i)fr esa] ckbujh LVsxks betsl ds fy, LVsXuksxzkQfd isyksM LFkku xkSlh;u LewfFkax çfØ;k vkSj LFkkuh; ,UVªkih dk mi;ksx dj igpkuh xbZ FkhA vuqdwyh LVsXuksxzkQh ij çLrkfor fof/k y{; tks jax iSysV ds vk/kkj ij laiqVu gS ftlls tsihbZth best ds fy, fiDlsy Lrj fo”ks’krk,¡ fudkyh tkrh gS rc bldk jax e‚My ds vk/kkj ij MsVk lsV ds :i esa xBu fd;k x;k gSA fudkys x, fiDly ds MsVk lsV ds eku dh rqyuk mPp yhLV flfXufQdsaV fcV ¼,y,lch½ dh bacsfMM {kerk ds lkFk “kkfCnd lans”kksa ds fy, mPp fMVsd”ku lVhdrk dk irk yxkus ds fy, isyksM LFkku dh igpku djus ds fy, dh tkrh gS] tgka fcV çfrLFkkiu dk;Zuhfr dk ç;ksx fd;k tkrk gSA
AbstrActFor secret communication, steganographic techniques are used to hide the secret messages or
images in any of the media such as image or audio or video considered as cover media. Human Visual System (HVS) may not be aware of the images with concealed content. This is the great success of steganography in which the truth of the transmission cannot be revealed. On the other hand, steganalysis is the counter part for steganography which reveals the concealed content from the cover media. Blind steganalysis is the art of attacking the stego images without having an idea about the method used for embedding secret information into the cover media whereas the targeted steganalysis attacks the stego image by knowing the method used for embedding secret information in to the cover media15. In the existing method, steganographic payload locations for binary stego images were identified using Gaussian smoothing process and local entropy. The proposed method targets on adaptive steganography, i.e., Embedding based on colour palette from which pixel-level features are extracted for the jpeg image then it is formed as data sets based on colour models. The extracted data set values of pixels are compared to identify the payload location to detect the high least significant bit (lSB) embedded capacity with high detection accuracy for textual messages, where in bit replacement strategy is used.
Keywords: Steganalysis, stego images, human visual system, blind steganalysis, least significant Bit, targeted steganalysis, embedded capacity, gaussian smoothing, local entropy
Bilingual International Conference on Information Technology: Yesterday, Today, and Tomorrow, 19-21 February 2015, pp. 106-110(C) DESIDOC, 2015
1. IntroductIonThe goal of Steganalytic attack is to reveal the
full hidden message. Steganalysis are of two types, these are blind and targeted steganalysis1. There are many steps involved in stego image analysis. The
steps are, determining the availability of concealed message, Identify the steganographic method used for embedding, identifies of payload locations, estimate the concealed message length, Changes in size and file type, last modified timestamp and modifications
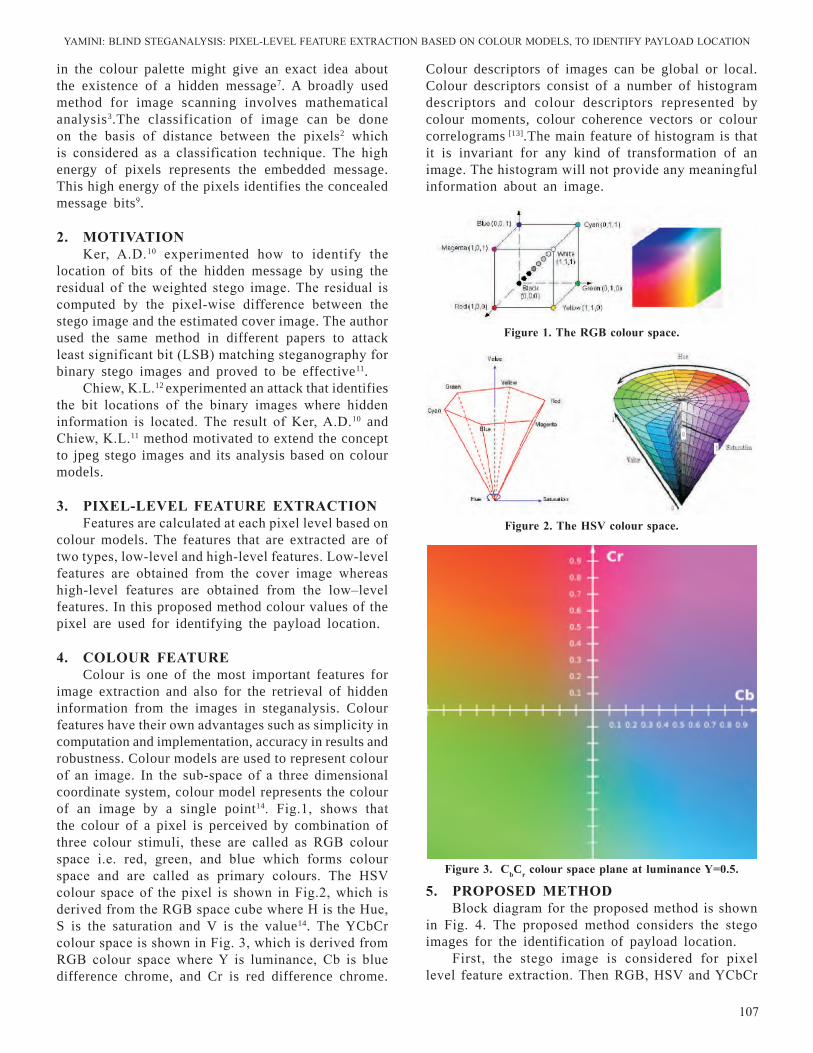
YAMInI: BlInD STEGAnAlYSIS: PIXEl-lEVEl FEATurE EXTrACTIOn BASED On COlOur MODElS, TO IDEnTIFY PAYlOAD lOCATIOn
107
in the colour palette might give an exact idea about the existence of a hidden message7. A broadly used method for image scanning involves mathematical analysis3.The classification of image can be done on the basis of distance between the pixels2 which is considered as a classification technique. The high energy of pixels represents the embedded message. This high energy of the pixels identifies the concealed message bits9.
2. MotiVAtionKer, A.D.10 experimented how to identify the
location of bits of the hidden message by using the residual of the weighted stego image. The residual is computed by the pixel-wise difference between the stego image and the estimated cover image. The author used the same method in different papers to attack least significant bit (lSB) matching steganography for binary stego images and proved to be effective11.
Chiew, K.l.12 experimented an attack that identifies the bit locations of the binary images where hidden information is located. The result of Ker, A.D.10 and Chiew, K.l.11 method motivated to extend the concept to jpeg stego images and its analysis based on colour models.
3. PixEl-lEVEl FEAtUrE ExtrACtionFeatures are calculated at each pixel level based on
colour models. The features that are extracted are of two types, low-level and high-level features. low-level features are obtained from the cover image whereas high-level features are obtained from the low–level features. In this proposed method colour values of the pixel are used for identifying the payload location.
4. ColoUr FEAtUrE
Colour is one of the most important features for image extraction and also for the retrieval of hidden information from the images in steganalysis. Colour features have their own advantages such as simplicity in computation and implementation, accuracy in results and robustness. Colour models are used to represent colour of an image. In the sub-space of a three dimensional coordinate system, colour model represents the colour of an image by a single point14. Fig.1, shows that the colour of a pixel is perceived by combination of three colour stimuli, these are called as rGB colour space i.e. red, green, and blue which forms colour space and are called as primary colours. The HSV colour space of the pixel is shown in Fig.2, which is derived from the rGB space cube where H is the Hue, S is the saturation and V is the value14. The YCbCr colour space is shown in Fig. 3, which is derived from rGB colour space where Y is luminance, Cb is blue difference chrome, and Cr is red difference chrome.
Colour descriptors of images can be global or local. Colour descriptors consist of a number of histogram descriptors and colour descriptors represented by colour moments, colour coherence vectors or colour correlograms [13].The main feature of histogram is that it is invariant for any kind of transformation of an image. The histogram will not provide any meaningful information about an image.
5. ProPosEd MEthodBlock diagram for the proposed method is shown
in Fig. 4. The proposed method considers the stego images for the identification of payload location.
First, the stego image is considered for pixel level feature extraction. Then rGB, HSV and YCbCr
Figure 1. the rGb colour space.
Figure 2. the hsV colour space.
Figure 3. Cbcr colour space plane at luminance Y=0.5.
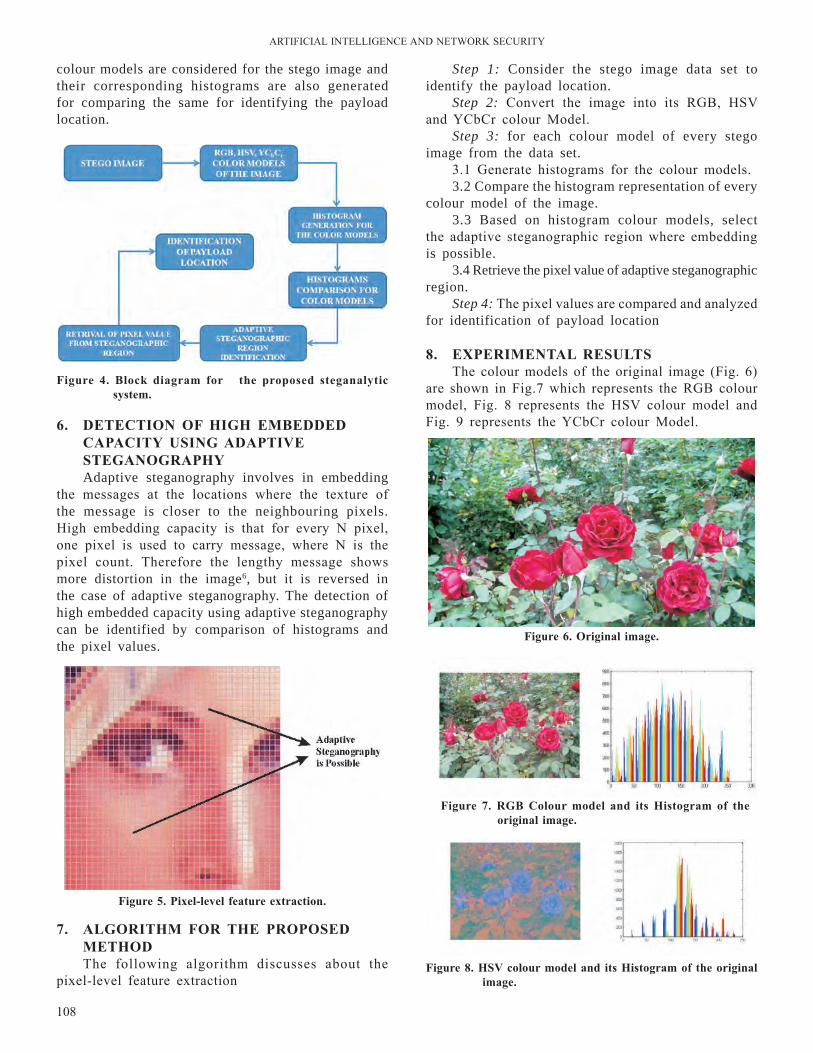
ArTIFICIAl InTEllIGEnCE AnD nETWOrK SECurITY
108
Step 1: Consider the stego image data set to identify the payload location.
Step 2: Convert the image into its rGB, HSV and YCbCr colour Model.
Step 3: for each colour model of every stego image from the data set.
3.1 Generate histograms for the colour models.3.2 Compare the histogram representation of every
colour model of the image.3.3 Based on histogram colour models, select
the adaptive steganographic region where embedding is possible.
3.4 Retrieve the pixel value of adaptive steganographic region.
Step 4: The pixel values are compared and analyzed for identification of payload location
8. ExPEriMEntAl rEsUltsThe colour models of the original image (Fig. 6)
are shown in Fig.7 which represents the rGB colour model, Fig. 8 represents the HSV colour model and Fig. 9 represents the YCbCr colour Model.
colour models are considered for the stego image and their corresponding histograms are also generated for comparing the same for identifying the payload location.
Figure 4. block diagram for the proposed steganalytic system.
6. dEtECtion oF hiGh EMbEddEd CAPACitY UsinG AdAPtiVE stEGAnoGrAPhYAdaptive steganography involves in embedding
the messages at the locations where the texture of the message is closer to the neighbouring pixels. High embedding capacity is that for every n pixel, one pixel is used to carry message, where n is the pixel count. Therefore the lengthy message shows more distortion in the image6, but it is reversed in the case of adaptive steganography. The detection of high embedded capacity using adaptive steganography can be identified by comparison of histograms and the pixel values.
Figure 5. Pixel-level feature extraction.
Figure 6. original image.
Figure 7. rGb Colour model and its histogram of the original image.
Figure 8. hsV colour model and its histogram of the original image.
7. AlGorithM For thE ProPosEd MEthodThe following algorithm discusses about the
pixel-level feature extraction
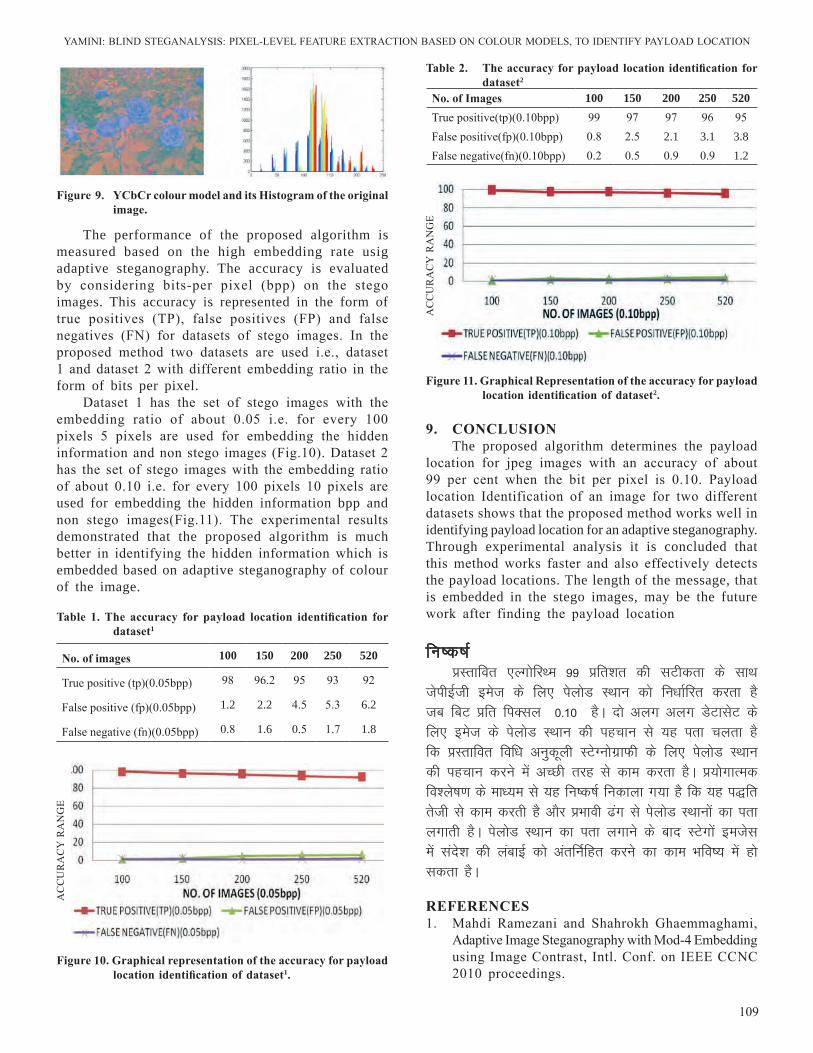
YAMInI: BlInD STEGAnAlYSIS: PIXEl-lEVEl FEATurE EXTrACTIOn BASED On COlOur MODElS, TO IDEnTIFY PAYlOAD lOCATIOn
109
9. ConClUsionThe proposed algorithm determines the payload
location for jpeg images with an accuracy of about 99 per cent when the bit per pixel is 0.10. Payload location Identification of an image for two different datasets shows that the proposed method works well in identifying payload location for an adaptive steganography. Through experimental analysis it is concluded that this method works faster and also effectively detects the payload locations. The length of the message, that is embedded in the stego images, may be the future work after finding the payload location
fu"d"k Z çLrkfor ,YxksfjFe 99 çfr”kr dh lVhdrk ds lkFk
tsihbZth best ds fy, isyksM LFkku dks fu/kkZfjr djrk gS tc fcV çfr fiDly 0-10 gSA nks vyx vyx MsVklsV ds fy, best ds isyksM LFkku dh igpku ls ;g irk pyrk gS fd çLrkfor fof/k vuqdwyh LVsXuksxzkQh ds fy, isyksM LFkku dh igpku djus esa vPNh rjg ls dke djrk gSA ç;ksxkRed fo”ys’k.k ds ek/;e ls ;g fu’d’kZ fudkyk x;k gS fd ;g i)fr rsth ls dke djrh gS vkSj çHkkoh <ax ls isyksM LFkkuksa dk irk yxkrh gSA isyksM LFkku dk irk yxkus ds ckn LVsxksa betsl esa lans”k dh yackbZ dks varfuZfgr djus dk dke Hkfo’; esa gks ldrk gSA
rEFErEnCEs1. Mahdi ramezani and Shahrokh Ghaemmaghami,
Adaptive Image Steganography with Mod-4 Embedding using Image Contrast, Intl. Conf. on IEEE CCnC 2010 proceedings.
The performance of the proposed algorithm is measured based on the high embedding rate usig adaptive steganography. The accuracy is evaluated by considering bits-per pixel (bpp) on the stego images. This accuracy is represented in the form of true positives (TP), false positives (FP) and false negatives (Fn) for datasets of stego images. In the proposed method two datasets are used i.e., dataset 1 and dataset 2 with different embedding ratio in the form of bits per pixel.
Dataset 1 has the set of stego images with the embedding ratio of about 0.05 i.e. for every 100 pixels 5 pixels are used for embedding the hidden information and non stego images (Fig.10). Dataset 2 has the set of stego images with the embedding ratio of about 0.10 i.e. for every 100 pixels 10 pixels are used for embedding the hidden information bpp and non stego images(Fig.11). The experimental results demonstrated that the proposed algorithm is much better in identifying the hidden information which is embedded based on adaptive steganography of colour of the image.
Figure 9. YCbCr colour model and its histogram of the original image.
table 1. the accuracy for payload location identification for dataset1
Figure 10. Graphical representation of the accuracy for payload location identification of dataset1.
AC
Cu
rA
CY
rA
nG
E
no. of images 100 150 200 250 520
True positive (tp)(0.05bpp) 98 96.2 95 93 92
False positive (fp)(0.05bpp) 1.2 2.2 4.5 5.3 6.2
False negative (fn)(0.05bpp) 0.8 1.6 0.5 1.7 1.8
table 2. the accuracy for payload location identification for dataset2
no. of images 100 150 200 250 520True positive(tp)(0.10bpp) 99 97 97 96 95False positive(fp)(0.10bpp) 0.8 2.5 2.1 3.1 3.8False negative(fn)(0.10bpp) 0.2 0.5 0.9 0.9 1.2
Figure 11. Graphical representation of the accuracy for payload location identification of dataset2.
AC
Cu
rA
CY
rA
nG
E

ArTIFICIAl InTEllIGEnCE AnD nETWOrK SECurITY
110
2. Hall P, Park Bu, Samworth rJ (2008). Choice of neighbor order in nearest-neighbor classification, Annals of Statistics 36 (5): 2135-2152, DOI:10.1214/07-AOS537.
3. Chen, X., Faltemier, T., Flynn, P. & Bowyer, K., Human face modeling and face recognition through multi-view high resolution stereopsis, Intl. Conference on computer vision and pattern
recognition (2006), pp.50-56.4. nigsch F, Bender A, van Buuren B, Tissen J,
nigsch E, Mitchell JB. Melting point prediction employing k-nearest neighbor algorithms and genetic parameter optimization, Journal of Chemical Information and Modeling,2006.46(6). pp.2412-22, DOI:10.1021/ci060149f.
5. Burges, C.J., A Tutorial on Support Vector Machines for Pattern recognition, Data Mining and
Knowledge Discovery,1998 2 121-167.6. P. E. Hart, The Condensed nearest neighbor rule,
IEEE Transactions on Information Theory 18,1968 515–516. DOI: 10.1109/TIT.1968.1054155.
7. Chapelle, O., and Haffner, p., & Vapnik, V.n., Support Vector Machines For Histogram based image classification, IEEE transaction on neural networks,1999. 10(5), 1055-64.
8. Md. raful Hassan, M.Maruf Hossain & James Bailey, Improving k-nearest neighbour Classification with Distance Functions Based on receiver Operating
Characteristics, lnAI,2008. Vol.5211, pp.489-504, Springer, Heidelberg.
9. I. Davidson & G.Paul, locating the secret messages in images, 10th ACM SIGKDD International Conference on knowledge Discovery and Data Mining,2004, pp 545-550.
10. A.D Ker, locating steganographic payload via WS residuals, 10th ACM workshop on multimedia and security,2008, pp.27-32.
11. A.D Ker & I.lubenko, Feature reduction and payload location with WAM steganalysis, Media forensics and security,2009. 7254.
12 K.l.Chiew & J.Pieprzyk, Identifying steganographic payload location in binary image, 11th Pacific Rim Conf. on Multimedia-Advances in Multimedia Information Processing,2010. Vol. 6297, pp.590-600.
13. C.Schmid, & r Mohr, local gray value invariants for image retrival, IEEE Trans Pattern Annal Machine Intell,1997.Vol.(19), pp. 530-534.
14. ryszard S.Choras, Image Feature Extraction Technique and Their Applications for CBIR and Biometrics System, Inter. Journal of Biology & Biomedical Engineering, 2007. Vol.1(1), pp.6-16.
15. Gokhan Gul & Fatih Kurugollu. JPEG Image steganalysis using Multivariate PDF Estimates with MrF cliques”, IEEE Transactions on Information Forensics & Security,2013. Vol.8(3), pp. 578-87.
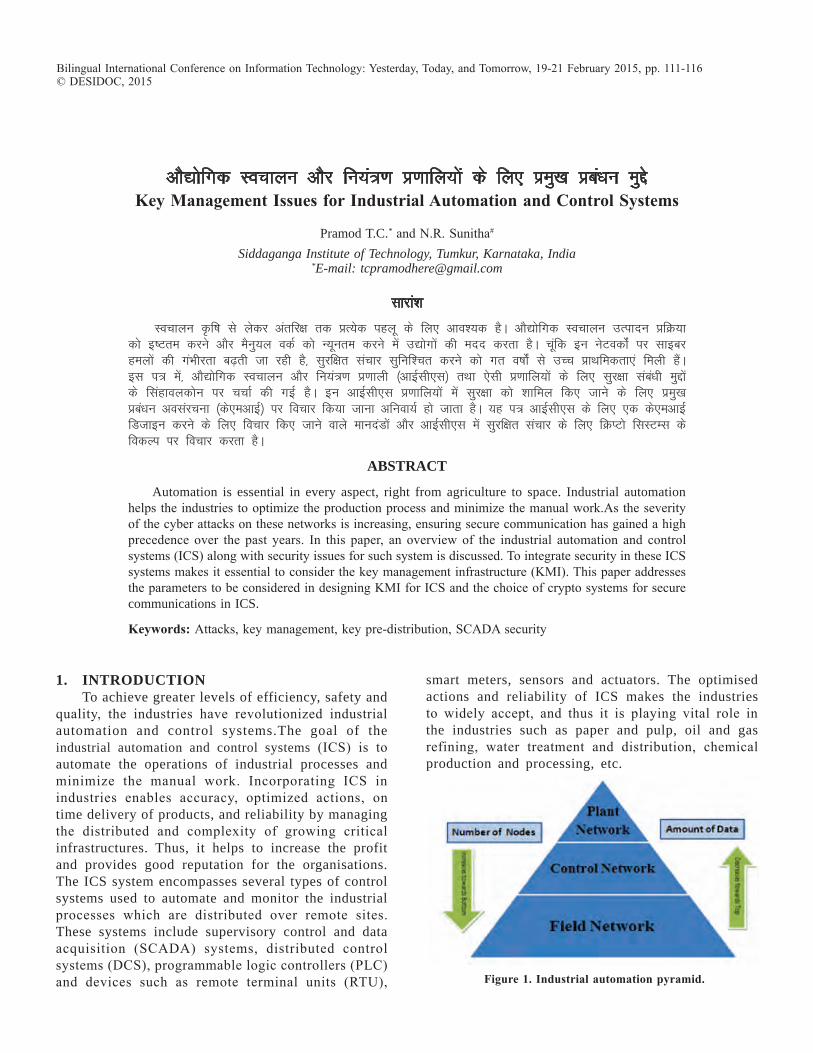
vkS|ksfxd Lopkyu vkSj fu;a=.k ç.kkfy;ksa ds fy, izeq[k çca/ku eqísKey Management issues for industrial Automation and Control systems
Pramod T.C.* and n.r. Sunitha#
Siddaganga Institute of Technology, Tumkur, Karnataka, India *E-mail: [email protected]
lkjka”k
Lopkyu —f"k ls ysdj varfj{k rd çR;sd igyw ds fy, vko';d gSA vkS|ksfxd Lopkyu mRiknu çfØ;k dks b"Vre djus vkSj eSuq;y odZ dks U;wure djus esa m|ksxksa dh enn djrk gSA pwafd bu usVodksaZ ij lkbcj geyksa dh xaHkhjrk c<+rh tk jgh gS] lqjf{kr lapkj lqfuf'pr djus dks xr o"kksaZ ls mPp çkFkfedrk,a feyh gSaA bl i= esa] vkS|ksfxd Lopkyu vkSj fu;a=.k ç.kkyh ¼vkbZlh,l½ rFkk ,slh ç.kkfy;ksa ds fy, lqj{kk laca/kh eqíksa ds flagkoydksu ij ppkZ dh xbZ gSA bu vkbZlh,l ç.kkfy;ksa esa lqj{kk dks 'kkfey fd, tkus ds fy, izeq[k çca/ku volajpuk ¼ds,evkbZ½ ij fopkj fd;k tkuk vfuok;Z gks tkrk gSA ;g i= vkbZlh,l ds fy, ,d ds,evkbZ fMtkbu djus ds fy, fopkj fd, tkus okys ekunaMksa vkSj vkbZlh,l esa lqjf{kr lapkj ds fy, fØIVks flLVEl ds fodYi ij fopkj djrk gSA
AbstrAct
Automation is essential in every aspect, right from agriculture to space. Industrial automation helps the industries to optimize the production process and minimize the manual work.As the severity of the cyber attacks on these networks is increasing, ensuring secure communication has gained a high precedence over the past years. In this paper, an overview of the industrial automation and control systems (ICS) along with security issues for such system is discussed. To integrate security in these ICS systems makes it essential to consider the key management infrastructure (KMI). This paper addresses the parameters to be considered in designing KMI for ICS and the choice of crypto systems for secure communications in ICS.
Keywords: Attacks, key management, key pre-distribution, SCADA security
Bilingual International Conference on Information Technology: Yesterday, Today, and Tomorrow, 19-21 February 2015, pp. 111-116© DESIDOC, 2015
1. IntroductIonTo achieve greater levels of efficiency, safety and
quality, the industries have revolutionized industrial automation and control systems.The goal of the industrial automation and control systems (ICS) is to automate the operations of industrial processes and minimize the manual work. Incorporating ICS in industries enables accuracy, optimized actions, on time delivery of products, and reliability by managing the distributed and complexity of growing critical infrastructures. Thus, it helps to increase the profit and provides good reputation for the organisations.The ICS system encompasses several types of control systems used to automate and monitor the industrial processes which are distributed over remote sites. These systems include supervisory control and data acquisition (SCADA) systems, distributed control systems (DCS), programmable logic controllers (PlC) and devices such as remote terminal units (rTu),
smart meters, sensors and actuators. The optimised actions and reliability of ICS makes the industries to widely accept, and thus it is playing vital role in the industries such as paper and pulp, oil and gas refining, water treatment and distribution, chemical production and processing, etc.
Figure 1. industrial automation pyramid.
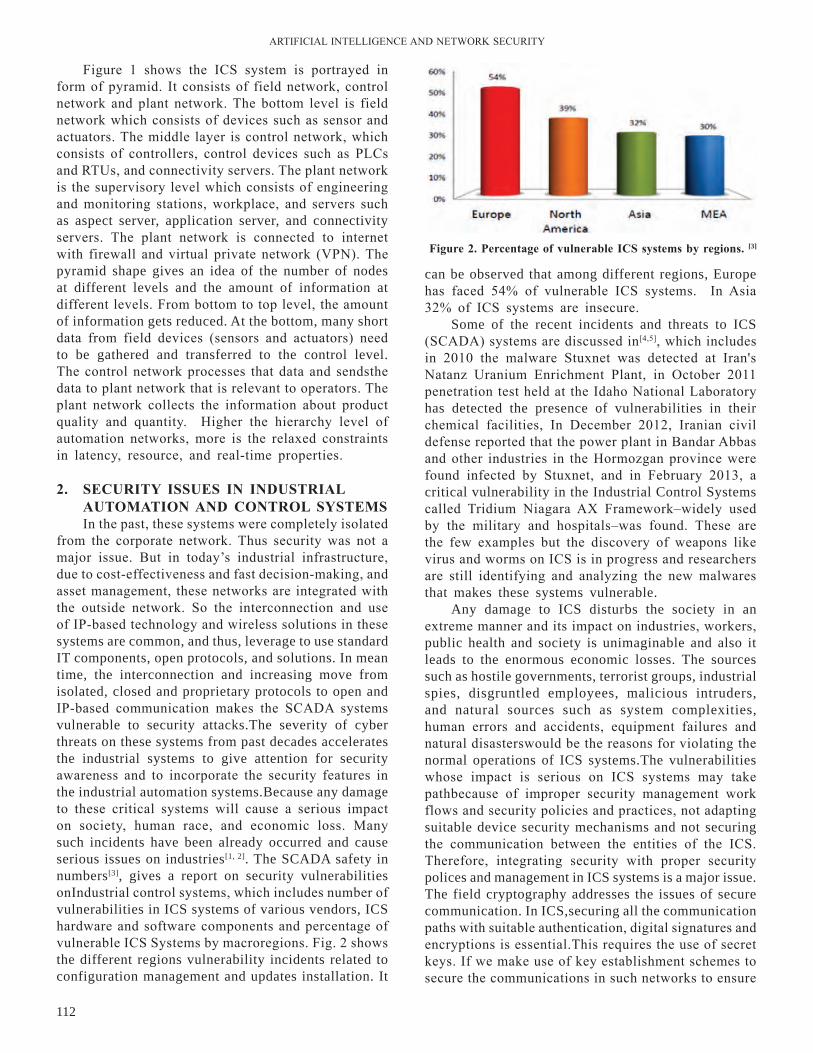
ArTIFICIAl InTEllIGEnCE AnD nETWOrK SECurITY
112
Figure 1 shows the ICS system is portrayed in form of pyramid. It consists of field network, control network and plant network. The bottom level is field network which consists of devices such as sensor and actuators. The middle layer is control network, which consists of controllers, control devices such as PlCs and rTus, and connectivity servers. The plant network is the supervisory level which consists of engineering and monitoring stations, workplace, and servers such as aspect server, application server, and connectivity servers. The plant network is connected to internet with firewall and virtual private network (VPn). The pyramid shape gives an idea of the number of nodes at different levels and the amount of information at different levels. From bottom to top level, the amount of information gets reduced. At the bottom, many short data from field devices (sensors and actuators) need to be gathered and transferred to the control level. The control network processes that data and sendsthe data to plant network that is relevant to operators. The plant network collects the information about product quality and quantity. Higher the hierarchy level of automation networks, more is the relaxed constraints in latency, resource, and real-time properties.
2. sECUritY issUEs in indUstriAl AUtoMAtion And Control sYstEMsIn the past, these systems were completely isolated
from the corporate network. Thus security was not a major issue. But in today’s industrial infrastructure, due to cost-effectiveness and fast decision-making, and asset management, these networks are integrated with the outside network. So the interconnection and use of IP-based technology and wireless solutions in these systems are common, and thus, leverage to use standard IT components, open protocols, and solutions. In mean time, the interconnection and increasing move from isolated, closed and proprietary protocols to open and IP-based communication makes the SCADA systems vulnerable to security attacks.The severity of cyber threats on these systems from past decades accelerates the industrial systems to give attention for security awareness and to incorporate the security features in the industrial automation systems.Because any damage to these critical systems will cause a serious impact on society, human race, and economic loss. Many such incidents have been already occurred and cause serious issues on industries[1, 2]. The SCADA safety in numbers[3], gives a report on security vulnerabilities onIndustrial control systems, which includes number of vulnerabilities in ICS systems of various vendors, ICS hardware and software components and percentage of vulnerable ICS Systems by macroregions. Fig. 2 shows the different regions vulnerability incidents related to configuration management and updates installation. It
Figure 2. Percentage of vulnerable iCs systems by regions. [3]
can be observed that among different regions, Europe has faced 54% of vulnerable ICS systems. In Asia 32% of ICS systems are insecure.
Some of the recent incidents and threats to ICS (SCADA) systems are discussed in[4,5], which includes in 2010 the malware Stuxnet was detected at Iran's natanz uranium Enrichment Plant, in October 2011 penetration test held at the Idaho national laboratory has detected the presence of vulnerabilities in their chemical facilities, In December 2012, Iranian civil defense reported that the power plant in Bandar Abbas and other industries in the Hormozgan province were found infected by Stuxnet, and in February 2013, a critical vulnerability in the Industrial Control Systems called Tridium niagara AX Framework–widely used by the military and hospitals–was found. These are the few examples but the discovery of weapons like virus and worms on ICS is in progress and researchers are still identifying and analyzing the new malwares that makes these systems vulnerable.
Any damage to ICS disturbs the society in an extreme manner and its impact on industries, workers, public health and society is unimaginable and also it leads to the enormous economic losses. The sources such as hostile governments, terrorist groups, industrial spies, disgruntled employees, malicious intruders, and natural sources such as system complexities, human errors and accidents, equipment failures and natural disasterswould be the reasons for violating the normal operations of ICS systems.The vulnerabilities whose impact is serious on ICS systems may take pathbecause of improper security management work flows and security policies and practices, not adapting suitable device security mechanisms and not securing the communication between the entities of the ICS.Therefore, integrating security with proper security polices and management in ICS systems is a major issue.The field cryptography addresses the issues of secure communication. In ICS,securing all the communication paths with suitable authentication, digital signatures and encryptions is essential.This requires the use of secret keys. If we make use of key establishment schemes to secure the communications in such networks to ensure
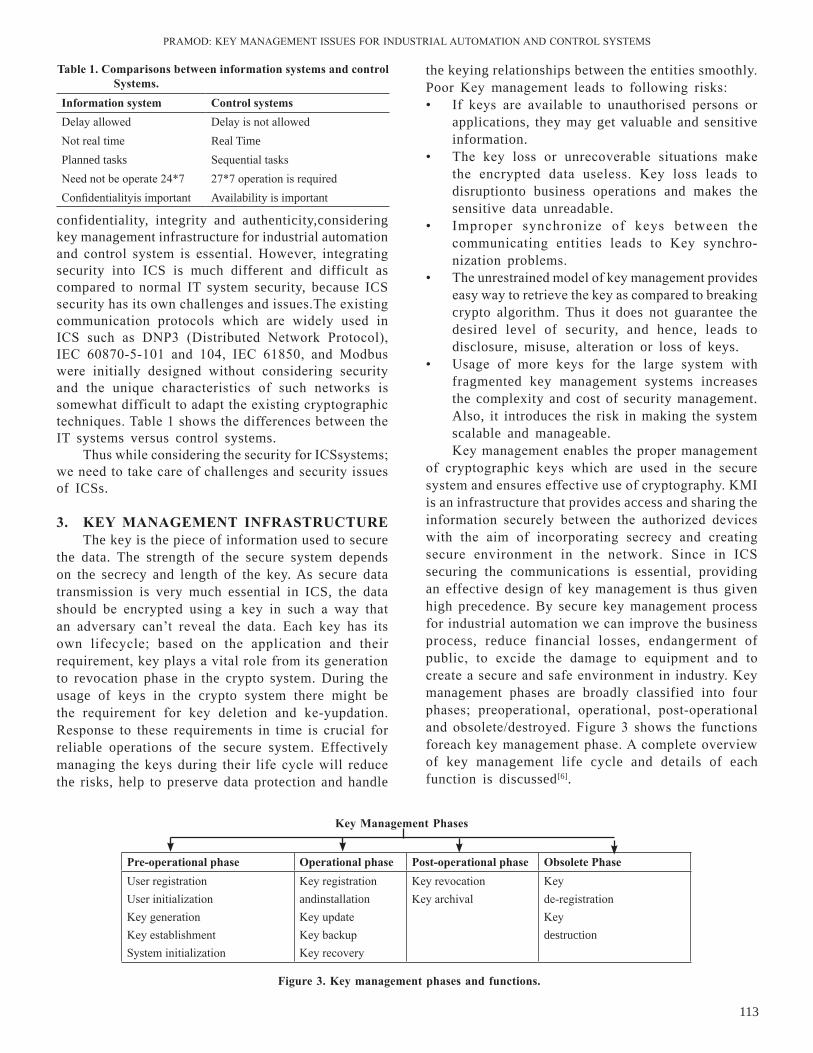
PrAMOD: KEY MAnAGEMEnT ISSuES FOr InDuSTrIAl AuTOMATIOn AnD COnTrOl SYSTEMS
113
the keying relationships between the entities smoothly. Poor Key management leads to following risks: • If keys are available to unauthorised persons or
applications, they may get valuable and sensitive information.
• The key loss or unrecoverable situations make the encrypted data useless. Key loss leads to disruptionto business operations and makes the sensitive data unreadable.
• Improper synchronize of keys between the communicating entities leads to Key synchro-nization problems.
• The unrestrained model of key management provides easy way to retrieve the key as compared to breaking crypto algorithm. Thus it does not guarantee the desired level of security, and hence, leads to disclosure, misuse, alteration or loss of keys.
• usage of more keys for the large system with fragmented key management systems increases the complexity and cost of security management. Also, it introduces the risk in making the system scalable and manageable.Key management enables the proper management
of cryptographic keys which are used in the secure system and ensures effective use of cryptography. KMI is an infrastructure that provides access and sharing the information securely between the authorized devices with the aim of incorporating secrecy and creating secure environment in the network. Since in ICS securing the communications is essential, providing an effective design of key management is thus given high precedence. By secure key management process for industrial automation we can improve the business process, reduce financial losses, endangerment of public, to excide the damage to equipment and to create a secure and safe environment in industry. Key management phases are broadly classified into four phases; preoperational, operational, post-operational and obsolete/destroyed. Figure 3 shows the functions foreach key management phase. A complete overview of key management life cycle and details of each function is discussed[6].
information system Control systemsDelay allowed Delay is not allowednot real time Real TimePlanned tasks Sequential tasksneed not be operate 24*7 27*7 operation is requiredConfidentialityis important Availability is important
table 1. Comparisons between information systems and control systems.
confidentiality, integrity and authenticity,considering key management infrastructure for industrial automation and control system is essential. However, integrating security into ICS is much different and difficult as compared to normal IT system security, because ICS security has its own challenges and issues.The existing communication protocols which are widely used in ICS such as DnP3 (Distributed network Protocol), IEC 60870-5-101 and 104, IEC 61850, and Modbus were initially designed without considering security and the unique characteristics of such networks is somewhat difficult to adapt the existing cryptographic techniques. Table 1 shows the differences between the IT systems versus control systems.
Thus while considering the security for ICSsystems; we need to take care of challenges and security issues of ICSs.
3. KEY MAnAGEMEnt inFrAstrUCtUrE The key is the piece of information used to secure
the data. The strength of the secure system depends on the secrecy and length of the key. As secure data transmission is very much essential in ICS, the data should be encrypted using a key in such a way that an adversary can’t reveal the data. Each key has its own lifecycle; based on the application and their requirement, key plays a vital role from its generation to revocation phase in the crypto system. During the usage of keys in the crypto system there might be the requirement for key deletion and ke-yupdation. response to these requirements in time is crucial for reliable operations of the secure system. Effectively managing the keys during their life cycle will reduce the risks, help to preserve data protection and handle
Pre-operational phase operational phase Post-operational phase obsolete Phaseuser registration user initialization Key generation Key establishment System initialization
Key registration andinstallation Key updateKey backupKey recovery
Key revocationKey archival
Key de-registration Keydestruction
Key Management Phases
Figure 3. Key management phases and functions.
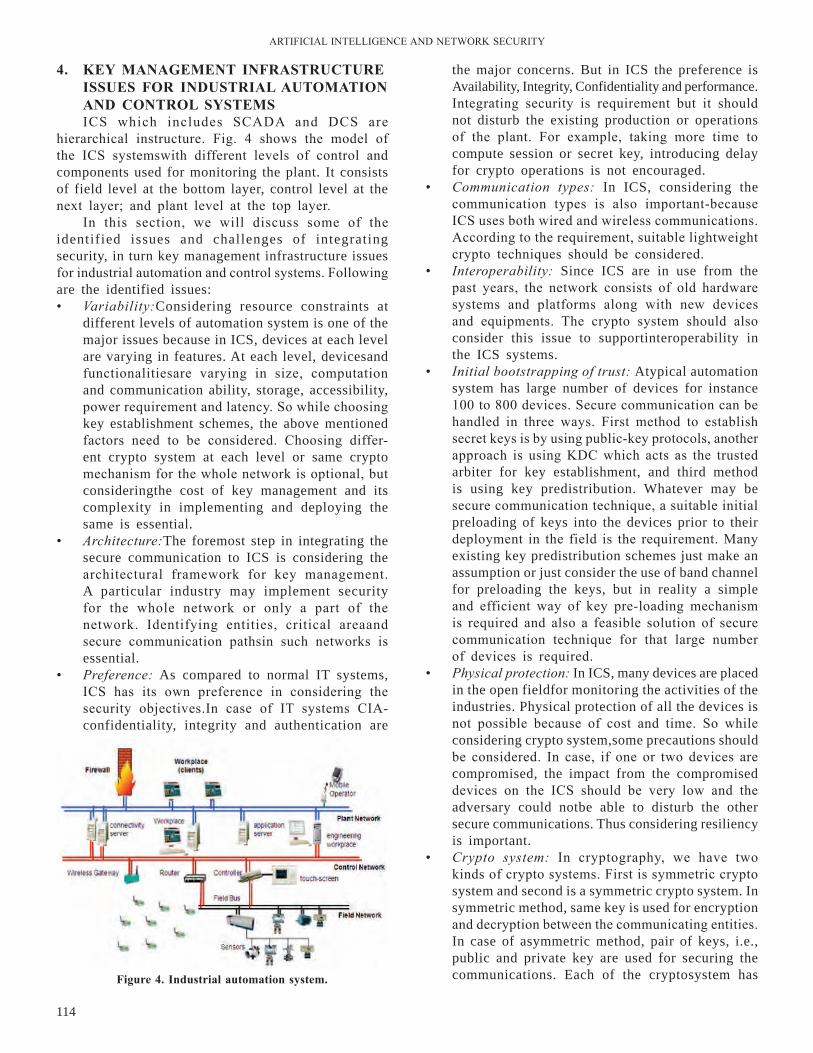
ArTIFICIAl InTEllIGEnCE AnD nETWOrK SECurITY
114
4. KEY MAnAGEMEnt inFrAstrUCtUrE issUEs For indUstriAl AUtoMAtion And Control sYstEMsICS which includes SCADA and DCS are
hierarchical instructure. Fig. 4 shows the model of the ICS systemswith different levels of control and components used for monitoring the plant. It consists of field level at the bottom layer, control level at the next layer; and plant level at the top layer.
In this section, we will discuss some of the identified issues and challenges of integrating security, in turn key management infrastructure issues for industrial automation and control systems. Following are the identified issues:• Variability:Considering resource constraints at
different levels of automation system is one of the major issues because in ICS, devices at each level are varying in features. At each level, devicesand functionalitiesare varying in size, computation and communication ability, storage, accessibility, power requirement and latency. So while choosing key establishment schemes, the above mentioned factors need to be considered. Choosing differ-ent crypto system at each level or same crypto mechanism for the whole network is optional, but consideringthe cost of key management and its complexity in implementing and deploying the same is essential.
• Architecture:The foremost step in integrating the secure communication to ICS is considering the architectural framework for key management. A particular industry may implement security for the whole network or only a part of the network. Identifying entities, critical areaand secure communication pathsin such networks is essential.
• Preference: As compared to normal IT systems, ICS has its own preference in considering the security objectives.In case of IT systems CIA- confidentiality, integrity and authentication are
the major concerns. But in ICS the preference is Availability, Integrity, Confidentiality and performance. Integrating security is requirement but it should not disturb the existing production or operations of the plant. For example, taking more time to compute session or secret key, introducing delay for crypto operations is not encouraged.
• Communication types: In ICS, considering the communication types is also important-because ICS uses both wired and wireless communications. According to the requirement, suitable lightweight crypto techniques should be considered.
• Interoperability: Since ICS are in use from the past years, the network consists of old hardware systems and platforms along with new devices and equipments. The crypto system should also consider this issue to supportinteroperability in the ICS systems.
• Initial bootstrapping of trust: Atypical automation system has large number of devices for instance 100 to 800 devices. Secure communication can be handled in three ways. First method to establish secret keys is by using public-key protocols, another approach is using KDC which acts as the trusted arbiter for key establishment, and third method is using key predistribution. Whatever may be secure communication technique, a suitable initial preloading of keys into the devices prior to their deployment in the field is the requirement. Many existing key predistribution schemes just make an assumption or just consider the use of band channel for preloading the keys, but in reality a simple and efficient way of key pre-loading mechanism is required and also a feasible solution of secure communication technique for that large number of devices is required.
• Physical protection: In ICS, many devices are placed in the open fieldfor monitoring the activities of the industries. Physical protection of all the devices is not possible because of cost and time. So while considering crypto system,some precautions should be considered. In case, if one or two devices are compromised, the impact from the compromised devices on the ICS should be very low and the adversary could notbe able to disturb the other secure communications. Thus considering resiliency is important.
• Crypto system: In cryptography, we have two kinds of crypto systems. First is symmetric crypto system and second is a symmetric crypto system. In symmetric method, same key is used for encryption and decryption between the communicating entities. In case of asymmetric method, pair of keys, i.e., public and private key are used for securing the communications. Each of the cryptosystem has Figure 4. industrial automation system.
PrAMOD: KEY MAnAGEMEnT ISSuES FOr InDuSTrIAl AuTOMATIOn AnD COnTrOl SYSTEMS
115
its own advantages and disadvantages.In ICS, considering the suitable crypto system is very important because at the lower and intermediate level of ICS devices have much resource constraints as compared to plant level. So according to the suitability and capability, selecting the suitable crypto system is important.
• In case of each crypto system, storing pre-crypto parameters is essential. Storageoccupied by the parameters,which are essential to generate the secret keys should be considered.
• In some devices, for example, sensors have less memory. Installing the crypto algorithm in such devices is a big problem. In such cases, selecting the direct and straight-forward key pre-distribution system is suitable.
• Considering capability of the device, both in communication and computation, to generate the secret key is also essential.
• Considering the key pre-distribution for whole network is also problematic because cryptographic keys may be needed by thousands of devices.
• Performance: The key management scheme used in ICS should be scalable, flexible, adaptable, and simple to manage.
• Key transmission: Once the devices are preconfigured with crypto parameters and placed in the network, requirement for additional messages for secret key generation for any device to device communication should be minimized or nullified.
• ICSs include devices and technology from variety of vendors. So securing the third party devices, software’s and securing the connection with joint ventures, alliance partners and outsourcing is also prominent.
• Many existing communication protocols used in ICS do not support security features. In corporating cryptographic techniques to provide security may require protocol modification.
• From key management perspective, manually facilitating key replacement/updation; key deletion in large systems would be impractical. Thus a suitable mechanism, such as self-computation, self-updation of keys may be feasible in such systems.
• From SCADA systems key management perspective considering the following issues is important because these systems have limited computational capacity, limited space capacity, low bandwidth and real-time processing requirement:
• Generic security considerations such as availability, confidentiality, integrity and authentication. Since availability of these systems has highest priority, crypto systems should be incorporated in such a way that, authenticated users have option to
quit crypto code and provide faster access to devices.
• number of keys used should be less at resource constraint devices.
• Support for direct communication between the devices.
• Key management should support broadcasting and multicasting.
• Key management should consider join and leave of the devices.
• Key updation and deletion is required with or without key compromise. The cost of computation and changes required while doing this operation should be considered. In existing key management schemes for these systems, if we update/delete the keys at one level, the devices at different levels of the system should alsorequire updation of some or all the pre stored keys. Also, in case of join and leave of device, the disruption to existing devices of system is more, and thus, it should be minimal.Within cryptography, key management is a major
and crucial field of research. The severity of cyber attacks on ICS require a secure system, and because of its constraints and nature, key management in these networks is challenging.The above discussed issues help to understand the complexity and requirement of key management infrastructure for industrial automation system.
5. ConClUsionsIndustrial automation and control system are
playing a vital role in the industries. As deliberate cyber attacks on these systems is increasing,ensuring security in communications has critical importance.Key management enables the proper management of cryptographic keys which are used to secure the system and ensures effective use of cryptography. This paper addresses the issues and challenges in the design of key management infrastructure for industrial automation and control systems. In future by considering the identified issuesand challenges of key management, we would like to address various key management operationsrequired for industrial automation and control systems.
fu’d’k ZvkS|ksfxd Lopkyu vkSj fu;a=.k ç.kkyh m|ksxksa esa
egRoiw.kZ Hkwfedk fuHkk jgh gSA pwafd bu ç.kkfy;ksa ij tkucw>dj fd, tkus okys lkbcj geys c<+rs tk jgs gSa] lapkj esa lqj{kk lqfuf'pr djus dk cgqr egRo gks x;k gSA izeq[k çca/ku fØIVksxzkfQd dqaft;ksa ds leqfpr çca/ku dks laHko cukrk gS ftUgsa ç.kkyh dks lqjf{kr j[kus esa ç;ksx fd;k tkrk gS vkSj fØIVksxzkQh dk çHkkoh mi;ksx lqfuf'pr djrk gSA bl i=
ArTIFICIAl InTEllIGEnCE AnD nETWOrK SECurITY
116
esa] vkS|ksfxd Lopkyu vkSj fu;a=.k ç.kkyh ¼vkbZlh,l½ ds fy, izeq[k çca/ku volajpuk ds fMtkbu ls lacaf/kr eqíksa vkSj pqukSfr;ksa ij ppkZ dh xbZ gSA Hkfo"; esa] izeq[k çca/ku ds igpkus x, eqíksa vkSj pqukSfr;ksa dks le>dj ge vkS|ksfxd Lopkyu vkSj fu;a=.k ç.kkfy;ksa ds fy, visf{kr fofHkUu izeq[k çca/ku çpkyuksa ij fopkj djuk pkgsaxsA
rEFErEnCEs1. Alcaraz, Cristina, & Sherali, Zeadally. Critical
infrastructure protection: requirements and challenges for the 21st century. International Journal of Critical Infrastructure Protection 2014.
2. Caswell, Jayne. Survey of industrial control system security.Project report (2011).
3. Dudurych, Ivan M., et al. Safety in numbers: Online security analysis of power grids with high wind penetration. Power and Energy Magazine, IEEE10.2, 2012, 62-70.
4. lim, I. H., et al. Applying security algorithms against cyber attacks in the distribution automation system. Transmission and Distribution Conference and Exposition, 2008. T&# x00026; D. IEEE/PES. IEEE, 2008.
5. Martellini, Maurizio. Cyber Security: Deterrence and IT protection for critical infrastruc-tures. Springer, 2013.
6. Bardis, n. G.; nikolaos Doukas & Konstantinos, ntaikos. A new approach of secret key management lifecycle for military applications. WSEAS Trans. Comp. Res., 2008, 3, 294-304.
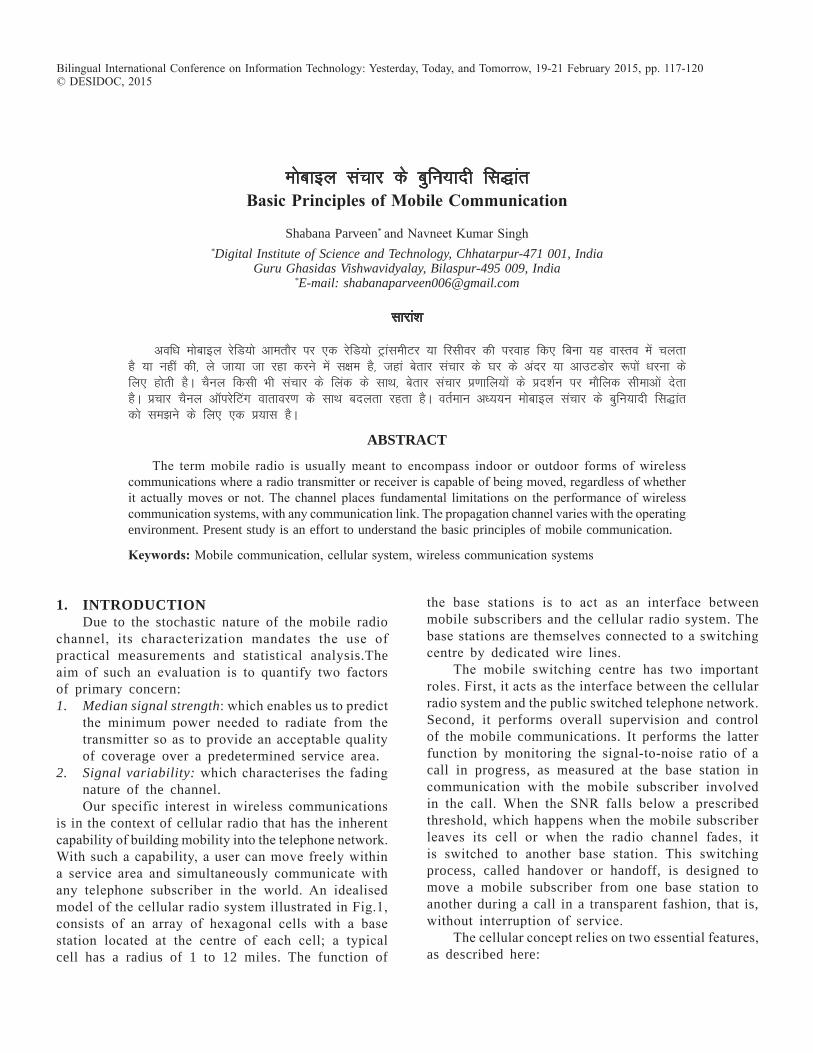
eksckby lapkj ds cqfu;knh fl)kar basic Principles of Mobile Communication
Shabana Parveen* and navneet Kumar Singh*Digital Institute of Science and Technology, Chhatarpur-471 001, India
Guru Ghasidas Vishwavidyalay, Bilaspur-495 009, India *E-mail: [email protected]
lkjka”k
vof/k eksckby jsfM;ks vkerkSj ij ,d jsfM;ks VªkalehVj ;k fjlhoj dh ijokg fd, fcuk ;g okLro esa pyrk gS ;k ugha dh] ys tk;k tk jgk djus esa l{ke gS] tgka csrkj lapkj ds ?kj ds vanj ;k vkmVMksj :iksa /kjuk ds fy, gksrh gSA pSuy fdlh Hkh lapkj ds fyad ds lkFk] csrkj lapkj ç.kkfy;ksa ds çn'kZu ij ekSfyd lhekvksa nsrk gSA çpkj pSuy v‚ijsfVax okrkoj.k ds lkFk cnyrk jgrk gSA orZeku v/;;u eksckby lapkj ds cqfu;knh fl)kar dks le>us ds fy, ,d ç;kl gSA
AbstrAct
The term mobile radio is usually meant to encompass indoor or outdoor forms of wireless communications where a radio transmitter or receiver is capable of being moved, regardless of whether it actually moves or not. The channel places fundamental limitations on the performance of wireless communication systems, with any communication link. The propagation channel varies with the operating environment. Present study is an effort to understand the basic principles of mobile communication.
Keywords: Mobile communication, cellular system, wireless communication systems
Bilingual International Conference on Information Technology: Yesterday, Today, and Tomorrow, 19-21 February 2015, pp. 117-120© DESIDOC, 2015
1. IntroductIonDue to the stochastic nature of the mobile radio
channel, its characterization mandates the use of practical measurements and statistical analysis.The aim of such an evaluation is to quantify two factors of primary concern:1. Median signal strength: which enables us to predict
the minimum power needed to radiate from the transmitter so as to provide an acceptable quality of coverage over a predetermined service area.
2. Signal variability: which characterises the fading nature of the channel.Our specific interest in wireless communications
is in the context of cellular radio that has the inherent capability of building mobility into the telephone network. With such a capability, a user can move freely within a service area and simultaneously communicate with any telephone subscriber in the world. An idealised model of the cellular radio system illustrated in Fig.1, consists of an array of hexagonal cells with a base station located at the centre of each cell; a typical cell has a radius of 1 to 12 miles. The function of
the base stations is to act as an interface between mobile subscribers and the cellular radio system. The base stations are themselves connected to a switching centre by dedicated wire lines.
The mobile switching centre has two important roles. First, it acts as the interface between the cellular radio system and the public switched telephone network. Second, it performs overall supervision and control of the mobile communications. It performs the latter function by monitoring the signal-to-noise ratio of a call in progress, as measured at the base station in communication with the mobile subscriber involved in the call. When the Snr falls below a prescribed threshold, which happens when the mobile subscriber leaves its cell or when the radio channel fades, it is switched to another base station. This switching process, called handover or handoff, is designed to move a mobile subscriber from one base station to another during a call in a transparent fashion, that is, without interruption of service.
The cellular concept relies on two essential features, as described here:

118
PArVEEn: BASIC PrInCIPlES OF MOBIlE COMMunICATIOn
2. FrEQUEnCY rEUsEThe term frequency reuse refers to the use of
radio channels on the same carrier frequency to cover different areas, which are physically separated from each other sufficiently to ensure that co-channel interference is not objectionable. Thus, instead of covering an entire local area by a single transmitter with high power at a high elevation, frequency reuse makes it possible to achieve two commonsense objectives: keep the transmitted power from each base station to a minimum, and position the antennae of the base stations just high enough to provide for the area coverage of the respective cells.
different directions. Thus, starting with any cell as a reference, we find the nearest co-channel cells by proceeding as follows:
Move i cells along any chain of hexagons, turn counter clockwise 60 degrees, and move j cells along the chain that lies on this new direction. The jth cells so located and the reference cell constitute the set of co-channel cells.
This procedure is repeated for a different reference cell, until all the cells in the system are covered. Figure 2 shows the application of this procedure for a single reference cell and the example of i = 2 and j = 2.
In north America, the band of radio frequencies assigned to the cellular system is 800-900 MHz. The subband 824-849 MHz is used to receive signals from the mobile units, and the subband 869-894 MHz is used to transmit signals to the mobile units. The use of these relatively high frequencies has the beneficial feature of providing a good portable coverage by penetrating buildings. In Europe and elsewhere, the base-mobile and mobile-base subbands are reversed.
Figure 1. idealised model of cellular radio system.
Figure 1. idealised model of cellular radio system.
3. CEll sPlittinGWhen the demand for service exceeds the number
of channels allocated to a particular cell, cell splitting is used to handle the additional growth in traffic within that particular cell. Specifically, cell splitting involves a revision of cell boundaries, so that the local area formerly regarded as a single cell can now contain a number of smaller cells and use the channel complements of these new cells. The new cells, which have a smaller radius than the original cells, are called micro cells. The transmitter power and the antennae height of the new base stations are correspondingly reduced, and the same set of frequencies are reused in accordance with a new plan.
For a hexagonal model of the cellular radio system, we may exploit the basic properties of hexagonal cellular geometry to lay out a radio channel assignment plan that determines which channel set should be assigned to which cell. We begin with two integers i and j (i≥j), called shift parameters, which are predetermined in some manner. We note that with a hexagonal cellular geometry there are six 'chains' of hexagons that emanate from each hexagon and that extend in
4. ProPAGAtion oF rAdio wAVEsThe major propagation problems encountered
in the use of cellular radio in built-up areas are due to the fact that the antenna of a mobile unit may lie well below the surrounding buildings. radio propagation takes place mainly by way of scattering from the surfaces of the surrounding buildings and by diffraction over and/or around them, as illustrated in Fig. 3. The important point to note from Fig. 3 is that energy reaches the receiving antenna via more than one path. Accordingly, we speak of a multipath phenomenon in that the various incoming radio waves reach their destination from different directions and with different time delays.
To understand the nature of the multipath phenomenon, consider first a static" multipath environment involving
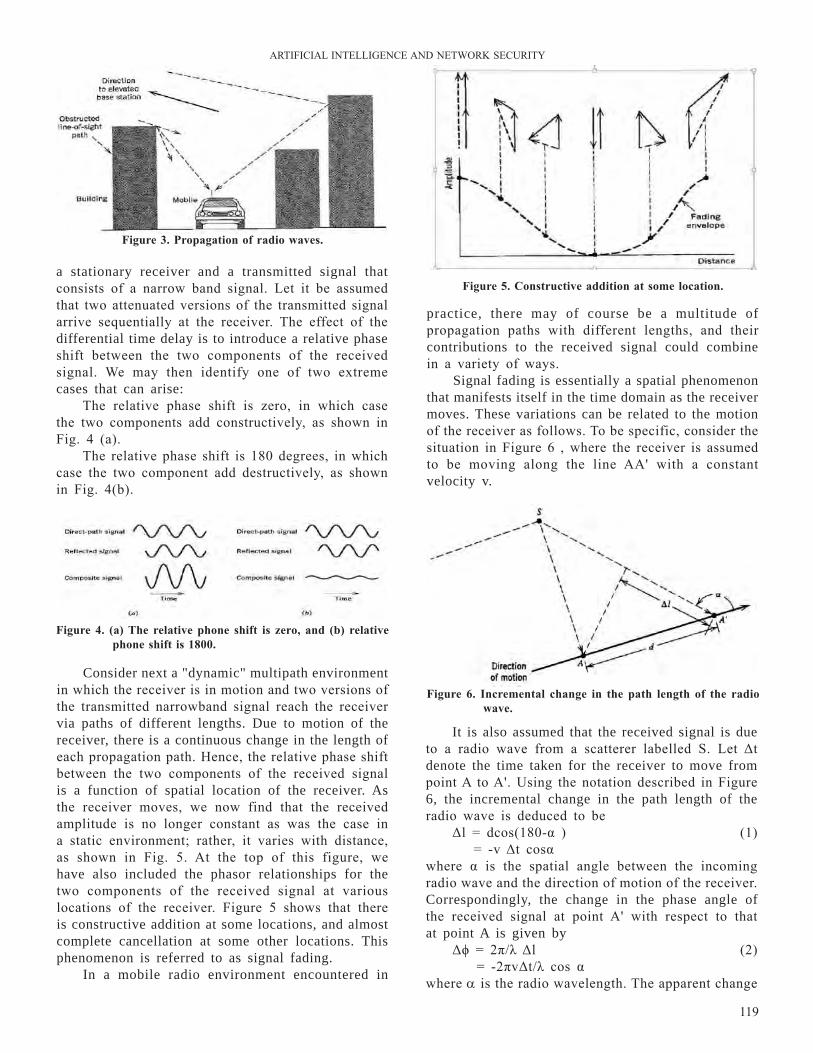
119
ArTIFICIAl InTEllIGEnCE AnD nETWOrK SECurITY
a stationary receiver and a transmitted signal that consists of a narrow band signal. let it be assumed that two attenuated versions of the transmitted signal arrive sequentially at the receiver. The effect of the differential time delay is to introduce a relative phase shift between the two components of the received signal. We may then identify one of two extreme cases that can arise:
The relative phase shift is zero, in which case the two components add constructively, as shown in Fig. 4 (a).
The relative phase shift is 180 degrees, in which case the two component add destructively, as shown in Fig. 4(b).
Figure 3. Propagation of radio waves.
Figure 4. (a) the relative phone shift is zero, and (b) relative phone shift is 1800.
Figure 5. Constructive addition at some location.
practice, there may of course be a multitude of propagation paths with different lengths, and their contributions to the received signal could combine in a variety of ways.
Signal fading is essentially a spatial phenomenon that manifests itself in the time domain as the receiver moves. These variations can be related to the motion of the receiver as follows. To be specific, consider the situation in Figure 6 , where the receiver is assumed to be moving along the line AA' with a constant velocity v.
Figure 6. incremental change in the path length of the radio wave.
It is also assumed that the received signal is due to a radio wave from a scatterer labelled S. let Δt denote the time taken for the receiver to move from point A to A'. using the notation described in Figure 6, the incremental change in the path length of the radio wave is deduced to be
Δl = dcos(180-α ) (1) = -v Δt cosα
where α is the spatial angle between the incoming radio wave and the direction of motion of the receiver. Correspondingly, the change in the phase angle of the received signal at point A' with respect to that at point A is given by
Δϕ = 2π/λ Δl (2) = -2πvΔt/λ cos α
where a is the radio wavelength. The apparent change
Consider next a "dynamic" multipath environment in which the receiver is in motion and two versions of the transmitted narrowband signal reach the receiver via paths of different lengths. Due to motion of the receiver, there is a continuous change in the length of each propagation path. Hence, the relative phase shift between the two components of the received signal is a function of spatial location of the receiver. As the receiver moves, we now find that the received amplitude is no longer constant as was the case in a static environment; rather, it varies with distance, as shown in Fig. 5. At the top of this figure, we have also included the phasor relationships for the two components of the received signal at various locations of the receiver. Figure 5 shows that there is constructive addition at some locations, and almost complete cancellation at some other locations. This phenomenon is referred to as signal fading.
In a mobile radio environment encountered in
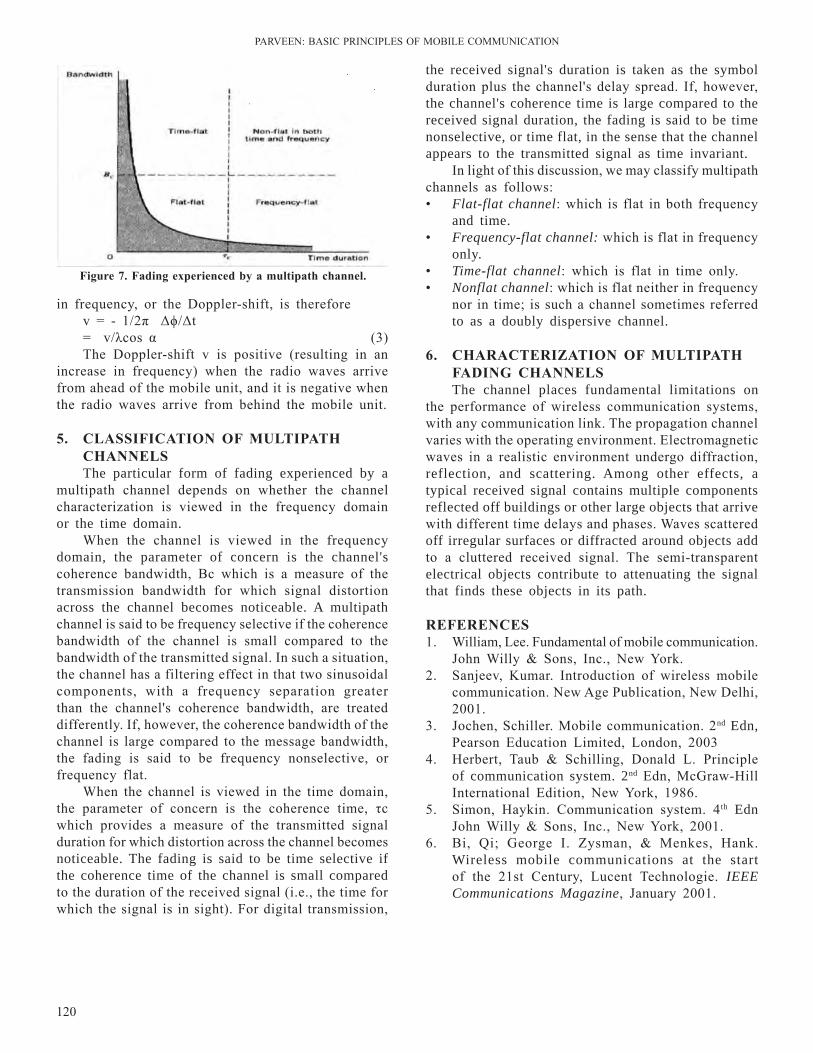
120
PArVEEn: BASIC PrInCIPlES OF MOBIlE COMMunICATIOn
in frequency, or the Doppler-shift, is thereforev = - 1/2π Δϕ/Δt= v/λcos α (3)The Doppler-shift v is positive (resulting in an
increase in frequency) when the radio waves arrive from ahead of the mobile unit, and it is negative when the radio waves arrive from behind the mobile unit.
5. ClAssiFiCAtion oF MUltiPAth ChAnnElsThe particular form of fading experienced by a
multipath channel depends on whether the channel characterization is viewed in the frequency domain or the time domain.
When the channel is viewed in the frequency domain, the parameter of concern is the channel's coherence bandwidth, Bc which is a measure of the transmission bandwidth for which signal distortion across the channel becomes noticeable. A multipath channel is said to be frequency selective if the coherence bandwidth of the channel is small compared to the bandwidth of the transmitted signal. In such a situation, the channel has a filtering effect in that two sinusoidal components, with a frequency separation greater than the channel's coherence bandwidth, are treated differently. If, however, the coherence bandwidth of the channel is large compared to the message bandwidth, the fading is said to be frequency nonselective, or frequency flat.
When the channel is viewed in the time domain, the parameter of concern is the coherence time, τc which provides a measure of the transmitted signal duration for which distortion across the channel becomes noticeable. The fading is said to be time selective if the coherence time of the channel is small compared to the duration of the received signal (i.e., the time for which the signal is in sight). For digital transmission,
the received signal's duration is taken as the symbol duration plus the channel's delay spread. If, however, the channel's coherence time is large compared to the received signal duration, the fading is said to be time nonselective, or time flat, in the sense that the channel appears to the transmitted signal as time invariant.
In light of this discussion, we may classify multipath channels as follows:• Flat-flat channel: which is flat in both frequency
and time.• Frequency-flat channel: which is flat in frequency
only.• Time-flat channel: which is flat in time only.• Nonflat channel: which is flat neither in frequency
nor in time; is such a channel sometimes referred to as a doubly dispersive channel.
6. ChArACtErizAtion oF MUltiPAth FAdinG ChAnnElsThe channel places fundamental limitations on
the performance of wireless communication systems, with any communication link. The propagation channel varies with the operating environment. Electromagnetic waves in a realistic environment undergo diffraction, reflection, and scattering. Among other effects, a typical received signal contains multiple components reflected off buildings or other large objects that arrive with different time delays and phases. Waves scattered off irregular surfaces or diffracted around objects add to a cluttered received signal. The semi-transparent electrical objects contribute to attenuating the signal that finds these objects in its path.
rEFErEnCEs1. William, lee. Fundamental of mobile communication.
John Willy & Sons, Inc., new York. 2. Sanjeev, Kumar. Introduction of wireless mobile
communication. new Age Publication, new Delhi, 2001.
3. Jochen, Schiller. Mobile communication. 2nd Edn, Pearson Education limited, london, 2003
4. Herbert, Taub & Schilling, Donald l. Principle of communication system. 2nd Edn, McGraw-Hill International Edition, new York, 1986.
5. Simon, Haykin. Communication system. 4 th Edn John Willy & Sons, Inc., new York, 2001.
6. Bi, qi; George I. Zysman, & Menkes, Hank. Wireless mobile communications at the start of the 21st Century, lucent Technologie. IEEE Communications Magazine, January 2001.
Figure 7. Fading experienced by a multipath channel.
vksQMh,e vkSj ih,ihvkj U;wuhdj.k ifj:i drjr fof/k oFdM and PAPr reduction using Clipping Method
Arun Kumar* and Manisha GuptaIEEE, Dept of ECE, JECRC University
*E-mail: [email protected]
lkjka”k
ok;jySl ek/;e fofHkUu izdkj ds geyksa ds fy, [kqys vkSj laosnu”khy gS vkSj ?kqliSfB;s vuk;kl gh uksM~l gSd dj ldrs gSaA xksiuh;rk vkSj izek.ku lqj{kk <kaps ds ewy rRo gSaA ok;jySl usVodZ vDlj lkafLFkfr topology ifjorZuksa] lhfer vkos’V fo”knrk bandwidth vkSj dsUnzh; fu;a=.k ds vHkko tSls dbZ dkjdksa dh otg ls vfLFkj vkSj vfo”oluh; gSaA ,d ekud lqj{kk <kaps dks ykxw djus ds fy, ,d fo”oluh; ewy izca/ku dh vkoî;drk gSA egŸoiw.kZ tkudkjh dks lk>k djus] egŸoiw.kZ tkudkjh dks forfjr djus vkSj fujlu e/; geyksa esa iq#’kksa dks jksdus tSls izLrkfor dk;ksZa esa oØ fQfVax ds Qk;nksa dk ykHk mBk;k tkrk gS A
AbstrAct
Due the increase in demand of high data rates in mobile communication, OFDM system is used in many applications. It efficiently overcomes the effect of inter-symbol interference caused due to the fading of the channel but peak to average power ratio (PAPr) is one of the disadvantages in OFDM system. In the first stage of the work, OFDM system is design with different modulation techniques like qAM, BPSK and qPSK and their Bit Error rate is defined. In the latter stage we work on reduction of PAPr by using a clipping Technique and we found the significant reduction in PAPr as compared to conventional clipping technique.
Keywords: OFDM, peak to average power ratio, BEr, ISI
Bilingual International Conference on Information Technology: Yesterday, Today, and Tomorrow, 19-21 February 2015, pp. 121-129© DESIDOC, 2015
1. IntroductIonIn a wireless broadcast system, OFDM plays
an important role and reduce the complexity of receiver, but in this process, channel estimation and synchronization is very important. The increase in data-speed in a mobile is a demand of many applications. It stil l uses a single carrier than due to the fading of the channel there will be a inter-symbol interference which greatly affects the performance of OFDM system1. OFDM system is a multi carrier transmission technique where the entire bandwidth is splitted into the number of orthogonal subcarriers. The symbol duration of subcarrier is set larger than delay spread of channel in order to reduce the ISI effect2. However, one of the drawbacks of OFDM system is PAPr which is due to the fluctuation of the amplitude which make the system much in-efficient [3]. The first multi-carrier technique was proposed by Chang4. Doelz, et. al. had designed a multi-carrier system for a single sideband channel5. The designed of multi-carrier
system with equalizer are discussed6,7,8. Septh had designed an OFDM receiver and has demodulated the signal and delivered the soft information to outer receiver for decoding 9. lu10 has consider space time codded OFDM and his results show a significant improvement in performance of OFDM by efficiently exploiting the spatial diversity and selective fading10. The OFDM system is designed by combining the different blocks as shown in Fig. 1 and its main function is to transmit the number of signals containing the different information at the same time11.
2. bAsiC oFdM sYstEM ModEllet us consider a complex symbol to be transmitted
using an OFDM technique. The modulated signal can be represented by following mathematical expression:
Yn(t) = ∑(k=0)(n-1) Y(n), Kej2πkΔft, o ≤ t ≤Ts
where Ts = Symbol duration, Δf = sub carrier spacing, n = number of Sub-channel.
To make the signal orthogonal,it should satisfy the

ArTIFICIAl InTEllIGEnCE AnD nETWOrK SECurITY
122
following condition, Ts.Δf = 1. With the orthogonal condition,the transmitted symbol Yn,k can be received by the receiver as described in following equation:
Yn(k)=1/Ts ∫oTs(Yn(t) e(-j2πkΔft)dt
With the cyclic Prefix the transmitted signal can be written as: T= Tg+Ts,Therefore
Yn(t+Ts)=∑(k=0)(n-1)Yn, K e(J2πkΔf(t+Ts)),-Tg≤ t≤Ts.
The impulse response of a channel is given by the following equation:
h (t)= h(t)=aiδ(t–ti)where ai and ti are delay and complex amplitude2 of ith path.
The received signal is given by:Xn(t)=∑_iYnx^k (t-ti)+ n (t),
where n(t) is noise of a signal.
3. ChArACtEristiCs oF oFdM siGnAlslet us consider a block of n symbols Y= [Yk],
where k=0, 1, 2, 3….n-1] is formed with modulating
Figure 1. overall spectrum or simple oFdM singnal shown with for sub-carriers within. note the zero crossings all correspond to peaks of adjacent sub-carriers.
Figure 2. block diagram of oFdM system.
symbols with set of subcarriers. The sub-carriers are orthogonal to each other, i.e., Fl = lΔF. The OFDM symbols can be written as:
y(t)=1/√n ∑_(l=0)(n-1)Xl e(j2πflt), 0<= t<=nTwhere J=√(-1).
now let us consider that input of OFDM signals are statistically independent and identically distributed if real part and imaginary part of OFDM signal ssare uncorrelated and orthogonal to each other. So considering the Central limit Theorem, where n is large, than the distribution of both real and imaginary signals approaches to Gaussian distribution with Zero and mean variance, i.e.,:
a^2=F [re{y(t))2+im(y(t)2 )]/2 . So the probability distribution function is
Pr(y(t)) =1/√2πσ e(-y(t)2/2σ2). The probability distribution function of OFDM signals when it is subjected to rayleigh Channel is express as: Pr(r)=2re(-r2), where r is the amplitude.
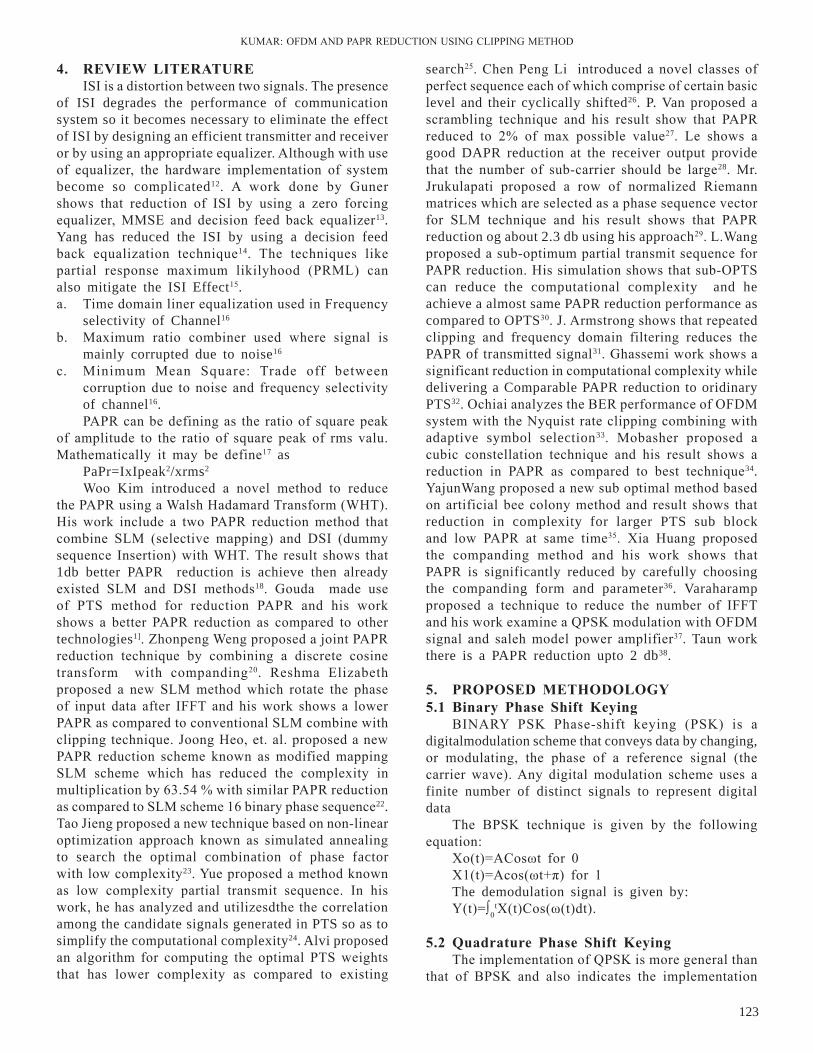
KuMAr: OFDM AnD PAPr rEDuCTIOn uSInG ClIPPInG METHOD
123
4. rEViEw litErAtUrEISI is a distortion between two signals. The presence
of ISI degrades the performance of communication system so it becomes necessary to eliminate the effect of ISI by designing an efficient transmitter and receiver or by using an appropriate equalizer. Although with use of equalizer, the hardware implementation of system become so complicated12. A work done by Guner shows that reduction of ISI by using a zero forcing equalizer, MMSE and decision feed back equalizer13. Yang has reduced the ISI by using a decision feed back equalization technique14. The techniques like partial response maximum likilyhood (PrMl) can also mitigate the ISI Effect15. a. Time domain liner equalization used in Frequency
selectivity of Channel16
b. Maximum ratio combiner used where signal is mainly corrupted due to noise16
c. Minimum Mean Square: Trade off between corruption due to noise and frequency selectivity of channel16.PAPr can be defining as the ratio of square peak
of amplitude to the ratio of square peak of rms valu. Mathematically it may be define17 as
PaPr=IxIpeak2/xrms2 Woo Kim introduced a novel method to reduce
the PAPr using a Walsh Hadamard Transform (WHT). His work include a two PAPr reduction method that combine SlM (selective mapping) and DSI (dummy sequence Insertion) with WHT. The result shows that 1db better PAPR reduction is achieve then already existed SlM and DSI methods18. Gouda made use of PTS method for reduction PAPr and his work shows a better PAPr reduction as compared to other technologies1]. Zhonpeng Weng proposed a joint PAPr reduction technique by combining a discrete cosine transform with companding20. reshma Elizabeth proposed a new SlM method which rotate the phase of input data after IFFT and his work shows a lower PAPr as compared to conventional SlM combine with clipping technique. Joong Heo, et. al. proposed a new PAPr reduction scheme known as modified mapping SlM scheme which has reduced the complexity in multiplication by 63.54 % with similar PAPr reduction as compared to SlM scheme 16 binary phase sequence22. Tao Jieng proposed a new technique based on non-linear optimization approach known as simulated annealing to search the optimal combination of phase factor with low complexity23. Yue proposed a method known as low complexity partial transmit sequence. In his work, he has analyzed and utilizesdthe the correlation among the candidate signals generated in PTS so as to simplify the computational complexity24. Alvi proposed an algorithm for computing the optimal PTS weights that has lower complexity as compared to existing
search25. Chen Peng li introduced a novel classes of perfect sequence each of which comprise of certain basic level and their cyclically shifted26. P. Van proposed a scrambling technique and his result show that PAPr reduced to 2% of max possible value27. le shows a good DAPR reduction at the receiver output provide that the number of sub-carrier should be large28. Mr. Jrukulapati proposed a row of normalized riemann matrices which are selected as a phase sequence vector for SlM technique and his result shows that PAPr reduction og about 2.3 db using his approach29. l.Wang proposed a sub-optimum partial transmit sequence for PAPr reduction. His simulation shows that sub-OPTS can reduce the computational complexity and he achieve a almost same PAPR reduction performance as compared to OPTS30. J. Armstrong shows that repeated clipping and frequency domain filtering reduces the PAPR of transmitted signal31. Ghassemi work shows a significant reduction in computational complexity while delivering a Comparable PAPR reduction to oridinary PTS32. Ochiai analyzes the BEr performance of OFDM system with the nyquist rate clipping combining with adaptive symbol selection33. Mobasher proposed a cubic constellation technique and his result shows a reduction in PAPr as compared to best technique34. YajunWang proposed a new sub optimal method based on artificial bee colony method and result shows that reduction in complexity for larger PTS sub block and low PAPr at same time35. Xia Huang proposed the companding method and his work shows that PAPR is significantly reduced by carefully choosing the companding form and parameter36. Varaharamp proposed a technique to reduce the number of IFFT and his work examine a qPSK modulation with OFDM signal and saleh model power amplifier37. Taun work there is a PAPR reduction upto 2 db38.
5. ProPosEd MEthodoloGY5.1 binary Phase shift Keying
BInArY PSK Phase-shift keying (PSK) is a digitalmodulation scheme that conveys data by changing, or modulating, the phase of a reference signal (the carrier wave). Any digital modulation scheme uses a finite number of distinct signals to represent digital data
The BPSK technique is given by the following equation:
Xo(t)=ACosωt for 0X1(t)=Acos(ωt+π) for 1The demodulation signal is given by:Y(t)=∫0
tX(t)Cos(ω(t)dt).
5.2 Quadrature Phase shift Keying The implementation of qPSK is more general than
that of BPSK and also indicates the implementation

ArTIFICIAl InTEllIGEnCE AnD nETWOrK SECurITY
124
table 6. bibliographical distribution of citations
bPsK QPsK QAMBernoulli Binary
Probability of zero=0.5Initial Seed=20394875Sample time =(4e-6)/24Sample per frame=24Output data type= boolean
BPSK modulator Baseband :Phase offset (rad)= 0 Output data type = double
Gain block Gain=1Multiplication= Element-wise(k.*u)Sample time=-1 for inherited.Integer routing mode= floor.Output data type= Inherit: same as input AWGn Channel:Initial seed= 1Mode= signal to noise ratio(Snr)Snr=15Input signal power=.01Input processing=inheritedState metric word length=16
error rate calculation block Receive Delay=34Computation Delay=0
Bernoulli Binary Probability of zero=0.5Initial Seed= 20394875Sample time =(4e-6)/48Sample per frame=48Output data type= boolean
qPSK modulator : Phase offset = pi/4Constellation Ordering= grayInput Data Type= bitOutput data type = double
Gain block Gain=1Multiplication= Element-wise(k.*u)Sample time=-1 for inherited.Integer routing mode= floor.Output data type= Inherit: same as input
AWGn Channel:Initial seed= 1Mode= signal to noise ratio(Snr)Snr=15Input signal power=.01Input processing=inherited qPSK Demodulation:Phase offset = pi/4Constellation Ordering= grayOutput data type = bitDecision type=Hard decision
error rate calculation :Receive Delay=34Computation Delay=0Computation Mode=Entire FrameOutput data=port
Bernoulli Binary Probability of zero=0.5Initial Seed=20394875Sample time =(4e-6)/144Sample per frame=144Output data type= boolean
rectangular 16-qAM:M-ary number=16Input type=BitConstellation ordering=Graynormalisation method= Min.distance between symbolsMinimum distance=2Phase offset(rad)=0Output data type= DoubleGain block Gain=1Multiplication= Element-wise(k.*u)Sample time=-1 for inherited.Integer routing mode= floor.Output data type= Inherit: same as input
AWGn Channel:Initial seed= 1Mode= signal to noise ratio(Snr)Snr=15Input signal power=.01Input processing=inherited
qAM Demodulator Baseband:M-ary number=16normalisation method= Min. Distance between Minimum distance=2Phase offset(rad)=0Costellation ordering= grayOutput type= BitDecision type= Hard decisionParameters of theerror rate calculation:Receive Delay=34Computation Delay=0Computation Mode=Entire Frame symbols Output data=port
of higher-order PSK. Writing the symbols in the constellation diagram in terms of the sine and cosine waves used to transmit them:
δn(t)=√2Es/Ts cos(2πfct+(2n-1) π/4, n=1,2,3,4This results in a two-dimensional signal space
with unit basis functionsΦ1(t)=√2/Ts cos(2πfct)Φ1(t)=√2/Ts sin(2πfct)The first basis function is used as the in-phase
component of the signal and the second as the quadrature
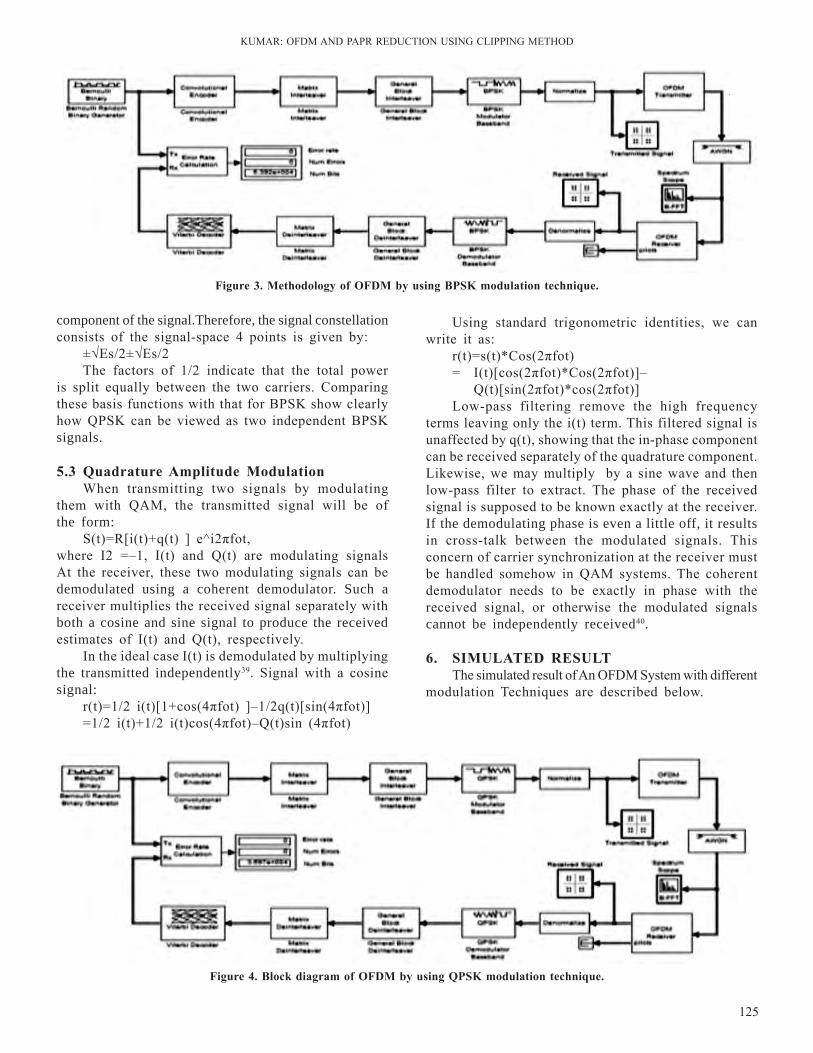
KuMAr: OFDM AnD PAPr rEDuCTIOn uSInG ClIPPInG METHOD
125
Figure 3. Methodology of oFdM by using bPsK modulation technique.
component of the signal.Therefore, the signal constellation consists of the signal-space 4 points is given by:
±√Es/2±√Es/2The factors of 1/2 indicate that the total power
is split equally between the two carriers. Comparing these basis functions with that for BPSK show clearly how qPSK can be viewed as two independent BPSK signals.
5.3 Quadrature Amplitude Modulation When transmitting two signals by modulating
them with qAM, the transmitted signal will be of the form:
S(t)=r[i(t)+q(t) ] e^i2πfot, where I2 =–1, I(t) and q(t) are modulating signals At the receiver, these two modulating signals can be demodulated using a coherent demodulator. Such a receiver multiplies the received signal separately with both a cosine and sine signal to produce the received estimates of I(t) and q(t), respectively.
In the ideal case I(t) is demodulated by multiplying the transmitted independently39. Signal with a cosine signal:
r(t)=1/2 i(t)[1+cos(4πfot) ]–1/2q(t)[sin(4πfot)] =1/2 i(t)+1/2 i(t)cos(4πfot)–q(t)sin (4πfot)
Figure 4. block diagram of oFdM by using QPsK modulation technique.
using standard trigonometric identities, we can write it as:
r(t)=s(t)*Cos(2πfot)= I(t)[cos(2πfot)*Cos(2πfot)]– q(t)[sin(2πfot)*cos(2πfot)]low-pass filtering remove the high frequency
terms leaving only the i(t) term. This filtered signal is unaffected by q(t), showing that the in-phase component can be received separately of the quadrature component. likewise, we may multiply by a sine wave and then low-pass filter to extract. The phase of the received signal is supposed to be known exactly at the receiver. If the demodulating phase is even a little off, it results in cross-talk between the modulated signals. This concern of carrier synchronization at the receiver must be handled somehow in qAM systems. The coherent demodulator needs to be exactly in phase with the received signal, or otherwise the modulated signals cannot be independently received40.
6. siMUlAtEd rEsUltThe simulated result of An OFDM System with different
modulation Techniques are described below.
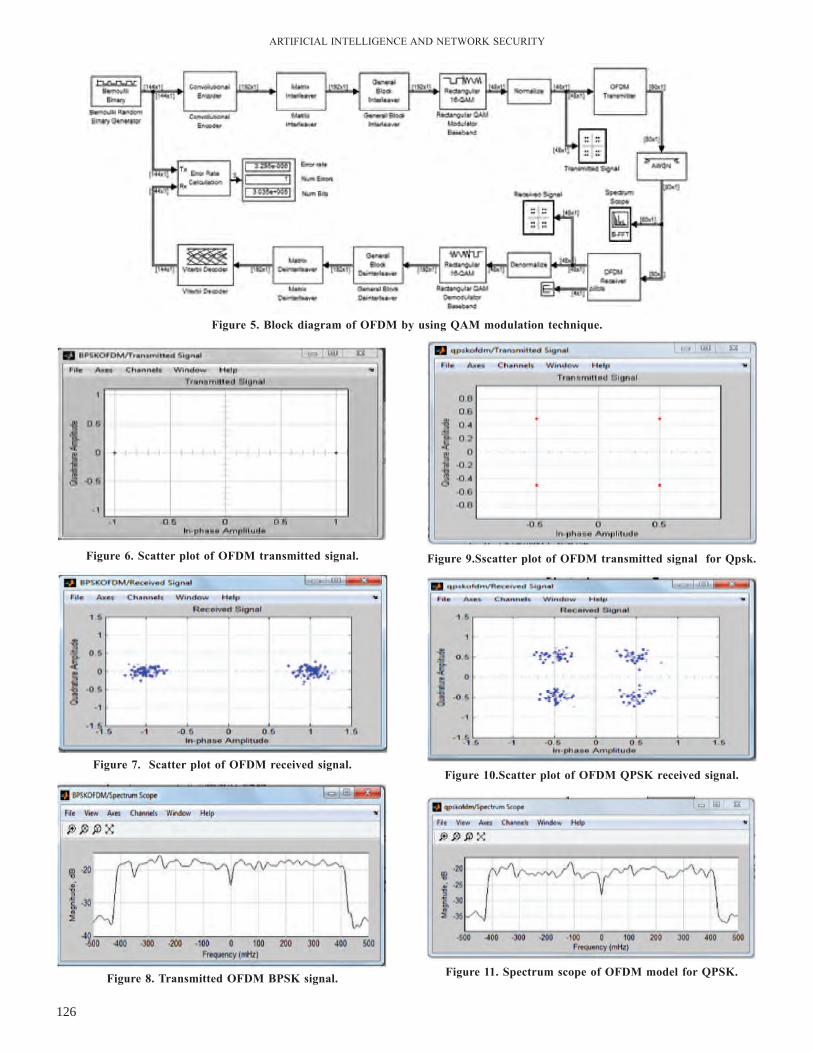
ArTIFICIAl InTEllIGEnCE AnD nETWOrK SECurITY
126
Figure 5. block diagram of oFdM by using QAM modulation technique.
Figure 6. scatter plot of oFdM transmitted signal.
Figure 7. scatter plot of oFdM received signal.
Figure 8. transmitted oFdM bPsK signal.
Figure 9.sscatter plot of oFdM transmitted signal for Qpsk.
Figure 10.scatter plot of oFdM QPsK received signal.
Figure 11. spectrum scope of oFdM model for QPsK.
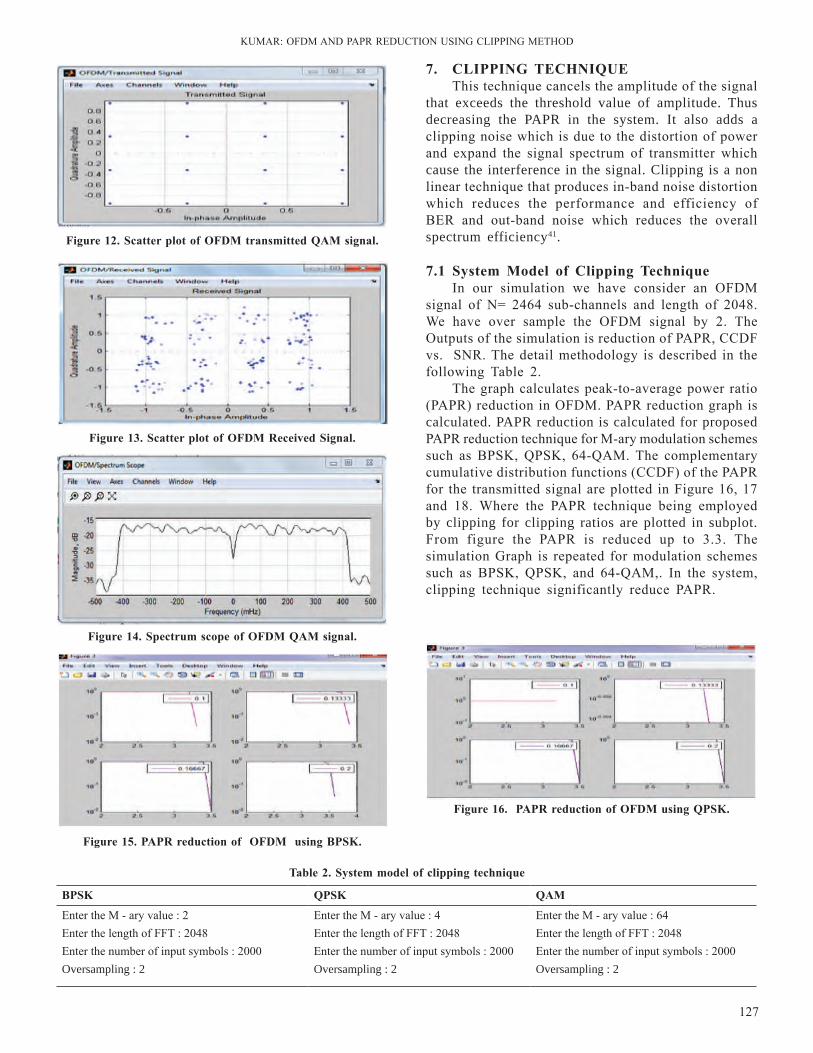
KuMAr: OFDM AnD PAPr rEDuCTIOn uSInG ClIPPInG METHOD
127
Figure 12. scatter plot of oFdM transmitted QAM signal.
Figure 13. scatter plot of oFdM received signal.
Figure 14. spectrum scope of oFdM QAM signal.
Figure 15. PAPr reduction of oFdM using bPsK.
7. CliPPinG tEChniQUEThis technique cancels the amplitude of the signal
that exceeds the threshold value of amplitude. Thus decreasing the PAPR in the system. It also adds a clipping noise which is due to the distortion of power and expand the signal spectrum of transmitter which cause the interference in the signal. Clipping is a non linear technique that produces in-band noise distortion which reduces the performance and efficiency of BEr and out-band noise which reduces the overall spectrum efficiency41.
7.1 system Model of Clipping techniqueIn our simulation we have consider an OFDM
signal of n= 2464 sub-channels and length of 2048. We have over sample the OFDM signal by 2. The Outputs of the simulation is reduction of PAPr, CCDF vs. Snr. The detail methodology is described in the following Table 2.
The graph calculates peak-to-average power ratio (PAPr) reduction in OFDM. PAPr reduction graph is calculated. PAPR reduction is calculated for proposed PAPr reduction technique for M-ary modulation schemes such as BPSK, qPSK, 64-qAM. The complementary cumulative distribution functions (CCDF) of the PAPr for the transmitted signal are plotted in Figure 16, 17 and 18. Where the PAPr technique being employed by clipping for clipping ratios are plotted in subplot. From figure the PAPr is reduced up to 3.3. The simulation Graph is repeated for modulation schemes such as BPSK, qPSK, and 64-qAM,. In the system, clipping technique significantly reduce PAPr.
bPsK QPsK QAM
Enter the M - ary value : 2Enter the length of FFT : 2048Enter the number of input symbols : 2000 Oversampling : 2
Enter the M - ary value : 4Enter the length of FFT : 2048Enter the number of input symbols : 2000Oversampling : 2
Enter the M - ary value : 64Enter the length of FFT : 2048Enter the number of input symbols : 2000Oversampling : 2
table 2. system model of clipping technique
Figure 16. PAPr reduction of oFdM using QPsK.
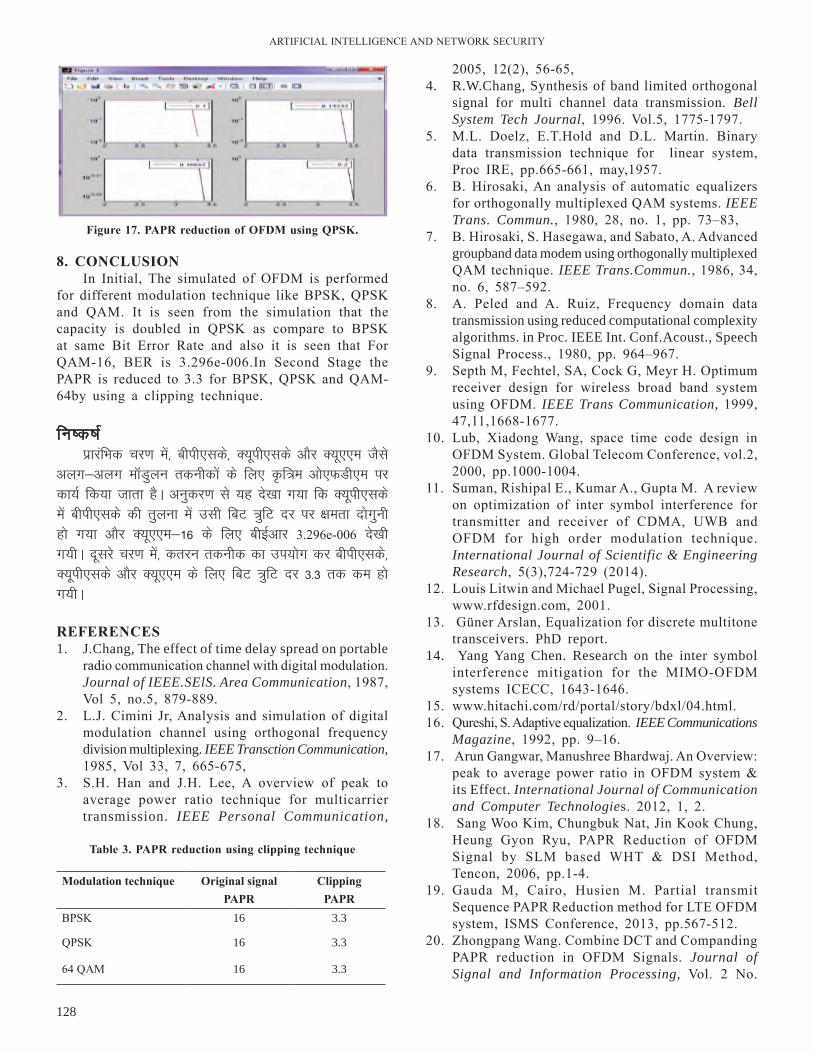
ArTIFICIAl InTEllIGEnCE AnD nETWOrK SECurITY
128
Figure 17. PAPr reduction of oFdM using QPsK.
table 3. PAPr reduction using clipping technique
8. ConClUsionIn Initial, The simulated of OFDM is performed
for different modulation technique like BPSK, qPSK and qAM. It is seen from the simulation that the capacity is doubled in qPSK as compare to BPSK at same Bit Error rate and also it is seen that For qAM-16, BEr is 3.296e-006.In Second Stage the PAPr is reduced to 3.3 for BPSK, qPSK and qAM-64by using a clipping technique.
fu’d’k ZizkjafHkd pj.k esa] chih,lds] D;wih,lds vkSj D;w,,e tSls
vyx&vyx ekWMqyu rduhdksa ds fy, —f=e vks,QMh,e ij dk;Z fd;k tkrk gSA vuqdj.k ls ;g ns[kk x;k fd D;wih,lds eas chih,lds dh rqyuk esa mlh fcV =qfV nj ij {kerk nksxquh gks x;k vkSj D;w,,e&16 ds fy, chbZvkj 3.296e-006 ns[kh x;hA nwljs pj.k esa] drju rduhd dk mi;ksx dj chih,lds] D;wih,lds vkSj D;w,,e ds fy, fcV =qfV nj 3-3 rd de gks x;hA
rEFErEnCEs1. J.Chang, The effect of time delay spread on portable
radio communication channel with digital modulation. Journal of IEEE.SElS. Area Communication, 1987, Vol 5, no.5, 879-889.
2. l.J. Cimini Jr, Analysis and simulation of digital modulation channel using orthogonal frequency division multiplexing. IEEE Transction Communication, 1985, Vol 33, 7, 665-675,
3. S.H. Han and J.H. lee, A overview of peak to average power ratio technique for multicarrier transmission. IEEE Personal Communication,
Modulation technique original signal PAPr
ClippingPAPr
BPSK 16 3.3
qPSK 16 3.3
64 qAM 16 3.3
2005, 12(2), 56-65, 4. R.W.Chang, Synthesis of band limited orthogonal
signal for multi channel data transmission. Bell System Tech Journal, 1996. Vol.5, 1775-1797.
5. M.l. Doelz, E.T.Hold and D.l. Martin. Binary data transmission technique for linear system, Proc IrE, pp.665-661, may,1957.
6. B. Hirosaki, An analysis of automatic equalizers for orthogonally multiplexed qAM systems. IEEE Trans. Commun., 1980, 28, no. 1, pp. 73–83,
7. B. Hirosaki, S. Hasegawa, and Sabato, A. Advanced groupband data modem using orthogonally multiplexed qAM technique. IEEE Trans.Commun., 1986, 34, no. 6, 587–592.
8. A. Peled and A. ruiz, Frequency domain data transmission using reduced computational complexity algorithms. in Proc. IEEE Int. Conf.Acoust., Speech Signal Process., 1980, pp. 964–967.
9. Septh M, Fechtel, SA, Cock G, Meyr H. Optimum receiver design for wireless broad band system using OFDM. IEEE Trans Communication, 1999, 47,11,1668-1677.
10. lub, Xiadong Wang, space time code design in OFDM System. Global Telecom Conference, vol.2, 2000, pp.1000-1004.
11. Suman, rishipal E., Kumar A., Gupta M. A review on optimization of inter symbol interference for transmitter and receiver of CDMA, uWB and OFDM for high order modulation technique. International Journal of Scientific & Engineering Research, 5(3),724-729 (2014).
12. louis litwin and Michael Pugel, Signal Processing, www.rfdesign.com, 2001.
13. Güner Arslan, Equalization for discrete multitone transceivers. PhD report.
14. Yang Yang Chen. Research on the inter symbol interference mitigation for the MIMO-OFDM systems ICECC, 1643-1646.
15. www.hitachi.com/rd/portal/story/bdxl/04.html.16. qureshi, S. Adaptive equalization. IEEE Communications
Magazine, 1992, pp. 9–16.17. Arun Gangwar, Manushree Bhardwaj. An Overview:
peak to average power ratio in OFDM system & its Effect. International Journal of Communication and Computer Technologies. 2012, 1, 2.
18. Sang Woo Kim, Chungbuk nat, Jin Kook Chung, Heung Gyon ryu, PAPr reduction of OFDM Signal by SlM based WHT & DSI Method, Tencon, 2006, pp.1-4.
19. Gauda M, Cairo, Husien M. Partial transmit Sequence PAPr reduction method for lTE OFDM system, ISMS Conference, 2013, pp.567-512.
20. Zhongpang Wang. Combine DCT and Companding PAPr reduction in OFDM Signals. Journal of Signal and Information Processing, Vol. 2 no.
KuMAr: OFDM AnD PAPr rEDuCTIOn uSInG ClIPPInG METHOD
129
2, 2011, pp. 100-10421. reshma Elizabeth regi, Haris P.A. Performance of
PAPr reduction in OFDM System with Complex Hadamard Sequence using SlM and Clipping.IJEAT, 2014, 3(4), pp.382-384.
22. Seok- Joong Heo, Hyung-Suknoh, Jong-Seono, Dong-John Shin, A modified SlM scheme with low complexity for PAPr reduction of OFDM System. PIMrC, 2007, pp.1-7.
23. Tao Jiang, weidong Xiang, richardson, P.C, Jinhua Guo. PAPr reduction of OFDM Signals using Partial Transmit Sequence with low computational Complexity, Broadcasting, IEEE Trans., 2007, 53, 3, pp. 719-724.
24. YueXiao, Xia, lei, qing Song Wen, Shaogian li. Signal processing Letter IEEE, 2010, 14, 10, 680-683.
25. Alauia A, Edmunton, Tellambura C, Fari I. PAPr reduction of OFDM Signal using Partial Transmit Sequence: An optimal approach using sphase decoding. Comm letters IEEE, 9(11), 2005, pp. 982-984.
26. Ching Peng li, Sen Hung Wang, Chin lieng Wong, novel low Complexity SlM Schemes for PAPr reduction in OFDM System, Signal Processing IEEE Trans, Vol.58, issue.5, 2010, pp.2916-2921.
27. P.Vaneetvelt, G.Wade, M.Momlinson, Peak to Average Power reduction OFDM Schemes by Selective Scrambling, Electronics letter, 32(1).1521, 1996,pp. 1963-1964.
28. le Goff, Sy, Al-Samahi, S.S, Boon lien khoo, Tsimenidis, C.C, Selected Mapping Without Side information PAPr reduction in OFDM, Wireless Communication Magazine,IEEE, 8(7), 2009, pp.3320-3325.
29. Irukulapati , nV, Chakka, VK, Jain A, SlM Based using new Phase Sequence, Electronics letters, 45(24), 2009, 1231-1232.
30. l. Wang, Y. Cao, Sub Optimum for PAPr reduction of OFDM Signal, Electronic letter , 44(15), 2008, pp.921-922.
31. J. Armstrong Peak to Average Power reduction for OFDM Signal by repeated Clipping and Frequency Domain, Electronics Letters, 38(5),
2002, pp.246-247. 32. Ghassemi A, Gulliver, T.A, PAPr reduction of
OFDM using PTS and Error Correcting Code sub-blocking, Wireless Commun. IEEE Trans., 9(3), 2010, 980-989.
33. Ochiai H, Imai H, Performance of Deliberate Clipping with adaptive Symbol Selection for strictly band limited OFDM System, IEEE Journal of Selected Area in Communication, 18, 11, 2002, pp.2270-2277.
34. Mosabher A, Khandani, AK, Integer Based Constellation Shaping Method For PAPr reduction in OFDM. IEEE Trans. Communication, 54(1), 2006, pp.119-127.
35. Yajun Wang, WenChen, Tellambara C, A PAPr reduction method based on artificial bee colony algorithm for optimum signals. IEEE Trans Wireless Communication, 9(10), 2010, 2994-2999.
36. Xiao Huang , Jianhua lu, Jhenli Zheang, letaicf, K.B, Companding Transform for reduction in Peak ratio of OFDM Signal. IEEE transaction on wireless communication, 3(6), 2005,pp/ 2030-2039.
37. Varahram P, Ali, BM, Partial Time Sequence Scheme with new Phase Sequence of PAPr reduction of OFDM System. IEEE Transac on Consumer Electronic, 57(2), 2011, 366-3721.
38. Tuan-Anh.Truong, Mathieu Azzel, Haolin, Burno Jahan, Michel Jezequel, DFT Precoded OFDM- An Alternate candidate for next generation Pons, Journal of Light Wave Technology, 2014, 32(6), pp.1128-1138.
39. ArunKumar, Manisha Gupta. Analysis and Simulation of CDMA qAM-16 for AWGn and rayleigh Channel. International Journal of Electronics Communication and Computer Engineering, 5(4), 2014, pp. 958-962.
40. Proakis J., Digital Communications, MA: McGraw Hill, Second Edition, Boston, (1994).
41. Davis, J. A. and J. Jedwab. Peak-to-mean power control in OFDM, Golay complementary sequences, and reed-Muller codes. IEEE Trans. Inform. Theory, 45, 2397–2417, nov. 1999.
cs,f'k;u lajpuk vk/kkfjr fo'ks"krk ekufp=.k dk mi;ksx djds eksckby ;qfä;ksa esa n{krkiw.kZ lalk/ku mi;ksx
Efficient resource Utilization in Mobile devices Using bayesian Framework based saliency Mapping
Praveen Kumar Yadav and n. ramasubramanianNational Institute of Technology, Tiruchirappalli, India
E-mail: [email protected], [email protected]
lkjka”k
ubZ çkS|ksfxdh dh çxfr ds lkFk eksckby ;qfä;ka mPp Lrj dh mi;ksfxrk,a çnku dj jgha gSaA ;s ;qfä;ka fofHkUu ç;kstuksa ds fy, O;kid jsat ds vuqç;ksx çnku djrh gSaA ohfM;ks Iys;j tSls vuqç;ksx mPp vfHkdyu 'kfä dh ekax djrs gSaA ohfM;ks uewuksa ds fy, Hkh mPp HkaMkj.k ¼LVksjst½ LFkku dh vko';drk gksrh gSA bl dk;Z esa] geus bu vis{kkvksa ds b"Vre mi;ksx ds fy, ,d fo'ks"krk ekufp=.k vk/kkfjr rjhds dks çLrqr fd;k gSA cs,f'k;u lajpuk vk/kkfjr fo'ks"krk ekufp=.k 'kh"kZ ls uhps dh vksj vkSj ry ls Åij dh vksj nksuksa ekufp=.k dks /;ku esa j[kus ds dkj.k cgqr dk;Zn{k gksrk gSA fo'ks"krk okys {ks= ds ckgj fiDlyksa dks /kqa/kyk dj fn;k tkrk gS rkfd ohfM;ks Iysf;ax ds fMdksfMax Qst ds nkSjku mu fo'ks"krkvksa dks ckgj fudkyus ds fy, vfHkdyu dks ?kVk;k tk ldsA pwafd /kqa/kykiu fufoZ?urk ds fy, ftEesokj gksrk gS] ;g ,udksfMax ds nkSjku vf/kd laihM+u çnku djrk gSA fo'ks"krk ekufp=.k dk mi;ksx djds lajpuk esa vkaf'kd ifjorZu ds dkj.k ohfM;ks dh xq.koÙkk leku cuh jgrh gSA
AbstrAct
Mobile devices are providing a high level of usability with the advancement of new technology. These devices provide a wide range of applications for various purposes. The applications like video players have a demand of high computation power. Video samples also require a high storage space. In this work, we have presented a saliency mapping-based approach for optimizing these requirements. The Bayesian framework based saliency mapping is efficient due to the consideration of both top-down and bottom-up mapping. Pixels outside the salient region are blurred to decrease the computations for extracting those features during the decoding phase of video playing. Since blurring is responsible for smoothing, it gives more compression during encoding. Because of the partial modification in a frame using saliency mapping, the quality of the video remains the same.
Keywords: Mobile devices, usability, saliency map, region of interest
Bilingual International Conference on Information Technology: Yesterday, Today, and Tomorrow, 19-21 February 2015, pp. 130-133© DESIDOC, 2015
1. IntroductIonThe advancement in technology has increased the
mobility of computational resources. A major shift has been observed in recent years, from traditional computing to mobile one. The new class of mobile device is equipped with various features like Wi-Fi, graphics processing unit, high definition camera and display, GPS, etc. The development of a new range of operating systems like Android and iOS has added support to it. While these features are very promising in terms of usability and availability, but lacks in terms of resources like computing power and local storage memory.1 Various approaches have been proposed in the past for sharing the computational loads through the grid and pervasive computing. But these are limited
by the availability and quality on the interconnection of computational point2. Video players are one of the important features of mobile devices. Playing video in a mobile device is very costly in terms of computation and storage requirement.
To manage the resources efficiently on mobile devices, it is necessary to optimize the existing computational capacity. The work presented here manages the features of video playing on mobile devices based on Bayesian framework saliency mapping. The saliency map helps in maintaining the quality of video while features are modified to optimize the processing power and storage. The work is implemented and tested on Android-based Akash ubiSlate7C+ tablet.
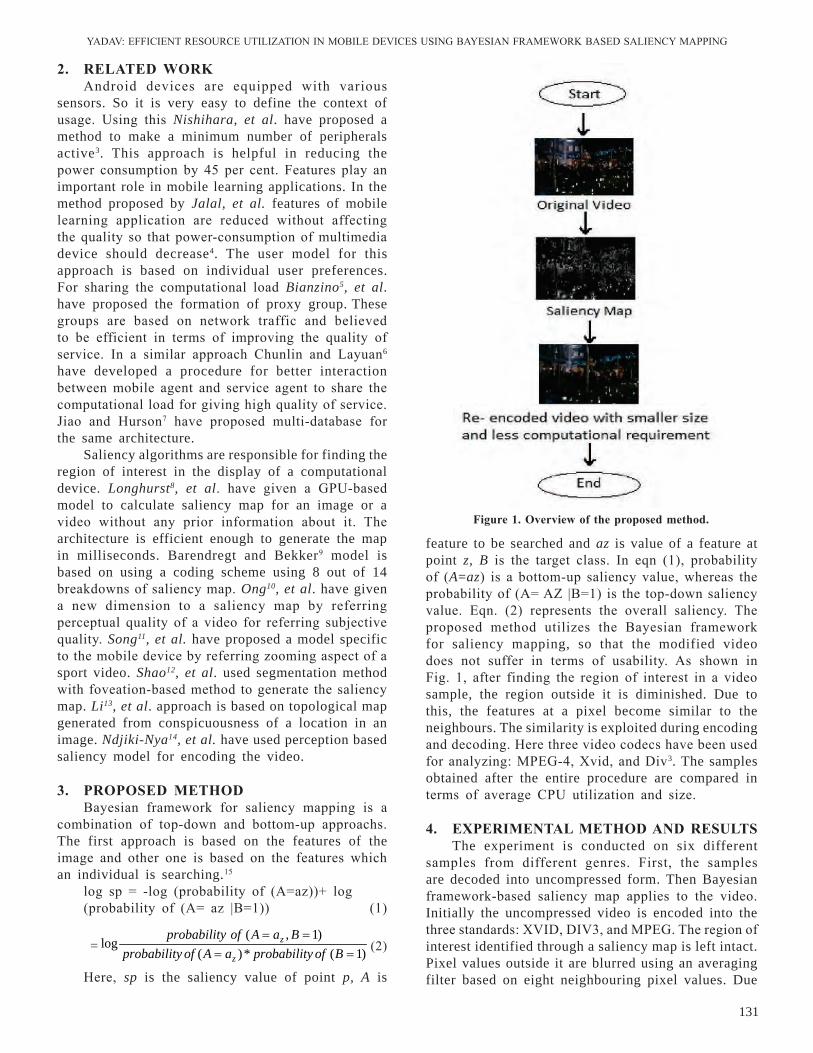
YADAV: EFFICIEnT rESOurCE uTIlIZATIOn In MOBIlE DEVICES uSInG BAYESIAn FrAMEWOrK BASED SAlIEnCY MAPPInG
131
2. rElAtEd worKAndroid devices are equipped with various
sensors. So it is very easy to define the context of usage. using this Nishihara, et al. have proposed a method to make a minimum number of peripherals active3. This approach is helpful in reducing the power consumption by 45 per cent. Features play an important role in mobile learning applications. In the method proposed by Jalal, et al. features of mobile learning application are reduced without affecting the quality so that power-consumption of multimedia device should decrease4. The user model for this approach is based on individual user preferences. For sharing the computational load Bianzino5, et al. have proposed the formation of proxy group. These groups are based on network traffic and believed to be efficient in terms of improving the quality of service. In a similar approach Chunlin and layuan6 have developed a procedure for better interaction between mobile agent and service agent to share the computational load for giving high quality of service. Jiao and Hurson7 have proposed multi-database for the same architecture.
Saliency algorithms are responsible for finding the region of interest in the display of a computational device. Longhurst8, et al. have given a GPu-based model to calculate saliency map for an image or a video without any prior information about it. The architecture is efficient enough to generate the map in milliseconds. Barendregt and Bekker9 model is based on using a coding scheme using 8 out of 14 breakdowns of saliency map. Ong10, et al. have given a new dimension to a saliency map by referring perceptual quality of a video for referring subjective quality. Song11, et al. have proposed a model specific to the mobile device by referring zooming aspect of a sport video. Shao12, et al. used segmentation method with foveation-based method to generate the saliency map. Li13, et al. approach is based on topological map generated from conspicuousness of a location in an image. Ndjiki-Nya14, et al. have used perception based saliency model for encoding the video.
3. ProPosEd MEthodBayesian framework for saliency mapping is a
combination of top-down and bottom-up approachs. The first approach is based on the features of the image and other one is based on the features which an individual is searching.15
log sp = -log (probability of (A=az))+ log (probability of (A= az |B=1)) (1)
=( , 1)
log( )* ( 1)
z
z
probability of A a Bprobability of A a probability of B
= == = (2)
Here, sp is the saliency value of point p, A is
feature to be searched and az is value of a feature at point z, B is the target class. In eqn (1), probability of (A=az) is a bottom-up saliency value, whereas the probability of (A= AZ |B=1) is the top-down saliency value. Eqn. (2) represents the overall saliency. The proposed method utilizes the Bayesian framework for saliency mapping, so that the modified video does not suffer in terms of usability. As shown in Fig. 1, after finding the region of interest in a video sample, the region outside it is diminished. Due to this, the features at a pixel become similar to the neighbours. The similarity is exploited during encoding and decoding. Here three video codecs have been used for analyzing: MPEG-4, Xvid, and Div3. The samples obtained after the entire procedure are compared in terms of average CPu utilization and size.
4. ExPEriMEntAl MEthod And rEsUltsThe experiment is conducted on six different
samples from different genres. First, the samples are decoded into uncompressed form. Then Bayesian framework-based saliency map applies to the video. Initially the uncompressed video is encoded into the three standards: XVID, DIV3, and MPEG. The region of interest identified through a saliency map is left intact. Pixel values outside it are blurred using an averaging filter based on eight neighbouring pixel values. Due
Figure 1. overview of the proposed method.
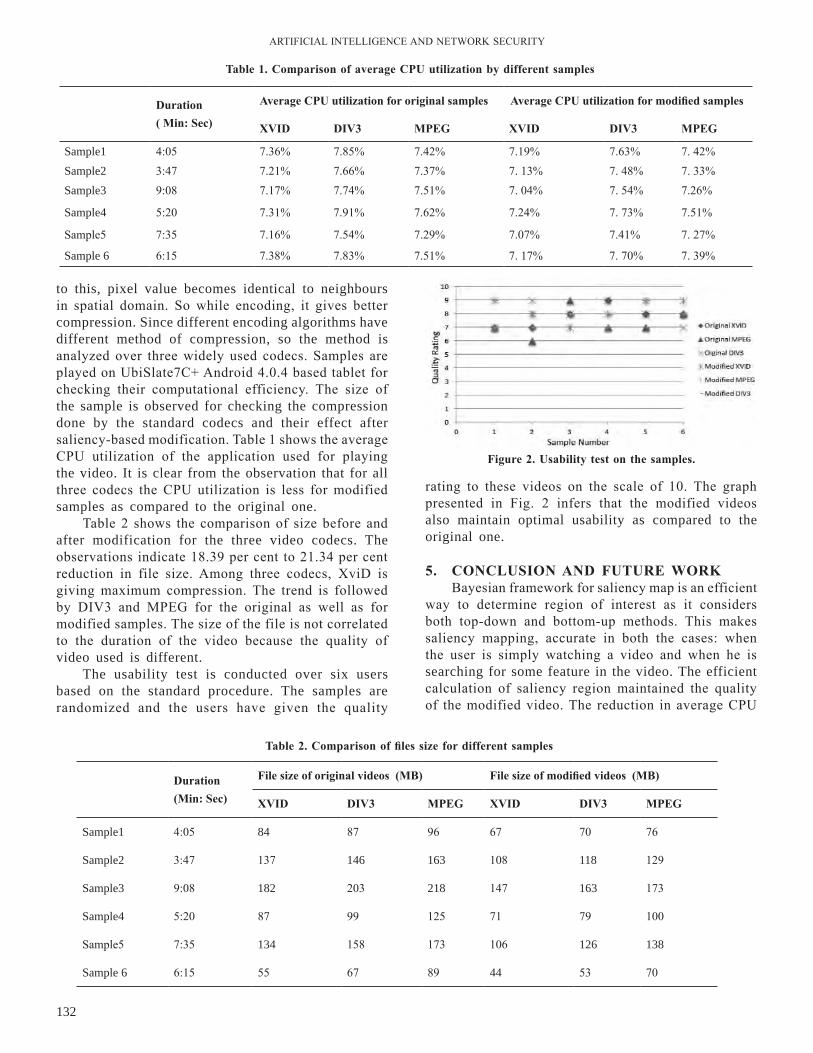
ArTIFICIAl InTEllIGEnCE AnD nETWOrK SECurITY
132
to this, pixel value becomes identical to neighbours in spatial domain. So while encoding, it gives better compression. Since different encoding algorithms have different method of compression, so the method is analyzed over three widely used codecs. Samples are played on ubiSlate7C+ Android 4.0.4 based tablet for checking their computational efficiency. The size of the sample is observed for checking the compression done by the standard codecs and their effect after saliency-based modification. Table 1 shows the average CPu utilization of the application used for playing the video. It is clear from the observation that for all three codecs the CPu utilization is less for modified samples as compared to the original one.
Table 2 shows the comparison of size before and after modification for the three video codecs. The observations indicate 18.39 per cent to 21.34 per cent reduction in file size. Among three codecs, XviD is giving maximum compression. The trend is followed by DIV3 and MPEG for the original as well as for modified samples. The size of the file is not correlated to the duration of the video because the quality of video used is different.
The usability test is conducted over six users based on the standard procedure. The samples are randomized and the users have given the quality
rating to these videos on the scale of 10. The graph presented in Fig. 2 infers that the modified videos also maintain optimal usability as compared to the original one.
5. ConClUsion And FUtUrE worKBayesian framework for saliency map is an efficient
way to determine region of interest as it considers both top-down and bottom-up methods. This makes saliency mapping, accurate in both the cases: when the user is simply watching a video and when he is searching for some feature in the video. The efficient calculation of saliency region maintained the quality of the modified video. The reduction in average CPu
table 1. Comparison of average CPU utilization by different samples
table 2. Comparison of files size for different samples
duration( Min: sec)
Average CPU utilization for original samples Average CPU utilization for modified samples
xVid diV3 MPEG xVid diV3 MPEG
Sample1 4:05 7.36% 7.85% 7.42% 7.19% 7.63% 7. 42%Sample2 3:47 7.21% 7.66% 7.37% 7. 13% 7. 48% 7. 33%Sample3 9:08 7.17% 7.74% 7.51% 7. 04% 7. 54% 7.26%
Sample4 5:20 7.31% 7.91% 7.62% 7.24% 7. 73% 7.51%
Sample5 7:35 7.16% 7.54% 7.29% 7.07% 7.41% 7. 27%
Sample 6 6:15 7.38% 7.83% 7.51% 7. 17% 7. 70% 7. 39%
duration(Min: sec)
File size of original videos (Mb) File size of modified videos (Mb)
xVid diV3 MPEG xVid diV3 MPEG
Sample1 4:05 84 87 96 67 70 76
Sample2 3:47 137 146 163 108 118 129
Sample3 9:08 182 203 218 147 163 173
Sample4 5:20 87 99 125 71 79 100
Sample5 7:35 134 158 173 106 126 138
Sample 6 6:15 55 67 89 44 53 70
Figure 2. Usability test on the samples.
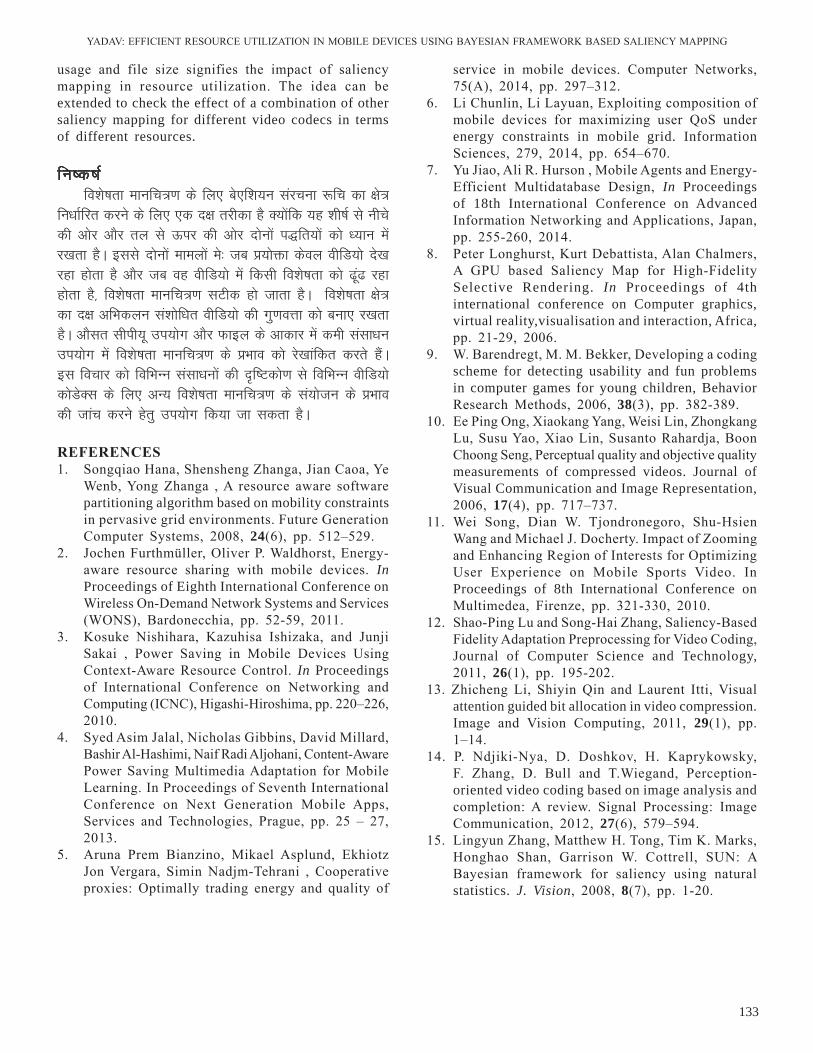
YADAV: EFFICIEnT rESOurCE uTIlIZATIOn In MOBIlE DEVICES uSInG BAYESIAn FrAMEWOrK BASED SAlIEnCY MAPPInG
133
usage and file size signifies the impact of saliency mapping in resource utilization. The idea can be extended to check the effect of a combination of other saliency mapping for different video codecs in terms of different resources.
fu’d’k Zfo'ks"krk ekufp=.k ds fy, cs,f'k;u lajpuk :fp dk {ks=
fu/kkZfjr djus ds fy, ,d n{k rjhdk gS D;ksafd ;g 'kh"kZ ls uhps dh vksj vkSj ry ls Åij dh vksj nksuksa i)fr;ksa dks /;ku esa j[krk gSA blls nksuksa ekeyksa es% tc ç;ksäk dsoy ohfM;ks ns[k jgk gksrk gS vkSj tc og ohfM;ks esa fdlh fo'ks"krk dks <wa< jgk gksrk gS] fo'ks"krk ekufp=.k lVhd gks tkrk gSA fo'ks"krk {ks= dk n{k vfHkdyu la'kksf/kr ohfM;ks dh xq.koÙkk dks cuk, j[krk gSA vkSlr lhih;w mi;ksx vkSj Qkby ds vkdkj esa deh lalk/ku mi;ksx esa fo'ks"krk ekufp=.k ds çHkko dks js[kkafdr djrs gSaA bl fopkj dks fofHkUu lalk/kuksa dh –f"Vdks.k ls fofHkUu ohfM;ks dksMsDl ds fy, vU; fo'ks"krk ekufp=.k ds la;kstu ds çHkko dh tkap djus gsrq mi;ksx fd;k tk ldrk gSA
rEFErEnCEs1. Songqiao Hana, Shensheng Zhanga, Jian Caoa, Ye
Wenb, Yong Zhanga , A resource aware software partitioning algorithm based on mobility constraints in pervasive grid environments. Future Generation Computer Systems, 2008, 24(6), pp. 512–529.
2. Jochen Furthmüller, Oliver P. Waldhorst, Energy-aware resource sharing with mobile devices. In Proceedings of Eighth International Conference on Wireless On-Demand network Systems and Services (WOnS), Bardonecchia, pp. 52-59, 2011.
3. Kosuke nishihara, Kazuhisa Ishizaka, and Junji Sakai , Power Saving in Mobile Devices using Context-Aware resource Control. In Proceedings of International Conference on networking and Computing (ICnC), Higashi-Hiroshima, pp. 220–226, 2010.
4. Syed Asim Jalal, nicholas Gibbins, David Millard, Bashir Al-Hashimi, naif radi Aljohani, Content-Aware Power Saving Multimedia Adaptation for Mobile learning. In Proceedings of Seventh International Conference on next Generation Mobile Apps, Services and Technologies, Prague, pp. 25 – 27, 2013.
5. Aruna Prem Bianzino, Mikael Asplund, Ekhiotz Jon Vergara, Simin nadjm-Tehrani , Cooperative proxies: Optimally trading energy and quality of
service in mobile devices. Computer networks, 75(A), 2014, pp. 297–312.
6. li Chunlin, li layuan, Exploiting composition of mobile devices for maximizing user qoS under energy constraints in mobile grid. Information Sciences, 279, 2014, pp. 654–670.
7. Yu Jiao, Ali r. Hurson , Mobile Agents and Energy-Efficient Multidatabase Design, In Proceedings of 18th International Conference on Advanced Information networking and Applications, Japan, pp. 255-260, 2014.
8. Peter longhurst, Kurt Debattista, Alan Chalmers, A GPu based Saliency Map for High-Fidelity Selective Rendering. In Proceedings of 4th international conference on Computer graphics, virtual reality,visualisation and interaction, Africa, pp. 21-29, 2006.
9. W. Barendregt, M. M. Bekker, Developing a coding scheme for detecting usability and fun problems in computer games for young children, Behavior research Methods, 2006, 38(3), pp. 382-389.
10. Ee Ping Ong, Xiaokang Yang, Weisi lin, Zhongkang lu, Susu Yao, Xiao lin, Susanto rahardja, Boon Choong Seng, Perceptual quality and objective quality measurements of compressed videos. Journal of Visual Communication and Image Representation, 2006, 17(4), pp. 717–737.
11. Wei Song, Dian W. Tjondronegoro, Shu-Hsien Wang and Michael J. Docherty. Impact of Zooming and Enhancing region of Interests for Optimizing user Experience on Mobile Sports Video. In Proceedings of 8th International Conference on Multimedea, Firenze, pp. 321-330, 2010.
12. Shao-Ping lu and Song-Hai Zhang, Saliency-Based Fidelity Adaptation Preprocessing for Video Coding, Journal of Computer Science and Technology, 2011, 26(1), pp. 195-202.
13. Zhicheng li, Shiyin qin and laurent Itti, Visual attention guided bit allocation in video compression. Image and Vision Computing, 2011, 29(1), pp. 1–14.
14. P. ndjiki-nya, D. Doshkov, H. Kaprykowsky, F. Zhang, D. Bull and T.Wiegand, Perception-oriented video coding based on image analysis and completion: A review. Signal Processing: Image Communication, 2012, 27(6), 579–594.
15. lingyun Zhang, Matthew H. Tong, Tim K. Marks, Honghao Shan, Garrison W. Cottrell, Sun: A Bayesian framework for saliency using natural statistics. J. Vision, 2008, 8(7), pp. 1-20.
O;k[;ku ladsrksa ds fy, fMftVy flXuy çkslsflax digital signal Processing for speech signals
nilu Singh* and r. A. KhanBabasaheb Bhimrao Ambedkar University, Lucknow, India
*E-mail: [email protected]
lkjka”k
bl vkys[k esa O;k[;ku ladsrks ds fy, fMftVy flXuy çkslsflax ¼Mh,lih½ rduhdksa dh vuqç;ksfxrk,¡] mi;ksfxrkvksa vkSj uqDlkuksa dk laf{kIr fooj.k çLrqr djrk gSA Mh,lih rduhdksa dk fodkl fiNys pkj n”kdksa esa fd;k x;k gS vkSj ;g foKku vkSj vfHk;kaf=dh ds {ks= esa vkrk gSA ysfdu tc ge pkj n”kd igys ds le; ds ckjs es ckr djrs gSa rks ml le; fMftVy dEi;wVj vkSj mlls lEcfU/kr gkMZos;j cgqr cMs vkdkj ds vkSj cgqr egaxsa gksrs Fks vkSj mudk mi;ksx lhfer FkkA blfy, bl {ks= esa rsth ls gq, cnyko us fMftVy daI;wVj çkS|ksfxdh vkSj buVhxzsfVM lfdZV Qscfjdsu esa ykHk fd;k gSA fQj Hkh Mh,lih es gksus okyh lHkh ladsrksa çlaLdj.k dh eqlhcrksa esa dqN lq/kkjksa dh vko”;drk gSA Mh,lih lapj.k ek/;e esa bysDVªksesxusfVd ladsrksa ds lEcfU/kr gSa vkSj ;g O;k[;ku çlaLdj.k leL;kvksa esa igyh ckj ykxw fd;k x;k gSA
AbstrActThis paper gives an overview of digital signal processing (DSP) techniques for speech signals its
applications, advantage and disadvantage. About 4 decades ago digital computers and associated digital hardware were large in size and more expensive, also their uses were limited. Hence the fast changes in this field provide the advantage in digital computers technology and integrated circuit fabrications. Still there are some improvements needed for all signal processing troubles in DSP. DSP concerns with electromagnetic signals across a transmission medium and it is first time implemented in speech processing problems.
Keywords: Digital Signal Processing, analog signal, digital signal, sampling, systems and signals
Bilingual International Conference on Information Technology: Yesterday, Toady, and Tomorrow, 19-21 Feburary 2015, pp. 134-138 © DESIDOC, 2015
1. IntroductIonA Digital Signal Processing is an integrated circuit
designed for high speed data handling and it is also a method of examining and modifying a signal to improve its effectiveness. It involves applying various mathematical and computational algorithms to produce a signal that’s of higher value than the original signal. Fast and continuous development in the field of digital signal processing techniques, provide procedures in many areas in reference to analog signal processing. In recent times DSP is used in many types of signal analyses such as speech signal processing, biomedical signal processing, geophysical signal processing, and telecommunication, etc1,2.
Digital Signal Processing is the discipline of using computers to understand digital models of the existing technology today. 1960s is known as the uprising year for DSP now it is necessary to the development of radar, sonar and space exploration etc. DSP used for implementation and many other fields that utilize it has developed technology with their
specialized techniques, specific algorithms and their arithmetic3. DSP improves the accuracy and reliability in the field of digital communication. usually DSP first converts an analog signal into a digital signal and then be relevant signal processing techniques and algorithms; DSP also helps to reduce noise and distortion. The fundamental of DSP is that it works by standardizing the levels of a signal. As it is known that all communication channels hold some background noise whether the signal are analog or digital, and apart from what type of information is conveyed. This noise in reference to some signal is known as signal to noise ratio for communication system, and one always tres to find how it improves. Suppose that an incoming analog signal such as a television broadcast station, the signal is first converted to digital using analog-to-digital converter (ADC) and resulting digital signal has two or more levels, these levels are always knowable. Since incoming signal contains noise hence many times levels are not at the typical values, so the DSP circuits correct the values
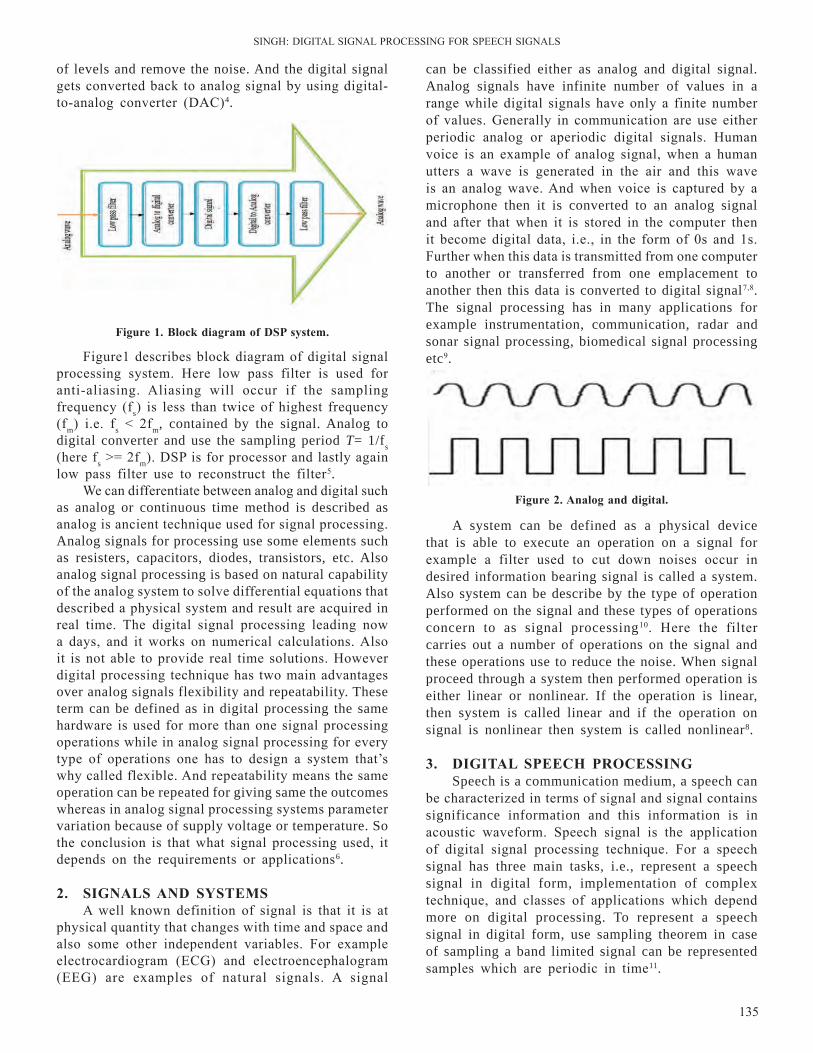
SInGH: DIGITAl SIGnAl PrOCESSInG FOr SPEECH SIGnAlS
135
Figure 1. block diagram of dsP system.
Figure 2. Analog and digital.
of levels and remove the noise. And the digital signal gets converted back to analog signal by using digital-to-analog converter (DAC)4.
can be classified either as analog and digital signal. Analog signals have infinite number of values in a range while digital signals have only a finite number of values. Generally in communication are use either periodic analog or aperiodic digital signals. Human voice is an example of analog signal, when a human utters a wave is generated in the air and this wave is an analog wave. And when voice is captured by a microphone then it is converted to an analog signal and after that when it is stored in the computer then it become digital data, i.e., in the form of 0s and 1s. Further when this data is transmitted from one computer to another or transferred from one emplacement to another then this data is converted to digital signal7,8. The signal processing has in many applications for example instrumentation, communication, radar and sonar signal processing, biomedical signal processing etc9. Figure1 describes block diagram of digital signal
processing system. Here low pass filter is used for anti-aliasing. Aliasing will occur if the sampling frequency (fs) is less than twice of highest frequency (fm) i.e. fs < 2fm, contained by the signal. Analog to digital converter and use the sampling period T= 1/fs (here fs >= 2fm). DSP is for processor and lastly again low pass filter use to reconstruct the filter5.
We can differentiate between analog and digital such as analog or continuous time method is described as analog is ancient technique used for signal processing. Analog signals for processing use some elements such as resisters, capacitors, diodes, transistors, etc. Also analog signal processing is based on natural capability of the analog system to solve differential equations that described a physical system and result are acquired in real time. The digital signal processing leading now a days, and it works on numerical calculations. Also it is not able to provide real time solutions. However digital processing technique has two main advantages over analog signals flexibility and repeatability. These term can be defined as in digital processing the same hardware is used for more than one signal processing operations while in analog signal processing for every type of operations one has to design a system that’s why called flexible. And repeatability means the same operation can be repeated for giving same the outcomes whereas in analog signal processing systems parameter variation because of supply voltage or temperature. So the conclusion is that what signal processing used, it depends on the requirements or applications6.
2. siGnAls And sYstEMsA well known definition of signal is that it is at
physical quantity that changes with time and space and also some other independent variables. For example electrocardiogram (ECG) and electroencephalogram (EEG) are examples of natural signals. A signal
A system can be defined as a physical device that is able to execute an operation on a signal for example a filter used to cut down noises occur in desired information bearing signal is called a system. Also system can be describe by the type of operation performed on the signal and these types of operations concern to as signal processing10. Here the filter carries out a number of operations on the signal and these operations use to reduce the noise. When signal proceed through a system then performed operation is either linear or nonlinear. If the operation is linear, then system is called linear and if the operation on signal is nonlinear then system is called nonlinear8.
3. diGitAl sPEECh ProCEssinG
Speech is a communication medium, a speech can be characterized in terms of signal and signal contains significance information and this information is in acoustic waveform. Speech signal is the application of digital signal processing technique. For a speech signal has three main tasks, i.e., represent a speech signal in digital form, implementation of complex technique, and classes of applications which depend more on digital processing. To represent a speech signal in digital form, use sampling theorem in case of sampling a band limited signal can be represented samples which are periodic in time11.

ArTIFICIAl InTEllIGEnCE AnD nETWOrK SECurITY
136
• Storing digital data is inexpensive and also digital data can be encrypted, coded and compressed.
• These systems more reliable and easily modify by changing software.
• It can be implemented to linear (complex) or nonlinear algorithms.There is also some disadvantage of DSP such
as [13]-• General purpose microprocessors & micro controllers
are cheaper than DSP hardware.• We not able to amplify signal after it is digitized
if the signal is weak (few tenths of milivolts).• It is happening that sampling loss some data.• using converter of Analog to digital & digital to
analog may be expensive.• Sometimes digital processing is not possible.
5. APPliCAtions oF diGitAl siGnAl ProCEssinG sYstEMThere are a lot of applications in different areas
for which the Digital Signal Processor becomes an ultimate solution and for these DSP makes available the finest promising combination of performance. Mainly the DSP applications can be simplified into multiplications and additions. Hence the MAC formed a main functional unit used in early DSP processors. later on researcher/designers integrated more features such as pipelining, SIMD, VlIW etc, to improved performance. Today’s DSP used in too many fields for example10,12,14.
Representation of speech signal can be classified as waveform representation and parametric representation. In case of waveform representation just keep out wave shape of a speech signal (analog) by using sampling and quantized method while in parametric representation speech signal represents as the output of a model for speech production. Again, parametric representation classified as excitation parameters and vocal tract parameter. Excitation parameters means related to source of speech sound and vocal tract parameters are related to the single speech sounds. There are many areas where speech processing is used, for example speaker recognition, speech recognition and synthesis, digital transmission etc11,7,8.
4. Pros And Cons oF diGitAl siGnAl ProCEssinG sYstEMThe most suitable reason to using digital signal
processing techniques is that the highly advanced signal processing functions can be implemented using digital signal processing techniques. It can be determined as to find discrete representations of signals. DSP is more complex in nature than analog signal processing on the other hand it has many advantages in excess of analog signal processing. Following are the advantage of DSP technique5,10,12.• DSP provide the facility of reproducibility i.e.
digital system allows reconfiguring the digital signal processing functions while in case of analog it is essential to redesign hardware.
• DSP has the Capability of being changed since the digital processing can be simply changed by programming.
• DSP make available better signal quality.• This processor is small in size and economical
to implement.• In analog signal it is complex to execute accurate
mathematical operations but these operations can be normally implemented on a digital computer.
• For analog require numerous filters but in digital same DSP processor is used for many filters.
Figure 3. Classification of speech signal.
• Speech recognition- Speaker verification, voice mail and speech synthesis etc.
• Signal analys is - analys is of Audio/video signals.
• Space photograph- development and data compression.
• Wave form generation- to represent speech signal.
SInGH: DIGITAl SIGnAl PrOCESSInG FOr SPEECH SIGnAlS
137
• Filtering the background noise- to remove white noise from a speech/signal
• Image processing- image compression, image enhancement, 3-D rotation and animation.
• Telecommunication and Data communication (using pulse modulation system)
• Compression and expansion of speech which is used in radio voice communication.
• Biomedical- MrI, ultrasound and patient monitoring. And for storing medical image.
• Sonar and Radar- missile control, radio frequency, secure spread spectrum radios and so on.
• Control system and Instrumentation- connecting device control e.g. laser printer control, robot, spectrum analysis, signal generators etc.
• Oil and mineral vision, process monitoring and control.
• F o r e a r t h q u a k e i n v e s t i g a t i o n a n d d a t a acquirement.There are lots of areas where DSP can be used but
here we have discussed only few popular applications. The main objective of DSP is to measure, filter and compress analog or digital signals. DSP basically is used for signal processing which is done on digital signal to improve the quality of signal. It is described by in the term of discrete representation such as discrete domain signals/frequency, discrete time. DSP contains some sub-fields as radar signal processing, communication signals processing, digital image processing, etc15.
6. sAMPlinG oF A siGnAlSampling is the process of converting a continuous
time signal into a discrete time signal acquire by taking samples of the continuous time signal at discrete time instants. Sampling rate /frequency (Fs) can be defined by the number of samples per seconds obtain from analog signal (continuous signal) to construct a discrete signal. And sampling period/interval is the inverse of sampling frequency or it is time between successive samples. The unit of sampling rate in time-domain is hertz or samples per second (Sa/s) [7] [8] [16]. Assume S1 (t) is an analog signal to the sampler, then the output is –
S1(nT) ≡ S(n)where- T is called the sampling interval, S(n) is
discrete time signal.There are lot of methods for sampling an analog
signal, in this study discussion about periodic sampling because in general periodic sampling is used and it can be described by
S(n) = S1(nT) - ∞ < n < ∞where – S1(nT) = analog signal in every T
seconds.The time interval T between successive samples
is known the sampling period/sample interval.
T1
= Fs are called the sampling rate/frequency.
There are a question that how we select the sampling period T or its equivalent and the sampling rate Fs the answer is that we must have common information concerning the frequency content of the signal. For example television signals generally contain frequency components up to 5 MHz.
For sampling a signal mostly used theorem is nyquist Shannon sampling theorem. using this theorem a signal can be reconstructed faultless but the condition is that the sampling frequency is greater than twice maximum frequency (Fs > 2Fmax) or its equivalent. If lower sampling rate is used then may be original signal information fully not recoverable from the sampled signal. Since human hearing range is 20Hz to 20 kHz i.e. the minimum sampling frequency is 40 kHz16,14. Sampling rate for phonemes is between 5Hz to 4 kHz because human speech usually sampled at much lower rate i.e. all the energy is enclosed between this and allocate sampling rate 8 kHz, and this sampling rate used by telephony system. Since for voice frequency transmission bandwidth allocated for a channel is typically 4 kHz.
7. ConClUsionIn this paper we try to provide some basic properties
of DSP which is useful for new researchers in this field.DSP known as core technology and is used in rapidly growing areas such as audio & video signal processing, telecommunications, instrument control etc. There is continuous development in the field of DSP and because of this it has become a key component for many applications which apply signal processing using microprocessor. DSPs are microcomputers/processors whose hardware, software and instruction sets are optimized for high-speed numeric data processing applications. In last few years DSP processors have become more popular and used vastly due to various advantages as reprogram ability, cost effectiveness, speed of data processing, size etc.
fu"d"k Zbl vkys[k es ge Mh,lih ds dqN cqfu;knh xq.k crkus
dh dksf”k”k dh xbZ gS tks bl {ks= ds u;s “kks/kdrkZvksa ds fy, mi;ksxh gSA Mh,lih dks ewy çkS|ksfxfd;ksa ds :i esa tkuk tkrk gS vkSj rsth ls c<+rs {ks=ksa tSls v‚fM;ks o ohfM;ks flXuy çkslsflax] nwjlapkj] ;a= fu;a=.k bR;kfn esa bLrseky fd;k tk jgk gSA Mh,lih ds {ks= esa fujarj fodkl gks jgk gS vkSj bldh otg gS fd ;g dbZ vuqç;ksxksa tks ekbZØksçkslslj dk mi;ksx djds ladsrks dk çlLdj.k djrs gSa ds fy, çeq[k ?kVd gSaA Mh,lih ,d ekbØksdEi;wVj çkslslj gS ftlds gkMZos;j]
ArTIFICIAl InTEllIGEnCE AnD nETWOrK SECurITY
138
l‚¶Vos;j vkSj balVD”ku lsV dk mPp xfr la[;kRed MsVk çlaLdj.k vuqç;ksxksa gsrq csgrjhu ç;ksx gks jgk gSaA fiNys dqN o’kksaZ esa Mh,lih çkslslj dkQh yksdfç; gks x, gSa vkSj iqu% çksxke dh ;ksX;rk] fdQk;rh nkeksa] MkVk çkslsflax dh xfr] vkdkj vkfn fofHkUu Qk;nksa ds dkj.k cgqr mi;ksx fd;k tk jgk gSaA
rEFErEnCEs1. K Mitra Sanjit, Digital Signal Processing Applications,
pp. 1-85.2. rabiner, lawrence, BiingHwang Juang, and B
Yegnanarayana. Fundamentals of Speech recognition 1 st. India: repro India ltd, 2009. 1-483.
3. DOI: http://www.xilinx.com/products/technology/dsp.html.
4. DOI: ht tp: / /whatis . techtarget .com/glossary/Electronics.
5. Tobin, Paul. Electric Circuit Theory,Digital Signal Processing (DSP). DIT, Kevin St. Volume DT287/2. pp 85-99.
6. DOI:http://nptel.ac.in/courses/Webcourse-contents/IIT-KAnPur/Digi_Sign_Pro/lecture1/images/node3.html.
7. Forouzen, Behrouz A., and Sophia Chung Fegan. Data Communications And networking. Ed 3rd.
new Yark: McGraw-Hill Companies, 2004. pp 49-140.
8. Proakis G. John, Manolakis G. Dimirits Digital Signal Processing, 12 India: Dorling Kindersley Pvt. ltd., India, 2012.
9. Beliveau Paul MATlAB for Signal Processing, E E 2 7 5 lab, January 15, 2012 pp-1-18.
10. DOI: http://www.dsp-technology.com/index.html11. rabiner r., lawrence, and ronald Schafer W.
Digital Processing Of Speech Signals. Vol. 10. India: Dorling Kindersley Pvt. ltd., InDIA, 2013.
12. Source: Digital Signal Processing: The new Semiconductor Industry Technology Driver, Will Strauss,IEEE Signal Processing Magazine, March 2000, pp. 52-56.
13. DOI:http://en.wikiversity.org/w/index.php?title, Digital_Signal_Processing & action
14. DOI: www.agilent.com Advantages and Disadvantages of using DSP Filtering on Oscilloscope Waveforms Application note 1494.
15. DOI: http://www.differencebetween.info/science-and-mathematics
16. Singh nilu; Khan r. A. & raj Shree. Equal Error rate and Audio Digitization and Sampling rate for Speaker Recognition System. American Scientific Publishers., 2014, 20(5-6),pp. 1085-88.
,l ,y 4 , vkSj jkLicsjh ikbZ dk mi;ksx dj LekVZQksu vk/kkfjr x`g Lopkfyr smartphone based home Automation system using sl4A and raspberry Pi
A. Sivsubramanyam* and M. VigneshRMK Engineering College, Chennai, India
*E-mail: [email protected]
lkjka”k
Lopkyu ?kj ij feyus okys vkjke vkSj lqj{kk Lrj dks c<k nsrk gSA LekVZQksu tks vktdy vklkuh ls miyC/k gSa vkSj jklcsjh ikbZ ekMîwy ds lkFk ljy] fdQk;rh nke ij x`g Lopkyu ç.kkyh dk fuekZ.k fd;k tk ldrk gSA x`g Lopkfyr ç.kkyh dks LekVZQksV tks ,aMjks,M vkSj ,aMjks,M ¼,l,y4,½ dh fLØIV ys;j ls ;qä gSa dh vkokt vkSj bZ&esy ls fu;fU=r fd;k tk ldrk gSA ,l,y4, LekVZQksu ds baVjQsl ds :i esa dk;Z djrk gS vkSj vkokt dk fo”ys’k.k xwxy ok;l fjxksfu”ku ls djrk gSaA bZ&esyksa dks ik;Fku fyfi vkSj ikjfll buiqV ls Hkstdj jklcsjh ekMîwy dks vkns”k ¼dekaMl½ fn;s tkrs gSaA jklcsjh ikbZ ekMîwy bZ&esy cDls ls vkns”k ¼daekaM½ fudkydj mudk ikyu djrk gSA
AbstrActAutomation increases the comfort and safety levels of a home. using smartphones that are ubiquitous
these days and with a raspberry Pi module, a very simple, cost – efficient home automation system can be built. The Home Automation System can be controlled by voice or email through smartphones running Android and equipped with Scripting layer for Android(Sl4A). Sl4A acts as the smartphone interface and does speech analysis using Google Voice recognition and issues commands to a raspberry Pi module by email through a Python script that parses input. The Raspberry Pi then carries out the commands fetched from the e-mail inbox.
Keywords: Home automation, raspberry Pi, Sl4A
Bilingual International Conference on Information Technology: Yesterday, Toady, and Tomorrow, 19-21 Feburary 2015, pp. 139-142 © DESIDOC, 2015
1. IntroductIonWith the advancements in Information Technology,
the next generation homes are going to be smart and powerful with complete automation. The user interface is desired to be more user-friendly and powerful. It should also be intuitive and the users should interact with it as they interact with other humans. As the choice for natural and expressive means of communication, speech is the most desirable for this interaction. Speech has the potential to provide a direct and flexible interaction for the embedded system operations [1]. Generally speaker independent systems are more widely used, since the user voice training is not required. Speech recognition is classified as connected word recognition and isolated word recognition[2]. For embedded devices like raspberry Pi, implementation of isolated word recognition is sufficient. Generally, speech recognition is a kind of pattern recognition.
Google Speech recognition can be used for the recognition of commands given by the user to the home automation system. It is the most up-to-date and continuously updated and therefore provides a better accuracy compared to other voice recognition systems.
The commands thus analysed are mailed to a preset email id which the raspberry Pi continuously monitors for commands. When a command is received through email, the Raspberry Pi carries out the necessary actions. lEDs have been used to implement the working of the system. The backend of the system is designed using the Python programming language.
2. sYstEM ArChitECtUrEThe system is developed using Raspberry Pi
and an Android phone with Sl4A(Scripting layer for Android). The voice recognition is carried out by Google Voice recognition and the commands are issued using Sl4A’s Python interpreter. These commands are analysed by the Python interpreter of Raspberry Pi and the commands are implemented by the General Purpose Input and Output(GPIO) pins of Raspberry Pi.
The raspberry Pi is a credit card-sized single-board computer developed in the uK by the raspberry Pi Foundation with the intention of promoting the teaching of basic computer science in schools3. The Raspberry
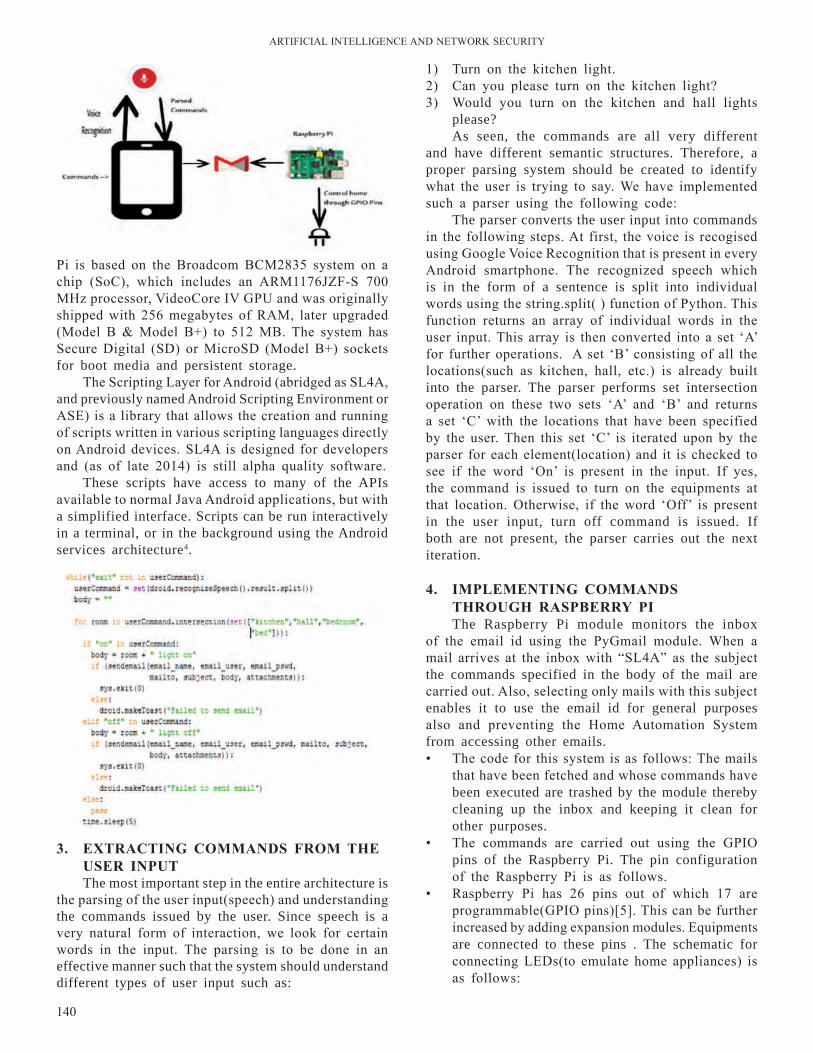
ArTIFICIAl InTEllIGEnCE AnD nETWOrK SECurITY
140
Pi is based on the Broadcom BCM2835 system on a chip (SoC), which includes an ArM1176JZF-S 700 MHz processor, VideoCore IV GPu and was originally shipped with 256 megabytes of rAM, later upgraded (Model B & Model B+) to 512 MB. The system has Secure Digital (SD) or MicroSD (Model B+) sockets for boot media and persistent storage.
The Scripting layer for Android (abridged as Sl4A, and previously named Android Scripting Environment or ASE) is a library that allows the creation and running of scripts written in various scripting languages directly on Android devices. Sl4A is designed for developers and (as of late 2014) is still alpha quality software.
These scripts have access to many of the APIs available to normal Java Android applications, but with a simplified interface. Scripts can be run interactively in a terminal, or in the background using the Android services architecture4.
1) Turn on the kitchen light.2) Can you please turn on the kitchen light?3) Would you turn on the kitchen and hall lights
please?As seen, the commands are all very different
and have different semantic structures. Therefore, a proper parsing system should be created to identify what the user is trying to say. We have implemented such a parser using the following code:
The parser converts the user input into commands in the following steps. At first, the voice is recogised using Google Voice recognition that is present in every Android smartphone. The recognized speech which is in the form of a sentence is split into individual words using the string.split( ) function of Python. This function returns an array of individual words in the user input. This array is then converted into a set ‘A’ for further operations. A set ‘B’ consisting of all the locations(such as kitchen, hall, etc.) is already built into the parser. The parser performs set intersection operation on these two sets ‘A’ and ‘B’ and returns a set ‘C’ with the locations that have been specified by the user. Then this set ‘C’ is iterated upon by the parser for each element(location) and it is checked to see if the word ‘On’ is present in the input. If yes, the command is issued to turn on the equipments at that location. Otherwise, if the word ‘Off’ is present in the user input, turn off command is issued. If both are not present, the parser carries out the next iteration.
4. iMPlEMEntinG CoMMAnds throUGh rAsPbErrY PiThe Raspberry Pi module monitors the inbox
of the email id using the PyGmail module. When a mail arrives at the inbox with “Sl4A” as the subject the commands specified in the body of the mail are carried out. Also, selecting only mails with this subject enables it to use the email id for general purposes also and preventing the Home Automation System from accessing other emails. • The code for this system is as follows: The mails
that have been fetched and whose commands have been executed are trashed by the module thereby cleaning up the inbox and keeping it clean for other purposes.
• The commands are carried out using the GPIO pins of the Raspberry Pi. The pin configuration of the raspberry Pi is as follows.
• raspberry Pi has 26 pins out of which 17 are programmable(GPIO pins)[5]. This can be further increased by adding expansion modules. Equipments are connected to these pins . The schematic for connecting lEDs(to emulate home appliances) is as follows:
3. ExtrACtinG CoMMAnds FroM thE UsEr inPUtThe most important step in the entire architecture is
the parsing of the user input(speech) and understanding the commands issued by the user. Since speech is a very natural form of interaction, we look for certain words in the input. The parsing is to be done in an effective manner such that the system should understand different types of user input such as:
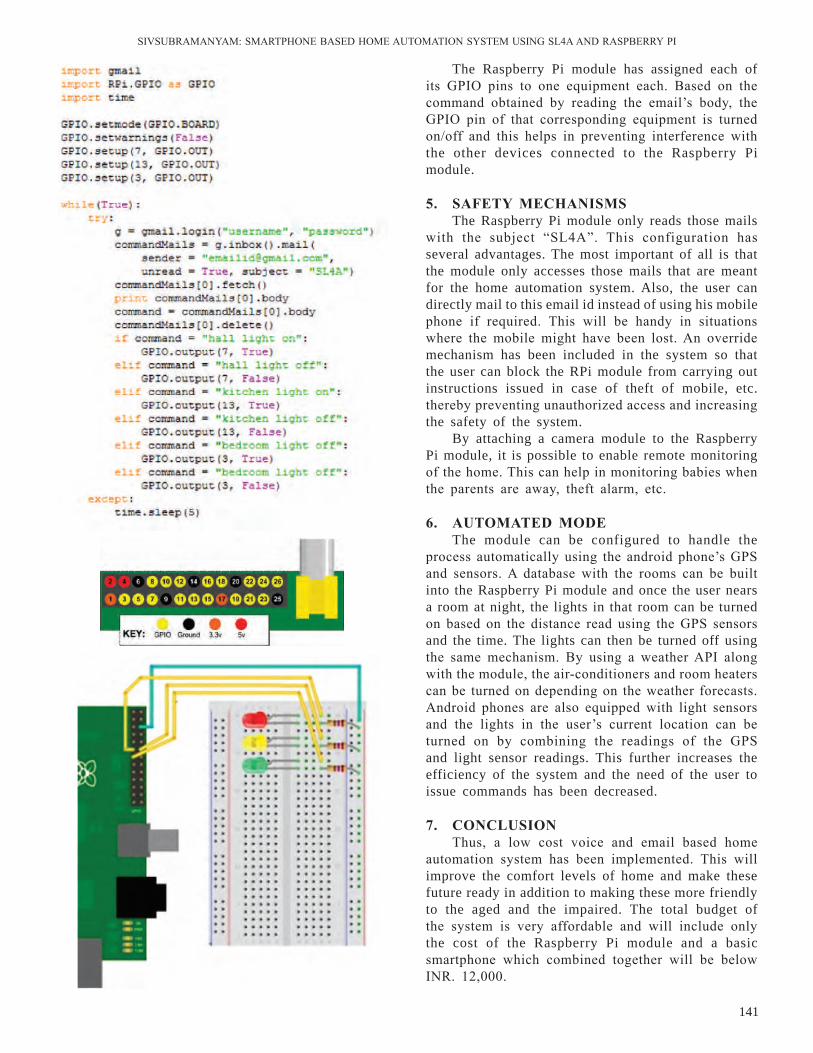
SIVSuBrAMAnYAM: SMArTPHOnE BASED HOME AuTOMATIOn SYSTEM uSInG Sl4A AnD rASPBErrY PI
141
The Raspberry Pi module has assigned each of its GPIO pins to one equipment each. Based on the command obtained by reading the email’s body, the GPIO pin of that corresponding equipment is turned on/off and this helps in preventing interference with the other devices connected to the Raspberry Pi module.
5. sAFEtY MEChAnisMsThe Raspberry Pi module only reads those mails
with the subject “Sl4A”. This configuration has several advantages. The most important of all is that the module only accesses those mails that are meant for the home automation system. Also, the user can directly mail to this email id instead of using his mobile phone if required. This will be handy in situations where the mobile might have been lost. An override mechanism has been included in the system so that the user can block the RPi module from carrying out instructions issued in case of theft of mobile, etc. thereby preventing unauthorized access and increasing the safety of the system.
By attaching a camera module to the Raspberry Pi module, it is possible to enable remote monitoring of the home. This can help in monitoring babies when the parents are away, theft alarm, etc.
6. AUtoMAtEd ModEThe module can be configured to handle the
process automatically using the android phone’s GPS and sensors. A database with the rooms can be built into the Raspberry Pi module and once the user nears a room at night, the lights in that room can be turned on based on the distance read using the GPS sensors and the time. The lights can then be turned off using the same mechanism. By using a weather API along with the module, the air-conditioners and room heaters can be turned on depending on the weather forecasts. Android phones are also equipped with light sensors and the lights in the user’s current location can be turned on by combining the readings of the GPS and light sensor readings. This further increases the efficiency of the system and the need of the user to issue commands has been decreased.
7. ConClUsion
Thus, a low cost voice and email based home automation system has been implemented. This will improve the comfort levels of home and make these future ready in addition to making these more friendly to the aged and the impaired. The total budget of the system is very affordable and will include only the cost of the Raspberry Pi module and a basic smartphone which combined together will be below Inr. 12,000.

ArTIFICIAl InTEllIGEnCE AnD nETWOrK SECurITY
142
fu"d"k Z bl çdkj] ,d de ykxr dh vkokt vkSj bZesy vk/kkfjr
x`g Lopkyu ç.kkyh ykxw dh xbZ gSA ;g ?kj esa vkjke ds Lrj esa c<ksrjh djrh gSa vkSj bls Hkfo"; yk;d cukrh gSa vkSj blds vfrfjä bls o`) vkSj fodykax ds fy, vf/kd vuqdwy cukrh gSaA bl ç.kkyh dh dqy [kpkZ ogu;ksX; gSa vkSj dsoy jkLicsjh ikbZ e‚Mîwy vkSj ,d LekVZ Qksu dh ykxr tks fd feykdj 12000 ls de gSa rS;kj fd;k tk ldrk gSaA
rEFErEnCEs1. M. r. Alam, “A review of smart homes – Past,
present and future,” IEEE Trans. on Systems, Man and Cybernetics, vol. 42 (2), pp. 1190-1203,
nov. 2012. 2. q. Y. Hong, C. H. Zhang, X. Y. Chen, and Y.
Chen, “Embedded speech recognition system for intelligent robot,” in Proc. IEEE Conf. on Mechatronics and Machine Vision in Practice, Dec. 2007, pp. 35-38.
3. Cellan-Jones, rory (5 May 2011). “A £15 computer to inspire young programmers”. BBC news.
4. Ferrill, Paul (2011). Pro Android Python with Sl4A. Apress (via Google Books). p. 4. ISBn 9781430235699.
5. http://www.raspberrypi.org/documentation/usage/gpio
Bilingual International Conference on Information Technology: Yesterday, Today, and Tomorrow, 19-21 Feburary 2015, pp. 143-148© DESIDOC, 2015
1. IntroductIon Satellite communication is specifically useful for
wide area coverage, communication on mobile platforms like moving vehicles, trains and aircraft, etc. network topology and the ‘anywhere and everywhere’, benefit of global voverage, better reliability, immediacy and
scalability versatility, point-to-multipoint and broadcast capability. The communication is distance-insensitive and end-to-end, it does not depend upon the terrain in between two stations. It is attractive, particularly for hilly, unreachable and remote areas. The major limitations of satellite communication are latency,
mi;qä rduhdksa ds mi;ksx }kjk lSVsykbV pSuy {kerk dk vuqdwyuoptimising satellite Channel Capacity by Utilising Appropriate techniques
Suresh Kumar JindalDefence Scientific Information and Documentation Centre, Delhi- 110 054, India
E-mail: [email protected]
lkjka”k
mixzg pSuy dh {kerk miyC/k cSaMfoFk ¼chMCY;w½] VªkalfeV i‚oj] fjlhoj laosnu”khyrk ij fuHkZj djrh gS] dHkh&dHkh bls “kksj rkieku vuqikr ¼th@Vh½] ifjos”k “kksj ?kuRo ds ykHk ds :i esa lanfHkZr fd;k tkrk gSA e‚Mqys”ku ;kstuk dk çdkj] mi;ksx rduhd] ,QbZlh dk mi;ksx ¼vkxs =qfV lq/kkj½ rduhd] fcV =qfV nj ds fy, t:jh laHkkouk ds çdkj] pSuy “krksaZ dh leku /kkj.kk ds rgr pSuy {kerk dks fu;af=r djus okys vU; ekud gSaA v/;;u vkSj fo”ys’k.k ds ç;kstu ds fy, fMftVy tkudkjh ikjs”k.k vkSj çkfIr ij fopkj fd;k tk jgk gSA lsVd‚e usVodZ FkzksiqV dk vuqdwyu mfpr e‚Mqys”ku ;kstuk dk mi;ksx] okgd esa okgd ¼lh,ulh½ tSlh mi;qä igq¡p ;kstukvksa tSlh dbZ rduhdksa ij fuHkZj djrk gS] ftls mixzg ds fy, ;qfXer okgd cgq&mi;ksx ¼is;MZdSfj;j eYVhiy ,Dlsl½ ¼ihlh,e,½ Hkh dgk tkrk gS ftlesa okgu ij i;kZIr fo|qr mRiknu {kerk ij miyC/k gSA ,evkbZ,evks tSlh rduhd] tks de txg] de otu vkSj miyC/k Mhlh fctyh dh otg ls vkt ds LFkku dh deh tSlh mixzg dh ck/kkvksa ds fy, okgu ij ,d ,aVhuk vkSj dbZ tehuh LVs”kuksa ds nksgjs&ifji= /kzqohdj.k ds :i esa lcls mi;qä gSA ,evkbZ,evks lhfer “kfä ds mixzg pSuy ds fy, vf/kd mi;qä gSA Vhlhih@vkbZih Rojd] Qk;jo‚y] opqZvy çkbosV usVodZ ¼ohih,u½] ;krk;kr dks vkdkj nsus] vfrØe.k fuokj.k ç.kkyh ¼vkbZih,l½& ,aVhok;jl@,aVhLikbZos;j@,aVhe‚yos;j] osc fQYVj vkSj baVjusV vkosnu ds fy, ,aVhLikTe tSlh mi;ksx rduhdsa ,d fuf”pr mixzg dh {kerk dks vkxs vuqdwfyr djsaxhA
AbstrActThe satellite channel capacity depends on available bandwidth (Bw), transmit power, receiver
sensitivity, sometimes referred as gain-to-noise temperature ratio (G/T), ambient noise density etc. The other parameters which dictate channel capacity are type of modulation scheme, access technique, use of FEC (forward error correction) technique, required probability of bit error rate, under identical assumption of channel conditions. Digital information transmission and reception is being considered for study and analysis purpose. The satcom network throughput optimization depends on many techniques like using proper Modulation scheme, appropriate access schemes like carrier-in-carrier (CnC), also called paired carrier multiple access (PCMA) for satellite where enough onboard power generation capability is available. Techniques like MIMO, which in the form of Dual-Circular polarization for one onboard antenna and multiground stations fits best into requirement as on today’s limitations of satellite having constraints of less space, weight and available DC power still exists. MIMO is more suitable for Power limited satellite channel. The access techniques like TCP/IP accelerator, firewall, virtual private network (VPn), traffic shaping, intrusion prevention system (IPS) – antivirus/antispyware/antimalware, web filter and antispasm for internet application will further optimize the capacity of a given satellite channel.
Keywords: PEMA, paired carrier multiple access, MIMO, multi input multi output, tcp, transmission control protocol, EB/nO- Bit energy-to-noise Power spectral density, IP, internet protocol
ArTIFICIAl InTEllIGEnCE AnD nETWOrK SECurITY
144
Modulation and coding
rF Power required (Eb/no required) at 10 bEr
spectral efficiency bits/s/hz
qPSK 3/4 low 1.3
8PSK 3/4 Moderate 1.9
16 APSK 3/4 High 2.5
32 APSK 3/4 Very high 3.1
table 1. relative spectral efficiency and radio frequency (rF) power utilisation for four common modulation and coding schemes.
expensive, large upfront capital costs, congestion of frequencies and limited orbital slots. There are specific situations where only satellite communication is a viable solution. There are numerous applications of satellite communication but the Bw spectrum is limited. There is always a move to increase the channel capacity of satellite links by utilizing different latest techniques like modulation schemes, access techniques, higher and higher power generation both at ground station as well as onboard satellite. Bigger and bigger aperture antennae are being installed onboard satellite depending on the design and cost of satellite in question.
However there are some disadvantages like, latency, limited spectrum for GEO satellite, the number of satellites that can be placed in the equatorial plan are limited to 180 in number with 2° separation.
To enhance throughput improvements required in the subsystem/system, software, hardware, choice of suitable type of protocol for specific applications, etc as following: using most Bw efficient modulation scheme. using power efficient modulation schemes as
power onboard satellite is a limiting factor. use of suitable modulation schemes to be suitable
for operation even when power amplifier onboard satellite working in saturation i.e. minimum I/P backoff and minimum O/P backoff. These channel coding schemes should require Eb/no near to Shannon’s limit of – 1.59 db Eb/no for near error free communication.
Maximum gain-to-noise temperature (G/T) of earth station receiver and onboard satellite Transponder utilizing best state-of-the-art lnAs and other components, for a fixed diameter antenna at both places, i.e, onboard and at ground station.
Suitable protocol for specific applications so that Bw is not wasted in re-transmissions and making available required bit error rate (BEr) for protocol to work optimally.
using appropriate access scheme for specific applications1.With the continuous developments in technology
we are in a position to generate higher power onboard satellite as well on ground station. It is also possible to improve the G/T of onboard transponder by both optimizing gain of a fixed dia Antenna and reducing the noise temperature of electronic components being used. new modulation/demodulation schemes are being developed with lesser and lesser Eb/no required for particular BEr requirement. new access techniques suitable for specific applications are being used. Better channel codes are being evolved to give maximum coding gain with minimum latency. Polarization diversity is being used to increase the channel capacity. Space division multiple access techniques in the form of
MIMO are being used to increase channel capacity and improve BER for a given satellite system. it is also used to encounter fading due to rain, fog, etc. MIMO technique is also used to provide communication at locations up to 75o latitude satisfactorily, i.e., at sites where satellite elevation angle is of the order of 15o.
2. ChoiCE oF sUitAblE ModUlAtion/ dEModUlAtion sChEME(2)
The schemes will be normalized to bits/S/Hz over the existing satellite channels. It has been observed that terrestrial digital radio systems use high level amplitude modulation (qAM) to increase spectral efficiency, but this is not feasible in satellite communication due to following reasons: I. Even as on today, satellite links are severely
power limited.II. The onboard satellite transponder amplifier has
to run in nonliner region to get more power efficiency, due to the fact that dc power puts a constraint on satellite.In satellite communication, the decrease in bit
error rate provides better quality of service, must not be dependent at the expense of scarce power resource onboard satellite. At the same time, modulation schemes which do not work well with nonlinear amplifiers are not suitable for satellite applications as power amplifier onboard satellite cannot be backedoff considerably to run it into linear region at the cost of reduced power efficiency.
It may be observed that for a long time, qPSK was at a powerful position as being almost the only exclusive modulation method in virtually all-digital satellite systems. It may be observed that as the modulation levels increase, constant envelope M-PSK becomes in efficient. On the other hand, qAM suffers more degradation in a nonlinear environment such as a satellite channel.
Table 1 shows the relative spectral efficiency and radio frequency (rF) power utilisation for four common modulation and coding schemes. The spectral efficiencies assume a channel filter alpha value of 20 per cent.
JInDAl: OPTIMISInG SATEllITE CHAnnEl CAPACITY BY uTIlISInG APPrOPrIATE TECHnIquES
145
Due to costly satellite bandwidth and limited spectrum available, there is ever increasing demand for higher information rates, Bw efficient modulation schemes are the demand of the time. While trying to increase Bw efficiency, care must be taken to design “balanced” link design so that onboard power amplifier I/P may not be required to backed off as much as 10db or more, to strike a balance between bandwidth and satellite power resources, at least for the time till we can generate 4-6 times more power as compared to present day’s power levels being generated with the help of solar panels onboard a satellite.
using high-level modulation schemes requiring Eb/no more than the order of 10 db for 10-6 BER are not recommended on power-limited satellites. For example Insat series satellites in C-Band 40 dBw of EIrP in 36 MHz of bandwidth are available. In a hired carrier of 128 Kbits, the Max(saturated) power available will be 37.5 watt i.e., 15.74 dBw. For multicarrier operation the power amplifier will have to be backed off by 4-6 dB. The available power will be 11.74 dBw in 128 Kbits Bw. This available power will have to satisfy the power Budget equation as:
(C/n)down = (Set)down EIrP – Pathloss + Earth station G/T-Bandwidth + 228.6 dB
=11.74 - 196.5 + 21 – 51 + 228.6 dB =13.84 dB12.84 dB, considering 1 dB as the consolidated
loss like antenna-pointing loss, loss in power cables, etc. i.e, maximum EIrP in 128 Kbit carrier will be 15.74.4.0 = 11.74 dBw. Accordingly (C/n)down for a GEO satellite, (taking a distance of 40,000 km, the receiver station may be at high altitude) will be 13.84 dB. Taking 1 dB as overall loss due to miss pointing of antenna, etc. the available (C/n)down will be 12.84 dB using M array modulation schemes like 16 APSK, 8PSK to increase the data rate will not help since Eb/no for 10-6 BEr is of the order of 16 db for 8PSK. undoublingly, using qPSK will give an advantage of 3 db since BW gets reduced by 50 per cent, for the same date rate, accordingly C/n goes up by 3 db whereas EB/nO remains same (as data rate doubles up). By employing qPSK instead of BPSK, one can double the information capacity with the same available Bw4 power. However to transmit 3 bits/Hz, i.e., 8 PSK, one will need EB/nO which is of the order of 14 dB. Since there will be 33 per cent savings in spectrum BW, the inband white noise decrease will push the EB/nO by 1.23 dB, making available EB/nO = 11.84 + 1.23 = 13.07 dB. Whereas EB/nO requirement is of the order of 17 dB, obviously the link will not function and BEr will increase beyond designed value of 10-6.
To achieve the optimum result, one has to go in for appropriate FEC which will reduce random errors and will provide a coding gain of the order of 5 dB.
The suggested scheme is conditional encoding and Viterby decoding along with concatenated read Solemon (rS) codes. The read Solemon codes will reduce the bunch errors due to some spike, etc. Accordingly, a concatenated code is suggested.
3. UsinG tCP/iP ProtoCol(3)
The round trip transmission delay (rTT) in case of GEO satellites for TCP is of the order of 560 ms. The maximum throughput which can be obtained is giver by
ThroughputMAX = receiver buffer size
RTTThe maximum buffer size in TCP is 64 Kbps, so
the maximum throughput = 64 Kb/.560 = 117 Kbytes, i.e, 936 Kbps. Even if one error occurs in 936 Kbits the packet will be discarded, which corresponds to a BER of 1 ≈ 10-6, where the efficiency of link falls to 50 per cent. Accordingly for TCP/IP Protocol to work satisfactorily well on GEO satellite, a BEr better than 10-7 has to be made available to get better efficiency, to permit TCP flow at the rate of 1 Mbps for a buffer size of 64 KB.
In TCP receiver window is defined as the number of bytes a sender can transmit without receiving an acknowledgment. TCP uses a receiver window that is 4 times the size of the maximum segment size (MSS) negociated during connection set up time, up to maximum of 64 K Bytes.
4. ChoiCE oF APProPriAtE ACCEss tEChniQUEsThere are many multiple access techniques for
satellite communication. These are frequency division multiple access (FDMA), time division multiple access (TDMA), code division multiple access (CDMA), SDMA, paired carrier multiple access (PCMA), multiple input-multiple output (MIMO), etc. Each multiple access technique has specific advantages and disadvantages, but FDMA is almost outdated and in most digital applications TDMA is being used. CDMA has specific advantages of low probability of intercept, and anti-jamming capabilities along with selective addressing. The techniques of spread spectrum, namely direct sequence and frequency hopping are used for military applications. Since the spectrum is precious and limited in nature, we want to use it most efficiently. The recent techniques to maximize bits/s/Hz are MIMO and paired carrier multiple access (PCMA). The MIMO increases channel capacity with no additional power, whereas PCMA needs more power.
PCMA can be applied to FDMA, TDMA, CDMA and SDMA (MIMO). The utility of PCMA power-limited satellite may not be there at all since the power is
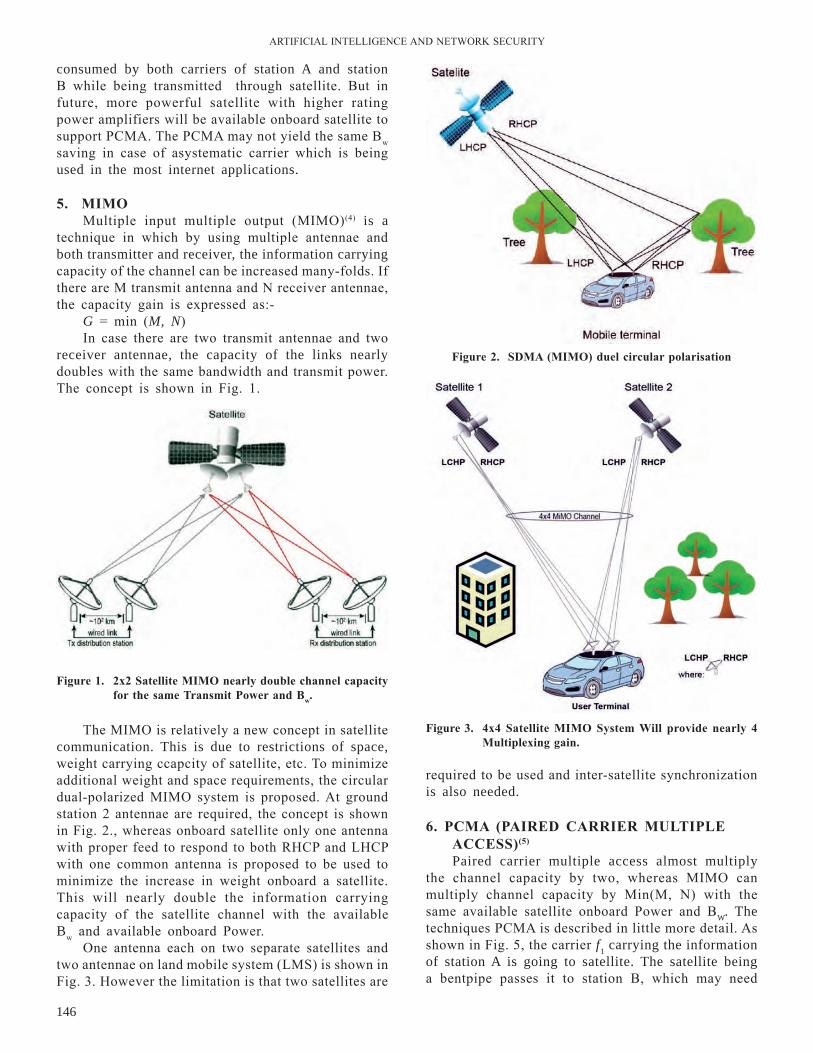
ArTIFICIAl InTEllIGEnCE AnD nETWOrK SECurITY
146
Figure 1. 2x2 satellite MiMo nearly double channel capacity for the same transmit Power and bw.
Figure 2. sdMA (MiMo) duel circular polarisation
Figure 3. 4x4 satellite MiMo system will provide nearly 4 Multiplexing gain.
consumed by both carriers of station A and station B while being transmitted through satellite. But in future, more powerful satellite with higher rating power amplifiers will be available onboard satellite to support PCMA. The PCMA may not yield the same Bw saving in case of asystematic carrier which is being used in the most internet applications.
5. MiMoMultiple input multiple output (MIMO)(4) is a
technique in which by using multiple antennae and both transmitter and receiver, the information carrying capacity of the channel can be increased many-folds. If there are M transmit antenna and n receiver antennae, the capacity gain is expressed as:-
G = min (M, N)In case there are two transmit antennae and two
receiver antennae, the capacity of the links nearly doubles with the same bandwidth and transmit power. The concept is shown in Fig. 1.
required to be used and inter-satellite synchronization is also needed.
6. PCMA (PAirEd CArriEr MUltiPlE ACCEss)(5)
Paired carrier multiple access almost multiply the channel capacity by two, whereas MIMO can multiply channel capacity by Min(M, n) with the same available satellite onboard Power and BW. The techniques PCMA is described in little more detail. As shown in Fig. 5, the carrier f1 carrying the information of station A is going to satellite. The satellite being a bentpipe passes it to station B, which may need
The MIMO is relatively a new concept in satellite communication. This is due to restrictions of space, weight carrying ccapcity of satellite, etc. To minimize additional weight and space requirements, the circular dual-polarized MIMO system is proposed. At ground station 2 antennae are required, the concept is shown in Fig. 2., whereas onboard satellite only one antenna with proper feed to respond to both rHCP and lHCP with one common antenna is proposed to be used to minimize the increase in weight onboard a satellite. This will nearly double the information carrying capacity of the satellite channel with the available Bw and available onboard Power.
One antenna each on two separate satellites and two antennae on land mobile system (lMS) is shown in Fig. 3. However the limitation is that two satellites are
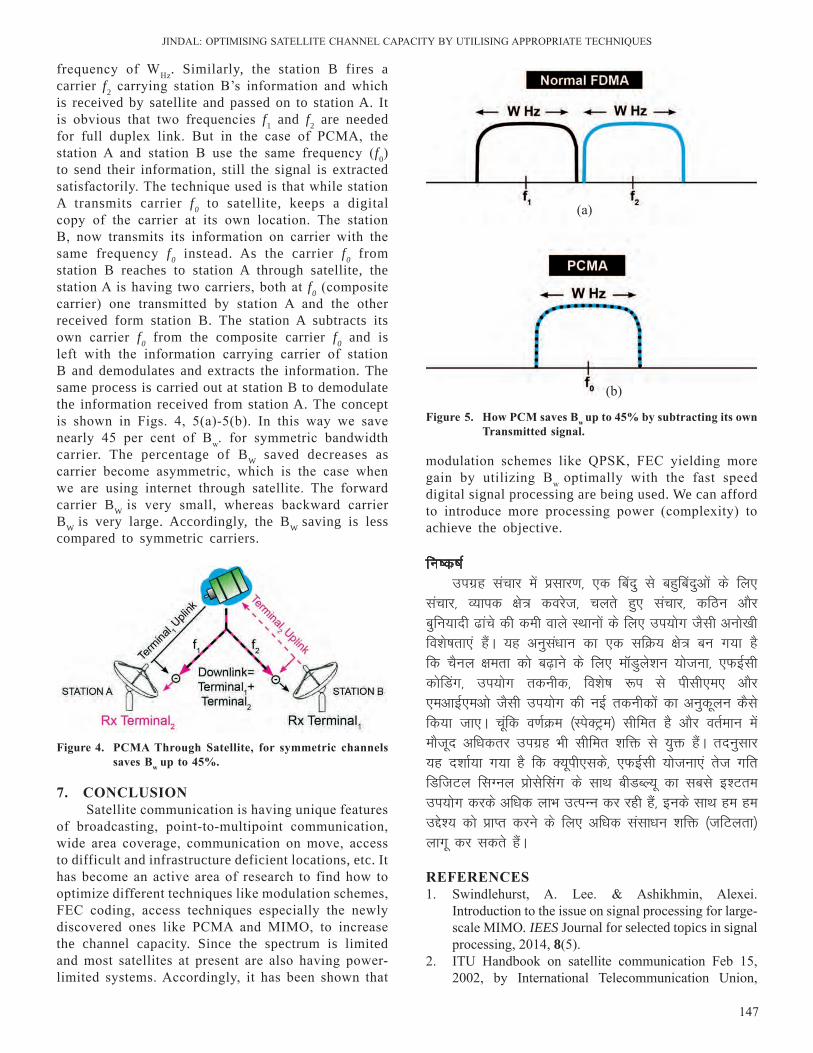
JInDAl: OPTIMISInG SATEllITE CHAnnEl CAPACITY BY uTIlISInG APPrOPrIATE TECHnIquES
147
Figure 4. PCMA through satellite, for symmetric channels saves bw up to 45%.
Figure 5. how PCM saves bw up to 45% by subtracting its own transmitted signal.
(a)
(b)
frequency of WHz. Similarly, the station B fires a carrier f2 carrying station B’s information and which is received by satellite and passed on to station A. It is obvious that two frequencies f1 and f2 are needed for full duplex link. But in the case of PCMA, the station A and station B use the same frequency (f0) to send their information, still the signal is extracted satisfactorily. The technique used is that while station A transmits carrier f0 to satellite, keeps a digital copy of the carrier at its own location. The station B, now transmits its information on carrier with the same frequency f0 instead. As the carrier f0 from station B reaches to station A through satellite, the station A is having two carriers, both at f0 (composite carrier) one transmitted by station A and the other received form station B. The station A subtracts its own carrier f0 from the composite carrier f0 and is left with the information carrying carrier of station B and demodulates and extracts the information. The same process is carried out at station B to demodulate the information received from station A. The concept is shown in Figs. 4, 5(a)-5(b). In this way we save nearly 45 per cent of Bw. for symmetric bandwidth carrier. The percentage of BW saved decreases as carrier become asymmetric, which is the case when we are using internet through satellite. The forward carrier BW is very small, whereas backward carrier BW is very large. Accordingly, the BW saving is less compared to symmetric carriers.
modulation schemes like qPSK, FEC yielding more gain by utilizing Bw optimally with the fast speed digital signal processing are being used. We can afford to introduce more processing power (complexity) to achieve the objective.
fu’d’k Z
mixzg lapkj esa çlkj.k] ,d fcanq ls cgqfcanqvksa ds fy, lapkj] O;kid {ks= dojst] pyrs gq, lapkj] dfBu vkSj cqfu;knh <kaps dh deh okys LFkkuksa ds fy, mi;ksx tSlh vuks[kh fo”ks’krk,a gSaA ;g vuqla/kku dk ,d lfØ; {ks= cu x;k gS fd pSuy {kerk dks c<+kus ds fy, e‚Mqys”ku ;kstuk] ,QbZlh dksfMax] mi;ksx rduhd] fo”ks’k :i ls ihlh,e, vkSj ,evkbZ,evks tSlh mi;ksx dh ubZ rduhdksa dk vuqdwyu dSls fd;k tk,A pwafd o.kZØe ¼LisDVªe½ lhfer gS vkSj orZeku esa ekStwn vf/kdrj mixzg Hkh lhfer “kfä ls ;qä gSaA rnuqlkj ;g n”kkZ;k x;k gS fd D;wih,lds] ,QbZlh ;kstuk,a rst xfr fMftVy flXuy çkslsflax ds lkFk chMCY;w dk lcls b”Vre mi;ksx djds vf/kd ykHk mRiUu dj jgh gSa] buds lkFk ge ge mís”; dks çkIr djus ds fy, vf/kd lalk/ku “kfä ¼tfVyrk½ ykxw dj ldrs gSaA
rEFErEnCEs1. Swindlehurst, A. lee. & Ashikhmin, Alexei.
Introduction to the issue on signal processing for large-scale MIMO. IEES Journal for selected topics in signal processing, 2014, 8(5).
2. ITu Handbook on satellite communication Feb 15, 2002, by International Telecommunication union,
7. ConClUsion Satellite communication is having unique features
of broadcasting, point-to-multipoint communication, wide area coverage, communication on move, access to difficult and infrastructure deficient locations, etc. It has become an active area of research to find how to optimize different techniques like modulation schemes, FEC coding, access techniques especially the newly discovered ones like PCMA and MIMO, to increase the channel capacity. Since the spectrum is limited and most satellites at present are also having power-limited systems. Accordingly, it has been shown that

ArTIFICIAl InTEllIGEnCE AnD nETWOrK SECurITY
148
ISBn-13 : 978-047122 1890.3. Chunmei, liu & Eytan, Modiano. An analysis of TCP
over random access satellite links, IEEE 2014.4. Jindal, Suresh Kumar. MIMO dual-circular polarisation
multiple access technique to increase satellite channel
capacity, Dec 2014. Accepted in Int. J. Eng. Res. Appli. (Acceptance letter id – 412134)
5. Preethi, S.J. & rajeshwari K. Survey of multiple access techniques for mobile communication. Int. J. Emerging Trends Techno. Sci., 2012, 1(4).
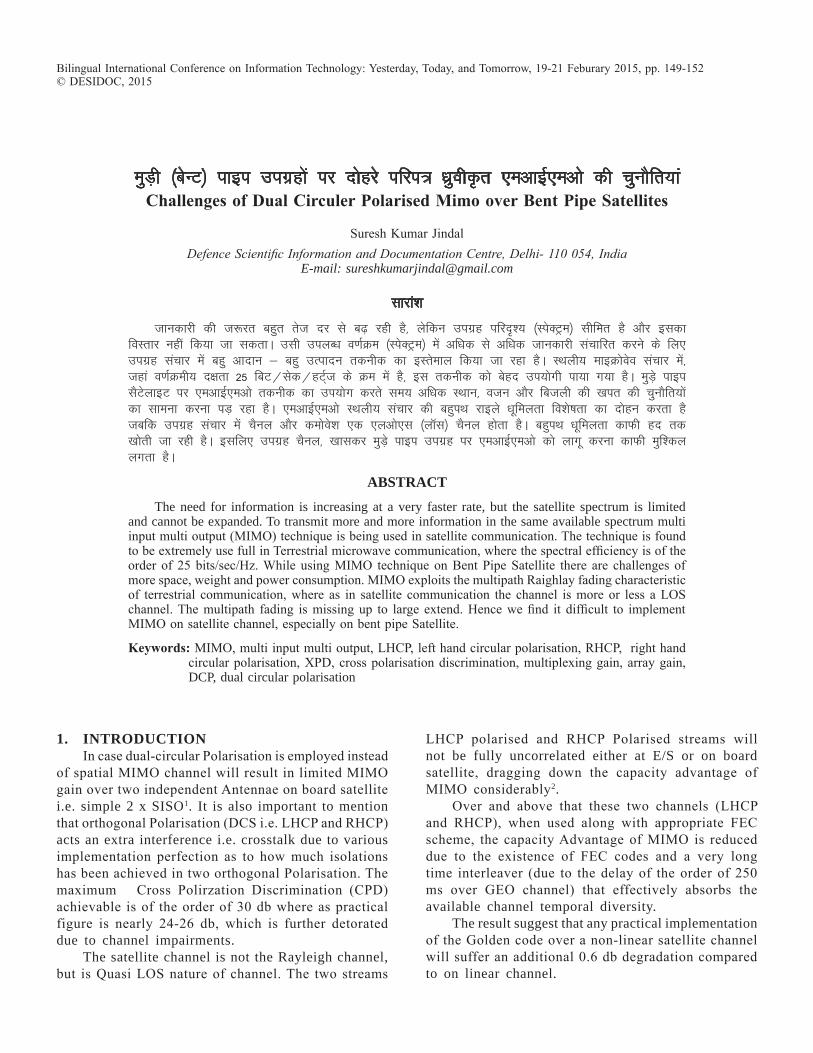
Bilingual International Conference on Information Technology: Yesterday, Today, and Tomorrow, 19-21 Feburary 2015, pp. 149-152© DESIDOC, 2015
1. IntroductIonIn case dual-circular Polarisation is employed instead
of spatial MIMO channel will result in limited MIMO gain over two independent Antennae on board satellite i.e. simple 2 x SISO1. It is also important to mention that orthogonal Polarisation (DCS i.e. lHCP and rHCP) acts an extra interference i.e. crosstalk due to various implementation perfection as to how much isolations has been achieved in two orthogonal Polarisation. The maximum Cross Polirzation Discrimination (CPD) achievable is of the order of 30 db where as practical figure is nearly 24-26 db, which is further detorated due to channel impairments.
The satellite channel is not the Rayleigh channel, but is quasi lOS nature of channel. The two streams
lHCP polarised and rHCP Polarised streams will not be fully uncorrelated either at E/S or on board satellite, dragging down the capacity advantage of MIMO considerably2.
Over and above that these two channels (lHCP and rHCP), when used along with appropriate FEC scheme, the capacity Advantage of MIMO is reduced due to the existence of FEC codes and a very long time interleaver (due to the delay of the order of 250 ms over GEO channel) that effectively absorbs the available channel temporal diversity.
The result suggest that any practical implementation of the Golden code over a non-linear satellite channel will suffer an additional 0.6 db degradation compared to on linear channel.
eqM+h ¼csUV½ ikbi mixzgksa ij nksgjs ifji= /kzqoh—r ,evkbZ,evks dh pqukSfr;kaChallenges of dual Circuler Polarised Mimo over bent Pipe satellites
Suresh Kumar JindalDefence Scientific Information and Documentation Centre, Delhi- 110 054, India
E-mail: [email protected]
lkjka”k
tkudkjh dh t:jr cgqr rst nj ls c<+ jgh gS] ysfdu mixzg ifj–”; ¼LisDVªe½ lhfer gS vkSj bldk foLrkj ugha fd;k tk ldrkA mlh miyC/k o.kZØe ¼LisDVªe½ esa vf/kd ls vf/kd tkudkjh lapkfjr djus ds fy, mixzg lapkj esa cgq vknku & cgq mRiknu rduhd dk bLrseky fd;k tk jgk gSA LFkyh; ekbØksoso lapkj esa] tgka o.kZØeh; n{krk 25 fcV@lsd@gVZ~t ds Øe esa gS] bl rduhd dks csgn mi;ksxh ik;k x;k gSA eqM+s ikbi lSVsykbV ij ,evkbZ,evks rduhd dk mi;ksx djrs le; vf/kd LFkku] otu vkSj fctyh dh [kir dh pqukSfr;ksa dk lkeuk djuk iM+ jgk gSA ,evkbZ,evks LFkyh; lapkj dh cgqiFk jkbys /kwfeyrk fo”ks’krk dk nksgu djrk gS tcfd mixzg lapkj esa pSuy vkSj deksos”k ,d ,yvks,l ¼y‚l½ pSuy gksrk gSA cgqiFk /kwfeyrk dkQh gn rd [kksrh tk jgh gSA blfy, mixzg pSuy] [kkldj eqM+s ikbi mixzg ij ,evkbZ,evks dks ykxw djuk dkQh eqf”dy yxrk gSA
AbstrActThe need for information is increasing at a very faster rate, but the satellite spectrum is limited
and cannot be expanded. To transmit more and more information in the same available spectrum multi input multi output (MIMO) technique is being used in satellite communication. The technique is found to be extremely use full in Terrestrial microwave communication, where the spectral efficiency is of the order of 25 bits/sec/Hz. While using MIMO technique on Bent Pipe Satellite there are challenges of more space, weight and power consumption. MIMO exploits the multipath raighlay fading characteristic of terrestrial communication, where as in satellite communication the channel is more or less a lOS channel. The multipath fading is missing up to large extend. Hence we find it difficult to implement MIMO on satellite channel, especially on bent pipe Satellite.
Keywords: MIMO, multi input multi output, lHCP, left hand circular polarisation, rHCP, right hand circular polarisation, XPD, cross polarisation discrimination, multiplexing gain, array gain, DCP, dual circular polarisation
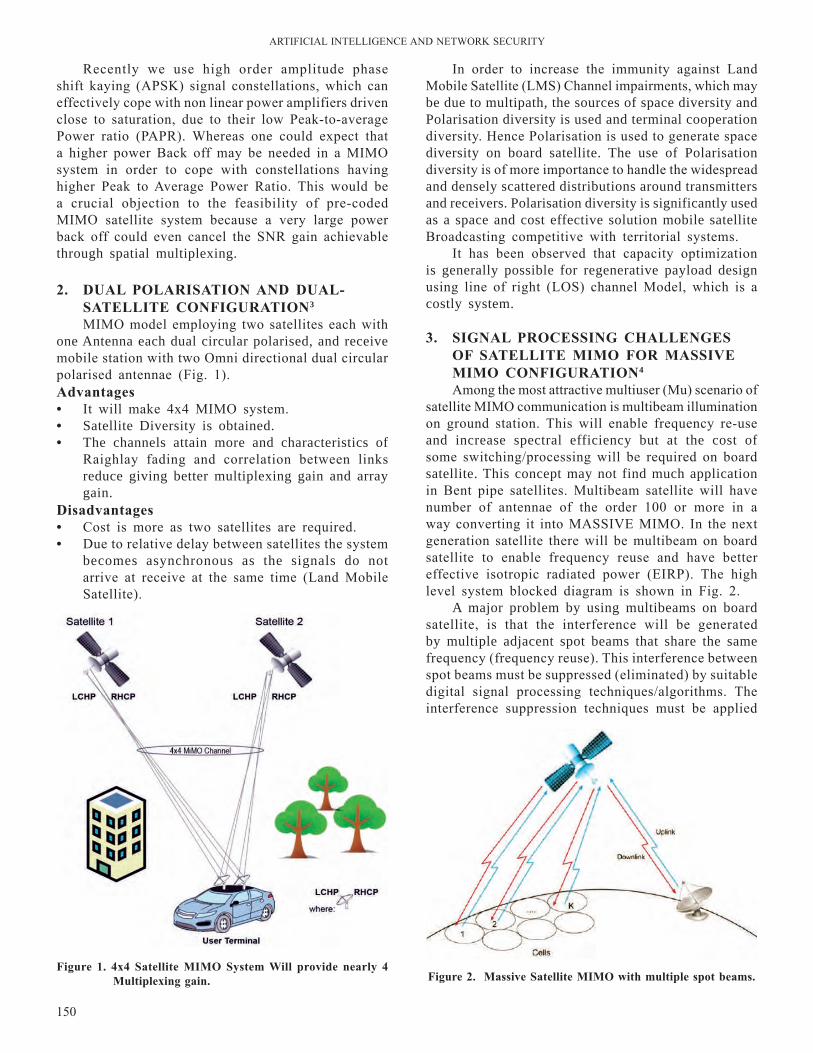
ArTIFICIAl InTEllIGEnCE AnD nETWOrK SECurITY
150
Figure 1. 4x4 satellite MiMo system will provide nearly 4 Multiplexing gain. Figure 2. Massive satellite MiMo with multiple spot beams.
recently we use high order amplitude phase shift kaying (APSK) signal constellations, which can effectively cope with non linear power amplifiers driven close to saturation, due to their low Peak-to-average Power ratio (PAPr). Whereas one could expect that a higher power Back off may be needed in a MIMO system in order to cope with constellations having higher Peak to Average Power ratio. This would be a crucial objection to the feasibility of pre-coded MIMO satellite system because a very large power back off could even cancel the Snr gain achievable through spatial multiplexing.
2. dUAl PolArisAtion And dUAl-sAtEllitE ConFiGUrAtion3 MIMO model employing two satellites each with
one Antenna each dual circular polarised, and receive mobile station with two Omni directional dual circular polarised antennae (Fig. 1).Advantages• It will make 4x4 MIMO system.• Satellite Diversity is obtained.• The channels attain more and characteristics of
raighlay fading and correlation between links reduce giving better multiplexing gain and array gain.
disadvantages • Cost is more as two satellites are required. • Due to relative delay between satellites the system
becomes asynchronous as the signals do not arrive at receive at the same time (land Mobile Satellite).
In order to increase the immunity against land Mobile Satellite (lMS) Channel impairments, which may be due to multipath, the sources of space diversity and Polarisation diversity is used and terminal cooperation diversity. Hence Polarisation is used to generate space diversity on board satellite. The use of Polarisation diversity is of more importance to handle the widespread and densely scattered distributions around transmitters and receivers. Polarisation diversity is significantly used as a space and cost effective solution mobile satellite Broadcasting competitive with territorial systems.
It has been observed that capacity optimization is generally possible for regenerative payload design using line of right (lOS) channel Model, which is a costly system.
3. siGnAl ProCEssinG ChAllEnGEs oF sAtEllitE MiMo For MAssiVE MiMo ConFiGUrAtion4
Among the most attractive multiuser (Mu) scenario of satellite MIMO communication is multibeam illumination on ground station. This will enable frequency re-use and increase spectral efficiency but at the cost of some switching/processing will be required on board satellite. This concept may not find much application in Bent pipe satellites. Multibeam satellite will have number of antennae of the order 100 or more in a way converting it into MASSIVE MIMO. In the next generation satellite there will be multibeam on board satellite to enable frequency reuse and have better effective isotropic radiated power (EIrP). The high level system blocked diagram is shown in Fig. 2.
A major problem by using multibeams on board satellite, is that the interference will be generated by multiple adjacent spot beams that share the same frequency (frequency reuse). This interference between spot beams must be suppressed (eliminated) by suitable digital signal processing techniques/algorithms. The interference suppression techniques must be applied

JInDAl: CHAllEnGES OF DuAl CIrCulEr POlArISED MIMO OVEr BEnT PIPE SATEllITES
151
Figure 3. high level block diagram of a bent Pipe satellite system.
Figure 4. high level block diagram of duel Circular Polarised MiMo system from composite signal.
to all antennae radiating signals and not only to the user beams directly.
A complex signal processing on board satellite will have to be implemented to suppress inter beam interference and beam switching on board. A very reliable and power efficient Digital Signal Processing (DSP) hardware will have be used along with software. The hardware should be reconfigurable from ground station to make changes in area coverage algorithm as and when need arises.
At the receiver also a complex DSP signal processing has to be implemented to estimate parameters and detection algorithms. The techniques have to be fast enough to iteratively detect the signal and decode it satisfactory.
4. rEQUirEMEnts oF FUtUristiC rECEiVErThe algorithms used have to be cost effective,
fast and power efficient. The algorithms have to made more effective by increasing the number of effective signal processing elements.
4.1 to Convert the Existing satellites to dual-Circular Polarised MiMo system following Challenges are to be overcome.Design a feed which should provide cross
Polarisation discrimination [XPC between left hand circular Polarisation (lHCP) and right Hand circular Polarisation (rHCP)] of the order of the order of 30 db. When compared to already existing antenna system w.r.t area coverage, side lobes and should adhare to other emission standards set by regulatory bodies may be international or regional.
The existing bent pipe satellites in use can be represented by following High level Block diagram (Fig. 3). Whereas, the system with Dual-Circular Polarisation Antenna, on board satellite can be represented by a high level Block diagram as shown in Fig. 4. It can be observed that with DCP the received on board satellite signal comes out in two streams as right Hand Circular Polarised signal and left Hand Circular Polarised signal has to be processed parallel in two branches having lnA, MIXEr, lOCAl isolator and Power Amplifier. The two streams of (lHCP and rHCP) signal are fed to Ortho Mode Transducer (OTM) and transmitted through common feed and antenna as conventional antenna. The only difference is that the feed has to be redesigned to respond two differently polarised signals.
5. ConClUsionIt has been observed that by using Dual Circular
Polarised MIMO with Bent Pipe Satellite system, we do not get two times multiplexing gain due to some
interference generated. The Antenna feed design is complex and against a theoretical requirement of Cross Polarisation Discrimination (XPD) of 30 db, practically achievable XPD is of the order of 24 db as on today. Even if we use only one antenna, but new feed is complex to design and more in weight. In addition two parallel chains of signal on board satellite are to be put in place which will further increase the weigh and the new pay load is to be re-designed.
fu’d’k Zns[kk x;k gS fd eqM+s ikbi dh mixzg ç.kkyh ds lkFk nksgjs
ifji= /kzoh—r ,evkbZ,evks dk mi;ksx djus ij] mRiUu dqN gLr{ksiksa dh otg ls gesa nqxquk cgqladsru ykHk ugha feyrk gSA ,aVhuk QhM dh fMtkbu tfVy gS vkSj 30 Mhch dh ,d lS)ka-frd ikj /kzohdj.k vUrj ¼,DlihMh½ dh vko’;drk ds f[kykQ gS] vkt O;kogkfjd :i ls çkIr djus ;ksX; ,DlihMh 24 Mhch dh O;oLFkk dk gSA ;gka rd fd vxj ge dsoy ,d ,aVhuk dk Hkh mi;ksx djsa] rc Hkh u, QhM dks fMtkbu djuk tfVy gS vkSj ;g otu esa Hkh vf/kd gSA blds vykok cksMZ mixzg ij ladsr dh nks lekukarj J`a[kyk,a j[kkuh gksaxh tks otu dks vkSj c<+k,xk rFkk u, is yksM dks fQj ls rS;kj fd;k tk jgk gSA
rEFErEnCEs 1. Jindal, Suresh Kumar. MIMO Dual-Circular
Polarisation Multiple Access Technique to Increase Satellite Channel Capacity, Dec 2014. Accepted in IJErA (Journal) : Acceptance letter id - 412134.

ArTIFICIAl InTEllIGEnCE AnD nETWOrK SECurITY
152
2. Arapoglou, Passtelis Danial & Burzigotti, Paolo. Practical MIMO aspects in DP Per Beam Mobile satellite Broadcasting. Int. J. Sat. commun., 2011.
3. Perer-nazira, Ana l. & Ibrs, Christian. MIMO channel modeling and Transmissin techniques for multisatellite and hybrid satellite terrestrial
mobile network, Physical communication, 2011, 4, 127-139.
4. radrigo, C. De lamare center for telecommunication studies (CETuS) communication research Gp. Deptt of Electronics, univ. of York, York Y0105DD u.K, MASSIVE MIMO systems: signal processing challenges & future trends.
fodykax yksxksa vkSj laoknkRed osc vuqç;ksxksa dh ubZ çkS|ksfxdh esa varj dks vkokt dh lgk;rk ls ikVuk
bridging the Gap between disabled People and new technology in interactive web Application with the help of Voice
Abhishek Sachan*, Abhishek Bajpai, Ashutosh Kumar and neeraj Kumar TiwariShri Ramswaroop Memorial University, UP- 225 003, India
*E-mail: [email protected]
lkjka”k
Hkk’kk igpku {ks= esa vc rd fd, dke dks vke balku ds rkSj ij fopkj djds fd;k x;k gSa ijUrq çkS|ksfxdh }kjk fodykax yksxksa ij T;knk /;ku ugha fn;k x;k gSaA bl “kks/k dk edln fodykax yksxksa ds fy, vf/kd dq”ky vkSj mi;ksx ;ksX; osc vuqç;ksx fodflr djuk gSA bl vkys[k esa] ge miHkksäk ds fy, vf/kd laoknkRed osc vuqç;ksx dks cukrs gSa vkSj lkjs osc “kCnksa dh çkfIr vkokt dh enn ls djrs gSaA ge bl “kks/k esa Lihp vfHkLoh—fr ds fy, tkok Lihp ,ihvkbZ ds ?kVdksa dk bLrseky djrs gSa mnkgj.k] vkokt vkSj “kkfCnd ?kVdksa ds lkFk oyZ~M okbM osc mi;ksx ds {ks= esa uohure fodkl gsrqA çLrkfor e‚My fodykax yksxksa ds fy, okLrfod le; i)fr dh enn ls nksuksa miHkksäkvksa ds chp esa vkokt lsok dks çnku djrk gSaAA
AbstrActSo far in the area of speech recognition most of the work has been carried out by considering
normal human being, but the disabled people haven’t got that much attention by the technology. Focus of this research is to develop a web application which will be more efficient and approachable to disabled people. In this paper, we have focused to provide more easy interaction with user and web application to access all web text with the help of voice. We used JSAPI (Java Speech API) components for speech acknowledgment in this research, i.e., the voice and the text components along with the latest development made in the field of World Wide Web uses. The proposed model is able to provide end to end voice service with a real time approach for disabled people.
Keywords: speech recognition; web speech recognition technology; JSAPI, web server
Bilingual International Conference on Information Technology: Yesterday, Today, and Tomorrow, 19-21 February 2015, pp. 153-158© DESIDOC, 2015
1. IntroductIonIn this modern era voice and visual technologies are
used in wide horizon. Voder provided the first speech synthesizer17. This technology can be certainly used as application on the web servers with optimized sound level. In last decades interaction of human and machine was out of thought but now a day’s programmers are coding for effective machine and human interaction with ease, which give the invention of speech recognition. This speech recognition concludes many research areas like mathematics, artificial intelligence, machine learning, statics and other electronics devices (microphone, processor, sound card technology)1-3. This developed application is capable to understand specific context of sentences, words, commands and makes the user flexible to input as a voice and also help to control all the web application text available on the web server as well as web reading. Many implementations has already done on language’s like English, Hindi, French,
etc. speech recognition, but it is not handy with the person with disability. In this paper our main focus on the speech reorganization with effective output in voice for all human beings.
To easily communicate with the people voice is the best medium, not only peoples but also with the web it is more flexible way. In these days for man to machine interaction voice is the best medium to command the computer and other handheld devices for specific task. In recent years more humanly nature like voice to text and text to voice conversion have been studied to recognized all type of signals. The prime motto of this study is to provide error free result. In this study, researcher has not only focused on voice but also in gestures and emotions of tested human.
Hinshelwood in 1917 introduced the term ‘congenital word blindness’ to describe this disability. Strauss and Warner in 1941 focus to the cases of the person with sufficient intellects are unsuccessful at the school
ArTIFICIAl InTEllIGEnCE AnD nETWOrK SECurITY
154
web application with the help of voice. This software contains many distinctive features like integrated speech reorganization as well as audio visually enriched boundary, which provides user better pronunciation activities and recognize the word.
2. rElAtEd worK oF sPEECh rECoGnition in wEb APPliCAtionSpeech awarding software is available in large
quantities in the market. Many renewed software are developed by many prestigious company like IBM11, Google12. IT giant Microsoft has also done research in this area by developing genie. In the market of software various voice navigation applications and speech recognizer are floating like Sphinx7, Sonic, X-voice9,10.
In speech recognition process surroundings voices are the worst part, it confuses the recognizer to understand the real voice that are supposed to hear [8]. This type of voice recognizer is used in robots. Major applications of this research are working in medical field as robots13. This virtual man complete it task efficiently while environment is full of other voice like motor noise. Such noises may change the input which was given by a voice. Currently we are using acoustic model for web based speech. To recognize speech for better results many IT giants are working on optimized research. Hewlett Packard (HP) is using Smart Badge15 hardware in its product by which we can save energy of device for longer period.
Another technology was proposed in this field named distributed speech recognition14 (DSr) for web based application. By this technology we can get result from different servers. This protocol provides very scalable system with maximum throughput from server side.
In the research16 many application is used for simulation like voice banking (VB) and directory help to show result sets between man and device. By our voice we can give command to machine for specific task in the area of speech recognition (Sr). There is no need of extra hardware for input like touchscreen or mouse.
now days microphone is using as voice receiver as input. While you are surfing the internet or video chat this hardware is using as voice receiver. For example, if we might say something like “Hi, how do u do? To which your input to be converted into text tokens. now this input sent will be send to server and server replies to local machine on the form of text and again this text will be converted in the form of voice as output.
Figure 1 shows speech reorganization engine recognized speech. The main function of this engine is to translate the speech into text so that application
due to experiencing reading difficulty. This type of difficulty is also define by the national committee like “national joint committee on learning disability” in 1988 emphasis on learning disability, basically learning disability refers to the faction of disorders manifested by important problem in the attainment and use of speaking, writing, speaking, reasoning mathematical disability on the web4.
For improving the mental process of speech of students, asked to focus on interpretation, relating, classification, these all term may causes disorders in the brain like classification is the consistent arrangement of specific items or things based on certain categories. So from the mental aspect of speech of students should aware of classification of words, objects subjects, sentences, animals, plants, facts, events etc. in the terms of web.
1.1 speech recognitionTo modify source speaker in to the target speaker
voice conversion (VC) system plays an important role. Basically speech signal provides different types of information, different fields of speech technology focuses on different information. The main focus of voice conversion is speaker identity. Voice conversion works on two major problem deals with speech. Firstly, characteristics identification of speaker during analysis phase and secondly in synthesis phase where replacement of source characteristics with the target characteristics. These operations are independent from each other.
1.2 objective of studyIt is an era of Internet that have responsibility
where individuals use, follow and web development technology for better communication language is the key for personnel and cultural development5. Due to the increasing use of audio visual communication tools invites people to use new modernized tools in education. For the success of students is to adapt the modernized educational equipment by voice. Multi tools are always beneficial then single tool for educational purposes in web application. This is a modernized period where the teaching based upon web technology and media is better than verbal teaching. It increases the level of learning, teaching and also provides solid information. Furthermore it improves students speaking and listening comprehension skills by the help this application6.
1.3 required Material & techniquesIn this paper we introduces the software and
API that contribute to the problem regarding to the problem mentioned above like bridging the gap between disabled people and new technology in interactive

SACHAn: BrIDGInG THE GAP BETWEEn DISABlED PEOPlE AnD nEW TECHnOlOGY In InTErACTIVE WEB APPlICATIOn WITH THE...
155
can understand it. The application basically does one of the two things:• Does interruption of the result is recognizing of
the speech. • Appear as a dictation application.
Some of the Fundamental of Speech recognition:
2.1 UtterancesWhen the user tries to speak something is
called utterance. It is steam of speech between the salience.
2.2 PronunciationsBasically speech reorganization engine takes inputs
of data, models, and algorithms to convert the text in to the speech. A particular piece of conformation that the process uses in the engine is called pronunciation.
2.3 GrammarSpeech reorganization engine works on certain
domain is called grammar. In this all the utterances of speech is compared with the words and phrases in the active grammar.
Here are some voice reorganization programs are available:• Windows 7: Most recent version of Microsoft
contains this type of reorganization system. It provide the many application are controlled by the voice such as opening browser, opening and closing of paint and also other work being done.
• Dragon naturally Speaking: Dragon is the world’s best-selling speech recognition software. It turns your talk into text and can complete our task with ease. In daily routine we can use such applications.
• Google Chrome browser: In the current system the Google chrome browser provide application of searching text into by the help of voice but it is limited to work that is only search in the form of text.
3. ProPosEd MEthodoloGYTwo main technologies required are as: speech
reorganization and synthesis. Speech synthesis for commercial technology and speech reorganization is also supported by the academic and commercial systems, but in certain boundaries. Versatility and accuracy is the main trade off principle between the speech recognition. The desired speech technology it is impossible to investigate the real aspects of voice such as acceptance or satisfaction.
We have to be focused on realistic studies so that we can focus on the future developing of the applications. The crux problem related with the designing to determine the user acceptance without use of technology, so we decided to use a wizard of web speech API approach, with the human operator performing the speech reorganization.
The group meetings are occurring to focusing on services and interaction techniques. These groups contain 6-8 participants and 2 moderators. The participants give brief descriptions of the proposed applications. These participants also helps to determine the scenarios that how the application can be used. They portraying the users while other performing other different services. Some recording is also made for the future perspective. These meetings helps to develop a list of potential services and to get original glance of what interaction might look like for using of web.
There are large list of inputs like brainstorming, focus groups and literature survey randomly we take four prototype us weather, headline news, messages
Figure 1. Process of converting voice input into text.
Figure 2. Proposed model for voice to voice in web application.
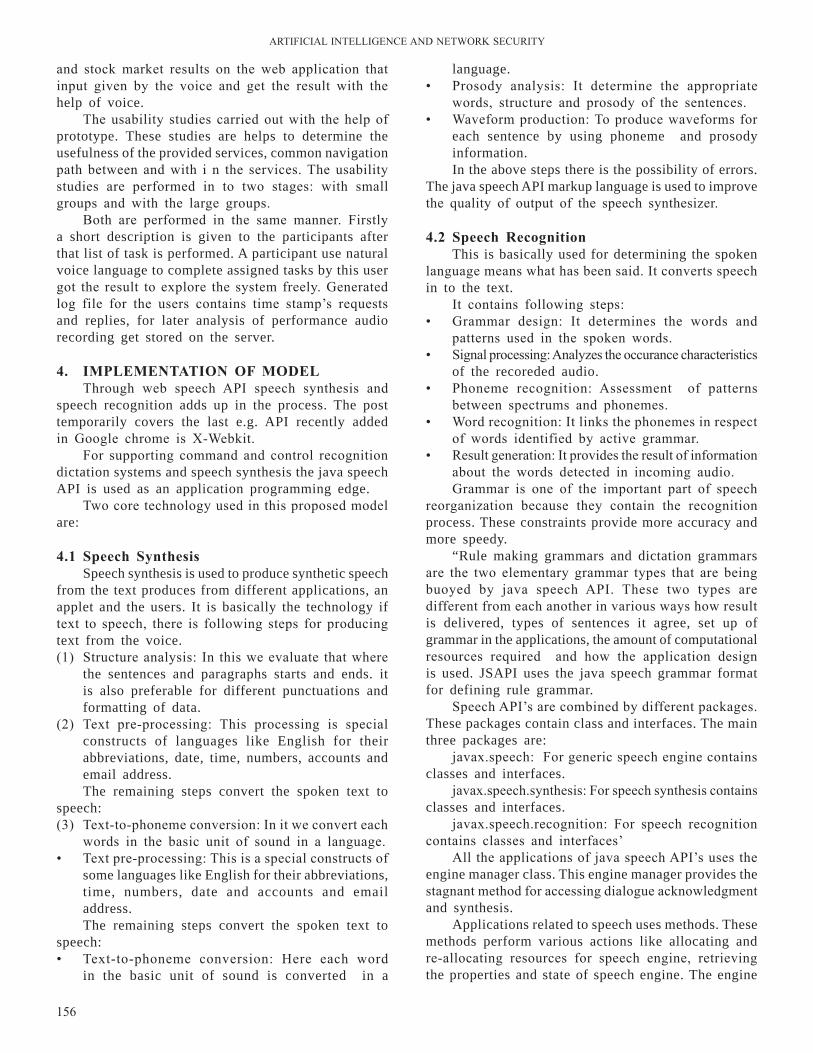
ArTIFICIAl InTEllIGEnCE AnD nETWOrK SECurITY
156
and stock market results on the web application that input given by the voice and get the result with the help of voice.
The usability studies carried out with the help of prototype. These studies are helps to determine the usefulness of the provided services, common navigation path between and with i n the services. The usability studies are performed in to two stages: with small groups and with the large groups.
Both are performed in the same manner. Firstly a short description is given to the participants after that list of task is performed. A participant use natural voice language to complete assigned tasks by this user got the result to explore the system freely. Generated log file for the users contains time stamp’s requests and replies, for later analysis of performance audio recording get stored on the server.
4. iMPlEMEntAtion oF ModElThrough web speech API speech synthesis and
speech recognition adds up in the process. The post temporarily covers the last e.g. API recently added in Google chrome is X-Webkit.
For supporting command and control recognition dictation systems and speech synthesis the java speech API is used as an application programming edge.
Two core technology used in this proposed model are:
4.1 speech synthesisSpeech synthesis is used to produce synthetic speech
from the text produces from different applications, an applet and the users. It is basically the technology if text to speech, there is following steps for producing text from the voice.(1) Structure analysis: In this we evaluate that where
the sentences and paragraphs starts and ends. it is also preferable for different punctuations and formatting of data.
(2) Text pre-processing: This processing is special constructs of languages like English for their abbreviations, date, time, numbers, accounts and email address.The remaining steps convert the spoken text to
speech:(3) Text-to-phoneme conversion: In it we convert each
words in the basic unit of sound in a language.• Text pre-processing: This is a special constructs of
some languages like English for their abbreviations, time, numbers, date and accounts and email address.The remaining steps convert the spoken text to
speech:• Text-to-phoneme conversion: Here each word
in the basic unit of sound is converted in a
language.• Prosody analysis: It determine the appropriate
words, structure and prosody of the sentences.• Waveform production: To produce waveforms for
each sentence by using phoneme and prosody information.In the above steps there is the possibility of errors.
The java speech API markup language is used to improve the quality of output of the speech synthesizer.
4.2 speech recognitionThis is basically used for determining the spoken
language means what has been said. It converts speech in to the text.
It contains following steps:• Grammar design: It determines the words and
patterns used in the spoken words.• Signal processing: Analyzes the occurance characteristics
of the recoreded audio.• Phoneme recognition: Assessment of patterns
between spectrums and phonemes.• Word recognition: It links the phonemes in respect
of words identified by active grammar.• result generation: It provides the result of information
about the words detected in incoming audio.Grammar is one of the important part of speech
reorganization because they contain the recognition process. These constraints provide more accuracy and more speedy.
“Rule making grammars and dictation grammars are the two elementary grammar types that are being buoyed by java speech API. These two types are different from each another in various ways how result is delivered, types of sentences it agree, set up of grammar in the applications, the amount of computational resources required and how the application design is used. JSAPI uses the java speech grammar format for defining rule grammar.
Speech API’s are combined by different packages. These packages contain class and interfaces. The main three packages are:
javax.speech: For generic speech engine contains classes and interfaces.
javax.speech.synthesis: For speech synthesis contains classes and interfaces.
javax.speech.recognition: For speech recognition contains classes and interfaces’
All the applications of java speech API’s uses the engine manager class. This engine manager provides the stagnant method for accessing dialogue acknowledgment and synthesis.
Applications related to speech uses methods. These methods perform various actions like allocating and re-allocating resources for speech engine, retrieving the properties and state of speech engine. The engine
SACHAn: BrIDGInG THE GAP BETWEEn DISABlED PEOPlE AnD nEW TECHnOlOGY In InTErACTIVE WEB APPlICATIOn WITH THE...
157
imparts the mechanism of pause and resuming the audio stream. Audio manager can be manipulated by engine interfaces.
The whole java speech API is work on event handling. Event generated can be easily identified and handled. Basically speech events handled through engine listener interface and also by synthesizer listener and recognizer listener.
5. ConClUsionThe speech recognizer that we used in our proposed
work for making better interaction of web application with the help of voice is first open source. Implementation of this research can be enhanced according use and ease. This recognizer is workable on real time mode with medium vocabulary speech recognition. By this we can recognize both words and numbers provided as input in the form of voice and get the result in the form of voice. We basically runs it live mode but contains certain limitations. After all the boundaries we can group up this software with usable hardware (Sound-card). The current trending software’s don’t support voice to voice (V-to-V) application on the web. This can be made more adaptable for any kind of web application. We have enhanced the efficiency of the voice recognition by this work.
Also, in the present work, we have hard coded the using of web speech by voice to voice. This can be further programmed for making all web application is controlled by the help of voice. This open source implemented idea is not only limited to static devices but also any user can exploit these services on dynamic devices too.
fu"d"k Zgekjs çLrkfod dk;Z esa O;k[;ku igpkud tks vkokt dh
lgk;rk ls osc vuqç;ksxksa ls csgrj laokn djrk gSa og çFke eqä L=ksr lk¶Vos;j gSaA bl “kks/k ds dk;kZUo;u dks mi;ksx vkSj lgtrk vuqlkj c<+k;k tk ldrk gSA ;g igpkud okLrfod le; esa e/;e “kCnkoyh O;k[;ku igpku ds lkFk
dke dj ldrk gSaA blds }kjk ge “kCnksa vkSj la[;k nksuksa dks vkokt ds :i esa buiqV dj ldrs gSa vkSj ifj.kke dks vkokt ds :i esa çkIr dj ldrs gSaA ge bls lh/ks çlkj.k ij pyk ldrs gSa ijUrq blesa dqN dfe;k¡ gksrh gSaA bu lHkh lhekvksa ds ckn ge bl lk¶Vos;j dks mi;ksx ;ksX; gkMZos;j ds lkFk ,d lewg cukrs gSaA orZeku çpfyr l‚¶Vos;j osc ij vkokt ls vkokt vuqç;ksxks dh enn ugha nsrkA ;g fdlh Hkh osc vuqç;ksx vf/kd vuqdwyu cuk;k tk ldrk gSA geus bl dk;Z ds }kjk vkokt igpku dh dq”kyrk esa o`f) dh gSA blds vykok] orZeku dke esa] geus osc O;k[;ku mi;ksx djds vkokt ls vkokt dks eqfær fd;k gSaA Hkfo’; esa blesa çksxzkfeax djds lHkh osc vuqç;ksxksa dks vkokt dh enn ls fu;af=r fd;k tk ldrk gSaA ;g eqä lzksr fopkj dk dk;kZUou dsoy fLFkj midj.kksa ij gh ugha vfirq mi;ksxdrkZ bu lsokvksa dk miHkksx lfØ; midj.kksa ij Hkh dj ldrs gSaA
rEFErEnCEs1. Bahl, l. r. Some experiments with large-vocabulary
isolated-word sentence recognition. In Int. Conf. Acoust., Speech and Signal Processing, 1984.
2. rabiner, l. and Juang, B.-H. Fundamentals of Speech recognition, 2003: Pearson Education.
3. H. Palazç, TrEn- Turkish speech recognition platform, Tübitak national electronics and cryptology Institute, 2005.
4. rabiner, l.r. A tutorial on hidden Markov models and selected applications in speech recognition. In Proceedings of the IEEE 77, 257—286, 1989.
5. l. Bahl, P. Brown, P. de Sow and Mercer, r. Maximum mutual information estimation of hidden Markov model parameters for speech recognition. Proc. IEEE Int. Conf. Acoust., Speech, Signal Process. (ICASSP\’86), 1986, 1, pp. 49-52
6. Aggarwal, r.K. and Dave, M. Performance evaluation of sequentially combined heterogeneous feature streams for Hindi speech recognition system. Telecommunication Systems, 52(3), pp. 1457-1466.
7. lee, Kai-Fu; Hon, Hsiao-Wuen & reddy, raj An overview of the SPHInX speech recognition system. IEEE Trans. Acoustics, Speech Signal Processing,
8. Juang, B.-H. and Katagiri, S. Discriminative learning for minimum error classification. IEEE Trans. Signal Process., 1992, 40(12), 3043-3054.
9. D. Povey and Woodland, P. Minimum phone error and I-smoothing for improved discriminative training. Proc. IEEE Int. Conf. Acoust., Speech, Signal Process. (ICASSP \’02), vol. 1, pp.105 -108 2002.
10. Ganapathiraju, J. Hamaker and Picone, J. Hybrid SVM/HMM architectures for speech recognition.
Figure 3. demonstration of web speech.

ArTIFICIAl InTEllIGEnCE AnD nETWOrK SECurITY
158
Proc. 6th Int. Conf. Spoken lang. Process. (ICSlP \’00), 2000, pp. 504 -507.
11. http://www.speech.be.philips.com/index.htm[ last Accessed on 17-Oct-2014]
12. Yoshitaka nishimura, Mikio nakano, Kazuhiro nakadai, Speech recognition for a robot under its motor noises by selective application of missing feature theory and Mllr.
13. naveen Srinivasamurthy, Antonio Ortega, Shrikanth narayanan, Efficient scalable speech compression for scalable speech recognition.
14. Brian Delaney, Tajana Simunic, nikil Jayant, Energy aware distributed speech recognition for
wireless mobile devices.15. lawrence r. rabiner, Applications of speech
recognition in the area of telecommunications.16. E. McDermott, T.J. Hazen, J. l. roux, A. nakamura
and S. Katagiri. Discriminative training for large-vocabulary speech recognition using minimum classification error. IEEE Trans. Audio, Speech, Lang. Process., 15(1), pp. 203-223.
17. http://en.wikipedia.org/wiki/Vocoder [ last Accessed on 19-Oct-2014]
18. http://www.research.ibm.com/haifa/projects/imt/dsr/ [last accessed on 20-Oct-2014]
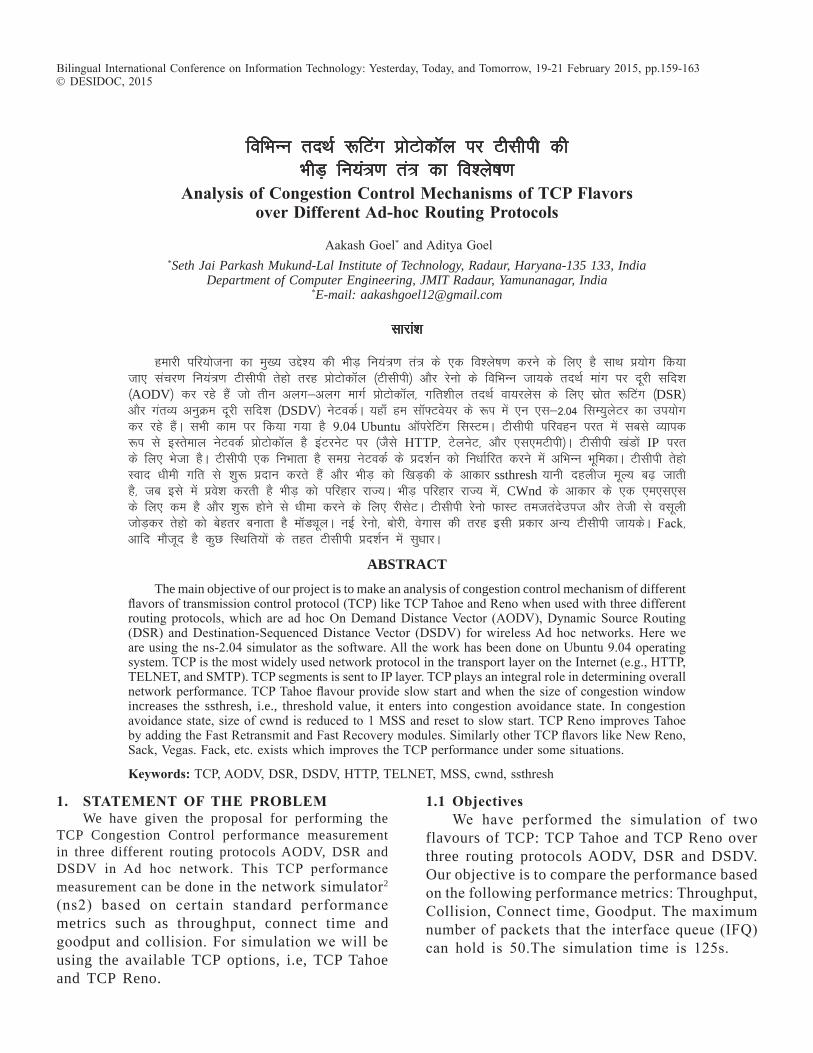
fofHkUu rnFkZ :fVax çksVksd‚y ij Vhlhih dh HkhM+ fu;a=.k ra= dk fo”ys’k.k
Analysis of Congestion Control Mechanisms of tCP Flavors over different Ad-hoc routing Protocols
Aakash Goel* and Aditya Goel*Seth Jai Parkash Mukund-Lal Institute of Technology, Radaur, Haryana-135 133, India
Department of Computer Engineering, JMIT Radaur, Yamunanagar, India *E-mail: [email protected]
lkjka”k
gekjh ifj;kstuk dk eq[; mís”; dh HkhM+ fu;a=.k ra= ds ,d fo”ys’k.k djus ds fy, gS lkFk ç;ksx fd;k tk, lapj.k fu;a=.k Vhlhih rsgks rjg çksVksd‚y ¼Vhlhih½ vkSj jsuks ds fofHkUu tk;ds rnFkZ ekax ij nwjh lfn”k ¼AODV½ dj jgs gSa tks rhu vyx&vyx ekxZ çksVksd‚y] xfr”khy rnFkZ ok;jysl ds fy, lzksr :fVax ¼DSR½ vkSj xarO; vuqØe nwjh lfn”k ¼DSDV½ usVodZA ;gk¡ ge l‚¶Vos;j ds :i esa ,u ,l&2-04 flE;qysVj dk mi;ksx dj jgs gSaA lHkh dke ij fd;k x;k gS 9.04 ubuntu v‚ijsfVax flLVeA Vhlhih ifjogu ijr esa lcls O;kid :i ls bLrseky usVodZ çksVksd‚y gS baVjusV ij ¼tSls HTTP] VsyusV] vkSj ,l,eVhih½A Vhlhih [kaMksa IP ijr ds fy, Hkstk gSA Vhlhih ,d fuHkkrk gS lexz usVodZ ds çn”kZu dks fu/kkZfjr djus esa vfHkUu HkwfedkA Vhlhih rsgks Lokn /kheh xfr ls “kq: çnku djrs gSa vkSj HkhM+ dks f[kM+dh ds vkdkj ssthresh ;kuh ngyht ewY; c<+ tkrh gS] tc bls esa ços”k djrh gS HkhM+ dks ifjgkj jkT;A HkhM+ ifjgkj jkT; esa] CWnd ds vkdkj ds ,d ,e,l,l ds fy, de gS vkSj “kq: gksus ls /khek djus ds fy, jhlsVA Vhlhih jsuks QkLV retransmit vkSj rsth ls olwyh tksM+dj rsgks dks csgrj cukrk gS e‚MîwyA ubZ jsuks] cksjh] osxkl dh rjg blh çdkj vU; Vhlhih tk;dsA Fack] vkfn ekStwn gS dqN fLFkfr;ksa ds rgr Vhlhih çn”kZu esa lq/kkjA
AbstrActThe main objective of our project is to make an analysis of congestion control mechanism of different
flavors of transmission control protocol (TCP) like TCP Tahoe and reno when used with three different routing protocols, which are ad hoc On Demand Distance Vector (AODV), Dynamic Source routing (DSr) and Destination-Sequenced Distance Vector (DSDV) for wireless Ad hoc networks. Here we are using the ns-2.04 simulator as the software. All the work has been done on ubuntu 9.04 operating system. TCP is the most widely used network protocol in the transport layer on the Internet (e.g., HTTP, TElnET, and SMTP). TCP segments is sent to IP layer. TCP plays an integral role in determining overall network performance. TCP Tahoe flavour provide slow start and when the size of congestion window increases the ssthresh, i.e., threshold value, it enters into congestion avoidance state. In congestion avoidance state, size of cwnd is reduced to 1 MSS and reset to slow start. TCP reno improves Tahoe by adding the Fast retransmit and Fast recovery modules. Similarly other TCP flavors like new reno, Sack, Vegas. Fack, etc. exists which improves the TCP performance under some situations.
Keywords: TCP, AODV, DSr, DSDV, HTTP, TElnET, MSS, cwnd, ssthresh
Bilingual International Conference on Information Technology: Yesterday, Today, and Tomorrow, 19-21 February 2015, pp.159-163 DESIDOC, 2015
1. stAtEMEnt oF thE ProblEMWe have given the proposal for performing the
TCP Congestion Control performance measurement in three different routing protocols AODV, DSR and DSDV in Ad hoc network. This TCP performance measurement can be done in the network simulator2
(ns2) based on certain standard performance metrics such as throughput, connect time and goodput and collision. For simulation we will be using the available TCP options, i.e, TCP Tahoe and TCP Reno.
1.1 objectivesWe have performed the simulation of two
flavours of TCP: TCP Tahoe and TCP Reno over three routing protocols AODV, DSR and DSDV. Our objective is to compare the performance based on the following performance metrics: Throughput, Collision, Connect time, Goodput. The maximum number of packets that the interface queue (IFq) can hold is 50.The simulation time is 125s.
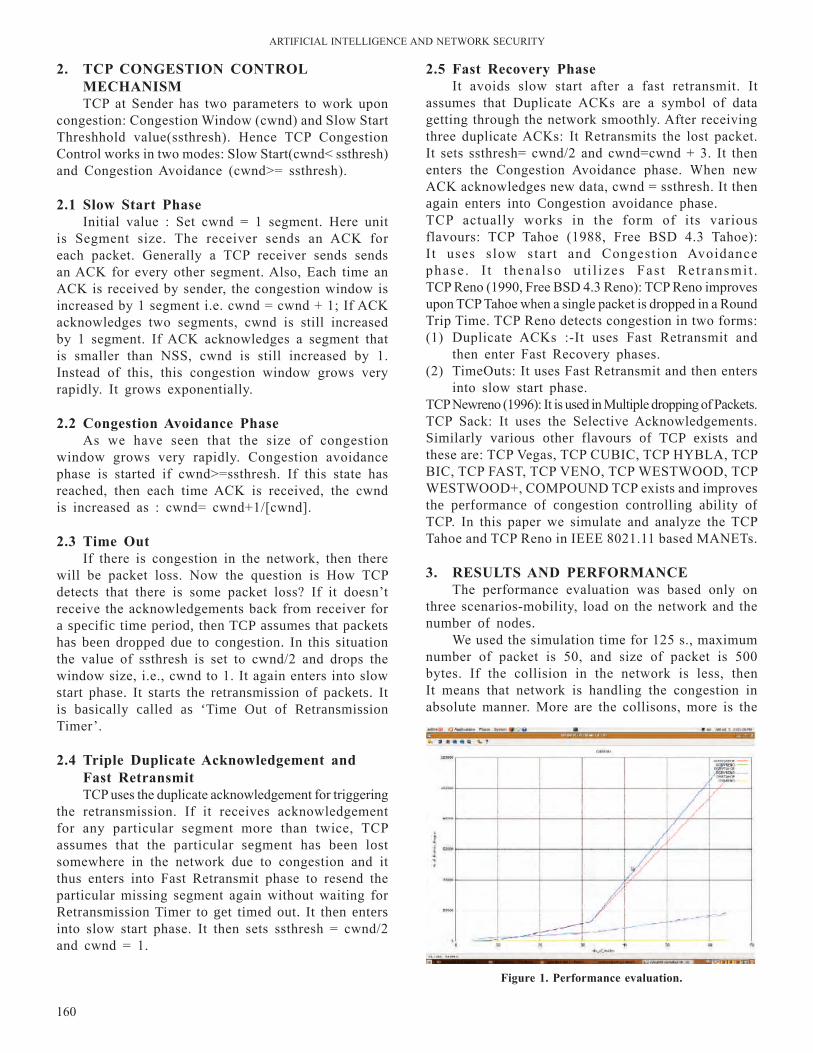
ArTIFICIAl InTEllIGEnCE AnD nETWOrK SECurITY
160
2. tCP ConGEstion Control MEChAnisMTCP at Sender has two parameters to work upon
congestion: Congestion Window (cwnd) and Slow Start Threshhold value(ssthresh). Hence TCP Congestion Control works in two modes: Slow Start(cwnd< ssthresh) and Congestion Avoidance (cwnd>= ssthresh).
2.1 slow start PhaseInitial value : Set cwnd = 1 segment. Here unit
is Segment size. The receiver sends an ACK for each packet. Generally a TCP receiver sends sends an ACK for every other segment. Also, Each time an ACK is received by sender, the congestion window is increased by 1 segment i.e. cwnd = cwnd + 1; If ACK acknowledges two segments, cwnd is still increased by 1 segment. If ACK acknowledges a segment that is smaller than nSS, cwnd is still increased by 1. Instead of this, this congestion window grows very rapidly. It grows exponentially.
2.2 Congestion Avoidance PhaseAs we have seen that the size of congestion
window grows very rapidly. Congestion avoidance phase is started if cwnd>=ssthresh. If this state has reached, then each time ACK is received, the cwnd is increased as : cwnd= cwnd+1/[cwnd].
2.3 time outIf there is congestion in the network, then there
will be packet loss. now the question is How TCP detects that there is some packet loss? If it doesn’t receive the acknowledgements back from receiver for a specific time period, then TCP assumes that packets has been dropped due to congestion. In this situation the value of ssthresh is set to cwnd/2 and drops the window size, i.e., cwnd to 1. It again enters into slow start phase. It starts the retransmission of packets. It is basically called as ‘Time Out of Retransmission Timer’.
2.4 triple duplicate Acknowledgement and Fast retransmitTCP uses the duplicate acknowledgement for triggering
the retransmission. If it receives acknowledgement for any particular segment more than twice, TCP assumes that the particular segment has been lost somewhere in the network due to congestion and it thus enters into Fast retransmit phase to resend the particular missing segment again without waiting for Retransmission Timer to get timed out. It then enters into slow start phase. It then sets ssthresh = cwnd/2 and cwnd = 1.
2.5 Fast recovery PhaseIt avoids slow start after a fast retransmit. It
assumes that Duplicate ACKs are a symbol of data getting through the network smoothly. After receiving three duplicate ACKs: It retransmits the lost packet. It sets ssthresh= cwnd/2 and cwnd=cwnd + 3. It then enters the Congestion Avoidance phase. When new ACK acknowledges new data, cwnd = ssthresh. It then again enters into Congestion avoidance phase.TCP actually works in the form of its various flavours: TCP Tahoe (1988, Free BSD 4.3 Tahoe): I t uses slow start and Congestion Avoidance phase . I t thenalso u t i l izes Fas t ret ransmi t .TCP reno (1990, Free BSD 4.3 reno): TCP reno improves upon TCP Tahoe when a single packet is dropped in a round Trip Time. TCP reno detects congestion in two forms:(1) Duplicate ACKs :-It uses Fast retransmit and
then enter Fast recovery phases.(2) TimeOuts: It uses Fast retransmit and then enters
into slow start phase.TCP newreno (1996): It is used in Multiple dropping of Packets.TCP Sack: It uses the Selective Acknowledgements. Similarly various other flavours of TCP exists and these are: TCP Vegas, TCP CuBIC, TCP HYBlA, TCP BIC, TCP FAST, TCP VEnO, TCP WESTWOOD, TCP WESTWOOD+, COMPOunD TCP exists and improves the performance of congestion controlling ability of TCP. In this paper we simulate and analyze the TCP Tahoe and TCP reno in IEEE 8021.11 based MAnETs.
3. rEsUlts And PErForMAnCEThe performance evaluation was based only on
three scenarios-mobility, load on the network and the number of nodes.
We used the simulation time for 125 s., maximum number of packet is 50, and size of packet is 500 bytes. If the collision in the network is less, then It means that network is handling the congestion in absolute manner. More are the collisons, more is the
Figure 1. Performance evaluation.
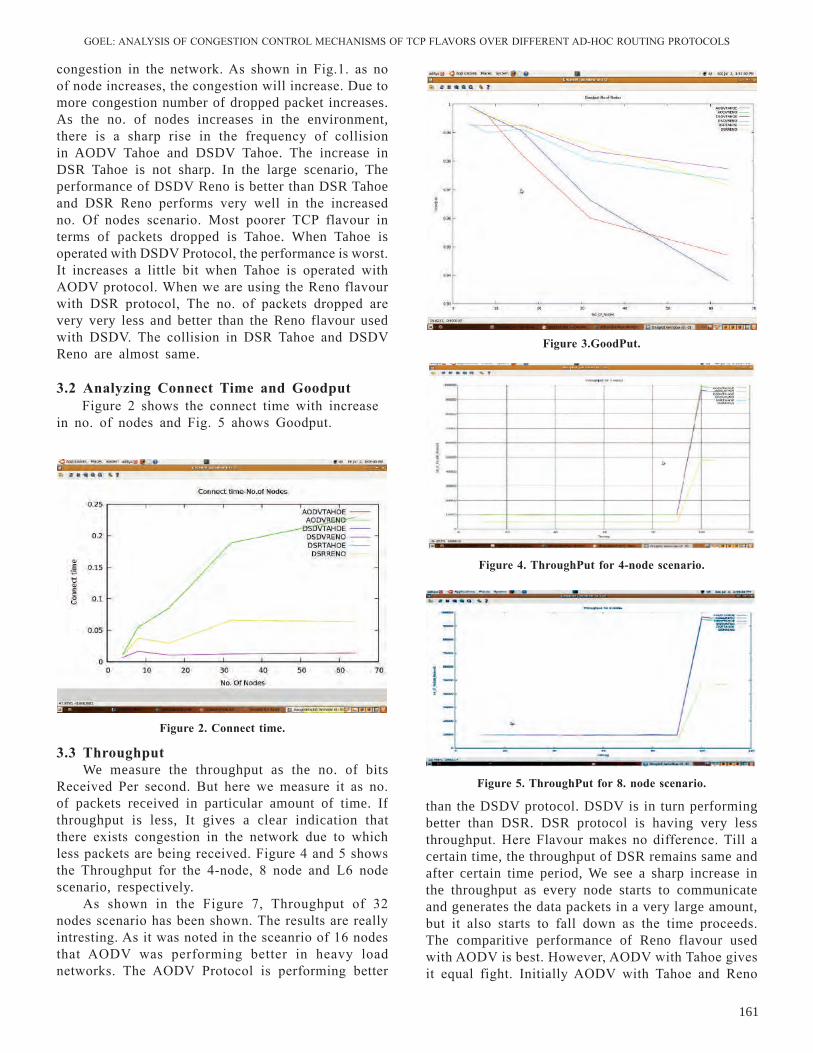
GOEl: AnAlYSIS OF COnGESTIOn COnTrOl MECHAnISMS OF TCP FlAVOrS OVEr DIFFErEnT AD-HOC rOuTInG PrOTOCOlS
161
congestion in the network. As shown in Fig.1. as no of node increases, the congestion will increase. Due to more congestion number of dropped packet increases. As the no. of nodes increases in the environment, there is a sharp rise in the frequency of collision in AODV Tahoe and DSDV Tahoe. The increase in DSR Tahoe is not sharp. In the large scenario, The performance of DSDV Reno is better than DSR Tahoe and DSr reno performs very well in the increased no. Of nodes scenario. Most poorer TCP flavour in terms of packets dropped is Tahoe. When Tahoe is operated with DSDV Protocol, the performance is worst. It increases a little bit when Tahoe is operated with AODV protocol. When we are using the reno flavour with DSr protocol, The no. of packets dropped are very very less and better than the Reno flavour used with DSDV. The collision in DSr Tahoe and DSDV Reno are almost same.
3.2 Analyzing Connect time and Goodput Figure 2 shows the connect time with increasein no. of nodes and Fig. 5 ahows Goodput.
Figure 2. Connect time.
Figure 3.GoodPut.
Figure 4. throughPut for 4-node scenario.
Figure 5. throughPut for 8. node scenario.
3.3 throughputWe measure the throughput as the no. of bits
received Per second. But here we measure it as no. of packets received in particular amount of time. If throughput is less, It gives a clear indication that there exists congestion in the network due to which less packets are being received. Figure 4 and 5 shows the Throughput for the 4-node, 8 node and l6 node scenario, respectively.
As shown in the Figure 7, Throughput of 32 nodes scenario has been shown. The results are really intresting. As it was noted in the sceanrio of 16 nodes that AODV was performing better in heavy load networks. The AODV Protocol is performing better
than the DSDV protocol. DSDV is in turn performing better than DSR. DSR protocol is having very less throughput. Here Flavour makes no difference. Till a certain time, the throughput of DSR remains same and after certain time period, We see a sharp increase in the throughput as every node starts to communicate and generates the data packets in a very large amount, but it also starts to fall down as the time proceeds. The comparitive performance of Reno flavour used with AODV is best. However, AODV with Tahoe gives it equal fight. Initially AODV with Tahoe and reno
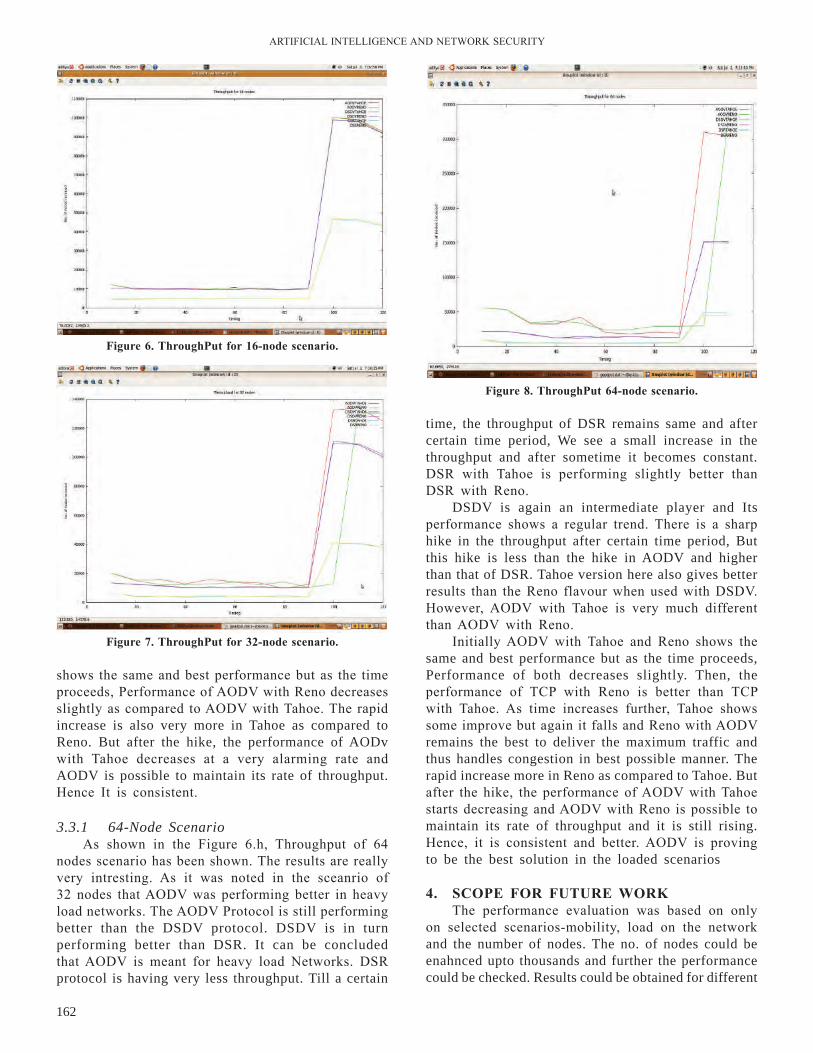
ArTIFICIAl InTEllIGEnCE AnD nETWOrK SECurITY
162
shows the same and best performance but as the time proceeds, Performance of AODV with reno decreases slightly as compared to AODV with Tahoe. The rapid increase is also very more in Tahoe as compared to Reno. But after the hike, the performance of AODv with Tahoe decreases at a very alarming rate and AODV is possible to maintain its rate of throughput. Hence It is consistent.
3.3.1 64-Node ScenarioAs shown in the Figure 6.h, Throughput of 64
nodes scenario has been shown. The results are really very intresting. As it was noted in the sceanrio of 32 nodes that AODV was performing better in heavy load networks. The AODV Protocol is still performing better than the DSDV protocol. DSDV is in turn performing better than DSR. It can be concluded that AODV is meant for heavy load networks. DSr protocol is having very less throughput. Till a certain
time, the throughput of DSR remains same and after certain time period, We see a small increase in the throughput and after sometime it becomes constant. DSr with Tahoe is performing slightly better than DSr with reno.
DSDV is again an intermediate player and Its performance shows a regular trend. There is a sharp hike in the throughput after certain time period, But this hike is less than the hike in AODV and higher than that of DSR. Tahoe version here also gives better results than the reno flavour when used with DSDV. However, AODV with Tahoe is very much different than AODV with reno.
Initially AODV with Tahoe and reno shows the same and best performance but as the time proceeds, Performance of both decreases slightly. Then, the performance of TCP with reno is better than TCP with Tahoe. As time increases further, Tahoe shows some improve but again it falls and reno with AODV remains the best to deliver the maximum traffic and thus handles congestion in best possible manner. The rapid increase more in Reno as compared to Tahoe. But after the hike, the performance of AODV with Tahoe starts decreasing and AODV with reno is possible to maintain its rate of throughput and it is still rising. Hence, it is consistent and better. AODV is proving to be the best solution in the loaded scenarios
4. sCoPE For FUtUrE worKThe performance evaluation was based on only
on selected scenarios-mobility, load on the network and the number of nodes. The no. of nodes could be enahnced upto thousands and further the performance could be checked. Results could be obtained for different
Figure 6. throughPut for 16-node scenario.
Figure 8. throughPut 64-node scenario.
Figure 7. throughPut for 32-node scenario.
GOEl: AnAlYSIS OF COnGESTIOn COnTrOl MECHAnISMS OF TCP FlAVOrS OVEr DIFFErEnT AD-HOC rOuTInG PrOTOCOlS
163
rEFErEnCEs1. Habibullah, Jamal, and Sultan, Kiran, Performance
analysis of TCP congestion control algorithms, Inter. J. Com. Comm., 2(1), 2008.
2. Georgi, Kirov. A simulation analysis of the TCP control algorithms. International Conference on Computer Systems and Technologies - CompSysTech, 2005.
3. Basagni, M.; Conti, S. & Giordano, I. Stojmenovic, eds, Mobile Ad Hoc networking. IEEE Press/Wiley, 2004.
4. nitin, Kartik. Algorithm for TCP Congestion Control. EE 384y-Spring 2003 - Prof. nick McKeown, Prof. Balaji Prabhakar.
5. Holland, G. & Vaidya, n. Analysis of TCP performance over mobile ad hoc networks. ACM Mobicom 99. r. Boppana and S. Konduru, An adaptive distancevector routing algorithm for mobile, ad hoc networks. IEEE Infocom 2001,
6. Ahuja, A. et al. Performance of TCP over different routing protocols in mobile ad-hoc networks. In Proceedings of the IEEE Vehicular Technology Conference (VTC 2000), Tokyo, Japan, 2000.
7. www.isi.edu/nsnam/ns/tutorial Marc Greis tutorial on ns-2, Matthias Transier, ns-2 tutorial running simulations.
8. http://www.duke.edu/~hpgavin/gnuplot.html9. Allalouf, Miriam; Shavitt, Yuval & Steiner, Eitan.
notes on The Simulation of TCP Congestion Control Algorithms, School of Electrical Engineering Tel Aviv university.
10. Aggarwal, Amit; Savage, Stefan & Anderson,Thomas. understanding the performance of TCP pacing. IEEE InfoCom 2000, March 30, 2000,
11. Barlow, Diane. Close, The AWK Manual, Edition 1.0, Dec. 1995.
12. Dyer.,Thomas D. The univ. of Texas at San Antonio, TX, A Comparison of TCP performance over three routing protocols for mobile ad hoc networks.
13. Perkins, Dmitri D. & Hughes, Herman D. TCP performance in mobile ad hoc networks. Michigan State university, East lansing, MI 48824-1226, perkin 27.
14. Dyer, Thomas D. & Boppana, rajendra V. Analysis of TCP and uDP Traffic in MAnETs. uT San Antonio.
scenarios as well using the nSG, i.e., (network Scenario Generator). network other parameter like radio network interface and realistic physical layers can be used. This would make the performance evaluation much better. More proactive and reactive routing protocols can be compared and their performance can be obtained in various cases. With the analysis of performance of MAnETs, we can enhance the throughput of network as required. It will possible to do performance analysis of MAnETs in noise network environment too.
5. ConClUsionsThus, we conclude from our simulation result
that number of packets drop in DSR is very less compared to DSDV and AODV routing protocols. Drop rate in reno Flavour is less as compared to that in Tahoe Flavour. So Collision in DSr is very less than that in DSDV and AODV. Collision in DSR Reno is much less than that in DSR Tahoe. DSDV has less connect time than DSr and AODV. Goodput of DSr is high compared to DSDV and AODV. If we see overall from the perspective of Throughput, Reno Flavour performs better than that Tahoe Flavour. We also conclude that the DSR routing protocol performs well under the variety of conditions than that of the DSDV and AODV. In some of the scenarios DSDV protocol performance better than the DSR and AODV. There are various scenarios in which the performance of AODV with reno is better than that of DSDV Reno and DSR Reno. AODV is good at higher loads scenario whereas for the scenarios of small loads, DSDV is a better approach.
fu"d"k Z bl DSR cgqr gS esa bl çdkj] ge gekjs fleqys”ku
ifj.kke ls iSdsV Mª‚i dh la[;k fu’d’kZ fudkyuk de DSDV vkSj AODV ekxZ çksVksd‚y dh rqyuk esaA jsuks Lokn esa Mª‚i nj ds :i esa de gS rsgks Lokn esa ml dh rqyuk esaA rks bl dsr esa Vdjko DSDV vkSj AODV esa gS fd vf/kd ls cgqr de gSA bl dsr jsuks esa Vdjko dh bl dsr rsgks esa gS fd vf/kd ls cgqr de gSA DSDV bl dsr ls de dusDV le; gS vkSj AODVA bl DSR ds Goodput DSDV vkSj AODV dh rqyuk esa vf/kd gSA ge F: iqV ds utfj, ls lexz ns[krs gSa] jsuks Lokn dh rqyuk esa csgrj çn”kZu fd rsgks LoknA ge Hkh bl dsr ekxZ çksVksd‚y fdLe ds rgr vPNh rjg ls djrk gS fd fu’d’kZ fudkyuk DSDV vkSj AODV dh rqyuk esa fLFkfr;ksa dhA ifj–’;ksa DSDV çksVksd‚y esa ls dqN esa bl dsr vkSj AODV dh rqyuk esa csgrj çn”kZuA fofHkUu ifj–”;ksa gSa tks çn”kZu esa jsuks ds lkFk AODV dh DSDV jsuks vkSj bl dsr jsuks dh rqyuk esa csgrj gSA AODV mPprj esa vPNk gS NksVs Hkkj ds ifj–”;ksa ds fy,] tcfd Hkkj ifj–”;] DSDV ,d csgrj rjhdk gSAsA

oØ fQfVax dk mi;ksx djds eksckby rnFkZ usVodZ ds fy, ,d uohu forfjr ewy izca/ku iz.kkyh
A novel distributed Key Management system for Mobile Adhoc networks using Curve Fitting
K.r. ramkumar and C.S. ravichandran*
Sri Venkateswara College of Engineering Sri Ramakrishna College of Engineering
*E-mail: [email protected]
lkjka”k
ok;jySl ek/;e fofHkUu izdkj ds geyksa ds fy, [kqys vkSj laosnu”khy gS vkSj ?kqliSfB;s vuk;kl gh uksM~l gSd dj ldrs gSaA xksiuh;rk vkSj izek.ku lqj{kk <kaps ds ewy rRo gSaA ok;jySl usVodZ vDlj lkafLFkfr topology ifjorZuksa] lhfer vkos’V fo”knrk bandwidth vkSj dsUnzh; fu;a=.k ds vHkko tSls dbZ dkjdksa dh otg ls vfLFkj vkSj vfo”oluh; gSaA ,d ekud lqj{kk <kaps dks ykxw djus ds fy, ,d fo”oluh; ewy izca/ku dh vko”;drk gSA egŸoiw.kZ tkudkjh dks lk>k djus] egŸoiw.kZ tkudkjh dks forfjr djus vkSj fujlu e/; geyksa esa iq#’kksa dks jksdus tSls izLrkfor dk;ksZa esa oØ fQfVax ds Qk;nksa dk ykHk mBk;k tkrk gSA
AbstrAct
The wireless medium is uncovered and vulnerable to different routing attacks and intruders can hack nodes effortlessly. The confidentiality and authentication are the main elements of security framework.The wireless networks are unstable and unreliable because of various factors; topology changes are frequent, limited bandwidth and acbsence of a centralized control.A reliable key management is required to implement a standard security framework. The proposed work leverages the advantages of curve fitting for key sharing; key distribution and revocation to prevent men in middle attacks
Keywords: Curve fitting, secret sharing, certificate, polynomial functions
Bilingual International Conference on Information Technology: Yesterday, Today, and Tomorrow, 19-21 February 2015, pp. 164-170© DESIDOC, 2015
1. IntroductIonThe “active attacks”1,2 execute harmful functions
such as packet discarding, corrupting payload and routing messages. The “passive attacks”1,2 mainly read network functions and collect information about network. Furthermore, a malicious node4,7 can take part in the network to disrupt the normal routing process.The malicious node is an unauthorized node that causes congestion, propagates incorrect routing messages, prevents services or shuts them down completely. These extortions exist because of intrinsically limited physical security of mobile ad hoc networks. undeniably, it is easier to interrupt communications and infuse corrupted messages in the wireless communication medium than in an equivalent wired network. A dedicated server is constituted to manage certificates in normal scenario or assymetric keys are used. These traditional methods are not applicble to wireless networks.
2. sECUritY issUEsThe spoofing is the main problem that destructs
the entire network .The immediate dominance of spoofing attack8,2 is the “over all” corruption of network information trailed by network loops and partitioning of network. The security frame work for MAnET is made up of the following building blocks.i) Distributed Key Managementii) Security Association (SA) iii) Curve fitting
2.1 security Association A certificate contains3 (Px: public key, toc: time of
creation and IPx: Ip address of a device). A dedicated server3 is taking the responsibility of issuing and revoking certificates.But establishing a separate server is against to the nature of MAnET. Therefore this work requires a hybrid approach with Security association
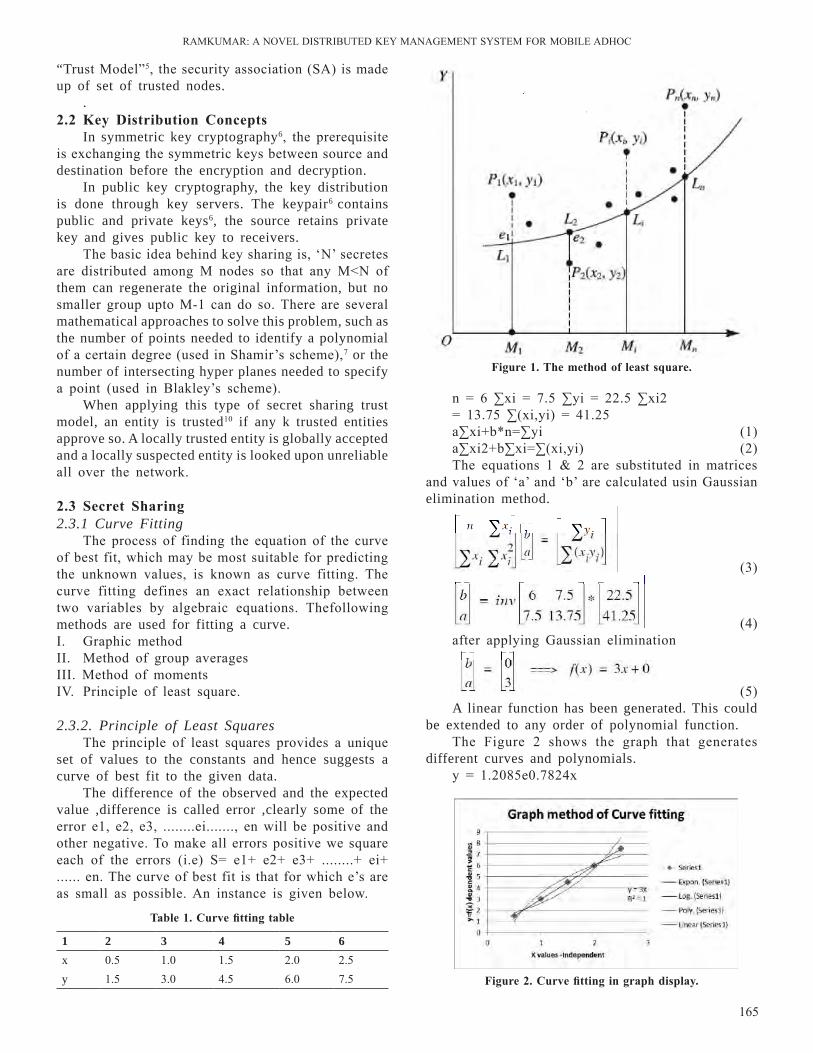
rAMKuMAr: A nOVEl DISTrIBuTED KEY MAnAGEMEnT SYSTEM FOr MOBIlE ADHOC
165
n = 6 ∑xi = 7.5 ∑yi = 22.5 ∑xi2 = 13.75 ∑(xi,yi) = 41.25 a∑xi+b*n=∑yi (1)a∑xi2+b∑xi=∑(xi,yi) (2)The equations 1 & 2 are substituted in matrices
and values of ‘a’ and ‘b’ are calculated usin Gaussian elimination method.
(3)
(4)after applying Gaussian elimination
(5) A linear function has been generated. This could
be extended to any order of polynomial function.The Figure 2 shows the graph that generates
different curves and polynomials.y = 1.2085e0.7824x
“Trust Model”5, the security association (SA) is made up of set of trusted nodes.
. 2.2 Key distribution Concepts
In symmetric key cryptography6, the prerequisite is exchanging the symmetric keys between source and destination before the encryption and decryption.
In public key cryptography, the key distribution is done through key servers. The keypair6 contains public and private keys6, the source retains private key and gives public key to receivers.
The basic idea behind key sharing is, ‘n’ secretes are distributed among M nodes so that any M<n of them can regenerate the original information, but no smaller group upto M-1 can do so. There are several mathematical approaches to solve this problem, such as the number of points needed to identify a polynomial of a certain degree (used in Shamir’s scheme),7 or the number of intersecting hyper planes needed to specify a point (used in Blakley’s scheme).
When applying this type of secret sharing trust model, an entity is trusted10 if any k trusted entities approve so. A locally trusted entity is globally accepted and a locally suspected entity is looked upon unreliable all over the network.
2.3 secret sharing2.3.1 Curve Fitting
The process of finding the equation of the curve of best fit, which may be most suitable for predicting the unknown values, is known as curve fitting. The curve fitting defines an exact relationship between two variables by algebraic equations. Thefollowing methods are used for fitting a curve.I. Graphic methodII. Method of group averagesIII. Method of momentsIV. Principle of least square.
2.3.2. Principle of Least SquaresThe principle of least squares provides a unique
set of values to the constants and hence suggests a curve of best fit to the given data.
The difference of the observed and the expected value ,difference is called error ,clearly some of the error e1, e2, e3, ........ei......., en will be positive and other negative. To make all errors positive we square each of the errors (i.e) S= e1+ e2+ e3+ ........+ ei+ ...... en. The curve of best fit is that for which e’s are as small as possible. An instance is given below.
Figure 1. the method of least square.
Figure 2. Curve fitting in graph display.
1 2 3 4 5 6x 0.5 1.0 1.5 2.0 2.5y 1.5 3.0 4.5 6.0 7.5
table 1. Curve fitting table
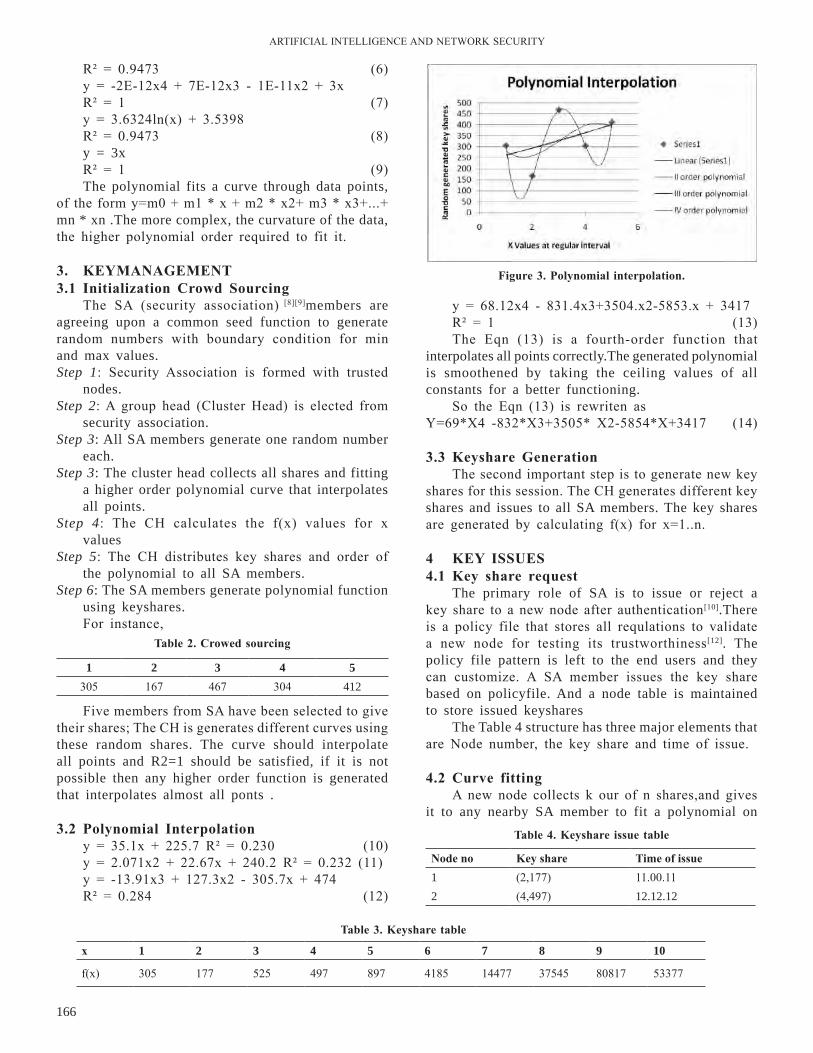
ArTIFICIAl InTEllIGEnCE AnD nETWOrK SECurITY
166
r² = 0.9473 (6) y = -2E-12x4 + 7E-12x3 - 1E-11x2 + 3x
r² = 1 (7) y = 3.6324ln(x) + 3.5398
r² = 0.9473 (8) y = 3x
r² = 1 (9) The polynomial fits a curve through data points,
of the form y=m0 + m1 * x + m2 * x2+ m3 * x3+...+ mn * xn .The more complex, the curvature of the data, the higher polynomial order required to fit it.
3. KEYMAnAGEMEnt3.1 initialization Crowd sourcing
The SA (security association) [8][9]members are agreeing upon a common seed function to generate random numbers with boundary condition for min and max values.Step 1: Security Association is formed with trusted
nodes.Step 2: A group head (Cluster Head) is elected from
security association.Step 3: All SA members generate one random number
each.Step 3: The cluster head collects all shares and fitting
a higher order polynomial curve that interpolates all points.
Step 4: The CH calculates the f(x) values for x values
Step 5: The CH distributes key shares and order of the polynomial to all SA members.
Step 6: The SA members generate polynomial function using keyshares.For instance,
y = 68.12x4 - 831.4x3+3504.x2-5853.x + 3417 r² = 1 (13)
The Eqn (13) is a fourth-order function that interpolates all points correctly.The generated polynomial is smoothened by taking the ceiling values of all constants for a better functioning.
So the Eqn (13) is rewriten asY=69*X4 -832*X3+3505* X2-5854*X+3417 (14)
3.3 Keyshare GenerationThe second important step is to generate new key
shares for this session. The CH generates different key shares and issues to all SA members. The key shares are generated by calculating f(x) for x=1..n.
4 KEY issUEs 4.1 Key share request
The primary role of SA is to issue or reject a key share to a new node after authentication[10].There is a policy file that stores all requlations to validate a new node for testing its trustworthiness[12]. The policy file pattern is left to the end users and they can customize. A SA member issues the key share based on policyfile. And a node table is maintained to store issued keyshares
The Table 4 structure has three major elements that are node number, the key share and time of issue.
4.2 Curve fitting
A new node collects k our of n shares,and gives it to any nearby SA member to fit a polynomial on
1 2 3 4 5305 167 467 304 412
table 2. Crowed sourcing
table 3. Keyshare table
table 4. Keyshare issue table
Five members from SA have been selected to give their shares; The CH is generates different curves using these random shares. The curve should interpolate all points and R2=1 should be satisfied, if it is not possible then any higher order function is generated that interpolates almost all ponts .
3.2 Polynomial interpolationy = 35.1x + 225.7 r² = 0.230 (10) y = 2.071x2 + 22.67x + 240.2 r² = 0.232 (11)y = -13.91x3 + 127.3x2 - 305.7x + 474r² = 0.284 (12)
Figure 3. Polynomial interpolation.
x 1 2 3 4 5 6 7 8 9 10
f(x) 305 177 525 497 897 4185 14477 37545 80817 53377
node no Key share time of issue1 (2,177) 11.00.112 (4,497) 12.12.12

rAMKuMAr: A nOVEl DISTrIBuTED KEY MAnAGEMEnT SYSTEM FOr MOBIlE ADHOC
167
received values .The existing polynomial is compared with newly generated one,if both are equal then symmetric key is issued or node is rejected.And that new node is identified as intruder.Theorem 1:
The keyshares that are generated from a polynomial are correctly interpolated by same right order polynomial function.Proof :
Here five shares are taken from table 3 to reconstruct the polynomial.
1 2 3 4 5305 177 525 497 897
table 5. Keyshare collection table Figure 5. Correct function generation.
Figure 4. reconstruction of polynomials.
The order of the polynomial function is 4 here. The SA member interpolates with different order of polynomials.
y =69x4-832x3+3505x2-5854x+3417 (15)R² = 1y = -4x3 + 84.57x2 - 235.4x + 436.2 (16)r² = 0.868 y = 160.2e0.319x (17)r² = 0.677 The trendline fixation shows that eqn. 15 has the
correct key (3417).
Theorem 2:The keyshares that are collected at irregular
intervals are interpolated with a correct polynomial function after sorting the shares.Proof :
Here five f(x) values have been collected from table 3 in random order
x 2 3 7 9 10f(x) 177 497 14477 80817 153377The following graph shows the correct regeneration
of a polynomial function with random shares.y = 69x4 -832x3+3505x2-5854x+3417 r² = 1
Theorem 3: The incorrect number of shares cannot generate
Figure 6. interpolating incorrect functions.
the correct polynomial function.Proof:
Three 3 insufficient shares have been taken to regenerate polynomial. The graph shows the incorrect version of polynomial function.
y = 238x2 - 842x + 909 (18) R² = 1
Theorem 4The incorrect shares are not tolerated in curvefitting
to regenerate originating polynomials.
2 3 7 9 10177 497 14477 567856 153377
table 6. incorrect share collection
Figure 7. incorrect polynomial interpolation.
ArTIFICIAl InTEllIGEnCE AnD nETWOrK SECurITY
168
Proof:The Table 6 shows that an incorrect value for 9
is taken to generate the polynomial.y=-5728.9x4+126721x3-929941x2 +3E+06x-2E+06 (19)R² = 1The Eqn (17) is an incorrect one. So even a single
incorrect share cannot generated correct polynomial.A new legitimate node is issued a symmetric key
after all four conditions satisfied on keyshares that are collected from SA members.Moreover the new node have symmetric key but not a polynomial function.So it cannot generate its own shares to issue to hackers.
4.3 Certificate Exchange-secured wayThe PSK(polynomial secret key) , is the symmetric
key found by a new node, this is used for encrypting all routing messages and beacons to avoid all men in middle attacks. The forward ant[13][14] that is used for route discovery is encrypted by PSK and it carries a certificate to destination node.
4.3.1 Forward ant Generation Input : fant:forward ant and cerificateOutput: fantS: secured forward ant//IPx- Ip addres, Px-Public key,toc-time of creation,
exp-expiry time Cnode=[IPx,Px,toc,exp] fantS=[fant,Cnode]psk+ routediscovery (fanSt,nlist);endThe forward ant and certificate of node X are
joined together and encrypted by the PSK.
4.4 route discovery4.4.1 Routediscovery (fantS,nlist)
Input :fant :forward Ant, nlist :neighbor listOutput: Route discovery and table updating//Decrypt the received forward ant with the help
of PSKfant=[fantS]psk-if isnew(fant.aid) then//if hop count does not cross Maxhopcount then
acceptif fant.ahc<=fant.amhc then// if it reaches destination then create backward
ant and stop route discovery. The certificate of source node is extracted for future communications.
if fant.adst == currentnodeID Cdst=[IPdst,Pdst,toc,exp]
Backwardant(fant,Cdst) Break// If it is not destination then continue route discovery elseif fant.adst!=currentnodeID and
routediscovery(fantS,nlist) else discard(fant) end The route discovery is fully encrypted and the
nodes that are having valid PSK only can participate routing. The unauthorized nodes cannot snoop routing packets and non repudiation and denial of service are completely avoided.
4.4.2 Path Updating
The path updating is done by backward ant The intended source node decrypts backward ant
to extract certificate of destination node and stores in to node table.
Algorithm : BackwardAnt (bant¬S)Input : bantS : backward antOutput: m:updated path// Decrypt backward ant by psk bant=[bantS]psk-//Checks hop count limitif bant.ahc<bant.amhc then//if it reaches source node then collect keys of
destination nodeif bant.adst==currentnodeIP then KeyCollect(uant,Cdst)// else travel further to reach sourceelse if bant.adst!=currentnodeIP then pickup next node from bant.apath and bant.ahc=bant.ahc+1 bantS=[bant]psk+ unicast(bantS)else discard(bant)end
5. KEY rEVoCAtionA same key for a longer duration is not a good
idea and periodical change of key is required.
5.1 Key revocation algorithmStep 1: The key shares expired and symmetric key
becomes obsolete.Step 2: The SA members elect a new CHStep 3: The SA members are filtered based on their
trustworthiness. A misbehaving SA would be eliminated from further operations.
Step 4: The CH collects random numbers from all SA members and generates a new polynomial
Step 5: It generates key shares based on the new polynomial.
Step 6: The SA members collect new sharesStep 7: The other nodes need to collect shares from
SA

rAMKuMAr: A nOVEl DISTrIBuTED KEY MAnAGEMEnT SYSTEM FOr MOBIlE ADHOC
169
5.2 Key revocation Methods-alternativesMethod I:The same sets of random shares from table 2 are
interpolated by different order of polynomial.
6. ConClUsions And FUtUrEworKThe above graphs show the complete life cycle
of a key management system. The key generation, polynomial interpoloation ,key share generation ,key distribution and key revocation all things are implmented in curvefitting tool and all things are proved that this framework is more suitable for MAnET. The other polynomial interpolation like lagrange and Berkley methods are more complex in term of computational efforts.
The future work would be the following things.The policy file need to be standardized. This policyfile is purely based upon the MAnET type and some heuristic method would be suggested for automative policy file establishment.
fu’d’k ZÅij fn;s x;s xzkQ eas izeq[k izca/ku iz.kkyh ds iwjh
thou pØ dks fn[kk;k x;k gSA egŸoiw.kZ mRifŸk] ikWyhuksfe;k baVjiksyks,”ku] ewy”ks;j mRifŸk] ewy forj.k vkSj ewy fujlu tSlh lHkh ckrsa oØ fQfVax midj.kksa esa ykxw dh tk jgh gSa vkSj lHkh phtksa us lkfcr dj fn;k gS fd ;g ÝseodZ eksckby rnFkZ usVodZ esusV ds fy, vf/kd mi;qDr gSA
rEFErEnCEs1. Distributed Private Key Generation for Identity
Based Cryptosystems in Ad Hoc networks Chan, A.C.F. Wireless Communications letters, IEEE Volume: 1, Issue: 1 Digital Object Identifier: 0.1109/WCl.2012.120211.110130 Publication Year: 2012, Page(s): 46-48 IEEE Journals & Magazines
2. Evaluating Trust in Ad Hoc network routing by Induction of Decision Trees Sirotheau Serique, l.F.; de Sousa, r.T. latin America Transactions, IEEE (revista IEEE America latina) Volume: 10, Issue: 1 Digital Object Identifier: 10.1109/TlA.2012.6142481 Publication Year: 2012 , Page(s): 1332-1343 IEEE Journals & Magazines
3. A Survey on Trust Management for Mobile Ad Hoc networks Jin-Hee Cho, Member, IEEE, Ananthram
Figure 8. Key revocation.
Figure 10. regeneration of polynomial-non.
y = 911x2 - 4962.x + 3273 r² = 0.959 (20)
y = 134x3 - 1098.3x2 + 2702x – 1551 r² = 0.9666 (21)
The 3rd-order polynomial is taken as next session symmetric key value is 1551.
Method II:The originating function is updated with new
key value. This is a simple method of changing Xo term.
y = 69x4 - 832x3 + 3505x2 - 5854x + 3417 this is overwritten as y = 69x4 - 832x3 + 3505x2 - 5854x + 12345 Eqn.20
and from Eqn.20 the new keyshares are generated.x 0 1 2 3 4 5f(x) 12345 9233 9105 9453 9425 9825linear sharesy = 69x4 - 832x3 + 3505x2 - 5854x + 12345
r² = 1 Eqn.20y = 69x4 - 832x3 + 3505x2 - 5854x + 12345
r² = 1 Eqn (21)
Figure 9. Keyregeneration.
ArTIFICIAl InTEllIGEnCE AnD nETWOrK SECurITY
170
Swami, Fellow, IEEE, and Ing-ray Chen, Member, IEEE Communications Surveys & Tutorials, Vol. 13, no. 4, Fourth quarter 2011.
4. Optimal Combined Intrusion Detection and Biometric-Based Continuous Authentication in High Security Mobile Ad Hoc networks Jie liu, F. richard Yu, IEEE, Chung-Horng lung, and Helen Tang IEEE transactions on wireless communications, vol. 8, no. 2, february 2009.
5. J. H. Cho and A. Swami, “Towards Trustbased Cognitive networks: A Survey of Trust Management for Mobile Ad Hoc networks,” 14th Int’l Command and Control Research and Technology Symposium,Washington D.C. 15-17 June 2009.
6. l. Abusalah, A. Khokhar, and M. Guizani, “A Survey of Secure Mobile Ad Hoc routing Protocols,” IEEE Commun. Surveys and Tutorials, vol.19, no. 4, pp.78-93, 2008.
7. M. A. Ayachi, C. Bidan, T. Abbes, and A. Bouhoula, Misbehavior Detection using Implicit Trust relations in the AODV routing Protocol,”2009 Int’l Conf. on Computational Science and Engineering,Vancouver, Canada, vol. 2, 29-31 Aug. 2009, pp. 802-808.
8. Boukerche and Y. ren, “A Security Management Scheme using a novel Computational reputation Model for Wireless and Mobile AdHoc networks,” Proc. Int’l Workshop on Modeling Analysis and Simulation of Wireless and Mobile Systems, Vancouver, British Columbia,Canada, pp. 88-95,
2008.9. A survey of routing attacks in Mobile ad hoc
networks Bounpadith kannhavong,hidehisa nakayama, yoshiaki nemoto, and nei kato, Tohoku university Abbas jamalipour, university of Sydney IEEE Wireless Communications • October 2007
10. H. li and M. Singhal, Trust Management in Distributed Systems, Computers, vol. 40, no.2, Feb. 2007, pp. 45-53. E.
11. Aivaloglou, S. Gritxalis, and C. Skianis, Trust Establishment in Ad Hoc and Sensor networks, Proc. 1st Int’l Workshop on Critical Information Infrastructure Security, lecture notes in Computer Science,vol. 4347, pp. 179-192, Samos, Greece, 31 Aug. – 1 Sep. 2006, Springer.
12. ramkumar and nasir Memon An Efficient Key Pre distribution Scheme forAd Hoc network Security Mahalingam Ieee Journal On Selected Areas in CommuniCations, Vol. 23, no. 3, March 2005.
13. Di Caro, G., Ducatelle, F., Gambardella, l.M.: AntHocnet: An Adaptive nature-InspiredAlgorithm for routing in Mobile Ad Hoc networks, Tech. rep. no. IDSIA-27-04-2004, IDSIA/uSI-SuPSI (September 2004).
14. Guine, M., Sorges, u., Bouazzi, I.: ArA-the antcolony based routing algorithm for MAnETs. In: Proc. of IWAHn 2002, pp. 79–85 (August 2002).
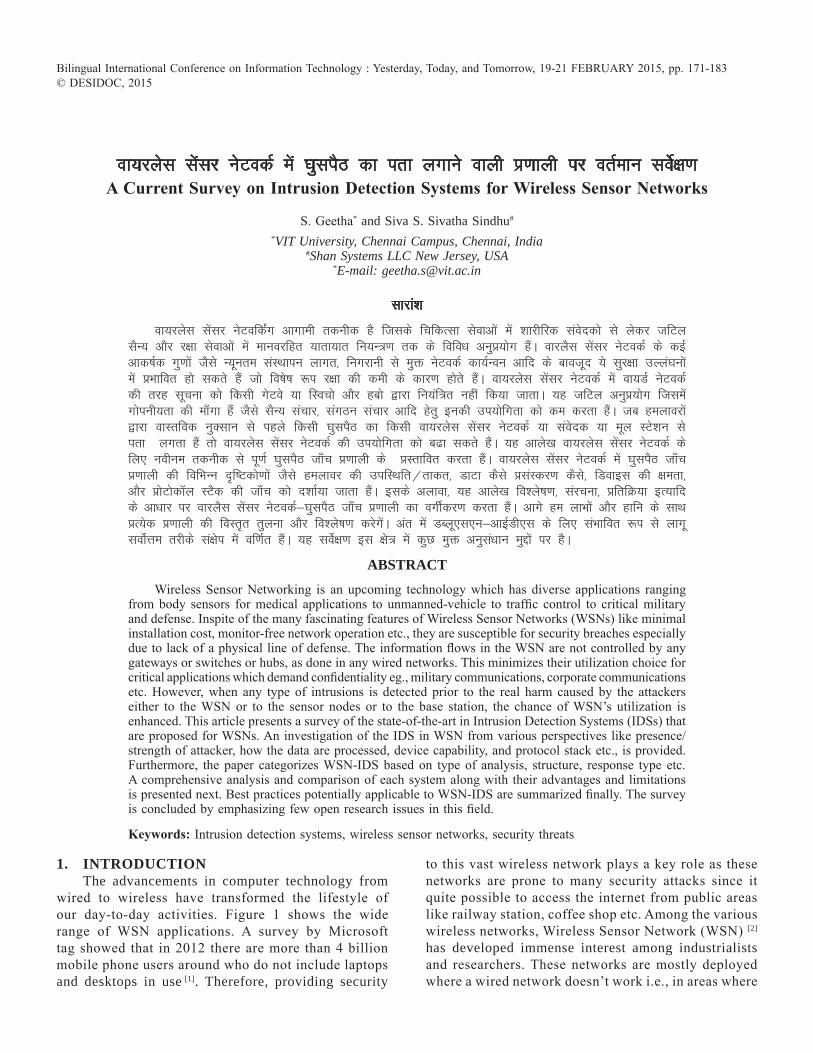
ok;jysl lsalj usVodZ esa ?kqliSB dk irk yxkus okyh ç.kkyh ij orZeku losZ{k.kA Current survey on intrusion detection systems for wireless sensor networks
S. Geetha* and Siva S. Sivatha Sindhu#
*VIT University, Chennai Campus, Chennai, India #Shan Systems LLC New Jersey, USA
*E-mail: [email protected]
lkjka”k
ok;jysl lsalj usVofdaZx vkxkeh rduhd gS ftlds fpfdRlk lsokvksa esa “kkjhfjd laosndks ls ysdj tfVy lSU; vkSj j{kk lsokvksa esa ekuojfgr ;krk;kr fu;U=.k rd ds fofo/k vuqç;ksx gSaA okjySl lsalj usVodZ ds dbZ vkd’kZd xq.kksa tSls U;wure laLFkkiu ykxr] fuxjkuh ls eqä usVodZ dk;ZUou vkfn ds ckotwn ;s lqj{kk mYya?kuksa esa çHkkfor gks ldrs gSa tks fo’ks’k :i j{kk dh deh ds dkj.k gksrs gSaA ok;jysl lsalj usVodZ esa ok;MZ usVodZ dh rjg lwpuk dks fdlh xsVos ;k fLopks vkSj gcks }kjk fu;af=r ugha fd;k tkrkA ;g tfVy vuqç;ksx ftlesa xksiuh;rk dh ek¡xk gSa tSls lSU; lapkj] laxBu lapkj vkfn gsrq budh mi;ksfxrk dks de djrk gSaA tc geykojksa }kjk okLrfod uqDlku ls igys fdlh ?kqliSB dk fdlh ok;jysl lsalj usVodZ ;k laosnd ;k ewy LVs”ku ls irk yxrk gSa rks ok;jysl lsalj usVodZ dh mi;ksfxrk dks c<k ldrs gSaA ;g vkys[k ok;jysl lsalj usVodZ ds fy, uohue rduhd ls iw.kZ ?kqliSB tk¡p ç.kkyh ds çLrkfor djrk gSaA ok;jysl lsalj usVodZ esa ?kqliSB tk¡p ç.kkyh dh fofHkUu –f’Vdks.kksa tSls geykoj dh mifLFkfr@rkdr] MkVk dSls çlaLdj.k dSls] fMokbl dh {kerk] vkSj çksVksd‚y LVSd dh tk¡p dks n”kkZ;k tkrk gSaA blds vykok] ;g vkys[k fo”ys’k.k] lajpuk] çfrfØ;k bR;kfn ds vk/kkj ij okjySl lsalj usVodZ&?kqliSB tk¡p ç.kkyh dk oxhZdj.k djrk gSaA vkxs ge ykHkksa vkSj gkfu ds lkFk çR;sd ç.kkyh dh foLr`r rqyuk vkSj fo”ys’k.k djsxsaA var esa MCyw,l,u&vkbZMh,l ds fy, laHkkfor :i ls ykxw loksZÙke rjhds la{ksi esa of.kZr gSaA ;g losZ{k.k bl {ks= esa dqN eqä vuqla/kku eqíksa ij gSA
AbstrActWireless Sensor networking is an upcoming technology which has diverse applications ranging
from body sensors for medical applications to unmanned-vehicle to traffic control to critical military and defense. Inspite of the many fascinating features of Wireless Sensor networks (WSns) like minimal installation cost, monitor-free network operation etc., they are susceptible for security breaches especially due to lack of a physical line of defense. The information flows in the WSn are not controlled by any gateways or switches or hubs, as done in any wired networks. This minimizes their utilization choice for critical applications which demand confidentiality eg., military communications, corporate communications etc. However, when any type of intrusions is detected prior to the real harm caused by the attackers either to the WSn or to the sensor nodes or to the base station, the chance of WSn’s utilization is enhanced. This article presents a survey of the state-of-the-art in Intrusion Detection Systems (IDSs) that are proposed for WSns. An investigation of the IDS in WSn from various perspectives like presence/strength of attacker, how the data are processed, device capability, and protocol stack etc., is provided. Furthermore, the paper categorizes WSn-IDS based on type of analysis, structure, response type etc. A comprehensive analysis and comparison of each system along with their advantages and limitations is presented next. Best practices potentially applicable to WSn-IDS are summarized finally. The survey is concluded by emphasizing few open research issues in this field.
Keywords: Intrusion detection systems, wireless sensor networks, security threats
Bilingual International Conference on Information Technology : Yesterday, Today, and Tomorrow, 19-21 FEBruArY 2015, pp. 171-183© DESIDOC, 2015
1. IntroductIonThe advancements in computer technology from
wired to wireless have transformed the lifestyle of our day-to-day activities. Figure 1 shows the wide range of WSn applications. A survey by Microsoft tag showed that in 2012 there are more than 4 billion mobile phone users around who do not include laptops and desktops in use [1]. Therefore, providing security
to this vast wireless network plays a key role as these networks are prone to many security attacks since it quite possible to access the internet from public areas like railway station, coffee shop etc. Among the various wireless networks, Wireless Sensor network (WSn) [2] has developed immense interest among industrialists and researchers. These networks are mostly deployed where a wired network doesn’t work i.e., in areas where
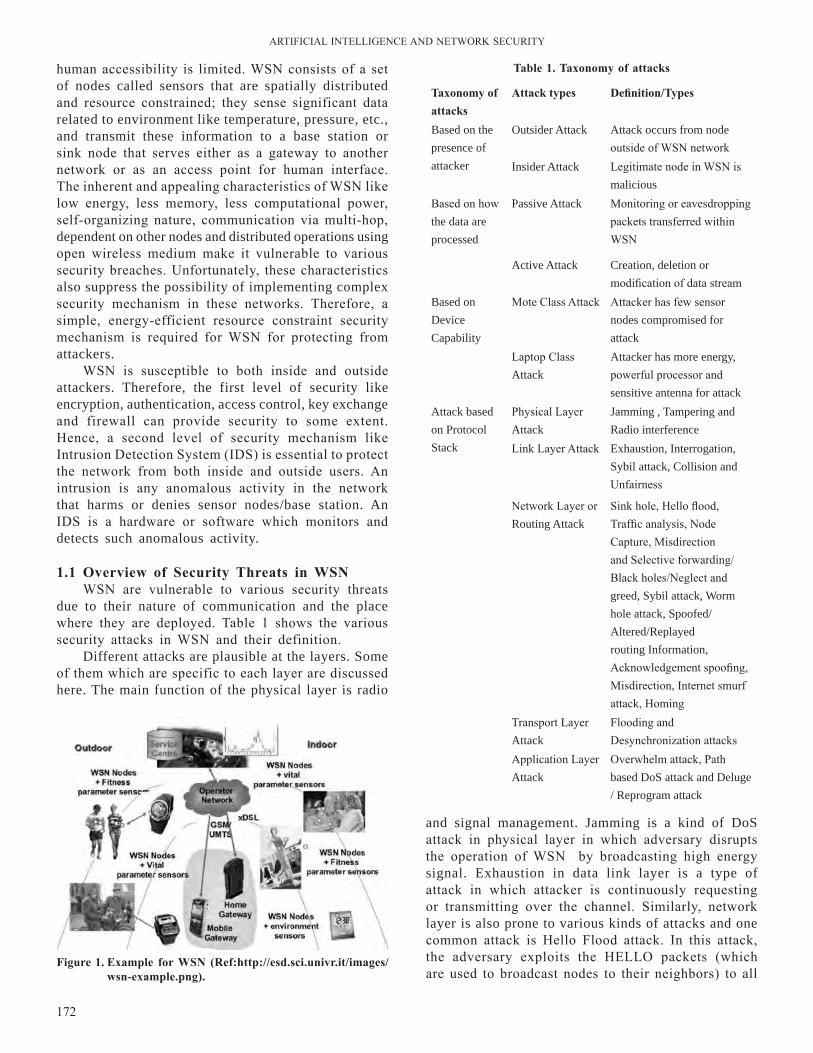
ArTIFICIAl InTEllIGEnCE AnD nETWOrK SECurITY
172
and signal management. Jamming is a kind of DoS attack in physical layer in which adversary disrupts the operation of WSn by broadcasting high energy signal. Exhaustion in data link layer is a type of attack in which attacker is continuously requesting or transmitting over the channel. Similarly, network layer is also prone to various kinds of attacks and one common attack is Hello Flood attack. In this attack, the adversary exploits the HEllO packets (which are used to broadcast nodes to their neighbors) to all
human accessibility is limited. WSn consists of a set of nodes called sensors that are spatially distributed and resource constrained; they sense significant data related to environment like temperature, pressure, etc., and transmit these information to a base station or sink node that serves either as a gateway to another network or as an access point for human interface. The inherent and appealing characteristics of WSn like low energy, less memory, less computational power, self-organizing nature, communication via multi-hop, dependent on other nodes and distributed operations using open wireless medium make it vulnerable to various security breaches. unfortunately, these characteristics also suppress the possibility of implementing complex security mechanism in these networks. Therefore, a simple, energy-efficient resource constraint security mechanism is required for WSn for protecting from attackers.
WSn is susceptible to both inside and outside attackers. Therefore, the first level of security like encryption, authentication, access control, key exchange and firewall can provide security to some extent. Hence, a second level of security mechanism like Intrusion Detection System (IDS) is essential to protect the network from both inside and outside users. An intrusion is any anomalous activity in the network that harms or denies sensor nodes/base station. An IDS is a hardware or software which monitors and detects such anomalous activity.
1.1 overview of security threats in wsnWSn are vulnerable to various security threats
due to their nature of communication and the place where they are deployed. Table 1 shows the various security attacks in WSn and their definition.
Different attacks are plausible at the layers. Some of them which are specific to each layer are discussed here. The main function of the physical layer is radio
Figure 1. Example for wsn (ref:http://esd.sci.univr.it/images/wsn-example.png).
taxonomy of attacks
Attack types definition/types
Based on the presence of attacker
Outsider Attack Attack occurs from node outside of WSn network
Insider Attack legitimate node in WSn is malicious
Based on how the data are processed
Passive Attack Monitoring or eavesdropping packets transferred within WSn
Active Attack Creation, deletion or modification of data stream
Based on Device Capability
Mote Class Attack Attacker has few sensor nodes compromised for attack
laptop Class Attack
Attacker has more energy, powerful processor and sensitive antenna for attack
Attack based on Protocol Stack
Physical layer Attack
Jamming , Tampering and Radio interference
link layer Attack Exhaustion, Interrogation, Sybil attack, Collision and unfairness
network layer or Routing Attack
Sink hole, Hello flood, Traffic analysis, node Capture, Misdirection and Selective forwarding/Black holes/neglect and greed, Sybil attack, Worm hole attack, Spoofed/Altered/Replayed routing Information, Acknowledgement spoofing, Misdirection, Internet smurf attack, Homing
Transport layer Attack
Flooding and Desynchronization attacks
Application layer Attack
Overwhelm attack, Path based DoS attack and Deluge / Reprogram attack
table 1. taxonomy of attacks
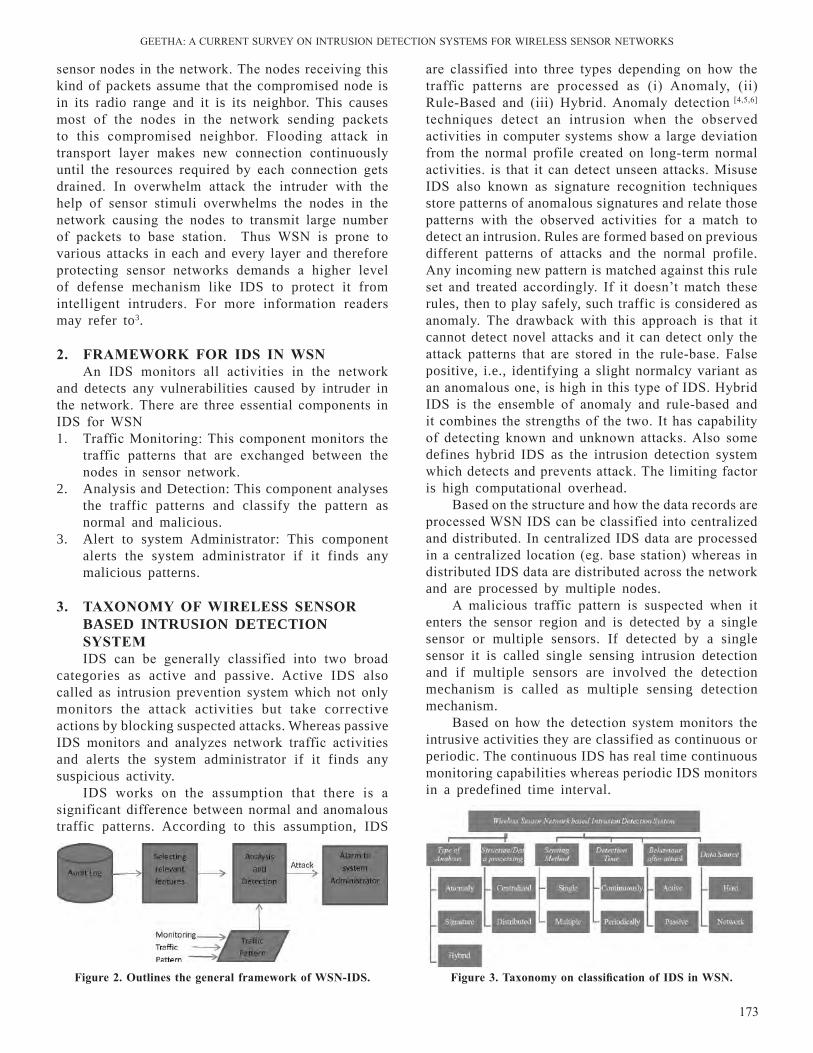
GEETHA: A CurrEnT SurVEY On InTruSIOn DETECTIOn SYSTEMS FOr WIrElESS SEnSOr nETWOrKS
173
sensor nodes in the network. The nodes receiving this kind of packets assume that the compromised node is in its radio range and it is its neighbor. This causes most of the nodes in the network sending packets to this compromised neighbor. Flooding attack in transport layer makes new connection continuously until the resources required by each connection gets drained. In overwhelm attack the intruder with the help of sensor stimuli overwhelms the nodes in the network causing the nodes to transmit large number of packets to base station. Thus WSn is prone to various attacks in each and every layer and therefore protecting sensor networks demands a higher level of defense mechanism like IDS to protect it from intelligent intruders. For more information readers may refer to3.
2. FrAMEworK For ids in wsnAn IDS monitors all activities in the network
and detects any vulnerabilities caused by intruder in the network. There are three essential components in IDS for WSn1. Traffic Monitoring: This component monitors the
traffic patterns that are exchanged between the nodes in sensor network.
2. Analysis and Detection: This component analyses the traffic patterns and classify the pattern as normal and malicious.
3. Alert to system Administrator: This component alerts the system administrator if it finds any malicious patterns.
3. tAxonoMY oF wirElEss sEnsor bAsEd IntrusIon dEtEctIon sYstEMIDS can be generally classified into two broad
categories as active and passive. Active IDS also called as intrusion prevention system which not only monitors the attack activities but take corrective actions by blocking suspected attacks. Whereas passive IDS monitors and analyzes network traffic activities and alerts the system administrator if it finds any suspicious activity.
IDS works on the assumption that there is a significant difference between normal and anomalous traffic patterns. According to this assumption, IDS
are classified into three types depending on how the traffic patterns are processed as (i) Anomaly, (ii) rule-Based and (iii) Hybrid. Anomaly detection [4,5,6]
techniques detect an intrusion when the observed activities in computer systems show a large deviation from the normal profile created on long-term normal activities. is that it can detect unseen attacks. Misuse IDS also known as signature recognition techniques store patterns of anomalous signatures and relate those patterns with the observed activities for a match to detect an intrusion. Rules are formed based on previous different patterns of attacks and the normal profile. Any incoming new pattern is matched against this rule set and treated accordingly. If it doesn’t match these rules, then to play safely, such traffic is considered as anomaly. The drawback with this approach is that it cannot detect novel attacks and it can detect only the attack patterns that are stored in the rule-base. False positive, i.e., identifying a slight normalcy variant as an anomalous one, is high in this type of IDS. Hybrid IDS is the ensemble of anomaly and rule-based and it combines the strengths of the two. It has capability of detecting known and unknown attacks. Also some defines hybrid IDS as the intrusion detection system which detects and prevents attack. The limiting factor is high computational overhead.
Based on the structure and how the data records are processed WSn IDS can be classified into centralized and distributed. In centralized IDS data are processed in a centralized location (eg. base station) whereas in distributed IDS data are distributed across the network and are processed by multiple nodes.
A malicious traffic pattern is suspected when it enters the sensor region and is detected by a single sensor or multiple sensors. If detected by a single sensor it is called single sensing intrusion detection and if multiple sensors are involved the detection mechanism is called as multiple sensing detection mechanism.
Based on how the detection system monitors the intrusive activities they are classified as continuous or periodic. The continuous IDS has real time continuous monitoring capabilities whereas periodic IDS monitors in a predefined time interval.
Figure 2. outlines the general framework of wsn-ids. Figure 3. taxonomy on classification of ids in wsn.
ArTIFICIAl InTEllIGEnCE AnD nETWOrK SECurITY
174
Also, based on the location of data source, IDS is classified as host based and network based IDSs. The host based IDS uses log files of single host for processing whereas in network based IDS uses network traffic patterns for processing and analysis.
Table 2 lists the survey of various intrusion detection schemes in WSn based on various perspectives. Among the various classification perspectives the most common type of classification is ‘type of analysis’.
The following section explains some major works that fall under these categories.
3.1 Anomaly detection techniques in wsnThere are many research works in anomaly intrusion
detection system in wireless sensor networks. Most researchers prefer anomaly than misuse and hybrid IDS due to the resource constraints such as poor memory, weak computational capability in WSn. Misuse IDS requires more memory to store the predefined rules whereas the computational overhead is high in hybrid IDS.
Clustering is one of the data mining approaches used for IDS. Clustering is the process of selecting groups of similar objects, such that each group of objects is well separated by a distance. Sutharshan Rajasegarar, et al., proposed a clustering based anomaly detection technique7 in which clusters are formed based on the fixed-width clustering. Each data vector is the Euclidean distance between the centroid of the current clusters and this dissimilarity measure is computed to add or form a new cluster. The approach followed is distributed and therefore each sensor node executes the clustering operation on its own local data. It then sends the sufficient statistics to its immediate parent and the parent node combines the clusters from its immediate children. It again then forms a combined set of clusters and sends the sufficient statistics of the merged clusters to its immediate parent. This process proceeds continuously up to the gateway node. At gateway anomalous cluster is detected using average inter-cluster distance of the K nearest neighbor (Knn) clusters. Inter cluster distance is computed using Euclidean distance measure between centroids of the number of clusters in the cluster set. Between the set of inter-cluster distances the shortest K distances are chosen and using those, the average inter-cluster distance is computed. A cluster is identified as anomalous if its average inter-cluster distance is greater than one standard deviation of the inter-cluster distance from the mean inter-cluster distance.
Evaluation: Simulation based on the sensor data gathered from the Great Duck Island project.
Advantage: The sensor node should be in active mode for longer time duration than in sleep mode if large volume of raw data is transmitted over the
network. The sensor nodes send only the merged clusters rather than raw data and therefore this reduces the communication overhead which in turn improves the life time of WSn.
Disadvantage: In the centralised case, the gateway node has complete information about the data in the network, whereas in the distributed case, the gateway node only has the merged cluster information of the nodes. Therefore, there is a slight reduction in the detection accuracy in the distributed case compared to the centralised case.
Outcome: Proved that distributed approach achieves comparable performance with the centralized case, while achieving a significant reduction in communication overhead.
Heshan Kumarage8, et al., proposed anomaly detection mechanism that aims to detect anomalies using distributed in-network processing in a hierarchical framework. unsupervised data partitioning is performed distributively adapting fuzzy c-means clustering in an incremental model. non-parametric and non-probabilistic anomaly detection is performed through fuzzy membership evaluations and thresholds on observed inter-cluster distances. Robust thresholds are determined adaptively using second order statistical knowledge at each evaluation stage.
Evaluation: Two types of dynamic heterogeneous data set called Intel sensor data set and ISSnIP data set.
Advantage: load balancing is achieved here by distributing the clustering process between all the nodes. If not, there will be greater communication overhead in the nodes that are in close proximity to the gateway node, which in turn reduces the life time of the network.
Disadvantage: Slight reduction in accuracy when compared to centralized approach.
Outcome: results show that the their framework achieves high detection accuracy compared to existing data clustering approaches with more than 96% less communication overheads opposed to a centralized approach.
loo9, et al., proposed an anomaly detection technique which uses fixed-width clustering. This algorithm constructs a set of clusters, such that each cluster has a fixed radius in the problem space. In the training phase of the fixed-width clustering technique, a threshold value is chosen as the maximum radius of a cluster. The first data point in the dataset forms the centroid of a new cluster. If the distance of each successive point to its closest cluster is less than threshold value, then the point is assigned to the cluster, and the centroid of the cluster is recalculated. Otherwise, the new data point forms the centroid of a new cluster. At the end of training phase, the clusters that contain less

GEETHA: A CurrEnT SurVEY On InTruSIOn DETECTIOn SYSTEMS FOr WIrElESS SEnSOr nETWOrKS
175
Technique
Author
Year
Anal
ysis
Type
St
ruct
ure /
Dat
a Pr
oces
sing
and
Colle
ctio
n Se
nsin
g M
etho
d De
tect
ion
Tim
e Be
havi
or a
fter a
ttack
Da
ta S
ourc
e
AS
HCe
ntra
lized
Di
strib
uted
Si
ngle
Mul
tiple
Cont
inuo
us
Perio
dic
Activ
e Pa
ssiv
e H
ost
N/W
1 Ke
y M
gt P
roto
col [2
1]
Davi
d et
. al
2000
Cr
ypto
grap
hic a
ppro
ach:
Key
Mgt
for C
onfid
entia
lity
and
Grou
p lev
el Au
then
ticati
on
2 SP
INS
[22]
Pe
rrig
et.al
2001
Cr
ypto
grap
hic a
ppro
ach:
Aut
hent
icatio
n, C
onfid
entia
lity
and
Auth
entic
ated
Broa
dcas
t
3 Pr
otoc
ol b
ehav
ior o
f TC
P [2
3]Ha
inin
g
et. al
20
02
Lea
f Rou
ter
SYN
Kill
4 De
viati
on D
etecti
on [2
4]
Palp
anas
et
al
2003
Stre
am d
ata b
y a s
enso
r 5
Dire
ction
al An
tenna
s [2
5]Hu
et al
20
04
Prot
ocol
ba
sed
Di
recti
on in
fo
base
d on
re
ceiv
ed si
gnal
6 M
alicio
us n
ode
detec
tion
by si
gnal
stren
gth
[26]
Pire
sWald
ir Ri
beiro
et al
20
04
7 De
cent
raliz
ed ID
S [2
7]
Silv
a et a
l 20
05
8 Pr
even
tion
and
Detec
tion
in C
luste
ring
ba
sed
[28]
Su et
al
2005
C
luste
r He
ad
9 Di
strib
uted
anom
aly
[29]
Ra
jaseg
arar
et al
20
06
10
Intru
sion
Detec
tion
for
Rout
ing
attac
ks [9
]Lo
o et
al 20
06
(Sim
ulati
on)
11
Distr
ibut
ed In
trusio
n De
tectio
n [1
4]Io
anni
s et a
l 20
07
(S
imul
ation
)
12
SVM
Intru
sion
Detec
tion
[12]
Soph
ia et
al 20
07
(sim
ulati
on)
13
Mac
hine
Lea
rnin
g ba
sed
IDS
[31]
Yu et
al
2008
(Sim
ulati
on)
14
Coop
erati
ve ID
S [ 1
5]
I. Kr
ontir
is et
al
2009
(In
real
situa
tion)
15
Li
ght W
eight
Intru
sion
Detec
tion
[17]
Hai e
t al
2010
16
Hype
relli
psoi
dal
cluste
ring
algor
ithm
[29]
Mos
htag
hi et
al
2011
17
Cros
s lay
er in
trusio
n de
tectio
n [1
1i]
Djall
el et
al 20
12
18
Diss
imila
rity
of se
nsor
ob
serv
ation
[32]
Rasa
m et
al
2013
(Sim
ulati
on)
tabl
e 2.
Com
pari
son
of v
ario
us i
ds
in w
sn b
ased
on
clas
sific
atio
n pe
rspe
ctiv
es
ArTIFICIAl InTEllIGEnCE AnD nETWOrK SECurITY
176
than a threshold value of the total set of points are labeled as anomalous. Remaining clusters are labeled as normal. The testing phase operates by calculating the distance between a new point and each cluster centroid. If the distance from the test point to the centroid of its nearest cluster is less than threshold, then the new point is given the label of the nearest cluster, i.e., normal or anomalous. If the distance from new point to the nearest cluster is greater than threshold, then newpoint lies in a sparse region of the feature space, and is labeled as anomalous.
Evaluation: Simulation is based on a sensor network simulation library from the naval research laboratory. Four types of simulation scenarios were implemented which includes normal traffic, periodic route error attacks, active sinkhole attacks, and passive sinkhole attacks.
Advantage: This approach requires no communication between sensor node, which is a significant factor required in power-constrained sensor networks in minimizing the energy. Also, a general set of features that can be used to characterize the routing behaviour in a network for intrusion detection, and are potentially applicable to a wide range of routing protocols has been identified.
Disadvantage: This approach has the capability to identify only three different types of attack. Also, it uses AODV (Ad hoc On-Demand Distance Vector) protocol which not more suitable for WSn.
Outcome: Periodic route error attack, achieved a 95% detection rate for a 5% false positive rate For passive sinkhole attack, the detection rate was 70% for a 5% false positive rate. For active sinkhole attack, detection rate was 100% and false positive rate was 5%.
Bhuse and Gupta10 used the DSDV and DSR protocols instead of AODV protocol used by loo, et al.. Intrusion detection uses specific characteristics of these protocols like number of route requests received, number of route requests sent, number of data requests received etc. However, to our familiarity, these routing protocols are not attractive for sensor networks.
Djallel11, et al. proposed an intrusion detection system based on a cross layer architecture that exploits communication and collaboration of three adjacent layers -- network, MAC and physical layers. The basic idea of this approach is to detect malicious users when they attempt to communicate with the network nodes. After receiving request To Send (rTS) packets of the intruder’s node by the targeted node, their detection system checks if it is one of the neighbors in the routing path (by consulting the routing table at the network layer). In addition the authenticity of the intruder node will be checked by
measuring the Received Signal Strength Indicator (rSSI) of the received packet (at the physical layer). By using the routing information at the MAC layer, each sensor node can previously know the source of packets that will be received. Thus, any node trying to communicate (receive rTS or Clear To Send (CTS) packets) with the sensor nodes is immediately detected as an intruder if it is not included in the routing path. A hierarchical cluster-based network topology is proposed. This topology divides the network into several clusters, and selects a cluster head (CH) node which has the greatest energy reserves in the cluster. The base station is responsible of the formation of clusters, the election of CHs and the establishment of chains of node based on routing information (identifier, geographical position and energy reserve) sent by all nodes in the network. All the network nodes will transmit collected data to their CH through the chain of neighboring nodes. Then CHs take the responsibility of transmitting received data directly to the base station (BS), or indirectly through the neighboring CHs.
Evaluation: IDS performance analysis is carried out using the network simulator nS2 with a model built on 100 nodes distributed randomly on a square surface of 100 × 100 m2
Advantage: The implementation of detection system for each layer can greatly increase the load (processing power, energy consumption etc.) on sensor nodes. Therefore, in their approach instead of proposing IDS for each layer, a single intrusion detection system is constructed that can detect different types of attacks across several layers of the OSI model.
Disadvantage: Could not detect all types of security attacks. Outcome: Prevents major attacks that affect data routing in network layer.
SVM has been used by many researchers for classification of network traffic patterns in wired networks. The drawback with SVM is its long training time and complexity overhead. There are only very few research works in applying SVM for intrusion detection in WSn.
Sophia Kaplantzis, et al., proposed a centralized intrusion detection scheme based on Support Vector Machines (SVMs) and sliding windows[12]. They focused on adapting a classification based IDS to detect a malicious DoS attacks, namely the Selective Forwarding Attack, that may be launched against a WSn. This IDS used routing information local to the base station of the network and raises alarms based on the 2D feature vector (bandwidth, hop count). Classification of the data patterns is performed using a one-class SVM classifier. By centralized, here it means that the intrusion detection task (feature selection, data processing, anomaly detection) is carried out entirely by the base station, without further loading the sensor
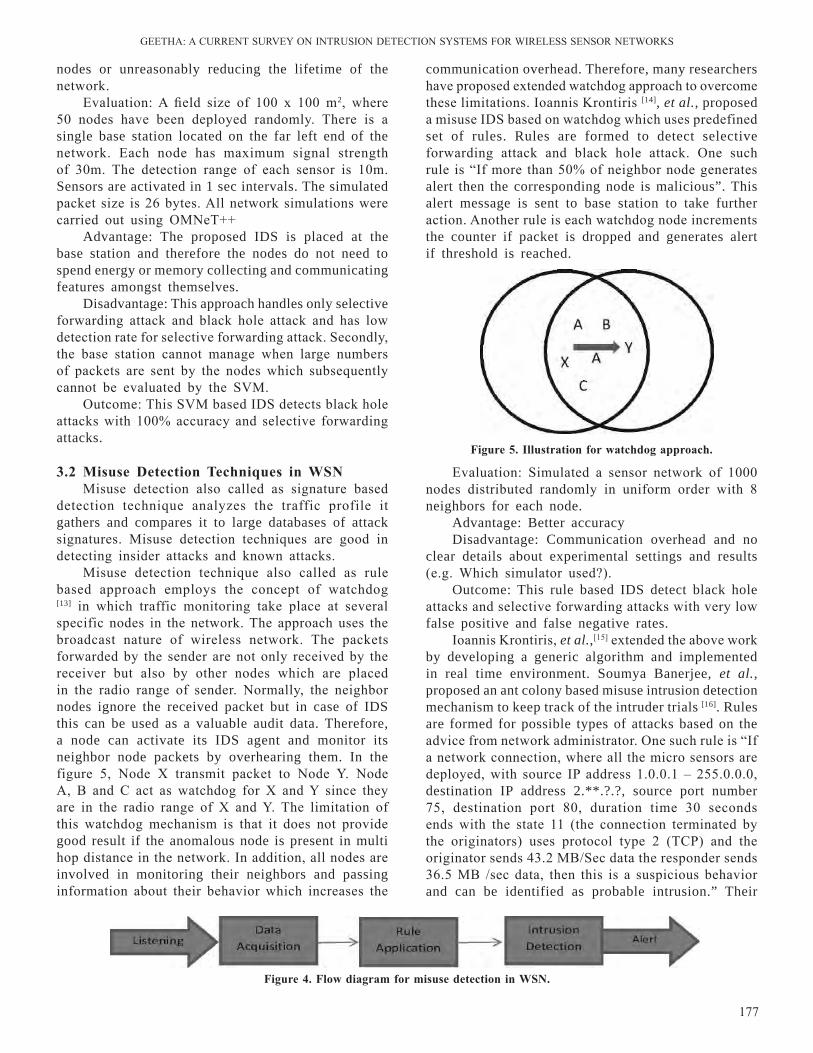
GEETHA: A CurrEnT SurVEY On InTruSIOn DETECTIOn SYSTEMS FOr WIrElESS SEnSOr nETWOrKS
177
nodes or unreasonably reducing the lifetime of the network.
Evaluation: A field size of 100 x 100 m2, where 50 nodes have been deployed randomly. There is a single base station located on the far left end of the network. Each node has maximum signal strength of 30m. The detection range of each sensor is 10m. Sensors are activated in 1 sec intervals. The simulated packet size is 26 bytes. All network simulations were carried out using OMneT++
Advantage: The proposed IDS is placed at the base station and therefore the nodes do not need to spend energy or memory collecting and communicating features amongst themselves.
Disadvantage: This approach handles only selective forwarding attack and black hole attack and has low detection rate for selective forwarding attack. Secondly, the base station cannot manage when large numbers of packets are sent by the nodes which subsequently cannot be evaluated by the SVM.
Outcome: This SVM based IDS detects black hole attacks with 100% accuracy and selective forwarding attacks.
3.2 Misuse detection techniques in wsnMisuse detection also called as signature based
detection technique analyzes the traffic profile it gathers and compares it to large databases of attack signatures. Misuse detection techniques are good in detecting insider attacks and known attacks.
Misuse detection technique also called as rule based approach employs the concept of watchdog [13] in which traffic monitoring take place at several specific nodes in the network. The approach uses the broadcast nature of wireless network. The packets forwarded by the sender are not only received by the receiver but also by other nodes which are placed in the radio range of sender. normally, the neighbor nodes ignore the received packet but in case of IDS this can be used as a valuable audit data. Therefore, a node can activate its IDS agent and monitor its neighbor node packets by overhearing them. In the figure 5, node X transmit packet to node Y. node A, B and C act as watchdog for X and Y since they are in the radio range of X and Y. The limitation of this watchdog mechanism is that it does not provide good result if the anomalous node is present in multi hop distance in the network. In addition, all nodes are involved in monitoring their neighbors and passing information about their behavior which increases the
communication overhead. Therefore, many researchers have proposed extended watchdog approach to overcome these limitations. Ioannis Krontiris [14], et al., proposed a misuse IDS based on watchdog which uses predefined set of rules. Rules are formed to detect selective forwarding attack and black hole attack. One such rule is “If more than 50% of neighbor node generates alert then the corresponding node is malicious”. This alert message is sent to base station to take further action. Another rule is each watchdog node increments the counter if packet is dropped and generates alert if threshold is reached.
Figure 4. Flow diagram for misuse detection in wsn.
Figure 5. illustration for watchdog approach.
Evaluation: Simulated a sensor network of 1000 nodes distributed randomly in uniform order with 8 neighbors for each node.
Advantage: Better accuracyDisadvantage: Communication overhead and no
clear details about experimental settings and results (e.g. Which simulator used?).
Outcome: This rule based IDS detect black hole attacks and selective forwarding attacks with very low false positive and false negative rates.
Ioannis Krontiris, et al.,[15] extended the above work by developing a generic algorithm and implemented in real time environment. Soumya Banerjee, et al., proposed an ant colony based misuse intrusion detection mechanism to keep track of the intruder trials [16]. Rules are formed for possible types of attacks based on the advice from network administrator. One such rule is “If a network connection, where all the micro sensors are deployed, with source IP address 1.0.0.1 – 255.0.0.0, destination IP address 2.**.?.?, source port number 75, destination port 80, duration time 30 seconds ends with the state 11 (the connection terminated by the originators) uses protocol type 2 (TCP) and the originator sends 43.2 MB/Sec data the responder sends 36.5 MB /sec data, then this is a suspicious behavior and can be identified as probable intrusion.” Their
ArTIFICIAl InTEllIGEnCE AnD nETWOrK SECurITY
178
work is based the use of multi ant agents driven by parallel search to deploy pheromone value on each node. At a given iteration each ant travels from the current node of sensor network to neighboring node and changes the color of each visited node according to a local norm. They introduced the concept of tabu list, where for each session the list stores the pheromone trace or path that is prone to attack. If there is any imbalance in the pheromone values, an alert is raised and system administrator is informed.
Evaluation: no clear details about how they are simulated:
Advantage: Self organizing nature.Disadvantage: The sender node broadcasts packets
to all nodes through all possible paths which result in congestion and high energy consumption. In addition, the proposed algorithm requires more memory to store the pheromone trace or path.
Outcome: no clear results
3.3 hybrid detection techniques in wsnHybrid detection techniques are fusion of anomaly
detection and misuse detection in order to combine the advantages of these two techniques. The hybridization of these learning and adaptation techniques overcome the limitations of individual intrusion detection techniques and achieves synergetic effects for intrusion detection. There are some existing works on hybrid intrusion detection systems for WSn such as [17], [18] and [19]. In Hai[17], et al., proposed a cluster based and hybrid approach for intrusion detection in WSn. In their work, IDS agents are placed in every node. There are two types of agents - local IDS agent and global IDS agent. Due to the resource constraint characteristics of WSn, global agents are active only at a subset of nodes. The global IDS agent monitors the communication of its neighbors by means of predefined rules with two-hop neighbor knowledge. It then sends alarm to cluster head (CH) if they detect any malicious nodes. Each node has an internal database, which contains a list of known signatures, attack patterns, which are computed and generated in the CH. They attempt to minimize the number of nodes where the global agents are positioned by evaluating their trustworthy based on trust priority. In order to reduce the collisions and usage of resources, they proposed an over-hearing mechanism that reduces the sending message alerts.
Evaluation: A field size of 100 × 100 m2, where 200 nodes have been deployed randomly. All network simulations were carried out using Castalia, a WSn simulator in OMneT++
Advantage: High detection rate even under burst of attacks.
Disadvantage: False positive rate is high when rule based-approach of intrusion detection is used.
Secondly, it requires manual rule updating by experts and specialists in the area of wireless security.
Outcome: When the rate of collision and the number of anomalous node is not very high the proposed approach can detect the routing attacks such as selective forwarding, sinkhole, hello flood and wormhole attacks with a better energy saving.
Yan[18], et al., proposed a clustering approach in WSn and embedded hybrid IDS in CH. This developed model has three modules: misuse detection module, anomaly detection module and decision making module. In the misuse detection module, rules formed are used to analyze incoming packets and categorize the packet as normal or anomalous. For building anomaly detection model, the supervised learning algorithm Back Propagation network (BPn) is adopted. The abnormal packets, which are detected by misuse detection model is used as input vectors of BPn. Initially, the network is trained with training dataset containing four types of attacks and normal patterns, when the process of training is over; the model is integrated with the misuse detection module in order to classify the new data. Finally, the output of both anomaly detection and misuse detection models is used as an input for the decision making module. The decision making module reports the results to the base station if there is any intrusion.
Evaluation: KDD dataset with 24 features and 4 types of attack patterns and one normal pattern are used.
Advantage: Accuracy is increased.Disadvantage: The major drawback of the proposed
scheme is that IDS monitor runs in a fixed cluster heads. Therefore it’s an attractive node for the intruder that uses all its capacity to attack this node. Another drawback is the number of features which is very important (twenty four features are used). Thus the cluster head consumes much more energy, which minimizes the life time of the node.
Outcome: The simulation results show a higher rate of detection and a lower false positive rate.
Hichem Sedjelmaci [19], et al., proposed an intrusion framework that uses a combination between the anomaly detection based on support vector machine (SVM) and the misuse detection. The anomaly detection uses a distributed learning algorithm for the training of a SVM to solve the two-class problem (distinguish between normal and anomalous activities). In addition, the author used a hierarchical topology that divide the sensor network into clusters, each one having a cluster head (CH). The objective of this framework is to save the energy that allows the network life time prolongation. Each node has the possibility to activate its IDS. Minimization of number of nodes to run intrusion detection is required since it reduces energy. The average number of IDS nodes (n) for

GEETHA: A CurrEnT SurVEY On InTruSIOn DETECTIOn SYSTEMS FOr WIrElESS SEnSOr nETWOrKS
179
each individual link is expressed by the following equation n=1.6r²d where d is network density and r is the communication range. Each IDS monitors the neighbor nodes with no trust between each pair of agents. Sensor nodes are stationary and cluster head has more energy compared to the other ones. Training model with less feature and high accuracy is chosen and embedded into hybrid intrusion detection module in order to obtain a lightweight and accurate detection system.
s. no. technique Author/Year Attacks detected detection accuracy
Energy consumption
Computational speed
Memory consumption
Comm. bandwidth/overhead
1 Key Mgt Protocol [21]
David, et al., 2000
Secret Key based Protocol low High Medium High
2 SPInS [22] Perrig, et al., 2001
Authenticated comm.unication low Medium High low
3 Protocol behavior of TCP [23]
Haining, et al.,2002
SYn Flooding High low low low Medium
4 Deviation Detection [24]
Palpanas, et al.,2003
Outlier detectionnA
low low low low
5 Directional Antennas [25]
Hu, et al., 2004 Worm Hole nA low low low High
6 Malicious node detection by signal strength [26]
Pires Waldir Ribeiro, et al., 2004
HEllO flood and Worm Hole
near 90% High High low High
7 Decentralized IDS [27]
Silva, et al., 2005
Message delay, Repetition, Worm Hole, Jamming Data alteration Msg negligence, Black Hole and Selective Forwarding
Greater than 80%
Medium Medium Medium low
8 Prevention and Detection in Clustering based [28]
Su, et al., 2005 Packet –Dropping Duplicating and Jamming
High High Medium Medium High
9 Distributed anomaly [29]
Rajasegarar, et al., 2006
normal/ anornal Slightly low compared to centralized
Medium O(mnc) m-no.of measurements during a time window
O(nc) nc-no.of clusters
low
10 Intrusion Detection for Routing attacks [9]
loo et al 2006 Periodic Route Error, Active and Passive Sink Hole Error
95%70%100% respectively
High low High High
11 Distributed Intrusion Detection [14]
Ioannis, et al., 2007
Black Hole and Selective Forwarding Attack
lower false +ve and false –ve rate (>5% false alarm rate)
low O(n) n-no. of nodes in the monitoring area
O(nw) w- width of sliding window
low
12 SVM Intrusion Detection [12]
Sophia, et al.,2007
Black Hole and Selective Forwarding Attack
100% and 85% respectively
High low 0(n) n-no. of data records
High
Evaluation: KDD Cup ‘99 dataset with selected features.
Advantage: Achieves high detection rate with low false positive rate.
Disadvantage: Communication in WSn consumes high energy. Training time is long and therefore it requires high computational power.
Outcome: Accuracy rate over 98%.The analysis and comparison of various wireless
sensor based IDS based on its characteristics are given in Table 3.
table 3. Comparison of various ids in wsn based on its characteristics
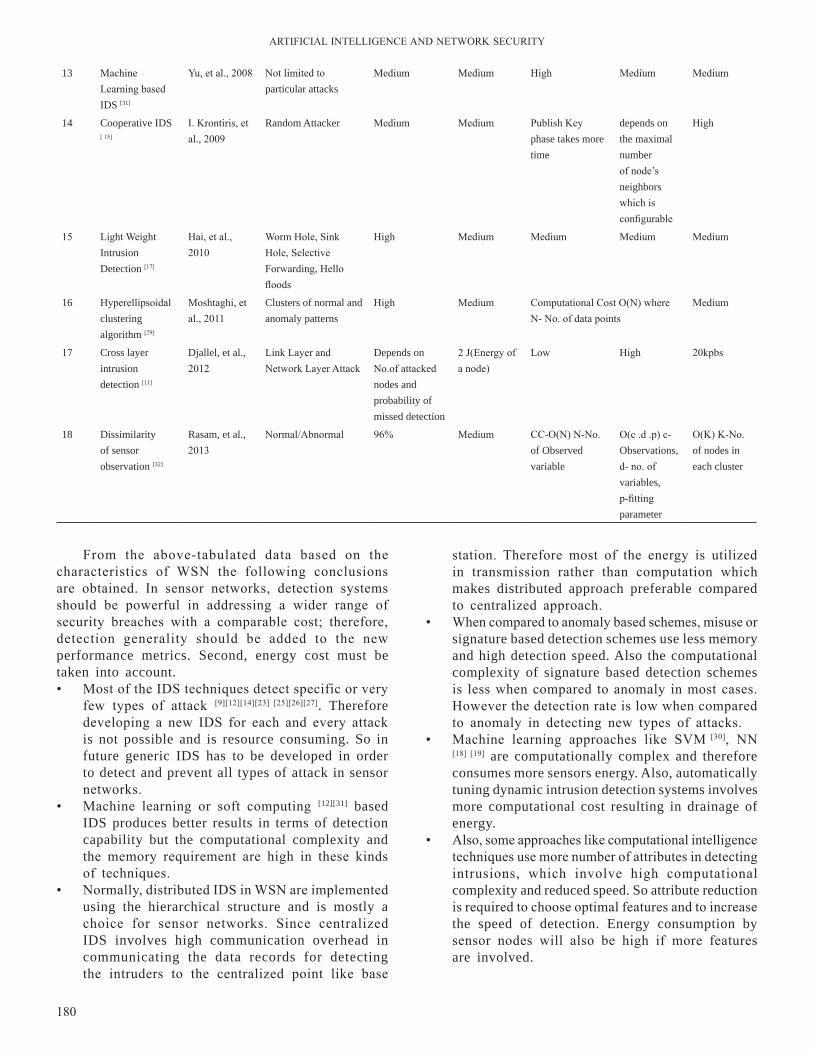
ArTIFICIAl InTEllIGEnCE AnD nETWOrK SECurITY
180
13 Machine learning based IDS [31]
Yu, et al., 2008 not limited to particular attacks
Medium Medium High Medium Medium
14 Cooperative IDS [ 15]
I. Krontiris, et al., 2009
Random Attacker Medium Medium Publish Key phase takes more time
depends on the maximal number of node’s neighbors which is configurable
High
15 light Weight Intrusion Detection [17]
Hai, et al., 2010
Worm Hole, Sink Hole, Selective Forwarding, Hello floods
High Medium Medium Medium Medium
16 Hyperellipsoidal clustering algorithm [29]
Moshtaghi, et al., 2011
Clusters of normal and anomaly patterns
High Medium Computational Cost O(n) where n- no. of data points
Medium
17 Cross layer intrusion detection [11]
Djallel, et al., 2012
link layer and network layer Attack
Depends on no.of attacked nodes and probability of missed detection
2 J(Energy of a node)
low High 20kpbs
18 Dissimilarity of sensor observation [32]
Rasam, et al., 2013
normal/Abnormal 96% Medium CC-O(n) n-no. of Observed variable
O(c .d .p) c- Observations, d- no. of variables, p-fitting parameter
O(K) K-no.of nodes in each cluster
From the above-tabulated data based on the characteristics of WSn the following conclusions are obtained. In sensor networks, detection systems should be powerful in addressing a wider range of security breaches with a comparable cost; therefore, detection generality should be added to the new performance metrics. Second, energy cost must be taken into account.• Most of the IDS techniques detect specific or very
few types of attack [9][12][14][23] [25][26][27]. Therefore developing a new IDS for each and every attack is not possible and is resource consuming. So in future generic IDS has to be developed in order to detect and prevent all types of attack in sensor networks.
• Machine learning or soft computing [12][31] based IDS produces better results in terms of detection capability but the computational complexity and the memory requirement are high in these kinds of techniques.
• normally, distributed IDS in WSn are implemented using the hierarchical structure and is mostly a choice for sensor networks. Since centralized IDS involves high communication overhead in communicating the data records for detecting the intruders to the centralized point like base
station. Therefore most of the energy is utilized in transmission rather than computation which makes distributed approach preferable compared to centralized approach.
• When compared to anomaly based schemes, misuse or signature based detection schemes use less memory and high detection speed. Also the computational complexity of signature based detection schemes is less when compared to anomaly in most cases. However the detection rate is low when compared to anomaly in detecting new types of attacks.
• Machine learning approaches like SVM [30], nn [18] [19] are computationally complex and therefore consumes more sensors energy. Also, automatically tuning dynamic intrusion detection systems involves more computational cost resulting in drainage of energy.
• Also, some approaches like computational intelligence techniques use more number of attributes in detecting intrusions, which involve high computational complexity and reduced speed. So attribute reduction is required to choose optimal features and to increase the speed of detection. Energy consumption by sensor nodes will also be high if more features are involved.
GEETHA: A CurrEnT SurVEY On InTruSIOn DETECTIOn SYSTEMS FOr WIrElESS SEnSOr nETWOrKS
181
4. CoMPArison And disCUssionsThe major problem of security in sensor networks
lies in the balance between minimizing resource consumption and maximizing security. The resource in this perspective comprises energy as well as computational resource like CPu, memory, and network bandwidth. Therefore, any security mechanisms for sensor networks should consider the following five major resource constraints: (1) limited energy, (2) limited memory, (3) limited computing power, (4) limited communication bandwidth, (5) limited communication range [20]. Intrusion detection systems are classified into anomaly, misuse and hybrid based on the detection mechanism. These types of intrusion detection system can be centralized or distributed based on the control strategy. The distributed IDS can be fully distributed or partially distributed. Control Strategy defines how the elements of an IDS is controlled, and moreover, how the input and output of the IDS are managed. In centralized IDS, monitoring and detection of traffic pattern is controlled directly from the base station/gateway node. In partially distributed IDS, monitoring and detection of attack patterns is controlled from a local sensor node, with hierarchical reporting to one or more cluster head. In fully distributed, monitoring and detection of traffic patterns is done using an agent-based approach, where response decisions are made at the point of analysis. Centralized IDS in WSn allow for easy expansion of network. The drawback here is that there is a single point of failure if compromised. If the centralized analyzer flops, the entire network is now without the protection of wireless IDS. In distributed IDS, each IDS sensor agent keeps in touch with the other sensors to transfer information and alerts in order to function as a comprehensible structure. The advantage here is that the system does not face any single point failure. The drawbacks include 1. Expansion of network results in redesigning all sensors 2. Overall cost increases etc. Centralized SVM training method allows an improved separation of the classes with the error rate negligible. However, there is high communication overhead, and it is not appropriate for resource-constrained WSn. Therefore many researchers suggest that the distributed SVM training is appropriate for the constraint of sensor nodes in terms of energy, computation, memory and provide nearer classification as centralized approach. Also, from the papers discussed above in the earlier sections we came across some limitations which can be considered as open-research issues that could be addressed while developing better IDS for WSn. 1. Developing a real time IDs for WSn and investigating
its applicability in fading atmospheres and also with networks of moving sensors with different radio ranges.
2. Developing generic IDS, which detects almost all attack types.
3. Developing lightweight IDS using soft computing approaches as these techniques utilize more resources. Also these machine learning approaches have been successfully applied in many fields including wired IDS and adhoc IDS and therefore applying these techniques improve the detection capability.
4. Developing computationally intelligent optimization technique for placing IDS agents in sensor nodes.
5. To our knowledge, there is no labeled dataset specifically for WSn IDS. Collecting and designing such dataset would be useful for the research community.
5. ConClUsionThis survey paper introduces IDSs for WSn along
with their design specifications, requirements and classifications based on various strategies. Further, different types of attacks happening in a WSn and respective plausible detection mechanism adapted is also mentioned. Also, significant IDSs adapted for WSns are discussed and their salient features are highlighted in a comparable chart, followed by the critics about IDSs that would be suitable to WSns are provided. Finally, as a measure to help out the researchers over the selection of appropriate IDS for WSns, a few unhandled research issues are pointed out along with future scope for this research.
fu"d"k Z;g losZ{k.k vkys[k ok;jySl lsalj usVodZ ds vkbZMh,l
ds lkFk muds fMtkbu fofunsZ”kksa] vko”;drkvksa vkSj fofHkUu j.kuhfr;ksa ij vk/kkfjr oxhZdj.k dk ifjp; nsrk gSaA blds vykok ok;jySl lsalj usVodZ esa fofHkUu çdkj ds geysa vkSj blds fy, viukbZ xbZ fo”oluh; [kkst çfØ;k dk mYys[k gSa ok;jySl lsalj usVodZ ds fy, viukbZ xbZ ?kqliSB tk¡p ç.kkyh vkSj rqyukRed pkVZ esa eq[; xq.k çdkf”kr fd;s x;s gSaA mlds ckn vkbZMh,l tks fd ok;jySl lsalj usVodZ ds fy, vuqdwy gS mudh vkykspuk çLrqr dh xbZ gSaA var esa] mfpr vkbZMh,l dk p;u esa “kks/kdrkZvksa dh enn ds fy,] dqN vçcaf/kr vuqla/kku eqíksa ds lkFk&lkFk bl vuqla/kku ds Hkfo’; dh laHkkouk dks n”kkZ;k x;k gSaA
rEFErEnCEs1. u.S. Barricades.[Online]. http://www.usbarricades.
com/traffic-signal-ups-uninterruptable-powersupply-654
2. Abduvaliyev, A.; Pathan, A.S.K.; Jianying Zhou, roman, r. & Wai-Choong Wong. On the Vital
ArTIFICIAl InTEllIGEnCE AnD nETWOrK SECurITY
182
Areas of Intrusion Detection Systems in Wireless Sensor networks. IEEE Communications Surveys & Tutorials, 2013, 15(3), 1-16.
3. Chaudhari, H.C. and Kadam l.u. Wireless Sensor networks: Security, Attacks and Challenges. International Journal of networking, 2011, 1(1), 4-16.
4. Tavallaee, M.; Stakhanova, n. & Ghorbani, A.A. Toward credible evaluation of anomaly-based intrusion-detection methods. IEEE Transactions on Systems, Man, and Cybernetics—Part C: Applications and reviews, 2010, 40(5), 516-524. Zhang, n., Yu, W., Fu, X. and Das, S.K. Maintaining defender’s reputation in anomaly detection against insider attacks. IEEE Transactions on Systems, Man, and Cybernetics. Part B, Cybernetics, 2010, 40(3), 597-611.
5. Siva.S.Sivatha Sindhu, S.Geetha, A.Kannan. Decision tree based light weight intrusion detection using a wrapper approach. Expert Systems with Applications: An International Journal, 2012, 39(1), 129-141.
6. Sutharshan rajasegarar; Christopher leckie; Marimuthu Palaniswami; James C. Bezdek. Distributed Anomaly Detection in Wireless Sensor networks. In Proceedings of 10th IEEE Singapore International Conference on Communication systems, 2006.
7. Heshan Kumarage , Ibrahim Khalil, Zahir Tari, Albert Zomaya. Distributed anomaly detection for industrial wireless sensor networks based on fuzzy data modeling. Journal of Parallel and Distributed Computing, Elsevier, 2013, 73(6), 790–806.
8. C.E. loo, M.Y. ng, C. leckie and M. Palaniswami. Intrusion Detection for Routing Attacks in Sensor networks. International Journal of Distributed Sensor networks,2006, 2(4), 313 – 332.
9. V. Bhuse and A. Gupta. Anomaly intrusion detection in wireless sensor networks. Journal of High Speed networks, 2006, 15(1), 33–51.
10. Djallel Eddine Boubiche, Azeddine Bilami. Cross layer intrusion detection system for wireless sensor network. International Journal of network Security and its Applications, 2012, 4(2), 36-44.
11. Sophia Kaplantzis; Alistair Shilton; nallasamy Mani; Y. Ahmet Sekercioglu. Detecting Selective Forwarding Attacks in Wireless Sensor networks using Support Vector Machines. In Proceedings of IEEE Intelligent Sensors, Sensor networks and Information ISSnIP, 2007.
12. S. Marti; T. J. Giuli; K. lai; M. Baker. Mitigating routing misbehavior in mobile ad hoc networks. In Proceedings of the 6th Annual International Conference on Mobile Computing and networking, 2000.
13. Ioannis Krontiris; Tassos Dimitriou; Felix C. Freiling. Towards intrusion detection in wireless sensor
networks. In Proceedings of the 13th European Wireless Conference, Paris, 2007.
14. Ioannis Krontiris, Zinaida Benenson, Thanassis Giannetsos, Felix C. Freiling, Tassos. Dimitriou Cooperative Intrusion Detection in Wireless Sensor networks. Wireless Sensor networks,” lecture notes in Computer Science, 2009, 5432(1), pp 263-278.
15. Soumya Banerjee, Crina Grosan, Ajith Abraham and P. K. Mahant. Intrusion Detection on Sensor networks using Emotional Ants. International Journal of Applied science and computation, 2005, 12(3), 152-173.
16. T. H. Hai, E. n. Huh and M. Jo. A lightweight Intrusion Detection Framework for Wireless Sensor networks. Wireless Communications and mobile computing, 2010,10(4), 559-572.
17. K. q. Yan; S. C. Wang; S. S. Wang; C. W. liu. Hybrid Intrusion Detection System for Enhancing the Security of a Cluster-based Wireless Sensor network. In Proceedings of 3rd IEEE International Conference on Computer Science and Information Technology, Chengdu, China, 2010.
18. Hichem Sedjelmaci and Mohamed Feham. novel hybrid intrusion detection system for clustered wireless sensor network. International Journal of network Security and its Applications, 2011,3(4), 1-14.
19. Shafiullah Khan, Al-Sakib Khan Pathan, nabil Ali Alrajeh. Wireless Sensor networks: Current Status and Future Trends. CrC Press (Book), 2012.546 p.
20. David W. Carman, Peter S. Kruus, Brian J. Matt. Constraints and approaches for distributed sensor network security. nAI labs Technical report no. #00-010, September 2000.
21. Perrig; r. Szewczyk; V. Wen; D. Culler; D. Tygar. SPInS: Security Protocols for Sensor networks. In Proceedings of 7th Annual International Conference on Mobile Computing and networks, rome, 2001.
22. Haining, W.; Danlu, Z.; Kang, G.S. Detecting SYn Flooding Attacks. In Proceedings of the 21st Annual Joint Conference of the IEEE Computer and Communications Societies (InFOCOM 2002), new York, nY, uSA, 2002.
23. Palpanas T, et al. Distributed deviation detection in sensor networks. SIGMOD record, 2003, 32(1), 77–82.
24. lingxuan Hu. using Directional Antennas to Prevent Wormhole Attacks. In Proceedings of network and Distributed System Security Symposium (nDSS 2004), San Diego, California, uSA, 2004.
25. Pires, W.r.; De Paula Figueiredo, T.H.; Wong, H.C.; loureiro, A.A.F. Malicious node Detection in Wireless Sensor networks. In Proceedings of
GEETHA: A CurrEnT SurVEY On InTruSIOn DETECTIOn SYSTEMS FOr WIrElESS SEnSOr nETWOrKS
183
the 18th International Parallel and Distributed Processing Symposium, Santa Fe, nM, uSA, 2004.
26. Silva APrd; Martins M.H.T; rocha B.P.S; loureiro A.A.F; ruiz l.B.; Wong H.C. Decentralized intrusion detection in wireless sensor networks. In Proceedings of ACM International Workshop on quality of Service and Security in Wireless and Mobile networks, 2005.
27. Su Chien-Chung ; Ko-Ming Chang ; Yau-Hwang Kuo; Mong-Fong Horng. The new intrusion prevention and detection approaches for clustering-based sensor networks. In Proceedings of IEEE Wireless Communications and networking Conference, 2005.
28. Masud Moshtaghi, Sutharshan rajasegarar, Christopher leckie, & Shanika Karunasekera. An Efficient Hyperellipsoidal Clustering Algorithm for resource-Constrained Environments. Pattern Recognition,
2011, 44(9) 2197-2209.29. S rajasegarar, C leckie, JC Bezdek, M Palaniswami,
Centered hyperspherical and hyperellipsoidal one-class support vector machines for anomaly detection in sensor networks. IEEE Transactions on Information Forensics and Security, 2010, 5(3), pp. 518-533.
30. Yu Z, Tsai JJP. A framework of machine learning based intrusion detection for wireless sensor networks. In Proceedings of IEEE International Conference on Sensor networks, ubiquitous and Trustworthy Computing, pp. 80-88, 2008.
31. rassam. M.A, Zainal A. & Maarof M.A. An Efficient Distributed Anomaly Detection Model for Wireless Sensor networks. in Proceedings of AASRI Conference on Parallel and Distributed Computing and Systems, Elsevier, 5, pp. 9-14, 2013.
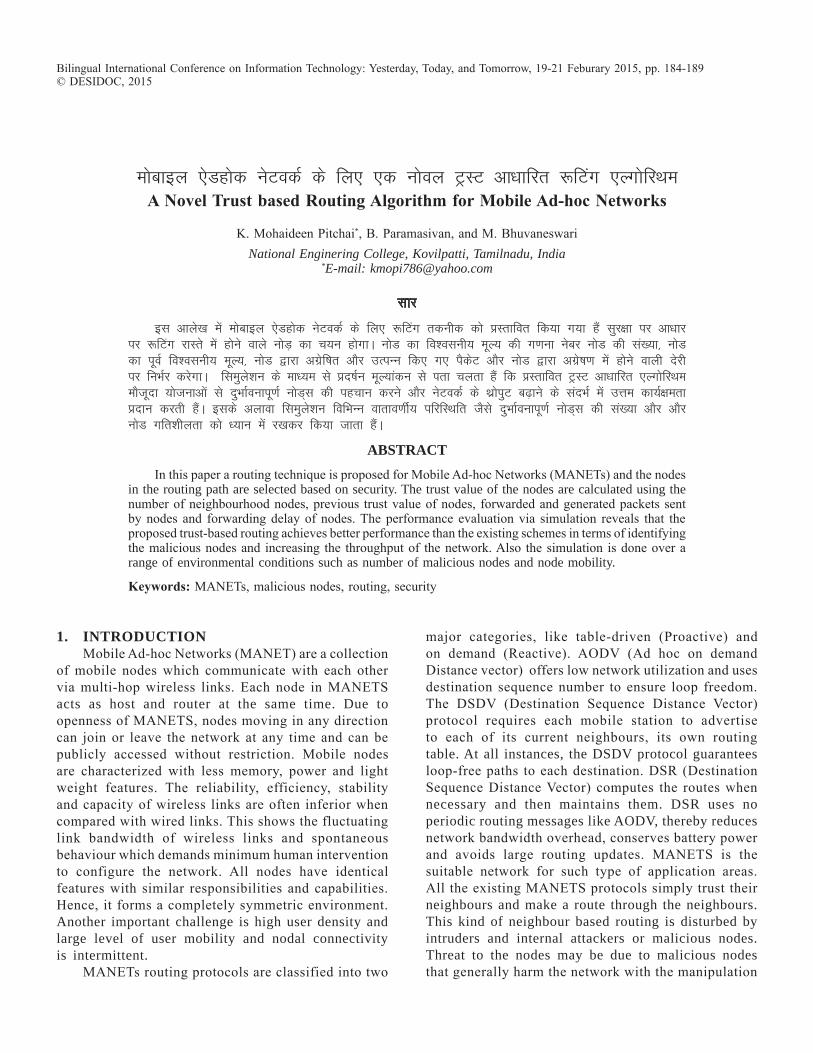
Bilingual International Conference on Information Technology: Yesterday, Today, and Tomorrow, 19-21 Feburary 2015, pp. 184-189© DESIDOC, 2015
1. IntroductIonMobile Ad-hoc networks (MAnET) are a collection
of mobile nodes which communicate with each other via multi-hop wireless links. Each node in MAnETS acts as host and router at the same time. Due to openness of MAnETS, nodes moving in any direction can join or leave the network at any time and can be publicly accessed without restriction. Mobile nodes are characterized with less memory, power and light weight features. The reliability, efficiency, stability and capacity of wireless links are often inferior when compared with wired links. This shows the fluctuating link bandwidth of wireless links and spontaneous behaviour which demands minimum human intervention to configure the network. All nodes have identical features with similar responsibilities and capabilities. Hence, it forms a completely symmetric environment. Another important challenge is high user density and large level of user mobility and nodal connectivity is intermittent.
MAnETs routing protocols are classified into two
major categories, like table-driven (Proactive) and on demand (reactive). AODV (Ad hoc on demand Distance vector) offers low network utilization and uses destination sequence number to ensure loop freedom. The DSDV (Destination Sequence Distance Vector) protocol requires each mobile station to advertise to each of its current neighbours, its own routing table. At all instances, the DSDV protocol guarantees loop-free paths to each destination. DSr (Destination Sequence Distance Vector) computes the routes when necessary and then maintains them. DSR uses no periodic routing messages like AODV, thereby reduces network bandwidth overhead, conserves battery power and avoids large routing updates. MAnETS is the suitable network for such type of application areas. All the existing MAnETS protocols simply trust their neighbours and make a route through the neighbours. This kind of neighbour based routing is disturbed by intruders and internal attackers or malicious nodes. Threat to the nodes may be due to malicious nodes that generally harm the network with the manipulation
eksckby ,sMgksd usVodZ ds fy, ,d uksoy VªLV vk/kkfjr :fVax ,YxksfjFke A novel trust based routing Algorithm for Mobile Ad-hoc networks
K. Mohaideen Pitchai*, B. Paramasivan, and M. BhuvaneswariNational Enginering College, Kovilpatti, Tamilnadu, India
*E-mail: [email protected]
Lkkj
bl vkys[k esa eksckby ,sMgksd usVodZ ds fy, :fVax rduhd dks çLrkfor fd;k x;k gSa lqj{kk ij vk/kkj ij :fVax jkLrs esa gksus okys uksM+ dk p;u gksxkA uksM dk fo”oluh; ewY; dh x.kuk uscj uksM dh la[;k] uksM dk iwoZ fo”oluh; ewY;] uksM }kjk vxzsf’kr vkSj mRiUu fd, x, iSdsV vkSj uksM }kjk vxzs’k.k esa gksus okyh nsjh ij fuHkZj djsxkA fleqys”ku ds ek/;e ls çn’kZu ewY;kadu ls irk pyrk gSa fd çLrkfor VªLV vk/kkfjr ,YxksfjFke ekStwnk ;kstukvksa ls nqHkkZoukiw.kZ uksM~l dh igpku djus vkSj usVodZ ds FkzksiqV c<+kus ds lanHkZ esa mÙke dk;Z{kerk çnku djrh gSaA blds vykok fleqys”ku fofHkUu okrko.khZ; ifjfLFkfr tSls nqHkkZoukiw.kZ uksM~l dh la[;k vkSj vkSj uksM xfr”khyrk dks /;ku esa j[kdj fd;k tkrk gSaA
AbstrActIn this paper a routing technique is proposed for Mobile Ad-hoc networks (MAnETs) and the nodes
in the routing path are selected based on security. The trust value of the nodes are calculated using the number of neighbourhood nodes, previous trust value of nodes, forwarded and generated packets sent by nodes and forwarding delay of nodes. The performance evaluation via simulation reveals that the proposed trust-based routing achieves better performance than the existing schemes in terms of identifying the malicious nodes and increasing the throughput of the network. Also the simulation is done over a range of environmental conditions such as number of malicious nodes and node mobility.
Keywords: MAnETs, malicious nodes, routing, security
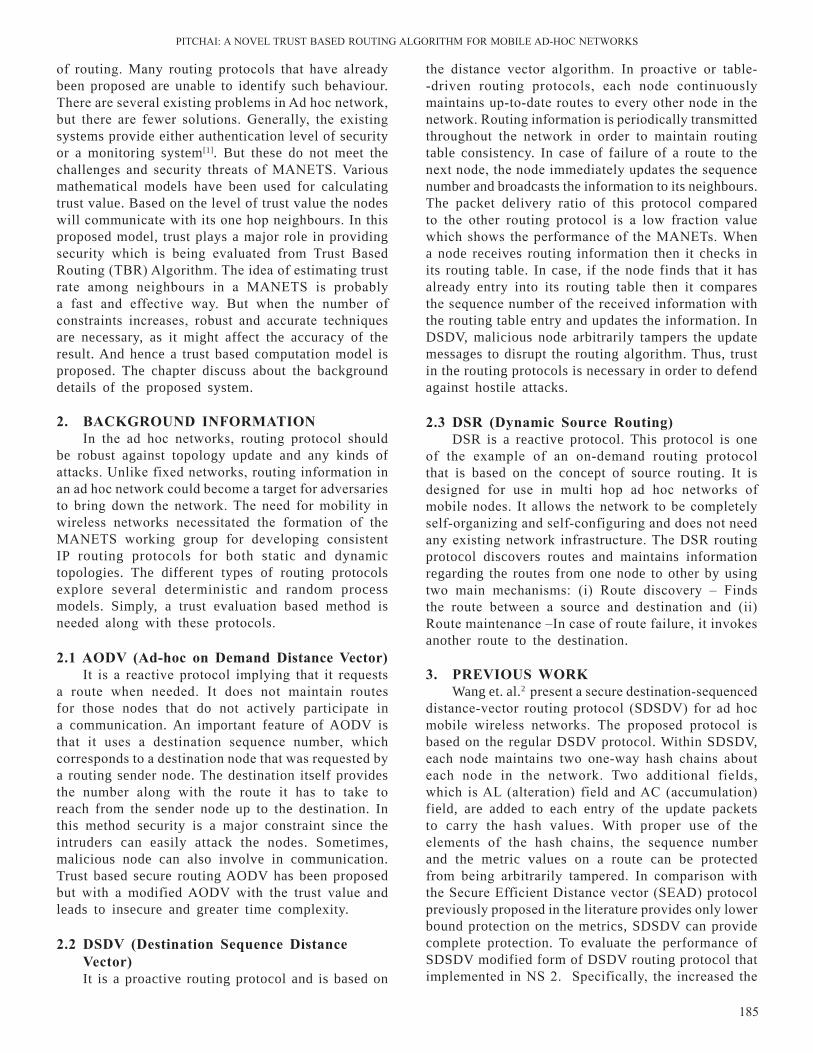
PITCHAI: A nOVEl TruST BASED rOuTInG AlGOrITHM FOr MOBIlE AD-HOC nETWOrKS
185
of routing. Many routing protocols that have already been proposed are unable to identify such behaviour. There are several existing problems in Ad hoc network, but there are fewer solutions. Generally, the existing systems provide either authentication level of security or a monitoring system[1]. But these do not meet the challenges and security threats of MAnETS. Various mathematical models have been used for calculating trust value. Based on the level of trust value the nodes will communicate with its one hop neighbours. In this proposed model, trust plays a major role in providing security which is being evaluated from Trust Based routing (TBr) Algorithm. The idea of estimating trust rate among neighbours in a MAnETS is probably a fast and effective way. But when the number of constraints increases, robust and accurate techniques are necessary, as it might affect the accuracy of the result. And hence a trust based computation model is proposed. The chapter discuss about the background details of the proposed system.
2. bACKGroUnd inForMAtionIn the ad hoc networks, routing protocol should
be robust against topology update and any kinds of attacks. unlike fixed networks, routing information in an ad hoc network could become a target for adversaries to bring down the network. The need for mobility in wireless networks necessitated the formation of the MAnETS working group for developing consistent IP routing protocols for both static and dynamic topologies. The different types of routing protocols explore several deterministic and random process models. Simply, a trust evaluation based method is needed along with these protocols.
2.1 AodV (Ad-hoc on demand distance Vector)It is a reactive protocol implying that it requests
a route when needed. It does not maintain routes for those nodes that do not actively participate in a communication. An important feature of AODV is that it uses a destination sequence number, which corresponds to a destination node that was requested by a routing sender node. The destination itself provides the number along with the route it has to take to reach from the sender node up to the destination. In this method security is a major constraint since the intruders can easily attack the nodes. Sometimes, malicious node can also involve in communication. Trust based secure routing AODV has been proposed but with a modified AODV with the trust value and leads to insecure and greater time complexity.
2.2 dsdV (destination sequence distance Vector) It is a proactive routing protocol and is based on
the distance vector algorithm. In proactive or table--driven routing protocols, each node continuously maintains up-to-date routes to every other node in the network. routing information is periodically transmitted throughout the network in order to maintain routing table consistency. In case of failure of a route to the next node, the node immediately updates the sequence number and broadcasts the information to its neighbours. The packet delivery ratio of this protocol compared to the other routing protocol is a low fraction value which shows the performance of the MAnETs. When a node receives routing information then it checks in its routing table. In case, if the node finds that it has already entry into its routing table then it compares the sequence number of the received information with the routing table entry and updates the information. In DSDV, malicious node arbitrarily tampers the update messages to disrupt the routing algorithm. Thus, trust in the routing protocols is necessary in order to defend against hostile attacks.
2.3 dsr (dynamic source routing)DSR is a reactive protocol. This protocol is one
of the example of an on-demand routing protocol that is based on the concept of source routing. It is designed for use in multi hop ad hoc networks of mobile nodes. It allows the network to be completely self-organizing and self-configuring and does not need any existing network infrastructure. The DSr routing protocol discovers routes and maintains information regarding the routes from one node to other by using two main mechanisms: (i) route discovery – Finds the route between a source and destination and (ii) route maintenance –In case of route failure, it invokes another route to the destination.
3. PrEVioUs worKWang et. al.2 present a secure destination-sequenced
distance-vector routing protocol (SDSDV) for ad hoc mobile wireless networks. The proposed protocol is based on the regular DSDV protocol. Within SDSDV, each node maintains two one-way hash chains about each node in the network. Two additional fields, which is Al (alteration) field and AC (accumulation) field, are added to each entry of the update packets to carry the hash values. With proper use of the elements of the hash chains, the sequence number and the metric values on a route can be protected from being arbitrarily tampered. In comparison with the Secure Efficient Distance vector (SEAD) protocol previously proposed in the literature provides only lower bound protection on the metrics, SDSDV can provide complete protection. To evaluate the performance of SDSDV modified form of DSDV routing protocol that implemented in nS 2. Specifically, the increased the
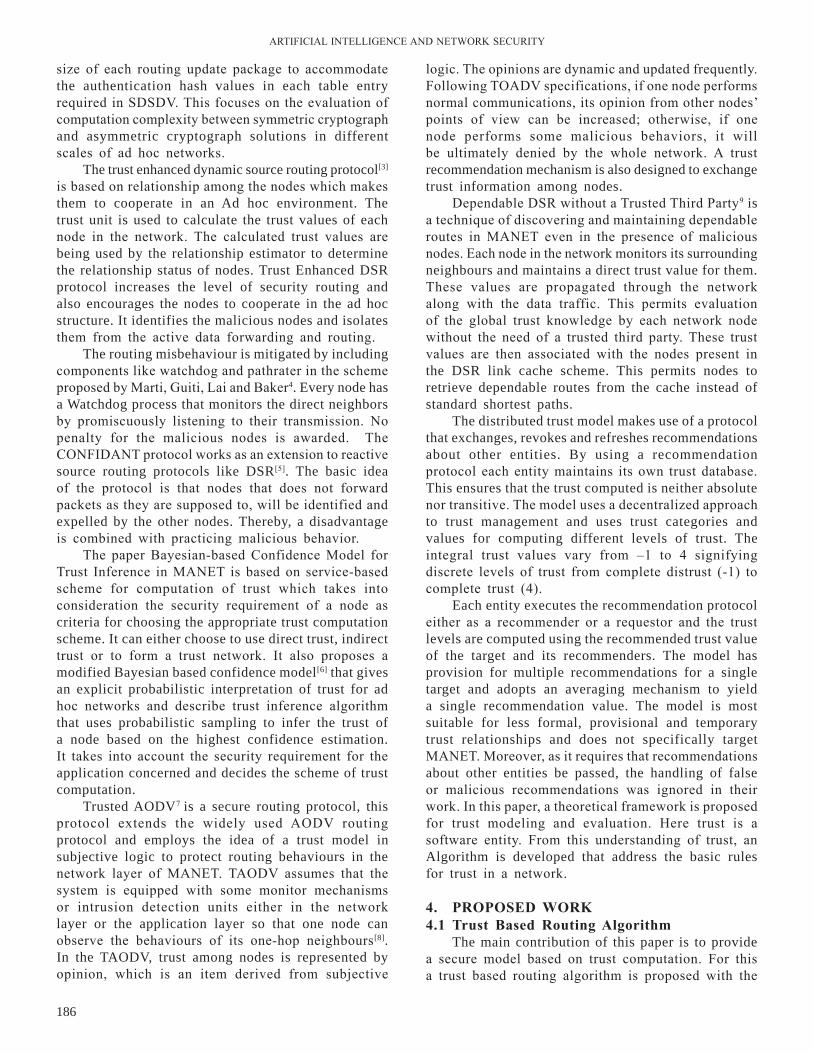
ArTIFICIAl InTEllIGEnCE AnD nETWOrK SECurITY
186
size of each routing update package to accommodate the authentication hash values in each table entry required in SDSDV. This focuses on the evaluation of computation complexity between symmetric cryptograph and asymmetric cryptograph solutions in different scales of ad hoc networks.
The trust enhanced dynamic source routing protocol[3] is based on relationship among the nodes which makes them to cooperate in an Ad hoc environment. The trust unit is used to calculate the trust values of each node in the network. The calculated trust values are being used by the relationship estimator to determine the relationship status of nodes. Trust Enhanced DSR protocol increases the level of security routing and also encourages the nodes to cooperate in the ad hoc structure. It identifies the malicious nodes and isolates them from the active data forwarding and routing.
The routing misbehaviour is mitigated by including components like watchdog and pathrater in the scheme proposed by Marti, Guiti, lai and Baker4. Every node has a Watchdog process that monitors the direct neighbors by promiscuously listening to their transmission. no penalty for the malicious nodes is awarded. The COnFIDAnT protocol works as an extension to reactive source routing protocols like DSR[5]. The basic idea of the protocol is that nodes that does not forward packets as they are supposed to, will be identified and expelled by the other nodes. Thereby, a disadvantage is combined with practicing malicious behavior.
The paper Bayesian-based Confidence Model for Trust Inference in MAnET is based on service-based scheme for computation of trust which takes into consideration the security requirement of a node as criteria for choosing the appropriate trust computation scheme. It can either choose to use direct trust, indirect trust or to form a trust network. It also proposes a modified Bayesian based confidence model[6] that gives an explicit probabilistic interpretation of trust for ad hoc networks and describe trust inference algorithm that uses probabilistic sampling to infer the trust of a node based on the highest confidence estimation. It takes into account the security requirement for the application concerned and decides the scheme of trust computation.
Trusted AODV7 is a secure routing protocol, this protocol extends the widely used AODV routing protocol and employs the idea of a trust model in subjective logic to protect routing behaviours in the network layer of MAnET. TAODV assumes that the system is equipped with some monitor mechanisms or intrusion detection units either in the network layer or the application layer so that one node can observe the behaviours of its one-hop neighbours[8]. In the TAODV, trust among nodes is represented by opinion, which is an item derived from subjective
logic. The opinions are dynamic and updated frequently. Following TOADV specifications, if one node performs normal communications, its opinion from other nodes’ points of view can be increased; otherwise, if one node performs some malicious behaviors, it will be ultimately denied by the whole network. A trust recommendation mechanism is also designed to exchange trust information among nodes.
Dependable DSr without a Trusted Third Party9 is a technique of discovering and maintaining dependable routes in MAnET even in the presence of malicious nodes. Each node in the network monitors its surrounding neighbours and maintains a direct trust value for them. These values are propagated through the network along with the data traffic. This permits evaluation of the global trust knowledge by each network node without the need of a trusted third party. These trust values are then associated with the nodes present in the DSR link cache scheme. This permits nodes to retrieve dependable routes from the cache instead of standard shortest paths.
The distributed trust model makes use of a protocol that exchanges, revokes and refreshes recommendations about other entities. By using a recommendation protocol each entity maintains its own trust database. This ensures that the trust computed is neither absolute nor transitive. The model uses a decentralized approach to trust management and uses trust categories and values for computing different levels of trust. The integral trust values vary from –1 to 4 signifying discrete levels of trust from complete distrust (-1) to complete trust (4).
Each entity executes the recommendation protocol either as a recommender or a requestor and the trust levels are computed using the recommended trust value of the target and its recommenders. The model has provision for multiple recommendations for a single target and adopts an averaging mechanism to yield a single recommendation value. The model is most suitable for less formal, provisional and temporary trust relationships and does not specifically target MAnET. Moreover, as it requires that recommendations about other entities be passed, the handling of false or malicious recommendations was ignored in their work. In this paper, a theoretical framework is proposed for trust modeling and evaluation. Here trust is a software entity. From this understanding of trust, an Algorithm is developed that address the basic rules for trust in a network.
4. ProPosEd worK4.1 trust based routing Algorithm
The main contribution of this paper is to provide a secure model based on trust computation. For this a trust based routing algorithm is proposed with the

PITCHAI: A nOVEl TruST BASED rOuTInG AlGOrITHM FOr MOBIlE AD-HOC nETWOrKS
187
idea of managing the decentralized network effectively. It includes the neighbour set table that contains the neighbour id of the source node. For each source their one hop neighbours will be listed. neighbour set table also contains a self entity known as trust for each of the available neighbours. Based on the level of trust from the neighbour set table the node is assigned as TH, TA, Tl and nT (refer Table 1). The priority is given only for the TH and TA neighbour range. This paper also provides the second level authentication of password checking for the neighbours in the higher priority level. After this, the Source node will send rrEq Packet to the trusted node. Similarly, the routes
-TH (TBr value between 0.76 and 1), Trust Average – TA (TBr value between 0.51 and 0.75), Trust low - Tl (TBr value between 0.26 and 0.5) and no Trust - nT (TBr value between 0 and 0.25).
Step 6: The neighboring nodes which fall under the category of nT will not be considered for routing. rest of the three categories TH, TA and Tl goes for the next level of security verification.
Step 7: The neighboring nodes with trust value TH will go for low level of encryption. likewise nodes with trust values TA and Tl will go for medium and higher level of encryption respectively. The encryption levels are classified based on the size of the key. 32 bit, 64 bit and 128 bit keys for TH, TA and Tl respectively.
Step 8: With these levels of security checks the source node establishes a route to its neighbor and the process proceeds still one hop neighbor is the destination.
4.2 Procedure for Evaluating trustThe nodes in the neighbor table are evaluated
for trust based on the Eqn (1) mentioned in step 4 of the TBr algorithm. In this equation four important parameters are considered for calculating the TBR value. The Prevtrust parameter specifies the previous trust value of the node. It represents the past activity of the node. The parameter Pacsent is considered for determining the trust value in order to accommodate the severity of the traffic. Trust is an array that holds neighbor id for each trust entity. TMnODE is used to temporarily hold the neighbors.for (each node I in neighbour table){
if ( 0.76 < TBr value < 1.0){
assign_trust[i] = TH;save TMnODE[j] = i;j++;
}else if (0.51 < TBr value < 0.75){
assign_trust[i] = TA;save TMnODE[k]=i;k++;
}else if ( 0.26 < TBr value < 0.5){
trust[i] =Tl;}else{
trust[i]=nT;Generate a warning message;
}}
table 1. trust entity
s. no Entity Full Form tbr Value
1 TH Trust High 0.76 to 1
2 TA Trust Average 0.51 to 0.75
3 Tl Trust low 0.26 to 0.5
4 nT no Trust 0 to 0.25
are established on demand. The key framework of this paper is to check the level of trust with the neighbours available in the table. So, this provides a higher model of trust computation with simple mathematical equation.Step 1: The source node will broadcasts HEllO packets to
all its one hop neighbors in its transmission range. If an acknowledgement is received, then those nodes will be included in neighbor Set Table (nST).
Step 2: In order determine the trust level of the neighbors’, check whether the destination node is in source nodes nST. If it is true then calculate its trust value according to the step 4.
Step 3: If the destination is not in the nST, then find the trust value of all of its neighbors in the nST.
Step 4: Compute the good level of trust TBr(y) among all the available neighbors. TBr(y) = sin(x) to calculate the trust value (y) based on a node’s direct experience. Here the computation value is restricted between 0 and 1. The function for calculating the trust value is
TBr(y) = sin (c1 * Prevtrust + c2 * noneigh + c3 * Pacsent
+c4 DelayForward) (1)
where c1, c2, c3 and c4 are constants whose sum is equal to 1. Those values are determined during simulation. Prevtrust is the previous trust value of node x. noneigh represents the number of neighbor nodes of y. Pacsent represents the packets forwarded and generated by x. DelayForward represents the forwarding delay of node x.
Step 5: After calculating the trust value of all neighbors, they are categorized according to trust value ie. Trust High
ArTIFICIAl InTEllIGEnCE AnD nETWOrK SECurITY
188
4.3 Flow ChartThe flow chart in Fig. 1 explains the procedural
steps of the proposed algorithm. The network is deployed first for a particular transmission range. Then the nodes within that range are identified by broadcasting Hello packets. Applying the TBR algorithm for establishing neighbour adjacency and then evaluates the trust. And as a second level different levels of encryption technique are done with the trusted neighbours.
For instance, (Fig. 3) node 1 has 2, 4, and 5 as its one hop neighbours. The neighbour set information is updated in the neighbour table. Applying TBR Algorithm, the source node will decide the trusted node and data packets are sent to that node. For node 2, the neighbor table contains 3, 7, and 6 as neighbors. Among these, node 7 has the highest trust. now, node 7 will broadcasts Hello Packets to choose its neighbors. The node 7 has node 8 as its one hop which is the destination. This process continues until the exact path or the route to the destination is reached.
Figure 1. Flow chart for tbr algorithm.
Figure 2. trust evaluation using tbr.
Figure 3. Path establishment from source to destination.
5. PErForMAnCE EVAlUAtionConsider a MAnET with all type of nodes, which
may be selfish or malicious as well as trusted node. Here in the illustrated example, (Fig. 2) there are eight nodes. The node 1 acts as source want to send data to destination node 8. When a node is ready for data transmission, first it should be aware of the neighbours. After getting information about its one hop neighbours, the source now has to compare the level of trust among all of them from neighbour set table.
table 2. neighbour trust table
neighbour id trust Value2 TH4 nT5 Tl
To analyze the performance of the proposed protocol, it was simulated in a 1000m X 1000m region. The transmission range was set to 25 m. The nodes were set to move at a speed to 10 to 20 meter/sec with a pause time of 30 seconds. CBr traffic was generated with the data payload size of 512 bytes. To calculate the value of TBR for each neighbor node the constants c1 to c4 are assumed as 0.25. The parameters like time to first byte, throughput and percentage of attacks detected were measured.
The parameters time taken to receive first byte (TTFB) after the connection has been setup was measured in each round of simulation and it seems to be consistent throughout the simulation as shown in Fig. 4. TBr algorithm is a reactive routing protocol which will collect routing information only on demand. The advantage of this algorithm is that it creates no
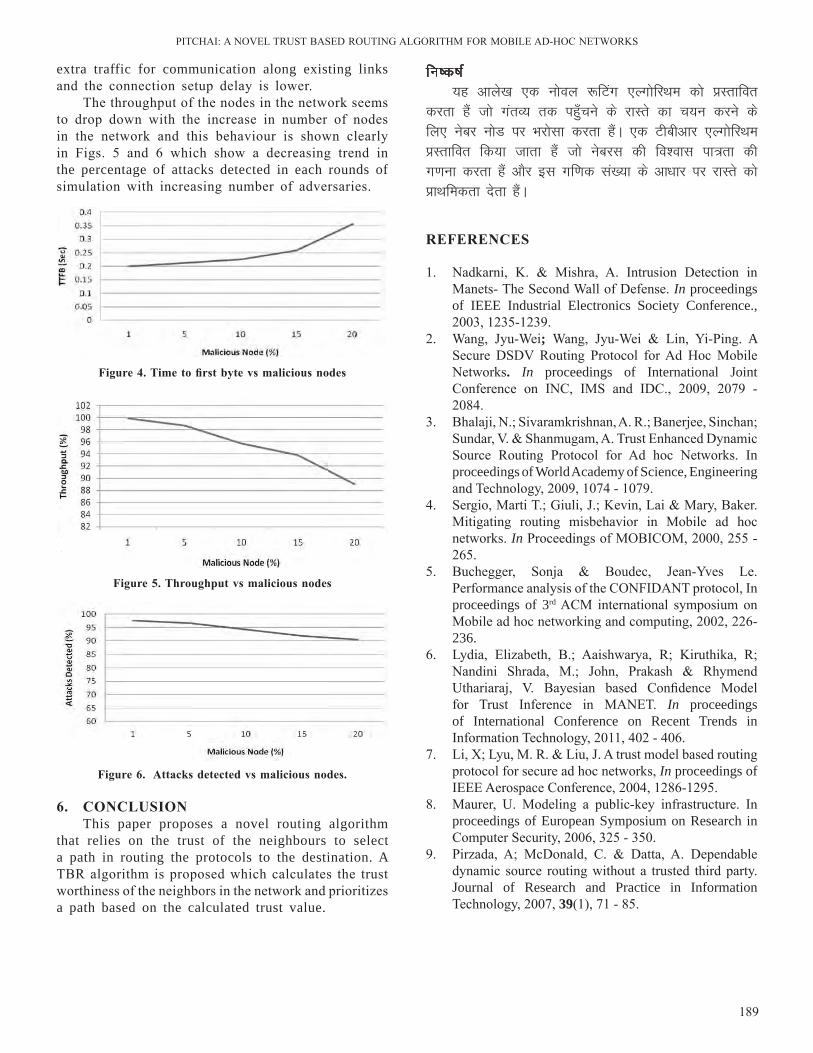
PITCHAI: A nOVEl TruST BASED rOuTInG AlGOrITHM FOr MOBIlE AD-HOC nETWOrKS
189
extra traffic for communication along existing links and the connection setup delay is lower.
The throughput of the nodes in the network seems to drop down with the increase in number of nodes in the network and this behaviour is shown clearly in Figs. 5 and 6 which show a decreasing trend in the percentage of attacks detected in each rounds of simulation with increasing number of adversaries.
fu’d’k Z;g vkys[k ,d uksoy :fVax ,YxksfjFke dks çLrkfor
djrk gSa tks xarO; rd igq¡pus ds jkLrs dk p;u djus ds fy, uscj uksM ij Hkjkslk djrk gSaA ,d Vhchvkj ,YxksfjFke çLrkfor fd;k tkrk gSa tks uscjl dh fo”okl ik=rk dh x.kuk djrk gSa vkSj bl xf.kd la[;k ds vk/kkj ij jkLrs dks çkFkfedrk nsrk gSaA
rEFErEnCEs
1. nadkarni, K. & Mishra, A. Intrusion Detection in Manets- The Second Wall of Defense. In proceedings of IEEE Industrial Electronics Society Conference., 2003, 1235-1239.
2. Wang, Jyu-Wei; Wang, Jyu-Wei & lin, Yi-Ping. A Secure DSDV routing Protocol for Ad Hoc Mobile networks. In proceedings of International Joint Conference on InC, IMS and IDC., 2009, 2079 - 2084.
3. Bhalaji, n.; Sivaramkrishnan, A. r.; Banerjee, Sinchan; Sundar, V. & Shanmugam, A. Trust Enhanced Dynamic Source routing Protocol for Ad hoc networks. In proceedings of World Academy of Science, Engineering and Technology, 2009, 1074 - 1079.
4. Sergio, Marti T.; Giuli, J.; Kevin, lai & Mary, Baker. Mitigating routing misbehavior in Mobile ad hoc networks. In Proceedings of MOBICOM, 2000, 255 - 265.
5. Buchegger, Sonja & Boudec, Jean-Yves le. Performance analysis of the COnFIDAnT protocol, In proceedings of 3rd ACM international symposium on Mobile ad hoc networking and computing, 2002, 226-236.
6. lydia, Elizabeth, B.; Aaishwarya, r; Kiruthika, r; nandini Shrada, M.; John, Prakash & rhymend uthariaraj, V. Bayesian based Confidence Model for Trust Inference in MAnET. In proceedings of International Conference on Recent Trends in Information Technology, 2011, 402 - 406.
7. li, X; lyu, M. r. & liu, J. A trust model based routing protocol for secure ad hoc networks, In proceedings of IEEE Aerospace Conference, 2004, 1286-1295.
8. Maurer, u. Modeling a public-key infrastructure. In proceedings of European Symposium on Research in Computer Security, 2006, 325 - 350.
9. Pirzada, A; McDonald, C. & Datta, A. Dependable dynamic source routing without a trusted third party. Journal of Research and Practice in Information Technology, 2007, 39(1), 71 - 85.
Figure 5. throughput vs malicious nodes
Figure 6. Attacks detected vs malicious nodes.
Figure 4. time to first byte vs malicious nodes
6. ConClUsionThis paper proposes a novel routing algorithm
that relies on the trust of the neighbours to select a path in routing the protocols to the destination. A TBr algorithm is proposed which calculates the trust worthiness of the neighbors in the network and prioritizes a path based on the calculated trust value.
jk’Vªh; Kku usVodZ ds ek/;e ls Kku dk lgt ,dhdj.kseamless integration of Knowledge through national knowledge network
P. Geetha, letha M.M.*, Wilson K. Cherukulath, r. Sivakumar, Deepna n., and T. MukundanNaval Physical and Oceanographic Laboratory, Thrikkakara, Kochi 682 021, Kerala
*E-mail: [email protected]
lkjka”k
lwpuk vkSj lapkj çkS|ksfxdh ¼vkbZ lh Vh½ ds fodkl us iqLrdky;ksa dks okLrfod le; Kku çnku ds fy, l{ke cuk fn;k gSA fnuksafnu Kku çnku vkSj lk>k djus ds fy, vf/kd ls vf/kd ubZ rjhdks dh ek¡x c<+ jgh gSA bl c<+rh t:jr dks eglwl djrs gq, Hkkjr ljdkj rhoz xfr dk MkVk lapkj usVodZ LFkkfir fd;k gSa mnkgj.kr% jk’Vªh; Kku usVodZ ¼,u ds ,u½ us vuqla/kku laLFkkuksa] ç;ksx”kkykvksa] fo”ofo|ky;ksa dks tksM+dj muds Kku vkSj lg;ksxkRed vuqla/kku ¼dksykcksjsfVo fjlpZ½ dks lk>k fd;k gSaA bl ohfM;ks dsafær nqfu;k esa] lkekftd usVofdaZx lkbVksa ds ikl Kku dks lk>k djus ds fy, esa [kqn ds ohfM;ks miyC/k gSaA Lukrd] LukrdksÙkj vkSj ih,pMh Nk=ksa dks vkbZ vkbZ Vh] vkbZ vkbZ ,l bZ vkj vkSj vkb vkbZ ,l lh ls fu;fer vkHkklh ¼opZoy½ d{kk,a jk’Vªh; Kku usVodZ ds ek/;e ls miyC/k gSaA laxksf’B;k¡] lEesyu vkfn vkHkklh eksM esa vk;ksftr dh tk jgh gSa ftlls Kku çca/ku ds {ks= esa ,d Økafrdkjh ifjorZu vk;k gSaA bl “kks/ki= esa ys[kdksa us ,u ds ,u lqfo/kk ds ek/;e ls ukS&lsuk HkksSfrdh rFkk leqnz foKku ç;ksx”kkyk esa Kku vtZu vkSj lk>k djus ds rjhds dh O;k[;k djus dk ç;kl fd;k gSA
AbstrActThe developments in Information and Communication Technology (ICT) have enabled libraries to
provide real-time knowledge access. Day by day the demand for more and more innovative methods of accessing and sharing knowledge is increasing. realizing this growing need, Government of India established the high speed data communication network i.e. the national Knowledge network (nKn), connecting research institutes, laboratories, universities, etc. to share their knowledge and collaborative research. In a video centric world, social networking sites have their own video options to share the knowledge. regular classes for undergraduate, post graduate and PhD students are available from IITs, IISEr and IISc through nKn as virtual classes. Seminars, Conferences, etc. are also conducted in virtual mode making a revolutionary change in the field of knowledge management. In this paper, the authors attempt to explain the ways of knowledge acquisition and sharing through nKn facility in naval Physical and Oceanographic laboratory (nPOl).
Keywords: Firewall, national knowledge network, video conference, virtual classrooms, knowledge shharing
Bilingual International Conference on Information Technology: Yesterday, Today, and Tomorrow, 19-21 February 2015, pp. 190-195 © DESIDOC, 2015
1. IntroductIonThe libraries and information centres of any
research organization in the digital world have to adopt Information Communication Technologies (ICT) to collect organize and disseminate information. In nPOl library viz. Technical Information resource Centre (TIrC) Internet service was started way back in 1997 with dial-up connection from Videsh Sanchar nigam limited (VSnl). Subsequently, a series of internet plans such as Direct Internet Access Service (DIAS), Integrated Service Digital network (ISDn), etc were provided to users for internet access. TIrC professional also utilized this service for providing literature search service to scientists on project related topics. TIrC established BSnl broadband connection
in 2006 which made the e-journal access faster. In 2012, nPOl became a member of India’s prestigious national Knowledge network (nKn) and established its connection in TIRC and technical groups.
1.1 national Knowledge network
national Knowledge network (nKn) project is aimed at establishing a strong and robust internal Indian network which will be capable of providing secure and reliable connectivity. nKn is intended to connect all the knowledge and research institutions in the country using high bandwidth / low latency network. national Informatics Centre is the project execution agency for nKn in India and the project was approved in 2010. national Knowledge network (nKn) is multi-gigabit
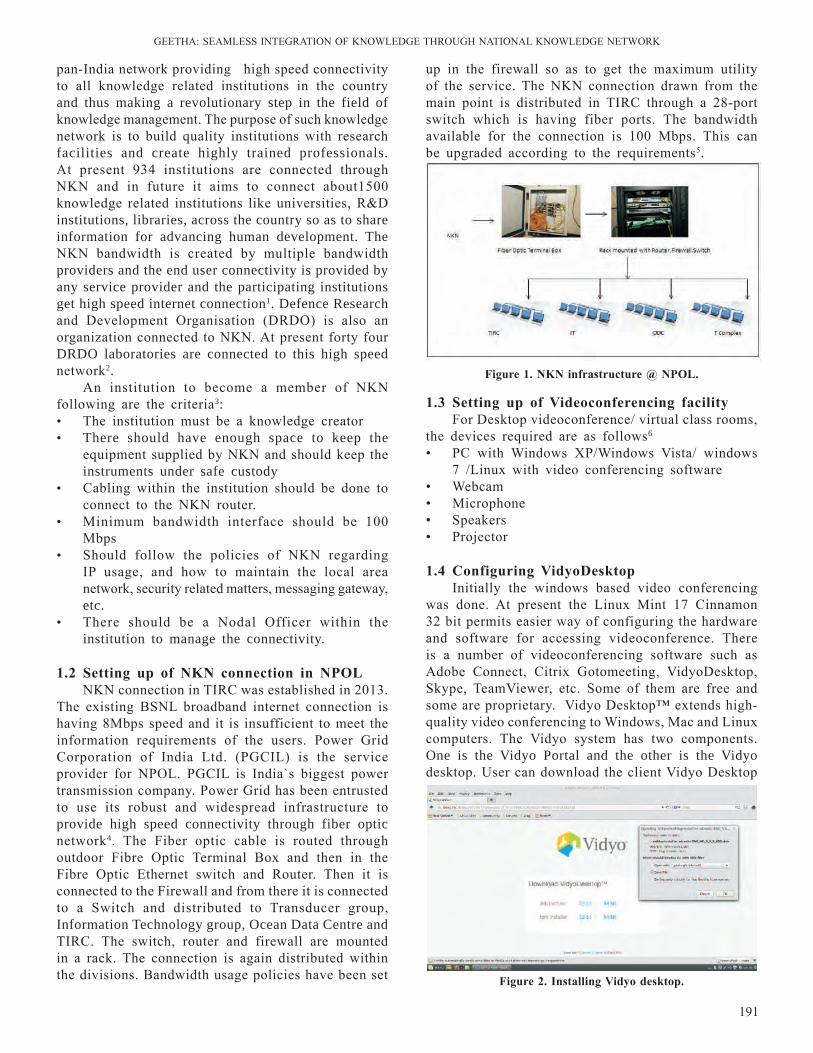
GEETHA: SEAMlESS InTEGrATIOn OF KnOWlEDGE THrOuGH nATIOnAl KnOWlEDGE nETWOrK
191
up in the firewall so as to get the maximum utility of the service. The nKn connection drawn from the main point is distributed in TIrC through a 28-port switch which is having fiber ports. The bandwidth available for the connection is 100 Mbps. This can be upgraded according to the requirements5.
pan-India network providing high speed connectivity to all knowledge related institutions in the country and thus making a revolutionary step in the field of knowledge management. The purpose of such knowledge network is to build quality institutions with research facilities and create highly trained professionals. At present 934 institutions are connected through nKn and in future it aims to connect about1500 knowledge related institutions like universities, r&D institutions, libraries, across the country so as to share information for advancing human development. The nKn bandwidth is created by multiple bandwidth providers and the end user connectivity is provided by any service provider and the participating institutions get high speed internet connection1. Defence Research and Development Organisation (DrDO) is also an organization connected to nKn. At present forty four DRDO laboratories are connected to this high speed network2.
An institution to become a member of nKn following are the criteria3:• The institution must be a knowledge creator• There should have enough space to keep the
equipment supplied by nKn and should keep the instruments under safe custody
• Cabling within the institution should be done to connect to the nKn router.
• Minimum bandwidth interface should be 100 Mbps
• Should follow the policies of nKn regarding IP usage, and how to maintain the local area network, security related matters, messaging gateway, etc.
• There should be a nodal Officer within the institution to manage the connectivity.
1.2 setting up of nKn connection in nPol nKn connection in TIrC was established in 2013.
The existing BSnl broadband internet connection is having 8Mbps speed and it is insufficient to meet the information requirements of the users. Power Grid Corporation of India ltd. (PGCIl) is the service provider for nPOl. PGCIl is India`s biggest power transmission company. Power Grid has been entrusted to use its robust and widespread infrastructure to provide high speed connectivity through fiber optic network4. The Fiber optic cable is routed through outdoor Fibre Optic Terminal Box and then in the Fibre Optic Ethernet switch and router. Then it is connected to the Firewall and from there it is connected to a Switch and distributed to Transducer group, Information Technology group, Ocean Data Centre and TIrC. The switch, router and firewall are mounted in a rack. The connection is again distributed within the divisions. Bandwidth usage policies have been set
Figure 1. nKn infrastructure @ nPol.
Figure 2. installing Vidyo desktop.
1.3 setting up of Videoconferencing facilityFor Desktop videoconference/ virtual class rooms,
the devices required are as follows6
• PC with Windows XP/Windows Vista/ windows 7 /linux with video conferencing software
• Webcam• Microphone • Speakers• Projector
1.4 Configuring VidyodesktopInitially the windows based video conferencing
was done. At present the linux Mint 17 Cinnamon 32 bit permits easier way of configuring the hardware and software for accessing videoconference. There is a number of videoconferencing software such as Adobe Connect, Citrix Gotomeeting, VidyoDesktop, Skype, TeamViewer, etc. Some of them are free and some are proprietary. Vidyo Desktop™ extends high-quality video conferencing to Windows, Mac and linux computers. The Vidyo system has two components. One is the Vidyo Portal and the other is the Vidyo desktop. user can download the client Vidyo Desktop

ArTIFICIAl InTEllIGEnCE AnD nETWOrK SECurITY
192
from the Vidyo Portal.7
To install the software some dependency problem had to be resolved by issuing command # apt-get install-f.
1.5 Vidyodesktop Conference toolbarBefore entering in to the video conference, we
should be thorough with the icons in the VidyoDesktop Conference Toolbar.
Before calling room status is also to be taken into account.
Figure 3. installing Vidyodesktop.Figure 6. setting up speaker, camera and microphone.
Figure 7. joining room.
Figure 9. room status8.Figure 5. installing Vidyodesktop.
Figure 4. installing Vidyodesktop.
After installation, a window will appear asking to fill the Portal address, username and password. Different category of users such as nIC official, nKn (educational Institutions under nKn), Judiciary, Financial Services, etc., have accounts on different portal. nPOl belongs to the nKn category.
We may also install the same software using the terminal also. For this, go to the directory where the package is downloaded and install it typing
# sudo dpkg -i <package name>.
After submitting the username, password details, a window with a list of contacts appear (Fig.5). Camera, Microphone and speaker are connected and configured (Fig.6). Testing of the devices can be done by “Join My room” (Fig.7)
Figure 8. the conference toolbar icons meaning8.
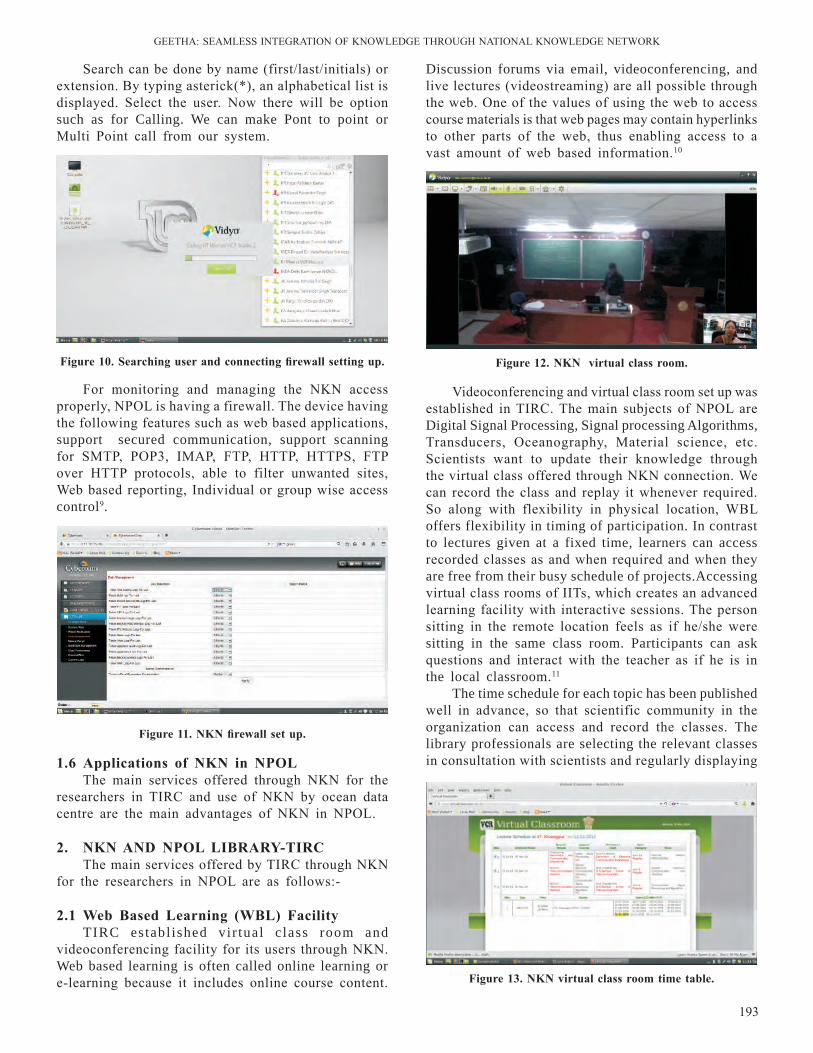
GEETHA: SEAMlESS InTEGrATIOn OF KnOWlEDGE THrOuGH nATIOnAl KnOWlEDGE nETWOrK
193
Search can be done by name (first/last/initials) or extension. By typing asterick(*), an alphabetical list is displayed. Select the user. now there will be option such as for Calling. We can make Pont to point or Multi Point call from our system.
Discussion forums via email, videoconferencing, and live lectures (videostreaming) are all possible through the web. One of the values of using the web to access course materials is that web pages may contain hyperlinks to other parts of the web, thus enabling access to a vast amount of web based information.10
Figure 10. searching user and connecting firewall setting up. Figure 12. nKn virtual class room.
Figure 11. nKn firewall set up.
Figure 13. nKn virtual class room time table.
Videoconferencing and virtual class room set up was established in TIrC. The main subjects of nPOl are Digital Signal Processing, Signal processing Algorithms, Transducers, Oceanography, Material science, etc. Scientists want to update their knowledge through the virtual class offered through nKn connection. We can record the class and replay it whenever required. So along with flexibility in physical location, WBl offers flexibility in timing of participation. In contrast to lectures given at a fixed time, learners can access recorded classes as and when required and when they are free from their busy schedule of projects.Accessing virtual class rooms of IITs, which creates an advanced learning facility with interactive sessions. The person sitting in the remote location feels as if he/she were sitting in the same class room. Participants can ask questions and interact with the teacher as if he is in the local classroom.11
The time schedule for each topic has been published well in advance, so that scientific community in the organization can access and record the classes. The library professionals are selecting the relevant classes in consultation with scientists and regularly displaying
For monitoring and managing the nKn access properly, nPOl is having a firewall. The device having the following features such as web based applications, support secured communication, support scanning for SMTP, POP3, IMAP, FTP, HTTP, HTTPS, FTP over HTTP protocols, able to filter unwanted sites, Web based reporting, Individual or group wise access control9.
1.6 Applications of nKn in nPolThe main services offered through nKn for the
researchers in TIrC and use of nKn by ocean data centre are the main advantages of nKn in nPOl.
2. nKn And nPol librArY-tirCThe main services offered by TIrC through nKn
for the researchers in nPOl are as follows:-
2.1 web based learning (wbl) Facility TIRC establ ished vir tual c lass room and
videoconferencing facility for its users through nKn. Web based learning is often called online learning or e-learning because it includes online course content.
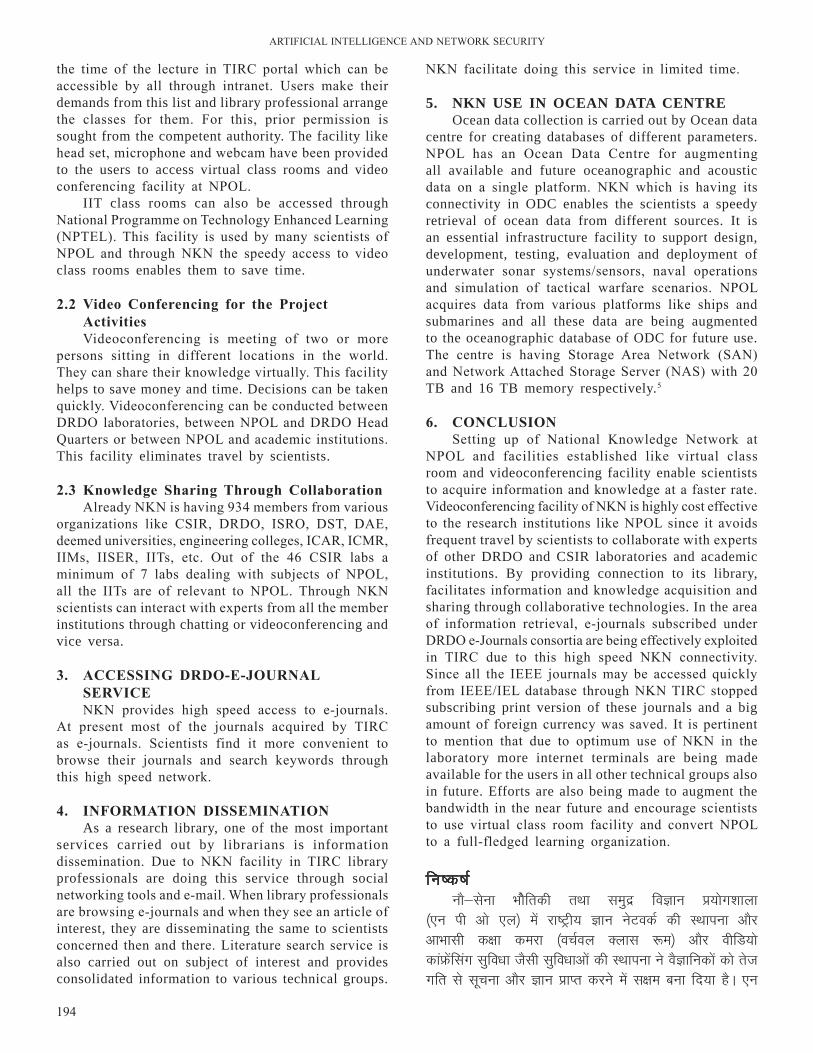
ArTIFICIAl InTEllIGEnCE AnD nETWOrK SECurITY
194
nKn facilitate doing this service in limited time.
5. nKn usE In ocEAn dAtA cEntrEOcean data collection is carried out by Ocean data
centre for creating databases of different parameters. nPOl has an Ocean Data Centre for augmenting all available and future oceanographic and acoustic data on a single platform. nKn which is having its connectivity in ODC enables the scientists a speedy retrieval of ocean data from different sources. It is an essential infrastructure facility to support design, development, testing, evaluation and deployment of underwater sonar systems/sensors, naval operations and simulation of tactical warfare scenarios. nPOl acquires data from various platforms like ships and submarines and all these data are being augmented to the oceanographic database of ODC for future use. The centre is having Storage Area network (SAn) and network Attached Storage Server (nAS) with 20 TB and 16 TB memory respectively.5
6. ConClUsion
Setting up of national Knowledge network at nPOl and facilities established like virtual class room and videoconferencing facility enable scientists to acquire information and knowledge at a faster rate. Videoconferencing facility of nKn is highly cost effective to the research institutions like nPOl since it avoids frequent travel by scientists to collaborate with experts of other DRDO and CSIR laboratories and academic institutions. By providing connection to its library, facilitates information and knowledge acquisition and sharing through collaborative technologies. In the area of information retrieval, e-journals subscribed under DrDO e-Journals consortia are being effectively exploited in TIrC due to this high speed nKn connectivity. Since all the IEEE journals may be accessed quickly from IEEE/IEl database through nKn TIrC stopped subscribing print version of these journals and a big amount of foreign currency was saved. It is pertinent to mention that due to optimum use of nKn in the laboratory more internet terminals are being made available for the users in all other technical groups also in future. Efforts are also being made to augment the bandwidth in the near future and encourage scientists to use virtual class room facility and convert nPOl to a full-fledged learning organization.
fu"d"k ZukS&lsuk HkksSfrdh rFkk leqnz foKku ç;ksx”kkyk
¼,u ih vks ,y½ esa jk’Vªh; Kku usVodZ dh LFkkiuk vkSj vkHkklh d{kk dejk ¼opZoy Dykl :e½ vkSj ohfM;ks dkaÝsaflax lqfo/kk tSlh lqfo/kkvksa dh LFkkiuk us oSKkfudksa dks rst xfr ls lwpuk vkSj Kku çkIr djus esa l{ke cuk fn;k gSA ,u
the time of the lecture in TIrC portal which can be accessible by all through intranet. users make their demands from this list and library professional arrange the classes for them. For this, prior permission is sought from the competent authority. The facility like head set, microphone and webcam have been provided to the users to access virtual class rooms and video conferencing facility at nPOl.
IIT class rooms can also be accessed through national Programme on Technology Enhanced learning (nPTEl). This facility is used by many scientists of nPOl and through nKn the speedy access to video class rooms enables them to save time.
2.2 Video Conferencing for the Project ActivitiesVideoconferencing is meeting of two or more
persons sitting in different locations in the world. They can share their knowledge virtually. This facility helps to save money and time. Decisions can be taken quickly. Videoconferencing can be conducted between DrDO laboratories, between nPOl and DrDO Head quarters or between nPOl and academic institutions. This facility eliminates travel by scientists.
2.3 Knowledge sharing through CollaborationAlready nKn is having 934 members from various
organizations like CSIr, DrDO, ISrO, DST, DAE, deemed universities, engineering colleges, ICAr, ICMr, IIMs, IISEr, IITs, etc. Out of the 46 CSIr labs a minimum of 7 labs dealing with subjects of nPOl, all the IITs are of relevant to nPOl. Through nKn scientists can interact with experts from all the member institutions through chatting or videoconferencing and vice versa.
3. ACCEssinG drdo-E-joUrnAl sErViCEnKn provides high speed access to e-journals.
At present most of the journals acquired by TIrC as e-journals. Scientists find it more convenient to browse their journals and search keywords through this high speed network.
4. inForMAtion dissEMinAtionAs a research library, one of the most important
services carried out by librarians is information dissemination. Due to nKn facility in TIrC library professionals are doing this service through social networking tools and e-mail. When library professionals are browsing e-journals and when they see an article of interest, they are disseminating the same to scientists concerned then and there. literature search service is also carried out on subject of interest and provides consolidated information to various technical groups.
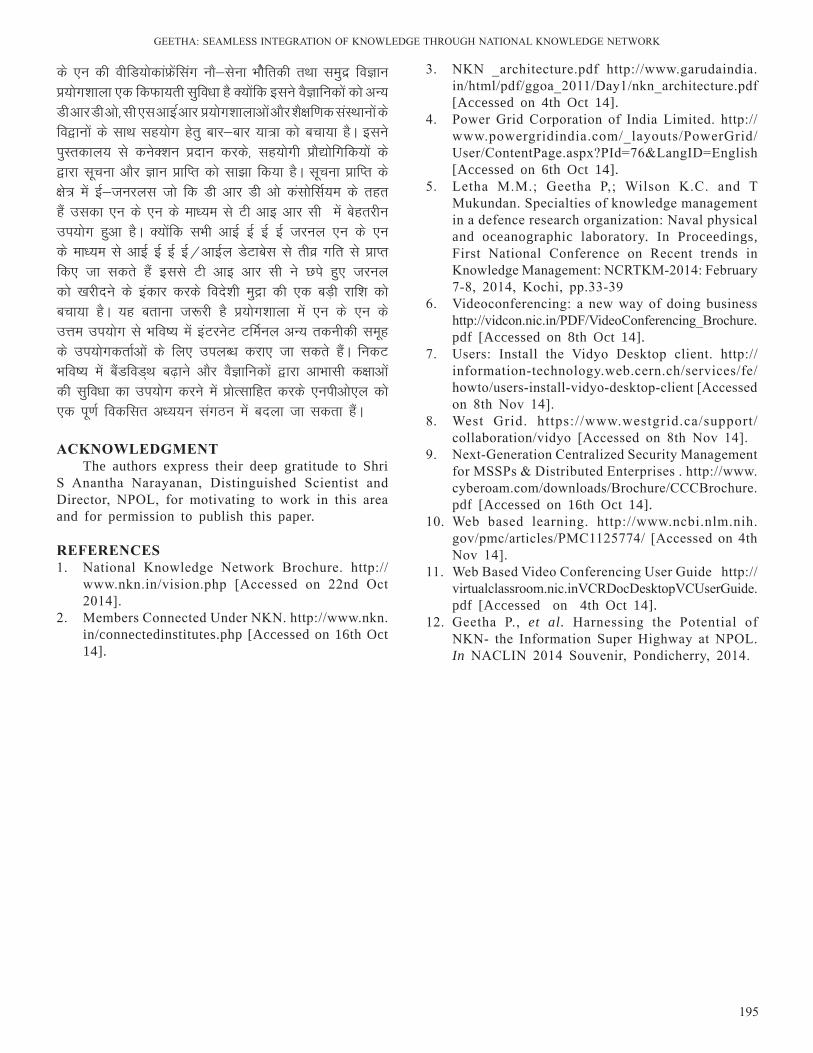
GEETHA: SEAMlESS InTEGrATIOn OF KnOWlEDGE THrOuGH nATIOnAl KnOWlEDGE nETWOrK
195
ds ,u dh ohfM;ksdkaÝsaflax ukS&lsuk HkksSfrdh rFkk leqnz foKku ç;ksx”kkyk ,d fdQk;rh lqfo/kk gS D;ksafd blus oSKkfudksa dks vU; Mh vkj Mh vks] lh ,l vkb Zvkj ç;ksx”kkykvksa vkSj “kS{kf.kd laLFkkuksa ds fo}kuksa ds lkFk lg;ksx gsrq ckj&ckj ;k=k dks cpk;k gSA blus iqLrdky; ls dusD”ku çnku djds] lg;ksxh çkS|ksfxfd;ksa ds }kjk lwpuk vkSj Kku çkfIr dks lk>k fd;k gSA lwpuk çkfIr ds {ks= esa bZ&tujyl tks fd Mh vkj Mh vks dalksflZ;Ek ds rgr gSa mldk ,u ds ,u ds ek/;e ls Vh vkb vkj lh esa csgrjhu mi;ksx gqvk gSA D;ksafd lHkh vkbZ bZ bZ bZ tjuy ,u ds ,u ds ek/;e ls vkbZ bZ bZ bZ@vkbZy MsVkcsl ls rhoz xfr ls çkIr fd, tk ldrs gSa blls Vh vkb vkj lh us Nis gq, tjuy dks [kjhnus ds badkj djds fons”kh eqæk dh ,d cM+h jkf”k dks cpk;k gSA ;g crkuk t:jh gS ç;ksx”kkyk esa ,u ds ,u ds mÙke mi;ksx ls Hkfo’; esa baVjusV VfeZuy vU; rduhdh lewg ds mi;ksxdrkZvksa ds fy, miyC/k djk, tk ldrs gSaA fudV Hkfo’; esa cSaMfoM~Fk c<+kus vkSj oSKkfudksa }kjk vkHkklh d{kkvksa dh lqfo/kk dk mi;ksx djus esa çksRlkfgr djds ,uihvks,y dks ,d iw.kZ fodflr v/;;u laxBu esa cnyk tk ldrk gSaA
ACKnowlEdGMEntThe authors express their deep gratitude to Shri
S Anantha narayanan, Distinguished Scientist and Director, nPOl, for motivating to work in this area and for permission to publish this paper.
rEFErEnCEs1. national Knowledge network Brochure. http://
www.nkn.in/vision.php [Accessed on 22nd Oct 2014].
2. Members Connected under nKn. http://www.nkn.in/connectedinstitutes.php [Accessed on 16th Oct 14].
3. nKn _architecture.pdf http://www.garudaindia.in/html/pdf/ggoa_2011/Day1/nkn_architecture.pdf [Accessed on 4th Oct 14].
4. Power Grid Corporation of India limited. http://www.powergridindia.com/_layouts/PowerGrid/user/ContentPage.aspx?PId=76&langID=English [Accessed on 6th Oct 14].
5. letha M.M.; Geetha P,; Wilson K.C. and T Mukundan. Specialties of knowledge management in a defence research organization: naval physical and oceanographic laboratory. In Proceedings, First national Conference on recent trends in Knowledge Management: nCrTKM-2014: February 7-8, 2014, Kochi, pp.33-39
6. Videoconferencing: a new way of doing business http://vidcon.nic.in/PDF/VideoConferencing_Brochure.pdf [Accessed on 8th Oct 14].
7. users: Install the Vidyo Desktop client. http://information-technology.web.cern.ch/services/fe/howto/users-install-vidyo-desktop-client [Accessed on 8th nov 14].
8. West Grid. https://www.westgrid.ca/support/collaboration/vidyo [Accessed on 8th nov 14].
9. next-Generation Centralized Security Management for MSSPs & Distributed Enterprises . http://www.cyberoam.com/downloads/Brochure/CCCBrochure.pdf [Accessed on 16th Oct 14].
10. Web based learning. http://www.ncbi.nlm.nih.gov/pmc/articles/PMC1125774/ [Accessed on 4th nov 14].
11. Web Based Video Conferencing user Guide http://virtualclassroom.nic.inVCrDocDesktopVCuserGuide.pdf [Accessed on 4th Oct 14].
12. Geetha P., et al. Harnessing the Potential of nKn- the Information Super Highway at nPOl. In nAClIn 2014 Souvenir, Pondicherry, 2014.

,;j xSi okbM ,jh;k usVodZ esa =qfV;ksa vkSj {kerkvksa dk çcU/ku % pqukSfr;ka vkSj eksckby ,tsaV i)fr
Fault and Performance Management in Air-gap wide Area organizational networks: Challenges and Mobile Agent Approach
Chaynika Taneja Defence Research & Development Organisation, New Delhi, India
E-mail: [email protected]
lkjka”k
u sVod Z d s vfro ` fgr c<r s vkdkj vk Sj tfVyrk d s dkj.k vkt ,d ljy] ekifu; vk Sj lalk/kuk lgk;d usVodZ çcU/ku ç.kkyh dh vko”;drk gS aA =qfV;ks a vk Sj {kerkvks a dk çcU/ku cgqr egRoiw.kZ {ks= gSaA ;g vkys[k ,;j xSi okbM ,fj;k usVodZ ds çca/ku esa gksus okyh pqukSfr;ksa vkSj eqíks dks çLrqr djrk gSA bl v/;;u ds vko``fr usVodZ dks ,d lefiZr usVodZ lapkyu dsUæ dh enn ls tk¡pk tkrk gSaA ,d fu/kkZfjr vof/k esa usVodZ dh miyC/krk] iSdsVks dh {kfr vkSj vkSj iSVuZ dk voyksdu fd;k x;kA ;g voyksdu ijaijkxr ,l ,u ,e ih vk/kkfjr usVodZ çcU/ku ç.kkyh ds mi;ksx ls fd;k x;kA blds ckn geus eksckby ,tsaV i)fr ij vk/kkfjr =qfV;kssa vkSj {kerk çca/ku ds fy, ,d e‚My dk çLrko fd;k gSA eksckby ,tsaVksa us dsaæh—r LVsfVd ,tsaV vk/kkfjr çca/ku e‚My dh dqN dfe;ksa dks nwj fd;k gSA çca/ku LVs”ku }kjk mRiUu ,tsaV ,d ckj lkjk usVodZ dk Hkze.k djrk gS] t:jh lwpuk ,df=r djrk gS vkSj ewy LVs”ku dks Hkst nsrk gSA çca/ku LVs”ku ds }kjk ,d iwoZ&fu/kkZfjr uhfr ls ,tsaV dh ;k=k dks lapkfyr fd;k tkrk gSA fdlh Hkh LFkkuh; çlaLdj.k dks mlh uksM ij fu’ikfnr fd;k tkrk gS ftlls e/;orhZ ifj.kke çs’k.k dh vko”;drk ugh jgrhA ;g çca/ku lwpuk ds fy, gksus okyh cSaMfoM~Fk [kir dks de dj nsrk gSA mijksDr ç.kkyh ijaijkxr i}fr ds laizs{k esa laizs’k.k izlqfIr dh rqyuk esa csgrj çn”kZu djrh gSA
AbstrActWith tremendous growth in the size and complexity of networks, the need for a light weight,
scalable and resource friendly network management has further increased. Fault and performance management have been the most crucial areas.The paper discussed the challenges and issues faced during the management of an air-gap wide area network. The network under study was monitored at a dedicated network operations centre. network availability and packet loss were observed over a stipulated period and patterns observed. The observations were made using a conventional SnMP-based network management system. Thereafter, we propose a model for fault and performance management based on the mobile agent approach. Mobile agents have been used to overcome some limitations imposed by the centralised static agent based management model. The agent once generated by the management station traverses the network, collecting the required information and returns to the base. The agent itinerary is governed by a predefined policy at the managing station. Any local processing is performed at the nodes itself, thereby, eliminating the need to transmit intermediate results. This reduces bandwidth consumption by management information. The system also performs better than the conventional system in terms of reduced latency.
Keywords: Router, mobile agent, fault management, performance management, availability, packet loss, SnMP, CMIP, polling, latency, bandwidth, core router, leaf node, routing aggregation point, wide area network
Bilingual International Conference on Information Technology: Yesterday, Today, and Tomorrow, 19-21 Feburary 2015, pp. 196-200 © DESIDOC, 2015
1. IntroductIonFault management is one of the most critical
functional areas of network management. Effective fault management can contribute towards increased network availability and timely resolution. Performance management improves resource utilisation and improves efficiency. Traditional network management approaches
based on the client server model exhibit performance issues as network expand. Heterogeneity of components and convergence of voice as well as data further aggravate the problem. A distributed approach to network management is therefore the logical step to help decentralize management control. Mobile agents, which are mobile code snippets, capable of traversing
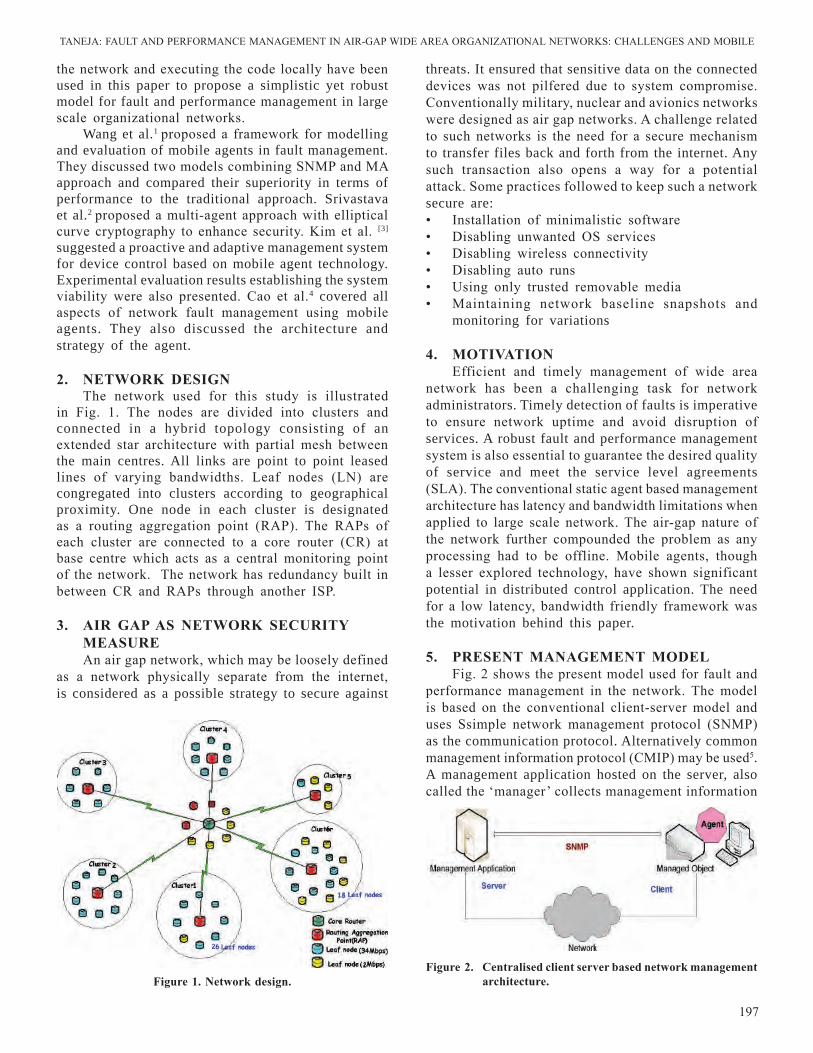
TAnEJA: FAulT AnD PErFOrMAnCE MAnAGEMEnT In AIr-GAP WIDE ArEA OrGAnIZATIOnAl nETWOrKS: CHAllEnGES AnD MOBIlE
197
threats. It ensured that sensitive data on the connected devices was not pilfered due to system compromise.Conventionally military, nuclear and avionics networks were designed as air gap networks. A challenge related to such networks is the need for a secure mechanism to transfer files back and forth from the internet. Any such transaction also opens a way for a potential attack. Some practices followed to keep such a network secure are:• Installation of minimalistic software • Disabling unwanted OS services• Disabling wireless connectivity• Disabling auto runs• using only trusted removable media• Maintaining network baseline snapshots and
monitoring for variations
4. MotiVAtionEfficient and timely management of wide area
network has been a challenging task for network administrators. Timely detection of faults is imperative to ensure network uptime and avoid disruption of services. A robust fault and performance management system is also essential to guarantee the desired quality of service and meet the service level agreements (SlA). The conventional static agent based management architecture has latency and bandwidth limitations when applied to large scale network. The air-gap nature of the network further compounded the problem as any processing had to be offline. Mobile agents, though a lesser explored technology, have shown significant potential in distributed control application. The need for a low latency, bandwidth friendly framework was the motivation behind this paper.
5. PrEsEnt MAnAGEMEnt ModElFig. 2 shows the present model used for fault and
performance management in the network. The model is based on the conventional client-server model and uses Ssimple network management protocol (SnMP) as the communication protocol. Alternatively common management information protocol (CMIP) may be used5. A management application hosted on the server, also called the ‘manager’ collects management information
the network and executing the code locally have been used in this paper to propose a simplistic yet robust model for fault and performance management in large scale organizational networks.
Wang et al.1 proposed a framework for modelling and evaluation of mobile agents in fault management. They discussed two models combining SnMP and MA approach and compared their superiority in terms of performance to the traditional approach. Srivastava et al.2 proposed a multi-agent approach with elliptical curve cryptography to enhance security. Kim et al. [3]
suggested a proactive and adaptive management system for device control based on mobile agent technology. Experimental evaluation results establishing the system viability were also presented. Cao et al.4 covered all aspects of network fault management using mobile agents. They also discussed the architecture and strategy of the agent.
2. nEtworK dEsiGn The network used for this study is illustrated
in Fig. 1. The nodes are divided into clusters and connected in a hybrid topology consisting of an extended star architecture with partial mesh between the main centres. All links are point to point leased lines of varying bandwidths. leaf nodes (ln) are congregated into clusters according to geographical proximity. One node in each cluster is designated as a routing aggregation point (rAP). The rAPs of each cluster are connected to a core router (Cr) at base centre which acts as a central monitoring point of the network. The network has redundancy built in between Cr and rAPs through another ISP.
3. Air GAP As nEtworK sECUritY MEAsUrEAn air gap network, which may be loosely defined
as a network physically separate from the internet, is considered as a possible strategy to secure against
Figure 1. network design.Figure 2. Centralised client server based network management
architecture.
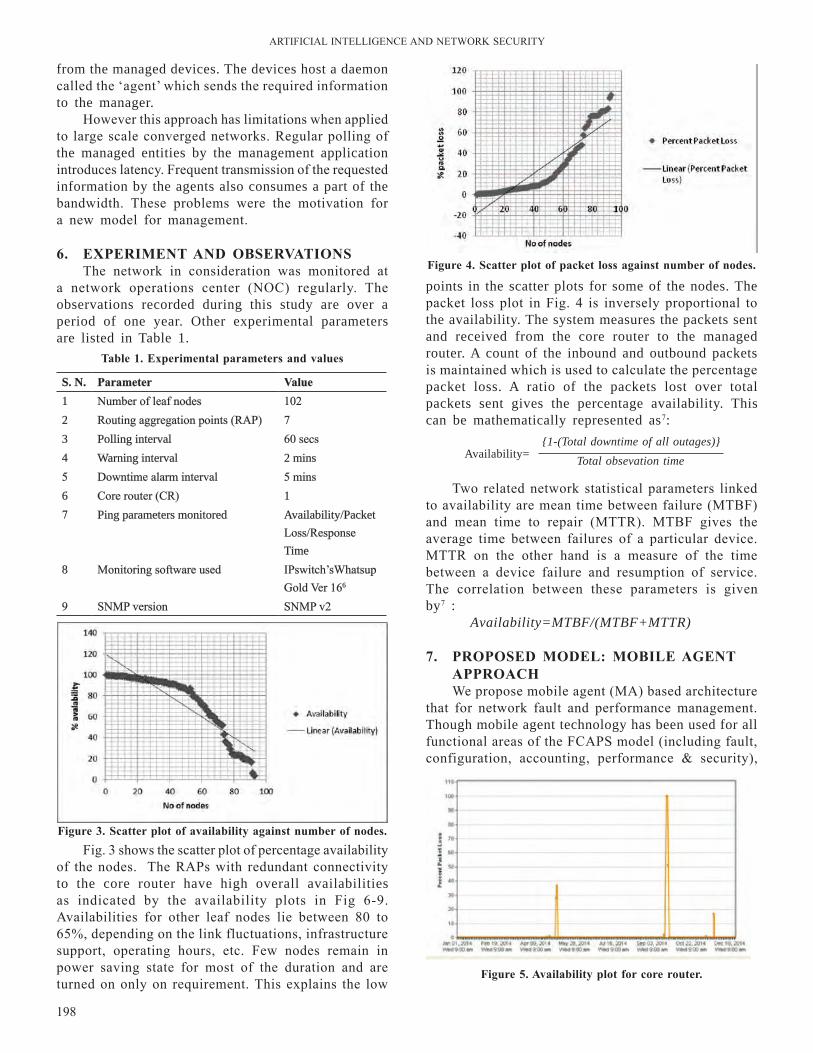
ArTIFICIAl InTEllIGEnCE AnD nETWOrK SECurITY
198
from the managed devices. The devices host a daemon called the ‘agent’ which sends the required information to the manager.
However this approach has limitations when applied to large scale converged networks. regular polling of the managed entities by the management application introduces latency. Frequent transmission of the requested information by the agents also consumes a part of the bandwidth. These problems were the motivation for a new model for management.
6. ExPEriMEnt And obsErVAtions
The network in consideration was monitored at a network operations center (nOC) regularly. The observations recorded during this study are over a period of one year. Other experimental parameters are listed in Table 1.
table 1. Experimental parameters and values
Figure 3. scatter plot of availability against number of nodes.
Figure 4. scatter plot of packet loss against number of nodes.
points in the scatter plots for some of the nodes. The packet loss plot in Fig. 4 is inversely proportional to the availability. The system measures the packets sent and received from the core router to the managed router. A count of the inbound and outbound packets is maintained which is used to calculate the percentage packet loss. A ratio of the packets lost over total packets sent gives the percentage availability. This can be mathematically represented as7:
s. n. Parameter Value1 number of leaf nodes 1022 routing aggregation points (rAP) 73 Polling interval 60 secs4 Warning interval 2 mins5 Downtime alarm interval 5 mins6 Core router (Cr) 17 Ping parameters monitored Availability/Packet
loss/response Time
8 Monitoring software used IPswitch’sWhatsup Gold Ver 166
9 SnMP version SnMP v2
Fig. 3 shows the scatter plot of percentage availability of the nodes. The rAPs with redundant connectivity to the core router have high overall availabilities as indicated by the availability plots in Fig 6-9. Availabilities for other leaf nodes lie between 80 to 65%, depending on the link fluctuations, infrastructure support, operating hours, etc. Few nodes remain in power saving state for most of the duration and are turned on only on requirement. This explains the low
Availability={1-(Total downtime of all outages)}
Total obsevation time
Figure 5. Availability plot for core router.
Two related network statistical parameters linked to availability are mean time between failure (MTBF) and mean time to repair (MTTr). MTBF gives the average time between failures of a particular device. MTTr on the other hand is a measure of the time between a device failure and resumption of service. The correlation between these parameters is given by7 :
Availability=MTBF/(MTBF+MTTR)
7. ProPosEd ModEl: MobilE AGEnt APProAChWe propose mobile agent (MA) based architecture
that for network fault and performance management. Though mobile agent technology has been used for all functional areas of the FCAPS model (including fault, configuration, accounting, performance & security),
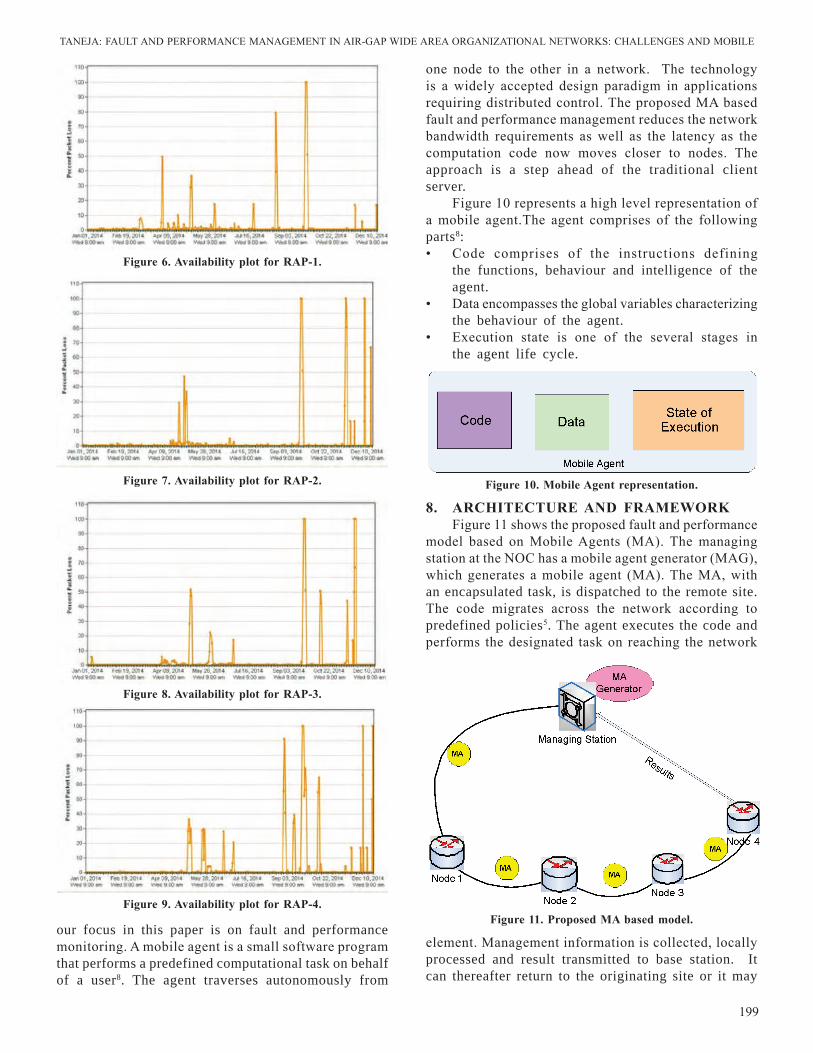
TAnEJA: FAulT AnD PErFOrMAnCE MAnAGEMEnT In AIr-GAP WIDE ArEA OrGAnIZATIOnAl nETWOrKS: CHAllEnGES AnD MOBIlE
199
one node to the other in a network. The technology is a widely accepted design paradigm in applications requiring distributed control. The proposed MA based fault and performance management reduces the network bandwidth requirements as well as the latency as the computation code now moves closer to nodes. The approach is a step ahead of the traditional client server.
Figure 10 represents a high level representation of a mobile agent.The agent comprises of the following parts8:• Code comprises of the instructions defining
the functions, behaviour and intelligence of the agent.
• Data encompasses the global variables characterizing the behaviour of the agent.
• Execution state is one of the several stages in the agent life cycle.
Figure 9. Availability plot for rAP-4.
Figure 6. Availability plot for rAP-1.
Figure 7. Availability plot for rAP-2.
Figure 8. Availability plot for rAP-3.
Figure 10. Mobile Agent representation.
our focus in this paper is on fault and performance monitoring. A mobile agent is a small software program that performs a predefined computational task on behalf of a user8. The agent traverses autonomously from
8. ArChitECtUrE And FrAMEworKFigure 11 shows the proposed fault and performance
model based on Mobile Agents (MA). The managing station at the nOC has a mobile agent generator (MAG), which generates a mobile agent (MA). The MA, with an encapsulated task, is dispatched to the remote site. The code migrates across the network according to predefined policies5. The agent executes the code and performs the designated task on reaching the network
Figure 11. Proposed MA based model.
element. Management information is collected, locally processed and result transmitted to base station. It can thereafter return to the originating site or it may
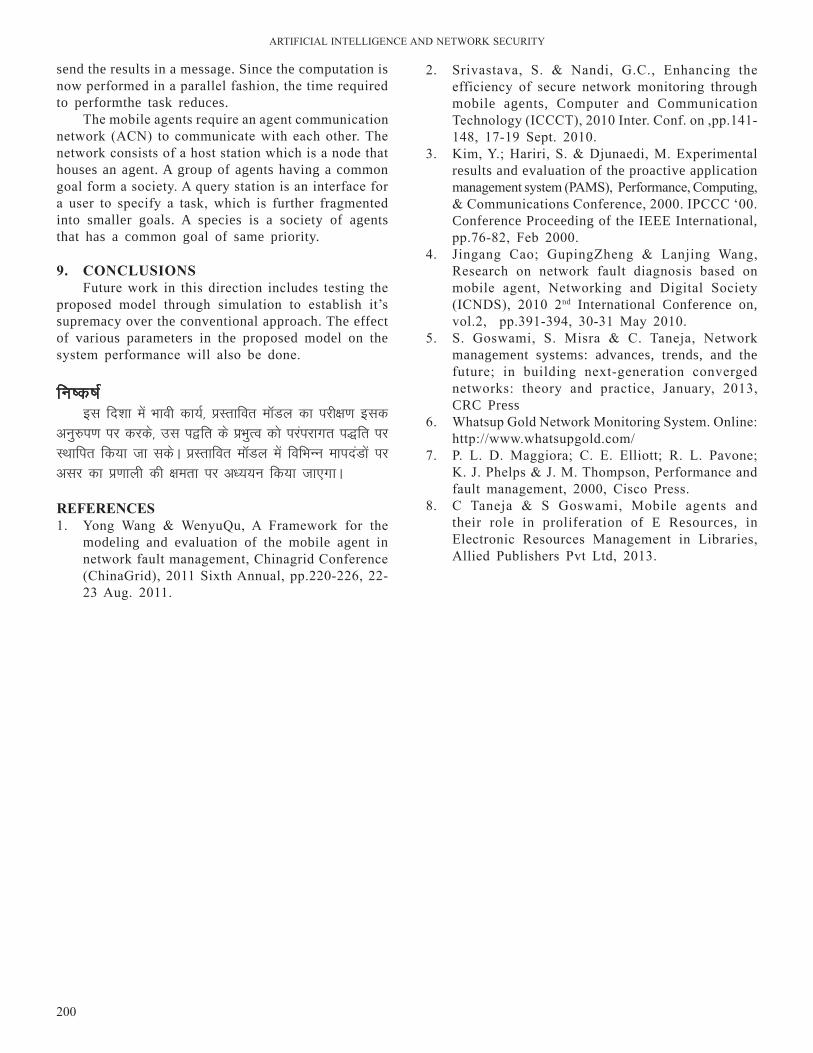
ArTIFICIAl InTEllIGEnCE AnD nETWOrK SECurITY
200
send the results in a message. Since the computation is now performed in a parallel fashion, the time required to performthe task reduces.
The mobile agents require an agent communication network (ACn) to communicate with each other. The network consists of a host station which is a node that houses an agent. A group of agents having a common goal form a society. A query station is an interface for a user to specify a task, which is further fragmented into smaller goals. A species is a society of agents that has a common goal of same priority.
9. ConClUsions Future work in this direction includes testing the
proposed model through simulation to establish it’s supremacy over the conventional approach. The effect of various parameters in the proposed model on the system performance will also be done.
fu"d"k Zbl fn”kk esa Hkkoh dk;Z] çLrkfor e‚My dk ijh{k.k bld
vuq#i.k ij djds] ml i}fr ds çHkqRo dks ijaijkxr i)fr ij LFkkfir fd;k tk ldsA çLrkfor e‚My esa fofHkUu ekinaMksa ij vlj dk ç.kkyh dh {kerk ij v/;;u fd;k tk,xkA rEFErEnCEs1. Yong Wang & Wenyuqu, A Framework for the
modeling and evaluation of the mobile agent in network fault management, Chinagrid Conference (ChinaGrid), 2011 Sixth Annual, pp.220-226, 22-23 Aug. 2011.
2. Srivastava, S. & nandi, G.C., Enhancing the efficiency of secure network monitoring through mobile agents, Computer and Communication Technology (ICCCT), 2010 Inter. Conf. on ,pp.141-148, 17-19 Sept. 2010.
3. Kim, Y.; Hariri, S. & Djunaedi, M. Experimental results and evaluation of the proactive application management system (PAMS), Performance, Computing, & Communications Conference, 2000. IPCCC ‘00. Conference Proceeding of the IEEE International, pp.76-82, Feb 2000.
4. Jingang Cao; GupingZheng & lanjing Wang, research on network fault diagnosis based on mobile agent, networking and Digital Society (ICnDS), 2010 2nd International Conference on, vol.2, pp.391-394, 30-31 May 2010.
5. S. Goswami, S. Misra & C. Taneja, network management systems: advances, trends, and the future; in building next-generation converged networks: theory and practice, January, 2013, CRC Press
6. Whatsup Gold network Monitoring System. Online: http://www.whatsupgold.com/
7. P. l. D. Maggiora; C. E. Elliott; r. l. Pavone; K. J. Phelps & J. M. Thompson, Performance and fault management, 2000, Cisco Press.
8. C Taneja & S Goswami, Mobile agents and their role in proliferation of E Resources, in Electronic resources Management in libraries, Allied Publishers Pvt ltd, 2013.
ok;jySl lsUlj usVodZ ds MsVk laxzg ds fMtkbu eqís vkSj rduhd% ,d losZ{k.k design issues and techniques on data Collection in wsns: A survey
Koppala Guravaiah*, and r. leela VelusamyDepartment of Computer Science and Engineering, National Institute of Technology, Tiruchirappalli
*E-mail: [email protected]
lkjka”k
gky ds o’kksaZ esa] ok;jysl lsalj usVodZ cgqr lkjs vuqç;ksxksa ds çHkkoh lek/kku çnku djrk gSA bl usVodZ dk çeq[k dk;Z i;kZoj.k dks vuqHko vkSj çklafxd MkVk dk laxzg djuk gSA MkVk laxzg vuqHkwfrr MkVk dks bdëk djds çlaLdj.k gsrq çs’kd lsalj ls vafre lsalj rd Hkstus dh çfØ;k dks dgrs gSaA MkVk laxzg lh/ks vafre lsalj rd ;k cgqr lkjs lsalj ls cus gq, ekxZ }kjk Hkstk tkrk gSA bl vkys[k esa] ok;jySl lsUlj usVodZ ds fy, fofHkUu MsVk laxzg jkÅfVax çksVksd‚y dk oxhZdj.k çLrqr fd;k x;k gSA jkÅfVax çksVksd‚y dk oxhZdj.k bu fMtkbu eqíksa ij vk/kkfjr gS ;s eqís gSa ÅtkZ] mez] foyacrk vkSj nks’k lgus dh {kerkA çHkkoh MsVk laxzg ds fy, fofHkUu rduhdsa tSls DyLVfjax] ,xjhxs”ku] usVodZ dksfMax] M;wVh lkbZfdfyax] MkjsD”kuy ,aVsuk] flad eksfcfyVh vkSj Økl ys;j lek/kkuks dh igpku dh xbZ gSaA bl vkys[k esa bu rduhdksa dh dfe;ka dh Hkh ppkZ dh xbZ gSaA
AbstrActIn recent years, Wireless Sensor networks have become the effective solutions for a broad range
of applications. The major task of this network is sensing the environment and collection of relevant data. Data collection is the process of collecting and forwarding the sensed data from the source sensor nodes to the sink for further processing. Data collection is done either directly or through multi-hop based routing. In this paper, classification of different data collection routing protocols for WSns is presented. Classification of routing protocols is done based on design issues such as energy, lifetime, latency, and fault tolerance. To accomplish effective data collection, various techniques, using clustering, aggregation, network coding, duty cycling, directional antennas, sink mobility, and cross layer solutions have been identified. The drawbacks of these techniques are discussed in this paper.
Keywords: routing protocols, Wireless sensor networks, data collection, energy efficiency, network lifetime, low latency, fault tolerance
Bilingual International Conference on Information Technology: Yesterday, Toady, and Tomorrow, 19-21 Feburary 2015, pp. 201-209 © DESIDOC, 2015
1. IntroductIonWireless sensor networks (WSns)1 are wide
spread networks containing a huge number of tiny and lightweight wireless sensor nodes. These networks are used to sense the environment by measuring the essential parameters such as sound, movements, vibration, pressure, temperature, humidity, etc. The sensor nodes in WSn are self organized and connected through wireless communication to the base station (BS) or sink, which collects the information from the sensor nodes. These sensor nodes work with resource constraints such as limited battery, computational communication capabilities. WSns are widely used in many applications1,2,3 such as medical applications, structural monitoring, habitat monitoring, intrusion detection, tracking for military purpose, home applications, etc. In major WSn applications, data collection is the most important functionality. In this, the source nodes sense the data from the sensing field and forwards
to the BS either directly or through multi-hop for further processing.
The routing protocols used in ad hoc and cellular networks are not suitable to WSns due to its design challenges such as node deployment, limited resource constraints (battery, processing power, and communication capabilities), and node mobility4. WSns are application specific networks deployed with large number of nodes for data gathering. Because of huge number of nodes global addressing is not achievable. The nodes located in the same area may generate redundant data and transmit the same. This leads to network traffic, bandwidth wastage, and more energy consumption. Finite battery power is the main resource constraint of a sensor node because battery replacement or recharge is not possible in WSn. Energy depletion in a sensor node leads to node failures. This has an impact on network lifetime and quality of data collected. Communication medium in WSn is wireless medium; this increases
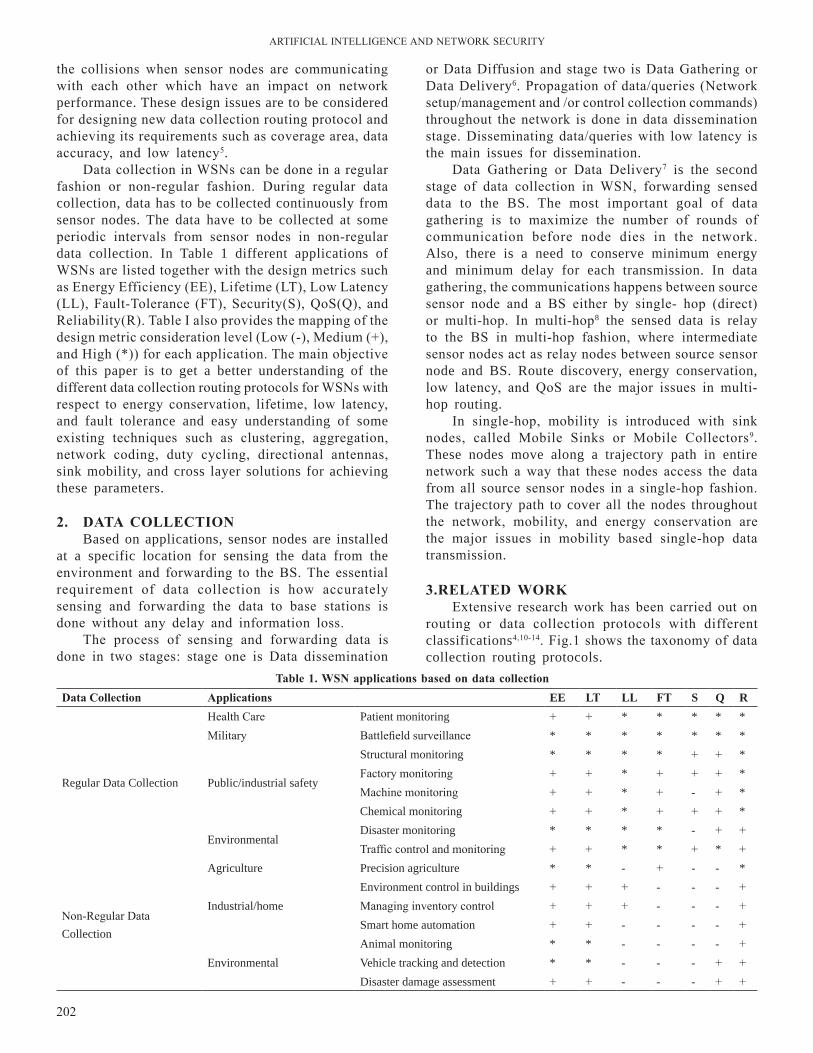
ArTIFICIAl InTEllIGEnCE AnD nETWOrK SECurITY
202
the collisions when sensor nodes are communicating with each other which have an impact on network performance. These design issues are to be considered for designing new data collection routing protocol and achieving its requirements such as coverage area, data accuracy, and low latency5.
Data collection in WSns can be done in a regular fashion or non-regular fashion. During regular data collection, data has to be collected continuously from sensor nodes. The data have to be collected at some periodic intervals from sensor nodes in non-regular data collection. In Table 1 different applications of WSns are listed together with the design metrics such as Energy Efficiency (EE), lifetime (lT), low latency (ll), Fault-Tolerance (FT), Security(S), qoS(q), and reliability(r). Table I also provides the mapping of the design metric consideration level (low (-), Medium (+), and High (*)) for each application. The main objective of this paper is to get a better understanding of the different data collection routing protocols for WSns with respect to energy conservation, lifetime, low latency, and fault tolerance and easy understanding of some existing techniques such as clustering, aggregation, network coding, duty cycling, directional antennas, sink mobility, and cross layer solutions for achieving these parameters.
2. dAtA CollECtion Based on applications, sensor nodes are installed
at a specific location for sensing the data from the environment and forwarding to the BS. The essential requirement of data collection is how accurately sensing and forwarding the data to base stations is done without any delay and information loss.
The process of sensing and forwarding data is done in two stages: stage one is Data dissemination
or Data Diffusion and stage two is Data Gathering or Data Delivery6. Propagation of data/queries (network setup/management and /or control collection commands) throughout the network is done in data dissemination stage. Disseminating data/queries with low latency is the main issues for dissemination.
Data Gathering or Data Delivery7 is the second stage of data collection in WSn, forwarding sensed data to the BS. The most important goal of data gathering is to maximize the number of rounds of communication before node dies in the network. Also, there is a need to conserve minimum energy and minimum delay for each transmission. In data gathering, the communications happens between source sensor node and a BS either by single- hop (direct) or multi-hop. In multi-hop8 the sensed data is relay to the BS in multi-hop fashion, where intermediate sensor nodes act as relay nodes between source sensor node and BS. Route discovery, energy conservation, low latency, and qoS are the major issues in multi-hop routing.
In single-hop, mobility is introduced with sink nodes, called Mobile Sinks or Mobile Collectors9. These nodes move along a trajectory path in entire network such a way that these nodes access the data from all source sensor nodes in a single-hop fashion. The trajectory path to cover all the nodes throughout the network, mobility, and energy conservation are the major issues in mobility based single-hop data transmission.
3.rElAtEd worK Extensive research work has been carried out on
routing or data collection protocols with different classifications4,10-14. Fig.1 shows the taxonomy of data collection routing protocols.
data Collection Applications EE lt ll Ft s Q r
Regular Data Collection
Health Care Patient monitoring + + * * * * *Military Battlefield surveillance * * * * * * *
Public/industrial safety
Structural monitoring * * * * + + *Factory monitoring + + * + + + *Machine monitoring + + * + - + *Chemical monitoring + + * + + + *
EnvironmentalDisaster monitoring * * * * - + +Traffic control and monitoring + + * * + * +
non-regular Data Collection
Agriculture Precision agriculture * * - + - - *
Industrial/homeEnvironment control in buildings + + + - - - +Managing inventory control + + + - - - +Smart home automation + + - - - - +
EnvironmentalAnimal monitoring * * - - - - +Vehicle tracking and detection * * - - - + +Disaster damage assessment + + - - - + +
table 1. wsn applications based on data collection
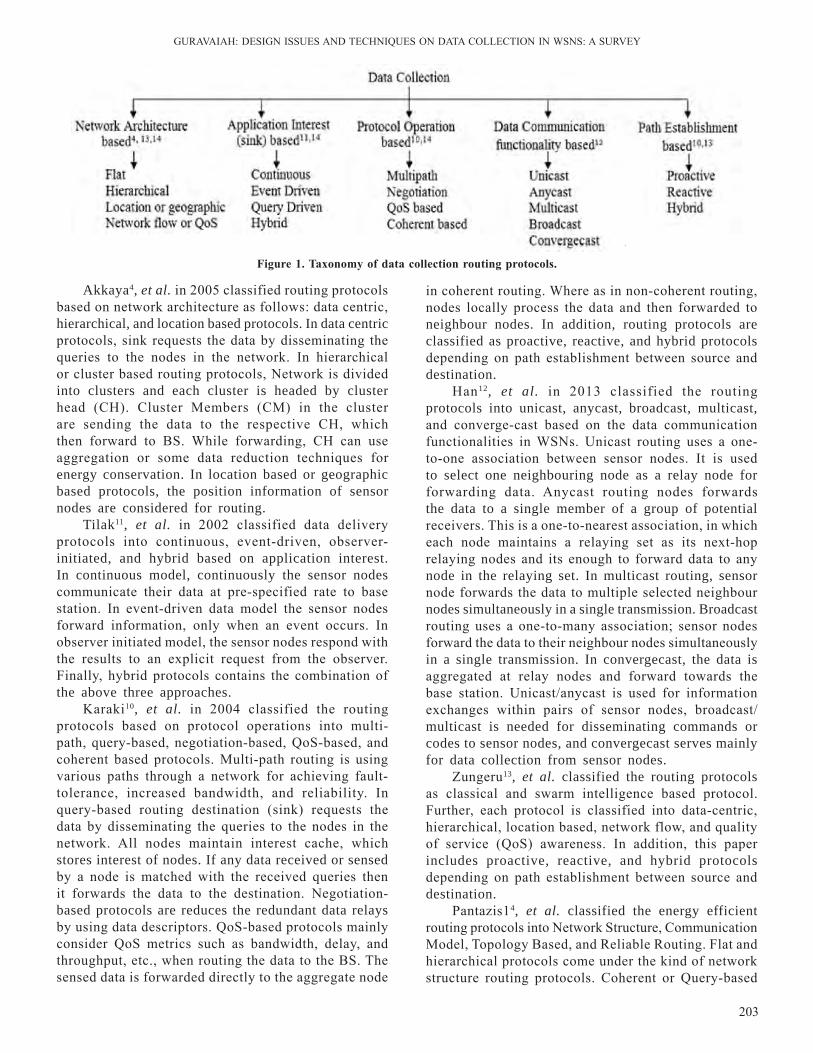
GurAVAIAH: DESIGn ISSuES AnD TECHnIquES On DATA COllECTIOn In WSnS: A SurVEY
203
Figure 1. taxonomy of data collection routing protocols.
Akkaya4, et al. in 2005 classified routing protocols based on network architecture as follows: data centric, hierarchical, and location based protocols. In data centric protocols, sink requests the data by disseminating the queries to the nodes in the network. In hierarchical or cluster based routing protocols, network is divided into clusters and each cluster is headed by cluster head (CH). Cluster Members (CM) in the cluster are sending the data to the respective CH, which then forward to BS. While forwarding, CH can use aggregation or some data reduction techniques for energy conservation. In location based or geographic based protocols, the position information of sensor nodes are considered for routing.
Tilak11, et al. in 2002 classified data delivery protocols into continuous, event-driven, observer-initiated, and hybrid based on application interest. In continuous model, continuously the sensor nodes communicate their data at pre-specified rate to base station. In event-driven data model the sensor nodes forward information, only when an event occurs. In observer initiated model, the sensor nodes respond with the results to an explicit request from the observer. Finally, hybrid protocols contains the combination of the above three approaches.
Karaki10, et al. in 2004 classified the routing protocols based on protocol operations into multi-path, query-based, negotiation-based, qoS-based, and coherent based protocols. Multi-path routing is using various paths through a network for achieving fault-tolerance, increased bandwidth, and reliability. In query-based routing destination (sink) requests the data by disseminating the queries to the nodes in the network. All nodes maintain interest cache, which stores interest of nodes. If any data received or sensed by a node is matched with the received queries then it forwards the data to the destination. negotiation- based protocols are reduces the redundant data relays by using data descriptors. qoS-based protocols mainly consider qoS metrics such as bandwidth, delay, and throughput, etc., when routing the data to the BS. The sensed data is forwarded directly to the aggregate node
in coherent routing. Where as in non-coherent routing, nodes locally process the data and then forwarded to neighbour nodes. In addition, routing protocols are classified as proactive, reactive, and hybrid protocols depending on path establishment between source and destination.
Han12, et al. in 2013 classified the routing protocols into unicast, anycast, broadcast, multicast, and converge-cast based on the data communication functionalities in WSns. unicast routing uses a one-to-one association between sensor nodes. It is used to select one neighbouring node as a relay node for forwarding data. Anycast routing nodes forwards the data to a single member of a group of potential receivers. This is a one-to-nearest association, in which each node maintains a relaying set as its next-hop relaying nodes and its enough to forward data to any node in the relaying set. In multicast routing, sensor node forwards the data to multiple selected neighbour nodes simultaneously in a single transmission. Broadcast routing uses a one-to-many association; sensor nodes forward the data to their neighbour nodes simultaneously in a single transmission. In convergecast, the data is aggregated at relay nodes and forward towards the base station. unicast/anycast is used for information exchanges within pairs of sensor nodes, broadcast/multicast is needed for disseminating commands or codes to sensor nodes, and convergecast serves mainly for data collection from sensor nodes.
Zungeru13, et al. classified the routing protocols as classical and swarm intelligence based protocol. Further, each protocol is classified into data-centric, hierarchical, location based, network flow, and quality of service (qoS) awareness. In addition, this paper includes proactive, reactive, and hybrid protocols depending on path establishment between source and destination.
Pantazis14, et al. classified the energy efficient routing protocols into network Structure, Communication Model, Topology Based, and reliable routing. Flat and hierarchical protocols come under the kind of network structure routing protocols. Coherent or query-based
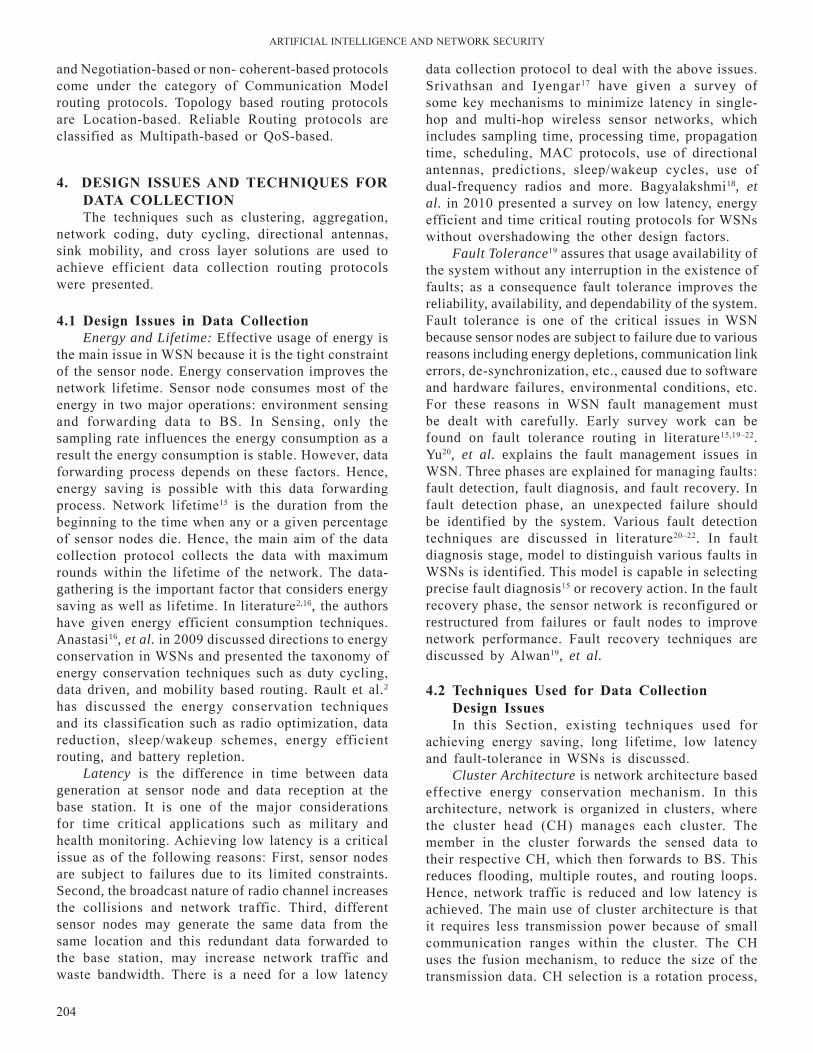
ArTIFICIAl InTEllIGEnCE AnD nETWOrK SECurITY
204
and negotiation-based or non- coherent-based protocols come under the category of Communication Model routing protocols. Topology based routing protocols are location-based. reliable routing protocols are classified as Multipath-based or qoS-based.
4. dEsiGn issUEs And tEChniQUEs For dAtA CollECtionThe techniques such as clustering, aggregation,
network coding, duty cycling, directional antennas, sink mobility, and cross layer solutions are used to achieve efficient data collection routing protocols were presented.
4.1 design issues in data CollectionEnergy and Lifetime: Effective usage of energy is
the main issue in WSn because it is the tight constraint of the sensor node. Energy conservation improves the network lifetime. Sensor node consumes most of the energy in two major operations: environment sensing and forwarding data to BS. In Sensing, only the sampling rate influences the energy consumption as a result the energy consumption is stable. However, data forwarding process depends on these factors. Hence, energy saving is possible with this data forwarding process. network lifetime15 is the duration from the beginning to the time when any or a given percentage of sensor nodes die. Hence, the main aim of the data collection protocol collects the data with maximum rounds within the lifetime of the network. The data-gathering is the important factor that considers energy saving as well as lifetime. In literature2,16, the authors have given energy efficient consumption techniques. Anastasi16, et al. in 2009 discussed directions to energy conservation in WSns and presented the taxonomy of energy conservation techniques such as duty cycling, data driven, and mobility based routing. Rault et al.2 has discussed the energy conservation techniques and its classification such as radio optimization, data reduction, sleep/wakeup schemes, energy efficient routing, and battery repletion.
Latency is the difference in time between data generation at sensor node and data reception at the base station. It is one of the major considerations for time critical applications such as military and health monitoring. Achieving low latency is a critical issue as of the following reasons: First, sensor nodes are subject to failures due to its limited constraints. Second, the broadcast nature of radio channel increases the collisions and network traffic. Third, different sensor nodes may generate the same data from the same location and this redundant data forwarded to the base station, may increase network traffic and waste bandwidth. There is a need for a low latency
data collection protocol to deal with the above issues. Srivathsan and Iyengar17 have given a survey of some key mechanisms to minimize latency in single-hop and multi-hop wireless sensor networks, which includes sampling time, processing time, propagation time, scheduling, MAC protocols, use of directional antennas, predictions, sleep/wakeup cycles, use of dual-frequency radios and more. Bagyalakshmi18, et al. in 2010 presented a survey on low latency, energy efficient and time critical routing protocols for WSns without overshadowing the other design factors.
Fault Tolerance19 assures that usage availability of the system without any interruption in the existence of faults; as a consequence fault tolerance improves the reliability, availability, and dependability of the system. Fault tolerance is one of the critical issues in WSn because sensor nodes are subject to failure due to various reasons including energy depletions, communication link errors, de-synchronization, etc., caused due to software and hardware failures, environmental conditions, etc. For these reasons in WSn fault management must be dealt with carefully. Early survey work can be found on fault tolerance routing in literature15,19–22. Yu20, et al. explains the fault management issues in WSn. Three phases are explained for managing faults: fault detection, fault diagnosis, and fault recovery. In fault detection phase, an unexpected failure should be identified by the system. Various fault detection techniques are discussed in literature20–22. In fault diagnosis stage, model to distinguish various faults in WSns is identified. This model is capable in selecting precise fault diagnosis15 or recovery action. In the fault recovery phase, the sensor network is reconfigured or restructured from failures or fault nodes to improve network performance. Fault recovery techniques are discussed by Alwan19, et al.
4.2 techniques Used for data Collection design issuesIn this Section, existing techniques used for
achieving energy saving, long lifetime, low latency and fault-tolerance in WSns is discussed.
Cluster Architecture is network architecture based effective energy conservation mechanism. In this architecture, network is organized in clusters, where the cluster head (CH) manages each cluster. The member in the cluster forwards the sensed data to their respective CH, which then forwards to BS. This reduces flooding, multiple routes, and routing loops. Hence, network traffic is reduced and low latency is achieved. The main use of cluster architecture is that it requires less transmission power because of small communication ranges within the cluster. The CH uses the fusion mechanism, to reduce the size of the transmission data. CH selection is a rotation process,
GurAVAIAH: DESIGn ISSuES AnD TECHnIquES On DATA COllECTIOn In WSnS: A SurVEY
205
which balances the energy saving in the network and improves the network lifetime. However, in cluster based routing protocols cluster head selection plays a critical role. BS location is not considering in these algorithms, which causes the hot spot problem in multi-hop WSns.
Data Aggregation in WSns is one of the important methods used to aggregate the raw data originated from multiple sources. In data aggregation schemes, nodes receive the data, minimized the amount of data by applying data aggregation techniques and then forwarded towards the base station. Average or minimum received data are only forwarded by the received node. Hence, it reduces the traffic in the network, with this low latency is achieved. However, the base station (sink) cannot be ensuring the accuracy of the aggregated data that has been received by it and also cannot recover the data.
Network Coding is a technique same as aggregation scheme, where the nodes of a network collects data from neighbours and combines them together for transmission. network Coding improves the network throughput, efficiency, reliability and scalability, as well as resilience to attacks and eavesdropping. network traffic in broadcast scenarios can be reduced by sending several packets as a single packet instead of sending individual packets at a time.
Duty Cycling has been considered one of the key energy conservation techniques in WSns. The radio transceiver of node is switching between sleep and active modes. In duty cycling, radio transceiver of node is move to sleep mode whenever it is not communicating to other nodes. This requires cooperative coordination between nodes when the nodes are working in duty cycling. In this, for communication to occur a node must wait until its neighbor nodes are awake. This increases sleep latency. With duty cycling multi-hop broadcasting is complex because all the neighbouring nodes are not active at the same time.
Directional antennas are used to send or receive signals with greater power in one or more directions at a time, allowing for improving performance in terms of throughput, increase in the transmission range and reduce interference from unwanted sources. reusing of bandwidth is also possible through these directional antennas. However, there is over head in the optimal antenna pattern selection and transmission power calculations. There is a need to consider hidden and exposed terminal problems.
Sink mobility is the energy efficient technique, where mobility is introduced with sink nodes. The mobile sinks travels across the network and collects the information from nodes with single-hop and then forward the same to BS. Sink mobility scheme increases the network lifetime by minimizing the
workload of nodes which are nearer to the BS. It improves scalability of the network by connecting the sparse network. In sink mobility scheme mobile data collector collects the data in single-hop fashion, this also improves reliability. However, the mobile node needs to maintain the trajectory path while moving. It requires synchronization between mobile collector and nodes. Mobility of mobile collector may cause packet loss while data gathering.
Cross layered approach in WSn is energy efficient when compared to layered approach. In the cross-layered approach, the protocol stack is considered as a single system instead of separate layers. Protocol state information is shared among the all layers for interaction across the protocol layers. Implementations of these protocols significantly affect the performance metrics such as energy consumption, latency, and system efficiency
5. ExistinG solUtionsExisting solutions for achieving energy efficiency,
longer lifetime, low latency, and fault-tolerance have been briefly explained in this Section. Most of these solutions are based on techniques such as clustering, aggregation, network coding, duty cycling, directional antennas, sink mobility, and cross layer solutions.
Peng23, et al. proposed flow partitioned unequal clustering algorithm (FPuC) to achieve longer network lifetime and coverage lifetime. FPuC consist of two phases: clustering and flow partition routing. In the clustering phase, cluster head is elected based on the sensor nodes that have more residual energy and larger overlapping degree. In the flow partition routing, cluster head gathers the data from each cluster node and aggregates this data as a packet and then forwards to the sink through gateway nodes depending on residual energy. The flow-partitioned routing algorithm consists two phases: data flow partitioning phase and relaying phase. In the data flow partitioning phase, the cluster head partitions data flow into several smaller packets and then distributes these packets to its gateway nodes. In relaying phase, every gateway node transmits received information to the next hop with minimum cost.
Wu24, et al. proposed ant colony algorithm for data aggregation (DAACA). This algorithm consists of three phases: initialization, packets transmissions, and operations on pheromones. In the transmission phase, dynamically select the next hop by estimating the residual energy and the amount of pheromones of neighbour nodes. Pheromones adjustments are performed after certain rounds of transmissions. In addition, four different pheromones adjustment strategies such as Basic-DAACA, elitist strategy based DAACA (ES-DAACA), Maximum & Minimum based DAACA
ArTIFICIAl InTEllIGEnCE AnD nETWOrK SECurITY
206
(MM-DAACA), and Ant Colony System based DAACA (ACS-DAACA) are used to prolong the network lifetime. However, in an initialization phase duplication packets are transmitted from sink nodes to initialize the network which leads to energy wastage in the network. Miao25, et al. discussed network coding to solve the problems in the Gradient-Based routing (GBr) scheme such as: (i) Broadcasting of interest messages by sink node
leads to duplication of packets, which causes more energy wastage in network and
(ii) Due to the unstable network environment in WSns, point to point message delivery leads to
data retransmissions in the network. network coding for GBr (GBr-nC) is proposed
for the energy efficient broadcasting algorithm, which is used to reduce network traffic. GBr-C and auto-adaptable GBr-C are two competing algorithms proposed to reduce the retransmission attempts.
Chandanala26, et al. proposed mechanism to save energy in flood-based WSns using two techniques called network coding and duty-cycling. First, they proposed a cross layer technique called DutyCode, in which a random low Power listening MAC protocol that implements packet streaming was designed. The authors have used elastic intervals for randomizing sleep
table 2. Comparison of existing solutions
Author Proposed Algorithm
techniques Used Metrics drawbacks
Peng23, et al. FPuC Clustering,Data aggregation, andMulti-hop
Energy, network lifetime, and coverage lifetime
Cluster Head selection overhead
Wu24, et al. DAACA Clustering,Data aggregation using ant colony optimization, and multi-hop
Energy, network lifetime Bottle neck problem nearer to sink node, Overhead in pheromones calculation at each round
Miao25, et al. GBr-nC,GBr-C, andauto-adaptable GBr-C
network coding andMulti-hop
network lifetime, Energy, and network traffic
Transmission delays in competing algorithm
Chandanala26, et al. DutyCode and ECS
network coding, duty-cycling, and multi-hop
Energy Transition between active and sleep states Overhead
Rout27, et al. ADAnC Clustering, network coding, duty-cycling, and multi-hop
Energy, low latency, and lifetime
Cluster maintenance overhead
qiu28, et al. IHr Clustering and multi-hop Fault tolerance and Energy
node unable to find CH leads reliability problems
Assi29 MSTP Data aggregation using compressive sensing, random projection, and multi-hop
Energy, network lifetime Computational overhead in MST calculations causes delay and wastage of energy
Ma30, et al. SHDGP Mobile collectors andSingle-hop
Energy, low latency, scalability, and throughput
High control overhead to maintain the trajectory path, Packet loss due to speed of data collector
Rout31, et al. ETD-DA Directional Antennas, network coding, andMulti-hop
Energy, throughput, and low latency
Overhead in optimal antenna pattern selection and transmission power calculations
Boukerche3, et al. PEq andCPEq
Clustering, aggregation, and publish/subscribemechanism
Fault tolerance, low-latency, and Energy
Traffic overhead
GurAVAIAH: DESIGn ISSuES AnD TECHnIquES On DATA COllECTIOn In WSnS: A SurVEY
207
cycles. To eliminate redundant packet transmissions an Enhanced Coding Scheme was proposed, which selects suitable network coding techniques for nodes.
Rout27, et al. intended an energy efficient adaptive data aggregation strategy using network coding (ADAnC) to improve the energy efficiency in a cluster based duty-cycled WSn. network coding reduces the traffic inside a cluster, and duty cycle is used in the cluster network to improve energy efficiency and network lifetime.
qiu28, et al. put forward a novel energy-aware cluster based fault tolerance mechanism, called the Informer Homed routing (IHr). IHr is the advanced version of Dual Homed routing (DHr) in which, each sensor node associated with two cluster heads called primary cluster head (PCH) and backup cluster head (BCH). Sensor node forwards the data to PCH instead of forwarding to both PCH and BCH at the same time. In each round BCH checks the liveness of the PCH using beacon message. If BCH not received beacon message from PCH within three rounds then BCH will announces to sensor nodes that the PCH has failed and transmit data to BCH. Hence, IHr provides an energy efficient fault tolerance mechanism to enhance the network lifetime. However, there is an overhead in cluster head selection process.
Assi29 proposed a data gathering method using the techniques Compressive Sensing (CS) and random projection to improve the lifetime of large WSns. To increase the network lifetime the authors opted the method, which evenly distribute the energy throughout the network instead of decreasing the overall network energy consumption. The authors proposed Minimum Spanning Tree Projection (MSTP), a new compressive data gathering method. MSTP creates a number of Minimum-Spanning-Trees (MSTs), each root node of the tree aggregates sensed data from the sensors using compressive sensing. A random projection root node with compressive data gathering helps in balancing the energy consumption load throughout the network. In addition, MSTP is extended to eMSTP, where the sink node acts as a root node for all MST. Ma30, et al. proposed a mobility based data gathering mechanism for WSns. A mobile data collector (M-collector) can be a mobile robot or a vehicle arranged with a transceiver and battery. The M-collector traverses through specific path and identify the sensor nodes, which comes within its transmission range while traversing. It then directly gathers the data from sensor nodes, and then forwards to the BS without delays. Hence, this enhances the lifetime of sensors. The main focus of the authors is to minimize the data-gathering tour distance called single- hop data-gathering problem (SHDGP). Rout31, et al. in 2012 presented an energy Efficient Triangular (regular) Deployment strategy with
Directional Antenna (ETD-DA) with 2-connectivity pattern. This pattern is achieved by orienting the directional antenna beam of a sensor in a particular direction towards the sink. Forwarding of data in the network is based on network coding for many-to-one traffic flow from sensors to sink. The proposed approach achieves better connectivity, energy efficiency, and robustness in delivering data to the Sink. Boukerche32, et al. proposed periodic, event-driven, and query-based protocol (PEq) and its variation CPEq. PEq is designed for achieving the following: low latency, high reliability, and broken path reconfiguration. CPEq is a cluster based routing protocol. The publish/subscribe mechanism is used to broadcast requests throughout the network. Table 2 compares the different solutions proposed, the techniques used and the metrics considered. Also the drawbacks of each solution are presented in Table 2. In the process of data gathering, energy conservation had been the main objective. The above discussed existing solutions for energy efficient data gathering concentrated on the following issues:
redundant data forwarding,• Data storm problem or congestion nearer to the • base station,Path selection in multi-hop routing, and • Data aggregation operations.• river Formation Dynamics (rFD)33,34 is one of
the heuristic optimization method and subset topics of Swarm intelligence. rFD is based on replicating how water forms rivers by eroding the ground and depositing sediments. These rivers joined into sea by selecting the shortest path based on altitudes of the land. So for rFD has not been used to solve the above issues in WSn. We would like to propose a solution to solve path selection in multi-hop routing using rFD. By applying rFD looping in multi-hop routing can be minimized. This work will be carried out shortly and results published.
6. ConClUsionIn this paper a detailed classification of data
collection routing protocols in WSn is discussed. Data collection routing protocols use various techniques, such as clustering, aggregation, network coding, duty cycling, directional antennas, sink mobility, and cross layered solutions. These techniques are discussed for accomplishing energy efficiency, long lifetime, low latency, and fault-tolerance. Finally, this paper presents a comparison among existing solutions available on data collection. Further, we would like to propose a novel effective data collection routing method by considering the drawbacks of each solution, which are discussed in this paper.

ArTIFICIAl InTEllIGEnCE AnD nETWOrK SECurITY
208
fu’d’k Zbl vkys[k esa] ok;jySl lsUlj usVodZ ds fy, fofHkUu
MsVk laxzg jkÅfVax çksVksd‚y dk foLr`r oxhZdj.k dh ppkZ dh xbZ gSaA MsVk laxzg jkÅfVax çksVksdky fofHkUu rduhdsa tSls DyLVfjax] ,xhjhxsku] usVodZ dksfMax] M;wVh lkbZfdfyax] MkjsD’kuy ,aVsuk] flad eksfcfyVh vkSj Økl ys;j lek/kkuks dk mi;ksx djrk gSaA bu rduhdksa dh ppkZ ÅtkZ n{krk] yach mez] de foyacrk] vkSj nksk lgu’khyrk ds y{;ksa dh iwfrZ gsrq dh xbZ gSaA var esa] ;g vkys[k MsVk laxzg ij miyC/k ekStwnk lek/kku ds chp ,d rqyuk çLrqr djrk gSA blds vykok] ge bl vkys[k esa uohu çHkkoh MkVk laxzg jkÅfVax fof/k dh] çR;sd lek/kku dh [kkfe;ksa dks /;ku esa j[krs gq, çLrkfor djrs gSa tks fd bl vkys[k esa of.kZr gSaA
rEFErEnCEs1. Akyildiz, Ian F., W. Su, Y. Sankarasubramaniam,
and E. Cayirci. Wireless sensor networks: a survey, Computer networks, 38, no.4, pp. 393-422, 2002.
2. Rault, Tifenn, Abdelmadjid Bouabdallah, and Yacine Challal. Energy efficiency in wireless sensor networks: A top-down survey, Computer networks, 67, pp. 104-122, 2014.
3. Yick, Jennifer, Biswanath Mukherjee, and Dipak Ghosal. Wireless sensor network survey, Computer networks, 52, 12, pp. 2292-2330, 2008.
4. K. Akkaya and M. Younis, A survey on routing protocols for wireless sensor networks, Ad Hoc networks, vol. 3, no. 3, pp. 325–349, 2005.
5. Gowrishankar, S., T.G.Basavaraju, Manjaiah D.H., and Subir Kumar Sarkar. Issues in wireless sensor networks, Proceedings of the World Congress on Engineering, Vol. 1, 2008.
6. Wang, Feng, and Jiangchuan liu., networked wireless sensor data collection: Issues, challenges, and approaches, IEEE Communications Surveys & Tutorials, vol. 13, no.4, pp. 673-687, 2011.
7. Murthy, C. Siva ram, and B. S. Manoj, Ad hoc wireless networks: Architectures and protocols, Pearson education, 2004.
8. Stavrou, Eliana, and Andreas Pitsillides, A survey on secure multipath routing protocols in WSns, Computer networks, 54.13, pp. 2215-2238, 2010.
9. Di Francesco, Mario, Sajal K. Das, and Giuseppe Anastasi, Data collection in wireless sensor networks with mobile elements: A survey, ACM Transactions on Sensor networks (TOSn) 8.1 article 7, 2011.
10. Al-Karaki, Jamal n., and Ahmed E. Kamal, routing techniques in wireless sensor networks: a survey, IEEE Wireless communications, 11.6, pp. 6-28, 2004.
11. Tilak, Sameer, nael B. Abu-Ghazaleh, and Wendi Heinzelman, A taxonomy of wireless micro-sensor network models, ACM SIGMOBIlE Mobile Computing and Communications review 6.2, pp. 28-36, 2002.
12. Han, Kai, et al. Algorithm design for data communications in duty-cycled wireless sensor networks: A survey, IEEE Communications Magazine, 51.7, 2013.
13. Zungeru, Adamu Murtala, li-Minn Ang, and Kah Phooi Seng, Classical and swarm intelligence based routing protocols for wireless sensor networks: A survey and comparison, Journal of network and Computer Applications, 35.5, pp. 1508-1536, 2012.
14. Pantazis, nikolaos A., Stefanos A. nikolidakis, and Dimitrios D. Vergados, Energy-efficient routing protocols in wireless sensor networks: A survey, IEEE Communications Surveys & Tutorials, 15.2, pp. 551-591, 2013.
15. Mahapatro, Arunanshu, and Pabitra Mohan Khilar, Fault diagnosis in wireless sensor networks: A survey. IEEE Communications Surveys & Tutorials, 15.4, pp. 2000-2026, 2013.
16. Anastasi, Giuseppe, et al. Energy conservation in wireless sensor networks: A survey, Ad Hoc networks, 7.3, pp. 537-568, 2009.
17. Srivathsan, S., and S. S. Iyengar, Minimizing latency in wireless sensor networks: a survey, Proceedings of the Third IASTED International Conference Advances in Computer Science and Technology, Vol. 92, 2007.
18. Baghyalakshmi, D., Jemimah Ebenezer, and S. A. V. Satyamurty, low latency and energy efficient routing protocols for wireless sensor networks, IEEE International Conference on Wireless Communication and Sensor Computing(ICWCSC), pp. 1-6, 2010.
19. Alwan, Hind, and Anjali Agarwal, A survey on fault tolerant routing techniques in wireless sensor networks, IEEE Third International Conference on Sensor Technologies and Applications (SEnSOrCOMM’09), pp. 366-371, 2009.
20. Yu, Mengjie, Hala Mokhtar, and Madjid Merabti, Fault management in wireless sensor networks, IEEE Wireless Communications, 14.6, pp.13-19, 2007.
21. liu, Hai, Amiya nayak, and Ivan Stojmenović., Fault-tolerant algorithms/protocols in wireless sensor networks, Guide to Wireless Sensor networks, Springer london, pp. 261-291, 2009.
22. De Souza, luciana Moreira Sá, Harald Vogt, and Michael Beigl, A survey on fault tolerance in wireless sensor networks, Interner Bericht. Fakultät für Informatik, universität Karlsruhe: Karlsruhe,
GurAVAIAH: DESIGn ISSuES AnD TECHnIquES On DATA COllECTIOn In WSnS: A SurVEY
209
Germany 2007.23. Peng, Jian, Xiaohai Chen, and Tang liu, A Flow-
Partitioned unequal Clustering routing Algorithm for Wireless Sensor networks, International Journal of Distributed Sensor network, 2014.
24. lin, Chi, et al., Energy efficient ant colony algorithms for data aggregation in wireless sensor networks, Journal of Computer and System Sciences, 78.6, pp. 1686-1702, 2012.
25. Miao, lusheng, et al., network coding and competitive approach for gradient based routing in wireless sensor networks, Ad Hoc networks, 10.6 pp. 990-1008, 2012.
26. Chandanala, roja, et al., On combining network coding with duty-cycling in flood-based wireless sensor networks, Ad Hoc networks. 11.1, pp. 490-507, 2013.
27. rout, rashmi ranjan, and Soumya K. Ghosh., Adaptive data aggregation and energy efficiency using network coding in a clustered wireless sensor network: An analytical approach, Computer Communications, 40, pp. 65-75, 2014.
28. qiu, Meikang, et al., Informer homed routing fault tolerance mechanism for wireless sensor networks, Journal of Systems Architecture, 59.4, pp. 260-270, 2013.
29. Ebrahimi, Dariush, and Chadi Assi, Compressive
data gathering using random projection for energy efficient wireless sensor networks, Ad Hoc networks, 16, pp. 105-119, 2014.
30. Ma, Ming, Yuanyuan Yang, and Miao Zhao, Tour planning for mobile data-gathering mechanisms in wireless sensor networks, IEEE Transactions on Vehicular Technology, 62.4, pp. 1472-83, 2013.
31. rout, rashmi ranjan, Saswati Ghosh, and Soumya K. Ghosh, Efficient data collection with directional antenna and network coding in wireless sensor networks, IEEE International Conference on Advanced networks and Telecommunications Systems (AnTS), pp. 81-86, 2012.
32. Boukerche, Azzedine, richard Werner nelem Pazzi, and regina Borges Araujo, Fault-tolerant wireless sensor network routing protocols for the supervision of context-aware physical environments, Journal of Parallel and Distributed Computing, 66(4), pp. 586-99, 2012.
33. rabanal, Pablo, Ismael rodríguez, and Fernando rubio. using river formation dynamics to design heuristic algorithms. unconventional Computation. Springer Berlin Heidelberg, pp. 163-177, 2007.
34. S. Hameed-Amin, H.S. Al-raweshidy, r. Sabbar-Abbas Smart data packet ad-hoc routing protocol. Computer networks, 2014, 62, pp.162–181,
lkbcj ;q)ç.kkyh% Hkkjr esa ekStwn eqís vkSj ifjçs{; Cyber warfare: issues and Perspectives in india
D S Bajia M.D.University, Rohtak (Haryana)
E-mail: [email protected]
lkjka”k
lkbcj lqj{kk vkSj lg;ksx dk eqík jk"Vªh; lqj{kk ds ,d egRoiw.kZ u, igyw ds :i esa mHkjk gSA ,d lajf{kr vkSj lqjf{kr lkbcj Lisl lqfuf'pr djuk ljdkjksa dh fnuksfnu c<+rh çkFkfedrk cu jgk gS D;ksafd vc ;g ekuo thou ds çR;sd igyw dks Nwrk gSA O;fä fo'ks"k vkSj fuxeksa ls ysdj jkT;ksa rd fgr/kkjdksa dh fofo/krk vfrçHkkoh lkbcj lqj{kk ifj–'; esa fofHkUu çkFkfedrkvksa vkSj ifjçs{;ksa esa lkeatL; cSBkuk ,d dfBu dk;Z cuk nsrh gSA lkbcj ;q)ç.kkyh esa vusd xfrfof/k;ka 'kkfey gksrh gSa tSls tklwlh vkSj fo/oal ds fy, dEI;wVj usVodZ dks gSd djukA iwoZ jk"Vªifr vkSj ç[;kr oSKkfud ,-ih-ts- vCnqy dyke us ,dckj dgk Fkk Þlkbcj ;q)ç.kkyh jk"Vªh; lqj{kk ds fy, lcls cM+k [krjk gS tks lqj{kk [krjs ds :i esa cSfyfLVd felkbyksa dks vegRow.kZ cuk nsxkAß
AbstrAct
The issue of cyber security and cooperation has emerged as an important new aspect of national security. Ensuring a safe and secure cyber space is a increasing priority for governments as it now touches almost every aspect of human existence. The diversity of stakeholders, from the individual, to corporations, to states makes reconciling of different priorities and perspectives in an overarching cyber security scenarios a difficult task. Cyber warfare includes a host of activities like hacking computer networks for espionage and sabotage. Former President and eminent scientist A.P. J. Abdul Kalam has once said that Cyber warfare is the biggest threat to national security which will render even the ballistic missiles insignificant as a security threat.
Keywords: Cyber warfare, cyber security, cyber space, India
Bilingual International Conference on Information Technology: Yesterday, Today, and Tomorrow, 19-21 February 2015, pp. 210-214© DESIDOC, 2015
1. IntroductIonWe observe in our day to day life that information
revolution has contributed a lot to make this world a better place to live, owing to its intrinsic characteristics of the exponential rate of growth in data processing speed and ability to share information knowledge across the globe in real time. It has impacted in many areas like freeing the society of oppressive state power, enabled the poor societies to modernize,enabled maintenance of international peace and also bringing in the revolution in Military Affairs (rMA).
Despite all these goodies provided by Information and communication technologies (ICT) it has also brought some incomprehensible challenges to the security community all over the world. The negative personality traits of individuals, groups under the cover of inherent anonymity of ICT are finding manifestation in cyber space. The uS governments national Strategy to Secure Cyberspace defined It as: ‘Cyberspace is composed of hundreds thousand of interconnected
computers, servers routers, switches and fabric optic cables that allow our critical infrastructure to work.
We can define national security in a simple way as 'the situation in which vital interests of nation are safe from substantial interference and disruption' and security as a 'condition in which states consider that there is no danger of military attack, political pressure or economic coercion'. Thus it can be concluded that security is not just a military issue, it relates to safeguarding the vital political, economic and strategic interests of the nation.
2. thE CYbEr world One of the landmarks in technological developments
in the electronic age is the rise of computers. The cyber technology has enabled the convergence of information and digital media, revolutionized the availability of information in terms of ease, efficiency, economy and wider and immediate reach with respect to any other form of media including the print media. The cyber

BAJIA: CYBEr WArFArE: ISSuES AnD PErSPECTIVES In InDIA
211
control individual or groups or a non state actor or a state could exercise over cyber space in its favor. It includes many dimensions like economic political and military dimensions.
Cyber warfare is a war waged in cyber space. It includes defending information and computer networks, deterring information attacks, as well as denying the adversary the ability to do the same. T can include offensive information operation mounted against an adversary, or even dominating information on the battlefield. It includes network penetration, DOS attacks on computers and networks, equipment sabotage through cyber space, and sensor jamming. It also includes manipulating trusted information.
The concept of world politics is essentially a struggle for power between nation-states. One school of thought introduced political realism, scholars like George Kennan and Hans Morgenthu emphasized the importance of military strength as index of state power. later on historians focused on how nation-state was increasingly finding itself challenged for events that originated beyond its borders and whose impact transcended national boundaries.
Today we find a clear impact on information and communication technologies on contemporary society. The reality of today is that the trans-national architecture of global information network has made territorial borders less significant; the application of information technologies to both the military and civilian realms leads to blurring of boundaries between the political, military and civilian spheres. The information revolution has dramatically increased the importance information in the strategic world, alongside existing traditional military capabilities and information domain has moved centre stage in combat operations.This has given rise to newforms of warfare. Many aspects of modern warfare are conducted so called “information operations”, with substantial implications for military affairs, politics and society as a whole.
The change in scope and space of warfare brings new challenges for protection of society. The development towards willful integration of civilian infrastructure and stronger shift towards deception of entire societies is alarming. Current trends such as the opening up of markets and liberalization of markets, globlisation processes that stimulate the cross-national interconnection of infrastructure and widespread access to telecommunication networks, are heightening the security requirements of infrastructure in countries across the world.
Certain observers find important tendencies toward convergence between military and civilian technologies, leading to the militiarisation of society at large and turning every conflict into information warfare and, as a consequence thereof, they point to the “sham humanitarian nature of information weapons.”
technology has given the power to store enormous amount of data and information into an insignificant equivalence of space memory, as compared to conventional methods along with easy access and availability. But with power comes the great responsibility.
The internet is the battle field for cyber war. It has a significant role to play in the global communication, research and development information exchange and business expansion. Internet is a labyrinth as the system is so interconnected and it commercialisation is to such an extent that it is impossible to define boundaries. And as so it has become the most used medium for cyber crimes.
To analyze the possible implications of current development on security we need to analyze from where and how the cyber power manifests itself. It is a very fuzzy (confused and not expressed clearly) concept. An attempt has been made to investigate the role of India as a developing nation state to secure cyber space by building up cyber deterrence capabilities in the form of plausible deniability and retaliation capability and further operationlising these capabilities through a comprehensive policy framework taking into account factors peculiar to India such as: the existing digital divide between developed and developing nations; coexistence of multiple socio-economic categories in the country; interdependence of cyber-space related resources among nation states; political will and vision on the information age.
Many noticeable incidents like; rome Air Force lab incident!1994), Kosovo War (1995) Estonia Crisis (1995) in which the computerized infrastructure of Estonia’s high-tech government began to fray, victimized by what experts in cyber security termed a coordinated “denial of service”(DOS) occurred. This led a new thinking among cyber experts and several interrelated points came to the fore.• Cyber warfare has the potential to bring a country
to an economic standstill.• Offensive actions in space can often provide a
great deal of deniability. This has come up as a smart weapon of choice for inflicting blows without involving in a direct war.
• Attack can be executed from almost anywhere in the world without consideration for strategic geographic buffers.
3. UndErstAndinG CYbEr sPACE And CYbEr PowErWhile cyber space is a bio-electric environment
that is literally universal, it exists wherever there are telephone wires, coaxial cables whereas cyber power is the capacity to wage cyber warfare. Cyber power is that intangible virtual asset which exists in cyber space and is directly proportional to the degree of

ArTIFICIAl InTEllIGEnCE AnD nETWOrK SECurITY
212
Information Communication Technologies has enabled a big change in Military Affairs Application of recent technological developments to the whole range of weapons systems, information gathering, communication and surveillance, regard the global information environment as having become a “battle Space in which technology is used to deliver critical and critical content in order to shape perceptions, manage opinions and control behaviour” . The hallmark of information revolution is it has transparency of events and the global immediacy of coverage, the concept of cyber warfare and information operations play an increasingly important role to the extent that, for some, “the most effective weapon in the battlespace is the information’s” dramatic development in networking technologies, networking infrastructure technologies, standardization of transmission protocols and data links that are enabling factors for the shift of military thinkers from platform-centric to network-centric concepts.
Vulnerabilities in both the military and civilian infrastructures are believed to be on the rise due to increasingly complex interdependencies. In addition, overall capacity of malicious actors to do harm is seen to be enhanced by inexpensive, ever more sophisticated, rapidly proliferating, and easy to use tools in cyber space. Sometimes experts reject the notion that cyber warfare is less violent than conventional conflicts.But the states will have to address potential threats to security that will likely to emerge as a result of an unequal distribution of soft power. Countries, regions and various groups already suffering economic hardship and political and cultural alienation are unlikely to feel the benefits of information technology easily.
4. orGAnisAtionAl sEtUP in indiAIn India, the primary approach was initially on
economic aspects with a gradual shift towards safeguarding national security The Information Technology Act of 2000 which came into force on October, 17, 2000 was enacted largely to facilitate e-commerce, with cyber crime referred to only in that context. The preamble of the IT Act only provided legal recognition for transaction carried out by means of electronic data interchange and other means of electronic communication. To remove some minor errors in IT Act-2000, the Act was again amended under Information Technology (remove of Difficulties) Order 2002 and passed on September 19,2002 further amendments were done in 2008 and the Act was called as Information Technology (Amendment) Act, 2008.
As of now in India there are more than 12 agencies that are listed as ‘stakeholders’ in cyber security in a recent draft national Cyber Security Policy document released on 26 March 2011. real oversight over cyber
security could be said to be distributed among the ministries of communication and technology, home affairs, and defence and office of the national Security Advisor. On the military side also there is a profusion of agencies ranging from the Corps of Signals, to the Army Computer Emergency response Team (A-CErT), to the IT departments of various headquarters and the Integrated Defence Staff (IDS). The Defence Information Assurance and research Agency (DIArA) has been made the nodal Agency mandated to deal with cyber security related issues of Tri Services and Ministry of Defence’ according to a statement made by defence minister in parliament in 2010. Some agencies like national Disaster Management Authority (nDMA) of Indiapay a peripheral role and many of the sectoral CERTS are yet to come up.
Ensuring the security and integrity of the networks that connect the critical infrastructure is of paramount importance since crucial sectors such as financial, energy, transportation, and telecommunications are connected through cyber networks. The horizontal and vertical expansion of the user base has meant that while the threats and vulnerabilities inherent in the internet and the cyberspace networks might have remained more or less the same, as before, the probability of disruption has grown apace with the rise of number of users.
In an era where interconnected networks are critical arteries of human existence and knowledge has become a valuable commodity, this represents serious threats to national security.Therefore in addition to securing critical infrastructure and government information networks, government also have to ensure the public at large that cyber networks on which they have become increasingly dependence.
Indian Computer response Team (Cert-In) is the most important constituent of India’s Cyber community. national information security assurance programme (nISAP) is formulated for protection of Government and Critical infrastructures. The highlights of nISAP are:(a) Government and critical infrastructure should have
a security policy and create a point of contact.(b) Mandatory for organizations to implement security
control, and report any security incident in Cert-In.(c) Cert-In to create a panel of auditor for IT security.
All organizations to be subject to third party audit from this panel once a year.
(d) Cert-In to be reported about security compliance on periodic basis by the organizations.
5. indo-Us CYbEr sECUritY
CooPErAtionThis forum was set up in 2001, high power
delegations from both sides met and several initiatives
BAJIA: CYBEr WArFArE: ISSuES AnD PErSPECTIVES In InDIA
213
were announced. An information Sharing and Analysis Centre was set up for better cooperation in anti hacking measures. Indo-uS cyber security cooperation has become a staple discussion of high level summits and subsequent joint statements in the recent past.
The uS and Indian government are intensifying on-going cooperation to address national security issues from the increasing interdependency of our critical network information systems involved in out sourcing business processing, knowledge management, software development and enhanced inter-government interaction.
On the Indian side, the emphasis has been on capacity building and research and development, and the form has provided opportunity to initiate a number of programmes in this direction. One area there is considerable scope is for cooperation is in Research and Development which, in context of cyber Security, can run the full gamut from removing loopholes in the hardware and software to creating tools law and enforcement and intelligence agencies and for, military purposes.
Today as the time between the requirement, availability andcollection of information continues to shrink, possessing, exploiting and manipulating information has become an essential part of warfare; those actions have become critical to the outcome of contemporary and future conflicts. The ability to observe, orient, decide, and act (OODA) faster operational skills faster and more effectively than an adversary is a key part of the equation.
Information warfare is split in offensive and defensive modes. Offensive activities include: military deception measures designed to mislead the enemy by manipulation, distortion and falsification of evidence. The defensive modes include activities such as operation security which denies knowledge of operation to the enemy. There by decreasing the effect of enemy’s deception activities. The defensive side of information warfare is concerned with the protection and integrity of data, people within the systems.
Military Deception occurs when someone manipulates perception. Deception guides the enemy into making mistakes by presenting false information, images or statements.The aim of Military Deception (MIlDEC) is to execute actions to mislead adversary military-decision makers with regard to friendly military capabilities. One of the changes brought about by networking and the information available on the net is that sophisticated attacks which were the domain of net savvy personnel now can be carried out by kids for fun or by armatures. As systems become ever more complicated, even sophisticated attackers are heading this way. Hacking is progressively becoming simpler while defence is becoming unimaginably complex.
According to the Information operation; Doctrine,Tactics Techniques, and Procedures Field Manual 3-13 of The united States Army, the threat source of network operations are as follows.
• Hackers• Insiders• Activist non-state actors• Foreign IT activities• Information fratricideThe boundaries among these threats and among
capability level are indistinct, and it is often difficult to discern the origin of any particular incident.So the issue of cyber security has added a new dimension to the national security. Information operations have become extremely important aspect of war fighting. They are integral to the successful execution of military operations as they ensure efficient and effective application of lethal and non-lethal effects on battlefield to exploit or degrade the threats ability to retaliate.
6. ConClUsionThus, cyber warfare is a totally new aspect of
technology at war. The biggest handicap is dealing in cyber warfare is that so little is known, except for a few scientists whether in uniform or not. And yet every citizen needs to understand at least in general,if not specific scientific detail the implications of using modern communication and information systems ranging from the telephone to the internet.
fu’d’k Zbl le; Hkkjr esa bysDVª‚fud Lo:i esa O;kikj ,d lcls
vf/kd Qyrk&Qwyrk {ks= gSA ;g fiNys dqN o"kksaZ ls O;kikj ds {ks= esa Økafrdkjh ifjorZu ykus okyk jgk gS vkSj vc bl ij bldk vR;f/kd çHkko gSA blus cgqewY; le; vkSj ÅtkZ dh cpr dj cgqr gn rd vke vkneh ds thou esa lq/kkj fd;k gSA okf.kT; ds {ks= esa lwpuk çkS|ksfxdh ds mi;ksx ls cM+h ek=k esa le;] ÅtkZ vkSj dkxth dk;ksaZ dh cpr gksrh gSA 'kklu&O;oLFkk esa vkbZVhlh us yksxksa dks vius ?kjksa esa cSBdj ekml ds ,d fDyd ij ljdkj ls lacaf/kr lHkh dk;ksaZ dks vklkuh ls djus ds!
biblioGrAPhY1. Gibson Willam. neuromances, 1984,271p.2. White House. The national strategy to secure
cyber space, Washington, DC, February 2003, P.vii.
3. Sharma M K. Cyber Warfare the power of unseen Knowledge World, new Delhi, 2012 pp. 4-6
4. Joint Chief of staff “Joint Doctrine for Information Operations”, Joint Paper, Washington, 2006; pp.3-13.
ArTIFICIAl InTEllIGEnCE AnD nETWOrK SECurITY
214
5. rumsfeld, Information Operation roadmap, October 30, 2013.
6. 4 Kurutikikh, “Information Challenges to Security”, International Affairs, (1999) 45/2.
7. Dan Kuehl, ‘ in Edwin I. Arimstead, ed.,Information Operations: The hard reality of soft power washington, 2002, pp.4
8. Mussington David, Concepts for Enhancing Critical Infrastructure Protection: Relating Y2k to CIP research and Development, Santa Monica, 2002.
9. Samuel Charien, Strategic Analysis 2011 35 (5), pp. 770-780.
10. htpp://ids.nic.in/art-by-offids/Cyber%Security%20% /India20%
11. The Joint Statement issued at the end of President Obama’s visit to India in 2010 Available at htpp://meaindia.nic.in/mystart.php?id= 100016632 and pid 1849.
12. uS-India Security Forum :Enhanced cooperation to safeguard shared information infrastructures, 3 March, 2006.
13. Poudwal Sanjay, network Centric Warfare: how we think, see and fight in the information age Knowledge World; new Delhi, 2012.

,dh—r lkbcj lqj{kk ds fy, baVsfytsaV ,dh—r e‚My intelligent Unified Model for integrated Cyber security
rajesh Kumar Meena* and Indu Gupta Laser Science and Technolgy Centre, Delhi-110 054 , India
*E-mail:[email protected];
lkjka”k
bl i= dk eq[; mís”; ,d ubZ baVsfytsaV ,dh—r lkbcj lqj{kk ç.kkyh e‚My ¼vkbZ;qfeDl½ dk losZ]leh{kk vkSj fo”ys’k.k djuk gSA ;g e‚My nqfu;k dks lkbcj [krjksa ls eqä djus ,oa lgh çHkkoh <ax ls lek/kku djus es l{ke gksxkA ,d ,dh—r lkbcj lqj{kk rduhd e‚My ds fMtkbu esa ekSfyd leL;k dsaæh; fu;a=.k vkSj iwjh ç.kkyh dh fuxjkuh djuk gSaA ikjaifjd lkbcj lqj{kk e‚My orZeku lkbcj i;kZoj.k es Hkfo’; ds lkbcj [krjksa ,o leL;kvksa dks laHkkyus] lekIr djus ,oa mi;ksxdrkZvks dh vko”;drkvksa dks iwjk djus es l{ke ugh gSA dqN miyC/k rduhdksa dks ,dh—r dj ,d lkFk dke ,oa lg;ksx djus ls vkbZ;qfeDl e‚My l{ke ,oa mi;ksxh cu tkrk gSA bl e‚My es dqN baVsfytsaV rduhdks dks lek;ksftr fd;k x;k gS tks fd Hkfo’; dh lkbcj lqj{kk ds fy, vko”;d gSa] tSls dh ,QlhMhl] lkbcj lqj{kk j.kuhfr] vxyh ih<+h ?kqliSB dk irk yxkus ç.kkyh ¼,uth&vkbZMh,l½] Hkfo’; iwoZ psrkouh ç.kkyh ¼bZMCY;w,l½] rduhdh&lkekftd lkbcj lqj{kk psrkouh ç.kkyh ¼Vh,llh,l½] ckny MkVkcsl lsokvksa] lkbcj ;q) ¼lhMCY;w½ j.kuhfr;k¡] [krjk fo”ys’kd] lkbcj lqj{kk fo”ys’kd] lkbcj lsalj] vxyh ih<+h ,dh—r [krjk çca/ku ¼,uth&;qVh,e½] vxyh ih<+h&bUVªqtu tkap ç.kkyh ¼,uth&vkbZMh,l½ vkfnA bl i= ds }kjk fofHkUu ekStwnk lkbcj lqj{kk baVsfytsaV rduhdks vkSj ifí~r;ks dk losZ{k.k] leh{kk vkSj fo”ys’k.k fd;k x;k gSA ;g e‚My lkbcj Lisl es ,d etcwr] fo”oluh;] dq”ky vkSj Rofjr mÙkjnk;h ifj.kke nsus esa l{ke gksx] ftldh Js’Brk ls lkbcj lqj{kk lapkyu ds nkSjku csgrj ifj.kke vkSj mi;ksxh lgk;rk fey ldsxhA
AbstrActThe objective of this paper is to survey, review and analyse a new Intelligent unified Model for
Integrated Cyber Security (IuMICS) System. This model can work effectively and accurately to find solutions of cyber threats to create free cyber world. The fundamental problem in designing a unified model is integration of cyber security technique which can, centrally control and monitor the complete system. The traditional methods of cyber security models are not able to handle current and future cyber threat problems of cyber environment to fulfil up to end user requirements. Some techniques become more useful when the work along other IuMICS system. This model can include such intelligent techniques that are required for the future cyber world like FCDS, cyber security strategies, next generation- intrusion detection system (nG-IDS),future early warning system (EWS), technical-socio cyber security (TSCS) warning system, Cloud Database services, Cyber Warfare (CW) Strategies, Threat Evaluator, Cyber Security Analysts ,Cyber Sensors, next Generation- unified Threat Management (nG-uTM),next Generation –Intrusion Detection System(nG-IDS), etc. In this paper a survey has been carried out to review and analyse the various existing cyber security intelligent techniques and strategies. It will result in a robust, reliable, efficient and quick responsive system to assist during the cyber security operation and approach to obtain better results in the cyberspace superiority.
Keywords: Cyber security strategies, federated cyber defence system, technical-socio cyber security warning system and early warning system
Bilingual International Conference on Information Technology: Yesterday, Today, and Tomorrow, 19-21 February 2015, pp. 215-220 DESIDOC, 2015
1. IntroductIonThe most common problems in the cyber world
are cyber threats. Most of the cyber defence techniques are working in more effective manners in day to day activity, but the rate of cyber threats growth is
faster compared to cyber defence solutions. A nuclear war may not be on the immediate horizon, but a cyber war has the potential to bring major cities worldwide to a standstill and affecting everything like banking, traffic networks, hospitals and even

ArTIFICIAl InTEllIGEnCE AnD nETWOrK SECurITY
216
electricity grids etc. Hence this reflects the need of integration of all techniques in a single platform for controlling and monitoring purpose. Federated cyber defence system (FCDS) was developed to minimize the number of threats and attacks that may affect the domain connected to the open network. Being technical-socio in nature, successful information systems security process relies on two pillars: technology and humans. In cyber space, information security is not limited within a local entity; it is in a working group, an organization or even a whole nation. If the security process is to be managed effectively and efficiently, then it is expected to have better understanding about the security mechanisms. Harmful activities cover broad spectrum of cyber threats and potential cyber attacks. Everybody relies on networks, and nothing can operate unless the networks function correctly. They can influence communication links, data resources, their integrity, confidentiality and availability [1]. General Douglas MacArthur once said “There is no security on this Earth, there is only opportunity”.
2. iUMiCs APProAChThe main objective of the work is to review,
analyse, design and develop an Intelligent unified Model for Integrated Cyber Security (IuMICS) Monitoring and Controlling System that integrates a number of intelligent techniques, they collect time-series situation information, perform intrusion detection, keep track of event evolution, characterize and identify security events so that corresponding defence actions can be taken timely and is an effective manner.
Different organizations have different expectations on the tasks and responsibilities of the previously developed cyber security model. The differences are generally concerning the management and supervision of the responsibilities. The key and primary role of the IuMICS across the organization would be the same and include the following responsibilities:- • Collecting and filtering computer network traffic. • Analyzing the traffic for suspicious or unexpected
behaviour. • Discovering system misuse and unauthorized
system access. • reporting to the appropriate parties and working
to prevent future attacks. • Centrally monitoring the whole system.
IuMICS consult the output of an automated system that provide them with network data that have been automatically collected and filtered to focus the IuMICS attention on data most likely to contain clues regarding attacks. These automated systems such as firewalls, border gateways, intrusion detection systems (IDSs), anti-virus systems and system administration tools produce log files and metadata
that the IuMICS can inspect to detect suspicious activities. The IuMICS activities classified into three categories; reactive, proactive and security quality management. The Intrusion Detection Systems may have the automated incidence response in place for some kinds of attacks, but for others the onus is on the analyst to respond. Alerts from Intrusion Detection System (IDS).The cyber security IuMICS get filtered raw data from the Intrusion Detection System (IDS). This data could be network packet traffic, net flow data or host-based log data. The IDS makes initial filtering decisions based on the pre-loaded attack signatures. This process can include decisions about tuning data collection and IDS signatures to catch all new related data. The response to an incident can be automated by the IDS itself; it can be done by the cyber security analyst.
Various Cyber Panel technologies from the different areas have been integrated into an advanced cyber defence system known as Integrated Cyber Panel System [2].The Integrated Cyber Panel System is designed to provide cyber awareness and control for survivability. This system helps the operator defend the enclave against cyber attacks and maintain mission-required enclave functionality. The successful executions of many commercial, scientific, and military applications require timely, reliable, and accurate information flow in cyber space to support online transactions and remote operations. Developing effective security monitoring mechanisms to provide cyber situation awareness has become an increasingly important focus within the network research and management community. It integrates technologies and concepts in the integrated cyber security control panel areas [3].
Many infrastructure components have been developed to facilitate integration of these technologies including high-level models of the network mission and common underlying communication tools. Cyber Panel technologies provide either awareness or response functionality. The technology of Cyber Security Monitoring (CSM) is based on observation, experience, and classification of attacks, vulnerabilities, and countermeasures. The system of Integrated Cyber Security (ICS) protection should be invariant to a device through which a user gets an access to ICS.
A result of a security model has been proposed based on the analysis of contemporary cyber threats and cloud technologies, thereby creating a safe virtual environment for the end user. This model is invariant to operating system platform and device performance, because of using security services in the cloud aimed to analyze and detect a cyber threat, as well as provides a range of services such as vaccination, certification and tokenization to ensure certain level of user’s security.

MEEnA: InTEllIGEnT unIFIED MODEl FOr InTEGrATED CYBEr SECurITY
217
the increased cyber threats and crimes. Some of the techniques are reviewed and analysed, which are very efficient, reliable, highly accurate, robust, and quick in response in the future cyber world. The major techniques and components of the IuMICS model are shown in Figure 1.
The unified approach for cyber security monitoring system is required in the current time, because this approach is a combination of all robust and reliable solutions of the integrated cyber security techniques. Despite reasonable investment in security tools and technologies, several successful attacks have proved that something more needs to be done to effectively detect and manage the growing numbers of threats. One of the major causes is the lack of synergy between various functions and tools within the security domain itself and across layers including physical, network, user, data and application security. Hence, in order to evolve a successful response strategy for cyber security, it is important to look at all these layers holistically and leverage the information available at every layer to develop an overall threat and response model.
In order to ensure a unified and holistic approach to cyber security, it’s important to convert data available across various layers and across different functions/tools into real actionable intelligence. The various critical steps are involved in building a unified cyber security monitoring and management frameworks as risk awareness, environment awareness, identity and data awareness, business awareness, content visibility and hidden intelligence etc. Most importantly, for any cyber security solution to work, it must be managed effectively and evolve continuously.
The overall cyber security framework should be capable of being upgraded and flexible enough to add new innovations, scale to meet new technology architecture like cloud, mobility and evolve to counter the latest emerging threats. This model is unique, more powerful, reliable, robust, and efficient as compared to previously developed cyber security models. This in fact, presents drastic change in cyber security against the cyber threats. This model can create a cyber threat free environment in cyber space using the various techniques and algorithms for both static and mobile networks. Countering focused and targeted attacks requires a focused cyber security strategy. Organizations need to take a proactive approach to ensure that they stay secure in cyber space and adopt a robust cyber security strategy which should be implemented through the IuMICS. IuMICS covers the best functions of cyber security like, risk driven, holistic, adaptable, efficient, collaborative etc. The main drawback of the today’s cyber security model is its high computation cost and poor accuracy.
3. iUMiCs tEChniQUEs Analysis and evaluation of the techniques of cyber
security and their results are depicted. Cyber security techniques protect our network from the outside and inside cyber threats and attacks. These techniques are becoming more useful in day to day activity with
Figure 1. intelligent unified model for integrated cyber security (iUMiCs) monitoring system.
3.1 Cloud database server The goal of the simulation is to create the need
and opportunity for team interaction. They interact, by exchanging information both verbally and electronically, for making decisions individually and as a team. These interactions are continuously logged on to the database server in real time monitoring.
3.2 threat Evaluator The threat evaluator primarily classifies the classes
of threats. The threat classes are identified to categorise the functionality of the threats and the results are sent to master controlling authority. The main purpose of the master controller is to query an attack scenario, the events associated with that particular attack scenario, along with some associated noise events from the database. The Master Controller distributes the events from the database to each of the cyber security host system on per role basis.
4. CYbEr sECUritY AnAlYst
Cyber security analyst in the context of this simulation refers to the participants. Each participant is assigned a role name corresponding to his/her specialization. The cyber security analyst also plays a major role in IuMICS model.
5. CYbEr sEnsorsCyber physical systems (CPSs) are the integration
of abstract computations and physical processes, in which sensors, actuators, and embedded devices
ArTIFICIAl InTEllIGEnCE AnD nETWOrK SECurITY
218
are networked to sense, monitor, and control the physical world. The CPS reflects the decision to the physical world through a sequence of control processes.
6. nExt GEnErAtion–UniFiEd thrEAt MAnAGEMEnt (nG-UtM)uTMs represent all-in-one security appliances that
carry a variety of security capabilities including firewall, VPn, gateway anti-virus, gateway anti-spam, intrusion prevention, content filtering, bandwidth management, application control, data leakage prevention(DlP), deep packet inspection(DPI) and centralized reporting. The official definition of uTM is “Products that include multiple security features integrated into one box”. Identity-based security solutions can secure every move at work, at home and at travel – from the network gateway to the endpoints. It binds security with your identity and works as a private security guard. It is the first uTM that embeds user identity in the firewall rule matching criteria, offering instant visibility and proactive controls over security breaches and eliminating dependence on IP Addresses. uTM unique layer 8 technology treats uSEr as the 8th layer in the network stack [4]. uTM identity-based security offers a high degree of granularity, making policy-setting an efficient process down to the user level that can be extended to any combination of group, job function or application.
7. nExt GEnErAtion-intrUsion dEtECtion sYstEM (nG-ids)The Intrusion Detection is carried out as nG-IDS.
Multiple detection techniques have to be combined. A behaviour-based analyse of the network traffic is done to detect known as well as new, yet unknown threats. The needed model has to be built in an unsupervised fashion in such a way, that no endangered learning phase is needed. Cross-site correlation between systems and networks can be used to reduce the false alert rates of the anomaly detection efficiently [5]. There are three basic approaches to carry out Intrusion Detection in encrypted communication, namely protocol-based, intrusive and non-intrusive.
8. FUtUrE EArlY wArninG sYstEM (Ews) Early warning system (EWS) is a main part of
the future cyber defence. A next generation early warning system is securing the internet of the future. The need to protect the infrastructure of the Internet of the Future, as well as to manage such a security infrastructure has to have the highest priority [6].
If it is assumed that data and services will be located, respectively provided in “clouds”, then the architecture of a EWS must address this virtualisation
aspect. Although virtualisation is a mainstream technology nowadays, it seems that security issues are often an afterthought. Existing security models and practices cannot be directly applied to a vastly different environment. Furthermore, virtualization principles could change drastically the way we do security, that forces to rethink how to manage these security items.
In recent years we have witnessed a growing series of threats and attacks on the Internet and on applications and databases. Through denial of service attacks, viruses, phishing, spyware and other malware, criminals disrupt service provisioning and steal personal or confidential business data for financial gain or other purposes.
In respect to these characteristics the aim of our requirements is the development of an efficient cooperative Early Warning System for future networks. In the current environment of the Internet, multiple distributed and heterogeneous networks are connected at which no encryption is done or is only partial.
9. tEChniCAl-soCio CYbEr sECUritY
wArninG sYstEMsThis technique is more useful and robust, provided
that it is implemented in all organizations and units. Cyber security is a global problem that requires collaboration and coordination between all countries. In order to address this vulnerability all nations should suggest a developing platform that eliminates the existing technical- socio gap between cyber security warning disseminators and end recipients. A technical- socio cyber security coordination system TS (CS)2 is collaboration between the cyber security warning system original data and updated warning data. As subscribers to the TS (CS)2 platform, member organizations have to regularly feed the platform operators with the information about their security implementations at the different technical and social areas, policies, operations, practices and technical implementations. The TS (CS)2 operators will collect this warning and analyze it from technical-socio perspective. The TS (CS)2 platform will then disseminate a guided version of the warning to the subscriber. Guided warning will ensure those subscribes are effectively responding to security warnings [7].
10. CYbEr wArFArE (Cw) strAtEGiEsCyber warfare is internet-based conflict involving
politically motivated attacks on information and information systems. cyber warfare attacks can disable official websites and networks, disrupt or disable essential services, steal or alter classified data, and criple financial systems among many other possibilities. Inside cyber warfare, any country can wage cyber
MEEnA: InTEllIGEnT unIFIED MODEl FOr InTEGrATED CYBEr SECurITY
219
12. ConClUsions In this paper various latest research techniques for
cyber security have been reviewed and analyzed. An efficient and accurate cyber security model has been presented. An Intelligent unified model for integrated cyber security (IuMICS) framework for the future internet has been analysed. The proposed model improves the performance of each cyber security technique and integrates all on a single platform for controlling and monitoring the whole cyber network.
The integration of all the techniques is always a challenging work, but best solution has been tried to analyse and design the model IuMICS. The cyber security strategy of IuMICS should have unique cyber security team performing tasks and filling roles that are appropriate for it and that these roles are not the same among all other techniques.
The IuMICS analyse is vital for developing an integrated system of cyber security. The cyber security monitoring and management system is a universal approach in cyber security required for, developing an Intelligent unified model for integrated cyber security (IuMICS) system. Cyber threats continue to haunt internet users across the world & cyber-threats are the problems of today and the future.
In the future it is purposed to enhance the performances of proposed IuMICS cyber security model by includes few other cyber security techniques like design, optimization, simulation algorithms and include the proactive cyber threat detection techniques.
fu"d"k Z bl i= esa lkbcj lqj{kk ds fy, fofHkUu uohure
vuqla/kku rduhdksa dh leh{kk vkSj fo”ys’k.k fd;k x;k gSA ,d dq”ky vkSj lVhd lkbcj lqj{kk e‚My çLrqr fd;k x;k gSA Hkfo’; ds baVjusV ds fy, ,d baVsfytsaV ,dh—r lkbcj lqj{kk ç.kkyh ¼vkbZ;qfeDl½ e‚My dk fo”ys’k.k fd;k x;k gSA çLrkfor lkbcj lqj{kk e‚My es lHkh lkbcj lqj{kk rduhdks ds çn”kZu esa lq/kkj ,oa lHkh lkbcj usVodZl vkSj rduhdks dks ,d eap ij ,dh—r] fu;af=r ,oa fuxjkuh djus ;ksX; cuk;k x;k gSA
lHkh rduhdksa dk ,dhdj.k ges”kk ,d pqukSrh Hkjk dke gS] ysfdu vkbZ;qfeDl e‚My ds fo”ys’k.k vkSj fMtkbu es lcls vPNs lek/kku dh dksf”k”k dh xbZ gSA vkbZ;qfeDl e‚My dh lkbcj lqj{kk ifí~r;kWa vf}rh; gS] lkbcj lqj{kk Vhe ds dk;Z çn”kZu vkSj Hkwfedkvksa ds fy, cgqr mi;qä gS tks fd vU; lHkh lkbcj e‚My rduhdksa ds chp gh ugha gSA
vkbZ;qfeDl e‚My dk fo”ys’k.k ,dh—r lkbcj lqj{kk ç.kkyh ds fodkl ds fy, egRoiw.kZ gSA lkbcj lqj{kk ds fy, lkbcj lqj{kk fuxjkuh vkSj çca/ku ç.kkyh ,d lkoZHkkSfed
war on any other country, irrespective of resources, because most military forces are network-centric and connected to the internet, which is not secure. The most effective protection against cyber warfare attacks is securing information and networks. Cyber warfare refers to politically motivated hacking to conduct sabotage and espionage. It is a form of information warfare sometimes seen as analogous to conventional warfare although this analogy is controversial for both its accuracy and its political motivation. Any software-controlled system that can accept input can theoretically be infiltrated and attacked. Cyber attacks immediately follow physical attacks, cyber attacks are increasing in volume, sophistication, and coordination, cyber attackers are attracted to high-value targets, Many, if not most, targets would probably be commercial computer and communications systems, organised crime, terrorist groups [8].
11. FEdErAtEd CYbEr dEFEnCE sYstEM (FCds)FCDS is a system prototype designed for the
improvement of federated network cyber security. Each domain of FCDS consists of the following elements: a number of sensors (S), a decision module (DM) and a number of reaction elements (rE) [9]. The sensors forward the information to the decision module with alarms when an event is observed in the network. Decision module performs reasoning analyse and makes decision if the observed action is an attack and produces appropriate rules applicable to reaction elements. Decision modules are deployed in autonomous networks which share information about detected attacks and recommended reactions. It is assumed that information exchange between them is voluntary as well as the use of recommend reactions depends on internal domain security policy and administrator decision. When set of domains are functioning together then those are able to produce a result that is not independently obtainable. Reliable and secure communication is required for sensor data collection, distribution and reaction element remote control. The dynamic physical world and complexity of cyber world present many challenges in CPS analyse and design, such as storage restriction, resource constrain, network bandwidth, and so on. The FCDS support the flexibility integration of loosely coupled services and components. The typical applications of CPS includes: intelligent transportation, precision agriculture, and medical cyber physical system. This section analyses the technique for protecting the network from the cyber threats which arises due to attacks on the network.
ArTIFICIAl InTEllIGEnCE AnD nETWOrK SECurITY
220
ifí~r gS tks fd ,d baVsfytsaV ,dh—r lkbcj lqj{kk e‚My ¼vkbZ;qfeDl½ ç.kkyh ds fodkl ds fy;s vfrvko”;d gSA
lkbcj [krjs baVjusV dh nqfu;k es orZeku vkSj Hkfo’; dh leL;k gS] lkbcj [krjksa ds fujUrj tkjh jgsus ls baVjusV ds mi;ksxdrkZvksa dks vf/kd leL;k ,oa ijs”kkfu;ks dk lekuk djuk iM jgk gSA
bl lkbcj lqj{kk e‚My es Hkfo’; ds çLrkfor dk;ksZ esa vPNk fMtkbu] vuqdwyu] fleqys”ku ,Yxksfjne ]dqN vU; lk-bcj lqj{kk rduhd] lfØ; lkbcj [krjs dk irk yxkus dh rduhd Hkh ”kkfey gS ftlls fd çLrkfor vkbZ;qfeDl lkbcj lqj{kk e‚My ds çn”kZu ,oa dk;Z{kerk dks c<+k;k tk ldsA
rEFErEnCEs1. Meena, r.K. & Kumar, Vinod. Cyber Security :A
review. Cyber Times Int. J. Techno. Manag., 2013, 2(2), 6-12.
2. http://www.happiestminds.com/unified-cyber-security-monitoring-and-management-framework, unified Cyber Security Monitoring and Management Framework.
3. Kianmehr, K. .An incremental semi rule-based learning model for cyber security in cyber infrastructures Cyber Technology in Automation, Control, and Intelligent Systems (CYBEr), In IEEE International
Conference, 2012, pp.123-128.4. Chao, Yin; Bingyao, Cao; Jiaying, Ding & Wei,
Gu. The research and Implementation of uTM, Wireless Mobile and Computing (CCWMC 2009), IET International Communication Conference, 2009, pp.389-392
5. Koch, robert. Towards next-Generation Intrusion Detection. Cyber Conflict (ICCC), 3rd International Conference, 2011, pp.1–18.
6. Golling, M. & Stelte, B. requirements for a Future EWS – Cyber Defence in the Internet of the Future, Cyber Conflict (ICCC), 3rd International Conference, 2011, pp.1-16.
7. Al Sabbagh, B. & Kowalski, S. ST (CS)2 Featuring socio-technical cyber security warning systems, 2012 International Conference, 2012, pp.312-316.
8. Eom, Jung-Ho; Kim, nam-uk; Kim, Sung-Hwan & Chung, Tai-Myoung. Cyber military strategy for cyberspace superiority in cyber warfare, Cyber Security, Cyber Warfare and Digital Forensic (CyberSec), 2012 International Conference, 2012, pp. 295–299.
9. Jasiul, B. et al., Federated Cyber Defence System Applied methods and techniques, Communications and Information Systems Conference (MCC), Military, 2012, pp.1–6.
guhi‚V ifjfu;kstu dks Nn~ekoj.k nsukCamouflaging honeypot deployment
Abhishek Sinha* and lakshita Sejwal*Sri Sukhmani Institute of Engineering and Technology, Derabassi, India
Defence Scientific Information and Documentation Centre, Delhi-110 054, India *Email: [email protected],
lkjka”k
guhi‚V dh mi;ksfxrk fdlh }s"kiw.kZ ç;ksäk }kjk bl ij ckj ckj geyk djus ij gh fuHkZj djrh gS rkfd usVodZ ?kqliSB ds Hkhrj fodflr rjhdksa vkSj ço`fÙk;ksa dk ,slh ,d ç.kkyh dk mi;ksx dj v/;;u vkSj fo'ys"k.k fd;k tk ldsA mi;qZä dk;Zuhfr dks lqfuf'pr djus ds fy, lokZf/kd egRoiw.kZ ckr ;g gS fd yf{kr usVodZ ds Hkhrj ,slh ,d ç.kkyh ds yxs gksus ds mn~?kkVu ls cpk tk, D;ksafd mn~?kkfVr gks tkus ij] geykoj yxh gqbZ j{kkRed ç.kkyh ds ek/;e ls ml ekxZ ls cpus ds fy, ,d oSdfYid rjhdk <wa< ldrk gS vkSj bl çdkj bls usVodZ ds Hkhrj vuqi;ksxh cuk ldrk gSA ,slh fLFkfr ls cpus ds fy, ;g lokZf/kd egRoiw.kZ gks tkrk gS fd guhi‚Vksa ds ifjfu;kstu ds m)kVu ls fuf'pr :i ls cpk tk, rkfd mUgsa usVodZ lqj{kk ds ,d mi;ksxh lk/ku ds :i esa j[kk tk ldsA usVodZ VªSfQd dk vkSj guhi‚Vksa ds Hkhrj mi;ksx fd, x, vuq—fr okys ifjos'k }kjk mRiUu dbZ vU; fof'k"V gLrk{kjksa dk fo'ys"k.k djds vkSj okLrfod ç.kkfy;ksa dh lVhd vuq—fr ds u gksus ds ifj.kkeLo:i] ftlds dkj.k lkekU; ç.kkyh ls brj dfri; vlkekU; O;ogkj çnf'kZr gksrk gS tks guhi‚Vksa ds ifjfu;kstu mn~?kkVu gsrq gLrk{kj ds :i esa dk;Z djrs gSa] guhi‚V ds ifjfu;kstu dk fo'ys"k.k fd;k tk ldrk gSA bl i= esa ge ,d rjhds dks lq>krs gSa ftls fdlh ç.kkyh ds lkFk ekStwn ,sls usVodZ ds Hkhrj guhi‚Vksa ds ifjfu;kstu ds m)kVu dks lqjf{kr j[kus ds fy, viuk;k tk ldrk gS] tks guhi‚V ds ifjfu;kstu mn~?kkVu ls cpus ds fy, lfØ; vkSj fuf"Ø; rjhdksa ds la;kstu ds lkFk lEiw.kZ ç.kkyh dks dk;Z djokrs gq, mPp tksf[ke mRiknd lzksrksa dh igpku djus ds fy, Kkr geyk uhfr;ksa ds MsVkcsl rFkk lkFk gh }s"kiw.kZ vkbZih irksa ds MsVkcsl dk ç;ksx djrk gSA
AbstrAct
The usefulness of honeypot depends upon its being attacked again and again by a malicious user so that the approaches and trends developed within network intrusion can be studied and analyzed using such a system. The most important factor to ensure the above strategy is to avoid the disclosure of the deployment of such a system within the target network since upon disclosure, the attacker may find an alternative to avoid the passage through the deployed defensive system leaving it useless within network.To avoid such a situation it becomes the top most priority that the deployment disclosure of the honeypots must be avoided to keep them as a useful resource of the network security.The deployment of honeypots can be analyzed by analyzing the network traffic and many other unique signatures generated by the emulated environment used within honeypots and as a result of the failure of exact emulation of the real systems which leads to the display of certain unusual behavior than a usual system acting as a signature for the deployment disclosure of honeypots.In this paper we suggest an approach that can be adopted to protect the honeypots against their disclosure of being deployed within network with a system that uses a database of known attack strategies and also a database of malicious IP addresses to identify highly threat generating sources making the entire system work with a combination of active and passive approach to avoid deployment disclosure of honeypot.
Keywords: Honeypot fingerprint, firewall, intrusion,network security
Bilingual International Conference on Information Technology: Yesterday, Today, and Tomorrow, 19-21 February 2015, pp. 221-225© DESIDOC, 2015
1. IntroductIonHoneypot is a security resource whose actual
strength is hidden within their unauthorized and illicit access1-4, so that the intrusions within network can be recorded for further analysis, delaying network
attacks and designing better strategies to strengthen network security.This means that honeypot is deployed as a bait to trap the attacker by luring them to attack the network resources giving them an illusion of the legitimate system.The strategies to setup such systems
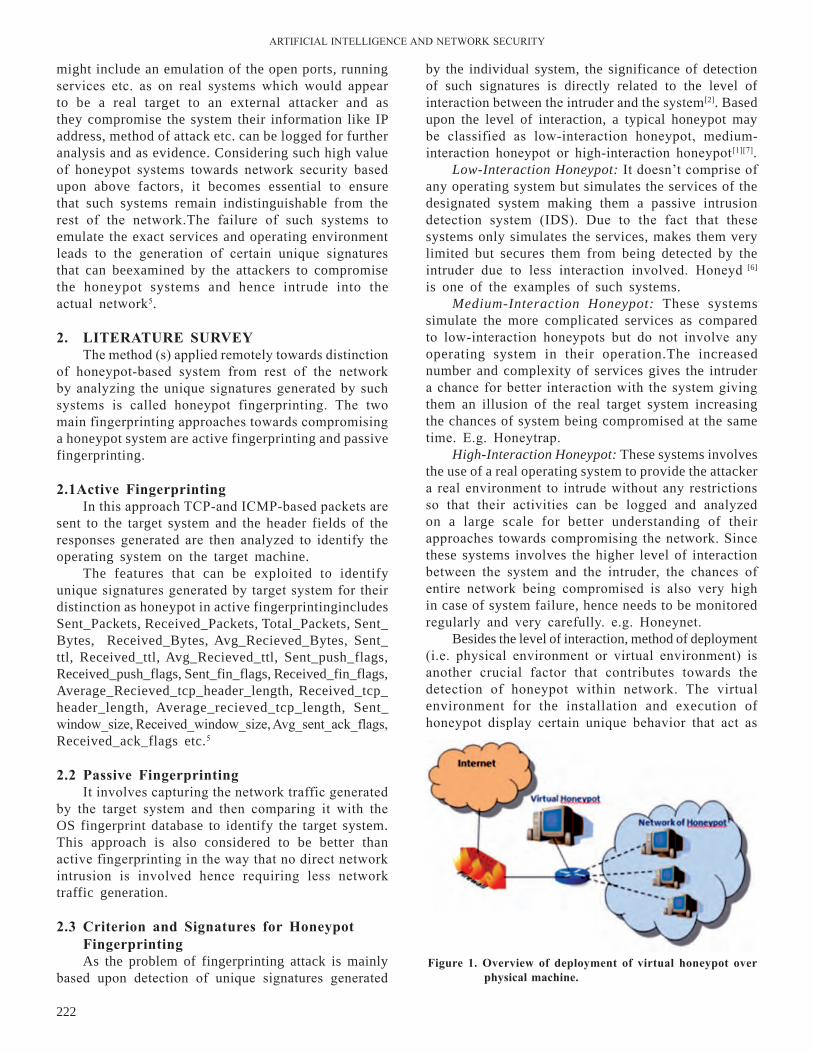
ArTIFICIAl InTEllIGEnCE AnD nETWOrK SECurITY
222
might include an emulation of the open ports, running services etc. as on real systems which would appear to be a real target to an external attacker and as they compromise the system their information like IP address, method of attack etc. can be logged for further analysis and as evidence. Considering such high value of honeypot systems towards network security based upon above factors, it becomes essential to ensure that such systems remain indistinguishable from the rest of the network.The failure of such systems to emulate the exact services and operating environment leads to the generation of certain unique signatures that can beexamined by the attackers to compromise the honeypot systems and hence intrude into the actual network5.
2. litErAtUrE sUrVEYThe method (s) applied remotely towards distinction
of honeypot-based system from rest of the network by analyzing the unique signatures generated by such systems is called honeypot fingerprinting. The two main fingerprinting approaches towards compromising a honeypot system are active fingerprinting and passive fingerprinting.
2.1Active FingerprintingIn this approach TCP-and ICMP-based packets are
sent to the target system and the header fields of the responses generated are then analyzed to identify the operating system on the target machine.
The features that can be exploited to identify unique signatures generated by target system for their distinction as honeypot in active fingerprintingincludes Sent_Packets, Received_Packets, Total_Packets, Sent_Bytes, Received_Bytes, Avg_Recieved_Bytes, Sent_ttl, Received_ttl, Avg_Recieved_ttl, Sent_push_flags, Received_push_flags, Sent_fin_flags, Received_fin_flags, Average_Recieved_tcp_header_length, Received_tcp_header_length, Average_recieved_tcp_length, Sent_window_size, received_window_size, Avg_sent_ack_flags, Received_ack_flags etc.5
2.2 Passive FingerprintingIt involves capturing the network traffic generated
by the target system and then comparing it with the OS fingerprint database to identify the target system. This approach is also considered to be better than active fingerprinting in the way that no direct network intrusion is involved hence requiring less network traffic generation.
2.3 Criterion and signatures for honeypot FingerprintingAs the problem of fingerprinting attack is mainly
based upon detection of unique signatures generated
by the individual system, the significance of detection of such signatures is directly related to the level of interaction between the intruder and the system[2]. Based upon the level of interaction, a typical honeypot may be classified as low-interaction honeypot, medium-interaction honeypot or high-interaction honeypot[1][7].
Low-Interaction Honeypot: It doesn’t comprise of any operating system but simulates the services of the designated system making them a passive intrusion detection system (IDS). Due to the fact that these systems only simulates the services, makes them very limited but secures them from being detected by the intruder due to less interaction involved. Honeyd [6]
is one of the examples of such systems.Medium-Interaction Honeypot: These systems
simulate the more complicated services as compared to low-interaction honeypots but do not involve any operating system in their operation.The increased number and complexity of services gives the intruder a chance for better interaction with the system giving them an illusion of the real target system increasing the chances of system being compromised at the same time. E.g. Honeytrap.
High-Interaction Honeypot: These systems involves the use of a real operating system to provide the attacker a real environment to intrude without any restrictions so that their activities can be logged and analyzed on a large scale for better understanding of their approaches towards compromising the network. Since these systems involves the higher level of interaction between the system and the intruder, the chances of entire network being compromised is also very high in case of system failure, hence needs to be monitored regularly and very carefully. e.g. Honeynet.
Besides the level of interaction, method of deployment (i.e. physical environment or virtual environment) is another crucial factor that contributes towards the detection of honeypot within network. The virtual environment for the installation and execution of honeypot display certain unique behavior that act as
Figure 1. overview of deployment of virtual honeypot over physical machine.
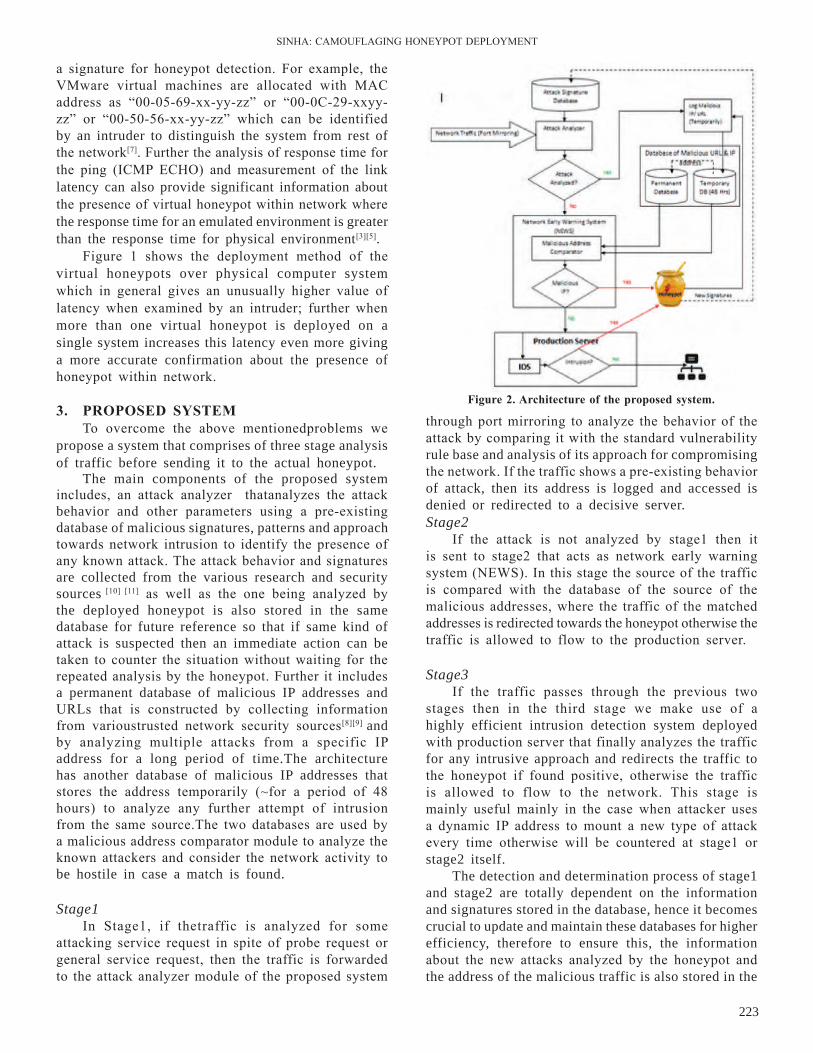
SInHA: CAMOuFlAGInG HOnEYPOT DEPlOYMEnT
223
a signature for honeypot detection. For example, the VMware virtual machines are allocated with MAC address as “00-05-69-xx-yy-zz” or “00-0C-29-xxyy-zz” or “00-50-56-xx-yy-zz” which can be identified by an intruder to distinguish the system from rest of the network[7]. Further the analysis of response time for the ping (ICMP ECHO) and measurement of the link latency can also provide significant information about the presence of virtual honeypot within network where the response time for an emulated environment is greater than the response time for physical environment[3][5].
Figure 1 shows the deployment method of the virtual honeypots over physical computer system which in general gives an unusually higher value of latency when examined by an intruder; further when more than one virtual honeypot is deployed on a single system increases this latency even more giving a more accurate confirmation about the presence of honeypot within network.
3. ProPosEd sYstEMTo overcome the above mentionedproblems we
propose a system that comprises of three stage analysis of traffic before sending it to the actual honeypot.
The main components of the proposed system includes, an attack analyzer thatanalyzes the attack behavior and other parameters using a pre-existing database of malicious signatures, patterns and approach towards network intrusion to identify the presence of any known attack. The attack behavior and signatures are collected from the various research and security sources [10] [11] as well as the one being analyzed by the deployed honeypot is also stored in the same database for future reference so that if same kind of attack is suspected then an immediate action can be taken to counter the situation without waiting for the repeated analysis by the honeypot. Further it includes a permanent database of malicious IP addresses and urls that is constructed by collecting information from varioustrusted network security sources[8][9] and by analyzing multiple attacks from a specific IP address for a long period of time.The architecture has another database of malicious IP addresses that stores the address temporarily (~for a period of 48 hours) to analyze any further attempt of intrusion from the same source.The two databases are used by a malicious address comparator module to analyze the known attackers and consider the network activity to be hostile in case a match is found.
Stage1In Stage1, if thetraffic is analyzed for some
attacking service request in spite of probe request or general service request, then the traffic is forwarded to the attack analyzer module of the proposed system
Figure 2. Architecture of the proposed system.
through port mirroring to analyze the behavior of the attack by comparing it with the standard vulnerability rule base and analysis of its approach for compromising the network. If the traffic shows a pre-existing behavior of attack, then its address is logged and accessed is denied or redirected to a decisive server.Stage2
If the attack is not analyzed by stage1 then it is sent to stage2 that acts as network early warning system (nEWS). In this stage the source of the traffic is compared with the database of the source of the malicious addresses, where the traffic of the matched addresses is redirected towards the honeypot otherwise the traffic is allowed to flow to the production server.
Stage3If the traffic passes through the previous two
stages then in the third stage we make use of a highly efficient intrusion detection system deployed with production server that finally analyzes the traffic for any intrusive approach and redirects the traffic to the honeypot if found positive, otherwise the traffic is allowed to flow to the network. This stage is mainly useful mainly in the case when attacker uses a dynamic IP address to mount a new type of attack every time otherwise will be countered at stage1 or stage2 itself.
The detection and determination process of stage1 and stage2 are totally dependent on the information and signatures stored in the database, hence it becomes crucial to update and maintain these databases for higher efficiency, therefore to ensure this, the information about the new attacks analyzed by the honeypot and the address of the malicious traffic is also stored in the
ArTIFICIAl InTEllIGEnCE AnD nETWOrK SECurITY
224
database each time a hostile activity is encountered. The malicious IP address storage is done using two different databases, where one acts as permanent storage and stores the addresses collected from standard sources like[8] as well as the addresses from the temporary storage that have been analyzed for generating multiple attacks over a long period of time. The other database acts as the temporary database for the storage of malicious IP addresses and stores all the IP detected to be intrusive for a period of 48 hours after which it analyzes if there exists multiple attacks from the same IP within 48 hours then that IP is transferred to the permanent database and rest all addresses are cleared. This database is useful in the case where the attacker uses dynamic IP address to launch an attack, so blacklisting that particular address permanently can’t restrict the attack.
The choice of the honeypot to be deployed with such a system is also an important aspect of the proposed strategy where the deployment of highly interactive honeypot may disclose its own deployment within network through system level detection, so a medium interaction honeypot is the best choice for such a system.
4. rEAl-tiME MonitorinGThe proposed system camouflages the deployment
of honeypot by means of analysis of the mirrored live traffic flowing through the system where the time consumption for analyzing intrusive approach decreases with the use of signature base within the system as compared to repeated analysis of same approach using the deployed honeypot. The whole system initially analyzes the traffic for hostility using static approach and then proceeding towards dynamic approach if a result is not obtained by the former.Advanced forensic techniques used on the basis of looking MAC (Modify, Access, Change) can helps us to determine the attacker’s action within the system to construct a more efficient signature base by using the tools like Coroners toolkit designed by Dan Farmer and WietseVenema12.
5. ConClUsionIn this paper we have discussed an approach
towards hiding the deployment of a honeypot within network involving a passive approach in which the incoming hostile traffic is analyzed by the means of a database having the information about the nature of attack collected from the deployed honeypot and other sources, which on discovering a positive intrusion could either forward the traffic to some defensive system or could restrict the access hence avoiding the direct interaction with the honeypot in known attack cases. The use of database of malicious addresses
acts as an early warning system in the suggested approach, which alerts the network administrator regarding a potential intrusion hence adding an extra layer of security so that necessaryaction can be taken within time. The results suggest that, if signatures and approaches are identified accurately to construct the database then stage1 can avoid the disclosure of honeypot deployment within network.
Only the highly interactive honeypots may lead to disclosure of its deployment through system level detection, so it is suggested that a medium interaction honeypot must be used to avoid such a situation.
fu’d’k Zbl i= esa geus usVodZ ds Hkhrj guhi‚V ds yxs gksus dks
fNikus ds fy, ,d rjhds ij ppkZ dh gS ftlesa ,d fuf"Ø; rjhdk 'kkfey gS ftlesa vkus okys vfgrdj VªSfQd dks ,sls MsVkcsl ds ek/;e ls fo'ysf"kr fd;k tkrk gS tks ifjfu;ksftr guhi‚V vkSj vU; lzksrksa ls ,df=r geys ds Lo:i d laca/k esa lwpuk,a j[krk gS vkSj tks ldkjkRed ?kqliSB dk irk yxus ij ;k rks VªSfQd dks fdlh lqj{kkRed ç.kkyh esa Hkst nsrk gS vFkok igqap ij jksd yxk nsrk gS vkSj bl çdkj Kkr geyk ekeyksa esa guhi‚V ds lkFk çR;{k vU;ksU;fØ;k dks gVkrk gSA }s"kiw.kZ irksa ds MsVkcsl dk mi;ksx lq>kbZ x, rjhds esa ,d iwoZ psrkouh ç.kkyh ds :i esa dk;Z djrk gS] tks usVodZ ç'kkld ,d laHkkfor ?kqliSB ds laca/k esa ltx dj nsrk gS vkSj bl çdkj lqj{kk dh ,d vkSj ijr cukrk gS rkfd le; ds Hkhrj vko';dj dkjZokbZ dh tk ldsA ifj.kke n'kkZrs gSa fd ;fn MsVkcsl dk fuekZ.k djus ds fy, gLrk{kjksa vkSj rjhdksa dh lVhdrk ls igpku dj yh tkrh gS] rks pj.k 1 usVodZ ds Hkhrj guhi‚V ds ifjfu;kstu ds mn~?kkVu dks jksd ldrk gSA
dsoy mPp vU;ksU;fØ;kRed guhi‚V ç.kkyh Lrj ij irk yxkus ds ek/;e ls blds ifjfu;kstu ds mn~?kkVu dj ldrs gSa] vr%] ;g lq>k;k tkrk gS fd ,slh fLFkfr ls cpus ds fy, ,d e/;e vU;ksU;fØ;kRed guhi‚V dk gh ç;ksx fd;k tkuk pkfg,A
rEFErEnCEs1. lance Spitzner, Honeypots: Tracking Hackers.
Addison-Wesley longman Publishing Co., Inc. Boston, MA, uSA, 2002.
2. Iyatiti Mokube, Michele Adams, Honeypots: Concepts, approaches, and challenges. ACM-SE 45 Proceedings of the 45th annual southeast regional conference, 2007, pp. 321-326.
3. Xinwen Fu, Wei Yu, Dan Cheng, Xuejun Tan, Kevin Streff, Steve Graham, On recognizing virtual honeypots and countermeasures. Proceedings of the 2nd IEEE International Symposium on Dependable, Autonomic and Secure Computing (DASC'06), 2006, pp. 1-8.
SInHA: CAMOuFlAGInG HOnEYPOT DEPlOYMEnT
225
4. Swapnali Sundar Sadamate, review Paper on Honeypot Mechanism–the autonomous hybrid solution for enhancing. International Journal of Advanced Research in Computer Science and Software Engineering. 2014, 4(1), pp. 854-858.
5. S. Mukkamala, K. Yendrapalli, r. Basnet, M. K. Shankarapani, A.H. Sung, Detection of virtual environments and low interaction honeypots. Proceedings of the 2007 IEEE Workshop on Information Assurance, united States Military Academy, West Point, nY 20-22 June 2007, pp. 92-98.
6. n. Provos, A virtual honeypot framework. Proceedings of the 13th uSEnIX Security Symposium, August 2004.
7. Hamid Mohammadzadeh, Masood Mansoori, Ian Welch, Evaluation of fingerprinting techniques and
a windows-based dynamic honeypot. Proceedings of the Eleventh Australasian Information Security Conference (AISC 2013), 2013, pp. 59-66.
8. Directory of Malicious IPs. https://www.projecthoneypot.org/list_of_ips.php
9. Malware domain listhttp://malware-domains.com/files/domains.zip
10. Kristopher Kendall, A Database of Computer Attacks for the Evaluation of Intrusion Detection Systems. M.E. Thesis, Department of Electrical Engineering and Computer Science, Massachusetts Institute of Technology, June 1999.
11. Open source Vulnerability rule base http://www.snort.org/vrt
12. Clarke l. Jeffris, The Coroners Toolkit - In depth. SAnS Institute InfoSec reading room whitepaper, 2002.
Bilingual International Conference on Information Technology: Yesterday, Today, and Tomorrow, 19-21 Feburary 2015, pp. 226-230© DESIDOC, 2015
1. IntroductIon Modern enterprises demand changes to be incorporated
in the existing system spontaneously. The quick response against change is the key to survive in present competitive and global scenario. To attain stability in businesses, enterprises are required to streamline the existing business processes and procedures while exposing certain applications throughout the enterprise in highly standardized manner. A contemporary approach for
addressing these critical issues is represented by Web services that can be easily assembled to form a collection of autonomous and loosely coupled business processes.
The advancement in Web services and standards in combination with automated business integration tools leads to the enhancement in software integration and Service-oriented Architecture. This architecture aims to address the requirements of loosely coupled,
cSafdax esa lsok mUeq[kh okLrqdyk ds lkFk lqj{kksecurity with service oriented Architecture in banking
neha ManchandaIdeal Institute of Management and Technology, Delhi-110 092, India
E-mail: [email protected]
lkjka”k
ijaijkxr :i ls m|e vkbZVh vkfdZVsDpj vkosnu dsafær [kjkc interoperable vkSj dM+k dj fn;k x;k gS fctusl çkslsl çca/ku ds fy, cgqr dBksj gSA lsok& mUeq[khdj.k dh /kkj.kk f”kfFky ;qfXer lsok okLrqdyk esa ¶yksfjMk exible] iqu% ç;ksT;] çfØ;k mUeq[k m|e vkbZVh okLrqdyk nsus ds fy, djuk gSA lkekU; esa ] lsok mUeq[k dEI;wfVax ¼lekt½ Hkfo’; cSafdax m|ksx ds fy, ,d vk/kkj ds :i esa dk;Z djrk gS tks lsok mUeq[k vkfdZVsDpj (SOA) ds fuekZ.k ds fy, uhao çnku djrk gSA SOA ‘,d vkosnu ds lHkh dk;ksaZ O;kikj çfØ;kvksa ds fy, QkeZ O;ofLFkr –”;ksa esa dgk tk ldrk gS] tks vPNh rjg ls Mh QkbZ usM çfrns; baVjQsl ds lkFk Lora= lsokvksa ds :i esa usM Mh QkbZ jgs gSa ftlds Hkhrj ,d vkosnu okLrqdyk’ gSA osc lsokvksa lsok mUeq[khdj.k ds fy, okLrfod dk;kZUo;u çkS|ksfxdh cu x, gSaA osc lsokvksa dks ns[kus dh çfØ;k fcanq ls lsokvksa orchestrating ds fy, lans”k] Mh QkbZ fuax lsokvksa ds fy, McY;w,lMh,y] vkSj BPEl ds lkFk ckrphr ds fy, lapkj ds fy, baVjusV] lkcqu dk ç;ksx djsaA Qksdl cSafdax m|ksx ds {ks= esa lsokvksa vkSj dh fofo/krk ds lkFk SOA ds mi;ksx ij gS laxBuksa] “kh’kZ iafä fodkl esa lq/kkj lek/kku gS fd fuekZ.k ykxr dks de djus] ifjpkyu tksf[ke dks de djus] vkSj laxBu dh o`f) dh czkaM oSY;w ds fy, vxz.kh xzkgd vuqHko esa lq/kkj djus ds fy, SOA dk mi;ksx dSls dj ldrs gSa vkt ds çfrLi/khZ ekgkSy esaA
AbstrActTraditionally enterprise IT architectures have been application-centric poorly interoperable and
inflexible that too rigid for business process management. The notion of service-orientation aims to deliver flexible, reusable, process-oriented enterprise IT architecture in loosely coupled service architecture. In general, Service oriented computing (SOC) provides the foundations for building Service oriented architecture (SOA) which serves as backbone for future banking industry. SOA is an application architecture within which all functions of an application are defined as independent services with well defined callable interfaces which can be called in systematic sequences to form business processes. Web Services have become de-facto implementation technology for service- orientation. Web services use internet for communication, SOAP for interacting with messages, WSDl for defining services and BPEl for orchestrating services from process point of view. The focus is on use of SOA with variety of services in the banking industry sector and how organizations can use SOA to construct solutions that improve top line growth, reduce costs ,reduce operational risks and improve customer experience leading to increased brand value of the organization in today’s competitive environment.
Keywords: Service oriented architecture, service oriented computing, WSDl, SOAP, BPEl
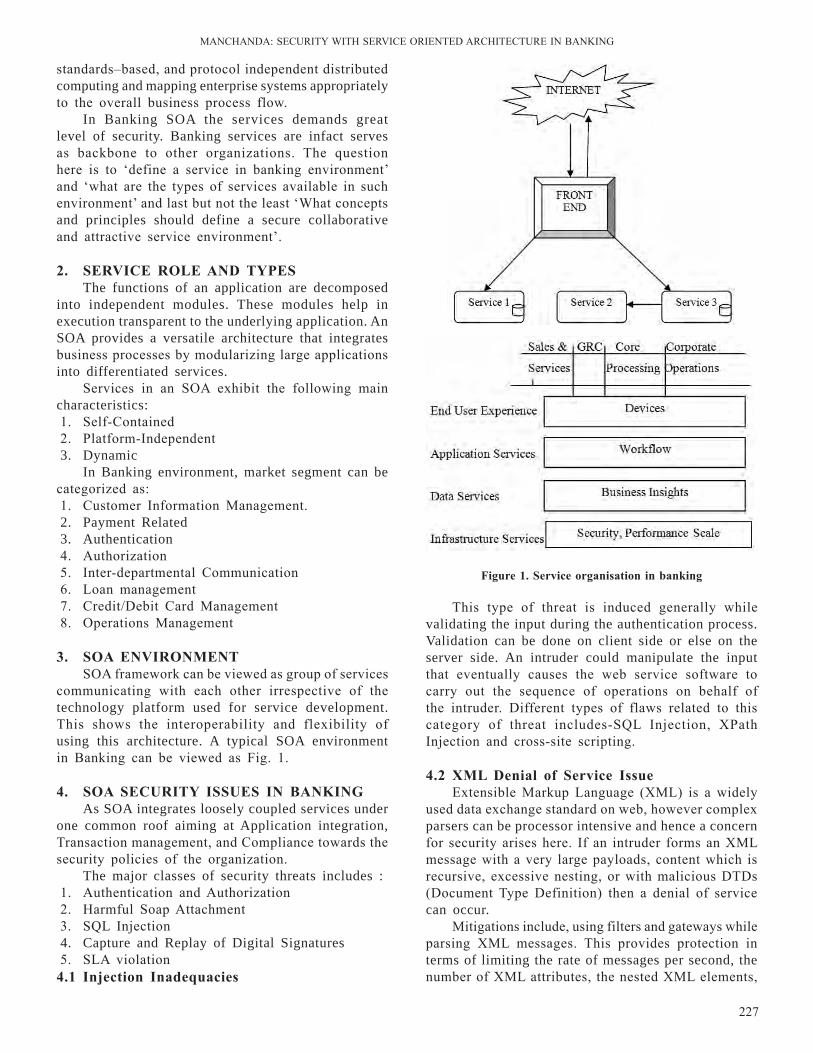
MAnCHAnDA: SECurITY WITH SErVICE OrIEnTED ArCHITECTurE In BAnKInG
227
standards–based, and protocol independent distributed computing and mapping enterprise systems appropriately to the overall business process flow.
In Banking SOA the services demands great level of security. Banking services are infact serves as backbone to other organizations. The question here is to ‘define a service in banking environment’ and ‘what are the types of services available in such environment’ and last but not the least ‘What concepts and principles should define a secure collaborative and attractive service environment’.
2. sErViCE rolE And tYPEsThe functions of an application are decomposed
into independent modules. These modules help in execution transparent to the underlying application. An SOA provides a versatile architecture that integrates business processes by modularizing large applications into differentiated services.
Services in an SOA exhibit the following main characteristics:1. Self-Contained2. Platform-Independent3. Dynamic
In Banking environment, market segment can be categorized as:1. Customer Information Management.2. Payment Related3. Authentication4. Authorization5. Inter-departmental Communication6. loan management7. Credit/Debit Card Management8. Operations Management
3. soA EnVironMEntSOA framework can be viewed as group of services
communicating with each other irrespective of the technology platform used for service development. This shows the interoperability and flexibility of using this architecture. A typical SOA environment in Banking can be viewed as Fig. 1.
4. soA sECUritY issUEs in bAnKinGAs SOA integrates loosely coupled services under
one common roof aiming at Application integration, Transaction management, and Compliance towards the security policies of the organization.
The major classes of security threats includes :1. Authentication and Authorization2. Harmful Soap Attachment3. Sql Injection4. Capture and Replay of Digital Signatures5. SlA violation
4.1 injection inadequacies
This type of threat is induced generally while validating the input during the authentication process. Validation can be done on client side or else on the server side. An intruder could manipulate the input that eventually causes the web service software to carry out the sequence of operations on behalf of the intruder. Different types of flaws related to this category of threat includes-Sql Injection, XPath Injection and cross-site scripting.
4.2 xMl denial of service issueExtensible Markup language (XMl) is a widely
used data exchange standard on web, however complex parsers can be processor intensive and hence a concern for security arises here. If an intruder forms an XMl message with a very large payloads, content which is recursive, excessive nesting, or with malicious DTDs (Document Type Definition) then a denial of service can occur.
Mitigations include, using filters and gateways while parsing XMl messages. This provides protection in terms of limiting the rate of messages per second, the number of XMl attributes, the nested XMl elements,
Figure 1. service organisation in banking
ArTIFICIAl InTEllIGEnCE AnD nETWOrK SECurITY
228
the length of an XMl node name, and the DTDs. Alternatively, schema validation can be used to validate xml input but it is not as efficient as the XMl parsing is done before validating the document.
4.3 replay Attack FlawsWhen the attacker replays the messages to the
server multiple times for invoking an action replay attack occurs. Mitigations include the use of digital signatures and encryption policies. Furthermore in case of attack related to encrypted messages, signed timestamps can be used. Client can also include unique message identifiers (nonce) which can be used by servers for message tracking to keep the record of processed unique messages.
4.4 insufficient logginglogs are very important if a hacking or intrusion
attempt occurs. Mitigations policies include maintaining logs of transactions incorporating both successful and unsuccessful authentication attempts, unsuccessful authorization and various application errors. log files can also be encrypted for ensuring their confidentiality. In addition, only recording the logs is not sufficient, someone needs to monitor it regularly. Automated log scanning and audit reduction proves to be useful in monitoring the log records.
5. dEFEnsiVE MEChAnisMs For sECUritY oF FinAnCiAl institUtionProtection is a main concern for the banking
entities. It involves customers, employees and various assets. The behavior of invaders involved in fraud is in most of the cases are unpredictable. Therefore, the situation here is a bit risky.
To overcome risk environment, a check on financial criminals and money launderers is required, as they are very smart, by hook or by crook, trying every possible way to evade detection. Moreover if existing approach doesn’t works well, new strategies were evolved.
unfortunately in today’s world of highly trained individuals who are taking care of managing these funds besides having support of high equipped and challenging teams are failing to provide security from the terrorists, money launderers. Reason being the complexity of identity concealing strategy followed by them. They usually follow a series of transactions to hide the origin of the illicit funds. Consequently, the investigators are confused in these complex webs of transactions known as ‘Hidden relationships’. Money launderers often establish rings of accounts that appear to be unrelated and then used it to move assets between several of these accounts.
5.1 regulatory FrameworkSome regulations in Europe and united States urge
the financial institutions to keep a track on patterns of transactions performed between unrelated accounts from security point of view. In recommendation 11 of its ‘Forty recommendations,’ the Financial Action Task Force on Money laundering (FATF) states:
Financial institutions should pay special attention to all complex, unusually large transactions, and all unusual patterns of transactions, which have no apparent economic or visible lawful purpose. The background and purpose of such transactions should, as far as possible, be examined, the findings published, and made available to help competent authorities and auditors.
Hidden relationships and networks, by their very purpose, have no legitimate economic or lawful purpose. regulations in the united States and their guidance offer similar guidance to financial institutions and instruct them to look for patterns. The summary statement from adoption of the rule states.
The language in the rule requiring the reporting of patterns of transaction is intended to recognize the fact that a transaction may not always appear suspicious on a standalone basis. In some cases, a broker-dealer may only be able to determine that a suspicious transaction report must be filed after reviewing its records, either for the purposes of monitoring for suspicious transactions, auditing its compliance systems, or during review.
5.2 hidden relationshipThe term hidden relationship itself states that
while existing in performing course of transactions appears to be hidden. Financial Institutions needs to detect these networks of transactions by analysing log, nature, place and various other aspects of transaction lifecycle. For example, we have four accounts in a bank. Account 1 shares a piece of information such as an address, phone number or beneficiary in common with Account 2. Account 2 shares a different piece of data with Account 3, and so on. Figure 2.
It appears that Account 1 and Account 4 share absolutely nothing in common. However, there exists a hidden network which can be used by criminal to launder funds. unfortunately, hidden relationships or networks are rarely that easy to define or identify in real time transactions.
5.3 Patterns of Funds transfers between Correspondent banks The money laundering from correspondent bank
is considered to be vulnerable is not taken care properly. Therefore, due diligence procedures and regular monitoring should be imposed by financial
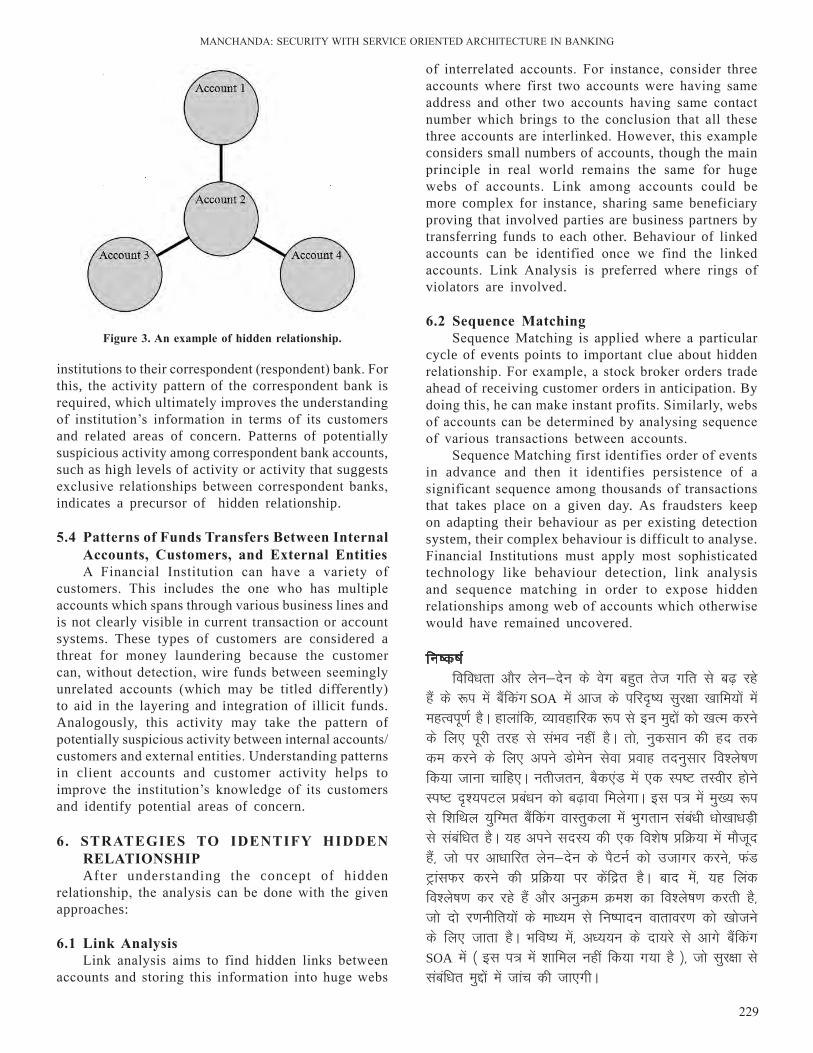
MAnCHAnDA: SECurITY WITH SErVICE OrIEnTED ArCHITECTurE In BAnKInG
229
institutions to their correspondent (respondent) bank. For this, the activity pattern of the correspondent bank is required, which ultimately improves the understanding of institution’s information in terms of its customers and related areas of concern. Patterns of potentially suspicious activity among correspondent bank accounts, such as high levels of activity or activity that suggests exclusive relationships between correspondent banks, indicates a precursor of hidden relationship.
5.4 Patterns of Funds transfers between internal Accounts, Customers, and External Entities A Financial Institution can have a variety of
customers. This includes the one who has multiple accounts which spans through various business lines and is not clearly visible in current transaction or account systems. These types of customers are considered a threat for money laundering because the customer can, without detection, wire funds between seemingly unrelated accounts (which may be titled differently) to aid in the layering and integration of illicit funds. Analogously, this activity may take the pattern of potentially suspicious activity between internal accounts/customers and external entities. understanding patterns in client accounts and customer activity helps to improve the institution’s knowledge of its customers and identify potential areas of concern.
6. strAtEGiEs to idEntiFY hiddEn rElAtionshiPAfter understanding the concept of hidden
relationship, the analysis can be done with the given approaches:
6.1 link Analysislink analysis aims to find hidden links between
accounts and storing this information into huge webs
of interrelated accounts. For instance, consider three accounts where first two accounts were having same address and other two accounts having same contact number which brings to the conclusion that all these three accounts are interlinked. However, this example considers small numbers of accounts, though the main principle in real world remains the same for huge webs of accounts. link among accounts could be more complex for instance, sharing same beneficiary proving that involved parties are business partners by transferring funds to each other. Behaviour of linked accounts can be identified once we find the linked accounts. link Analysis is preferred where rings of violators are involved.
6.2 sequence Matching Sequence Matching is applied where a particular
cycle of events points to important clue about hidden relationship. For example, a stock broker orders trade ahead of receiving customer orders in anticipation. By doing this, he can make instant profits. Similarly, webs of accounts can be determined by analysing sequence of various transactions between accounts.
Sequence Matching first identifies order of events in advance and then it identifies persistence of a significant sequence among thousands of transactions that takes place on a given day. As fraudsters keep on adapting their behaviour as per existing detection system, their complex behaviour is difficult to analyse. Financial Institutions must apply most sophisticated technology like behaviour detection, link analysis and sequence matching in order to expose hidden relationships among web of accounts which otherwise would have remained uncovered.
fu’d’k Zfofo/krk vkSj ysu&nsu ds osx cgqr rst xfr ls c<+ jgs
gSa ds :i esa cSafdax SOA esa vkt ds ifj–’; lqj{kk [kkfe;ksa esa egRoiw.kZ gSA gkykafd] O;kogkfjd :i ls bu eqíksa dks [kRe djus ds fy, iwjh rjg ls laHko ugha gSA rks] uqdlku dh gn rd de djus ds fy, vius Mksesu lsok çokg rnuqlkj fo”ys’k.k fd;k tkuk pkfg,A urhtru] cSd,aM esa ,d Li’V rLohj gksus Li’V –”;iVy çca/ku dks c<+kok feysxkA bl i= esa eq[; :i ls f”kfFky ;qfXer cSafdax okLrqdyk esa Hkqxrku laca/kh /kks[kk/kM+h ls lacaf/kr gSA ;g vius lnL; dh ,d fo”ks’k çfØ;k esa ekStwn gSa] tks ij vk/kkfjr ysu&nsu ds iSVuZ dks mtkxj djus] QaM VªkalQj djus dh çfØ;k ij dsafær gSA ckn esa] ;g fyad fo”ys’k.k dj jgs gSa vkSj vuqØe Øe”k dk fo”ys’k.k djrh gS] tks nks j.kuhfr;ksa ds ek/;e ls fu’iknu okrkoj.k dks [kkstus ds fy, tkrk gSA Hkfo’; esa] v/;;u ds nk;js ls vkxs cSafdax SOA esa ¼ bl i= esa “kkfey ugha fd;k x;k gS ½] tks lqj{kk ls lacaf/kr eqíksa esa tkap dh tk,xhA
Figure 3. An example of hidden relationship.
ArTIFICIAl InTEllIGEnCE AnD nETWOrK SECurITY
230
7. ConClUsionIn Today’s scenario Security loopholes in Banking
SOA is critical as the variety and velocity of transactions are growing at very fast pace. However, practically to eliminate these issues completely is not possible. So, in order to minimize the extent of damage, the service flow in its domain should be analysed accordingly. Consequently, having a clear picture at the backend will lead to clear front-end management. This paper mainly deals with payments related frauds in loosely coupled banking architecture. It focuses on the process of fund transfer, uncovering the pattern of transaction based upon its members who are present in a particular process. Afterwards, it tends to find the execution environment by means of two strategies which are link analysis and sequence analyses, respectively.
In future, scope of the study will be further examined in security related issues (which have not been covered in this paper) in banking SOA.
rEFErEnCEs1. Brahe, S. BPM on Top of SOA: Experiences from the Fi-
nancial Industry. Danske Bank and IT university of Co-penhagen, Denmark .
2. Cunningham, M. Exploiting the Knowledge Economy: Issues, Applications and Case Studies, Part 1. IOS Press, 2006.
3. Heuvel, M. P.-J. Service oriented architectures: approach-es, technologies and research issues. The VLDB J., 2007.
4. Microsoft. Microsoft Industry reference Architecture for Banking (MIrA-B), 2012.
5. Oracle. Hidden relationships and networks: Financial Institutions at risk . 10, 2009.
6. Systems and network analysis center Information assurance directorate. Service oriented architecture security vulnerabilities web services.
7. http://www.networkworld.com/article/2264806/lan-wan/soa-security--the-basics.html
8. http://www.redbooks.ibm.com/redpapers/pdfs/redp4467. pdf
lkbcj lqj{kk& ,d losZ{k.kCyber security-A survey
Smita Jhajharia and Vaishnavi Kannan* Delhi Technological University, Delhi, India
*E-mail: [email protected]
lkjka”k
e”khusa flQZ loZO;kih gh ugha vfirq vkil esa tqMh gqbZ gSaA dEi;wVj FkksMs ls le; esa csgn egRoiw.kZ Lrj rd igq¡p x;k gSaA ‘lkbcj lkezxh’ ds lkFk rst vkSj vDlj vçR;kf”kr ifj.kke çkIr gq, gSaA lkbcj lqj{kk ds igyqvksa esa dkQh tksf[ke c<+k gS] ysfdu ge ikrs gSa fd budh jksdFkke djuk ,d vR;Ur egRoiw.kZ leL;k gSA lkbcj lqj{kk dk mís”; MkVk] lalk/ku ¼tSls gkMZos;j tks HkaMkj.k vkSj x.kuk djrs gSa] l‚¶Vos;j vkSj dq”ky dfeZ;ksa½ dh j{kk djuk gSA lqj{kk ds mfpr rjhdksa vkSj rduhdksa ds enn ls laxBuksa ds MsVk vkSj lalk/kuksa vkSj vU; Li”kZ~; ,oa vLi”kZ~; laifÙk dh j{kk dj ldrs gSaA fofHkUu lkbcj geyksa dks le>uk vkSj muds jksdFkke ls [krjs dks de dj ldrs gSa vkSj vf/kd lqjf{kr lwpuk ç.kkfy;ksa dks çkIr dj ldrs gSA ;g vkys[k lkbcj geyksa ls j{kk ds fy, fofHkUu eqíksa] pqukSfr;ksa] vkSj jksdFkke ds rjhdksa dk o.kZu djrk gSaA
AbstrActMachines are not just omnipresent but are also interconnected. The immensely important but incredibly
short history of computers has reached a defining point. With the “cyber stuff” there are rapid and often unexpected consequences. Aspects of cyber security raise real risks but how we perceive and respond to them poses a more crucial problem. The purpose of cyber security is to safeguard data, resources such as hardware used for storage and computation, software and skilled personnel. Selection of proper security methods and techniques can help organizations protect their data and resources and other tangible and intangible possessions. understanding the various cyber attacks and their prevention can reduce the risk to attack and a more secure information systems can be obtained. This paper addresses the various issues, challenges, and prevention methods for protection against cyber attacks.
Keywords: Cyber attacks, cyber security, response team, security policies
Bilingual International Conference on Information Technology: Yesterday, Today, and Tomorrow, 19-21 February 2015, pp. 231-238© DESIDOC, 2015
1. IntroductIonModern life is fundamentally dependent on internet.
And the issues that result challenge everyone from businessmen to politicians. It affects us as individuals. There is possibly no issue that is so important and that touches so many and still remains so inadequately understood. Cyber security, also known as information technology security, aims at protecting devices, networks, programs, applications and data from unplanned or illicit access, change or damage. It aims to realize the full benefits of the digital revolution, provide users with the confidence that their sensitive information is secure, commerce is not compromised, and the infrastructure is not penetrated. nation states also need confidence that the networks supporting their national security and economic prosperity are safe and elastic.
2. PrEVioUs CYbEr AttACKsThese case examples prove that cyber crime is a
really expensive catastrophe: Bank of the West–A web site of a California
financial institution was attacked in 2012, distracting the officials from an online account takeover against its clients. The loss was estimated to be more than $900,0001.
Efficient Services Escrow Group – In 2013, a cyber theft of $1.5 million against a California escrow firm forced the company to shut down.
Target – Target fell victim to a massive data breach in 2013 compromising the e-mail, mailing address, phone numbers, and financial information of nearly 110 million customers.
nASA breach-uS space agency nASA has decided is to encrypt all its mobile computers after the loss of a laptop containing personal information about more
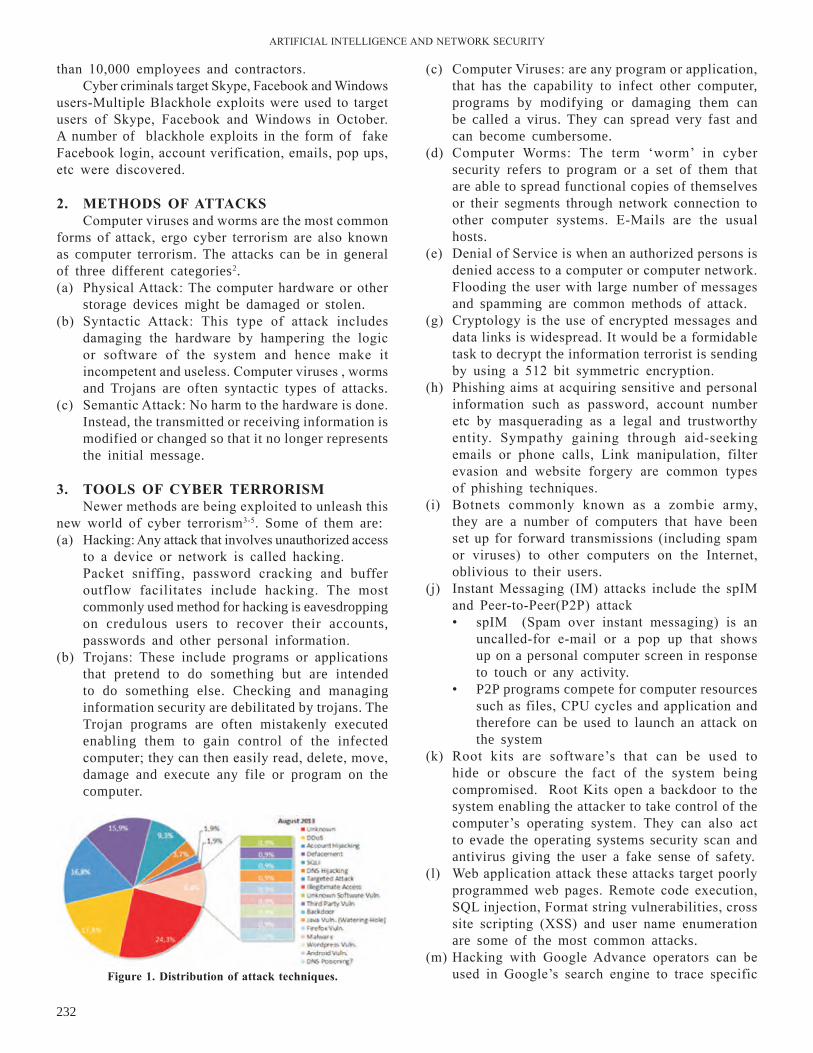
ArTIFICIAl InTEllIGEnCE AnD nETWOrK SECurITY
232
(c) Computer Viruses: are any program or application, that has the capability to infect other computer, programs by modifying or damaging them can be called a virus. They can spread very fast and can become cumbersome.
(d) Computer Worms: The term ‘worm’ in cyber security refers to program or a set of them that are able to spread functional copies of themselves or their segments through network connection to other computer systems. E-Mails are the usual hosts.
(e) Denial of Service is when an authorized persons is denied access to a computer or computer network. Flooding the user with large number of messages and spamming are common methods of attack.
(g) Cryptology is the use of encrypted messages and data links is widespread. It would be a formidable task to decrypt the information terrorist is sending by using a 512 bit symmetric encryption.
(h) Phishing aims at acquiring sensitive and personal information such as password, account number etc by masquerading as a legal and trustworthy entity. Sympathy gaining through aid-seeking emails or phone calls, link manipulation, filter evasion and website forgery are common types of phishing techniques.
(i) Botnets commonly known as a zombie army, they are a number of computers that have been set up for forward transmissions (including spam or viruses) to other computers on the Internet, oblivious to their users.
(j) Instant Messaging (IM) attacks include the spIM and Peer-to-Peer(P2P) attack
spIM (Spam over instant messaging) is an • uncalled-for e-mail or a pop up that shows up on a personal computer screen in response to touch or any activity. P2P programs compete for computer resources • such as files, CPu cycles and application and therefore can be used to launch an attack on the system
(k) root kits are software’s that can be used to hide or obscure the fact of the system being compromised. root Kits open a backdoor to the system enabling the attacker to take control of the computer’s operating system. They can also act to evade the operating systems security scan and antivirus giving the user a fake sense of safety.
(l) Web application attack these attacks target poorly programmed web pages. remote code execution, Sql injection, Format string vulnerabilities, cross site scripting (XSS) and user name enumeration are some of the most common attacks.
(m) Hacking with Google Advance operators can be used in Google’s search engine to trace specific
than 10,000 employees and contractors.Cyber criminals target Skype, Facebook and Windows
users-Multiple Blackhole exploits were used to target users of Skype, Facebook and Windows in October. A number of blackhole exploits in the form of fake Facebook login, account verification, emails, pop ups, etc were discovered.
2. MEthods oF AttACKsComputer viruses and worms are the most common
forms of attack, ergo cyber terrorism are also known as computer terrorism. The attacks can be in general of three different categories2. (a) Physical Attack: The computer hardware or other
storage devices might be damaged or stolen.(b) Syntactic Attack: This type of attack includes
damaging the hardware by hampering the logic or software of the system and hence make it incompetent and useless. Computer viruses , worms and Trojans are often syntactic types of attacks.
(c) Semantic Attack: no harm to the hardware is done.Instead, the transmitted or receiving information is modified or changed so that it no longer represents the initial message.
3. tools oF CYbEr tErrorisMnewer methods are being exploited to unleash this
new world of cyber terrorism3-5. Some of them are:(a) Hacking: Any attack that involves unauthorized access
to a device or network is called hacking. Packet sniffing, password cracking and buffer
outflow facilitates include hacking. The most commonly used method for hacking is eavesdropping on credulous users to recover their accounts, passwords and other personal information.
(b) Trojans: These include programs or applications that pretend to do something but are intended to do something else. Checking and managing information security are debilitated by trojans. The Trojan programs are often mistakenly executed enabling them to gain control of the infected computer; they can then easily read, delete, move, damage and execute any file or program on the computer.
Figure 1. distribution of attack techniques.
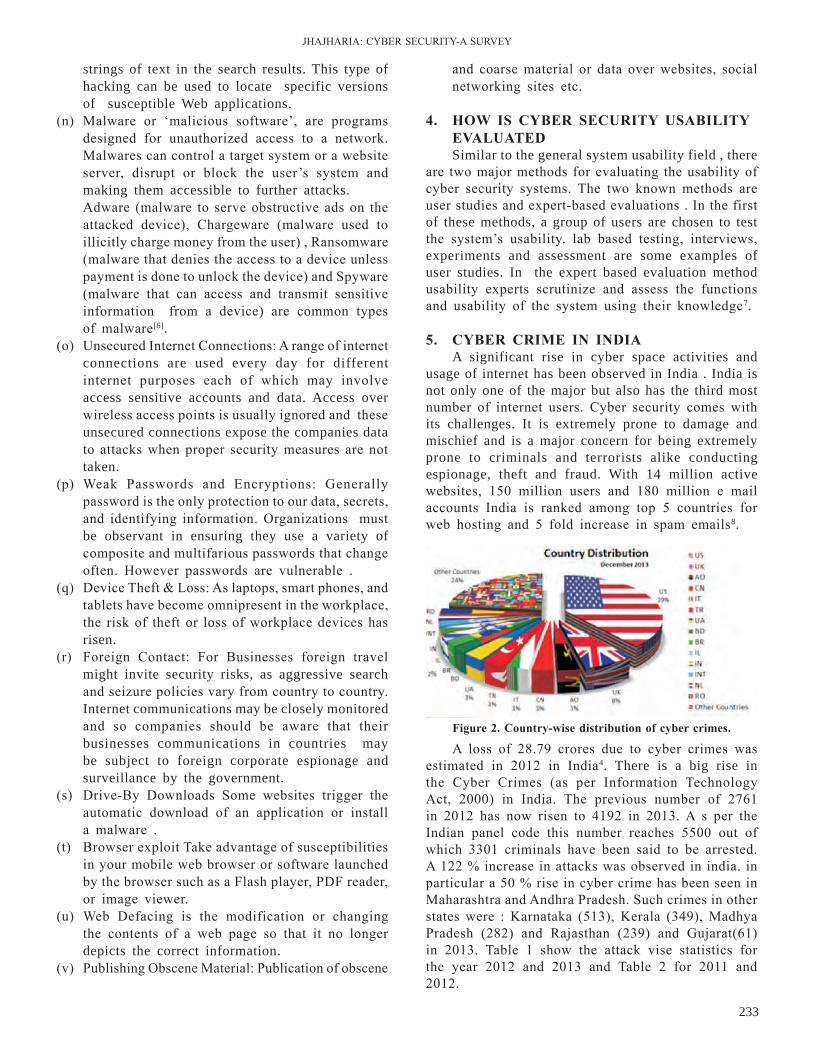
JHAJHArIA: CYBEr SECurITY-A SurVEY
233
strings of text in the search results. This type of hacking can be used to locate specific versions of susceptible Web applications.
(n) Malware or ‘malicious software’, are programs designed for unauthorized access to a network. Malwares can control a target system or a website server, disrupt or block the user’s system and making them accessible to further attacks.
Adware (malware to serve obstructive ads on the attacked device), Chargeware (malware used to illicitly charge money from the user) , ransomware (malware that denies the access to a device unless payment is done to unlock the device) and Spyware (malware that can access and transmit sensitive information from a device) are common types of malware[6].
(o) unsecured Internet Connections: A range of internet connections are used every day for different internet purposes each of which may involve access sensitive accounts and data. Access over wireless access points is usually ignored and these unsecured connections expose the companies data to attacks when proper security measures are not taken.
(p) Weak Passwords and Encryptions: Generally password is the only protection to our data, secrets, and identifying information. Organizations must be observant in ensuring they use a variety of composite and multifarious passwords that change often. However passwords are vulnerable .
(q) Device Theft & loss: As laptops, smart phones, and tablets have become omnipresent in the workplace, the risk of theft or loss of workplace devices has risen.
(r) Foreign Contact: For Businesses foreign travel might invite security risks, as aggressive search and seizure policies vary from country to country. Internet communications may be closely monitored and so companies should be aware that their businesses communications in countries may be subject to foreign corporate espionage and surveillance by the government.
(s) Drive-By Downloads Some websites trigger the automatic download of an application or install a malware .
(t) Browser exploit Take advantage of susceptibilities in your mobile web browser or software launched by the browser such as a Flash player, PDF reader, or image viewer.
(u) Web Defacing is the modification or changing the contents of a web page so that it no longer depicts the correct information.
(v) Publishing Obscene Material: Publication of obscene
and coarse material or data over websites, social networking sites etc.
4. how is CYbEr sECUritY UsAbilitY EVAlUAtEdSimilar to the general system usability field , there
are two major methods for evaluating the usability of cyber security systems. The two known methods are user studies and expert-based evaluations . In the first of these methods, a group of users are chosen to test the system’s usability. lab based testing, interviews, experiments and assessment are some examples of user studies. In the expert based evaluation method usability experts scrutinize and assess the functions and usability of the system using their knowledge7.
5. CYbEr CriME in indiAA significant rise in cyber space activities and
usage of internet has been observed in India . India is not only one of the major but also has the third most number of internet users. Cyber security comes with its challenges. It is extremely prone to damage and mischief and is a major concern for being extremely prone to criminals and terrorists alike conducting espionage, theft and fraud. With 14 million active websites, 150 million users and 180 million e mail accounts India is ranked among top 5 countries for web hosting and 5 fold increase in spam emails8.
A loss of 28.79 crores due to cyber crimes was estimated in 2012 in India4. There is a big rise in the Cyber Crimes (as per Information Technology Act, 2000) in India. The previous number of 2761 in 2012 has now risen to 4192 in 2013. A s per the Indian panel code this number reaches 5500 out of which 3301 criminals have been said to be arrested. A 122 % increase in attacks was observed in india. in particular a 50 % rise in cyber crime has been seen in Maharashtra and Andhra Pradesh. Such crimes in other states were : Karnataka (513), Kerala (349), Madhya Pradesh (282) and rajasthan (239) and Gujarat(61) in 2013. Table 1 show the attack vise statistics for the year 2012 and 2013 and Table 2 for 2011 and 2012.
Figure 2. Country-wise distribution of cyber crimes.

ArTIFICIAl InTEllIGEnCE AnD nETWOrK SECurITY
234
Existing Counter Cyber Security Initiatives national Informatics Centre (nIC) - A foremost organization acting as the network backbone and providing e-governance support to the state and Central Government, union Territories and Districts. It provides a spectrum of IT services including nationwide communication network for decentralized planning enhancement and better transparency of government.
Indian Computer Emergency response Team (Cert-In)—One of India’s most important constituency, cert in focuses on ensuring cyber space security and improving the information infrastructure. It also lays rules regarding security incident prevention and response and security assurance.
national Information Security Assurance Programme (nISAP)—This policy was mainly devised for governmental and significant other infrastructures with its highlights being:(a) Concerned infrastructures must have a security
policy and a point of contact to report any security
table 1. statistics of cyber attacks in india in the year 2012 and 2013.
name of attack 2012 statistics 2013(sep) statistics
e-mail messages received
44520 27909
Indian website defacement attack
23014 19886
proxy servers /bot infected systems tracked
6494717 5917695
Security drills 6 1
Security audits 6 16
Incidents handled 22060 42434
table 2. statistics of cyber attacks in india in the year 2012 and 2013.
name of Attack 2011 2012
Damage to physical storage systems . 826 1440
Damage of electronic evidence 9 9
Obscene publication/transmission in electronic form
496 589
Hacking 157 435
Attempt of illicit access 5 3
Obtaining license or digital signature by suppression/false fact.
6 6
Breach of privacy 26 46
Forgery 259 259
False electronic evidence 1 4
incident to Cert-In. (b) Cert-In to create a panel of auditor for IT security.
And All organizations inspect this panel once a year.
6. sECUritY PoliCiEs in indiA(1) national Cyber Security Policy India: It is a
proposed law by the Department of Electronics and Information Technology (DeitY), Ministry of Communication and Information Technology and the Government of India have proposed a national Cyber Security Policy which aims at safeguarding the public and private infrastructure from cyber attacks ergo protecting personal, financial and banking information. It aims to set up centers to promote research and development of cost efficient and tailor made security methods and the commercialization of such products.
(2) national Security Policy of India: it identifies the roles and responsibilities of the public and private sectors in cyber security, since they own the majority of the infrastructure.
(3) national Telecom Security Policy of India: The policy aims for socio-economic development by providing secure, reliable, cheap and good quality telecommunication services [9]. It also aims to create an environment that is investor friendly and create job opportunities in various sectors. It lays special emphasis on rural and village areas10.
(4) E-Mail Policy of India: The email policy of India further includes the following policies:
(a) Management of email accounts and their effective use according to the effective email services and use policy.
(b) Password and security policy for users (c) nIC Policy on format of e-mail address (d) Password policy (e) Security policy for user (f) Service level agreement
The Indian government has further decided to come up with a new email policy that will secure official communications in the government.(5) Cyber Security Awareness in India: Seminars
are organized on diverse subjects by the Cyber Security Awareness society in several cities of India in order to improve the level of security preparedness.
(6) Cyber Security Disclosure norms in India: The Indian government has planned to bring a legislation that would discuss cyber security disclosure rules. If a company becomes a prey of a cyber attack, the company is expected to divulge the details about its impact to the clients on the safety of their data and information and in some cases to the government too11.
JHAJHArIA: CYBEr SECurITY-A SurVEY
235
research & response, worm propagation and detection, targeted remote malware clean-up, advanced persistent threat countermeasure, anomaly detection for zero-day attack, intrusion detection systems, SPAM detection & filtering, antivirus and anti-malware research, exploitation and reverse engineering, among others is being conducted at various centers. Research on advancement of automated tool to simulate human hackers, is also being conducted.
9.2 next Generation Firewallresearch organizations are also working in future-
ready security solutions and multi identity-based technology such as next generation firewall, that offer security intelligence to enterprises and enable them to apply required and best suited security controls at the network perimeter. Integration of aforesaid technology with other security solutions such as threat intelligence and management systems, Web application firewall, web filtering, anti-virus, anti-spam, etc, will help in creating more efficient and secure ecosystem.
9.3 secured Protocol and AlgorithmsIn India, research has also been undertaken at
protocol and algorithm level such as secure routing protocols, efficient authentication protocols, reliability enhanced routing protocol for wireless networks, secure transmission control protocol and attack simulation algorithm, etc.
9.4 Authentication techniquesIn the country, research is moving towards
authentication techniques such as key management, two factor authentication, automated key management which provides the ability to encrypt and decrypt without a centralized key management system, File protection both on rest as well as in transit, access controls solutions on cloud, among others.
9.5 bYod, Cloud and Mobile securityApplication, network and Mobile security testing
technologies, BYOD risk mitigation, Cloud security assessment and protection are some of the areas where advancement of technologies is taking place through r&D activities.
9.6 Cyber ForensicsIn India, the research is being carried out to build
indigenous capabilities for cyber forensics. Some of the specific areas in which research is taking place in the country are: Disk forensics, network forensics, mobile device forensics, memory forensics, multimedia forensics and internet forensics.
Other areas in which researches are being undertaken are internet monitoring systems, extensive web security,
Other policies include imported software and telecom equipment security, cyber security of e-governance, cyber security of private banks in India, mobile payment cyber security, cyber security capabilities12.
7. ChAllEnGEs And ConCErnsSome challenges and concerns are highlighted
below:(a) lack of knowledge about the practices and the
culture of cyber security at personal as well as organizational level.
(b) lack of skilled and trained professionals to device the counter measures.
(c) lack of funds for the many information security organizations that have been set up.
(d) A weak and redundant IT Act subject to*6 non exploitation and age old cyber laws13.
8. rECoMMEndAtionsCertain recommendations are given below:
(a) need to educate the common citizens about the dangers of cyber terrorism.
(b) Joint effort is required by all Government agencies order to attract skilled personnel for implementation of counter measures.
(c) Financial and governmental support should be given to all organizations working for cyber security. monopoly should not be permitted.
(d) Agreements, issues and research relating to cyber security should be given due and not be neglected.
(e) Close vigil on potential adversaries should be kept and policies should be renewed based on this study.
9. rEsEArCh ArEAs in indiAquantum cryptography and secure multiparty
computation r&D activities in India are focused both on the contemporary requirements and high-tech and futuristic need of security in cyberspace. Research in futuristic area such as quantum cryptography which allows conducting various cryptographic tasks that are proven to be impossible with classical processing is being undertaken by the researchers. This results in a highly secured communications (such as sharing of keys or sharing of information which is accessible to the receiver only at a specific location) and allows detection and elimination of eavesdropping during the transit.
9.1 threat intelligenceResponse to cyber threats has changed to reactive
from the previous proactive. This change now makes necessary the need of a robust threat intelligence system for defence. Research in areas such as threat
ArTIFICIAl InTEllIGEnCE AnD nETWOrK SECurITY
236
wireless network security enhancement, VOIP security, encryption & cryptography, and encryption as a service among others.
9.7 Mobile devices and Apps The rapid growth of mobile devices demands an
equal growth in security. Every device, is just another window for a cyber attack and is another susceptible access point to network14.
9.8 social Media networking The growing use of social media contributes
more and more for the increase in personal cyber threats. To combat the risks, companies will need to look beyond the basics of policy and procedure development to more advanced technologies such as data leakage prevention, enhanced network monitoring and log file analysis15.
9.9 Cloud Computing More and more companies are shifting to cloud
computing for its efficiency and cost savings. A well devised security measure will help organizations to administer the risks of cloud computing. cloud security is yet to get its due attention. As indicated by recent surveys and reports, companies are underrating the significance of security.
9.10 Protect systems rather information The emphasis should be on protecting information,
not just systems. As more and more data is stored online instead of computer systems the security requirements will go beyond simply managing systems to protecting the data these systems house.
9.11 Everything Physical can be digital
Information written manually on a piece of paper, the report binders and even the pictures or photos can be converted to digital format and gleaned for misuse. This type of misuse requires special security management techniques and research is yet to be started in this area5.
Other areas include network and system security, monitoring and forensics and vulnerability remediation and assurance4.
10. tEChniQUEs sPECiFiC CYbEr sECUritY tEChnoloGiEsThere are various tools that have been designed for
intrusion detection. For early detection and minimization of loss these tools can be used.(a) Global intrusion detection tools (i.e. intrusion
detection systems) monitor and analyze network traffic data for suspicious patterns and generate alerts for patterns that are matched. For many
network security engineers, this is the main way in which they detect attacks.
(b) logs (e.g., network traffic capture tools) containing detailed information, coupled with the engineers expertise helps network security engineers to understand and assess the situation when an intrusion occurs. Typically, engineers filter through the data using textual commands in a computer shell.
(c) Public information sources (e.g., e-mailing lists) provide details of the latest intrusions and attacks. It should be kept up-to date.
(d) Code Samples enable engineers to better understand an intrusion as well as help engineers to find vulnerabilities in the network that a given intrusion exposes.
(1) Access Control and Identity Management-The username/password/authorization are the fundamental combinations that have proven to be sufficient.
(2) Authentication- Documents can be authenticated using watermarks or digital signatures in order to verify the involved parties in a communication and to ensure the original state of the document.
(3) Malware scanners- Software that can detect the presence and eradicate malicious content in a device.
(4) Firewalls- A firewall program monitors the incoming and outgoing traffic and intervenes if an unauthorized access is detected.
(5) Cryptography-Data can be stored or transmitted in an encrypted form to make it difficult to be accessed and read.
(6) Anti-Virus Software-Anti virus and anti phishing software should be installed on every device and updated regularly. Some well known software’s that can identify
suspicious events and collect data regarding them (like date, time, possibly the source and destination address and type of attack) are realized below:(a) Snort: It is a network intrusion detection and
prevention system that can analyze the at traffic and packet logging on IP networks. It uses protocol analysis, pre-processors and content searching to detect worms, exploits and illicit access. Also it can decide whether to collect or pass traffic based on a flexible rule-based language.
(b) OSSEC: The open source host-based intrusion detection system can perform log analysis, file integrity checking, policy monitoring, root kit detection, real-time alerting and active response.
(c) Backlog :It’s a software to collect and evaluate Event log information.
(d) System intrusion analysis & reporting environment (SnArE): It detects any host-based intrusion.
(e) Precursor like Honey pot logs can collect information
JHAJHArIA: CYBEr SECurITY-A SurVEY
237
on precursors.. (f) Third-party monitoring service: A third party can
monitor the the publicly accessible services, such as web, domain name system (DnS) and FTP servers of a company.
11. rEsPondinG to CYbEr inCidEntsAlthough focusing on preventive measures is
important it should be made clear that no preventive measures are 100% effective and hence an organization must be prepared for any cyber attack.
Even small institutions should be ready for the after effects of a cyber incident and ensure that its resources are being used efficiently and wisely.
An effective incident response (“Ir”) plan will likely lead to faster and better choices, which in turn will help to mitigate any damage that may have been caused[16].
Forming an Incident Response Team In forming an IR team, roles and responsibilities
have to be assigned and made communicated. Whom to contact in case of an attack should be clear17.
Response Planning next, outline the basic steps of Ir plan by establishing
checklists and clear action items.the following steps might be useful in responding to a cyber incident (a) Don’t turn off your computer in the event of a
cyber incident, the attacked device may contain information critical to analyzing the incident and switching off may destroy evidence and erase clues that might help a forensic expert .
(b) Contact law enforcement-Many law enforcement organizations have specialized and experienced personnel and computer experts in their e-crime sections that can help in investigation .
(c) Document the expected reach and impact of the attack. Document and circulate the current known and recorded facts about the. Facts such as the reason for suspicion, progress in the analysis and loss estimated may be included.
(d) Determine notification requirements. The real challenge is in detecting, analysing, containing, handling and covering of a breach. There might arise a need to consider outside help if the capability to respond to the incident internally is not there. Retain the information and software on the system, don’t alter the database and network device logs.
12. ChAllEnGEsCyber security challenge that target individuals
or organizations may result in the loss of sensitive information, financial loss, facilitate repeat attacks, or facilitate a distributed denial of service attack3.
Many users are unaware of how their computers might be compromised by malware. They may not even know that their devices could be used without their knowledge. Another challenge is the slow pace in tackling malicious activities , unexpected and new forms of cyber crime. The problem of not having a continuous availability of internet access is going to increase with the increase in societal dependence on cyber space. network devices can be targeted physically. Rapidly changing security and threat landscape. Responsibility to ensure that proper processes, technology, governance structure and compliance to laws and regulatory requirements are followed in a border less environment. Growth in the volume and complexity of the IT industry and the need for security measures for them.
Information security should be based on following eight major elements (a) The method applied should be in accordance with
the objectives, policies , rules and present and future needs of an organization.
(b) Protection methods must be economical. Employed method should be proportional to the level of estimated risks.
(c) For any program to be effective to cyber security policy must be made explicit and communicated well. The policies should clearly identify roles and responsibilities of different groups.
(d) If any system has external users then their activities should be clearly monitored and apt security measures should be taken.
(e) Awareness: Access to any knowledge pertaining to the security measures, methods and techniques should be allowed.
(f) Ethics: Any security measure installed must be in accordance with the interests of the user. users privacy and rights should not be violated.
(g) Multidisciplinary principle: All aspects and opinion of educational , legal , administrative, directorial, operational, market and technical aspects must be evaluated in the formulation of policies, procedures and techniques.
(h) A comprehensive and integrated approach. Is required for Information protection to be effective. Security should be made a part of the development process. For example, information security can include risk analysis, a business impact analysis and information classification document during the initial or analysis phase.
(i) Cyber security measures should be periodically reassessed in order to improve their functionality and with respect to time, need and objectives. MnC’s must make special adjustments depending on the various countries they are located at17,18.

ArTIFICIAl InTEllIGEnCE AnD nETWOrK SECurITY
238
13. FUtUrE sCoPEWhile it’s difficult to summarize where the future
of cybersecurity lies, it is important to pay attention to the present key trends that demand more research. cheaper and handy devices for computations and storage in the future may create a need to understand and analyze security at a whole new level. Better tools to understand the ever growing data set can yield unparalleled knowledge but may also break down boundaries (social, legal and ethical) that humans aren’t prepared to scout. It is required that We accept and manage the risks both real and online because of all that they provide us.
14. ConClUsionEveryone irrespective of their roles in society must
be involved In making decisions about cyber security that could help shape the future beyond the world of computers. Basic terms, concepts and knowledge that define what is possible, legal and proper are being missed and are often vague. This paper aims to bridge the gap between threats that are overblown and others that are missed17.
fu"d"k Zgj O;fä lekt es mudh fdlh Hkh Hkwfedk ds ckotwn
lkbcj lqj{kk ls lEcfU/kr fu.kZ;ksa esa Hkkx ys ldrk gSa ftlls og daI;wVj dh nqfu;k ls ijs Hkfo’; dks vkdkj nsus esa enn dj ldrk gSA cqfu;knh “kCnkoyh] fo’k; vkSj Kku tks crkrs gSa fd D;k lEHko] dkuwuh vkSj mfpr gSa vDlj xk;c vkSj vLi’V jgrs gSaA bl vkys[k dk mís”; [krjs ¼tks gn ls T;knk½ gSa vkSj [krjs ¼tks vuqifLFkr gS½ ds chp ds varj dks Hkjuk gSaA
15. ACKnowlEdGMEntI would like to take this opportunity to thank and
express my deep respect and regard Dr S.K. Pal and Dr Seema Verma for their exemplary guidance, constant encouragement and valuable feedback throughout the preparation of this paper. Their valuable suggestions were immensely helpful and working under her was a knowledgeable experience.
rEFErEnCEs1. http://oag.ca.gov/cybersecurity2. h t tp : / /www.gs- today.com/2014/03/31/cyber-
security/3. COl S.S. raghav. Cyber Security In India’s
counter terrorism strategy. 4. Ministry of Communications and Information
Technology. Cyber crime, cyber security and right to privacy fifty-second report.
5. ravi Sharma. Study of latest emerging trends on cyber security and its challenges to society.
6. Kamala D. Harris. Cybersecurity in the golden state.
7. Jason r. C. nurse, Sadie Creese, Michael Goldsmith, Koen lamberts. Guidelines for usable cybersecurity: Past and present.
8. http://hackmageddon.com/2013-cyber-attacks-statistics/
9. http://cis-india.org/telecom/resources/national-telecom-policy-2012
10. http://perry4law.org/cecsrdi/?p=70511. http://perry4law.org/cecsrdi/?p=54412. The Comprehensive national Cybersecurity
Initiative13. Atul M. Tonge, Suraj S. Kasture, Surbhi r.
Chaudhari. Cyber security: challenges for society- literature review.
14. Atul Kumar, Chiranshu Ahuja. Cyber security research developments.
15. http://patriot-tech.com/predictions-future-of-cyber-security/
16. Federal Communications Comission. Cyber Security Planning Guide.
17. Dan Shoemaker, Wm. Conklin. Cybersecurity: The Essential Body Of Knowledge.
18. Peter W. Singer, Allan Friedman. Cybersecurity: What everyone needs to know.

lkbcj lqj{kk dh pqukSfr;k¡Challenges in Cyber security
rajesh Kumar GoutamDepartment of Computer Science, University of Lucknow, Lucknow, India
E-mail: [email protected]
lkjka”k
lwpuk vkSj lapkj çkS|ksfxdh ds {ks= esa çxfr us ns”kksa dks tYnh lwpuk vknku&çnku ds fy, muds lapkj usVodZ dks csgrj djus dh lqfo/kk çnku dh gSaA dbZ ?kjsyw vkSj varjjk’Vªh; vkradoknh lewgksa us lkbcj geys ds fy, usVodZ ls tqMs gq, dEi;wVjksa dh –f’Vr detksfj;ksa dks y{; cuk;k gSaA fiNys nks n”kdksa esa] lkbcj geyksa us vius ifj–’; dks dkQh cny x;k gSA lkbcj vkradokfn;ksa lewgksa usa lefUor lkbcj geyksa ds fy, dkQh tfVy çkS|ksfxdh dk bLrseky vkSj dq”ky lkbcj fo”ks’kKksa dh HkrhZ dh gSaA ;g vkys[k lkbcj geyksa ds fofHkUu rjhdksa dh tkap djrk gSa vkSj lkbcj lqj{kk ds {ks= esa fofHkUu pqukSfr;ksa ij çdk”k Mkyrk gSaA
AbstrActAdvancements in information and communication technology have facilitated countries to develop
and improve their communication networks for quick information exchange. Many domestic and international terrorist groups target networked computers with exposed vulnerabilities for cyber attack. In past two decades, cyber attacks have changed its landscape tremendously. Cyber terrorists groups are applying more sophisticated technology and recruiting skilled cyber experts to conduct coordinated cyber attacks. The paper investigates the different methods of cyber attacks and highlights the various challenges in cyber security.
Keywords: Cyber-security, cyber-terriorism, cyber space
Bilingual International Conference on Information Technology : Yesterday, Today, and Tomorrow, 19-21 February 2015, pp. 239-243© DESIDOC, 2015
1. IntroductIonWith the emergence of internet it became possible
to retrieve information quickly with minimum human efforts. As far as we know, it is the only medium that can advertise business in very short time across the globe. Exponential growth of internet also affected India positively as it has faced significant rise in web related activates in last three decades. India is ranked on third position in the usage of internet after uSA and China[9]. It is considered one of the popular IT destination in the world. The growth in the usage of internet and networking has empowered the individuals and posed new challenges to governments and cyberspace administration as well.
Cyber security is now being considered as a major concern across the world as it is being exploited by criminals, hackers and terrorists to succeed in identity theft and financial fraud. Terrorists are using internet as a weapon to carry out their activities and stealing information from different countries. The emergence of mobile phones also added more complexities in cyber world. Moreover, complicated and malicious software damage more often computer systems and block the network as well. All these established the
cyber security as global issue for development of economy and national security.
2. CYbEr sECUritY And CYbEr tErriorisMCybersecurity threats from well-funded and
motivated adversaries are capable to disturb critical services provided by private organizations at home and abroad[14]. Threats are targeting core services of the government, economy and national security infrastructure, creating a shared risk for both public and private sectors.
2.1 Cyber securityThe word “Cyber” has been taken from the world
“Cybernetic” that means by using the computer [1]. Cybernetic covers the theory of communication and control of regulatory feedback. The word “Cyberspace” is very common in today’s computational world was introduced by W. Gibson in his novel “neuromancer” in reference to internet in 1991[1].
Cyberspace security is now being considered as common and international problem[11]. The term “Cyberspace” denotes the fusion of all communication

ArTIFICIAl InTEllIGEnCE AnD nETWOrK SECurITY
240
3. MEthods oF CYbEr AttACKA cyber attack towards the computer and network
may interrupt equipment performance and network reliability, often changes processing logic and performs the task of stealing and corrupting data [2]. Various cyber attack modes use different kind of vulnerabilities with different cyber weapons. On the basis of our literature survey, we identified three major categories of cyber attack that are described below.
3.1 Physical Attack ConventionalThis is conventional weapon that can be directed
towards computer hardware, computer facility and transmission lines [2]. Physical attacks often interrupt the performance of equipments, fragment the memory and generate circuitry heat and unusual manipulation in network lines. In 1991, u.S. armed forces interrupted the Iraqui communication lines through the use of cruise missiles and sprinkled carbon filaments to short circuited communication line[2]. On September 11, 2001, Al qaeda diminished World Trade Centre and Pentagon, during this attack, number of database linked globally, were destroyed[2].
3.2 Electronic Cyber AttackCyber attacks are inexpensive and easy to conduct
[12] [13]. An electronic attack includes the power of electromagnetic energy like a weapon. Intruders often use electromagnetic pulse (EMP) to create power and signal fluctuation to damage computer circuitry. now a days EMP is being considered as a dangerous weapon for cyber security. An EMP is defined as the burst of electromagnetic radiation generated during the detonation of nuclear weapon or when a non-nuclear EMP is used [3]. EMPs can be so high frequency as the flash of light beam. An EMP takes less than a nanosecond to grow and continue for longer hours[3]. The consequences of an EMP include physical damage of electronics instruments, short circuiting and electric shocks to people.
3.3 Computer network AttackA computer network attack (CnA) includes
malicious program code to infect computer to harm computer Software, configuration and security as well in any targeted organization. It affects the integrity or authenticity of existing data, often changes logic, control and processing of data that result the error in output[2]. If a computer is injected with malicious code, the system can be remotely controlled easily by hackers. Computer network attack actually targets that system that has software errors or lack of antivirus and firewalls[2].
networks, various databases and different information channels in huge [1]. It is interconnected global digital infrastructure that comprises of internet, telecommunications networks, computer systems, processors and various controllers in different organizations. The Cyberspace includes computer systems, mobile-phones, tablets, computer networks and internet as well. Cyberspace becomes anonymous and borderless in nature. The internet user can access any node connected to the global network from any part of earth. It is very easy for professional hackers to mask their identity and impersonate. It becomes virtual and spread globally, exists in presence of telephone wires, coaxial cables and other transmission media. The term Cyber security concerned with making cyberspace safe from threats, namely cyber-threats [1]. Cyber security includes technologies, processes and practices used to protect networks, computer hardware, software, programs, information and data from attack, damage or unauthorized access. In context of computing, the term security denotes cyber security that includes various elements such as application security, information security, network security and data recovery.
2.2 Cyber-terriorism and botnetThe treat of terrorism has presented large number of
challenges in cyber-war period. Terrorists are targeting to major cities, research laboratories across the globe and making communication channel unsecure. Although few serious efforts have been made in this direction but seems inefficient as most of mechanism are based on conventional paradigm. These conventional mechanisms become effective only in conventional cyber attack. The rapid growth of Information Technology (IT) has laid a huge database of information about anything and everywhere. unfortunately, this growth is also adding a new dimension to terrorism. Few recent researches support this fact that terrorist are recruiting best cyber security players at higher compensation.
Cyber-terrorism denotes unlawful attacks and threats of attacks against computers, networks and information contained in [2]. It is done to intimidate or pressurize a government and its people for political benefits or social objective. Cyber-terrorism takes place when cyberspace and terrorism converge. According to Denning, “Cyber-terrorism is an attack that includes violence against persons to generate fear”[4]. Cyber criminals often inject vulnerability in computers on network and gains control over, install various programs with ability to keep track of all their cyber crime related activities. A set of such types of computers under control of terrorist group or individuals is known as ‘Botnet’.

GOuTAM: CHAllEnGES In CYBEr SECurITY
241
4. ChAllEnGEs in CYbEr sECUritYAs the use of information technology is growing
rapidly worldwide. Significant increase in cyber related activities and large utilization of internet resulted more chances for cyber related crimes. Due to lack of adequate knowledge about system protection and possibility of anonymous, result cyber crimes in society. Several countries have witnessed significant increase in spamming, virus infection and worm infection. India is also experiencing the cyber security problems with various challenges as discussed below.
4.1 Cyber security is borderlessFor most of us the internet is essential part of
our daily routine to keep in touch with social media, academics, online shopping and paying bills. In our profession, we also use internet and other information technologies to enhance efficiency, quality of services and to access new markets across the world. As internet offers large number of benefits, there are also security challenges related with its use. rapid use of internet has established new opportunities for criminals and terrorists to access our personal and corporate information. The major problem with the cyber security is its borderless nature[5].
As the cyberspace connects the system across the world so it often becomes difficult to locate the origin of attack.
4.2 Anonymity of ActorsAlthough we are actively fighting and preventing
cyber crime related activities from damaging hardware and infrastructure but it is difficult to locate the origin of cyber attack. In the virtual cyberspace it becomes difficult to locate the political borders and culprits as well[5].
The major problem in cyber security is the identification of actors in a virtual space where acquiring anonymity is easy and where period gap between the intruder action and its effects. In addition, the continuous rapid growth of sophisticated computer technologies among the skilled population also makes reorganization of the attackers extremely difficult.
4.3 Fuzziness of terminologyThe fuzziness of terminology is also a major
problem in reference to develop global rules for cyber security that diminishes the capability of policymakers to prepare the rules for world population [6]. In addition, cyber security is defined in different various ways and several different cyber terms are being used with the same intention.
There is no globally accepted definition of cyber security and cyber crime, various terms are in use with related meanings.
4.4 large and AmorphousCyberspace is large, amorphous and continuously
growing in nature. It is virtual and interconnected worldwide. It does not cover any physical or geographical area. The complexity of cyberspace is mounting day-by-day, because of links between computers, mobiles, tablets, servers, routers and other components of the Internet’s infrastructure. Cyberspace includes complex technologies, whose expansion, construction and existence are imagined only during the process of maintenance. It is difficult to chart or map to cyberspace.
4.5 speed of technology developmentIT is still considered as an innovative and dynamic
sector that is continuously emerging new technologies rapidly. The time period between evolution of new vulnerability and the development of a sophisticated tools or techniques that fail the cyber attacks is getting shorter. In other words, the technologies we are developing are not efficient for long term. We are still unable to develop a technology that can permanently prevent the cyber attacks. We are required continuous efforts to tackle with this problem. As it is confirmed that world is facing cyber army problem and very few experts are able to present the solution of sophisticated cyber attacks. On the other hand, cyber attackers, criminals, hackers and cyber terrorists are executing their planning world widely. It becomes very essential for us to form a capable cyber army that can save us from financial fraud and information loss.
4.6 tracking the origin of CrimeInternet was never constructed to track and trace
the behavior of users[8]. The Internet was actually constructed to link autonomous computers for resource sharing and to provide a common platform to community of researchers [8]. It was constructed to expand the different possible usage of networking. It is very important for a nation to track and trace the origin of any cyber attack and infrastructure to block such types of attacks for nation’s long term survival and prosperity. A better cyber security tracking and tracing infrastructure can restrict future cyber attacks. The process of tracking and tracing a cyber attack often results sufficient details about the technologies being used in the attack and criminals as well. Time is also an important factor during the identification and tracking of cyber treats. How quickly you identify the cyber attack and present solution to interrupt the progress of attack is also important.
4.7 shortage of Cyber ExpertisationToday, world is facing rapid increase in the
number of cyber attacks in government offices, private organizations and companies. requirement for skilled
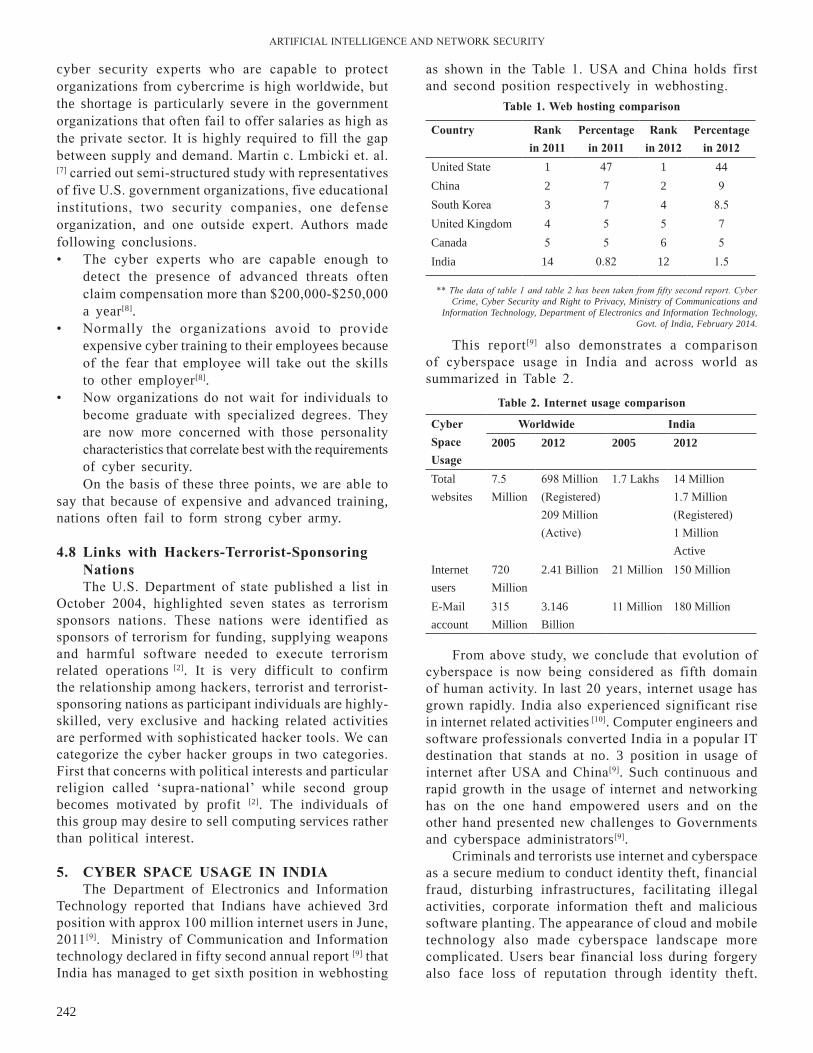
ArTIFICIAl InTEllIGEnCE AnD nETWOrK SECurITY
242
cyber security experts who are capable to protect organizations from cybercrime is high worldwide, but the shortage is particularly severe in the government organizations that often fail to offer salaries as high as the private sector. It is highly required to fill the gap between supply and demand. Martin c. lmbicki et. al. [7] carried out semi-structured study with representatives of five u.S. government organizations, five educational institutions, two security companies, one defense organization, and one outside expert. Authors made following conclusions.• The cyber experts who are capable enough to
detect the presence of advanced threats often claim compensation more than $200,000-$250,000 a year[8].
• normally the organizations avoid to provide expensive cyber training to their employees because of the fear that employee will take out the skills to other employer[8].
• now organizations do not wait for individuals to become graduate with specialized degrees. They are now more concerned with those personality characteristics that correlate best with the requirements of cyber security.On the basis of these three points, we are able to
say that because of expensive and advanced training, nations often fail to form strong cyber army.
4.8 links with hackers-terrorist-sponsoring nationsThe u.S. Department of state published a list in
October 2004, highlighted seven states as terrorism sponsors nations. These nations were identified as sponsors of terrorism for funding, supplying weapons and harmful software needed to execute terrorism related operations [2]. It is very difficult to confirm the relationship among hackers, terrorist and terrorist-sponsoring nations as participant individuals are highly-skilled, very exclusive and hacking related activities are performed with sophisticated hacker tools. We can categorize the cyber hacker groups in two categories. First that concerns with political interests and particular religion called ‘supra-national’ while second group becomes motivated by profit [2]. The individuals of this group may desire to sell computing services rather than political interest.
5. CYbEr sPACE UsAGE in indiAThe Department of Electronics and Information
Technology reported that Indians have achieved 3rd position with approx 100 million internet users in June, 2011[9]. Ministry of Communication and Information technology declared in fifty second annual report [9] that India has managed to get sixth position in webhosting
as shown in the Table 1. uSA and China holds first and second position respectively in webhosting.
table 1. web hosting comparison
table 2. internet usage comparison
Country rank in 2011
Percentage in 2011
rank in 2012
Percentage in 2012
united State 1 47 1 44China 2 7 2 9South Korea 3 7 4 8.5united Kingdom 4 5 5 7Canada 5 5 6 5India 14 0.82 12 1.5
This report[9] also demonstrates a comparison of cyberspace usage in India and across world as summarized in Table 2.
** The data of table 1 and table 2 has been taken from fifty second report. Cyber Crime, Cyber Security and Right to Privacy, Ministry of Communications and
Information Technology, Department of Electronics and Information Technology, Govt. of India, February 2014.
Cyber space Usage
worldwide india2005 2012 2005 2012
Total websites
7.5 Million
698 Million (registered)209 Million (Active)
1.7 lakhs 14 Million1.7 Million (registered)1 Million Active
Internet users
720 Million
2.41 Billion 21 Million 150 Million
E-Mail account
315 Million
3.146 Billion
11 Million 180 Million
From above study, we conclude that evolution of cyberspace is now being considered as fifth domain of human activity. In last 20 years, internet usage has grown rapidly. India also experienced significant rise in internet related activities [10]. Computer engineers and software professionals converted India in a popular IT destination that stands at no. 3 position in usage of internet after uSA and China[9]. Such continuous and rapid growth in the usage of internet and networking has on the one hand empowered users and on the other hand presented new challenges to Governments and cyberspace administrators[9].
Criminals and terrorists use internet and cyberspace as a secure medium to conduct identity theft, financial fraud, disturbing infrastructures, facilitating illegal activities, corporate information theft and malicious software planting. The appearance of cloud and mobile technology also made cyberspace landscape more complicated. users bear financial loss during forgery also face loss of reputation through identity theft.
GOuTAM: CHAllEnGES In CYBEr SECurITY
243
website of the Department of Homeland Security. release date: September 12, 2012. Available at http://www.dhs.gov/news/2012/09/12/written-testimony-nppd-house-homeland-security-subcommittee-cybersecurity.
4. Denning, D. Cyberterrorism, Testimony before the Special Oversight Panel of Terrorism Committee on Armed Services, uS House of representatives, 23 May 2000.
5 Kpmg International Issues Monitor. Cyber Crime –A Growing Challenge for Governments, Volume 08, July 2011.
6. Eric A. Fischer. Creating a national Framework for Cyber security: An Analysis of Issues and Options, CrS report for Congress, February 2005.
7. Martin C libicki, David Senty and Julia Pollak. An Examination of the Cybersecurity labor Market, rAnD national Security research Division.
8. F. lipson. Tracking and Tracing Cyber-Attacks: Technical Challenges and Global Policy Issues, Carnegie Mellon Software Engineering Institute, Pittsburgh, november 2002.
9. A Fifty Second report. Cyber Crime, Cyber Security and right to Privacy, Ministry of Communications and Information Technology, Department of Electronics and Information Technology, Govt. of India, February 2014.
10. A report from IDSA. India’s Cyber Security Challenges, Institute For Defense Studies and analysis March 2012.
11. IGCC Workshop report on China and Cybersecurity: Political, Economic, and Stratgic Dimensions, held at the university of California, San Diego April 2012.
12. nathalie Caplan. Cyber War: the Challenge to national Security, Journal of Global Security Studies, Vol. 4, 2013.
13. Adam C. Tagert. Cybersecurity Challenges in Developing nations, Dissertation, Carnegie Mellon university, Carnegie Mellon university, December 2010.
14. Br Business roundtable report. More Intelligent, More Effective Cybersecurity Protection, January 2013.
In India, More than 100,000 virus/worms are reported to be active daily on internet and 10,000 out of which are new and unique that presume how cyber criminals and attackers are active [9].
6. ConClUsionIn this paper, we look at how the topic cyber
security is important for our society and why it is being a central concern in whole world. We have focused our attention to three methods of cyber attacks that are being used by cyber-terrorists and hackers and examined some recent attacks with involvement of these methods. Further, we examine major challenges available in cyber security and showed that how it is difficult to locate the origin of cyber crime. Finally, we have shown that India has been established as popular IT destination and experiencing the problems of cyber security and shortage of cyber experts as well.
fu"d"k Zbl vkys[k esa] ge ;g ns[krs gS fd lkbcj lqj{kk fdl
çdk”k gekjs lekt ds fy, egRoiw.kZ gSa vkSj iwjh nqfu;k esa fpark dk dsaæ gSaA ge lkbcj vkradokfn;ksa vkSj gSdlZ }kjk bLrseky fd, x, rhu lkbcj geyksa ij /;ku dsfUær djsaxs vkSj bu rjhdksa ds bLrseky ls gky ds fd, x, geyksa dh tkap djsxsaA blds vykok] ge lkbcj lqj{kk esa çeq[k pqukSfr;ksa dh tkap djsaxs vkSj ;g crk,xsa fd lkbcj vijk/k dk L=ksr dks <w<uk D;ksa eqf”dy gSaA var esa] Hkkjr esa yksdfç; lwpuk çkS|ksfxdh laLFkkuksa dh LFkkiuk vkSj lkbcj lqj{kk esa vuqHko dh tkus leL;k,¡ vkSj lkbcj fo”ks’kK dh deh dks n”kkZ;k x;k gSaA
rEFErEnCEs1. A Comparative Analysis of Cyber security Initiatives
Worldwide, WSIS Thematic Meeting on Cyber security, International Telecommunication union, Geneva, July 2005.
2. Clay Wilson. Computer Attack and Cyberterrorism: Vulnerabilities and Policy Issues for Congress, Congressional Research Service Report for Congress, April 2005.
3. A testimony of national Protection and Programs Directorate Infrastructure Analysis and Strategy Division. The Electromagnetic Pulse (EMP) Threat: Examining the Consequences, available at Official
lqj{kk dkjdksa vkSj vksvks fMtkbu daLVªDV~l ds chp varj dks ikVukbridging the Gap between security Factors and oo design Constructs
Shalini Chandra and raees Ahmad KhanBBA University (A Central University), Lucknow, India
E-mail: [email protected]
lkjka”k
gekjs nSfud thou dh O;kikj çfØ;kvksa esa mi;ksx dh tk jgh çkS|ksfxdh esa rsth ls gks jgh çxfr fuf'pr :i ls n{krk vkSj mRikndrk dks c<+krh gS] ysfdu ;g l‚¶Vos;j dh lqj{kk ds çfr fpark djus ds fy, ck/; djrh gSA vksvks ikjkMkbe l‚¶Vos;j fodkl ds fy, lokZf/kd yksdfç; ikjkMkbEl esa ls ,d gSA lqjf{kr l‚¶Vos;j ds fodkl ds fy, dbZ 'kks/kdrkZvksa }kjk l‚¶Vos;j ds çkjafHkd@iwoZ pj.k ij lqj{kk ,dhdj.k ij fopkj djus dk lq>ko fn;k tkrk gSA blfy,] fMtkbu pj.k ij lqj{kk dks dk;kZfUor djuk ykHkçn gksxkA fMtkbu pj.k ij lqj{kk dks ,dh—r djus ds fy,] fMtkbu daLVªdV vkSj lqj{kk dkjdksa ds chp laca/k dk fo'ys"k.k fd, tkus dh vko';drk gSA bl i= esa] lqj{kk dkjdksa ds laca/k esa y{;ksUeq[k fMtkbu daLVªDV ds çHkko ij leh{kk dh ppkZ dh xbZ gSA
AbstrAct
Rapid advances in technology being used in our daily life business processes surely increase efficiency and productivity, but it also compels to show about concern security of the software. The object-oriented paradigm is one of the most popular paradigms for software development. It is suggested by many researchers for the development of secured software to consider security integration at the initial/preliminary stage of the software. Therefore, it will be beneficial to implement security in the design stage. In order to integrate security in design stage, it is required to analyze the relationship between design construct and security factors. In this paper, a review on impact of object-oriented design constructs on security factors has been discussed.
Keywords: Software security, security factors, design constructs, object-oriented
Bilingual International Conference on Information Technology: Yesterday, Today, and Tomorrow, 19-21 February 2015, pp. 244-247© DESIDOC, 2015
1. IntroductIonSecurity is one of the major attributes of software
quality. It is strongly believed that achieving security attributes may also have side effects of other factors. These side effects can be used to trade-off between security attributes. Skeleton of the object-oriented software has been designed and decided in the design phase of software development life cycle. So, these trade-offs may easily tackle efficiently and effectively in the design phase1,2. Development of security architecture for software is not a onetime built process; it is based on reuse of existing security specifications. It is suggested by many researchers for the development of secured software to consider security integration at the initial/preliminary stage of the software3.
During the security certificate process, it is required to measure the specific security non-functional attributes of the software4. Design level vulnerabilities are one of the most destructive defect categories5. Identification of
security attributes may facilitate disclosing vulnerability at design level. Therefore, it will be beneficial to implement security in the design stage15. In this paper, a review on impact of object-oriented design constructs on security factors has been discussed.
2. sECUritY dUrinG thE dEsiGn PhAsEDesign phase uses information available in the
requirement and analysis phase-and based on available information, architecture of software may be established. Architecture of software defines behaviour of components. What software is going to be delivered? Answer to the question may be given using design phase document or its output. Design phase gives an idea that how software is going to implement security features. It is recommended to avoid implementing security features at the later stages of development.
CHAnDrA: BrIDGInG THE GAP BETWEEn SECurITY FACTOrS AnD OO DESIGn COnSTruCTS
245
4. iMPACt oF objECt-oriEntEd dEsiGn ConstrUCt on sECUritY FACtors Information security is a concept that still lacks
unambiguous definitions. For security measurement, it is required to develop methodologies. An easy way has been suggested to find out its dimensions. Most common identified dimensions are Confidentiality, integrity, and availability. Scandariato[8], et. al. floated an idea of security properties of software that are quantitative in nature with regard to assessment. They further described proactive estimation of software security, especially during the architecture/design phases, using suitable security metrics8.
Rapid advances in technology being used in our daily life business processes surely increase efficiency and productivity, but it also compels to concern security of the software. The object-oriented paradigm is one of the most popular paradigms for software development. Due to its inherent ability to represent conceptual entities as objects, it is gaining more popularity gradually. These objects can be categorized, described, organized, combined, and manipulated easily. It has been proven by the experts that object-oriented design constructs have an impact on software quality attributes and security is one of the major attributes of quality14. Analysis of software from a security perspective is vital to software dependent society.
Design artifacts are flexible in nature, and can easily be changed. Several methodologies are available for quantitative assessment of the quality attributes including maintainability, understandability, complexity, etc.9-10. These methods are well-suited for the design phase. Design phase is the most flexible phase of software development. Class diagrams lay the foundation of the latest phase of development (for coding and implementation phases). From the high-level design of software, one can get all details of design characteristics and methods. Methodologies to quantify quality attribute motivate to quantify security attributes. literature survey reveals the fact that software based on object-oriented concepts provides facility to quantify security attributes and strengthen the motivation11.
Security attributes may get affected in more than one phase. The set of security attributes may help during identification of security factors phase-wise at a given point of time, security factors can be prioritized based on their phase-wise activities and it may provide the base to analyze the effect of a particular security factor. It is important to think about the measures of security of software and how to go about measuring them. To solve the purpose, there is need to figure out what behaviour is expected to the software. Several security factors get affected
The design phase is best phase for security considerations as user authentication or sensitive data are entertained or handled here easily6. In comparison to traditional penetrate and patch approach to handle security problems, fixing security problems in the early stage of software development life cycle is more efficient and effective. In the area of software engineering, the result of recent studies concludes that 80 per cent of the security bug and flaws are introduced in the early stages of software development life cycle7. So, it is required to consider security as early as possible. This will help to reduce vulnerabilities and loss because of these vulnerabilities.
3. sECUritY FACtorsSecurity factors are information, other than
cryptographic keys, that are needed to establish and describe the protection mechanism that secures the communications (information/data). In the early steps, security attribute requirements are identified and prioritized as there is need to have a set of security attributes built into the system. Reckoning security factors are a step towards the security estimation engineering field. The literature survey reveals that there is no such methodology exists to identify security factors and also no common accepted set of security factors available, so it is required to identify set security factors12.
Identified Security Factors includes • Authentication: Authentication means that accession
will be permitted only those users who claim to be authenticated.
• Authorization: Authorization ensures that the user has right to access information with their limitations. It supports access control.
• Confidentiality: Confidentiality ensures that only authorized users access the information.
• Integrity: Integrity ensures that the information is accessed and modified by those who are authorized to do.
• Availability: Availability ensures that the relevant information or services will be available whenever it is demanded. Many times loss of availability is considered as denial-of -services.
• Complexity: Measure of the degree of difficulty in understanding and comprehending the internal and external structure of design hierarchy.
• Reliability: Reliability characteristic provides the ability to perform failure free operation for a specified period of time in a specific environment.
• Non-repudiation: non-repudiations ensure that system or software cannot deny for services or information to recognize users.

ArTIFICIAl InTEllIGEnCE AnD nETWOrK SECurITY
246
in the design phase. Selection of security attributes depends on according to their user, environment, and resources. It will provide a base to decide which security attributes need to be integrated in the software. Object-oriented design concepts affect security attributes[13]. These attributes include authentication, authorization, confidentiality, integrity, and availability. Some of the security attributes have positive or negative impact due to these design concepts. Some of these have been illustrated in Table 1.
Security estimation of software does not produce or ensure best software; it only gives an indication of security level of software. This process is required to identify object-oriented software characteristics that are activated during the design phase of the software development and serve to define a variety of security factors. Some of the popular object-oriented characteristics, which affect security of software are inheritance, coupling, cohesion, abstract, and encapsulation.
It is possible that a system allows access to authorized users; it may also allow access to users who should not have access. So, it is required to scrutinize software architecture. For ex: let us assume that a security check is being already designed for group A. However, because of the sharing of methods and attributes through inheritance, coupling and cohesion, sensitive information is shared by group B, who are not completely authorized for that service. Such logic errors violate security design principle ‘least privilege’. So, it is required to quantify such errors and its impact to improve the security level. It also supports access control mechanisms. During the step some object oriented constructs have been identified that affect security attributes as shown in Figure 1.
5. siGniFiCAnCE And ConClUsion
A metrics based approach may be used to assess vulnerabilities and their impact of object oriented design. Based on the result of these measurements,
table 1. relationship between design constructs and security attributes
design constructs / security attributes Authentication Authorization Confidentiality integrity Availability
Inheritance
Coupling
Cohesion
Abstraction
Encapsulation
Figure 1. relationships among security factors and design constructs.
vulnerabilities of an object oriented design can be minimized, and hence, security can be improved at early phase of development. Object-oriented design constructs such as inheritance, coupling, cohesion, and encapsulation have impact on security. Therefore, these constructs may contribute to improve security of an object-oriented design
In building complex systems, one of the major difficulties is to recognize the interfaces between components at the early stage of software development process. Impact of security factors in a quantifiable manner facilitates a way to understand the nature of security attributes and they impact on one another. It will give the basis to rank the level of achievement of software security attributes and will support rating the software security.
egRo vk Sj fu"d"k ZnqcZyrkvksa vkSj y{;ksUeq[k fMtkbu ij muds çHkko dk
vkdyu djus ds fy, ,d esfVªDl vk/kkfjr –f"Vdks.k dk mi;ksx fd;k tk ldrk gSA bu ekiksa ds ifj.kke ds vk/kkj ij] ,d y{;ksUeq[k fMtkbu dh nqcZyrkvksa dks U;wure fd;k tk ldrk gS vkSj blfy, fodkl ds 'kq:vkrh pj.k ij lqj{kk
CHAnDrA: BrIDGInG THE GAP BETWEEn SECurITY FACTOrS AnD OO DESIGn COnSTruCTS
247
esa lq/kkj fd;k tk ldrk gSA mÙkjkf/kdkj] ;qXeu ¼difyax½] vklatu] vkSj laiqVhdj.k tSls y{;ksUeq[k fMtkbu daLVªDV dk lqj{kk ij çHkko iM+rk gSA blfy,] ;s daLVªDV y{;ksUeq[k fMtkbu dh lqj{kk esa lq/kkj djus esa ;ksxnku ns ldrs gSaA
tfVy ç.kkfy;ksa dks cukus esa] ,d çeq[k dfBukbZ l‚¶Vos;j fodkl çfØ;k ds 'kq:vkrh pj.k ij ?kVdksa ds chp baVjQsl dks igpkuus esa vkrh gSA ,d x.kuh; :i esa lqj{kk dkjdksa dk çHkko lqj{kk fo'ks"krkvksa ds Lo:i vkSj ,d nwljs ij blds çHkko dks le>us dk ,d rjhdk çnku djrk gSA ;g l‚¶Vos;j lqj{kk fo'ks"krkvksa dh çkfIr ds Lrj dks Js.kh çnku djus dk vk/kkj çnku djsxk vkSj l‚¶Vos;j lqj{kk dks Js.kh çnku djus esa lgk;rk nsxkA
rEFErEnCEs1. M Yanguo liu. quantitative Security Analysis
for Service-Oriented Software Architectures. Ph D. thesis 2008.
2. M. r. Barbacci, r. Ellison, A. J. lattanze, Judith A. Stafford, Charles B. Weinstock, William G. Wood. quality Attribute Workshops (qAWs), Third Edition. Technical report, CMu/SEI-2003-Tr-016, ESC-Tr-2003-016, 2003.
3. J. Verry. Security Incidents Drive Integration of Security into SDlC’s. 13 April 2010. , Building Trust one Assessment at a Time. Available at: http://www.pivotpointsecurity.com/blog/bid/27383/Security-Incidents-Drive-Integration-of-Security-Into-SDlC-s
4. F. Copigneaux, S. Martin. Software security evaluation based on a top-down McCall-like approach. Fourth Aerospace Computer Security Applications Conference, 1988., IEEE, pp: 414-418.
5. B. Potter and G. McGraw. Software Security Testing,” IEEE Security & Privacy, Volume: 2, Issue: 5, 2004, pp. 81–85.
6. MSDn library, http://msdn.microsoft.com/en-us/library/cc307414.aspx
7. A report. Information Technology Security Evaluation Criteria (ITSEC). Version 1.2, France, Germany - the netherlands - the uK, Available at: http://www.ssi.gouv.fr/site_documents/ITSEC/ITSEC-uk.pdf
8. R. Scandariato, B. D. Win, and W. J. Distrinet. Towards a measuring framework for security properties of software. Proceedings of the 2nd ACM workshop on quality of protection, 2006, pp. 27 – 30.
9. J. Bansiya and C. G. Davis. A Hierarchical Model for Object-Oriented Design quality Assessment. IEEE Transaction on Software Engineering, Volume: 28, Issue:1, 2002, pp:4-17.
10. K. Mustafa and r. A. Khan. quality Metric Development Framework.(qMDF) . Journal of Computer Science 1 (3), 2005, Pages: 437-444.
11. A. Sabelfeld and A.C. Myers. language-Based Information-Flow Security. IEEE Journal on Selected Areas in Communications, Volume: 21, Issue: 1, pp: 5-19, 2003.
12. B.B. Madan, K.G. Popstojanova, K. Vaidyanathan and K. S. Trivedi “Modeling and quantification of Security Attributes of Software Systems. Proceedings of the International Conference on Dependable Systems and networks (DSn’02), IEEE, 2002, pp: 505-514.
13. S. Chandra and r.A. Khan. Software Security Estimation Framework: Design Phase Perspective. Sixth International Conference on Information Technology, new Generations, ITnG 2009, 27-29 April, 2009. las Vegas, nV, uSA, IEEE Computer Society, pp: 254-259.
14. S Chandra and r. A. Khan. Object Oriented Software Security Estimation life Cycle: Design phase perspective. Journal of Software Engineering, uSA, Vol. 2(1), 2008, pp: 39-46.
15. A. Agrawal, S. Chandra, and r.A. Khan. An Efficient measurement of Object Oriented Design Vulnerability. Proceeding of IEEE conference on Availability, reliability and Security, 2009, IEEE Computer Society, pp: 618-622.
fo”ks’kKksa ds ny dk mi;ksx djds fMLVªhC;wVhM fMuk;y vkQ lfoZl vVSd dk irk yxkuk detection of distributed denial of service Attacks Using Panel of Experts
Suriender Singh* and S. SelvakumarNational Institute of Technology, Tiruchirappalli, Tamil Nadu
*E-mail: [email protected]
lkjka”k
MhMhvks,l dks Mhvks,l vkØe.k ds u, laLdj.k ds rkSj ij ns[kk tk ldrk gSa tks geykojksa ds }kjk mfpr mi;ksxdrkZ dks lsok çnku djus esa :dkoV iSnk djrk gSaA ;g vke rkSj ij mPp nj vkSj de nj dks MhMhvks,l ds :i esa oxhZ—r fd;k tkrk gSA de nj MhMhvks,l esa geykoj mi;ksxdrkZ dh e”khu ds vuqç;ksxksa esa fdlh deh dk “kks’k.k djrk gSa tcfd mPp nj MhMhvks,l geykoj ihfMr dh e”khu dks cksV usVodZ rS;kj djds ftls cksVusV dgrs gSa Hkj nsrk gSaA ;|fi MhMhvks,l geyk ,d n”kd ls vf/kd iqjkuk gS ;g vHkh Hkh lkbcj lqj{kk ds fy, ,d çeq[k [krjs ds :i esa tkuk tkrk gSA geys dk irk yxkus ds çeq[k dfBukbZ bldh lekurk lkekU; fLFkfr ftls ¶yS”k bosaV dgrs gSa ls gSa tgk¡ loZj okLrfod mi;ksxdrkZ ds }kjk iSnk fd, x, Hkkjh ;krk;kr dks vuqHko djrk gSaA bl vkys[k mPp nj MhMhvks,l geys ij /;ku nsrk gSa] irk djus ds ekStwnk rjhdksa dk fo”ys’k.k djrk gS vkSj çLrkfor lek/kku ij ppkZ djrk gSaA bl vkys[k esa] çf”kf{kr fo”ks’kKksa dk ,d ny tks fd vyx&vyx MsVk vk;keksa ij mUur gSa ds }kjk ,d ekMy rS;kj djrs gSa ftldk ç;ksx vlkekU; O;ogkj dks lkekU; O;ogkj ls vyx oxhZdj.k djus esa fd;k tkrk gSaA fo”ks’kKksa ds fu.kZ; dks MsEilVj&lkQj fl)kar ls tksMdj vafre oxhZdj.k djrs gSaA bu ijh{k.kksa dks lkoZtfud :i ls miyC/k vkSj iSnk fd, MkVklsV ij djrs gSa tSls LiSecsl] ,u,l,y&dsMhMh di] vkbZ,llh,Dl] ,l,lbZ&usV bR;kfnA çLrkfor ekM~y dh ekStwnk lek/kkuks ls rqyuk ds ckn ge ikrs gSa ;g T;knk lVhdrk ls dk;kZUou djrk gSaA
AbstrActDDoS can be viewed as the extended version of DoS attack to deny the services to the legitimate
users by a number of attackers. It is generally classified into High rate and low rate DDoS. In low rate DDoS, attacker exploits a vulnerability in applications of the victim machine while in high rate DDoS the attacker floods the victim by creating a network of bots called botnet. Even though DDoS attack is more than a decade old, it is still considered as a major threat to the cyber security. The major difficulty of attack detection lies in its similarity with the normal situation called flash event where server experiences a heavy traffic from legitimate users. This paper focuss on the high rate DDoS attack, analyses the existing detection methods, and discusses the proposed solution. In this paper, a model consisting of a panel of experts trained on different data dimensions is proposed to classify abnormal behavior from the normal behavior. The decision of the experts is combined using the Dempster-Shafer theory to get the final classification. Experiments have been performed on various publically available and generated datasets such as Spambase, nSl-KDD Cup, ISCX, SSE-net, etc. The proposed model is compared with the existing solutions and found to be performing with much better accuracy.
Keywords: DDoS, panel of experts, ensemble, random feature subspace, Dempster-Shafer
Bilingual International Conference on Information Technology: Yesterday, Today, and Tomorrow, 19-21 February 2015, pp. 248-254© DESIDOC, 2015
1. IntroductIonDistributed Denial of Service is an attack where
the attacker intentionally makes the services unavailable to the intended users or legitimate users. In cyber security, DDoS attack is one of the major threats that mainly results in a financial and reputation loss [1]. With the advancement of attack tools the intensity of DDoS attacks are growing stronger [2]. The working of DDoS attack is depicted in Fig. 1. The DDoS attack is characterized into two categories: infrastructure level
attack and application level attack. In application level attack, the attacker exploits the existing vulnerabilities in the target machine. An example of this type of an attack is “ping of death” that exploits the buffer overflow vulnerability at the target system that may lead to a system crash. Application level attacks can be avoided through patching known vulnerabilities, strengthening security policies, etc., On the other hand, if an attacker floods the victim machine resources or network resources with the intent to deny the
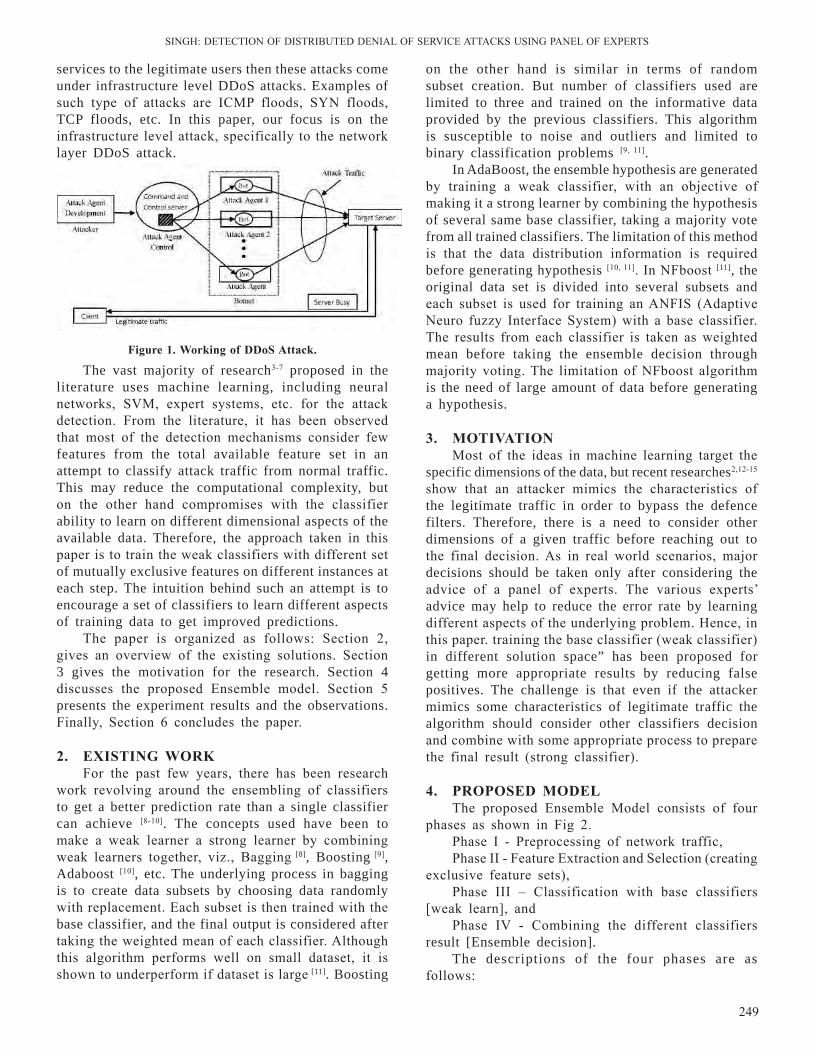
SInGH: DETECTIOn OF DISTrIBuTED DEnIAl OF SErVICE ATTACKS uSInG PAnEl OF EXPErTS
249
services to the legitimate users then these attacks come under infrastructure level DDoS attacks. Examples of such type of attacks are ICMP floods, SYn floods, TCP floods, etc. In this paper, our focus is on the infrastructure level attack, specifically to the network layer DDoS attack.
on the other hand is similar in terms of random subset creation. But number of classifiers used are limited to three and trained on the informative data provided by the previous classifiers. This algorithm is susceptible to noise and outliers and limited to binary classification problems [9, 11].
In AdaBoost, the ensemble hypothesis are generated by training a weak classifier, with an objective of making it a strong learner by combining the hypothesis of several same base classifier, taking a majority vote from all trained classifiers. The limitation of this method is that the data distribution information is required before generating hypothesis [10, 11]. In nFboost [11], the original data set is divided into several subsets and each subset is used for training an AnFIS (Adaptive neuro fuzzy Interface System) with a base classifier. The results from each classifier is taken as weighted mean before taking the ensemble decision through majority voting. The limitation of nFboost algorithm is the need of large amount of data before generating a hypothesis.
3. MotiVAtionMost of the ideas in machine learning target the
specific dimensions of the data, but recent researches2,12-15 show that an attacker mimics the characteristics of the legitimate traffic in order to bypass the defence filters. Therefore, there is a need to consider other dimensions of a given traffic before reaching out to the final decision. As in real world scenarios, major decisions should be taken only after considering the advice of a panel of experts. The various experts’ advice may help to reduce the error rate by learning different aspects of the underlying problem. Hence, in this paper. training the base classifier (weak classifier) in different solution space” has been proposed for getting more appropriate results by reducing false positives. The challenge is that even if the attacker mimics some characteristics of legitimate traffic the algorithm should consider other classifiers decision and combine with some appropriate process to prepare the final result (strong classifier).
4. ProPosEd ModElThe proposed Ensemble Model consists of four
phases as shown in Fig 2.Phase I - Preprocessing of network traffic,Phase II - Feature Extraction and Selection (creating
exclusive feature sets), Phase III – Classification with base classifiers
[weak learn], andPhase IV - Combining the different classifiers
result [Ensemble decision].The descriptions of the four phases are as
follows:
Figure 1. working of ddos Attack.
The vast majority of research3-7 proposed in the literature uses machine learning, including neural networks, SVM, expert systems, etc. for the attack detection. From the literature, it has been observed that most of the detection mechanisms consider few features from the total available feature set in an attempt to classify attack traffic from normal traffic. This may reduce the computational complexity, but on the other hand compromises with the classifier ability to learn on different dimensional aspects of the available data. Therefore, the approach taken in this paper is to train the weak classifiers with different set of mutually exclusive features on different instances at each step. The intuition behind such an attempt is to encourage a set of classifiers to learn different aspects of training data to get improved predictions.
The paper is organized as follows: Section 2, gives an overview of the existing solutions. Section 3 gives the motivation for the research. Section 4 discusses the proposed Ensemble model. Section 5 presents the experiment results and the observations. Finally, Section 6 concludes the paper.
2. ExistinG worKFor the past few years, there has been research
work revolving around the ensembling of classifiers to get a better prediction rate than a single classifier can achieve [8-10]. The concepts used have been to make a weak learner a strong learner by combining weak learners together, viz., Bagging [8], Boosting [9], Adaboost [10], etc. The underlying process in bagging is to create data subsets by choosing data randomly with replacement. Each subset is then trained with the base classifier, and the final output is considered after taking the weighted mean of each classifier. Although this algorithm performs well on small dataset, it is shown to underperform if dataset is large [11]. Boosting
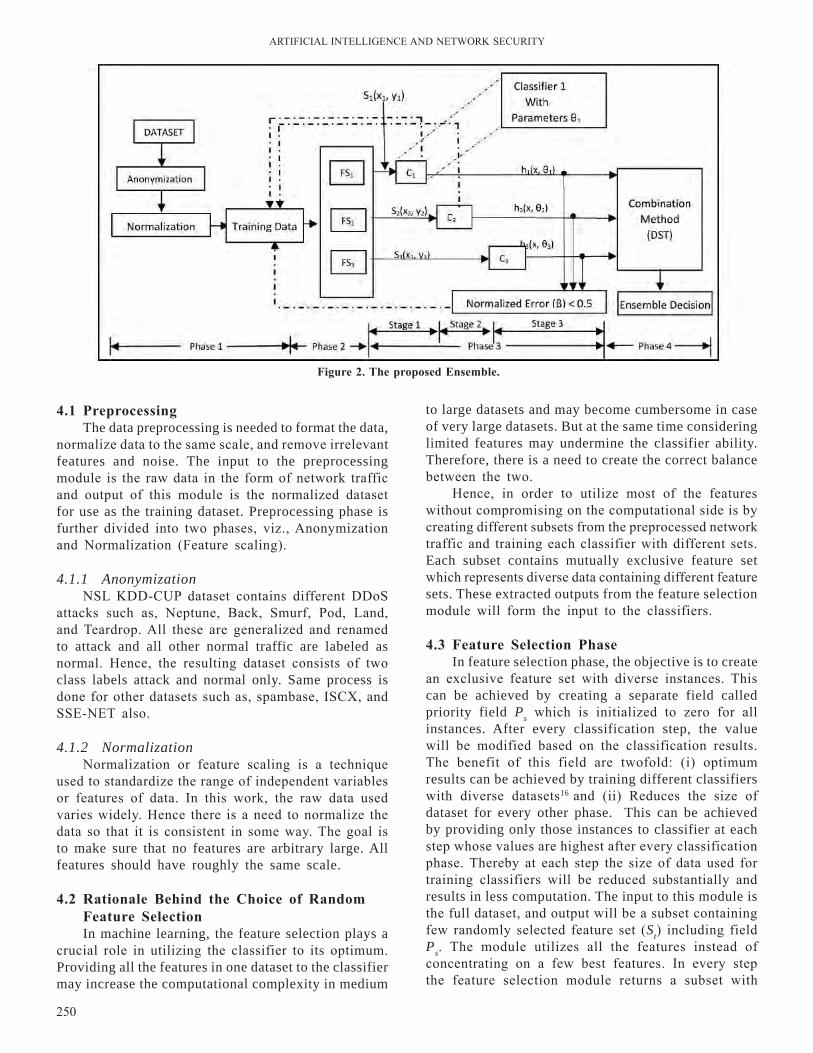
ArTIFICIAl InTEllIGEnCE AnD nETWOrK SECurITY
250
4.1 PreprocessingThe data preprocessing is needed to format the data,
normalize data to the same scale, and remove irrelevant features and noise. The input to the preprocessing module is the raw data in the form of network traffic and output of this module is the normalized dataset for use as the training dataset. Preprocessing phase is further divided into two phases, viz., Anonymization and normalization (Feature scaling).
4.1.1 AnonymizationnSl KDD-CuP dataset contains different DDoS
attacks such as, neptune, Back, Smurf, Pod, land, and Teardrop. All these are generalized and renamed to attack and all other normal traffic are labeled as normal. Hence, the resulting dataset consists of two class labels attack and normal only. Same process is done for other datasets such as, spambase, ISCX, and SSE-nET also.
4.1.2 Normalizationnormalization or feature scaling is a technique
used to standardize the range of independent variables or features of data. In this work, the raw data used varies widely. Hence there is a need to normalize the data so that it is consistent in some way. The goal is to make sure that no features are arbitrary large. All features should have roughly the same scale.
4.2 rationale behind the Choice of random Feature selectionIn machine learning, the feature selection plays a
crucial role in utilizing the classifier to its optimum. Providing all the features in one dataset to the classifier may increase the computational complexity in medium
to large datasets and may become cumbersome in case of very large datasets. But at the same time considering limited features may undermine the classifier ability. Therefore, there is a need to create the correct balance between the two.
Hence, in order to utilize most of the features without compromising on the computational side is by creating different subsets from the preprocessed network traffic and training each classifier with different sets. Each subset contains mutually exclusive feature set which represents diverse data containing different feature sets. These extracted outputs from the feature selection module will form the input to the classifiers.
4.3 Feature selection PhaseIn feature selection phase, the objective is to create
an exclusive feature set with diverse instances. This can be achieved by creating a separate field called priority field Ps which is initialized to zero for all instances. After every classification step, the value will be modified based on the classification results. The benefit of this field are twofold: (i) optimum results can be achieved by training different classifiers with diverse datasets16 and (ii) reduces the size of dataset for every other phase. This can be achieved by providing only those instances to classifier at each step whose values are highest after every classification phase. Thereby at each step the size of data used for training classifiers will be reduced substantially and results in less computation. The input to this module is the full dataset, and output will be a subset containing few randomly selected feature set (St) including field Ps. The module utilizes all the features instead of concentrating on a few best features. In every step the feature selection module returns a subset with
Figure 2. the proposed Ensemble.
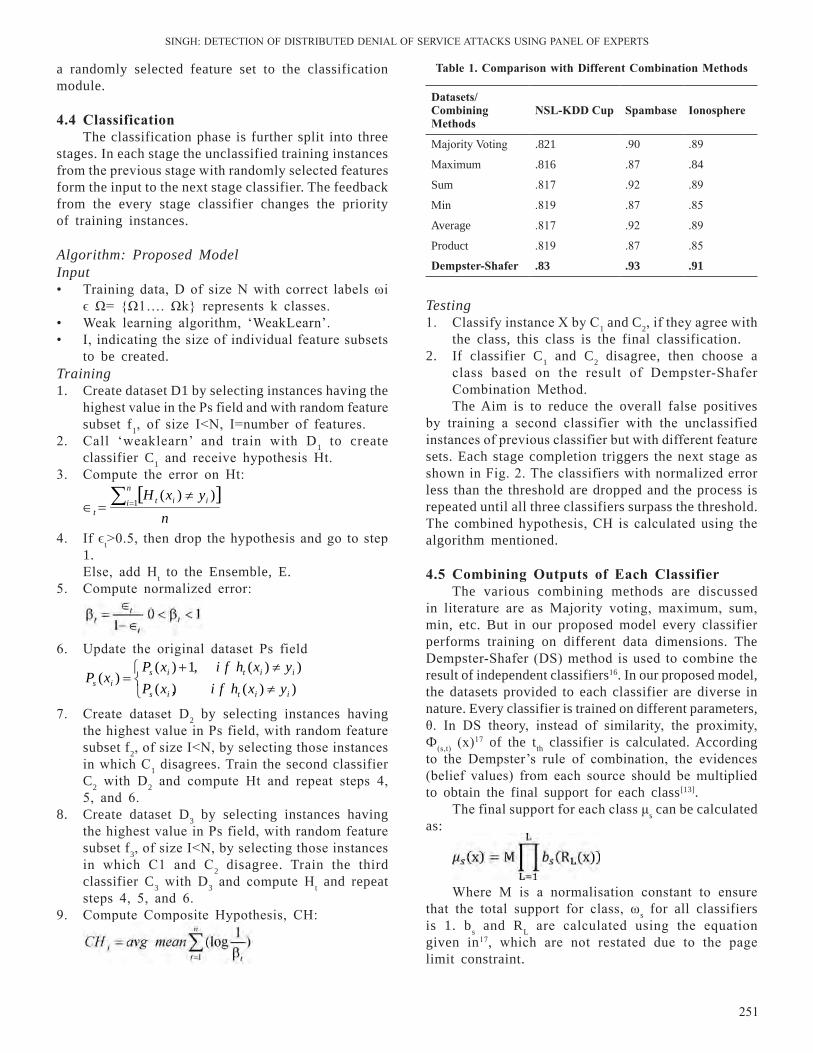
SInGH: DETECTIOn OF DISTrIBuTED DEnIAl OF SErVICE ATTACKS uSInG PAnEl OF EXPErTS
251
a randomly selected feature set to the classification module.
4.4 ClassificationThe classification phase is further split into three
stages. In each stage the unclassified training instances from the previous stage with randomly selected features form the input to the next stage classifier. The feedback from the every stage classifier changes the priority of training instances.
Algorithm: Proposed ModelInput• Training data, D of size n with correct labels ωi
ϵ Ω= {Ω1…. Ωk} represents k classes.• Weak learning algorithm, ‘Weaklearn’.• I, indicating the size of individual feature subsets
to be created.Training1. Create dataset D1 by selecting instances having the
highest value in the Ps field and with random feature subset f1, of size I<n, I=number of features.
2. Call ‘weaklearn’ and train with D1 to create classifier C1 and receive hypothesis Ht.
3. Compute the error on Ht:
[ ]n
yxHn
i iitt∑=
≠=∈ 1
))(
4. If ϵt>0.5, then drop the hypothesis and go to step 1.Else, add Ht to the Ensemble, E.
5. Compute normalized error:
6. update the original dataset Ps field
≠≠+
=))(),())(,1)(
)(iitis
iitisis yxhfixP
yxhfixPxP
7. Create dataset D2 by selecting instances having the highest value in Ps field, with random feature subset f2, of size I<n, by selecting those instances in which C1 disagrees. Train the second classifier C2 with D2 and compute Ht and repeat steps 4, 5, and 6.
8. Create dataset D3 by selecting instances having the highest value in Ps field, with random feature subset f3, of size I<n, by selecting those instances in which C1 and C2 disagree. Train the third classifier C3 with D3 and compute Ht and repeat steps 4, 5, and 6.
9. Compute Composite Hypothesis, CH:
table 1. Comparison with different Combination Methods
datasets/ Combining Methods
nsl-Kdd Cup spambase ionosphere
Majority Voting .821 .90 .89
Maximum .816 .87 .84
Sum .817 .92 .89
Min .819 .87 .85
Average .817 .92 .89
Product .819 .87 .85
dempster-shafer .83 .93 .91
Testing1. Classify instance X by C1 and C2, if they agree with
the class, this class is the final classification.2. If classifier C1 and C2 disagree, then choose a
class based on the result of Dempster-Shafer Combination Method.The Aim is to reduce the overall false positives
by training a second classifier with the unclassified instances of previous classifier but with different feature sets. Each stage completion triggers the next stage as shown in Fig. 2. The classifiers with normalized error less than the threshold are dropped and the process is repeated until all three classifiers surpass the threshold. The combined hypothesis, CH is calculated using the algorithm mentioned.
4.5 Combining outputs of Each Classifier The various combining methods are discussed
in literature are as Majority voting, maximum, sum, min, etc. But in our proposed model every classifier performs training on different data dimensions. The Dempster-Shafer (DS) method is used to combine the result of independent classifiers16. In our proposed model, the datasets provided to each classifier are diverse in nature. Every classifier is trained on different parameters, θ. In DS theory, instead of similarity, the proximity, Ф(s,t) (x)17 of the tth classifier is calculated. According to the Dempster’s rule of combination, the evidences (belief values) from each source should be multiplied to obtain the final support for each class[13].
The final support for each class μs can be calculated as:
Where M is a normalisation constant to ensure that the total support for class, ωs for all classifiers is 1. bs and Rl are calculated using the equation given in17, which are not restated due to the page limit constraint.
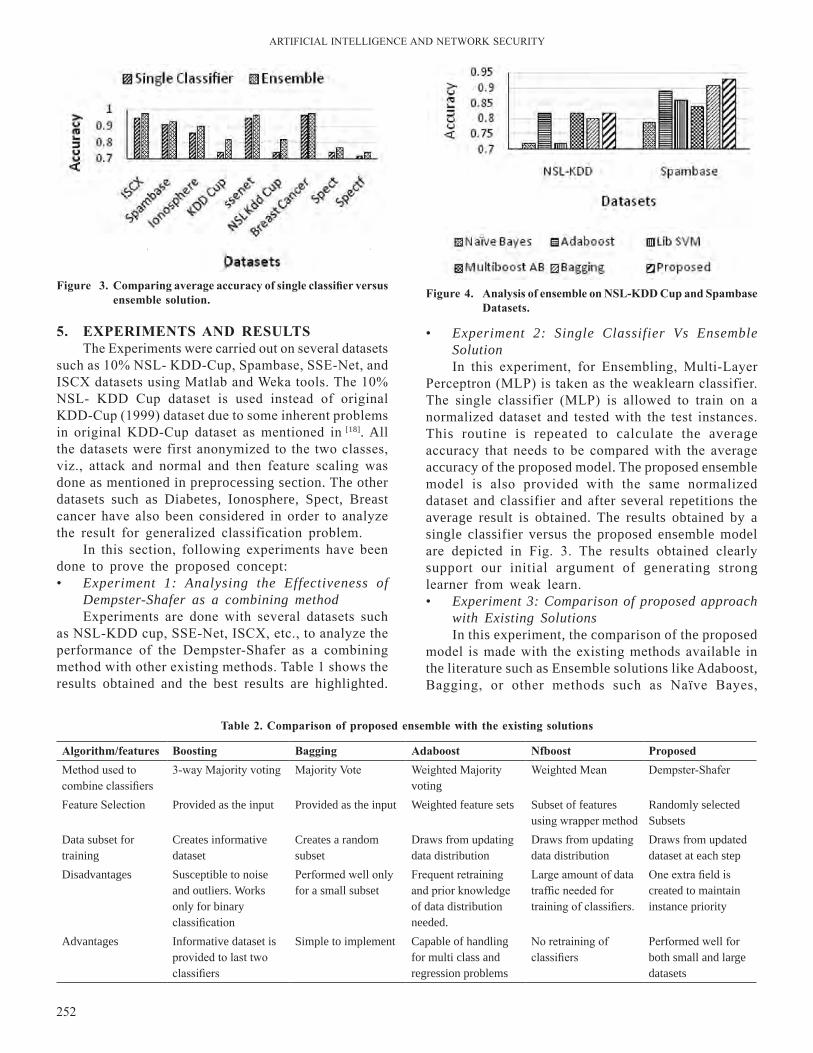
ArTIFICIAl InTEllIGEnCE AnD nETWOrK SECurITY
252
5. ExPEriMEnts And rEsUltsThe Experiments were carried out on several datasets
such as 10% nSl- KDD-Cup, Spambase, SSE-net, and ISCX datasets using Matlab and Weka tools. The 10% nSl- KDD Cup dataset is used instead of original KDD-Cup (1999) dataset due to some inherent problems in original KDD-Cup dataset as mentioned in [18]. All the datasets were first anonymized to the two classes, viz., attack and normal and then feature scaling was done as mentioned in preprocessing section. The other datasets such as Diabetes, Ionosphere, Spect, Breast cancer have also been considered in order to analyze the result for generalized classification problem.
In this section, following experiments have been done to prove the proposed concept: • Experiment 1: Analysing the Effectiveness of
Dempster-Shafer as a combining methodExperiments are done with several datasets such
as nSl-KDD cup, SSE-net, ISCX, etc., to analyze the performance of the Dempster-Shafer as a combining method with other existing methods. Table 1 shows the results obtained and the best results are highlighted.
• Experiment 2: Single Classifier Vs Ensemble SolutionIn this experiment, for Ensembling, Multi-layer
Perceptron (MlP) is taken as the weaklearn classifier. The single classifier (MlP) is allowed to train on a normalized dataset and tested with the test instances. This routine is repeated to calculate the average accuracy that needs to be compared with the average accuracy of the proposed model. The proposed ensemble model is also provided with the same normalized dataset and classifier and after several repetitions the average result is obtained. The results obtained by a single classifier versus the proposed ensemble model are depicted in Fig. 3. The results obtained clearly support our initial argument of generating strong learner from weak learn.• Experiment 3: Comparison of proposed approach
with Existing SolutionsIn this experiment, the comparison of the proposed
model is made with the existing methods available in the literature such as Ensemble solutions like Adaboost, Bagging, or other methods such as naïve Bayes,
Figure 3. Comparing average accuracy of single classifier versus ensemble solution. Figure 4. Analysis of ensemble on nsl-Kdd Cup and spambase
datasets.
Algorithm/features boosting bagging Adaboost nfboost ProposedMethod used to combine classifiers
3-way Majority voting Majority Vote Weighted Majority voting
Weighted Mean Dempster-Shafer
Feature Selection Provided as the input Provided as the input Weighted feature sets Subset of features using wrapper method
Randomly selected Subsets
Data subset for training
Creates informative dataset
Creates a random subset
Draws from updating data distribution
Draws from updating data distribution
Draws from updated dataset at each step
Disadvantages Susceptible to noise and outliers. Works only for binary classification
Performed well only for a small subset
Frequent retraining and prior knowledge of data distribution needed.
large amount of data traffic needed for training of classifiers.
One extra field is created to maintain instance priority
Advantages Informative dataset is provided to last two classifiers
Simple to implement Capable of handling for multi class and regression problems
no retraining of classifiers
Performed well for both small and large datasets
table 2. Comparison of proposed ensemble with the existing solutions
SInGH: DETECTIOn OF DISTrIBuTED DEnIAl OF SErVICE ATTACKS uSInG PAnEl OF EXPErTS
253
random forest, lib SVM, etc., using the nSl- KDD Cup dataset only. The normalized dataset with all 41 features are provided to the each method. In case of a single classifier, the results are obtained by taking a subset of best features because taking all features may result in overfitting of classifier. While in case of proposed model, all features are considered while creating the dataset because the proposed model inherently takes care of further splitting of the dataset. The results obtained after experiments using Weka and Matlab are shown in Fig. 4.
From Fig. 4 it is seen that Adaboost and Multiboost AB are performing nearly with the same accuracy as our proposed method.
Therefore, this gave us the motivation to test our method further on other publicly available datasets such as Spambase and the result clearly shows that the proposed model performs better over existing ones. Further, Table 2 lists out major differences among the proposed and the existing solutions.
6. ConClUsionIn this paper, a model with a panel of experts
(classifiers) trained in different data dimensions is proposed. Each expert is independent with respect to the parameters, which is achieved by training each classifier with different set of features. The preprocessed data is provided to the individual experts and based on the classification results the unclassified instances are recorded and provided to different independent expert. This process of unclassified instances given as input to other expert is repeated. Each expert output is combined using Dampster-Shafer theory, where the final support by each classifier is calculated through belief values from each source. The final combined hypothesis is considered as the ensemble solution. The proposed ensemble method has been tested against the single classifier prediction rate. From the experiments conducted it is found that the proposed method has better classification rate than the existing solutions.
fu"d"k Z bl vkys[k esa] çf”kf{kr fo”ks’kKksa dk ,d iSuy tks fd
vyx&vyx MsVk vk;keksa ij mUur gSa ds }kjk ,d ekMy dks çLrkfor fd;k tkrk gSaA çR;sd fo”ks’kK ekinaMksa ds fglkc ls Lora= gS ftles gj DykflQk;j dks vyx xq.kksa ds vk/kkj ij çf{kf”kr fd;k x;k gSaA vçlaL—r MkVk dks çR;sd fo”ks’kK dks fn;k x;k gSa vkSj buds }kjk fd, x, oxhZdj.k ifj.kkeksa ls voxhZ; mnkgj.k ntZ fd, x, gS vkSj fofHkUu LorU= fo”ks’kKksa dks fn, x, gSaA çR;sd fo”ks’kK dk ifj.kke MSelVj&lkQj fl)kUr ls tksMk x;k gSa tcfd vafre leFkZu dh x.kuk çR;sd lkslZ ds fo”okl ewY; ls dh xbZ gSaA vafre la;qä ifjdYiuk
dks lek/kku ds :i esa tkuk tkrk gSA çLrkfor fof/k dh tkap lhaxy DyklhQk;j nj ls dh tk pqdh gSA fd, x, ijh{k.kksa ls ifj.kke fudyrk gS fd çLrkfor fof/k ekStwnk lek/kku dh rqyuk esa csgrj oxhZdj.k nj gSA
rEFErEnCEs1. Huang, Yun, Xianjun Geng, & Andrew B. Whinston.
Defeating DDoS attacks by fixing the incentive chain. ACM Transactions on Internet Technology (TOIT), 2007, 7(1), 5.
2. h t tp : / /www.sta teof theinternet .com/secur i ty-cybersecurity-attack-trends-and-statistics.html [Accessed on 11 December 2014].
3. rasool Jalili, Faatema Imani-mehr, Morteza Amini, Hamid reza shahriari. Detection of DDoS attacks using statistical preprocessor and unsupervised neural networks. lnCS 2005, pp. 192-203.
4. S. Seufert, D. O Brein. Machine learning for automatic defence against DDoS attacks. Proceedings of IEEE International Conference (ICC), 2007, pp.1217-1222.
5. Dimitris Gavrilis, Evangelos Dermatas. real time detection of distributed denial-of-service attacks using rBF networks and statistical features, Computer networks, 2005, 44(5), pp.235-245.
6. Hoai-Vu nguyen, Yongsun Choi. Proactive detection of DDoS attacks using K-nn classifier in an Anti-DDoS Framework. International Journal of Computer Systems Science and Engineering, 2008, pp. 247-252.
7. Y. Xiang, W. Zhou. Mark-aided distributed filtering by using neural networks for DDoS defence. IEEE GlOBECOM, 2005, pp. 1701-1705.
8. l. Breiman. Bagging Predictors. Machine learning 1996, 24(2), pp. 123-140.
9. r.E. Schapire, The strength of weak learnability, Machine learning 1990, 5(2), pp.197-227.
10. Freund, Y. and Schapire, r.. A decision theoretic generalization of on-line learning and an application to boosting. Journal of Computer and System Sciences,1997, 55, pp. 119–139.
11. Arun raj Kumar and S. Selvakumar. Detection of distributed denial of service attacks using an ensemble of adaptive and hybrid neuro-fuzzy systems. Computer Communications, Elsevier Publications, 2013, 36(3), pp. 303-319.
12. S. Kandula, D. Katabi, M. Jacob. Botz-4 –Sale: Surviving organized DDoS attacks that mimic flash crowds. 2nd Symposium on networked Systems Design and Implementation nSDI), Boston, MA, May 2005.
13. S. Yu, T. Thapngam, J. liu, S. Wei, & W. Zhou. Discriminating DDoS Flows from flash crowds using Information distance. Third international
ArTIFICIAl InTEllIGEnCE AnD nETWOrK SECurITY
254
conference on network and System Security, IEEE-09, pp. 351-356.
14. K. li, W.l. Zhou, P. li, J. Hai, & J.W. liu. Distinguishing DDoS Attacks from Flash Crowds using Probability Metrics. IEEE, 3rd International Conference on network and System Security, Gold Coast, qlD, nSS’09, Oct 2009, pp 9-17.
15. Jung, Jaeyeon, Balachander Krishnamurthy, & Michael rabinovich. Flash crowds and denial of service attacks: Characterisation and implications for CDns and web sites. Proceedings of the 11th international conference on World Wide Web. ACM, 2002.
16. quost, Benjamin, Marie-Hélène Masson, and Thierry
Denœux. Classifier fusion in the Dempster–Shafer framework using optimized t-norm based combination rules. Int. J. Approximate Reasoning, 2011, 52(3), 353-374.
17. G. rogova. Combining the results of several neural network classifiers. Neural Networks, 1994, 7(5), pp. 777-781.
18. Tavallaee, Mahbod, Ebrahim Bagheri, and Wei lu. Ali. A. Ghorbani. A detailed analysis of the KDDCup 1999 dataset. Proc. of 2009 IEEE International symposium on computational intelligence in security and defense applications (CISDA-2009). IEEE Press, uSA.
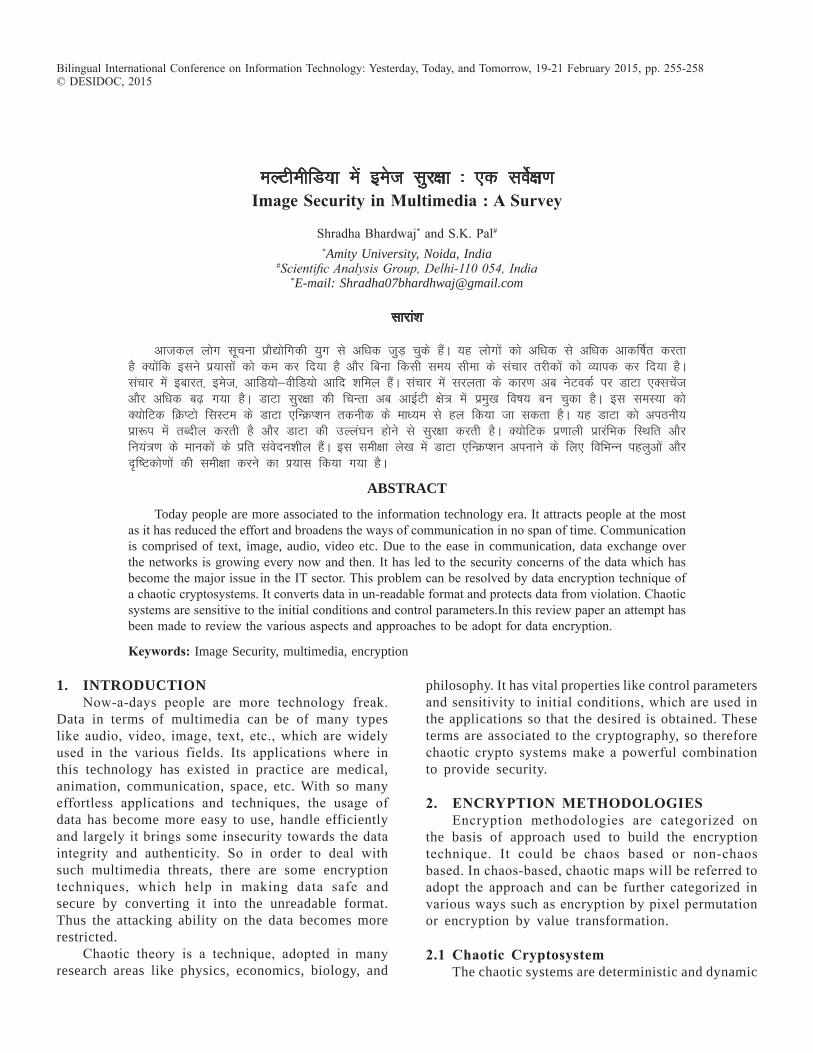
eYVhehfM;k esa best lqj{kk % ,d losZ{k.k image security in Multimedia : A survey
Shradha Bhardwaj* and S.K. Pal# *Amity University, Noida, India
#Scientific Analysis Group, Delhi-110 054, India *E-mail: [email protected]
lkjka”k
vktdy yksx lwpuk izkS|ksfxdh ;qx ls vf/kd tqM+ pqds gSaA ;g yksxksa dks vf/kd ls vf/kd vkdf’kZr djrk gS D;ksafd blus iz;klksa dks de dj fn;k gS vkSj fcuk fdlh le; lhek ds lapkj rjhdksa dks O;kid dj fn;k gSA lapkj esa bckjr] best] vkfM;ks&ohfM;ks vkfn “kfey gSaA lapkj esa ljyrk ds dkj.k vc usVodZ ij MkVk ,Dlpsat vkSj vf/kd c<+ x;k gSA MkVk lqj{kk dh fpUrk vc vkbZVh {ks= esa izeq[k fo’k; cu pqdk gSA bl leL;k dks D;ksfVd fØIVks flLVe ds MkVk ,fUØI”ku rduhd ds ek/;e ls gy fd;k tk ldrk gSA ;g MkVk dks viBuh; izk:i esa rCnhy djrh gS vkSj MkVk dh mYya?ku gksus ls lqj{kk djrh gSA D;ksfVd iz.kkyh izkjafHkd fLFkfr vkSj fu;a=.k ds ekudksa ds izfr laosnu”khy gSaA bl leh{kk ys[k esa MkVk ,fUØI”ku viukus ds fy, fofHkUu igyqvksa vkSj n`f’Vdks.kksa dh leh{kk djus dk Ikz;kl fd;k x;k gSA
AbstrAct
Today people are more associated to the information technology era. It attracts people at the most as it has reduced the effort and broadens the ways of communication in no span of time. Communication is comprised of text, image, audio, video etc. Due to the ease in communication, data exchange over the networks is growing every now and then. It has led to the security concerns of the data which has become the major issue in the IT sector. This problem can be resolved by data encryption technique of a chaotic cryptosystems. It converts data in un-readable format and protects data from violation. Chaotic systems are sensitive to the initial conditions and control parameters.In this review paper an attempt has been made to review the various aspects and approaches to be adopt for data encryption.
Keywords: Image Security, multimedia, encryption
1. IntroductIonnow-a-days people are more technology freak.
Data in terms of multimedia can be of many types like audio, video, image, text, etc., which are widely used in the various fields. Its applications where in this technology has existed in practice are medical, animation, communication, space, etc. With so many effortless applications and techniques, the usage of data has become more easy to use, handle efficiently and largely it brings some insecurity towards the data integrity and authenticity. So in order to deal with such multimedia threats, there are some encryption techniques, which help in making data safe and secure by converting it into the unreadable format. Thus the attacking ability on the data becomes more restricted.
Chaotic theory is a technique, adopted in many research areas like physics, economics, biology, and
philosophy. It has vital properties like control parameters and sensitivity to initial conditions, which are used in the applications so that the desired is obtained. These terms are associated to the cryptography, so therefore chaotic crypto systems make a powerful combination to provide security.
2. EnCrYPtion MEthodoloGiEsEncryption methodologies are categorized on
the basis of approach used to build the encryption technique. It could be chaos based or non-chaos based. In chaos-based, chaotic maps will be referred to adopt the approach and can be further categorized in various ways such as encryption by pixel permutation or encryption by value transformation.
2.1 Chaotic CryptosystemThe chaotic systems are deterministic and dynamic
Bilingual International Conference on Information Technology: Yesterday, Today, and Tomorrow, 19-21 February 2015, pp. 255-258© DESIDOC, 2015
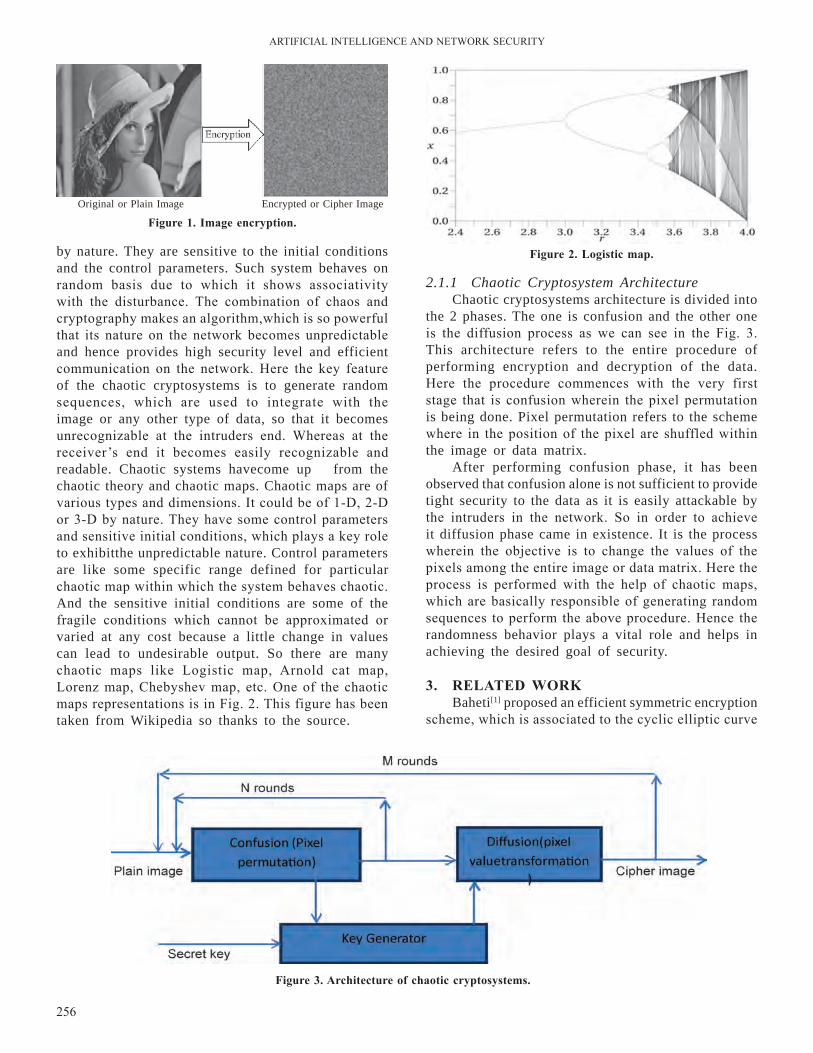
ArTIFICIAl InTEllIGEnCE AnD nETWOrK SECurITY
256
by nature. They are sensitive to the initial conditions and the control parameters. Such system behaves on random basis due to which it shows associativity with the disturbance. The combination of chaos and cryptography makes an algorithm,which is so powerful that its nature on the network becomes unpredictable and hence provides high security level and efficient communication on the network. Here the key feature of the chaotic cryptosystems is to generate random sequences, which are used to integrate with the image or any other type of data, so that it becomes unrecognizable at the intruders end. Whereas at the receiver’s end it becomes easily recognizable and readable. Chaotic systems havecome up from the chaotic theory and chaotic maps. Chaotic maps are of various types and dimensions. It could be of 1-D, 2-D or 3-D by nature. They have some control parameters and sensitive initial conditions, which plays a key role to exhibitthe unpredictable nature. Control parameters are like some specific range defined for particular chaotic map within which the system behaves chaotic. And the sensitive initial conditions are some of the fragile conditions which cannot be approximated or varied at any cost because a little change in values can lead to undesirable output. So there are many chaotic maps like logistic map, Arnold cat map, lorenz map, Chebyshev map, etc. One of the chaotic maps representations is in Fig. 2. This figure has been taken from Wikipedia so thanks to the source.
2.1.1 Chaotic Cryptosystem ArchitectureChaotic cryptosystems architecture is divided into
the 2 phases. The one is confusion and the other one is the diffusion process as we can see in the Fig. 3. This architecture refers to the entire procedure of performing encryption and decryption of the data.Here the procedure commences with the very first stage that is confusion wherein the pixel permutation is being done. Pixel permutation refers to the scheme where in the position of the pixel are shuffled within the image or data matrix.
After performing confusion phase, it has been observed that confusion alone is not sufficient to provide tight security to the data as it is easily attackable by the intruders in the network. So in order to achieve it diffusion phase came in existence. It is the process wherein the objective is to change the values of the pixels among the entire image or data matrix. Here the process is performed with the help of chaotic maps, which are basically responsible of generating random sequences to perform the above procedure. Hence the randomness behavior plays a vital role and helps in achieving the desired goal of security.
3. rElAtEd worKBaheti[1] proposed an efficient symmetric encryption
scheme, which is associated to the cyclic elliptic curve
Original or Plain Image
Figure 1. image encryption.
Figure 2. logistic map.
Figure 3. Architecture of chaotic cryptosystems.
Encrypted or Cipher Image
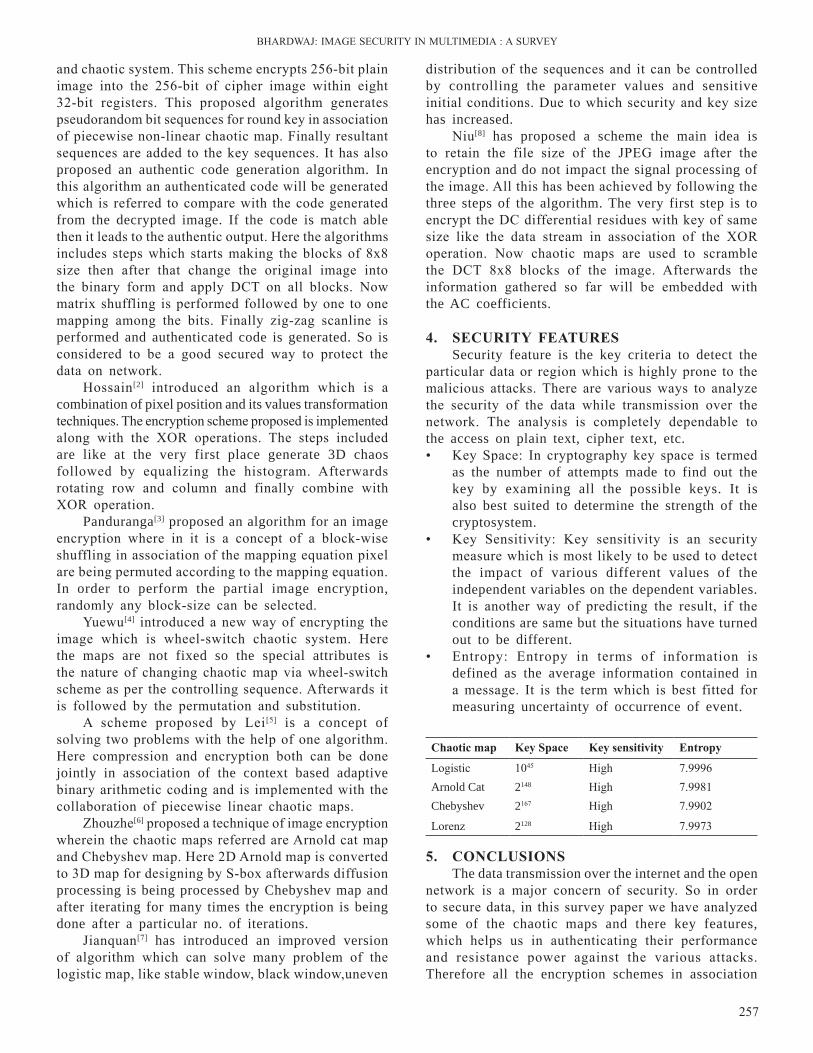
BHArDWAJ: IMAGE SECurITY In MulTIMEDIA : A SurVEY
257
distribution of the sequences and it can be controlled by controlling the parameter values and sensitive initial conditions. Due to which security and key size has increased.
niu[8] has proposed a scheme the main idea is to retain the file size of the JPEG image after the encryption and do not impact the signal processing of the image. All this has been achieved by following the three steps of the algorithm. The very first step is to encrypt the DC differential residues with key of same size like the data stream in association of the XOr operation. now chaotic maps are used to scramble the DCT 8x8 blocks of the image. Afterwards the information gathered so far will be embedded with the AC coefficients.
4. sECUritY FEAtUrEsSecurity feature is the key criteria to detect the
particular data or region which is highly prone to the malicious attacks. There are various ways to analyze the security of the data while transmission over the network. The analysis is completely dependable to the access on plain text, cipher text, etc.• Key Space: In cryptography key space is termed
as the number of attempts made to find out the key by examining all the possible keys. It is also best suited to determine the strength of the cryptosystem.
• Key Sensitivity: Key sensitivity is an security measure which is most likely to be used to detect the impact of various different values of the independent variables on the dependent variables. It is another way of predicting the result, if the conditions are same but the situations have turned out to be different.
• Entropy: Entropy in terms of information is defined as the average information contained in a message. It is the term which is best fitted for measuring uncertainty of occurrence of event.
and chaotic system. This scheme encrypts 256-bit plain image into the 256-bit of cipher image within eight 32-bit registers. This proposed algorithm generates pseudorandom bit sequences for round key in association of piecewise non-linear chaotic map. Finally resultant sequences are added to the key sequences. It has also proposed an authentic code generation algorithm. In this algorithm an authenticated code will be generated which is referred to compare with the code generated from the decrypted image. If the code is match able then it leads to the authentic output. Here the algorithms includes steps which starts making the blocks of 8x8 size then after that change the original image into the binary form and apply DCT on all blocks. now matrix shuffling is performed followed by one to one mapping among the bits. Finally zig-zag scanline is performed and authenticated code is generated. So is considered to be a good secured way to protect the data on network.
Hossain[2] introduced an algorithm which is a combination of pixel position and its values transformation techniques. The encryption scheme proposed is implemented along with the XOr operations. The steps included are like at the very first place generate 3D chaos followed by equalizing the histogram. Afterwards rotating row and column and finally combine with XOr operation.
Panduranga[3] proposed an algorithm for an image encryption where in it is a concept of a block-wise shuffling in association of the mapping equation pixel are being permuted according to the mapping equation. In order to perform the partial image encryption, randomly any block-size can be selected.
Yuewu[4] introduced a new way of encrypting the image which is wheel-switch chaotic system. Here the maps are not fixed so the special attributes is the nature of changing chaotic map via wheel-switch scheme as per the controlling sequence. Afterwards it is followed by the permutation and substitution.
A scheme proposed by lei[5] is a concept of solving two problems with the help of one algorithm. Here compression and encryption both can be done jointly in association of the context based adaptive binary arithmetic coding and is implemented with the collaboration of piecewise linear chaotic maps.
Zhouzhe[6] proposed a technique of image encryption wherein the chaotic maps referred are Arnold cat map and Chebyshev map. Here 2D Arnold map is converted to 3D map for designing by S-box afterwards diffusion processing is being processed by Chebyshev map and after iterating for many times the encryption is being done after a particular no. of iterations.
Jianquan[7] has introduced an improved version of algorithm which can solve many problem of the logistic map, like stable window, black window,uneven
Chaotic map Key space Key sensitivity Entropy
logistic 1045 High 7.9996Arnold Cat 2148 High 7.9981Chebyshev 2167 High 7.9902
lorenz 2128 High 7.9973
5. ConClUsionsThe data transmission over the internet and the open
network is a major concern of security. So in order to secure data, in this survey paper we have analyzed some of the chaotic maps and there key features, which helps us in authenticating their performance and resistance power against the various attacks. Therefore all the encryption schemes in association
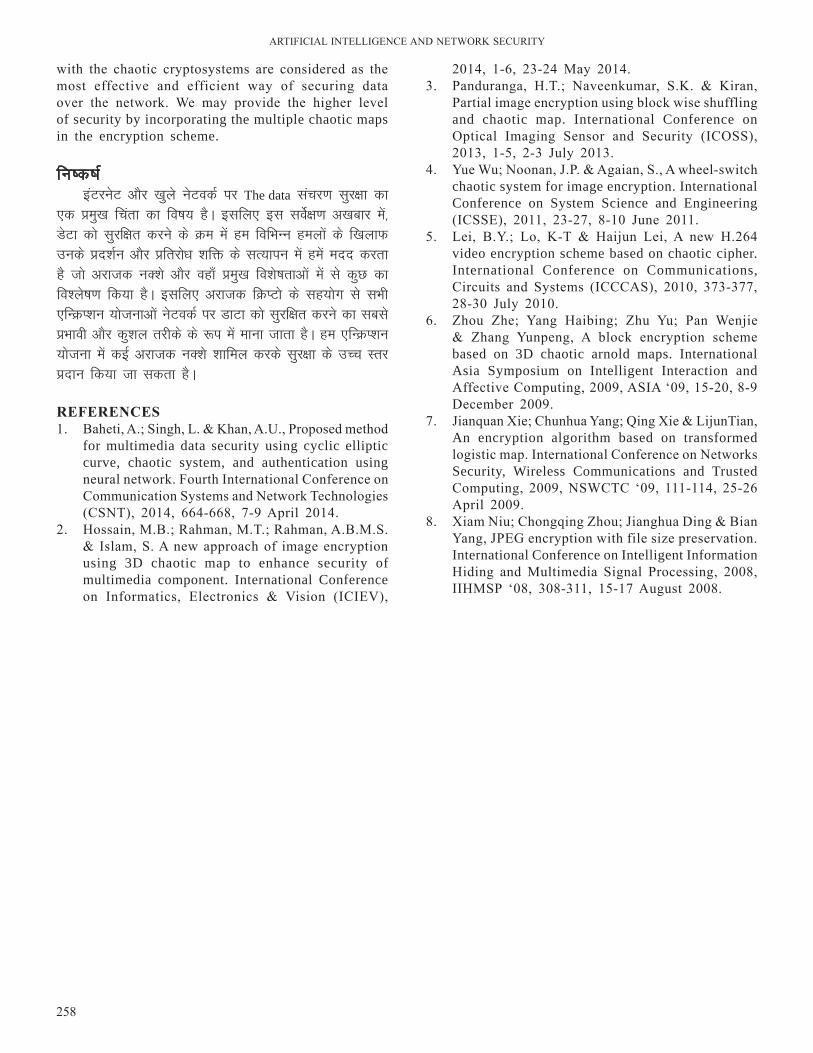
ArTIFICIAl InTEllIGEnCE AnD nETWOrK SECurITY
258
2014, 1-6, 23-24 May 2014.3. Panduranga, H.T.; naveenkumar, S.K. & Kiran,
Partial image encryption using block wise shuffling and chaotic map. International Conference on Optical Imaging Sensor and Security (ICOSS), 2013, 1-5, 2-3 July 2013.
4. Yue Wu; noonan, J.P. & Agaian, S., A wheel-switch chaotic system for image encryption. International Conference on System Science and Engineering (ICSSE), 2011, 23-27, 8-10 June 2011.
5. lei, B.Y.; lo, K-T & Haijun lei, A new H.264 video encryption scheme based on chaotic cipher. International Conference on Communications, Circuits and Systems (ICCCAS), 2010, 373-377, 28-30 July 2010.
6. Zhou Zhe; Yang Haibing; Zhu Yu; Pan Wenjie & Zhang Yunpeng, A block encryption scheme based on 3D chaotic arnold maps. International Asia Symposium on Intelligent Interaction and Affective Computing, 2009, ASIA ‘09, 15-20, 8-9 December 2009.
7. Jianquan Xie; Chunhua Yang; qing Xie & lijunTian, An encryption algorithm based on transformed logistic map. International Conference on networks Security, Wireless Communications and Trusted Computing, 2009, nSWCTC ‘09, 111-114, 25-26 April 2009.
8. Xiam niu; Chongqing Zhou; Jianghua Ding & Bian Yang, JPEG encryption with file size preservation. International Conference on Intelligent Information Hiding and Multimedia Signal Processing, 2008, IIHMSP ‘08, 308-311, 15-17 August 2008.
with the chaotic cryptosystems are considered as the most effective and efficient way of securing data over the network. We may provide the higher level of security by incorporating the multiple chaotic maps in the encryption scheme.
fu’d’k ZbaVjusV vkSj [kqys usVodZ ij The data lapj.k lqj{kk dk
,d çeq[k fpark dk fo’k; gSA blfy, bl losZ{k.k v[kckj esa] MsVk dks lqjf{kr djus ds Øe esa ge fofHkUu geyksa ds f[kykQ muds çn”kZu vkSj çfrjks/k “kfä ds lR;kiu esa gesa enn djrk gS tks vjktd uD”ks vkSj ogk¡ çeq[k fo”ks’krkvksa esa ls dqN dk fo”ys’k.k fd;k gSA blfy, vjktd fØIVks ds lg;ksx ls lHkh ,fUØI”ku ;kstukvksa usVodZ ij MkVk dks lqjf{kr djus dk lcls çHkkoh vkSj dq”ky rjhds ds :i esa ekuk tkrk gSA ge ,fUØI”ku ;kstuk esa dbZ vjktd uD”ks “kkfey djds lqj{kk ds mPp Lrj çnku fd;k tk ldrk gSA
rEFErEnCEs1. Baheti, A.; Singh, l. & Khan, A.u., Proposed method
for multimedia data security using cyclic elliptic curve, chaotic system, and authentication using neural network. Fourth International Conference on Communication Systems and network Technologies (CSnT), 2014, 664-668, 7-9 April 2014.
2. Hossain, M.B.; rahman, M.T.; rahman, A.B.M.S. & Islam, S. A new approach of image encryption using 3D chaotic map to enhance security of multimedia component. International Conference on Informatics, Electronics & Vision (ICIEV),
ok;jysl lsalj usVodZ ds fy, eSfVªDl vk/kkfjr dqath dh iwoZ forj.k ;kstuk Matrix based Key Pre-distribution schemes for wireless sensor network
Pramod T.C.*, and n.r. Sunitha Siddaganga Institute of Technology, Tumkur, Karnataka
*E-mail: [email protected]
lkjka”k
ok;jysl lsalj usVodZ ij Hks|rk o`f) gks jgh gS ds :i esa] lqjf{kr lapkj lqfuf”pr djus ds fy, fiNys dqN o’kksaZ ls /;ku fn;k tk jgk gSSA bl i= esa] mu yksxksa ds usVodZ ds lalk/ku ij fopkj djds] nks çeq[k iwoZ forj.k ;kstukvksa dk çLrko gSA igyh ;kstuk lgh dusfDVfoVh vkSj yphykiu çnku djrh gS tks tksM+h okj dqath iwoZ forj.k ;kstuk gSA HkaMkj.k mifj de djus ds fy,] dqath iwoZ forj.k ;kstuk&2 dk çLrko gSA ;g ;kstuk Hkh yphyk gS vkSj csgrj dusfDVfoVh çnku djrk gSA
AbstrActAs vulnerability on wireless sensor networks are increasing, ensuring secure communication has
gained a lot of attention for the past many years. In this paper, by considering the resource constraints of those networks, two key pre-distribution schemes are proposed. First scheme is pair-wise key pre-distribution scheme, which provides perfect connectivity and resilience. In order to reduce the storage overhead, key pre-distribution scheme-2 is proposed. This scheme is also resilient and provides better connectivity.
Keywords: Attacks, key pre-distribution, sensor, resiliency
Bilingual International Conference on Information Technology: Yesterday, Toady, and Tomorrow, 19-21 Feburary 2015, pp. 259-265 © DESIDOC, 2015
1. IntroductIonThe benefits and profit, of using small wireless
devices such as wireless sensor nodes revolutionize the era of technology. It is making the society smart and effective. Sensor devices are used to address the problems of day to day activities. However human beings are natural sensors. He/she can measure the length, weight and smell, etc., but the accuracy is not appropriate. The importance of accuracy and to sense the things that human beings can’t predict, makes the people to accept the wireless sensor network (WSn) technology. It is playing the vital role in the field of military, forest surveillance, healthcare, industrial automation and control systems, etc. The data from these devices, when used in such critical applications, are sensitive and prominent. So this requires the secure transmission of data. Hence use of cryptographic keys is essential. In WSn, secure key establishment can be established in three ways1: first is using trusted arbiter, i.e. using a trusted server scheme, second is using public-key schemes. However the resource constraints including limited battery, computation and communication overhead make the use of above two approaches as infeasible. In order to handle this, the simplest way is key pre-distribution, i.e. preloading the
secret keys prior to their deployment in the field. With this approach, several key pre-distribution, schemes have been proposed so far.
Blom2 makes use of secret symmetric matrix and public matrix to share the secret keys between the nodes. Blundo3, et al., makes use of symmetric bi-variate polynomial to establish secure communication. Eschenauer and Gligor4 (basic scheme for WSn) makes use of large key pool to assign the keys to nodes. Any two nodes which are able to find the common key from their loaded key chain can communicate securely otherwise using path key establishment secure communication will be established. The basic scheme security and resilience is extended in5, it is q-Composite scheme. Instead of one common key, this scheme requires at least q common keys to set up a link. Chan and Perrig6 proposed the PIKE. Here the node identifiers are arranged in a square grid structure. If two nodes are present in the same row or in the same column, then they share a pair wise key and can thus communicate directly. If not, using at most one intermediate node, those two nodes which are not shared keys, can establish their shared key. Kalindi7, et al. have modified the PIKE scheme. The keys are placed in the grid, which is 2-comosite
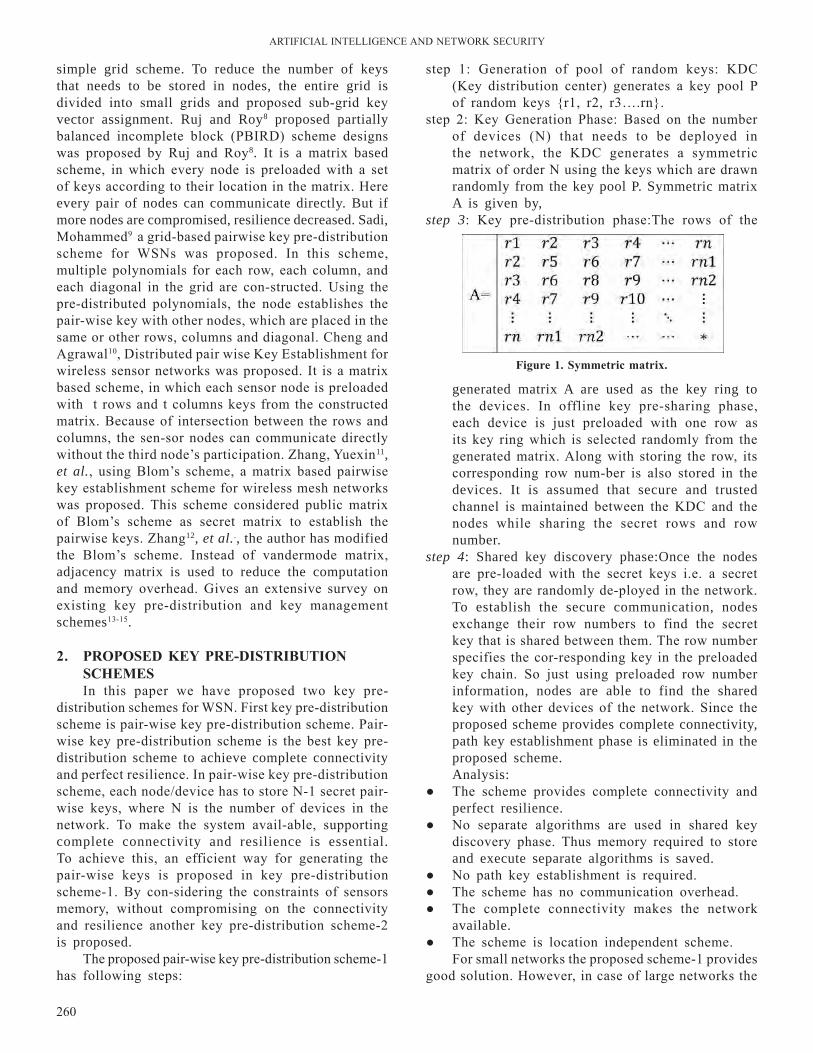
ArTIFICIAl InTEllIGEnCE AnD nETWOrK SECurITY
260
simple grid scheme. To reduce the number of keys that needs to be stored in nodes, the entire grid is divided into small grids and proposed sub-grid key vector assignment. Ruj and Roy8 proposed partially balanced incomplete block (PBIrD) scheme designs was proposed by ruj and roy8. It is a matrix based scheme, in which every node is preloaded with a set of keys according to their location in the matrix. Here every pair of nodes can communicate directly. But if more nodes are compromised, resilience decreased. Sadi, Mohammed9 a grid-based pairwise key pre-distribution scheme for WSns was proposed. In this scheme, multiple polynomials for each row, each column, and each diagonal in the grid are con-structed. using the pre-distributed polynomials, the node establishes the pair-wise key with other nodes, which are placed in the same or other rows, columns and diagonal. Cheng and Agrawal10, Distributed pair wise Key Establishment for wireless sensor networks was proposed. It is a matrix based scheme, in which each sensor node is preloaded with t rows and t columns keys from the constructed matrix. Because of intersection between the rows and columns, the sen-sor nodes can communicate directly without the third node’s participation. Zhang, Yuexin11, et al., using Blom’s scheme, a matrix based pairwise key establishment scheme for wireless mesh networks was proposed. This scheme considered public matrix of Blom’s scheme as secret matrix to establish the pairwise keys. Zhang12, et al.., the author has modified the Blom’s scheme. Instead of vandermode matrix, adjacency matrix is used to reduce the computation and memory overhead. Gives an extensive survey on existing key pre-distribution and key management schemes13-15.
2. ProPosEd KEY PrE-distribUtion sChEMEsIn this paper we have proposed two key pre-
distribution schemes for WSn. First key pre-distribution scheme is pair-wise key pre-distribution scheme. Pair-wise key pre-distribution scheme is the best key pre-distribution scheme to achieve complete connectivity and perfect resilience. In pair-wise key pre-distribution scheme, each node/device has to store n-1 secret pair-wise keys, where n is the number of devices in the network. To make the system avail-able, supporting complete connectivity and resilience is essential. To achieve this, an efficient way for generating the pair-wise keys is proposed in key pre-distribution scheme-1. By con-sidering the constraints of sensors memory, without compromising on the connectivity and resilience another key pre-distribution scheme-2 is proposed.
The proposed pair-wise key pre-distribution scheme-1 has following steps:
step 1: Generation of pool of random keys: KDC (Key distribution center) generates a key pool P of random keys {r1, r2, r3….rn}.
step 2: Key Generation Phase: Based on the number of devices (n) that needs to be deployed in the network, the KDC generates a symmetric matrix of order n using the keys which are drawn randomly from the key pool P. Symmetric matrix A is given by,
step 3: Key pre-distribution phase:The rows of the
generated matrix A are used as the key ring to the devices. In offline key pre-sharing phase, each device is just preloaded with one row as its key ring which is selected randomly from the generated matrix. Along with storing the row, its corresponding row num-ber is also stored in the devices. It is assumed that secure and trusted channel is maintained between the KDC and the nodes while sharing the secret rows and row number.
step 4: Shared key discovery phase:Once the nodes are pre-loaded with the secret keys i.e. a secret row, they are randomly de-ployed in the network. To establish the secure communication, nodes exchange their row numbers to find the secret key that is shared between them. The row number specifies the cor-responding key in the preloaded key chain. So just using preloaded row number information, nodes are able to find the shared key with other devices of the network. Since the proposed scheme provides complete connectivity, path key establishment phase is eliminated in the proposed scheme.Analysis:
● The scheme provides complete connectivity and perfect resilience.
● no separate algorithms are used in shared key discovery phase. Thus memory required to store and execute separate algorithms is saved.
● no path key establishment is required.● The scheme has no communication overhead.● The complete connectivity makes the network
available.● The scheme is location independent scheme.
For small networks the proposed scheme-1 provides good solution. However, in case of large networks the
Figure 1. symmetric matrix.
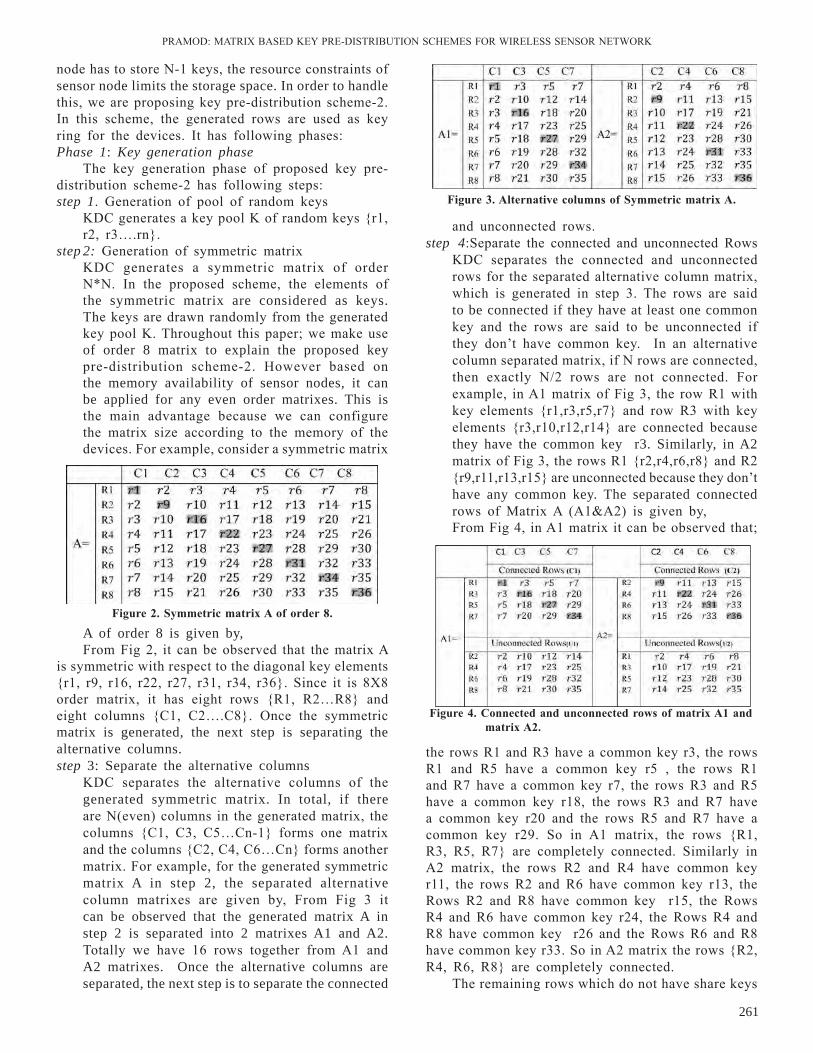
PrAMOD: MATrIX BASED KEY PrE-DISTrIBuTIOn SCHEMES FOr WIrElESS SEnSOr nETWOrK
261
and unconnected rows.step 4:Separate the connected and unconnected rows KDC separates the connected and unconnected
rows for the separated alternative column matrix, which is generated in step 3. The rows are said to be connected if they have at least one common key and the rows are said to be unconnected if they don’t have common key. In an alternative column separated matrix, if n rows are connected, then exactly n/2 rows are not connected. For example, in A1 matrix of Fig 3, the row r1 with key elements {r1,r3,r5,r7} and row r3 with key elements {r3,r10,r12,r14} are connected because they have the common key r3. Similarly, in A2 matrix of Fig 3, the rows r1 {r2,r4,r6,r8} and r2 {r9,r11,r13,r15} are unconnected because they don’t have any common key. The separated connected rows of Matrix A (A1&A2) is given by,From Fig 4, in A1 matrix it can be observed that;
node has to store n-1 keys, the resource constraints of sensor node limits the storage space. In order to handle this, we are proposing key pre-distribution scheme-2. In this scheme, the generated rows are used as key ring for the devices. It has following phases:Phase 1: Key generation phase
The key generation phase of proposed key pre-distribution scheme-2 has following steps:step 1. Generation of pool of random keys KDC generates a key pool K of random keys {r1,
r2, r3….rn}.step 2: Generation of symmetric matrix KDC generates a symmetric matrix of order
n*n. In the proposed scheme, the elements of the symmetric matrix are considered as keys. The keys are drawn randomly from the generated key pool K. Throughout this paper; we make use of order 8 matrix to explain the proposed key pre-distribution scheme-2. However based on the memory availability of sensor nodes, it can be applied for any even order matrixes. This is the main advantage because we can configure the matrix size according to the memory of the devices. For example, consider a symmetric matrix
Figure 2. symmetric matrix A of order 8.
Figure 3. Alternative columns of symmetric matrix A.
A of order 8 is given by,From Fig 2, it can be observed that the matrix A
is symmetric with respect to the diagonal key elements {r1, r9, r16, r22, r27, r31, r34, r36}. Since it is 8X8 order matrix, it has eight rows {r1, r2…r8} and eight columns {C1, C2….C8}. Once the symmetric matrix is generated, the next step is separating the alternative columns.step 3: Separate the alternative columns KDC separates the alternative columns of the
generated symmetric matrix. In total, if there are n(even) columns in the generated matrix, the columns {C1, C3, C5…Cn-1} forms one matrix and the columns {C2, C4, C6…Cn} forms another matrix. For example, for the generated symmetric matrix A in step 2, the separated alternative column matrixes are given by, From Fig 3 it can be observed that the generated matrix A in step 2 is separated into 2 matrixes A1 and A2. Totally we have 16 rows together from A1 and A2 matrixes. Once the alternative columns are separated, the next step is to separate the connected
Figure 4. Connected and unconnected rows of matrix A1 and matrix A2.
the rows r1 and r3 have a common key r3, the rows r1 and r5 have a common key r5 , the rows r1 and r7 have a common key r7, the rows r3 and r5 have a common key r18, the rows r3 and r7 have a common key r20 and the rows r5 and r7 have a common key r29. So in A1 matrix, the rows {r1, r3, r5, r7} are completely connected. Similarly in A2 matrix, the rows r2 and r4 have common key r11, the rows r2 and r6 have common key r13, the rows r2 and r8 have common key r15, the rows r4 and r6 have common key r24, the rows r4 and r8 have common key r26 and the rows r6 and r8 have common key r33. So in A2 matrix the rows {r2, r4, r6, r8} are completely connected.
The remaining rows which do not have share keys

ArTIFICIAl InTEllIGEnCE AnD nETWOrK SECurITY
262
with any other rows are separated as unconnected rows. From Fig 4, the rows {r2, r4, r6, r8} of A1 matrix are unconnected rows. Similarly because of no common keys, the rows {r1, r3, r5, r7} of A2 matrix are unconnected rows.
By observing connected rows and unconnected rows, one more important observation that we can make is, rows of unconnected rows {r2, r4, r6, r8} of A1 matrix share common keys with unconnected rows {r1, r3, r5, r7} of A2 matrix. For example the unconnected row r2 with key elements {r2,r10,r12,r14} of A1 matrix share a separate key with all the unconnected rows {r1, r3, r5, r7} of A2 matrix. In specific, the row r2 of A1 matrix shares common key r2 with row r1 of A2 matrix, common key r10 with row r3 of A2 matrix, common key r12 with row r5 of A2 matrix and common key r14 with row r7 of A2 matrix. Similarly the rows r4, r6 and r8 of A1 matrix also have common key with rows r1, r3, r5 and r7 of A2 matrix.
In this key pre-distribution scheme, the generated rows are used as key ring for the nodes. The main aim of this key pre-distribution scheme is to increase the connectivity with storing small number of keys in the nodes. As we can see if we preload the generated rows in step 4 as key ring for the devices, the connectivity is established between the connected rows (C1) of A1 matrix, between the connected rows (C2) of A2 matrix and unconnected rows (u1) of A1 matrix with unconnected rows (u2) of A2 matrix. With this, the connectivity is achieved to some extent. But because of no common key elements, the connected rows of A1 matrix are not able to connect with connected rows of A2 matrix and also with unconnected rows of A1 and A2 matrix. In order to establish connectivity, the KDC performs the next step.step 5: Assignment of diagonal elements The generated rows are shown in Fig 4. From this
figure, we can observe that, the diagonal elements are not shared with any rows of the matrix. In order to make it useful, the KDC extracts the diagonal elements of the constructed matrix. For example in Fig 4, the diagonal elements are {r1, r9, r16, r22, r27, r31, r34, r36}. Once the KDC extracts the diagonal elements, it distributes the diagonal elements to other rows. In general, for any order matrix, the distribution of diagonal key elements in the following manner will increase the probability of connectivity.
● The diagonal elements of connected rows of A1 matrix should be shared with alternative rows of connected rows of A2 matrix. Once it is done, the remaining key elements should be equally shared among the unconnected rows of A1 and A2 matrix.
● The diagonal elements of connected rows of A2 matrix should be shared with alternative rows of connected rows of A1 matrix. Once it is done, the remaining key elements should be equally shared among the unconnected rows of A1 and A2 matrix.Fig. 5 shows an example of distributing the
diagonal elements to the generated rows which is shown in Fig. 4.
In Fig 5, the random values stored in rows {r1,
Figure 5. Assignment of diagonal elements to rows.
r2…r8} are stored in nodes {n1, n2 …n8}. From Fig 5, we can observe that, the assignment of diagonal elements increases the connectivity and makes it possible to establish the connection between the connected and unconnected rows. For example, because of sharing the diagonal element r1 of the node n1, which belongs to connected rows of A1 matrix with node n4 of connected rows of A2 matrix; the node n1 and n4 are connected. To increase the connectivity to some more extent, we place some extra keys in the empty places of the generated matrix. For example, in the connected rows of A1 matrix, empty places are there at the node n3 and n7. Similarly, we have empty places in other matrixes also.
In Fig 5, because of no common key element, the nodes in the unconnected rows of A1 ma-trix are not able to connect each other. Similarly, the nodes in the unconnected rows of A2 matrix are not able to connect each other. In order to make the connection possible between unconnected rows and also to increase the connectivity between connected rows of A1 and A2 matrix, we make use of some extra keys from the generated key pool K in step1.In general, for any order matrix the distribution of extra keys should be perform in the following manner:● First count the number of empty spaces in the
unconnected rows of A1 matrix. Then ex-actly draw count/2 key elements from the key pool and assign them randomly to the rows. The same keys needs to be assigned to remaining empty spaces of unconnected rows of A1 matrix. Similarly, follow the same procedure for A2 matrix.
● Count the total number of empty spaces in any one of the connected rows matrix (either A1 or
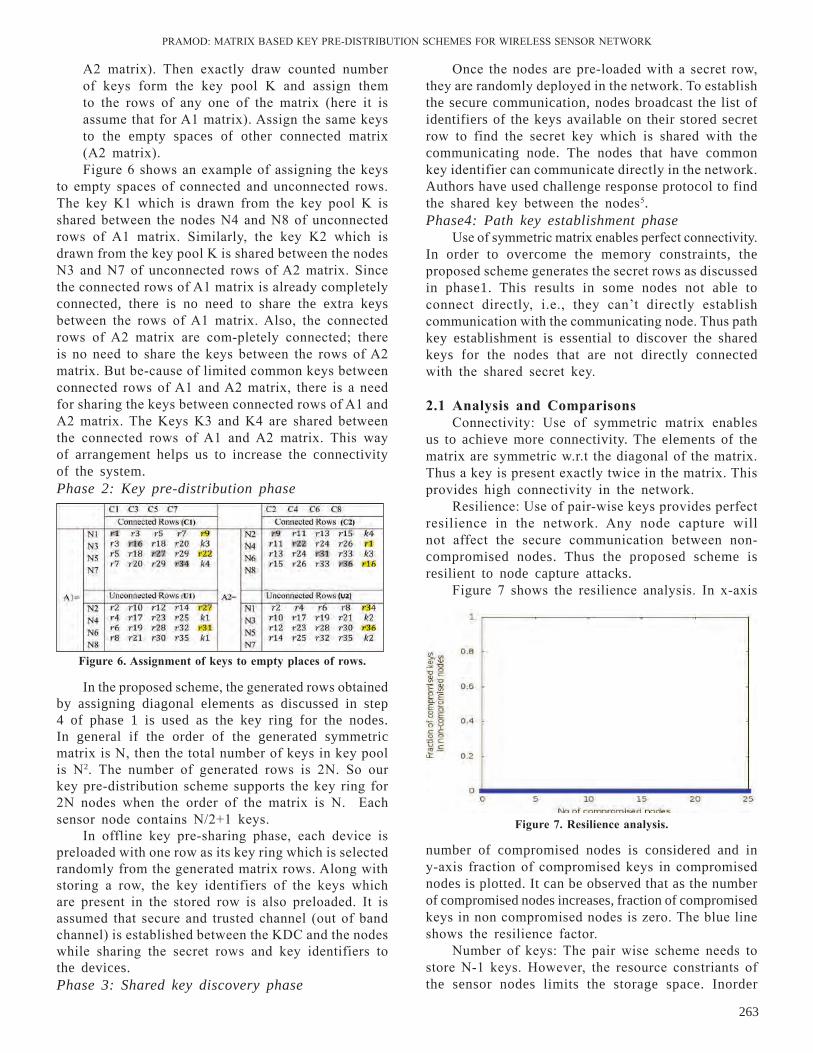
PrAMOD: MATrIX BASED KEY PrE-DISTrIBuTIOn SCHEMES FOr WIrElESS SEnSOr nETWOrK
263
Once the nodes are pre-loaded with a secret row, they are randomly deployed in the network. To establish the secure communication, nodes broadcast the list of identifiers of the keys available on their stored secret row to find the secret key which is shared with the communicating node. The nodes that have common key identifier can communicate directly in the network. Authors have used challenge response protocol to find the shared key between the nodes5. Phase4: Path key establishment phase
use of symmetric matrix enables perfect connectivity. In order to overcome the memory constraints, the proposed scheme generates the secret rows as discussed in phase1. This results in some nodes not able to connect directly, i.e., they can’t directly establish communication with the communicating node. Thus path key establishment is essential to discover the shared keys for the nodes that are not directly connected with the shared secret key.
2.1 Analysis and Comparisons
Connectivity: use of symmetric matrix enables us to achieve more connectivity. The elements of the matrix are symmetric w.r.t the diagonal of the matrix. Thus a key is present exactly twice in the matrix. This provides high connectivity in the network.
resilience: use of pair-wise keys provides perfect resilience in the network. Any node capture will not affect the secure communication between non-compromised nodes. Thus the proposed scheme is resilient to node capture attacks.
Figure 7 shows the resilience analysis. In x-axis
A2 matrix). Then exactly draw counted number of keys form the key pool K and assign them to the rows of any one of the matrix (here it is assume that for A1 matrix). Assign the same keys to the empty spaces of other connected matrix (A2 matrix).Figure 6 shows an example of assigning the keys
to empty spaces of connected and unconnected rows. The key K1 which is drawn from the key pool K is shared between the nodes n4 and n8 of unconnected rows of A1 matrix. Similarly, the key K2 which is drawn from the key pool K is shared between the nodes n3 and n7 of unconnected rows of A2 matrix. Since the connected rows of A1 matrix is already completely connected, there is no need to share the extra keys between the rows of A1 matrix. Also, the connected rows of A2 matrix are com-pletely connected; there is no need to share the keys between the rows of A2 matrix. But be-cause of limited common keys between connected rows of A1 and A2 matrix, there is a need for sharing the keys between connected rows of A1 and A2 matrix. The Keys K3 and K4 are shared between the connected rows of A1 and A2 matrix. This way of arrangement helps us to increase the connectivity of the system.Phase 2: Key pre-distribution phase
Figure 6. Assignment of keys to empty places of rows.
In the proposed scheme, the generated rows obtained by assigning diagonal elements as discussed in step 4 of phase 1 is used as the key ring for the nodes. In general if the order of the generated symmetric matrix is n, then the total number of keys in key pool is n2. The number of generated rows is 2n. So our key pre-distribution scheme supports the key ring for 2n nodes when the order of the matrix is n. Each sensor node contains n/2+1 keys.
In offline key pre-sharing phase, each device is preloaded with one row as its key ring which is selected randomly from the generated matrix rows. Along with storing a row, the key identifiers of the keys which are present in the stored row is also preloaded. It is assumed that secure and trusted channel (out of band channel) is established between the KDC and the nodes while sharing the secret rows and key identifiers to the devices.Phase 3: Shared key discovery phase
Figure 7. resilience analysis.
number of compromised nodes is considered and in y-axis fraction of compromised keys in compromised nodes is plotted. It can be observed that as the number of compromised nodes increases, fraction of compromised keys in non compromised nodes is zero. The blue line shows the resilience factor.
number of keys: The pair wise scheme needs to store n-1 keys. However, the resource constriants of the sensor nodes limits the storage space. Inorder

ArTIFICIAl InTEllIGEnCE AnD nETWOrK SECurITY
264
to handle this, in the proposed scheme each node needs to store nearly n/2+1 keys. With achieving high connectivity and perfect reslience , the proposed scheme also reduces the number of keys that needs to be stored in the nodes.
2.3 Analysis● The probability of connectivity is increased.● The scheme provides perfect resilience.● Based on the device memory, we can configure the matrix order. In case of some key pre-distribution scheme, there is a restriction in storing the number of keys. So our scheme provides flexibility.● The key generation phase has five steps. However this is one time operation and it happens at KDC. The KDC has sufficient memory and computation capabilities.● The number of keys that needs to be preloaded in nodes is relatively small. ● The scheme is simple and efficient.● When compare to the proposed scheme-I, the shared key discovery phase in proposed scheme-II requires more bandwidth. ● It can be clearly observed that in key pre-distribution scheme there is a tradeoff between connectivity, resilience and storage.
To communicate securely with neighbors, the nodes may require path key establishment. While establishing secure links through secure routes, the number of hops required to reach destination node may be different. The secure link established via one hop will correspond to direct key establishment phase, otherwise two or more hops are required to establish the secure links.
In case of probabilistic schemes, when the key ring is equal to or greater than some number of keys, then only the probability of connecting secure links in the network is possible to be determined. Thus the probabilistic schemes restrict the key ring i.e. number of keys that should be stored in the devices to establish the secure links irrespective of the device memory. If the device memory is less and it is not possible to store the restricted number of keys, it is difficult to apply probabilistic key pre-distribution scheme because the network gets disconnected when the key ring is small. However in our scheme there is no restriction in the key ring size; based on the device memory, the desired order of matrix can be generated and using the stored rows, devices can establish the secure links.
Table 1 shows the analysis of the proposed scheme with respect to number of hops needed to establish secure links. use of symmetric matrix enables the connectivity ratio high. In general if n nodes are there in the network, each node contains (n/4 +1)
keys. Since the node has (n/4 +1) keys it is possible to establish direct connectivity with n/4 +1 nodes. The use of symmetric property of the matrix and its arrangement has made possible to connect half of the nodes using one connecting node and maximum of two connecting nodes are required to es-tablish communication from source node to any destination node in any size network.
3. ConClUsionsThis paper presents two key pre-distribution schemes
using symmetric matrix. First key pre-distribution scheme is pair-wise key pre-distribution, which supports cent percent connectivity and resilience. In order to overcome the memory constraints, second key pre-distribution scheme is proposed. In this scheme, the number of keys that needs to be stored is less and it provides perfect resilience. In future we would like to study the possible attacks and to make the scheme resilient to identified attacks.
fu"d"k Z bl i= lefer eSfVªDl dk mi;ksx djrs gq, nks çeq[k iwoZ
forj.k ;kstukvksa dks çLrqr djrk gSA igyh dqath iwoZ forj.k ;kstuk ds “kr&çfr”kr dusfDVfoVh vkSj yphykiu dk leFkZu djrk gS tks tksM+h okj dqath iwoZ forj.k] gSA Le`fr dh deh dks nwj djus ds Øe esa] nwljh pkch iwoZ forj.k ;kstuk dk çLrko gSA bl ;kstuk esa tek gksus dh t:jr gS fd dqaft;ksa dh la[;k de gS vkSj ;g ,dne lgh yphykiu çnku djrk gSA Hkfo’; esa ge laHkkfor geyksa vkSj mUgsa igpku djus ds fy, yphyh ;kstuk cukus ds fy, v/;;u djuk pkgrs gSaA
rEFErEnCEs1. Du, Wenliang, et al. A key management scheme for
wireless sensor networks using deployment knowledge. InFOCOM 2004. Twenty-third AnnualJoint Conference of the IEEE Computer and Communications Societies. Vol. 1. IEEE, 2004.
2. R. Blom, An optimal class of symmetric key generation systems, report liTH-ISY-I-0641, linköping university, 1984.
3. Blundo, Carlo, et al. Perfectly-secure key distribution for dynamic confer-ences. Advances in cryptology—CrYPTO’92. Springer Berlin Heidelberg, 1993
4. Eschenauer, laurent, and Virgil D. Gligor. A key-
table 1. Analysis of effect on network topology
Parameter Valuenumber of nodes in the network nnumber of keys in a node n/4 +1 keysDirect connectivity n/4 +1 nodesHalf of the nodes in the network are reachable by
One connecting node
Maximum average path length (l) Two connecting nodes
PrAMOD: MATrIX BASED KEY PrE-DISTrIBuTIOn SCHEMES FOr WIrElESS SEnSOr nETWOrK
265
management scheme for distributed sensor networks. Proceedings of the 9th ACM conference on Computer and communications security. ACM, 2002.
5. Chan, Haowen, Adrian Perrig, and Dawn Song. Random key predistribution schemes for sensor networks. Security and Privacy, 2003. Proceedings. 2003 Symposium on. IEEE, 2003
6. Chan, Haowen, & Adrian Perrig. PIKE: Peer intermediaries for key establishment in sensor networks. InFOCOM 2005. 24th Annual Joint Conference of the IEEE Computer and Communications Societies. Proceedings IEEE. Vol. 1. IEEE, 2005.
7. Kalindi, r., et al. Sub-grid based key vector assignment: A key pre-distribution scheme for distributed sensor networks. International Journal of Pervasive Computing and Communications 2.1. 2007: 35-45.
8. ruj, Sushmita, and Bimal roy. Key predistribution using partially balanced designs in wireless sensor networks. Parallel and Distributed Processing and Applications. Springer Berlin Heidelberg, 2007. 431-445.
9. Sadi, Mohammed Golam, Dong Seong Kim, & Jong Sou Park. GBr: Grid based random key predistribution for wireless sensor network. Parallel and Distributed Sys-tems, 2005. Proceedings. 11th International Conference on. Vol. 2. IEEE, 2005.
10. Cheng, Yi, and Dharma P. Agrawal. Distributed
Pairwise Key Establishment in Wireless Sensor networks. PSC. 2006.
11. Zhang, Yuexin, et al. Matrix-based pairwise key establishment in wireless mesh net-works using deployment knowledge. Communications (ICC), 2013 IEEE Interna-tional Conference on. IEEE, 2013.
12. Sukumar, Suraj. Computational Analysis of Modified Blom’s Scheme. arXiv preprint arXiv:1303.7457 (2013).
13. Chattopadhyay, Subhankar, & Ashok Kumar Turuk. A survey on key pre-distribution scheme in homogeneous wireless sensor networks. 2010.
14. ruj, Sushmita, Amiya nayak, & Ivan Stojmenovic. Key Predistribution in Wireless Sensor networks When Sensors Are Within Communication Range.Theoretical As-pects of Distributed Computing in Sensor networks. Springer Berlin Heidelberg, 2011. 787-832.
15. Alcaraz, Cristina, et al. Selecting key management schemes for WSn applica-tions. Computers & Security 31.8 (2012): 956-966.
ok;jysl lsalj usVodZ ds fy, çkScScfyfLVd bZ,e e‚My dk mi;ksx djds ÅtkZ U;wuhdj.k ds fy, D;w&yhp çksVksd‚y dks :ikarfjr djuk
Modified Q-lEACh Protocol for Energy Minimization using Probabilistic EM Model for wireless sensor network
Vinay Dwivedi, Atul Kumar Jaiswal#, and Amit Saxena*
Department of CSE, TRUBA, Bhopal, India #Defence Scientific Information and Documentation Centre, Delhi-110 054, India
*E-mail: [email protected]
lkjka”k
lq/kkj dh çfØ;k esa ,d çksVksd‚y miyC/k gS ftls D;w&yhp çksVksd‚y dgk tkrk gSA ewyr% D;w&yhp çksVksd‚y ÅtkZ cpr eksM ds çlaLdj.k ds fy, nks fHkUu&fHkUu jkmfVax çksVksd‚y dk ,d la;kstu gSA D;w&yhp çksVksd‚y lhfer 'kfä FkzslgksYM QSDVj ij vk/kkfjr DokMSVªy eksM p;u ds fl)kar ij fMtkbu fd;k gqvk gSA yhp vkSj D;w&yhp ds chp vuqla/kku varj dyLVj uksM çfØ;k ds p;u ds fy, lwpukvksa ds lk>kdj.k dk gSA dyLVj uksM p;u ds nkSjku vf/kd fo|qr [kpZ gksrh gSA vc bl 'kfä'kkyh çHkko ds ºzkl us dyLVj gsM ds p;u vkSj csl LVs'ku ds fy, MkVk Vªkalfe'ku ds fy, bZ,e çkScSfcfyfLVd e‚My dk mi;ksx fd;kA çLrkfor i)fr nks QSDVj esa cuh gS&,d gS dyLVj gsM ds fuekZ.k ds nkSjku 'kfä dk ekiu vkSj nwljs pj.k esa] lsalj uksM ds lkFk MsVk ,xzhxs'ku dh çfØ;k dk mi;ksx fd;k x;k gSA lsalj uksM dk fMIyk;esaV e‚My fofHkUu [kaMksa esa foHkkftr gSA ifj.kke dk gekjk vuqHkokfJr ewY;kadu n'kkZrk gS fd :ikarfjr çksVksd‚y ,e&D;w&yhp yhp vkSj D;w&yhp ds laihM+u esa cgqr dq'ky gSA ;g çfØ;k ÅtkZ dh [kir yxHkx 45 izfr'kr de dj nsrh gSA
AbstrAct
In the process of improvement q-lEACH protocol is available. Basically, q-lEACH protocol is a combination of two different routing protocols for the processing of energy-saving mode. The q-lEACH protocols designed on the principle of quadatral mode selection based on limited power threshold factor. The research gap between lEACH and q-lEACH is sharing of information for the selection of cluster node process. During the cluster node selection, more power is consumed. now reduction of this powerful effect for EM probabilistic model for the selection of cluster head and data transmission for the base station has been used. The proposed method has two factor, one is a measurement of power during formation of cluster head, and in second phase used the process of data aggregation with sensor node. The deployment model of sensor node is distributed in different sections. The distribution of these sensor nodes in random fashion according to mobility model of sensor network. Our empirical evaluation of result shows that the modified protocol M-q-lEACH is very efficient in compression of lEACH and q-lEACH. The process reduces the consumption of energy about 45 per cent.
Keywords: WSn, Energy, EM Model, lEACH
Bilingual International Conference on Information Technology: Yesterday, Today, and Tomorrow, 19-21 February 2015, pp. 266-272© DESIDOC, 2015
1. IntroductIonIn current scenario, wireless sensor network suffered
from distribution of power for the selection of base node and cluster node. The utilization of power factor in sensor network is limited. Due to this reason most of the authors used the process of energy consumption for increasing the life of the network. The power supply process of wireless sensor network is fixed type. The process of power used battery[1,2]. now most of the authors followed the location-based and heretical-based
protocol for the minimization process of the energy factor in wireless sensor network. In consequence of efficient energy utilization one protocol which is very famous is lEACH protocol[4,5]. The lEACH protocol is based on the concept of location and threshold parameters for the selection of cluster head. Energy consumption and life of the network is a major research area of the wireless sensor network. In this network sensor is a tiny electronic device that takes more power for the processing of sensor data. The processing of data
DWIVEDI: MODIFIED q-lEACH PrOTOCOl FOr EnErGY MInIMIZATIOn uSInG PrOBABIlISTIC EM MODEl FOr WIrElESS SEnSOr...
267
and a lifetime of the network depends on consumption of power6. now in current research trend various routing protocols are designed for a minimization of energy consumption in wireless sensor network. Some protocols are based on location, some are based on performance. In the series of protocols one protocol is called lEACH protocol. The lEACH protocol is very efficient in concern of energy saving and life of the network. But the process of data propagation in form of bidirectional and most of the node are going in phase of sleep mode. So this is the reason these protocols also need some improvement. In the process of improvement, one protocol is available is called q-lEACH protocol [7]. The q-lEACH protocol are based on quad direction of lEACH protocol and the process of protocol based on variable threshold concept. Basically the q-lEACH protocol are based on the concept of location-based routing and hierarchal clustering head processing technique. In that phase of the protocol, one gap is issue the information of network to the cluster head of the network. The fill of this gap and to modify these protocols is called M-q-l-lEACH Protocol.
The process of modification based on the model of probability for the process of knowledge based on the processing of cluster head and network for the processing of data. Energy aware routing is a variant of directed diffusion and is intended to increase the lifetime of the network[8]. It differs from direct diffusion in that it maintains a set of sub-optimal paths instead of maintaining or enforcing one optimal path at a higher rate. These paths are maintained and chosen by a certain probability. In the whole process some point of information is lacking such as information relation between selection processes of cluster head.
Some problem discusses here. Wireless sensor networks consist of a number of sensing nodes, which are distributed in a wide area. They sense an event occurring in the environment and these sensing nodes are distributed or placed according to the requirements of the application. The base station (sink), which collects data from other nodes, interacts with a user (someone interested in monitoring the activity). Data can be collected in many ways from a sensing node to a sink node using hopping techniques or transmitting data on certain frequencies. Sinks have more advanced features than sensing nodes in terms of data transmissions and processing capabilities, memory size and energy reserves[9,10]. There can be multiple sinks for a network so that there is no single point of failure.
Energy dissipation is a major factor in WSns during communication between the nodes. Energy should be saved, so that the batteries do not get depleted or drained quickly as these are not easily replaceable in applications such as surveillance. quality of service
ensures the effective communication within the given or bounded delay time. Protocols should check for network stability, redundant data should be transmitted over the network for any type of traffic distribution. It also needs to maintain certain resource limiting factors, such as bandwidth, memory buffer size and processing capabilities.
2. lEACh ProtoColIn this section discuss pervious q-lEACH algorithm
process. They discuss network characteristics and working principle of the proposed scheme for efficient performance. In order to enhance some features like clustering process, stability period and network life-time for optimized performance of WSns. According to this approach sensor nodes are deployed in the territory. In order to acquire better clustering, we partition the network into four quadrants. Doing such sort of partitioning better coverage of the whole network is achieved. Additionally, the exact distribution of nodes in the field is also well defined14. Describes the optimal approach of load distribution among sensor nodes. Moreover, it also presents an idea of efficient clustering mechanism which yields significantly better coverage of the whole network. We deployed random nodes in a 100 m × 100 m filed. Based on location information, network is divided into four equal parts, i.e., (a1, a2, a3, a4). Defining overall network area as below:
A = a1 + a2 + a3 + a4 (1)an= A(xm, ym) (2)
where n = 4. And m = 100. Hence, overall field is distributed as follows:
Ym=0:50 limXm=0:50 an + Ym=0:50 limXm=51:100 an +Ym=51:100limXm=0:50an +Ym=51:100
limXm=51:100an (3)Portioning of network into quadrants yields in
efficient energy utilization of sensor nodes. Through this division optimum positions of CHs are defined. Moreover, transmission load of other sending nodes is also reduced. In conventional lEACH cluster are arbitrary in size and some of the cluster members are located far away. Due to this dynamic cluster formation farther nodes suffers through high energy drainage and thus, network performance degrades. Whereas, in q-lEACH network is partitioned into sub-sectors and hence, clusters formed within these sub-sectors are more deterministic in nature. Therefore, nodes are well distributed within a specific cluster and results in efficient energy drainage. Concept of randomized clustering as given in[1] for optimized energy drainage is applied in each sector. Assigning CH probability P = 0.05 we start clustering process. In every individual round nodes decides to become CH based upon P and threshold T(n) given in17 as:
ArTIFICIAl InTEllIGEnCE AnD nETWOrK SECurITY
268
Algorithm 1 Setup Phase1: begin2: if node "G −→ G =nodes which did not become
CHs in current EPOCH then3: if (nODE BElOnGS TO ==′ areaA′) then4: if (nuMBErOFCHs <= _ nK _) then5: TEMP=random number (0-1)6: if (temp <= P1−P(r,mod1/P) ) then7: node=CH A8: nuMBEr OF CHs = nuMBEr OF CHs+19: end if10: else if (nODE BElOnGS TO ==′ areaB′)
then11: REPEAT STEP 4: 812: else if (nODE BElOnGS TO ==′ areaC′)
then13: REPEAT STEP 4: 814: else if (nODE BElOnGS TO ==′ areaD′)
then15: rEPEAT STEP 4: 816: end if17: end if18: end ifAlgorithm 1 defines CHs selection mechanism.
Overall network is divided into four areas as: Area A, B, C and D. Initially, each node decides whether or not to become a CH. The node chooses a random number between 0 and 1. If this number is less than certain threshold T (n), and condition for desired number of CHs in a specific area is not met, then the node becomes a CH. Similarly the same process continues for the rest of the sectors and optimum number of clusters are formed. Selection of clusters will depend upon received Signal Strength Indicator (rSSI) of advertisement. After the decision of clusters, nodes must tell CHs about their association. On the basis of gathered information from attached nodes, guaranteed time slots are allocated to nodes using time division multiple access (TDMA) approach. Moreover, this information is again broadcasted with sensor nodes in the cluster.
Algorithm 2 defines the association of nodes with their appropriate CHs. non-CHs nodes will locate themselves in specified area they belong to. Then they will search for all possible CHs, and on the basis of rSSI they will start an association. This process will continue until association phase comes to an end. Once a cluster setup phase is complete and nodes are assigned to TDMA slots every node communicates at its allocated time interval. The rest of the time, radio of each non-cluster head node will remain off in order to optimize energy utilization. When all node data are received at the CHs then, the data is compressed and is sent to BS. The round
completes and new selection of CHs will be initiated for the next round. In proposing idea, we implement above mentioned concept of localized coordination in each sectored area. We used the same radio model as discussed in[16] for transmission and reception of information from sensor nodes to CHs and then to BS. Packet length K of 2000 bits is used in our simulations. According to the above mentioned, initially all nodes send their location information to BS. BS performs logical partitioning of network on the basis of gathered information. network is divided into four quadrants and broadcasts information to nodes. On the basis of threshold some nodes are elected as CH in each division. normal nodes choose their CHs within their own quadrant based on rSSI. For association nodes sends their requests to CHs. TDMA slots are assigned to every node for appropriate communication without congestion. Every node communicates in its allocated slot with its defined CH.
Algorithm 2 Node Association in Q-LEACH1: n ∈Group of normal nodes2: GC ∈Group of CHs3: if n∈(A, a1) then4: Where5: A = a1, a2, a3, a46: Check all possible ACHs7: Check rSSI of CHs8: Associate with ACHs9: then10: transfer of data occurs11: end if12: if n ∈(A, a2) then13: repeat step from 5: 8 for BCHs14: end if15: if n ∈(A, a3) then16: repeat step from 5: 8 for CCHs17: end if18: if n ∈(A, a4) then19: repeat step from 5: 8 for DCHs20: end if
3. ProPosEd ModElThe q-lEACH protocol not measure, the prior
knowledge of cluster head selection during transmission of data for base stations.The selection of cluster head process done by using the EM estimation technique. The EM technique estimates the energy level and the consumption level during transmission and selection of cluster node in the individual cluster group. The process of individual groups of node for selecting the cluster head depends on minimum energy required for the formation process. now process of that reduces the energy consumption and increase the lifetime of the network. In each area of cluster head selection using the grouping of nodes using estimation of maximum
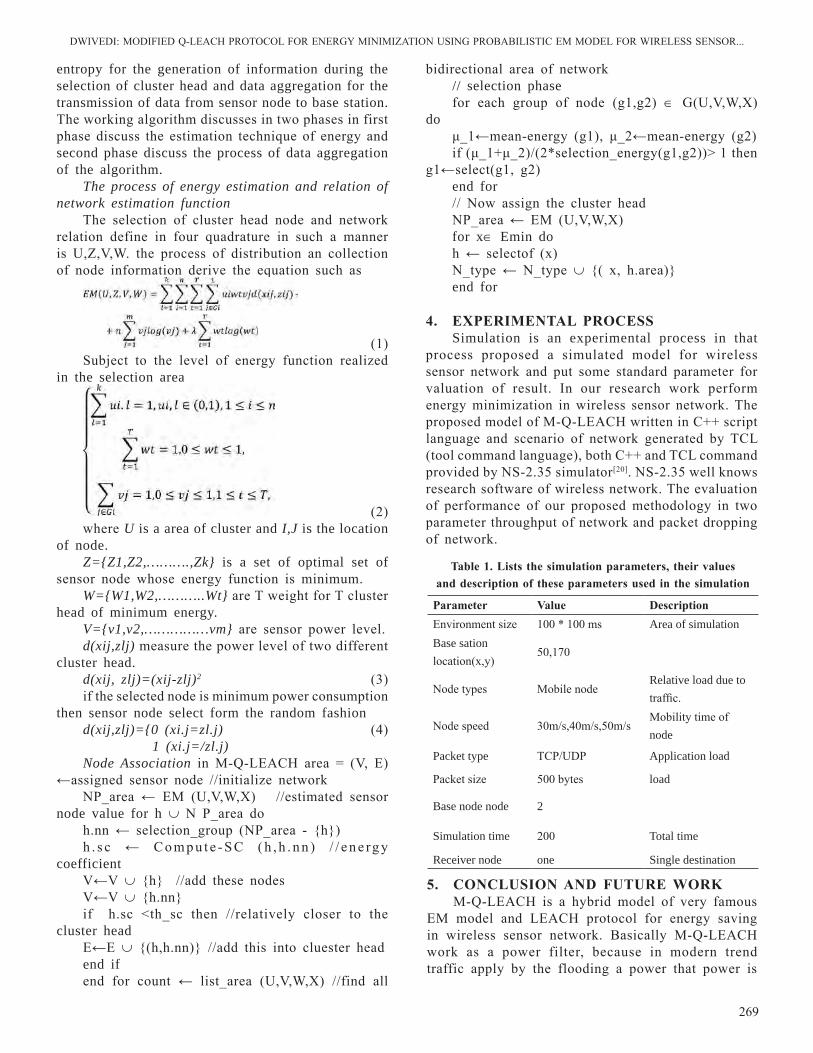
DWIVEDI: MODIFIED q-lEACH PrOTOCOl FOr EnErGY MInIMIZATIOn uSInG PrOBABIlISTIC EM MODEl FOr WIrElESS SEnSOr...
269
entropy for the generation of information during the selection of cluster head and data aggregation for the transmission of data from sensor node to base station. The working algorithm discusses in two phases in first phase discuss the estimation technique of energy and second phase discuss the process of data aggregation of the algorithm.
The process of energy estimation and relation of network estimation function
The selection of cluster head node and network relation define in four quadrature in such a manner is u,Z,V,W. the process of distribution an collection of node information derive the equation such as
(1) Subject to the level of energy function realized
in the selection area
(2)where U is a area of cluster and I,J is the location
of node.Z={Z1,Z2,……….,Zk} is a set of optimal set of
sensor node whose energy function is minimum.W={W1,W2,………..Wt} are T weight for T cluster
head of minimum energy.V={v1,v2,……………vm} are sensor power level.d(xij,zlj) measure the power level of two different
cluster head.d(xij, zlj)=(xij-zlj)2 (3)if the selected node is minimum power consumption
then sensor node select form the random fashiond(xij,zlj)={0 (xi.j=zl.j) (4) 1 (xi.j=/zl.j)Node Association in M-q-lEACH area = (V, E)
←assigned sensor node //initialize networknP_area ← EM (u,V,W,X) //estimated sensor
node value for h ∪ n P_area doh.nn ← selection_group (nP_area - {h})h . s c ← C o m p u t e - S C ( h , h . n n ) / / e n e rg y
coefficientV←V ∪ {h} //add these nodesV←V ∪ {h.nn}if h.sc <th_sc then //relatively closer to the
cluster headE←E ∪ {(h,h.nn)} //add this into cluester headend ifend for count ← list_area (u,V,W,X) //find all
bidirectional area of network// selection phase for each group of node (g1,g2) ∈ G(u,V,W,X)
doμ_1←mean-energy (g1), μ_2←mean-energy (g2)if (μ_1+μ_2)/(2*selection_energy(g1,g2))> 1 then
g1←select(g1, g2)end for// now assign the cluster head nP_area ← EM (u,V,W,X) for x∈ Emin doh ← selectof (x) n_type ← n_type ∪ {( x, h.area)}end for
4. ExPEriMEntAl ProCEssSimulation is an experimental process in that
process proposed a simulated model for wireless sensor network and put some standard parameter for valuation of result. In our research work perform energy minimization in wireless sensor network. The proposed model of M-q-lEACH written in C++ script language and scenario of network generated by TCl (tool command language), both C++ and TCl command provided by nS-2.35 simulator[20]. nS-2.35 well knows research software of wireless network. The evaluation of performance of our proposed methodology in two parameter throughput of network and packet dropping of network.
table 1. lists the simulation parameters, their values and description of these parameters used in the simulation
Parameter Value descriptionEnvironment size 100 * 100 ms Area of simulationBase sation location(x,y)
50,170
node types Mobile nodeRelative load due to traffic.
node speed 30m/s,40m/s,50m/sMobility time of node
Packet type TCP/uDP Application load
Packet size 500 bytes load
Base node node 2
Simulation time 200 Total time
Receiver node one Single destination
5. ConClUsion And FUtUrE worKM-q-lEACH is a hybrid model of very famous
EM model and lEACH protocol for energy saving in wireless sensor network. Basically M-q-lEACH work as a power filter, because in modern trend traffic apply by the flooding a power that power is
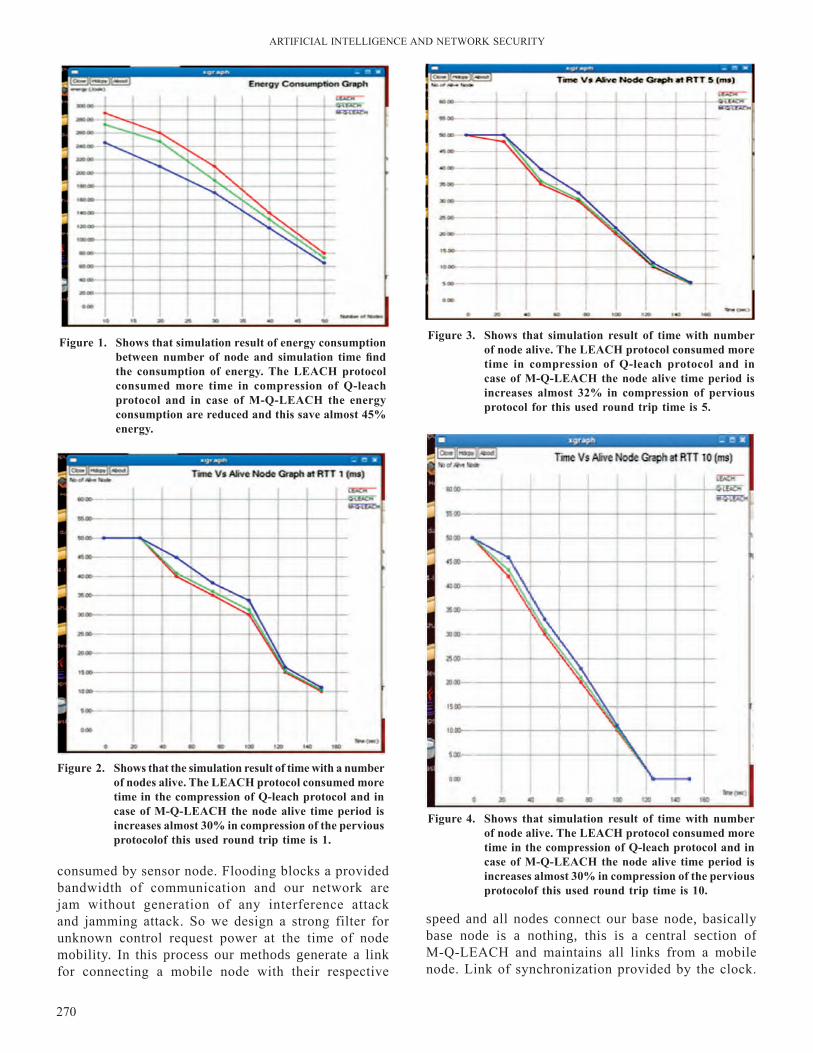
ArTIFICIAl InTEllIGEnCE AnD nETWOrK SECurITY
270
Figure 1. shows that simulation result of energy consumption between number of node and simulation time find the consumption of energy. the lEACh protocol consumed more time in compression of Q-leach protocol and in case of M-Q-lEACh the energy consumption are reduced and this save almost 45% energy.
Figure 3. shows that simulation result of time with number of node alive. the lEACh protocol consumed more time in compression of Q-leach protocol and in case of M-Q-lEACh the node alive time period is increases almost 32% in compression of pervious protocol for this used round trip time is 5.
Figure 4. shows that simulation result of time with number of node alive. the lEACh protocol consumed more time in the compression of Q-leach protocol and in case of M-Q-lEACh the node alive time period is increases almost 30% in compression of the pervious protocolof this used round trip time is 10.
Figure 2. shows that the simulation result of time with a number of nodes alive. the lEACh protocol consumed more time in the compression of Q-leach protocol and in case of M-Q-lEACh the node alive time period is increases almost 30% in compression of the pervious protocolof this used round trip time is 1.
consumed by sensor node. Flooding blocks a provided bandwidth of communication and our network are jam without generation of any interference attack and jamming attack. So we design a strong filter for unknown control request power at the time of node mobility. In this process our methods generate a link for connecting a mobile node with their respective
speed and all nodes connect our base node, basically base node is a nothing, this is a central section of M-q-lEACH and maintains all links from a mobile node. link of synchronization provided by the clock.
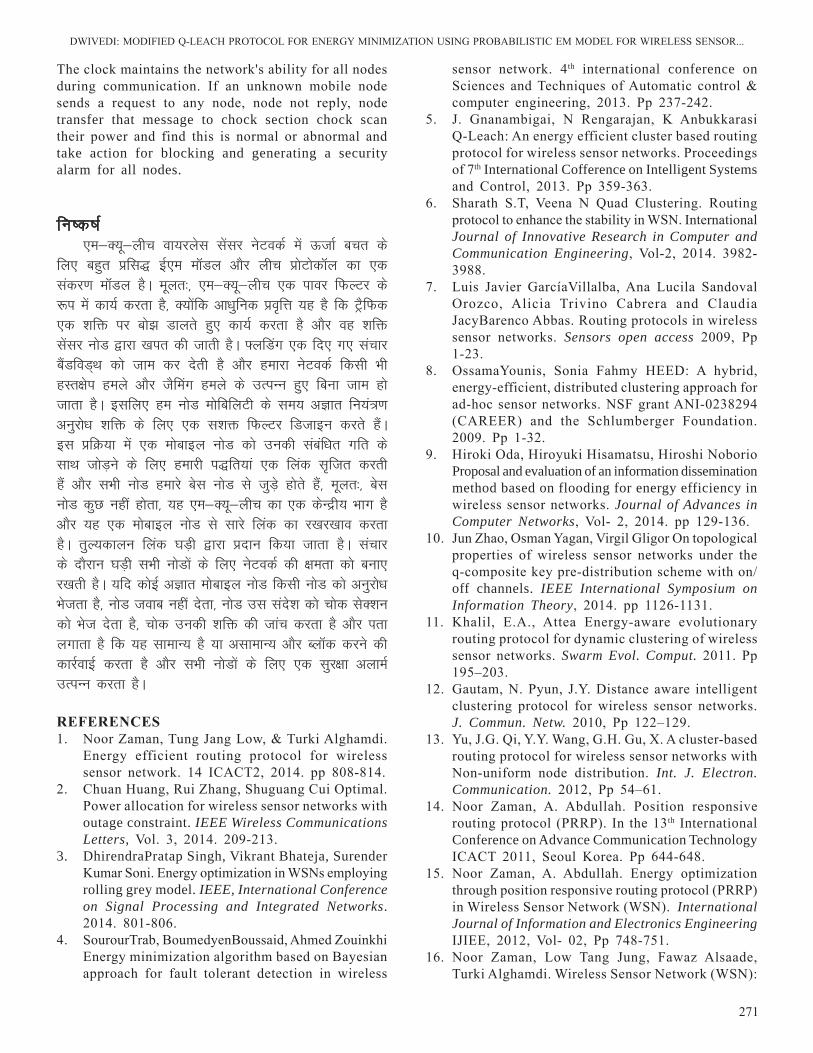
DWIVEDI: MODIFIED q-lEACH PrOTOCOl FOr EnErGY MInIMIZATIOn uSInG PrOBABIlISTIC EM MODEl FOr WIrElESS SEnSOr...
271
The clock maintains the network's ability for all nodes during communication. If an unknown mobile node sends a request to any node, node not reply, node transfer that message to chock section chock scan their power and find this is normal or abnormal and take action for blocking and generating a security alarm for all nodes.
fu’d’k Z,e&D;w&yhp ok;jysl lsalj usVodZ esa ÅtkZ cpr ds
fy, cgqr çfl) bZ,e e‚My vkSj yhp çksVksd‚y dk ,d ladj.k e‚My gSA ewyr%] ,e&D;w&yhp ,d ikoj fQYVj ds :i esa dk;Z djrk gS] D;ksafd vk/kqfud ço`fÙk ;g gS fd VªSfQd ,d 'kfä ij cks> Mkyrs gq, dk;Z djrk gS vkSj og 'kfä lsalj uksM }kjk [kir dh tkrh gSA ¶yfMax ,d fn, x, lapkj cSaMfoM~Fk dks tke dj nsrh gS vkSj gekjk usVodZ fdlh Hkh gLr{ksi geys vkSj tSfeax geys ds mRiUu gq, fcuk tke gks tkrk gSA blfy, ge uksM eksfcfyVh ds le; vKkr fu;a=.k vuqjks/k 'kfä ds fy, ,d l'kä fQYVj fMtkbu djrs gSaA bl çfØ;k esa ,d eksckby uksM dks mudh lacaf/kr xfr ds lkFk tksM+us ds fy, gekjh i)fr;ka ,d fyad l`ftr djrh gSa vkSj lHkh uksM gekjs csl uksM ls tqM+s gksrs gSa] ewyr%] csl uksM dqN ugha gksrk] ;g ,e&D;w&yhp dk ,d dsUæh; Hkkx gS vkSj ;g ,d eksckby uksM ls lkjs fyad dk j[kj[kko djrk gSA rqY;dkyu fyad ?kM+h }kjk çnku fd;k tkrk gSA lapkj ds nkSjku ?kM+h lHkh uksMksa ds fy, usVodZ dh {kerk dks cuk, j[krh gSA ;fn dksbZ vKkr eksckby uksM fdlh uksM dks vuqjks/k Hkstrk gS] uksM tokc ugha nsrk] uksM ml lans'k dks pksd lsD'ku dks Hkst nsrk gS] pksd mudh 'kfä dh tkap djrk gS vkSj irk yxkrk gS fd ;g lkekU; gS ;k vlkekU; vkSj Cy‚d djus dh dkjZokbZ djrk gS vkSj lHkh uksMksa ds fy, ,d lqj{kk vykeZ mRiUu djrk gSA
rEFErEnCEs1. noor Zaman, Tung Jang low, & Turki Alghamdi.
Energy efficient routing protocol for wireless sensor network. 14 ICACT2, 2014. pp 808-814.
2. Chuan Huang, rui Zhang, Shuguang Cui Optimal. Power allocation for wireless sensor networks with outage constraint. IEEE Wireless Communications Letters, Vol. 3, 2014. 209-213.
3. DhirendraPratap Singh, Vikrant Bhateja, Surender Kumar Soni. Energy optimization in WSns employing rolling grey model. IEEE, International Conference on Signal Processing and Integrated Networks. 2014. 801-806.
4. SourourTrab, BoumedyenBoussaid, Ahmed Zouinkhi Energy minimization algorithm based on Bayesian approach for fault tolerant detection in wireless
sensor network. 4th international conference on Sciences and Techniques of Automatic control & computer engineering, 2013. Pp 237-242.
5. J. Gnanambigai, n rengarajan, K Anbukkarasi q-leach: An energy efficient cluster based routing protocol for wireless sensor networks. Proceedings of 7th International Cofference on Intelligent Systems and Control, 2013. Pp 359-363.
6. Sharath S.T, Veena n quad Clustering. routing protocol to enhance the stability in WSn. International Journal of Innovative Research in Computer and Communication Engineering, Vol-2, 2014. 3982-3988.
7. luis Javier GarcíaVillalba, Ana lucila Sandoval Orozco, Alicia Trivino Cabrera and Claudia JacyBarenco Abbas. routing protocols in wireless sensor networks. Sensors open access 2009, Pp 1-23.
8. OssamaYounis, Sonia Fahmy HEED: A hybrid, energy-efficient, distributed clustering approach for ad-hoc sensor networks. nSF grant AnI-0238294 (CArEEr) and the Schlumberger Foundation. 2009. Pp 1-32.
9. Hiroki Oda, Hiroyuki Hisamatsu, Hiroshi noborio Proposal and evaluation of an information dissemination method based on flooding for energy efficiency in wireless sensor networks. Journal of Advances in Computer Networks, Vol- 2, 2014. pp 129-136.
10. Jun Zhao, Osman Yagan, Virgil Gligor On topological properties of wireless sensor networks under the q-composite key pre-distribution scheme with on/off channels. IEEE International Symposium on Information Theory, 2014. pp 1126-1131.
11. Khalil, E.A., Attea Energy-aware evolutionary routing protocol for dynamic clustering of wireless sensor networks. Swarm Evol. Comput. 2011. Pp 195–203.
12. Gautam, n. Pyun, J.Y. Distance aware intelligent clustering protocol for wireless sensor networks. J. Commun. Netw. 2010, Pp 122–129.
13. Yu, J.G. qi, Y.Y. Wang, G.H. Gu, X. A cluster-based routing protocol for wireless sensor networks with non-uniform node distribution. Int. J. Electron. Communication. 2012, Pp 54–61.
14. noor Zaman, A. Abdullah. Position responsive routing protocol (PrrP). In the 13th International Conference on Advance Communication Technology ICACT 2011, Seoul Korea. Pp 644-648.
15. noor Zaman, A. Abdullah. Energy optimization through position responsive routing protocol (PrrP) in Wireless Sensor network (WSn). International Journal of Information and Electronics Engineering IJIEE, 2012, Vol- 02, Pp 748-751.
16. noor Zaman, low Tang Jung, Fawaz Alsaade, Turki Alghamdi. Wireless Sensor network (WSn):

ArTIFICIAl InTEllIGEnCE AnD nETWOrK SECurITY
272
routing security, reliability and energy efficiency. Journal of Applied Science, Science alert, 2012. pp 593-597.
17. noor Zaman, A. Abdullah. Different techniques towards enhancing wireless sensor network (WSn) routing energy efficiency and quality of service (qoS). World Applied Science Journal, Vol. 13, 2011, Pp 798-805.
18. noor Zaman and Abdullah, A. low Tang Jung Optimization of energy usage in wireless network using Position responsive routing Protocol. IEEE Symposium on Computers & Informatics ISCI
2011, pp 51-55. 19. Ponnusamy, V., Abdullah, A., Downe, A. G. Energy
Efficient routing protocols in wireless sensor networks. A Survey. Wireless Sensor networks and Energy Efficiency: Protocols, Routing, and Management, 2011. 237-261.
20. nurhayati, Sung Hee Choi, and Kyung Oh lee. A cluster based energy efficient location routing protocol in wireless sensor network. International Journal of Computers and Communications, Vol. 5. 2011. 67-74.
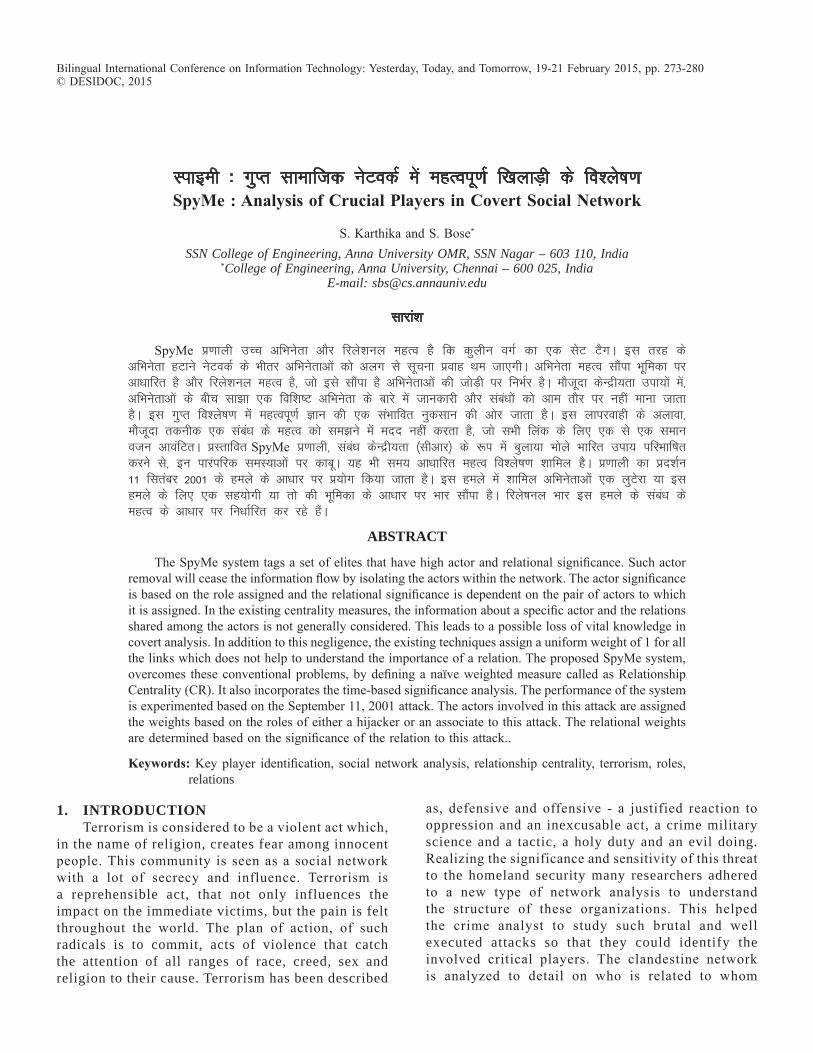
Likbeh % xqIr lkekftd usVodZ esa egRoiw.kZ f[kykM+h ds fo”ys’k.k spyMe : Analysis of Crucial Players in Covert social network
S. Karthika and S. Bose*
SSN College of Engineering, Anna University OMR, SSN Nagar – 603 110, India *College of Engineering, Anna University, Chennai – 600 025, India
E-mail: [email protected]
lkjka”k
SpyMe ç.kkyh mPp vfHkusrk vkSj fjys”kuy egRo gS fd dqyhu oxZ dk ,d lsV VSxA bl rjg ds vfHkusrk gVkus usVodZ ds Hkhrj vfHkusrkvksa dks vyx ls lwpuk çokg Fke tk,xhA vfHkusrk egRo lkSaik Hkwfedk ij vk/kkfjr gS vkSj fjys”kuy egRo gS] tks bls lkSaik gS vfHkusrkvksa dh tksM+h ij fuHkZj gSA ekStwnk dsUæh;rk mik;ksa esa] vfHkusrkvksa ds chp lk>k ,d fof”k’V vfHkusrk ds ckjs esa tkudkjh vkSj laca/kksa dks vke rkSj ij ugha ekuk tkrk gSA bl xqIr fo”ys’k.k esa egRoiw.kZ Kku dh ,d laHkkfor uqdlku dh vksj tkrk gSA bl ykijokgh ds vykok] ekStwnk rduhd ,d laca/k ds egRo dks le>us esa enn ugha djrk gS] tks lHkh fyad ds fy, ,d ls ,d leku otu vkoafVrA çLrkfor SpyMe ç.kkyh] laca/k dsUæh;rk ¼lhvkj½ ds :i esa cqyk;k Hkksys Hkkfjr mik; ifjHkkf’kr djus ls] bu ikjaifjd leL;kvksa ij dkcwA ;g Hkh le; vk/kkfjr egRo fo”ys’k.k “kkfey gSA ç.kkyh dk çn”kZu 11 flracj 2001 ds geys ds vk/kkj ij ç;ksx fd;k tkrk gSA bl geys esa “kkfey vfHkusrkvksa ,d yqVsjk ;k bl geys ds fy, ,d lg;ksxh ;k rks dh Hkwfedk ds vk/kkj ij Hkkj lkSaik gSA fjys’kuy Hkkj bl geys ds laca/k ds egRo ds vk/kkj ij fu/kkZfjr dj jgs gSaA
AbstrAct
The SpyMe system tags a set of elites that have high actor and relational significance. Such actor removal will cease the information flow by isolating the actors within the network. The actor significance is based on the role assigned and the relational significance is dependent on the pair of actors to which it is assigned. In the existing centrality measures, the information about a specific actor and the relations shared among the actors is not generally considered. This leads to a possible loss of vital knowledge in covert analysis. In addition to this negligence, the existing techniques assign a uniform weight of 1 for all the links which does not help to understand the importance of a relation. The proposed SpyMe system, overcomes these conventional problems, by defining a naïve weighted measure called as relationship Centrality (Cr). It also incorporates the time-based significance analysis. The performance of the system is experimented based on the September 11, 2001 attack. The actors involved in this attack are assigned the weights based on the roles of either a hijacker or an associate to this attack. The relational weights are determined based on the significance of the relation to this attack..
Keywords: Key player identification, social network analysis, relationship centrality, terrorism, roles, relations
Bilingual International Conference on Information Technology: Yesterday, Today, and Tomorrow, 19-21 February 2015, pp. 273-280© DESIDOC, 2015
1. IntroductIonTerrorism is considered to be a violent act which,
in the name of religion, creates fear among innocent people. This community is seen as a social network with a lot of secrecy and influence. Terrorism is a reprehensible act, that not only influences the impact on the immediate victims, but the pain is felt throughout the world. The plan of action, of such radicals is to commit, acts of violence that catch the attention of all ranges of race, creed, sex and religion to their cause. Terrorism has been described
as, defensive and offensive - a justified reaction to oppression and an inexcusable act, a crime military science and a tactic, a holy duty and an evil doing. realizing the significance and sensitivity of this threat to the homeland security many researchers adhered to a new type of network analysis to understand the structure of these organizations. This helped the crime analyst to study such brutal and well executed attacks so that they could identify the involved critical players. The clandestine network is analyzed to detail on who is related to whom
ArTIFICIAl InTEllIGEnCE AnD nETWOrK SECurITY
274
based on what relation, and it is called as social network analysis.
2. rElAtEd worKsAny organizational structure needs a factor of
commitment to achieve the desired objective. These levels of commitment span through many roles assigned to the entities namely, the hardcore leaders, active members, active supporters and passive supporters1,2. The entities are assigned unique roles that they perform to accomplish an operation. The leads in the top of a pyramid take maximum responsibilities to successfully complete a mission3. These actors plan and execute attacks based on various goals and objectives according to the policies of the organization4. The crime network analysis tells us about the structure of the network-based upon the various relations labeled on the links5. Knowing actors and their roles, can help to control the information flows within the network. This knowledge about each actor is vital in some application domains6. Pivot isolator may help disrupt terrorist activities. But it is not necessary that any player who breaks a social connection is pivot isolator. Although several techniques for identifying key separators have been proposed7, most of these do not always retain the intended meaning that emphasizes the ability to break the network into fragments as defined.
The measurement of relationships in a terror network requires a supple methodology able to discriminate the influence between father and son, and the influence amongst a group of friends8. unfortunately, almost all of our current mathematical tools are based on data from rigid constructs. For modeling purposes9 highlights two main problems for rigid constructs. The proposed work shores up the conclusion made by10,14 that the complexity in collecting data, the means of collecting data, and the type or nature of the data itself are going to play a role in making the data imprecise. This research focuses on the task of modelling terms such as relationship, influence, trust, and belief as there is a clear need for a more flexible construct.
The objective of this research work is to inculcate the significance of an event occurrence and the time order in which the incidents have taken place. The significance can be studied from various frequently occurring events, and with this, the structural equivalence property is understood. The actors and their relationships are represented using multi-rlational network (Mrn). The weighted actor Mrn analysis, computes actor weight by considering the roles assigned to each actor in an attack. The link weights tend to dynamically change according to the actor weights. The relational weight
based centrality does link analysis using the timely occurrence and event significance. This contributes in reducing the space dimension of the graph and includes all possible relations between the actors.
The paper explains the proposed framework of SpyMe- A tagger of pivot isolators.
3. sPYME- A tAGGEr oF PiVot isolAtorsThe proposed SpyMe system recognizes the
pivot isolators which are a set of actors, if removed, could break and paralyze the network. It identifies a set of pivot isolators to enhance the inactiveness of the network. The SpyMe system encompasses two sub-modules, namely, role-based actor weight computation, and relational weight computation. The actor-based weight analysis compares the distance oriented centrality metric with the role-oriented weight computation. The relational weight computation depends on the frequency of a relation occurring in a time period and actor weight assigned. The resulting cutset of Cr ranked top n actors are named pivot isolators-actors of high significance. The existing measures to compute this significance is based only on the distance between different actors which are discussed.
3.1 role-based Actor weight ComputationThe SnA measures individual importance within
the network using graph theoretic techniques that have been discussed11. One of the relevant social networks measures applied in many ways to find the KPs in the network called the centrality measure. Several centrality measures are described to determine the importance of an actor12,13. The degree centrality, betweenness centrality, and closeness centrality are the most widely used measures in SnA for analyzing actor centralities. All the centralities are computed for an unweighted graph and using only the distances among the actors i.e. the path length. Even if weighted graph is considered the edges are assigned with a uniform value of 1 to show the presence of a link between a pair of actors. It is inferred that the importance of the actor and relations labeled in the links is not considered for centrality analysis. The definition is proposed7 for the Key Player Problem (KPP-Pos/ KPP-neg) measures have not considered the relationship or actor weights. It is needed to assume that both are unity as it normalizes the measure range between[0, 1]. The Eqn. (1) presents the distance measure Dr used by6 for identifying the KP.
j K jR
1d
Dn
=
∑ (1)
where dKj is the minimum distance from all KPs
KArTHIKA: SPYME : AnAlYSIS OF CruCIAl PlAYErS In COVErT SOCIAl nETWOrK
275
to actor j. This equation assumes that a KP is at a distance of 1 from itself, dii = 1. This violates the graph theory concept which supports that a vertex is at a distance 0 from itself. Hence, instead of n, the normalization is done using n-k, where k is the size of the KP set with a reasonable assumption, that n > k and leaves dii = 0. Hence Equation (1) is normalized as Eqn (2).
j K jR
1d
Dn k
=−
∑
(2)To analyze the KPP problem using the weighted
graph, two attributes are considered to be important. The communication gains significance based on the actors among whom the interaction is taking place, and the relationship they share among them. When weights are assigned to the actors and relations involved in the communication to determine the significance, it is called as weighted KPP (WKPP). Hence, the WKPP analysis assigns weights for relations and actors for a corresponding interaction [7] assigned relationship weights to the closest adjacent actors as 1 and for the farthest is any real, positive number greater than 1. In the case of actor weights, it is restricted to the range [1, ∞]. Hence, the weighted distance measure is presented as shown in Eqn. (3).
R j Kjj V K
WD h d∈ −
= ∑ (3)
The normalized weighted distance measure WDR’ is shown in Eqn. (4).for ],1[],,1[ ∞∈∞∈= iji dh (4)where hj is the actor weight and dKj is the minimum distance from all KPs to the actor j.
It is inferred that the weights assigned for actors and relations varies, but it is again with respect to the distance and does not consider the attributes of the actor or the semantics of the relationship. This work, contributes in taking the weighted distance measure to the next level, where the additional features related to the network structure is also studied along with the distance measure to resolve the KPP. This paper contributes by introducing the new centrality that includes the social distance measure of actors based on the timing factor and the participation attributes. This centrality varies the participation measure from binary to different levels depending on the significance of involvement.
The actor weight measure determines the significance of how difficult it might be to replace that individual if they were removed from the network. The actors are assigned a weight where it is inversely proportional to the number of individuals in the organization with the same role. For example, there are two managers
in the network, so they are both assigned a weight of 0.5, and similarly, if there are 10 workers in the network with the same role, a weight of 0.1 is assigned for all workers. An actor is assigned a weight of 0 for unknown roles. The actor weights computed using distance-oriented measures and the role-based approach are analyzed. In the distance measure, all the actors which are closer and directly connected have higher values than the actors which are located at distant and are indirectly connected. But in the role-based actor analysis, the property of each actor is majorly considered rather than the distance within the actors, and hence, a distant actor with significant role is precisely identified in this measure.
3.2 relational weight Computation
The relational weight computation is performed as a two-step process, namely, relational analysis and weight computation. The relational analysis computes, relational probability, PRwt and weight computation determines the Rwt based on which Cr is computed.
3.2.1 Relational AnalysisIn this analysis, the significance of each relation
is studied. Since the network is organized as an Mrn, there exist multiple relational links between the actors. These links are used to compute the relational probability, through the following steps:1. Generate all relational links existing among the
two actors2. To identify the s ignif icant occurrence of
relation a. Determine the time period of relational
occurrence b. Find the frequency of the same relational
occurrence c. Identify contextually significant relational
occurrence3. Compute relational probability PRwt as given in
Eqn (5)Prwt = 1+ (OccSig/ OccRel) (5)
where OccSig is the significant number of relational occurrences and OccRel is the total number of relational occurrences. Here the addition of 1 to the proportion shows the presence of information exchange between the actors.
3.2.2 Weight ComputationThe significance of the actor analyzed using its
roles is included in the relational weight analysis. The Rwt value is higher or lower depending on the significance of the actors in the communication. Based on these weights the Rwt computation is done
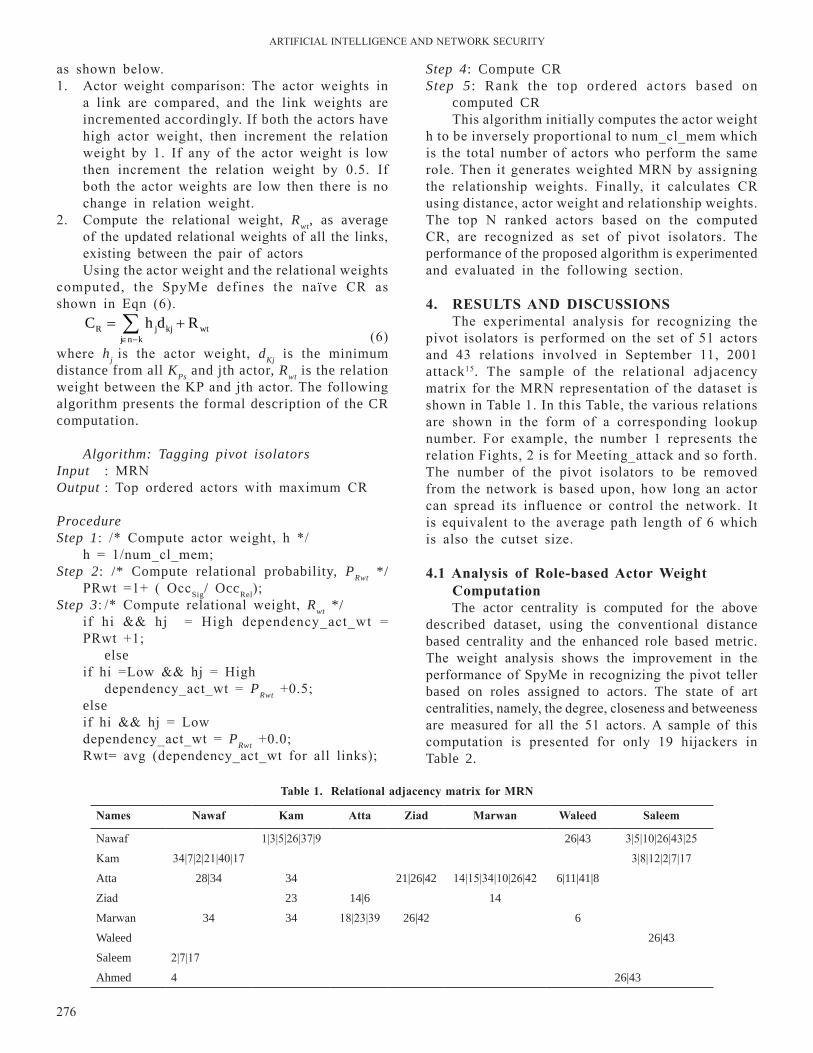
ArTIFICIAl InTEllIGEnCE AnD nETWOrK SECurITY
276
as shown below.1. Actor weight comparison: The actor weights in
a link are compared, and the link weights are incremented accordingly. If both the actors have high actor weight, then increment the relation weight by 1. If any of the actor weight is low then increment the relation weight by 0.5. If both the actor weights are low then there is no change in relation weight.
2. Compute the relational weight, Rwt, as average of the updated relational weights of all the links, existing between the pair of actorsusing the actor weight and the relational weights
computed, the SpyMe defines the naïve Cr as shown in Eqn (6).
R j kj wtj n k
C h d R∈ −
= +∑ (6)where hj is the actor weight, dKj is the minimum distance from all KPs and jth actor, Rwt is the relation weight between the KP and jth actor. The following algorithm presents the formal description of the CR computation.
Algorithm: Tagging pivot isolatorsInput : Mrn Output : Top ordered actors with maximum Cr
ProcedureStep 1: /* Compute actor weight, h */ h = 1/num_cl_mem;Step 2: /* Compute relational probability, PRwt */
Prwt =1+ ( OccSig/ OccRel);Step 3: /* Compute relational weight, Rwt */
if hi && hj = High dependency_act_wt = Prwt +1; elseif hi =low && hj = High dependency_act_wt = PRwt +0.5;else if hi && hj = low dependency_act_wt = PRwt +0.0;rwt= avg (dependency_act_wt for all links);
Step 4: Compute CR Step 5 : Rank the top ordered actors based on
computed CR This algorithm initially computes the actor weight
h to be inversely proportional to num_cl_mem which is the total number of actors who perform the same role. Then it generates weighted Mrn by assigning the relationship weights. Finally, it calculates Cr using distance, actor weight and relationship weights. The top n ranked actors based on the computed Cr, are recognized as set of pivot isolators. The performance of the proposed algorithm is experimented and evaluated in the following section.
4. rEsUlts And disCUssionsThe experimental analysis for recognizing the
pivot isolators is performed on the set of 51 actors and 43 relations involved in September 11, 2001 attack15. The sample of the relational adjacency matrix for the Mrn representation of the dataset is shown in Table 1. In this Table, the various relations are shown in the form of a corresponding lookup number. For example, the number 1 represents the relation Fights, 2 is for Meeting_attack and so forth. The number of the pivot isolators to be removed from the network is based upon, how long an actor can spread its influence or control the network. It is equivalent to the average path length of 6 which is also the cutset size.
4.1 Analysis of role-based Actor weight Computation The actor centrality is computed for the above
described dataset, using the conventional distance based centrality and the enhanced role based metric. The weight analysis shows the improvement in the performance of SpyMe in recognizing the pivot teller based on roles assigned to actors. The state of art centralities, namely, the degree, closeness and betweeness are measured for all the 51 actors. A sample of this computation is presented for only 19 hijackers in Table 2.
table 1. relational adjacency matrix for Mrn
names nawaf Kam Atta ziad Marwan waleed saleem
nawaf 1|3|5|26|37|9 26|43 3|5|10|26|43|25
Kam 34|7|2|21|40|17 3|8|12|2|7|17
Atta 28|34 34 21|26|42 14|15|34|10|26|42 6|11|41|8
Ziad 23 14|6 14
Marwan 34 34 18|23|39 26|42 6
Waleed 26|43
Saleem 2|7|17
Ahmed 4 26|43
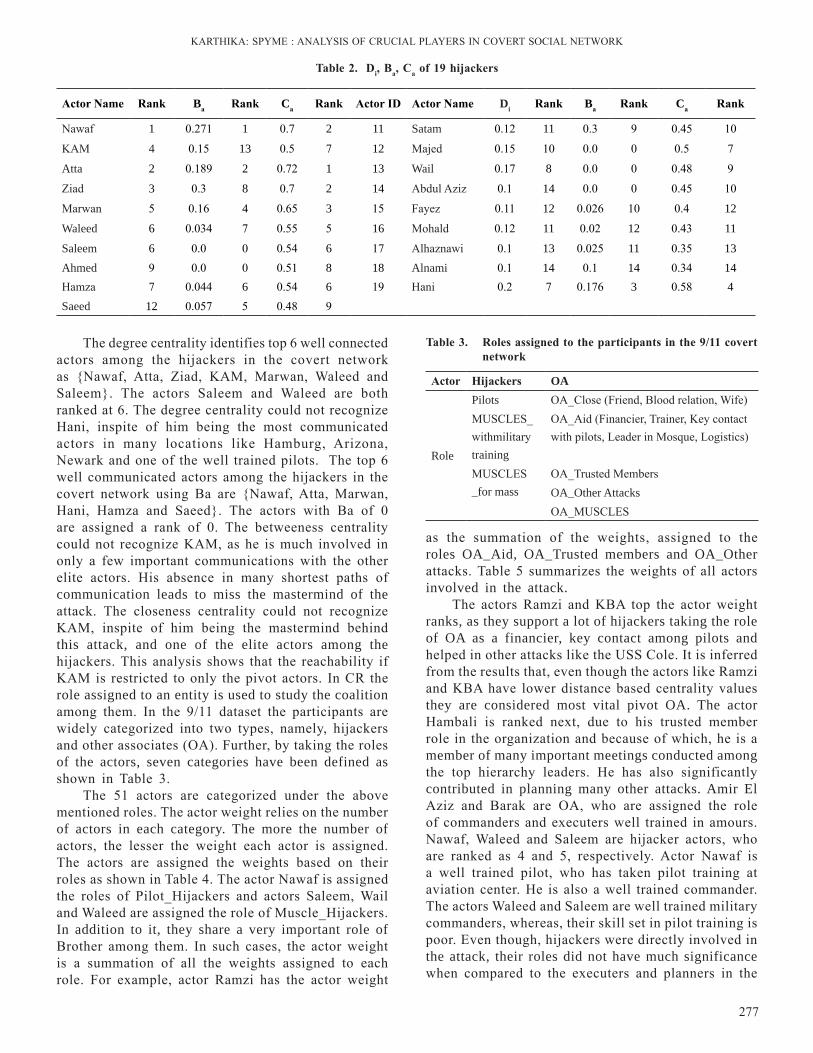
KArTHIKA: SPYME : AnAlYSIS OF CruCIAl PlAYErS In COVErT SOCIAl nETWOrK
277
The degree centrality identifies top 6 well connected actors among the hijackers in the covert network as {nawaf, Atta, Ziad, KAM, Marwan, Waleed and Saleem}. The actors Saleem and Waleed are both ranked at 6. The degree centrality could not recognize Hani, inspite of him being the most communicated actors in many locations like Hamburg, Arizona, newark and one of the well trained pilots. The top 6 well communicated actors among the hijackers in the covert network using Ba are {nawaf, Atta, Marwan, Hani, Hamza and Saeed}. The actors with Ba of 0 are assigned a rank of 0. The betweeness centrality could not recognize KAM, as he is much involved in only a few important communications with the other elite actors. His absence in many shortest paths of communication leads to miss the mastermind of the attack. The closeness centrality could not recognize KAM, inspite of him being the mastermind behind this attack, and one of the elite actors among the hijackers. This analysis shows that the reachability if KAM is restricted to only the pivot actors. In Cr the role assigned to an entity is used to study the coalition among them. In the 9/11 dataset the participants are widely categorized into two types, namely, hijackers and other associates (OA). Further, by taking the roles of the actors, seven categories have been defined as shown in Table 3.
The 51 actors are categorized under the above mentioned roles. The actor weight relies on the number of actors in each category. The more the number of actors, the lesser the weight each actor is assigned. The actors are assigned the weights based on their roles as shown in Table 4. The actor nawaf is assigned the roles of Pilot_Hijackers and actors Saleem, Wail and Waleed are assigned the role of Muscle_Hijackers. In addition to it, they share a very important role of Brother among them. In such cases, the actor weight is a summation of all the weights assigned to each role. For example, actor ramzi has the actor weight
table 2. di, ba, Ca of 19 hijackers
Actor name rank ba rank ca rank Actor id Actor name di rank ba rank ca rank
nawaf 1 0.271 1 0.7 2 11 Satam 0.12 11 0.3 9 0.45 10
KAM 4 0.15 13 0.5 7 12 Majed 0.15 10 0.0 0 0.5 7
Atta 2 0.189 2 0.72 1 13 Wail 0.17 8 0.0 0 0.48 9
Ziad 3 0.3 8 0.7 2 14 Abdul Aziz 0.1 14 0.0 0 0.45 10
Marwan 5 0.16 4 0.65 3 15 Fayez 0.11 12 0.026 10 0.4 12
Waleed 6 0.034 7 0.55 5 16 Mohald 0.12 11 0.02 12 0.43 11
Saleem 6 0.0 0 0.54 6 17 Alhaznawi 0.1 13 0.025 11 0.35 13Ahmed 9 0.0 0 0.51 8 18 Alnami 0.1 14 0.1 14 0.34 14Hamza 7 0.044 6 0.54 6 19 Hani 0.2 7 0.176 3 0.58 4Saeed 12 0.057 5 0.48 9
as the summation of the weights, assigned to the roles OA_Aid, OA_Trusted members and OA_Other attacks. Table 5 summarizes the weights of all actors involved in the attack.
The actors ramzi and KBA top the actor weight ranks, as they support a lot of hijackers taking the role of OA as a financier, key contact among pilots and helped in other attacks like the uSS Cole. It is inferred from the results that, even though the actors like ramzi and KBA have lower distance based centrality values they are considered most vital pivot OA. The actor Hambali is ranked next, due to his trusted member role in the organization and because of which, he is a member of many important meetings conducted among the top hierarchy leaders. He has also significantly contributed in planning many other attacks. Amir El Aziz and Barak are OA, who are assigned the role of commanders and executers well trained in amours. nawaf, Waleed and Saleem are hijacker actors, who are ranked as 4 and 5, respectively. Actor nawaf is a well trained pilot, who has taken pilot training at aviation center. He is also a well trained commander. The actors Waleed and Saleem are well trained military commanders, whereas, their skill set in pilot training is poor. Even though, hijackers were directly involved in the attack, their roles did not have much significance when compared to the executers and planners in the
Actor hijackers oA
Role
Pilots OA_Close (Friend, Blood relation, Wife)MuSClES_withmilitary training
OA_Aid (Financier, Trainer, Key contact with pilots, leader in Mosque, logistics)
MuSClES _for mass
OA_Trusted MembersOA_Other AttacksOA_MuSClES
table 3. roles assigned to the participants in the 9/11 covert network
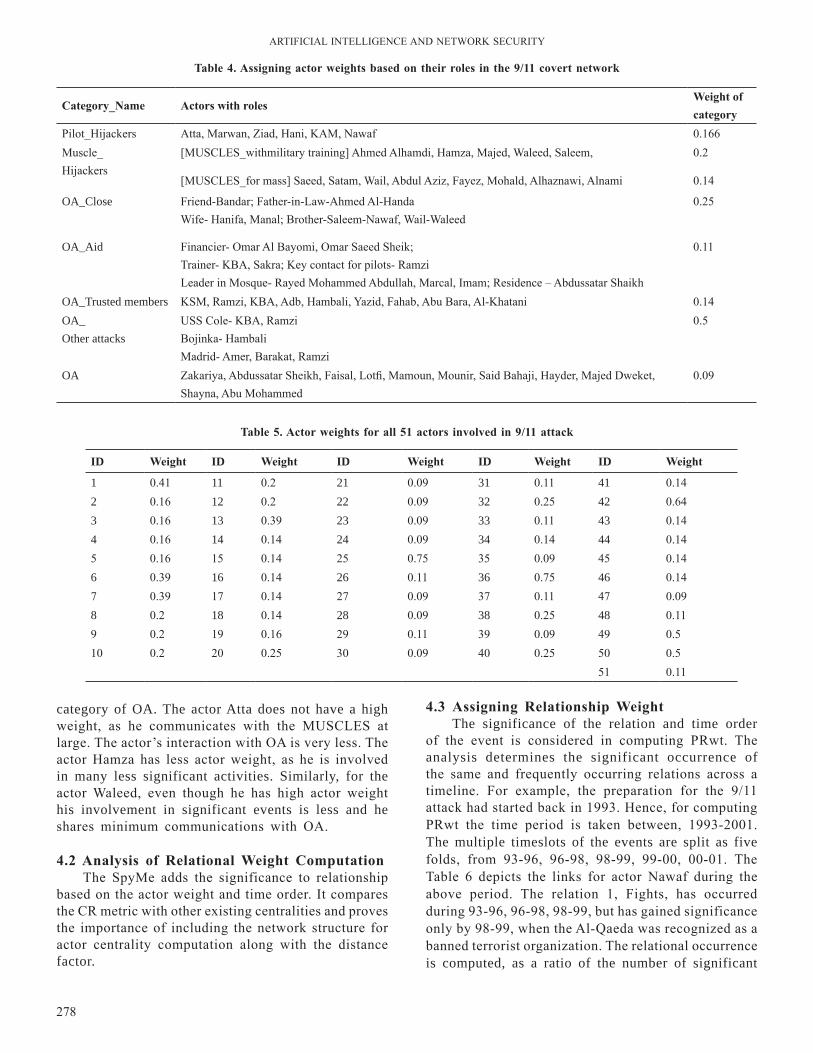
ArTIFICIAl InTEllIGEnCE AnD nETWOrK SECurITY
278
Category_name Actors with rolesweight of category
Pilot_Hijackers Atta, Marwan, Ziad, Hani, KAM, nawaf 0.166Muscle_Hijackers
[MuSClES_withmilitary training] Ahmed Alhamdi, Hamza, Majed, Waleed, Saleem, 0.2
[MuSClES_for mass] Saeed, Satam, Wail, Abdul Aziz, Fayez, Mohald, Alhaznawi, Alnami 0.14
OA_Close Friend-Bandar; Father-in-law-Ahmed Al-HandaWife- Hanifa, Manal; Brother-Saleem-nawaf, Wail-Waleed
0.25
OA_Aid Financier- Omar Al Bayomi, Omar Saeed Sheik;Trainer- KBA, Sakra; Key contact for pilots- ramzileader in Mosque- rayed Mohammed Abdullah, Marcal, Imam; residence – Abdussatar Shaikh
0.11
OA_Trusted members KSM, ramzi, KBA, Adb, Hambali, Yazid, Fahab, Abu Bara, Al-Khatani 0.14OA_Other attacks
uSS Cole- KBA, ramziBojinka- HambaliMadrid- Amer, Barakat, ramzi
0.5
OA Zakariya, Abdussatar Sheikh, Faisal, lotfi, Mamoun, Mounir, Said Bahaji, Hayder, Majed Dweket, Shayna, Abu Mohammed
0.09
table 4. Assigning actor weights based on their roles in the 9/11 covert network
table 5. Actor weights for all 51 actors involved in 9/11 attack
Id weight Id weight Id weight Id weight Id weight
1 0.41 11 0.2 21 0.09 31 0.11 41 0.142 0.16 12 0.2 22 0.09 32 0.25 42 0.643 0.16 13 0.39 23 0.09 33 0.11 43 0.144 0.16 14 0.14 24 0.09 34 0.14 44 0.145 0.16 15 0.14 25 0.75 35 0.09 45 0.146 0.39 16 0.14 26 0.11 36 0.75 46 0.147 0.39 17 0.14 27 0.09 37 0.11 47 0.098 0.2 18 0.14 28 0.09 38 0.25 48 0.119 0.2 19 0.16 29 0.11 39 0.09 49 0.510 0.2 20 0.25 30 0.09 40 0.25 50 0.5
51 0.11
category of OA. The actor Atta does not have a high weight, as he communicates with the MuSClES at large. The actor’s interaction with OA is very less. The actor Hamza has less actor weight, as he is involved in many less significant activities. Similarly, for the actor Waleed, even though he has high actor weight his involvement in significant events is less and he shares minimum communications with OA.
4.2 Analysis of relational weight ComputationThe SpyMe adds the significance to relationship
based on the actor weight and time order. It compares the Cr metric with other existing centralities and proves the importance of including the network structure for actor centrality computation along with the distance factor.
4.3 Assigning relationship weight The significance of the relation and time order
of the event is considered in computing Prwt. The analysis determines the significant occurrence of the same and frequently occurring relations across a timeline. For example, the preparation for the 9/11 attack had started back in 1993. Hence, for computing Prwt the time period is taken between, 1993-2001. The multiple timeslots of the events are split as five folds, from 93-96, 96-98, 98-99, 99-00, 00-01. The Table 6 depicts the links for actor nawaf during the above period. The relation 1, Fights, has occurred during 93-96, 96-98, 98-99, but has gained significance only by 98-99, when the Al-qaeda was recognized as a banned terrorist organization. The relational occurrence is computed, as a ratio of the number of significant

KArTHIKA: SPYME : AnAlYSIS OF CruCIAl PlAYErS In COVErT SOCIAl nETWOrK
279
occurrences to the total number of occurrences. The relationship weight has a default value of 1 and is incremented based on the significance.
For example, in Table 6, indicates the occurrence of relation and /* indicates the significant occurrence of relation. The link 1-6 existing with the relation 26 occurs only once and is also not significant. In such a case, the Prwt value is just the default weight of 1. Similarly, for the link 1-7, the relation 26 has occurred twice and one of them is significant. The Prwt value for the link 1-7 is a summation of default weight 1 and 1.5 which is the probability ratio (1/2).
4.4 Analysis of Cr measure The multiple relational weights on the link are
computed, and reduced to a simple graph averaging the weights. Thus rwt reduces the Mrn into a simple weighted graph. This reduces the space dimension of the graph, inspite of including all the existing relations among the actors. The Cr of the 19 hijackers are computed and ranked in the following Table 7.
The top 6 well communicated actors among the
table 6. sample of relationship analysis for actor nawaf
Actor_link relation
time Period (Year)93-96 96-98 98-99 99-00 00-01
1-2
1 / / /*
3 /*
5 /*
26 /*
37 / / /*
9 /
1-626 /
43 /*
1-7
3 /
5 /
10 /
26 / /*
43 /*
1-826 /*
43 /*
1-926 /*
43 /*
1-10 4 /*
1-11
4 /*
26 /*
43 /*
table 7. relationship centrality computation
Actor id cr rank Actor id cr rank1 0.27 2 10 0.1 92 0.38 1 11 0.1 93 0.22 5 12 0.1 94 0.25 3 13 0.15 85 0.23 4 14 0.1 96 0.19 6 15 0.1 97 0.1 9 16 0.16 78 0.1 9 17 0.16 79 0.16 7 18 0.16 7
19 0.19 6
hijackers in the covert network are {nawaf, KAM, Atta, Ziad, Marwan, Hani and Waleed}. The Cr is successful in recognizing all the major pivot actors, who also have the various important features of distance oriented centrality measures. This set of actors is easily reachable and are included in many shortest paths among different actors. The centralities are computed for all 51 actors and the top 6 pivot isolators have been tagged. Table 8 displays their ranking in the different centrality metrics.
table 8. ranking of Pivot isolators in different centrality measures
Pivot isolatorsCentrality Measures
(ranking among all 51 actors)
cr di ca ba
ramzi 1 8 15 14KBA 2 49 37 22KAM 3 10 19 17nawaf 4 4 2 2Atta 5 1 1 1Hani 6 3 3 3
The actors like Hambali, Amir El Aziz and others even though, had top ranks in the actor weight they did not share significant relations with many other hijackers or OA. The actors KAM, Atta and Hani, had a common role of hijackers and had many important contacts with the OA like ramzi, Omar-Al-Bayoumi, Yazid and Fahab. The tie strength of these actors is also improved, when they shared strong relations like Caller of Al-qaeda Summit, Attendee of Summit, Member of uSS Cole Attack, Advanced Flight Class and Brother Of with other actors.
5. ConClUsionThis paper has tagged the pivot isolators, by the
proposed SpyMe system, as it enumerates on how the various interpersonal relations, among the actors could be used to study the nature of covert organizations. It

ArTIFICIAl InTEllIGEnCE AnD nETWOrK SECurITY
280
extends the problem of KPP to WKPP, by including the actor and relationship weights. The proposed methodology, overcomes the state-of-art distance metric issues. The actor significance is analyzed by the role assigned to them, and the relational significance is based on the time order and the repeatability of its occurrence. The efficiency of the newly defined relationship centrality is compared with the existing centralities. The top n ranked actors could be further used to perform efficient fragmentation of the covert organization.
fu’d’k Z;g vfHkusrkvksa ds chp fofHkUu ikjLifjd laca/kksa] xqIr
laxBuksa dh ç—fr dk v/;;u djus ds fy, bLrseky fd;k tk ldrk gS ij fo”ys’k.k ds :i esa bl i= esa çLrkfor SpyMe ç.kkyh }kjk] /kqjh vkblksysVjksa esa fpfàr fd;k x;k gSA ;g vfHkusrk vkSj fj’rs Hkkj dks “kkfey djds] WKPP dks dsihih dh leL;k QSyh gqbZ gSA çLrkfor dk;Zç.kkyh] jkT; ds dyk nwjh ehfVªd eqíksa ij dkcwA vfHkusrk egRo mUgsa lkSaik Hkwfedk ls fo”ys’k.k fd;k gS] vkSj laca/kijd egRo le; vkns”k vkSj bldh ?kVuk ds repeatability ij vk/kkfjr gSA uo ifjHkkf’kr fj’rk dsUæh;rk dh n{krk ekStwnk centralities ds lkFk rqyuk esa gSA “kh’kZ ,u LFkku ij jgha vfHkusrkvksa vkxs xqIr laxBu ds dq”ky fo[kaMu çn”kZu djus ds fy, bLrseky fd;k tk ldrk gSA
rEFErEnCEs1. Bogardus, ES, Measuring social distance. Journal
of Applied Sociology, 1925, 9(2), 299-308.2. Parrillo, V. n., & Donoghue, C, updating the
Bogardus social distance studies: a new national survey. The Social Science Journal, 2005, 42(2), 257-271.
3. Burt, r.S., & Schøtt, T. relation contents in multiple networks. Social Science Research, 1985,
14(4), 287-308.4. Brass, D. J., A social network perspective on human
resources management. Research in personnel and human resources management, 1995, 13(1), 39-79.
5. Krebs, VE, Mapping networks of terrorist cells. Connections, 2002, 24(3), pp. 43-52.
6. Borgatti, SP, Centrality and network flow. Social networks, 2005, 27(1), 55-71.
7. Borgatti, SP, Identifying sets of key players in a social network. Computational & Mathematical Organization Theory, 2006, 12(1), 21-34.
8. Granovetter, MS. The strength of weak ties, American journal of sociology, 1973, 78(6), 1360-1380.
9. Zimmermann, H. J. Fuzzy data analysis. Proceedings of Fuzzy Set Theory and Its Applications, 2001, pp. 277-328.
10. Klerks, P. The network paradigm applied to criminal organizations: Theoretical nitpicking or a relevant doctrine for investigators? Connections, 2001, 24(3), 53-65.
11. Wasserman, S, Social network analysis: Methods and applications. Cambridge university press, (1994).
12. Freeman, l.C., Centrality in social networks conceptual clarification. Social networks, 1979, 1(3), pp. 215-239.
13. Bonacich, P., Factoring and weighting approaches to status scores and clique identification. Journal of Mathematical Sociology, 1973, 2(1), 113-120.
14. Burgess, M, Analytical network and System Administration: Managing Human-Computer Systems. Wiley, (2005).
15. The 9/11 Commission report: Final report of national commission on terrorist attacks upon the united States. <www.washingtonpost.com/wp-srv/nation/911report.pdf>
LekVZ oLrqvksa dk fuekZ.k % vkj ,Q vkbZ Mh rFid: Creating smart objects
Sumit MalhotraDefence Scientific Information and Documentation Centre, Delhi-110 054, India
*E-mail: [email protected]
lkjka”k
vkj ,Q vkbZ Mh rduhd vc n”kdksa ls ç;ksx esa gSA ge lc us bldk uke dHkh u dHkh thou esa lquk gSA ;g isij vkj ,Q vkbZ Mh rduhd ds ihNs ds foKku vkSj rduhd dks dqN xgjkbZ ls la>kus dk ç;kl gS] ftl ls ge vius ;g lksp ik;saxs dh dSls bl rduhd dk ç;ksx ge vius vius dk;Z {ks= esa dj ldrs gSaA ;g rduhd xr o’kksaZ esa dkQh eP;ksj gqbZ gS] vkSj vHkh Hkh fnu ij fnu csgrj vkSj vf/kd l{ke gksrh tk jgh gSA bl rduhd dh tks fo”ks’krk bls vyx cukrh gS] og ;s gS dh ;s rduhd futhZo oLrqvksa dks LekVZ cuk nsrh gSA LekVZ oLrqvksa esa viuh eseksjh vkSj dEI;wVs”ku dh {kerk gksrh gS] ftlls og vkl ikl dh vU; oLrqvksa vkSj okrkoj.k ls dE;wfudsV dj ldrh gSA isij esa ge bl rduhd ds fodkl] dk;Z ç.kkyh] vkSj ç;ksxksa ij ppkZ djsaxsA
AbstrAct
rFID is a technology that has been around for decades. All of us have heard its name at some point of time. This paper tries to give a deeper understanding into the science and working of this technology, and let you imagine one more way in which rFID can be used in your field of work. The rFID technology in all these years, has matured itself and is still evolving technology with lot of potential. Its applications are limited only by one’s imagination. What makes this technology so fascinating is the fact, that it can make objects intelligent. It gives objects the memory and gives them intelligence to communicate with other objects around. We will discuss its evolution, functioning and applications.
Keywords: rFID tag, rFID applications
Bilingual International Conference on Information Technology: Yesterday, Today, and Tomorrow, 19-21 Feburary 2015, pp. 281-285 © DESIDOC, 2015
1. IntroductIonrFID is one of the host of technologies used
for automatic identification of objects. Automatic identification is often used by companies to identify objects or individuals while manufacturing, on assembly lines or while in stores. The auto-id is aimed at reducing manual identification, data-entry, and thus improving efficiency of the whole business. The basic idea of such technologies is to let machines do the identification of object and individuals, using various sensor technologies. Bar codes, OCRs are some other technologies that have been around for a while now. The later developments are biometrics, voice recognition, and rFID.
2. EVolUtionThe immediate predecessor of rFID was Barcode,
that we are all must have seen, and that has been used excessively. Some of the fixed information about a product like its name, manufacturer, etc can be embedded on a barcode, which can easily read
by a barcode reader. For example in case of a book we can embed some fixed information like its name, publisher, subject, edition, no. of pages on a barcode, and paste the barcode as a sticker on every copy of the book. now in whichever library the book will go, the information stored in the barcode will never have to be entered manually.
rFID does all what a barcode does in a better way. Where a laser based sensor of barcode reader must be in line of sight with the barcode, in order to read it. An rFID has no such requirement. rFID is based on radio waves. An rFID reader can sense an rFID tag even if it is not in line of sight, it just needs to be in distance range of the reader. The following diagram depicts the communication between an rFID tag and a reader.
3. An rFid sYstEM & its CoMPonAntsAn rFID system consists of a reader and an
rFID tag. The reader consists of a powerful antenna to sense the tag, a source of power, and a computer
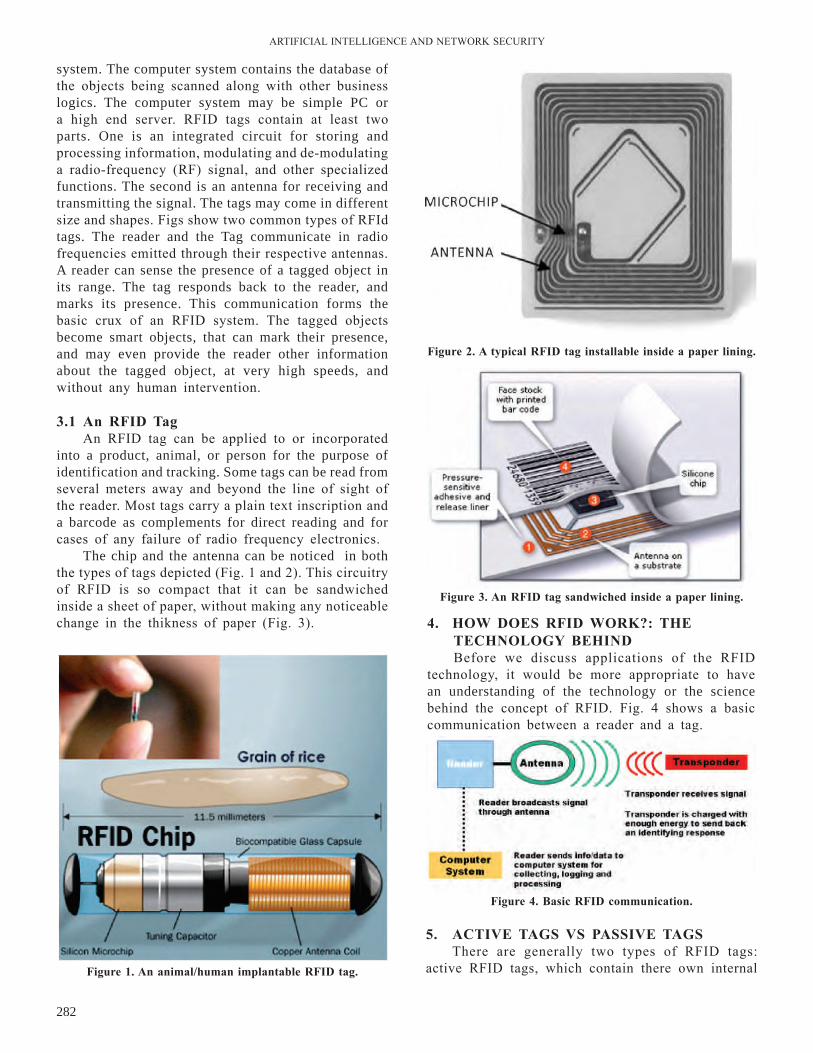
ArTIFICIAl InTEllIGEnCE AnD nETWOrK SECurITY
282
system. The computer system contains the database of the objects being scanned along with other business logics. The computer system may be simple PC or a high end server. rFID tags contain at least two parts. One is an integrated circuit for storing and processing information, modulating and de-modulating a radio-frequency (rF) signal, and other specialized functions. The second is an antenna for receiving and transmitting the signal. The tags may come in different size and shapes. Figs show two common types of rFId tags. The reader and the Tag communicate in radio frequencies emitted through their respective antennas. A reader can sense the presence of a tagged object in its range. The tag responds back to the reader, and marks its presence. This communication forms the basic crux of an rFID system. The tagged objects become smart objects, that can mark their presence, and may even provide the reader other information about the tagged object, at very high speeds, and without any human intervention.
3.1 An rFid tagAn rFID tag can be applied to or incorporated
into a product, animal, or person for the purpose of identification and tracking. Some tags can be read from several meters away and beyond the line of sight of the reader. Most tags carry a plain text inscription and a barcode as complements for direct reading and for cases of any failure of radio frequency electronics.
The chip and the antenna can be noticed in both the types of tags depicted (Fig. 1 and 2). This circuitry of rFID is so compact that it can be sandwiched inside a sheet of paper, without making any noticeable change in the thikness of paper (Fig. 3). 4. how doEs rFid worK?: thE
tEChnoloGY bEhindBefore we discuss applications of the rFID
technology, it would be more appropriate to have an understanding of the technology or the science behind the concept of rFID. Fig. 4 shows a basic communication between a reader and a tag.
Figure 1. An animal/human implantable rFid tag.
Figure 3. An rFid tag sandwiched inside a paper lining.
Figure 4. basic rFid communication.
Figure 2. A typical rFid tag installable inside a paper lining.
5. ACtiVE tAGs Vs PAssiVE tAGsThere are generally two types of rFID tags:
active rFID tags, which contain there own internal
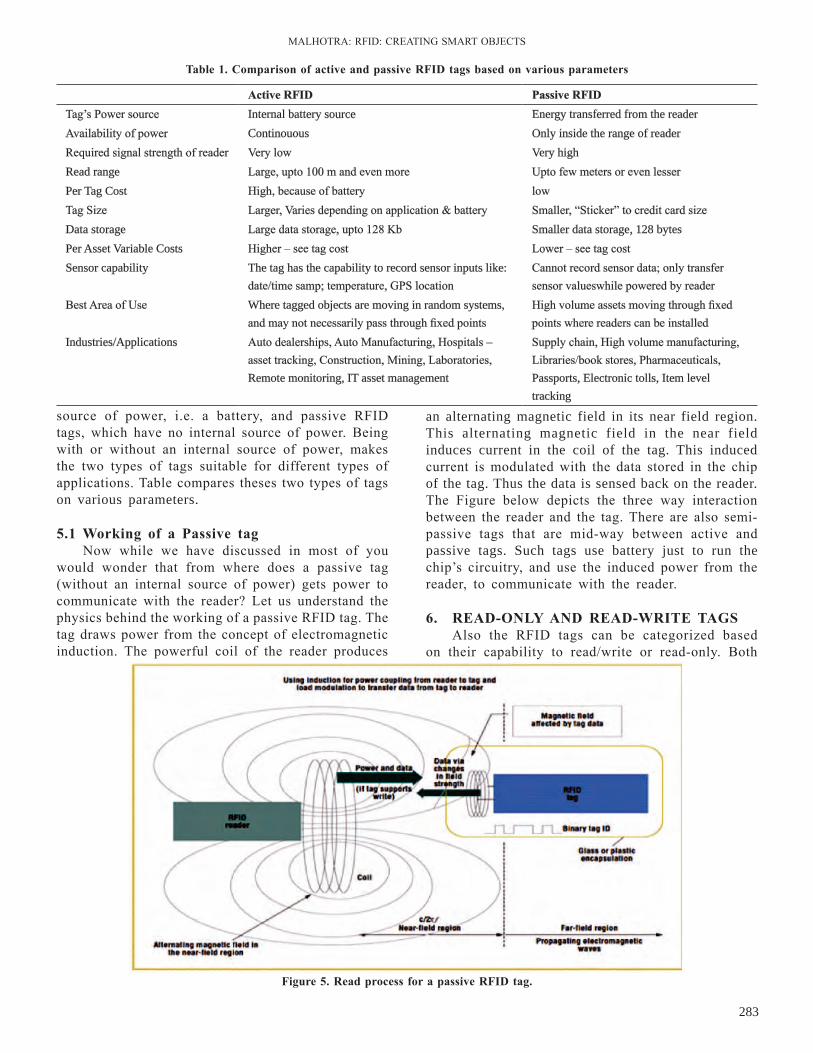
MAlHOTrA: rFID: CrEATInG SMArT OBJECTS
283
an alternating magnetic field in its near field region. This alternating magnetic field in the near field induces current in the coil of the tag. This induced current is modulated with the data stored in the chip of the tag. Thus the data is sensed back on the reader. The Figure below depicts the three way interaction between the reader and the tag. There are also semi-passive tags that are mid-way between active and passive tags. Such tags use battery just to run the chip’s circuitry, and use the induced power from the reader, to communicate with the reader.
6. rEAd-onlY And rEAd-writE tAGsAlso the rFID tags can be categorized based
on their capability to read/write or read-only. Both
table 1. Comparison of active and passive rFid tags based on various parameters
Figure 5. read process for a passive rFid tag.
source of power, i.e. a battery, and passive rFID tags, which have no internal source of power. Being with or without an internal source of power, makes the two types of tags suitable for different types of applications. Table compares theses two types of tags on various parameters.
5.1 working of a Passive tagnow while we have discussed in most of you
would wonder that from where does a passive tag (without an internal source of power) gets power to communicate with the reader? let us understand the physics behind the working of a passive rFID tag. The tag draws power from the concept of electromagnetic induction. The powerful coil of the reader produces
Active rFid Passive rFidTag’s Power source Internal battery source Energy transferred from the readerAvailability of power Continouous Only inside the range of readerrequired signal strength of reader Very low Very highRead range large, upto 100 m and even more upto few meters or even lesserPer Tag Cost High, because of battery lowTag Size larger, Varies depending on application & battery Smaller, “Sticker” to credit card sizeData storage large data storage, upto 128 Kb Smaller data storage, 128 bytesPer Asset Variable Costs Higher – see tag cost lower – see tag costSensor capability The tag has the capability to record sensor inputs like:
date/time samp; temperature, GPS locationCannot record sensor data; only transfer sensor valueswhile powered by reader
Best Area of use Where tagged objects are moving in random systems, and may not necessarily pass through fixed points
High volume assets moving through fixed points where readers can be installed
Industries/Applications Auto dealerships, Auto Manufacturing, Hospitals – asset tracking, Construction, Mining, laboratories, Remote monitoring, IT asset management
Supply chain, High volume manufacturing, libraries/book stores, Pharmaceuticals, Passports, Electronic tolls, Item level tracking
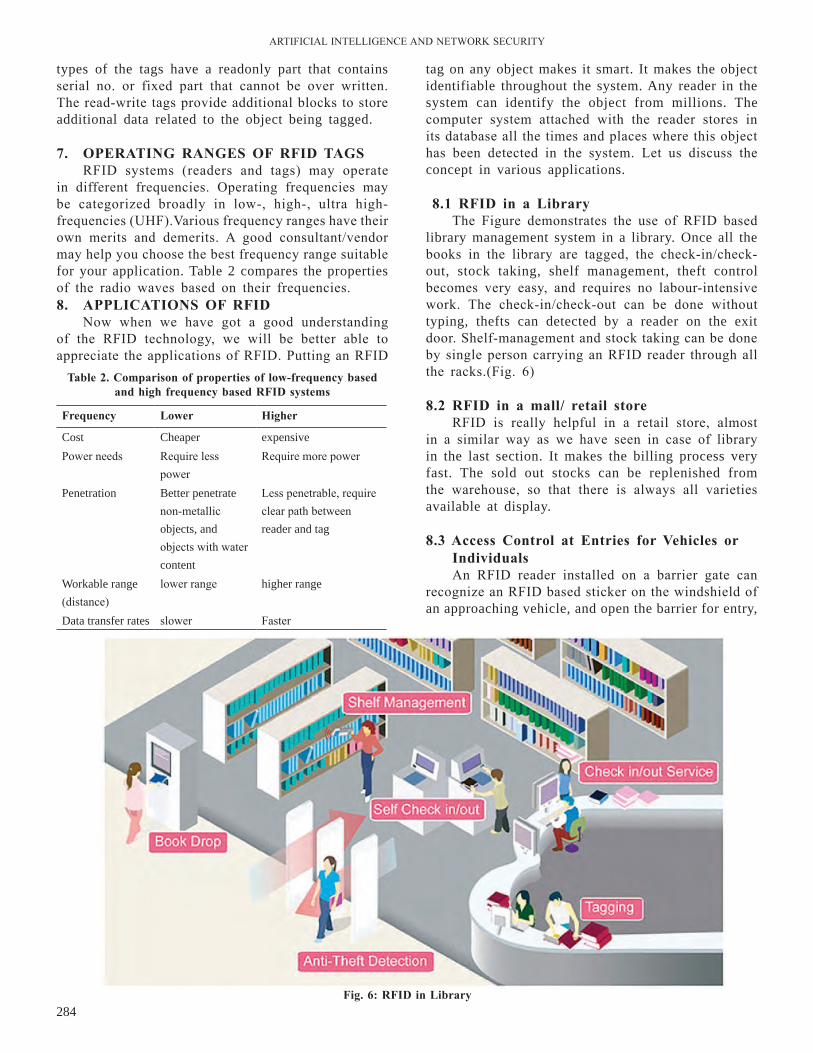
ArTIFICIAl InTEllIGEnCE AnD nETWOrK SECurITY
284
types of the tags have a readonly part that contains serial no. or fixed part that cannot be over written. The read-write tags provide additional blocks to store additional data related to the object being tagged.
7. oPErAtinG rAnGEs oF rFid tAGsrFID systems (readers and tags) may operate
in different frequencies. Operating frequencies may be categorized broadly in low-, high-, ultra high-frequencies (uHF).Various frequency ranges have their own merits and demerits. A good consultant/vendor may help you choose the best frequency range suitable for your application. Table 2 compares the properties of the radio waves based on their frequencies.8. APPliCAtions oF rFid
now when we have got a good understanding of the rFID technology, we will be better able to appreciate the applications of rFID. Putting an rFID
tag on any object makes it smart. It makes the object identifiable throughout the system. Any reader in the system can identify the object from millions. The computer system attached with the reader stores in its database all the times and places where this object has been detected in the system. let us discuss the concept in various applications.
8.1 rFid in a libraryThe Figure demonstrates the use of rFID based
library management system in a library. Once all the books in the library are tagged, the check-in/check-out, stock taking, shelf management, theft control becomes very easy, and requires no labour-intensive work. The check-in/check-out can be done without typing, thefts can detected by a reader on the exit door. Shelf-management and stock taking can be done by single person carrying an rFID reader through all the racks.(Fig. 6)
8.2 rFid in a mall/ retail storerFID is really helpful in a retail store, almost
in a similar way as we have seen in case of library in the last section. It makes the billing process very fast. The sold out stocks can be replenished from the warehouse, so that there is always all varieties available at display.
8.3 Access Control at Entries for Vehicles or individualsAn rFID reader installed on a barrier gate can
recognize an rFID based sticker on the windshield of an approaching vehicle, and open the barrier for entry,
Frequency lower higher
Cost Cheaper expensivePower needs require less
powerrequire more power
Penetration Better penetrate non-metallic objects, and objects with water content
less penetrable, require clear path between reader and tag
Workable range (distance)
lower range higher range
Data transfer rates slower Faster
table 2. Comparison of properties of low-frequency based and high frequency based rFid systems
Fig. 6: rFid in library
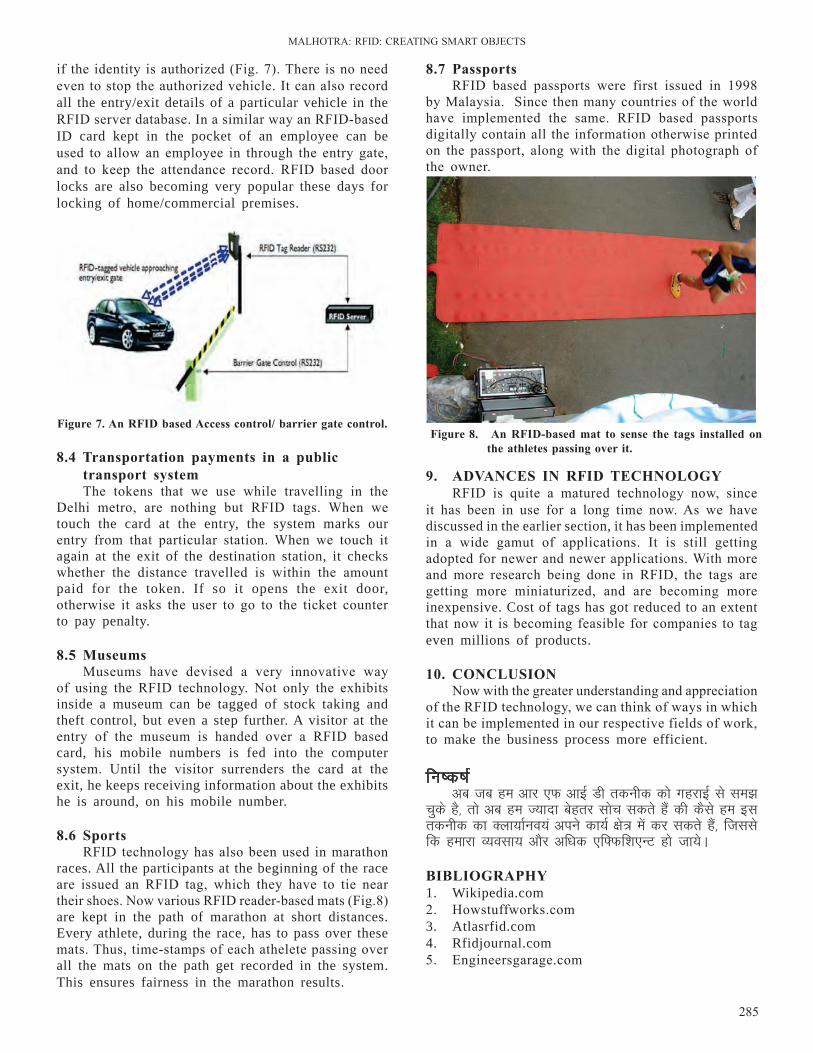
MAlHOTrA: rFID: CrEATInG SMArT OBJECTS
285
if the identity is authorized (Fig. 7). There is no need even to stop the authorized vehicle. It can also record all the entry/exit details of a particular vehicle in the rFID server database. In a similar way an rFID-based ID card kept in the pocket of an employee can be used to allow an employee in through the entry gate, and to keep the attendance record. rFID based door locks are also becoming very popular these days for locking of home/commercial premises.
8.4 transportation payments in a public transport systemThe tokens that we use while travelling in the
Delhi metro, are nothing but rFID tags. When we touch the card at the entry, the system marks our entry from that particular station. When we touch it again at the exit of the destination station, it checks whether the distance travelled is within the amount paid for the token. If so it opens the exit door, otherwise it asks the user to go to the ticket counter to pay penalty.
8.5 MuseumsMuseums have devised a very innovative way
of using the rFID technology. not only the exhibits inside a museum can be tagged of stock taking and theft control, but even a step further. A visitor at the entry of the museum is handed over a rFID based card, his mobile numbers is fed into the computer system. until the visitor surrenders the card at the exit, he keeps receiving information about the exhibits he is around, on his mobile number.
8.6 sportsrFID technology has also been used in marathon
races. All the participants at the beginning of the race are issued an rFID tag, which they have to tie near their shoes. now various rFID reader-based mats (Fig.8) are kept in the path of marathon at short distances. Every athlete, during the race, has to pass over these mats. Thus, time-stamps of each athelete passing over all the mats on the path get recorded in the system. This ensures fairness in the marathon results.
Figure 7. An rFid based Access control/ barrier gate control.Figure 8. An rFid-based mat to sense the tags installed on
the athletes passing over it.
8.7 PassportsrFID based passports were first issued in 1998
by Malaysia. Since then many countries of the world have implemented the same. rFID based passports digitally contain all the information otherwise printed on the passport, along with the digital photograph of the owner.
9. AdVAnCEs in rFid tEChnoloGY rFID is quite a matured technology now, since
it has been in use for a long time now. As we have discussed in the earlier section, it has been implemented in a wide gamut of applications. It is still getting adopted for newer and newer applications. With more and more research being done in rFID, the tags are getting more miniaturized, and are becoming more inexpensive. Cost of tags has got reduced to an extent that now it is becoming feasible for companies to tag even millions of products.
10. ConClUsionnow with the greater understanding and appreciation
of the rFID technology, we can think of ways in which it can be implemented in our respective fields of work, to make the business process more efficient.
fu"d"k Z vc tc ge vkj ,Q vkbZ Mh rduhd dks xgjkbZ ls le>
pqds gS] rks vc ge T;knk csgrj lksp ldrs gSa dh dSls ge bl rduhd dk Dyk;kZuo;a vius dk;Z {ks= esa dj ldrs gSa] ftlls fd gekjk O;olk; vkSj vf/kd ,f¶Qf”k,UV gks tk;sA
biblioGrAPhY1. Wikipedia.com2. Howstuffworks.com3. Atlasrfid.com4. Rfidjournal.com5. Engineersgarage.com
ok;jysl lsalj usVodksaZ esa ,aV d‚yksuh b"Vrehdj.k vkSj LokeZ baVsfytsUl dk fodklEvolution of Ant Colony optimization and swarm intelligence in wireless sensor networks
Ankit Verma* and Prem Chand VashistMVN University, Haryana-121105
*E-mail: [email protected]
lkjka”k
vusd ,YxksfjFe vkSj çksVksd‚y cSVjh ykbQ] ihMhvkj] fo'oluh;rk] FkzksiqV] =qfV lgu&{kerk] usVodZ ySVUlh] usVodZ ykbQ LiSu] MsVk vlsEcyh] vksvks,l] MsVk fMyhojh e‚My vkSj çpkyu volajpuk esa lq/kkj dj b"Vre ikFk jkmfVax ds lkFk ok;jysl lsalj usVodZ ds fu"iknu dks c<+kus ij /;ku dsfUær dj jgs gSaA ;g i= ,aV d‚yksuh b"Vrehdj.k jkmfVax ij vk/kkfjr ,aV d‚yksuh rduhdksa vkSj LokeZ baVsfytsUl ds fodkl dks n'kkZrk gS] tks ,lhvks ds fy, ,aV vkSj ch lsalj ds fy, ch ls çsfjr gSA
AbstrAct
Several algorithms and protocols are focusing on enhancing the performance of wireless sensor network with optimum path routing by improving battery life, PDr, reliability, throughput, fault tolerance, network latency, network life span, data assembly, qoS, data delivery models, and operating infrastructure. Paper shows the evolution of ant colony techniques and swarm intelligence based on ant colony optimization routing, which is inspired by ant for ant colony optimization, and bee for bee sensor.
Keywords: Ant colony optimization, swarm intelligence, wireless sensor networks
Bilingual International Conference on Information Technology: Yesterday, Today, and Tomorrow, 19-21 February 2015, pp. 286-289© DESIDOC, 2015
1. IntroductIonWireless sensor network comprise tinny sensors
which can exchange data via wireless channels1. Improvement in WSn makes the sensor very small, better battery life, low range, and consumes less power. Base station, sensor unit, region and task allocator are the parts of sensor network. Small sensor units are spread in the sensor network which make tough to find the accurate sensor location2. Adaptive collaboration and self-organization is necessary to survive in such sensor network3. location information is transferred to base station via multi-hop routing as feature of organizing itself. WSn most popular with wide application areas in different fields like science, technology and education. Performance improvement is a major issue, which can be achieved by reducing congestion and enhance network life4.
Various protocols and routing schemes are designed to improve sensor network performance, from which swarm intelligence is the most renowned scheme5. Swarm intelligence is based on insects like honey bees and ants, their decentralized management and collective behaviour6. Their behaviour is similar to networking in dynamic, parallel, and distributed systems. Evolution
of swarm intelligence improved the performance of wireless sensor networks in terms of packet delivery ratio, network lifetime, scalability, reliability with better qoS. Extensive range can be achieved using sensor of low cost with long battery life, and free of maintenance.
2. swArM intElliGEnCE roUtinG ProtoColsSwarm intelligence routing protocols are of three
types: bee-based, slime-based and ACO (ant colony optimization)-based.
2.1 bee Colony-based routing ProtocolsBee colony protocols based on for aging behaviour
of honey bees, which is the same as routing in sensor networks. Self-organizing nature and dividing labour is the principle which is used by honey bees.
2.1.1 Bee-SensorRouting protocol based on beehive is developed
with wired networks[5]. The principle is scoutrecruit system used with the help of bees. For aging is used
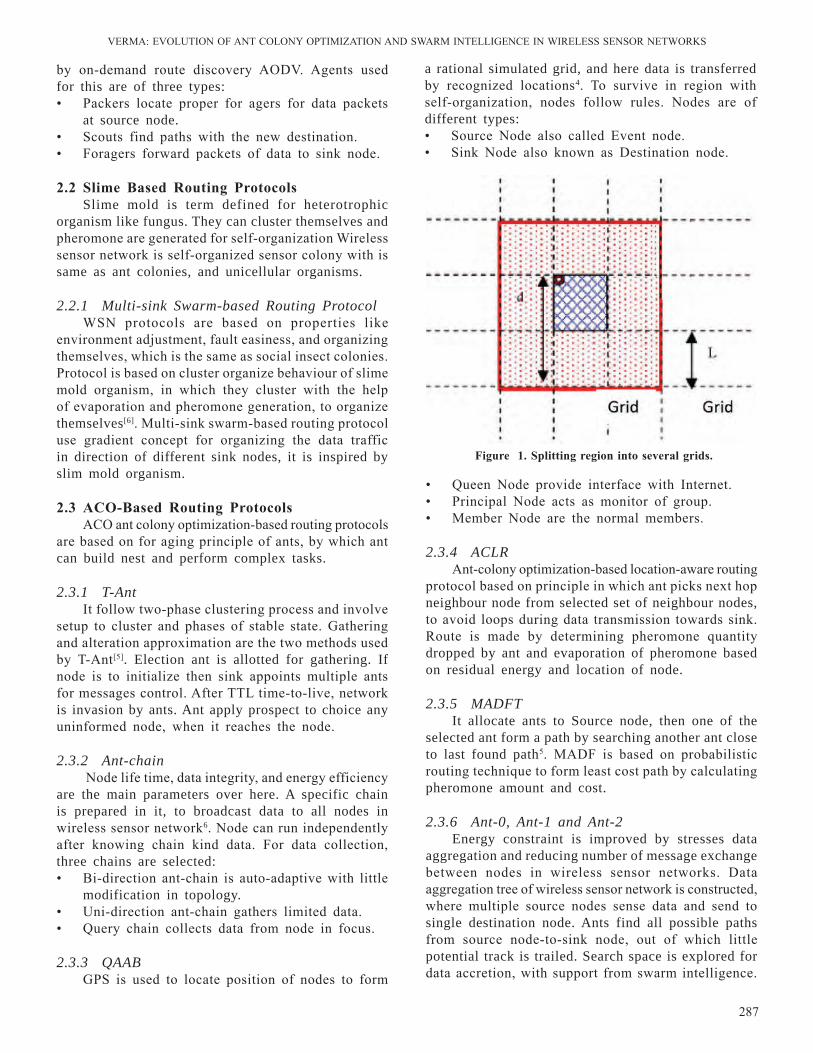
VErMA: EVOluTIOn OF AnT COlOnY OPTIMIZATIOn AnD SWArM InTEllIGEnCE In WIrElESS SEnSOr nETWOrKS
287
by on-demand route discovery AODV. Agents used for this are of three types:• Packers locate proper for agers for data packets
at source node.• Scouts find paths with the new destination.• Foragers forward packets of data to sink node.
2.2 slime based routing ProtocolsSlime mold is term defined for heterotrophic
organism like fungus. They can cluster themselves and pheromone are generated for self-organization Wireless sensor network is self-organized sensor colony with is same as ant colonies, and unicellular organisms.
2.2.1 Multi-sink Swarm-based Routing Protocol
WSn protocols are based on properties like environment adjustment, fault easiness, and organizing themselves, which is the same as social insect colonies. Protocol is based on cluster organize behaviour of slime mold organism, in which they cluster with the help of evaporation and pheromone generation, to organize themselves[6]. Multi-sink swarm-based routing protocol use gradient concept for organizing the data traffic in direction of different sink nodes, it is inspired by slim mold organism.
2.3 ACo-based routing ProtocolsACO ant colony optimization-based routing protocols
are based on for aging principle of ants, by which ant can build nest and perform complex tasks.
2.3.1 T-AntIt follow two-phase clustering process and involve
setup to cluster and phases of stable state. Gathering and alteration approximation are the two methods used by T-Ant[5]. Election ant is allotted for gathering. If node is to initialize then sink appoints multiple ants for messages control. After TTl time-to-live, network is invasion by ants. Ant apply prospect to choice any uninformed node, when it reaches the node.
2.3.2 Ant-chain node life time, data integrity, and energy efficiency
are the main parameters over here. A specific chain is prepared in it, to broadcast data to all nodes in wireless sensor network6. node can run independently after knowing chain kind data. For data collection, three chains are selected:• Bi-direction ant-chain is auto-adaptive with little
modification in topology.• uni-direction ant-chain gathers limited data. • query chain collects data from node in focus.
2.3.3 QAABGPS is used to locate position of nodes to form
a rational simulated grid, and here data is transferred by recognized locations4. To survive in region with self-organization, nodes follow rules. nodes are of different types:• Source node also called Event node.• Sink node also known as Destination node.
Figure 1. splitting region into several grids.
• queen node provide interface with Internet.• Principal node acts as monitor of group.• Member node are the normal members.
2.3.4 ACLRAnt-colony optimization-based location-aware routing
protocol based on principle in which ant picks next hop neighbour node from selected set of neighbour nodes, to avoid loops during data transmission towards sink. route is made by determining pheromone quantity dropped by ant and evaporation of pheromone based on residual energy and location of node.
2.3.5 MADFTIt allocate ants to Source node, then one of the
selected ant form a path by searching another ant close to last found path5. MADF is based on probabilistic routing technique to form least cost path by calculating pheromone amount and cost.
2.3.6 Ant-0, Ant-1 and Ant-2Energy constraint is improved by stresses data
aggregation and reducing number of message exchange between nodes in wireless sensor networks. Data aggregation tree of wireless sensor network is constructed, where multiple source nodes sense data and send to single destination node. Ants find all possible paths from source node-to-sink node, out of which little potential track is trailed. Search space is explored for data accretion, with support from swarm intelligence.
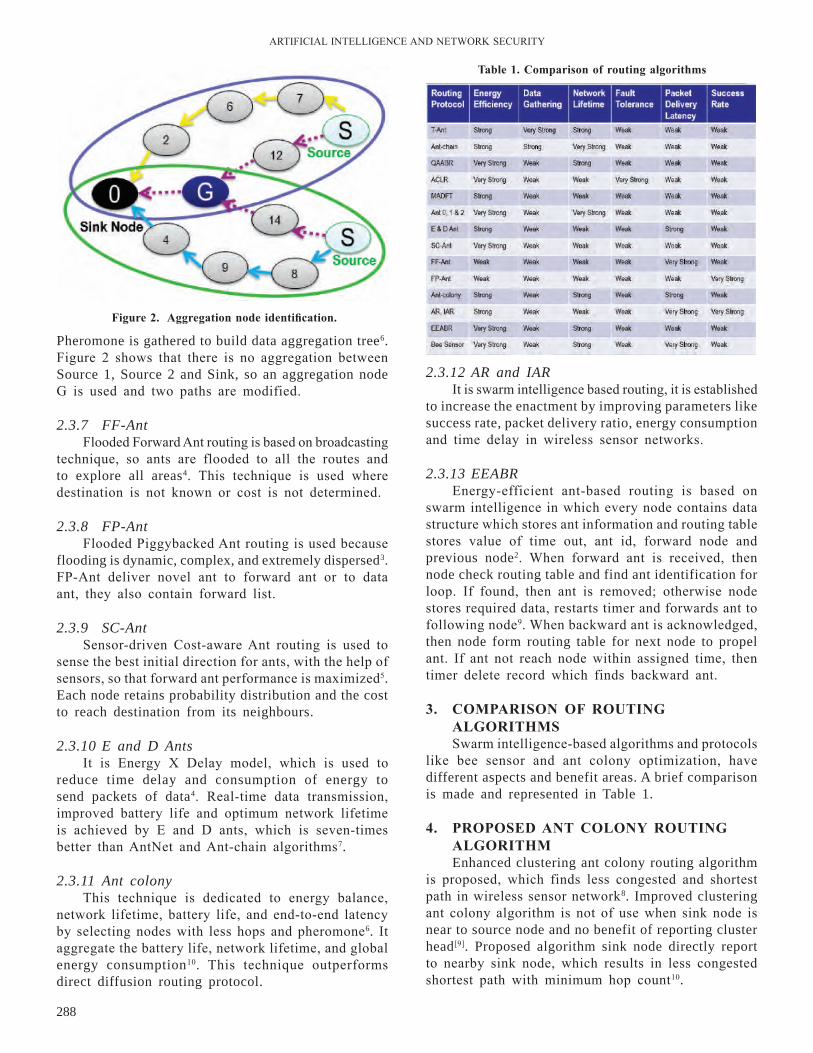
ArTIFICIAl InTEllIGEnCE AnD nETWOrK SECurITY
288
2.3.12 AR and IARIt is swarm intelligence based routing, it is established
to increase the enactment by improving parameters like success rate, packet delivery ratio, energy consumption and time delay in wireless sensor networks.
2.3.13 EEABREnergy-efficient ant-based routing is based on
swarm intelligence in which every node contains data structure which stores ant information and routing table stores value of time out, ant id, forward node and previous node2. When forward ant is received, then node check routing table and find ant identification for loop. If found, then ant is removed; otherwise node stores required data, restarts timer and forwards ant to following node9. When backward ant is acknowledged, then node form routing table for next node to propel ant. If ant not reach node within assigned time, then timer delete record which finds backward ant.
3. CoMPArison oF roUtinG AlGorithMsSwarm intelligence-based algorithms and protocols
like bee sensor and ant colony optimization, have different aspects and benefit areas. A brief comparison is made and represented in Table 1.
4. ProPosEd Ant ColonY roUtinG AlGorithMEnhanced clustering ant colony routing algorithm
is proposed, which finds less congested and shortest path in wireless sensor network8. Improved clustering ant colony algorithm is not of use when sink node is near to source node and no benefit of reporting cluster head[9]. Proposed algorithm sink node directly report to nearby sink node, which results in less congested shortest path with minimum hop count10.
Pheromone is gathered to build data aggregation tree6. Figure 2 shows that there is no aggregation between Source 1, Source 2 and Sink, so an aggregation node G is used and two paths are modified.
2.3.7 FF-AntFlooded Forward Ant routing is based on broadcasting
technique, so ants are flooded to all the routes and to explore all areas4. This technique is used where destination is not known or cost is not determined.
2.3.8 FP-AntFlooded Piggybacked Ant routing is used because
flooding is dynamic, complex, and extremely dispersed3. FP-Ant deliver novel ant to forward ant or to data ant, they also contain forward list.
2.3.9 SC-AntSensor-driven Cost-aware Ant routing is used to
sense the best initial direction for ants, with the help of sensors, so that forward ant performance is maximized5. Each node retains probability distribution and the cost to reach destination from its neighbours.
2.3.10 E and D AntsIt is Energy X Delay model, which is used to
reduce time delay and consumption of energy to send packets of data4. real-time data transmission, improved battery life and optimum network lifetime is achieved by E and D ants, which is seven-times better than Antnet and Ant-chain algorithms7.
2.3.11 Ant colony
This technique is dedicated to energy balance, network lifetime, battery life, and end-to-end latency by selecting nodes with less hops and pheromone6. It aggregate the battery life, network lifetime, and global energy consumption10. This technique outperforms direct diffusion routing protocol.
Figure 2. Aggregation node identification.
table 1. Comparison of routing algorithms
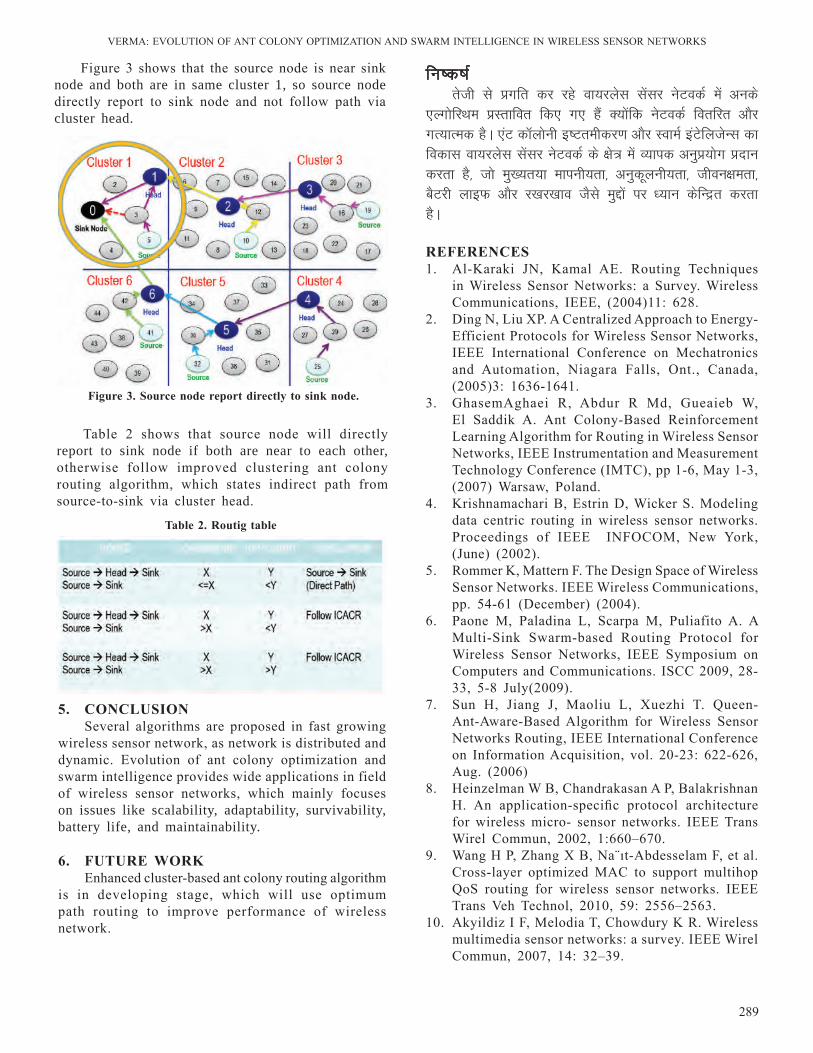
VErMA: EVOluTIOn OF AnT COlOnY OPTIMIZATIOn AnD SWArM InTEllIGEnCE In WIrElESS SEnSOr nETWOrKS
289
fu’d’k Zrsth ls çxfr dj jgs ok;jysl lsalj usVodZ esa vuds
,YxksfjFke çLrkfor fd, x, gSa D;ksafd usVodZ forfjr vkSj xR;kRed gSA ,aV d‚yksuh b"Vrehdj.k vkSj LokeZ baVsfytsUl dk fodkl ok;jysl lsalj usVodZ ds {ks= esa O;kid vuqç;ksx çnku djrk gS] tks eq[;r;k ekiuh;rk] vuqdwyuh;rk] thou{kerk] cSVjh ykbQ vkSj j[kj[kko tSls eqíksa ij /;ku dsfUær djrk gSA
rEFErEnCEs1. Al-Karaki Jn, Kamal AE. routing Techniques
in Wireless Sensor networks: a Survey. Wireless Communications, IEEE, (2004)11: 628.
2. Ding n, liu XP. A Centralized Approach to Energy-Efficient Protocols for Wireless Sensor networks, IEEE International Conference on Mechatronics and Automation, niagara Falls, Ont., Canada, (2005)3: 1636-1641.
3. GhasemAghaei r, Abdur r Md, Gueaieb W, El Saddik A. Ant Colony-Based reinforcement learning Algorithm for routing in Wireless Sensor networks, IEEE Instrumentation and Measurement Technology Conference (IMTC), pp 1-6, May 1-3, (2007) Warsaw, Poland.
4. Krishnamachari B, Estrin D, Wicker S. Modeling data centric routing in wireless sensor networks. Proceedings of IEEE InFOCOM, new York, (June) (2002).
5. rommer K, Mattern F. The Design Space of Wireless Sensor networks. IEEE Wireless Communications, pp. 54-61 (December) (2004).
6. Paone M, Paladina l, Scarpa M, Puliafito A. A Multi-Sink Swarm-based routing Protocol for Wireless Sensor networks, IEEE Symposium on Computers and Communications. ISCC 2009, 28-33, 5-8 July(2009).
7. Sun H, Jiang J, Maoliu l, Xuezhi T. queen-Ant-Aware-Based Algorithm for Wireless Sensor networks routing, IEEE International Conference on Information Acquisition, vol. 20-23: 622-626, Aug. (2006)
8. Heinzelman W B, Chandrakasan A P, Balakrishnan H. An application-specific protocol architecture for wireless micro- sensor networks. IEEE Trans Wirel Commun, 2002, 1:660–670.
9. Wang H P, Zhang X B, na¨ıt-Abdesselam F, et al. Cross-layer optimized MAC to support multihop qoS routing for wireless sensor networks. IEEE Trans Veh Technol, 2010, 59: 2556–2563.
10. Akyildiz I F, Melodia T, Chowdury K r. Wireless multimedia sensor networks: a survey. IEEE Wirel Commun, 2007, 14: 32–39.
Figure 3. source node report directly to sink node.
table 2. routig table
Figure 3 shows that the source node is near sink node and both are in same cluster 1, so source node directly report to sink node and not follow path via cluster head.
Table 2 shows that source node will directly report to sink node if both are near to each other, otherwise follow improved clustering ant colony routing algorithm, which states indirect path from source-to-sink via cluster head.
5. ConClUsionSeveral algorithms are proposed in fast growing
wireless sensor network, as network is distributed and dynamic. Evolution of ant colony optimization and swarm intelligence provides wide applications in field of wireless sensor networks, which mainly focuses on issues like scalability, adaptability, survivability, battery life, and maintainability.
6. FUtUrE worKEnhanced cluster-based ant colony routing algorithm
is in developing stage, which will use optimum path routing to improve performance of wireless network.