as7341 11-channel spectral sensor
TRANSCRIPT

User Guide
UG000400
AS7341 11-Channel
Spectral Sensor
Evaluation Kit
AS7341 EVAL KIT
v5-00 • 2019-Nov-25
Document Feedback AS7341 11-Channel Spectral Sensor Content Guide
Demo Kit Manual • PUBLIC UG000400 • v5-00 • 2019-Nov-25 56 │ 2
Content Guide
1 Introduction .................................... 3
1.1 Kits Content .................................................. 3 1.2 Ordering Information .................................... 5
2 Getting Started ............................... 6
3 Hardware Description .................... 7
3.1 Hardware Architecture ................................. 7 3.2 Power Supply ............................................... 8 3.3 Onboard Example LEDs .............................. 8 3.4 Connector Pinout Description .................... 10 3.5 Schematic ................................................... 12
4 Optical Diffuser ............................ 14
5 Calibration .................................... 16
6 Software ....................................... 22
6.1 Software Installation ................................... 22 6.2 Initialization Files ........................................ 23 6.3 AS7341 EVM Graphical User Interface ..... 30 6.4 Tab File ...................................................... 30 6.5 Hot Keys ..................................................... 30 6.6 Sensor Board Test ..................................... 31 6.7 Mode of Operation ..................................... 32
6.8 Main Window .............................................. 34 6.9 ALS Light Detection ................................... 37 6.10 Reflection Mode ......................................... 41 6.11 Tab Log ...................................................... 42 6.12 Flicker Log .................................................. 42 6.13 Detection Log ............................................. 42 6.14 Flicker Detection ........................................ 43 6.15 Register Mapping ....................................... 46 6.16 Tracer ......................................................... 47
7 Error Messages List .................... 50
8 Special Details for Other AS7341 Devices Using the AS7341 Eval Kit GUI ................................................ 53
8.1 Additional Details When Using an AS7341 PEN with EEPROM .................................... 53
9 Additional Documents ................ 54
10 Revision Information ................... 55
11 Legal Information ........................ 56

Document Feedback AS7341 11-Channel Spectral Sensor Introduction
Demo Kit Manual • PUBLIC UG000400 • v5-00 • 2019-Nov-25 56 │ 3
1 Introduction
AS7341 EVAL KIT is a platform to evaluate ams AS7341 11-channel spectral sensor’s applications
and to demonstrate different use cases based on ams spectral sensing. The ams EVK AS7341
realizes basic functions to get Sensor’s ADC counts based on alternative setups and includes special
functions to demonstrate application specific tasks (ALS Ambient Light Sensing, Reflection Mode,
Flicker Detection and Spectral and Color Mask Compare). Perhaps, these functions need a hardware
adaptation (e.g. LED on board for reflection) or additional an optional mechanical interface, which
must be ordered separately. In general, there are two available standard kits for the AS7341 EVK
depending on the use case and optical adapters.
● The standard kit ALS to measure lighting includes the hardware version without LEDs on board,
a diffuser in front of the Sensor and with a maximum field of view. It represents the standard kit
(see Figure 1) for applications with light sources in front of the sensor e.g. for light
measurement/detection or liquid measurements in transmission.
● The extended kit for Reflection Mode consists of the Sensor hardware, but with pre-assembled
LED (VTC2835-YUJI) and a special adapter in front of the Sensor with 0°/45° geometry for color
measurements.
This user guide describes the features and functions of Windows 10 based Evaluation Kit AS7341 and
demos based on the same hardware and interface and their standard and specific functions. The GUI
is suitable for the CSS EVKs and demos with I²C to FTDI Interface.
1.1 Kits Content
The standard AS7341 Evaluation Kit exists from following items, shown in Figure 1.
Figure 1 :
Kit Content of AS7341 EVK (ALS)
Item No.: Item Comment
1 FTDI - USB Cable USB – I²C Cable with 10 pol IDC Connector, 3.3V
Item 1
FTDI
Item 2
EVAL KIT with Diffuser in Front Adapter
Item 3
USB Stick
Item 4 Optional
Special Backside Adapter

Document Feedback AS7341 11-Channel Spectral Sensor Introduction
Demo Kit Manual • PUBLIC UG000400 • v5-00 • 2019-Nov-25 56 │ 4
Item No.: Item Comment
2 a0013a0_CSS EVAL KIT AS7341
Evaluation Kit with pre-assembled front adapter and diffuser
3 USB Data Stick Documents, software, firmware and drivers
4
Special Backside Adapter
EVAL Linos 16
EVAL Linos 16-25
Optional: 3D-Printing part, used to adapt the 16mm holder into
● 16 mm Linos-Nanobank (above)
● 25 mm Linos-Bank (below)
Figure 2 :
Kit Content of AS7341 EVK Reflection
Item No.: Item Comment
1 FTDI - USB Cable USB – I²C Cable with 10 pol IDC Connector, 3.3 V
2 a0013a0_CSS EVAL KIT AS7341 Reflection
Evaluation Kit with pre-assembled LED and 0°/45° optical front adapter (without diffuser1)
3 USB Data Stick Documents, software, firmware and drivers
4
Special Backside Adapter
EVAL Linos 16
EVAL Linos 16-25
Optional: 3D-Printing part, used to adapt the 16mm holder into
● 16 mm Linos-Nanobank (above)
● 25 mm Linos-Bank (below)
1 Customer should add a diffuser in front of the sensor in case of a non-diffuse application
Item 1
FTDI
Item 2
EVAL KIT with LED and 0°/45° Optical Front Adapter
Item 3
USB Stick
Item 4 Optional
Special Backside Adapter

Document Feedback AS7341 11-Channel Spectral Sensor Introduction
Demo Kit Manual • PUBLIC UG000400 • v5-00 • 2019-Nov-25 56 │ 5
1.2 Ordering Information
Ordering Code Description
AS7341 EVAL KIT AS7341 11-Channel Spectral Sensor Evaluation Kit
AS7341 EVK REFLECTION AS7341 11-Channel Spectral Sensor Evaluation Kit for reflection with pre-assembled LEDs and special 0°/45° adapter
a001aa_CSS EVAL KIT Linos 16 Optional 3D-Printing part, used to fit the CSS EVAL KITAS7341 into the 16 mm Linos-Nanobank
a001ba_CSS EVAL KIT Linos 16-25 Optional 3D-Printing part, used to adapt the 16mm holder into the 25 mm Linos-Bank
Attention
Please, order optional parts separately.
Information
It is also possible to print or modify the adapters customized. See the document path of the USB
Stick for the 3D models.

Document Feedback AS7341 11-Channel Spectral Sensor Getting Started
Demo Kit Manual • PUBLIC UG000400 • v5-00 • 2019-Nov-25 56 │ 6
2 Getting Started
The Evaluation Kit exists from the FTDI USB cable and the Sensor board with pre-assembled
adapters. Adapters are necessary to (front side) fulfil the optical requirements of the AS7341 filter
specification (diffuser), application specific requirements (FOV field of view or 0°/45° geometry) and
(back side) to fix the EVK into mechanical test systems.
The Sensor Boards has an I²C interface, which is converted to UART with physical USB interface and
COM-Port driver via FTDI converter. Figure 3 shows the FTDI cable (above) and the AS7341 Sensor
Board for Reflection Mode (below left) and the standard version e.g. for Light Detection (below right).
Figure 3:
AS7341 EVAL KITs with Sensor Hardware, Optical Adapters and FTDI Adapter
Select the correct EVAL KIT for your application. Plug the FTDI cable into the socket of the Sensor
board. Then connect the kit to PC.
The Evaluation Kit requires a onetime installation of FTDI Virtual COM Port Driver for the USB cable.
The installation files for the FTDI adapter are on the USB stick in the setup directories. Please install it
as an administrator.
If there is an issue during the installation, please read details in the manual or refer to
www.ftdichip.com for more information.
Install the AS7341 Software from the AS7341_Software.msi on the USB stick.
Please see chapter 4 for the software handling and description.
Document Feedback AS7341 11-Channel Spectral Sensor Hardware Description
Demo Kit Manual • PUBLIC UG000400 • v5-00 • 2019-Nov-25 56 │ 7
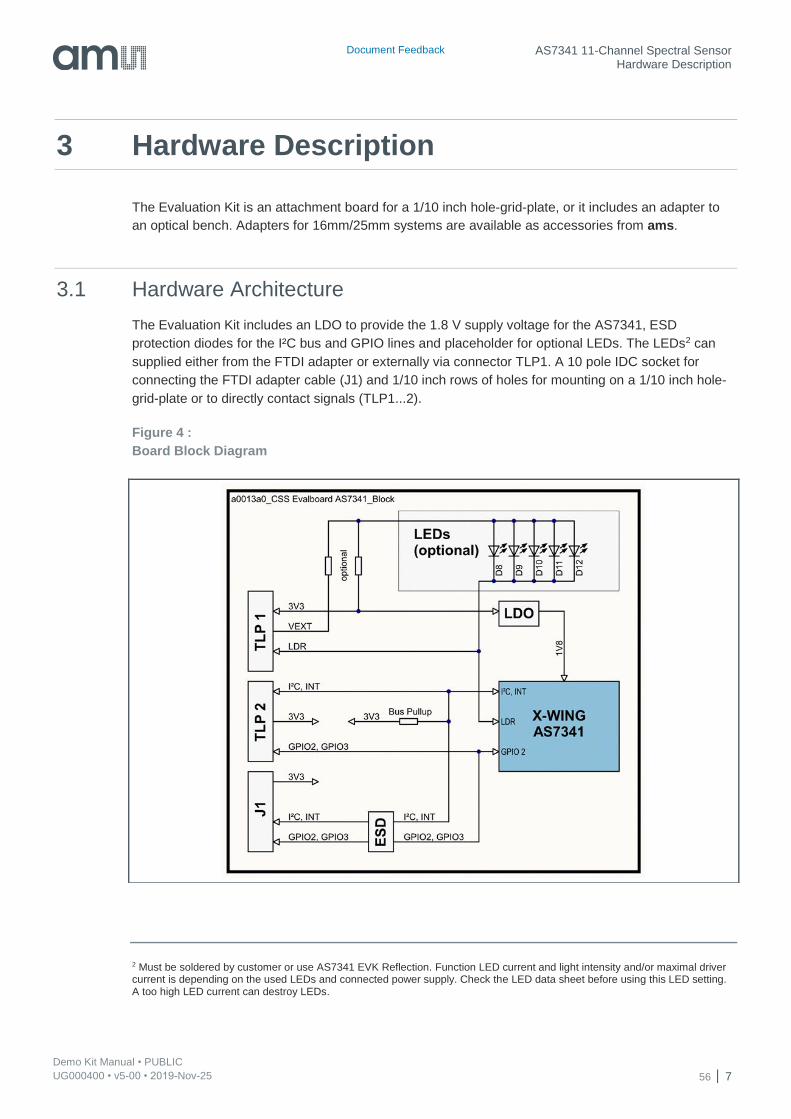
3 Hardware Description
The Evaluation Kit is an attachment board for a 1/10 inch hole-grid-plate, or it includes an adapter to
an optical bench. Adapters for 16mm/25mm systems are available as accessories from ams.
3.1 Hardware Architecture
The Evaluation Kit includes an LDO to provide the 1.8 V supply voltage for the AS7341, ESD
protection diodes for the I²C bus and GPIO lines and placeholder for optional LEDs. The LEDs2 can
supplied either from the FTDI adapter or externally via connector TLP1. A 10 pole IDC socket for
connecting the FTDI adapter cable (J1) and 1/10 inch rows of holes for mounting on a 1/10 inch hole-
grid-plate or to directly contact signals (TLP1...2).
Figure 4 :
Board Block Diagram
2 Must be soldered by customer or use AS7341 EVK Reflection. Function LED current and light intensity and/or maximal driver current is depending on the used LEDs and connected power supply. Check the LED data sheet before using this LED setting. A too high LED current can destroy LEDs.

Document Feedback AS7341 11-Channel Spectral Sensor Hardware Description
Demo Kit Manual • PUBLIC UG000400 • v5-00 • 2019-Nov-25 56 │ 8
3.2 Power Supply
In general, the FTDI converter realizes the 3.3 V power supply for the sensor board. The converter is
part of the original package of the AS7341 EVK. Customer can use on board alternative pre-designed
power supplies. For more details, see Figure 9.
Information
Make sure to use the original adapters and converters completely before connecting the hardware
to USB.
3.3 Onboard Example LEDs
Both example LEDs on this EVAL Board are the Yuji YJ-VTC-2835-G01-65, a broadband white light
LED. The typical spectral distribution shown in figure 5 below:
Figure 5:
Typical Spectral Distribution of Yuji YJ-VTC-2835-G01-65
If the EVAL Board power supply 3.3 V, it is not possible to get a current bigger than 10 mA through
both LEDs. This limit is given by a 3.3 V power supply and both 10 Ohm series resistors.
Figure 6:
Forward Current vs. Forward Voltage of Yuji YJ-VTC-2835-G01-65

Document Feedback AS7341 11-Channel Spectral Sensor Hardware Description
Demo Kit Manual • PUBLIC UG000400 • v5-00 • 2019-Nov-25 56 │ 9
Figure 7 describes the nonlinearity between GUI set current and the real current through the LEDs by
3.3 V power supply.
Figure 7:
Nonlinearity between GUI Set Current and a Real Measured Current
It is possible to connect the EVAL board to a bigger power consumption voltage. Pin1 on TLP1 is for
external LED voltage distribution. (Pin2 TLP1 is GND). R11 is to disassemble and fitted as R13.

Document Feedback AS7341 11-Channel Spectral Sensor Hardware Description
Demo Kit Manual • PUBLIC UG000400 • v5-00 • 2019-Nov-25 56 │ 10
3.4 Connector Pinout Description
Figure 8:
Connector Pinout Description
Figure 9:
Overview Connectors and Interfaces
Designator Comment
J1 10 pol. IDC Socket, connect to PC via FTDI Adapter (3.3 V)
TLP 1 VEXT, LDR, GND
TLP 2 3V3 (5V0), I²C, INT, GPIO
TLP 3 GND

Document Feedback AS7341 11-Channel Spectral Sensor Hardware Description
Demo Kit Manual • PUBLIC UG000400 • v5-00 • 2019-Nov-25 56 │ 11
Figure 10:
Connectors
Pin Number Net Name Function
TLP1 1 VEXT Supply the optional fitted LEDs from an external source
TLP1 2 GND Ground
TLP1 3 LDR Constant current sink from AS7341
TLP1 4…9 NC Not connected
TLP1 10 1V8 External power supply for AS7341 - before using this pin, disassemble the LDO.
TLP 2 1 GND Ground
TLP 2 2 NC Not connected
TLP 2 3 3V3 3V3 power input if there is no power on J1 (FTDI adapter) or 3V3 power output, if the power comes over J1
TLP 2 4 GND Ground
TLP 2 5 SDA I²C Data Signal
TLP 2 6 SCL I²C Clock Signal
TLP 2 7 INT AS7341 Interrupt Signal
TLP 2 8 GPIO 2 GPIO signal, bridged to the FTDI adapter
TLP 2 9 GND Ground
TLP 2 10 GPIO 3 GPIO signal, bridged to the FTDI adapter and the AS7341
TLP 2 11 SDA2 Is normally bridged to SDA, only needed for FTDI adapter
TLP 3 1..5, 7..10 NC Not connected
TLP 3 6 GND Ground
J1
J1 1 NC Not connected
J1 2 3V3 3V3 power input from the FTDI adapter
J1 3 GND Ground
J1 4 SDA I²C Data Signal
J1 5 SCL I²C Clock Signal
J1 6 INT AS7341 Interrupt Signal
J1 7 GPIO 2 GPIO signal, bridged to TPL 2
J1 8 GND Ground
J1 9 GPIO 3 GPIO signal, bridged to the AS7341
J1 10 SDA2 Is normally bridged to SDA, only needed for FTDI adapter

Document Feedback AS7341 11-Channel Spectral Sensor Hardware Description
Demo Kit Manual • PUBLIC UG000400 • v5-00 • 2019-Nov-25 56 │ 12
3.5 Schematic
Figure 11 :
Schematic Sensor Board

Document Feedback AS7341 11-Channel Spectral Sensor Hardware Description
Demo Kit Manual • PUBLIC UG000400 • v5-00 • 2019-Nov-25 56 │ 13

Document Feedback AS7341 11-Channel Spectral Sensor Optical Diffuser
Demo Kit Manual • PUBLIC UG000400 • v5-00 • 2019-Nov-25 56 │ 14
4 Optical Diffuser
For none-diffuse applications3, a translucent diffuser in front of AS7341 EVK is required, which uses
scattering centers to spread incoming directed light in pseudorandom directions. These scattering
centers can be very small surface structure on top (e.g. grounded glass) or small white particles inside
(e.g. opal glass) the diffuser. This property divides diffusers in two main groups of surface diffusers
and volume diffusers. The selection of a diffuser is always depending on the use case, the irradiance
on diffuser + Sensor and the needed flexibility of the setup.
A surface diffuser with high transmission and widest radiation pattern as possible should use for low
light measurement applications. Narrowing the radiation pattern for higher transmission efficiency is
only possible for detecting large and homogenous light sources (see following chapter) or if the
conditions for calibration are the same as measurement geometry and stability. Calibration can
compensate under stable conditions chromatic effects, deviations and others.
In applications under changing conditions regarding size, direction and/or orientation of the light
source a volume diffuser (e.g. Lexan 8B28 – opaque white) with nearly Lambertian and Achromatic
Characteristic is the best choice to create a Sensor system which is not affected by direction of
incoming light.
The AS7341 Eval Kit includes a Kimoto 100 PBU diffuser direct above the Sensor. This diffuser has
been selected according to excellent technical parameters taking into account price and availability.
The diffuser is located in two simple plastic shells and screwed on the Evaluation Kit (see Figure 13).
The following table lists the recommended diffuser parameters and/or the parameters of the diffuser
Kimoto in the AS7341 Eval Kit (=recommend parameters for similar diffuser).
Figure 12:
Recommend Diffuser Parameters
Parameter Value
Diffuser Material Kimoto 100 PBU
Diffuser Thickness 125 microns
Transmission 66 %
Haze 89.5 %
Half-Angle 35.5°
3 e.g. Ambient Light Sensing in contrast to reflections which are mostly diffuse

Document Feedback AS7341 11-Channel Spectral Sensor Optical Diffuser
Demo Kit Manual • PUBLIC UG000400 • v5-00 • 2019-Nov-25 56 │ 15
Figure 13:
Installation of Diffusor Holder ALS4
Information
The diffuser specification is depending on the customer application. Therefore, check the technical
parameters of the standard diffuser for technical details before you start any tests. Changing of the
diffuser is possible. Be careful and do not touch diffusers with fingers in case of any mounting
activities. The surface of diffusers is very sensitive and any touches or other mechanical stress or
dirty can change the optical behavior dramatically. Changing the diffuser and re-assembling with the
same typically changes calibration parameters and requires recalibration for optimal results.
For more details, please order our application note for AS7341 ‘APN-opto-mechanic’.
4 The assembly is similar for AS7341 EVK Reflection and/or the backside adapters

Document Feedback AS7341 11-Channel Spectral Sensor Calibration
Demo Kit Manual • PUBLIC UG000400 • v5-00 • 2019-Nov-25 56 │ 16
5 Calibration
The spectral characteristic of a sensor varies in the specified range over series.
Other disruptions can be:
● Variances, deviations and limitations in technologies e.g. sensor and LED results shifts and
differences over time, temperature and lots;
● Variances in the diffuser material will cause a variate in absorption/emission/transmission;
● Little variations of Sensor filter peak sensitivity and shape of channels depending on thickness
tolerances in filter deposition (layers thickness of high plus low refracting index);
● Synchronous variation will shift the transmission function in maximum range of ±5nm;
● Asynchronous variation will deform the shape of spectral transmission and may change
the stop band performance (overcrossing);
● Variation of spectral shape because of tolerances of the aperture (device packaging and field of
view (FOV) of the system;
● Increasing the incidence angle or FOV will cause a transmission shift to shorter
wavelength and deform the shape of the spectral transmission function;
The sum of all errors adds up and leads to inaccuracies and strong differences from device to device.
On the other side, devices should have high accuracy, comparability, and repeatability over a long
period, independent of changing conditions. Therefore, a calibration is necessary which considers all
existing conditions and deviations. High accuracy measurement needs in the end a calibration to
increase spectral performance, repeatability, and comparability of the Sensor.
A spectral sensor calibration often consists of 2 phases.
In Phase 1, the Sensor raw data is corrected Sensor specifically to compensate known variations and
drifts during measurement. These can be, for example, corrections of temperature fluctuations, optical
and/or electronic offsets and constant deviations based on Sensor setups. The result of this step
represents the basis for the actual Sensor system calibration, which takes into account the
compensation of the device fluctuations.
For best performance and as step 2, a Sensor system “device-to-device” calibration (one device to
one specific target for calibration) is recommend, which respects all final device specific optical effects
in the special system and affects the spectral sensitivity in the application of this device.
Other calibration methods are possible, such as using a Golden Device as a calibration standard for
all Sensors of a series (Lot or Type calibration). This method usually requires less effort, but is usually
less accurate because the exemplary scattering is not considered.
There is no general solution for calibration. The calibration must always be adapted to the target, the
sensor, the application and its required accuracy and effort. In the following, some examples are
described.

Document Feedback AS7341 11-Channel Spectral Sensor Calibration
Demo Kit Manual • PUBLIC UG000400 • v5-00 • 2019-Nov-25 56 │ 17
With spectral Sensors, the calibration is depending on very much on the application, but in any case, it
has to realize a uniformity of the Sensors as well as the matching into the application and increasing
accuracy. The uniformity of the sensors is an identical sensor behavior in the application with
compensation of all production or system and ambient deviations.
For example, the Sensor measures the physical quantity via the references of the calibration and
Sensor results represent direct the concentration of a substance in percent (e.g. NTU as typical unit
for turbidity measurement). This requires a formula or reference where Sensor counts can be convert
direct into the concentration in percent. The Sensor response of the AS7341 consists of 10 numerical
values (without the flicker channel but using n=10 … CLEAR and NIR in calibration) or 8 numerical
values (only using n=8 filters in VIS) of the Sensor channels. Due to manufacturing and based on all
deviations in the system, the sensitivity of each channel can vary spectrally or absolutely.
A simple method to compensate these deviations is a simple correction of each channel ‘Ch’ with a
correction factor ‘Cor’ on a target. The software compares a selected target with the measured Sensor
value. Use deviations for all filters of both as a ratio and factor to correct each Sensor values for other
measurements. This is the method one-point-calibration (e.g. white or spectral balance). It is in the
AS7341 Evaluation Kit as correction factor in the Init_file.txt (see chapter 6.2).
Equation 1:
(
𝐶ℎ𝑅 𝐹1(𝑡)𝐶ℎ𝑅 𝐹2(𝑡)𝐶ℎ𝑅 𝐹3(𝑡)
⋮𝐶ℎ𝑅 𝐹𝑛(𝑡))
=
(
𝐶𝑜𝑟 𝐹1𝐶𝑜𝑟𝐹2𝐶𝑜𝑟𝐹3⋮
𝐶𝑜𝑟 𝐹𝑛)
∗
(
𝐶ℎ 𝐹1(𝑡)𝐶ℎ 𝐹2(𝑡)𝐶ℎ 𝐹3(𝑡)
⋮𝐶ℎ 𝐹𝑛(𝑡))
Figure 14:
Correction Factors in Init_file.txt
For a Spectral Reconstruction, a correction matrix is required that converts the Sensor signals with all
filter (e.g. 8 x VIS and NIR + CLEAR => 10) into a reconstructed spectrum according to the step width
(n) of the targets.
Equation 2:
(𝑆380𝑛𝑚
⋮𝑆1000𝑛𝑚
) = CM(𝐶𝑜𝑟 380𝑛𝑚 𝐹1… . 𝐶𝑜𝑟 380𝑛𝑚 𝐹𝑛
⋮𝐶𝑜𝑟𝑛 1000𝑛𝑚 𝐹1 …𝐶𝑜𝑟 1000𝑛𝑚 𝐹𝑛
) ∗ (𝐶ℎ 𝐹1(𝑡)
⋮𝐶ℎ 𝐹𝑛(𝑡)
)
The accuracy of transformation and spectral reconstruction depends on the quality of the coefficients
of the Correction Matrix CM, which have to be calculate by the calibration. This method can be used in
the AS7341 GUI by definition a calibration matrix (e.g. CM for ALS Light Detection – Light Detection
Calibration Matrix File = ‘CM_L1_v1_0_0.csv‘, see chapter 6.2).

Document Feedback AS7341 11-Channel Spectral Sensor Calibration
Demo Kit Manual • PUBLIC UG000400 • v5-00 • 2019-Nov-25 56 │ 18
Figure 15:
Calibration Matrix for Light Detection
The reconstructed Sensor spectrum must be matched into the CIE1931 Color Space or any other
application specific unit. That can be done very simple by overlapping (multiplying) the spectrum and
standard observer function CIE1931 XYZ. The result of this overlapping are the specific XYZ values
for the reconstructed spectrum, which can be calculated into xyz, xyY, CCT and other CIE1931 typical
results.
Figure 16:
Example: Matching Spectrum into the CIE1931 Color Space
Alternatively, the correction matrix can directly contain the calibration data (here rows) for X, Y and Z.
Calibration is then performed directly via CIE1931 XYZ Target Transformation.
Figure 17:
Example: Matching Spectrum direct into the CIE1931 Color Space
RAW Specrum
CM 1nm step size
Calibration
Spectrum
Matching
CIE1931OR
other reference
Application
XYZ, xyY, Lab, Luv
CRI, CCT, Lux
OR
other values
RAW Specrum
CM XYZ based
Calibration
Application
XYZ, xyY, Lab, Luv
CRI, CCT, Lux
OR
other values
WavelengthF1 F2 F3 F4 F5 F6 F7 F8 Clear NIR
380 0,19414 -0,03387 0,0095 -0,00185 0,001581 -0,00036 0,000774 -0,00028 -0,00695 -0,00025
381 0,19611 -0,03421 0,009596 -0,00187 0,001597 -0,00037 0,000782 -0,00028 -0,00702 -0,00025
382 0,19809 -0,03456 0,009693 -0,00189 0,001613 -0,00037 0,00079 -0,00029 -0,0071 -0,00025
… … … … … … … … … … …
999 0,022006 -0,00812 0,008504 0,003958 0,000851 0,005155 0,001194 0,006027 -0,00953 0,009512
1000 0,022066 -0,00821 0,008532 0,003926 0,000856 0,00513 0,001198 0,006007 -0,0095 0,009459

Document Feedback AS7341 11-Channel Spectral Sensor Calibration
Demo Kit Manual • PUBLIC UG000400 • v5-00 • 2019-Nov-25 56 │ 19
If, for example, the Sensor measures the concentration of a substance in a sample, the filter
function(s) or matrix must provide the corresponding data in the software for conversion. These data
must be available prior to matching from sample measurements during development (spectral
fingerprint) or as reference data from standards of the market. The result here is often one or more
mathematical functions or look-up tables, which convert the digits measured by the sensor directly into
a physical unit (Sensor matching), whereby the tolerances are also compensated (Sensor uniformity)
via sensor-specific correction variables.
The GUI for the AS7341 Evaluation Kit supports all calibration methods. The control takes place via
the input files for calibration. GUI uses the correction matrix (lines) to recognize the calibration
method, step size and other parameters specified by the user and considers this in the further
calculations and software outputs (see also chapter 6.2.2).
The GUI setup installs some files for calibration as examples. These installed calibration data are NOT
the result of a “generally accepted” device calibration with the highest accuracy for each device. If an
evaluation kit is used under conditions similar to those in the calibration, the maximum accuracy that
can be achieved is that of a type or batch calibration. Type/batch calibration is always performed by
calibrating a golden device (=typical sensor), which is used as a model for a number of sensors
(batch, type) for calibration. Its calibration data are used for all sensors of this type/batch without
paying attention to exemplary scattering and differences.
A Device Calibration considers all device specific realities, deviations and needs an individual
calibration process. It is always the target to achieve the highest accuracy. Therefore, use the pre-
installed database for type calibration and other spectral sensitive functions (SpectralMaskCompare,
color recognition) only to see form and example of these data and, if necessary, replace them by your
own application specific database for a device calibration.
Init_files control the database for calibration exists from alternative files for Light Detection and
Reflection Mode. In standard, the correction vectors or other parameters can be defined as default
‘1.0‘, i.e. by default no correction of the raw values takes place. In this case, use such parameters to
adapt Sensor functions. The file for the correction matrix Lighting contains a universal standard
calibration for matching the Sensor raw values in spectra for standard light sources. The values are
based on specified and calculated theoretical or typical filter curves and do not take into account any
device specific scattering of the actual Sensors. The standard calibration can be used limited for
demonstrations, but should be replaced by alternatives for higher accurate measurement and control.
Alternatives are target calibration for applications where the targets and conditions are constant.
Another method is a device calibration on the spectral filters as golden device calibration with
subsequent adjustment of the Sensors in series to the golden device. The methods are manifold and
strongly dependent on the application, requirements, and system conditions. The result is negatively
affected, for example, by step overlaps between light sources and filters, strong infrared components
of the light sources or spectral components where the Sensor has only a low or no sensitivity.
Figure 18 shows the reconstructed spectrum of an identical standard light source ‘INC A’, compared
spectrometer and Sensor results where the Sensor raw results were calibrated by using the General
calibration matrix and/or a (Golden) Device matrix. In this example, the result of the Device calibration
is better by a factor 5 (see also the application note AS7341_QG000139).

Document Feedback AS7341 11-Channel Spectral Sensor Calibration
Demo Kit Manual • PUBLIC UG000400 • v5-00 • 2019-Nov-25 56 │ 20
Figure 18 :
Results of Alternative Correction Matrices (left General, right Device Calibration)
The following figures shows processes of the alternative used calibration methods, which customer
can use by definitions in the initial files.
Figure 19:
From Spectral RAW Values to Recalculated Spectrum to CIE1931 XYZ Results
Measurements must be done to get all
parameters which affects accuracy and
uniformity (Gain error, temperature drift,
linearity, NIR disruption, offset, ).
Verification of a pre-series will result a
selection of one sensor as Golden
Device.
Determination of RAW values from the
Golden Device for White Balance (e.g.
Day Light) will define the target values
for White Balance.
Determination of Calibration Matrix for
Golden Device based on alternative
measured target values in comparison
to target values will result a general
correction matrix for this Golden Device
and a series.
RAW values series sensor
Tests in R&D
Golden Device
Correction Matrix
General Correction
Vectors
Correction Vector or White
Balance
Corrections must be done with RAW
values to balance gain error,
temperature changings, offsets and
other issues based on changed
conditions
Optional: Measure White (E.g. Day
light) and balance actual sensor RAW
data s to Golden Device .
Using a special AS7341 algorithm to
correct optical NIR overcrossing.
Matrix Multiplication with corrected
values and CM Is the reconstructed
spectrum of the measured probe.
The reconstructed spectrum will be
multiplied with the XYZ standard
observer function to get the target
specific XYZ Tri-stimulus values.
The chromaticity values xyz and other
CIE1931 based values can be
calculated by using standard formulas .
Xyz, Yxy, Lu v CCT, CRI, lx, ...
0,0000
0,0200
0,0400
430 530 630
GeneralSpectro
0,0000
0,1000
430 530 630
Golden DeviceSpectro

Document Feedback AS7341 11-Channel Spectral Sensor Calibration
Demo Kit Manual • PUBLIC UG000400 • v5-00 • 2019-Nov-25 56 │ 21
Figure 20:
From Spectral RAW Values to CIE1931 XYZ
Measurements must be done to get all
parameters which affects accuracy and
uniformity (Gain error, temperature drift,
linearity, NIR disruption, offset, ).
Verification of a pre-series will result a
selection of one sensor as Golden
Device.
Determination of RAW values from the
Golden Device for White Balance (e.g.
Day Light) will define the target values
for White Balance.
Determination of Calibration Matrix for
Golden Device based on alternative
measured target values in comparison
to target values will result a general
correction matrix for this Golden Device
and a series.
RAW values series sensor
Tests in R&D
Golden Device
Correction Matrix
General Correction
Vectors
Correction Vector or White
Balance
Corrections must be done with RAW
values to balance gain error,
temperature changings, offsets and
other issues based on changed
conditions
Optional: Measure White (E.g. Day
light) and balance actual sensor RAW
data s to Golden Device .
Using a special AS7341 algorithm to
correct optical NIR overcrossing.
Matrix Multiplication from corrected
values with CM
Matched XYZ values are the results of
the calibration.
The chromaticity values xyz and other
CIE1931 based values can be
calculated by using standard formulas .
Xyz, Yxy, Lu v CCT, CRI, lx, ...
Document Feedback AS7341 11-Channel Spectral Sensor Software
Demo Kit Manual • PUBLIC UG000400 • v5-00 • 2019-Nov-25 56 │ 22
6 Software
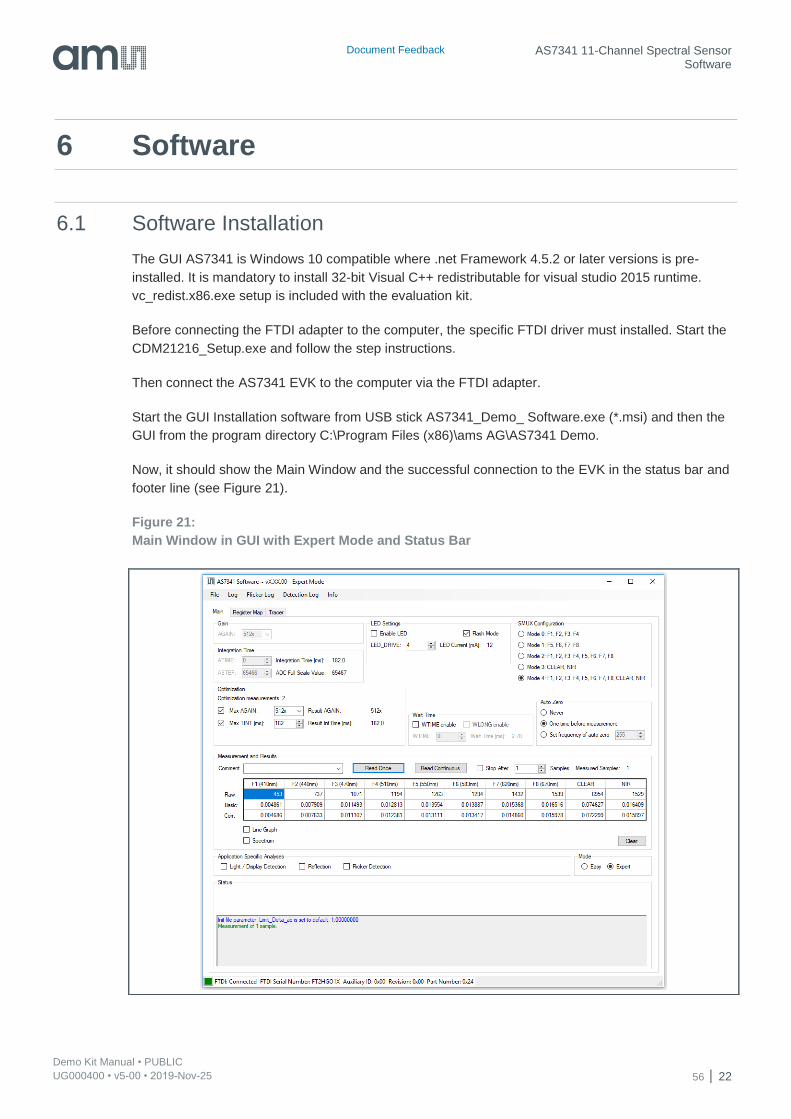
6.1 Software Installation
The GUI AS7341 is Windows 10 compatible where .net Framework 4.5.2 or later versions is pre-
installed. It is mandatory to install 32-bit Visual C++ redistributable for visual studio 2015 runtime.
vc_redist.x86.exe setup is included with the evaluation kit.
Before connecting the FTDI adapter to the computer, the specific FTDI driver must installed. Start the
CDM21216_Setup.exe and follow the step instructions.
Then connect the AS7341 EVK to the computer via the FTDI adapter.
Start the GUI Installation software from USB stick AS7341_Demo_ Software.exe (*.msi) and then the
GUI from the program directory C:\Program Files (x86)\ams AG\AS7341 Demo.
Now, it should show the Main Window and the successful connection to the EVK in the status bar and
footer line (see Figure 21).
Figure 21:
Main Window in GUI with Expert Mode and Status Bar

Document Feedback AS7341 11-Channel Spectral Sensor Software
Demo Kit Manual • PUBLIC UG000400 • v5-00 • 2019-Nov-25 56 │ 23
The GUI needs some initialization files, which will be installed during the setup in the user directory
c:\Users\user\AppData\Roaming\ams AG\AS7341 Demo\ (see Figure 22).
During the time of installation, the standard initialization files are generated in the folder UserData
(C:\Users\xxx\AppData\Roaming\ams AG\AS7341 Demo). In addition, each time the GUI checks
whether these standard files still exist in this area. If not, missing files are installed again by the GUI.
Consider to save the previously used initialization files if needed. For more details, see chapter 6.2.
Attention
A de-installation process will delete also standard initialization files. Therefore, make a backup or
copy of such files in case of using them after de-installation or use alternative file names for the
initialization files.
Figure 22:
User Directory with Initialization Files
6.2 Initialization Files
The initialization files (see Figure 22) supply important parameters for the GUI. Customer can adapt
these files but note, changings of any specified parameters in these files can affect the Sensor results
and accuracy dramatically. We recommend simulating any adaptations previously and making a file
backup of the initialization files before changing.
In standard, the initialization files5 are saved on hard disk in the directory
C:\Users\xxx\AppData\Roaming\ams AG\AS7341 Demo6 after installation the GUI:
● Init_file.txt - necessary for all GUI functions. It includes values to control functions and
limitations, e.g. Sensor signal correction, Light Detection.
● CM_x1_v1_0_0.csv – Correction matrices for x =L Light measurement
and x=R Reflection Mode.
● Mask_x_v1_0_0 – Database for x=’L’ SpectralMaskCompare (Light measurement)
and x=’R’ Color Recognition (Reflection Mode)
5 Change the AppData directory properties in case of the directory or subdirectories are not visible or read-only 6 Replace XXX by username

Document Feedback AS7341 11-Channel Spectral Sensor Software
Demo Kit Manual • PUBLIC UG000400 • v5-00 • 2019-Nov-25 56 │ 24
Comments are not considered by the GUI and can be done as any comment in all initialization files by
the characters ‘//’ in the beginning of a line.
All initialization files must be checked/adapted/changed before the GUI is running. The GUI will not
consider adapted parameters in these files by active running GUI. GUI will not change the Init_file or
Correction Matrix files but adapt or create Mask files in case of this function was selected and new
mask created and saved. Check own adaptations of these files if the GUI print out a syntax error. The
syntax and format of parameters is fixed and among them depending on the MS Windows region on
the used computer
6.2.1 Init_file
Init_file can include the following commands and parameters.
● XXXXXFile = xxxxxx.csv: are the standard or user defined files for calibration (see previous
section), spectral compare and other functions, which are used by the GUI as input files (in case
of none EEPROM hardware version). Otherwise, the GUI will generate a file selecting dialog to
select these files after choosing the application light or Reflection Mode.
In case of any AS7341 Demo with EEPROM on board (e.g. AS7341 Pen), the parameters from
the Init_file, correction matrix and spectral compare will be loaded from EEPROM.
● OffSet: can be used to adapt RawCounts (results from the analog-to-digital converter). The
specified values for the single channels F1…F8, Clear and NIR in the Init_file will be
added/subtracted from the measured RawCounts (calculated value from measured RawCounts,
Integration time and gain) before calculation into BasicCount.
Use the offset correction for example to compensate ambient light or other constant deviations.
Offset in Init_file refers only to all functions in the Basic window. Offset for ALS and Reflection
Mode is defined in the calibration data files separately. If not mention in calibration files, offset
will be used from Init_files. When offset values not defined in any of the files, default value zero
considered for each channels.
● CorrectionFactor - is to adapt RawCounts by multiplication the single CorrectionFactors. The
specified factors for the single channels F1…F8, Clear and NIR in the Init_file will be multiplied
with BasicCounts. Use this correction factor for customized calibration (see chapter 5), e.g. to
compensate effects of diffusers or other balance operations. Correction factor in Init_file refers
only to the functions in the Basic window. Correction factors for ALS and Reflection Mode is
defined in the calibration data files separately. If it is not mentioned in these files, it will choose
from Init_files. When correction factors are not defined in any of the files, the default value 1
taken for each channels.
● CorrectionGain – use it to correct Gain_Error in all GUI functions. The given numbers in the
installed initialization file are from data sheet. Customer should verify them and make an
individual gain correction in case of highest accuracy requirements. When correction
parameters for gain is not defined then in the Init_file, default value 1 taken for each channel.

Document Feedback AS7341 11-Channel Spectral Sensor Software
Demo Kit Manual • PUBLIC UG000400 • v5-00 • 2019-Nov-25 56 │ 25
● NIR_Correction - Activate the Dynamic NIR compensation algorithm for Light Detection and
SpectralMaskCompare – should be used for Light Detection but not for Reflection Mode. If not
declared in the file default value ON is taken into consideration from the main window.
● Corr_lx: conversion factor from Y (based on the calculated XYZ from corrected spectrum) to
Y(lx). This factor affects only the output of the results for Y(lx) in Light detection. If not stated in
the initialization file, default value is 683.
● Limit_mask: will limit the wavelengths for diagram output and SpectralMaskCompare. Lower
limit and upper limit of wavelength is considered. By default 381 is taken as lower limit and 781
is as upper limit.
● Limit_Compare: in percent is to stop the spectral comparison in case of no SpectralMask was
found with a difference smaller than the specified value compared with the actual measured
Sensor results. If it is not mention in the file default value 25 is taken into consideration.
● Delta_uv / LowerLimit_u / UpperLimit_u / UpperLimit_v / minCCT / maxCCT: specifies the
parameters, which are the conditions and limitations for CCT calculations in Light Detection.
These values affect direct the CCT calculation. When not mentioned in the Init_files default
value taken:
Deltauv = 0.2000, LowerUlimit = 0.1807, UpperUlimit = 0.3988, LowerVlimit = 0.3624,
UpperVlimit = 0.5408, MinCCT = 2000, MaxCCT = 7000

Document Feedback AS7341 11-Channel Spectral Sensor Software
Demo Kit Manual • PUBLIC UG000400 • v5-00 • 2019-Nov-25 56 │ 26
Figure 23:
Example for INIT_FILE.TXT
//Light detection calibration matrix file
LightDetectionCalibrationMatrixFile = CM_L1_v1_0_0.csv
//Light detection mask file
LightDetectionMaskFile = Mask_L_v1_0_0.csv
//Reflection calibration matrix file
ReflectionCalibrationMatrixFile = CM_R_v1_0_0.csv
//Reflection mask file
ReflectionMaskFile = Mask_R_v1_0_0.csv// Specify the masks for spectral compare
from wavelength to wavelength
limit_mask= 380, 780
//OffSet values decreases Basic values - reflection - daylight balance
//OffSet=14.68701168,4.431111111,1.7441773,1.493510912,0.831476535,0.575966812,0.5
34881552,0.522365412
// Correction factor of Raw values
CorrectionFactor=1,1,1,1,1.1,1.2,1.1,1,1,1
//Correction factor for gain error 0.5x,1x,2x,4x,8x,16x,32x,64x,128x,256x,512x
CorrectionGain= 1.0,0.998,0.995,1.001,0.969,0.994,0.990,0.988,0.998,0.977,0.958

Document Feedback AS7341 11-Channel Spectral Sensor Software
Demo Kit Manual • PUBLIC UG000400 • v5-00 • 2019-Nov-25 56 │ 27
// Activate the Dynamic NIR compensation for Correction in VIS based on NIR filter
to correct overcrossing from NIR
NIR_Correction= ON
//correction factor to correct Y as Lux from CIE1931 Y
corr_lx = 683
//distance du'v' White Curve and Sensor
Delta_uv= 0.2000
//Lower Limit of u'
LowerLimit_u= 0.1807
//Lower Limit of v'
LowerLimit_v= 0.3988
//Upper Limit of u'
UpperLimit_u= 0.3624
//UpperLimit of v'
UpperLimit_v= 0.543
//Limit of Delta ab
Limit_Delta_ab= 1.0
// Minimum CCT
minCCT= 1000
// Maximum CCT
maxCCT= 8000
//Stop Spectral compare in case of error(%) is greater than
limit_Compare= 50

Document Feedback AS7341 11-Channel Spectral Sensor Software
Demo Kit Manual • PUBLIC UG000400 • v5-00 • 2019-Nov-25 56 │ 28
6.2.2 Calibration_matrix_file
The Calibration matrices are CSV files, which include correction and calibration data for application
specific analyzes – ALS Light Detection and/or Reflection Mode:
● LEDCurrent = for calibration Reflection Mode, these values will be used for actual
measurements
● WaitTime: It is defined in the GUI as waiting time between two measurements in ms and
possible steps in 10ms increments. The function don’t use the WTIME (LONG) functions of the
AS7341 sensor chip.
● Offset = will reduce the ADC values (see also chapter 6.2.1)
● CorrectionFactor = Vector - will be used to balance the ADC values (see also chapter 6.2.1)
● Calibration matrix – will be used for calibration process by matrix multiplication
Note, here defined parameters replace the specified values from Init_file (see chapter 6.2.2).
The Calibration matrices are part of the software setup and represent general solutions for
demonstration AS7341 Evaluation Kits. They are based on the specified AS7341 filter definitions,
components on the Evaluation Kits and on the existed conditions during calibration. They do not
consider any real existing series deviations. Therefore, deviations in the Sensor results compared with
spectrometers are possible7.
Figure 24 shows a typical correction matrix file – here created for XYZ target calibration with offset –
correction, LED current settings and prepared correction vector.
The Calibration matrices can be based on:
● Simple balance algorithms by using the diagonal axe of CM[10:10]8;
Rows =10 x step sizes in nm; Columns = 10 filters of AS7341;
● Direct XYZ transformation by using a CM[3:8]
Rows =X,Y,Z; Columns = 8 VIS filters of AS7341;
● Spectral Reconstruction by using a CM[621:10]
Rows =621 steps between 380nm and 1000nm; Columns = 10 filters of AS7341;
Depending on the matrix CM, the algorithm for calibration converts the BasicCounts (Sensor results
F1…F8 + NIR/Clear) direct into corrected wavelength, XYZ coordinates or to an interpolated
spectrum.
7 Calibration, effort, and accuracy is always depending on the customer specific requirements. Use alternative calibration methods to increase accuracy in general. A device to target calibration, where Sensor and reference values are calculated to get the device specific Calibration matrix, will achieve the highest accuracy. A good compromise between effort and accuracy is use the general calculation matrix with a peak adjustment to a Golden device before. 8 Identical by using ‘Correction Factor=’ in Init_file-txt

Document Feedback AS7341 11-Channel Spectral Sensor Software
Demo Kit Manual • PUBLIC UG000400 • v5-00 • 2019-Nov-25 56 │ 29
Figure 24:
Correction Matrix File – Example for Target Calibration in Reflection Mode
6.2.3 Mask_files
A spectrum in ALS Light Detection can be used to detect the type of luminary or to calculate CIE1931
xyz, u’v’, Y (lux), CCT and CRI. In Reflection Mode, the result of comparison can be a recognized
and/or identified color in the CIE1931 color space. In all applications, the aim is to identify the
measured quantities in a set of defined masks. Such masks are defined in the files
Mask_x_v1_0_0_.csv.
These masks were predefined in a format, which must be also used in the calibration file (XYZ or
spectrum). The dimensions of the mask file are depending on the corrected Sensor values and
Calibration matrix CM. Changings in the CM makes necessary to adapt the mask file.
The process for SpectralMaskCompare is a simple algorithm based on ‘sum of square deviations”.
Each mask will be checked in its dimensions (wavelengths or tri-stimulus values) for deviations to the
actual Sensor values. The recognized result is the mask with the smallest deviation given in the mask
file OR the process will stop without recognition in case of all calculated deviations are greater than
limit_Compare from Init_file. It is possible to create or adapt the mask file in the GUI. For more details,
see chapter 6.9.
GUI uses the Calibration and Mask files from standard installation or selected by user with a pop up
selecting window (exclude EEPROM versions like Pen – see chapter 8.1).
User can teach or add also spectral masks in case of selection ALS or Reflection Mode. The new
spectral mask data are saved on to the previously selected mask .csv file.
LEDCurrent=9
OffSet=0.002444;0.007075;0.003559;0.010774;0.012211;0.014322;0.010946;0.008662
CorrectionFactor=1;1;1;1;1;1;1;1;1;1
CorrectionWhiteBalance=1.01;1.02;0.98
Wavelength;410;440;470;510;550;583;620;670
X;-370.0273523;65.10744143;59.9656346;-4.263315183;9.48780527;21.90377015;-
12.46664374;53.56187123
Y;-383.1813248;53.2951052;83.53207318;8.87444833;16.70486069;15.1545028;-
19.7717037;52.90998953
Z;-480.154549;148.7284495;91.76277547;-0.04161231;-2.876569144;12.63075412;-
33.429114;67.51650793

Document Feedback AS7341 11-Channel Spectral Sensor Software
Demo Kit Manual • PUBLIC UG000400 • v5-00 • 2019-Nov-25 56 │ 30
6.3 AS7341 EVM Graphical User Interface
Connect the AS7341 hardware to the system via a FTDI cable and double-click the software icon to
open the software GUI. If there are more than two FTDI cables connected to the computer, it would
popup the window as below Figure 25.
Figure 25:
Window for FTDI Cable Selection if Multiple FTDI Cable Connected
Please select the correct cable used for the Sensor Board and click ‘OK ‘. If there is only one FTDI
cable, the software will automatically select the connected cable.
When everything with the connection is fine, the bottom section in the GUI will display the positive
status of FTDI connection, FTDI cable series number, Sensor auxiliary ID, revision and part number.
Check the part number includes any 0x-code in case of any issues. A code 0x zero will point to a not
connected Sensor hardware. In case of an issue, check the USB driver installation and connections
start the software again or use the scan function in menu File.
6.4 Tab File
The GUI will automatically open, when launching the software. If no device is connected, an error
message will pop up.
The GUI starts showing a red indicator at the bottom section of the FTDI connection. Now connect a
device, navigate to the file tab in top corner of the GUI and click ‘Scan and Connect ‘. The GUI will
relaunch with the device connected. Use the Disconnect button to terminate the connection. Exit
Button to end the GUI application.
6.5 Hot Keys
The following hot keys are inserted in the GUI and are valid for all compatible hardware versions:

Document Feedback AS7341 11-Channel Spectral Sensor Software
Demo Kit Manual • PUBLIC UG000400 • v5-00 • 2019-Nov-25 56 │ 31
Figure 26:
EEPROM Commands for EEPROM Based AS7341 Eval Kits and Demonstrators
6.6 Sensor Board Test
To check the function of the EVAL KIT AS7341, start the measurement by pressing the Read Once
button (see figure: 24). One measurement step will be executed using Easy mode (see section 6.6). It
should show measured values in the table based on Sensor’s location to a luminary in front of the
Sensor and its spectrum in another window. Change the mode to Expert mode, adjust Integration
Time and AGAIN to change the digits based on application requirements.
More details about Sensor functions and the parameters are listed in Sensor’s data sheet or later in
this manual.
Select one of the plot options Line Graph or Spectrum (see Figure 26) to see the results as graphical
output. Table and diagrams show the RAW, Basic and Corrected Values (see section 6.7). Check the
given results on reasonableness and logic. Normally both in Easy and Expert mode by default, the
optimization for Gain and Integration time is switched-on. In case of Expert mode, optimization can be
turn off, to increase the parameters for conversion in case of zero digits or decrease in case of
saturation.
Figure 27:
First Sensor Board Test – Output of First Results in the Measurement Window
An increasing/decreasing should change the counts and values in the table or diagrams. Look for the
printed values and check them with the specified commands and parameters in the Init_file to look the
GUI works very well with all initialization files. Check always the stability of a test setup before the
actual measurements begin. Set the target to its minimum and maximum to check the required
Command Description
Ctrl + A Start detection logging
Ctrl + S Save detection logging
Ctrl + M Read a new calibration file
Ctrl + Z Make a screen shoot from a diagram

Document Feedback AS7341 11-Channel Spectral Sensor Software
Demo Kit Manual • PUBLIC UG000400 • v5-00 • 2019-Nov-25 56 │ 32
dynamic range. Make sure the parameter setup for Gain and Integration time is able to realize the full
dynamic range. Verify any potential drifts like temperature effects.
Information
For development reasons, various hardware platforms exist for the AS7341 EVK, for example with
and without temperature sensors on the sensor board. Therefore, the GUI can show more results
and details in the single windows than described here in this manual
6.7 Mode of Operation
The AS7342 GUI has two mode of operation – Easy and Expert Mode. By default, the Easy mode
initiated (see figure 25). User can switch mode using radio button to Export mode (see figure 25).
In Easy mode, most of the parameter setting are set automatically. The user has limited permission to
make modifications of parameter settings in Easy mode. The parameters like Gain, Integration time,
LED settings, SMUX configuration etc. are not possible to change in Easy mode. However,
optimization of Gain and Integration time is active during the Easy mode measurements. In addition,
Easy mode has limitation and restriction in Application specific Analyses windows.
Expert mode overcome all restriction in Easy mode. User could control all parameter setting in Expert
mode. In Expert mode, the optimization of max AGAIN and Max TINT to control the gain and
integration time is automatically turned off. Switch-on them manually to use it in Automatic mode. For
operating the GUI in expert mode by default, user can use AS7341 Demo Version.bat batch file with
the below command and execute the file in C:\Program Files (x86)\ams AG\AS7341 Demo or creating
a shortcut icon of this batch file in desktop. In addition, software version can be edited with this batch
file.

Document Feedback AS7341 11-Channel Spectral Sensor Software
Demo Kit Manual • PUBLIC UG000400 • v5-00 • 2019-Nov-25 56 │ 33
Figure 28:
Main Window in Easy Mode

Document Feedback AS7341 11-Channel Spectral Sensor Software
Demo Kit Manual • PUBLIC UG000400 • v5-00 • 2019-Nov-25 56 │ 34
6.8 Main Window
The Main Window in Expert mode contains the user interface with control buttons, fields, selection
boxes and output values for the identified device connected. The Main Window allows configuring the
AS7341 device and initializes the default setting to the devices. It allows the user to modify and
configure the Integration Time setting, Gain setting, LED setting, Auto zero, SMUX Configuration,
Dynamic gain and some application specific AS7341 functions and demos.
Information
The higher the counts, the better is the accuracy. Counts can be affected by changing Gain or TINT.
Both parameters will have different effects like FSR, noise, linearity’s, time, etc..
Integration Time (TINT): Integration Time is one parameter to affect the Sensor result = digital counts
or digits. The Integration Time affects direct the saturation (FSR 16 bit = 2^16 is reached for first time
at 182 ms = 2.78 µs * 2^16). The Integration Time is set using ATIME (0x81) and ASTEP (0xCA,
0xCB) registers. The Integration Time is displayed in millisecond. It is calculated using the equation -
𝑡𝑖𝑛𝑡 = (𝐴𝑇𝐼𝑀𝐸 + 1) × (𝐴𝑆𝑇𝐸𝑃 + 1) × 2.78 μ𝑠
The Integration Time parameter like the ATIME and ASTEP can be set by clicking the up or down
arrow button. ATIME sets the number of integration steps from 0 to 255. Set the Integration Time per
step in increments of 2.78 μs. ASTEP sets the Integration Time from 1 to 65534 steps. The default
configuration in GUI for these two registers are ASTEP = 0 and ATIME = 65534, which results in an
Integration Time of 182ms. The Sensor specification does not allow both settings –ATIME and ASTEP
– are set to ‘0 ‘.
Gain Setting (GAIN): Gain is the second parameter to affect the Sensor result = digital counts. The
Gain Control AGAIN allows the user access to the gain settings in the 0xAA Register (4:0 bits). The
gain amplifies the 6 integrated ADCs signal to increase sensitivity by switching to a higher gain value.
The gain options include 11 alternative gain stages between 0.5x and 512x. Select these options from
the list box when the down arrow is pressed.
Enable Optimization to switch-on an algorithm of the GUI, which analyzes sensor output and
parameter setup to find an optimal ADC parameter set for Gain and TINT by given maximal values. By
default this is ON in case of Easy Mode and OFF in case of EXPERT MODE.
Optimization of gain is enabled by checking Max AGAIN and denoting the maximum gain value to be
considered in the list box besides the checkbox. Similarly optimization of Integration time is enable by
checking Max TINT and mentioning the maximum value to consider in up down list.
WaitTime: It is defined in the GUI as waiting time between two measurements in ms and possible
steps in 10ms increments. The function don’t use the WTIME (LONG) functions of the AS7341 sensor
chip.
LED Setting (LED Current): If LEDs are mounted on the Sensor board for Reflection Mode; Enable for
switch-on the LED and set LED currents. The current can be set using the up-down control. It has a

Document Feedback AS7341 11-Channel Spectral Sensor Software
Demo Kit Manual • PUBLIC UG000400 • v5-00 • 2019-Nov-25 56 │ 35
range from 4 mA to 258 mA9. Activate Flash Mode if the LED is only switched-on during the
measurement process.
Auto Zero: Sets options and the frequency at which the device performs auto zero of the spectral
engines to compensate for changes of the device temperature
SMUX Configuration: The device integrates a multiplexer (SMUX). With the SMUX, it is possible to
map all available photo diodes to one of the six available light to frequency converter (ADC0 to ADC5).
After power up of the device, the SMUX needs to be configured before a spectral measurement is
started. Here the SMUX configured to three different modes where user can see the corresponding
selected channels in the selected mode.
Measurement Setting: Select ‘Read once’ or ‘Read Continuous’ to measure step by step or in
continuous mode (alternative with a specified number of steps) and/or to stop a continuous mode after
n steps. The ADC results are printed after each measurement as numeric values presenting RAW or
calculated BasicCounts or CorrectedValue.
RawCounts are represent the counts from the ADC depending on the used setup (SMUX
Configuration, OffSet, Gain, Integration time, LED-current etc).
The Basic Counts are calculated on base of the RAW measurement values and the corresponding
gain and Integration Time at that time to get Sensor results not depend on the parameter setup (gain,
TINT).
BasicCounts = (RawCounts - OffSet) / (gain * tint_ms)
Corrected counts are the results of calculations based on specified parameters in init_list, e.g.
‘Gain_Correction” or ‘CorrectionFactor’.
CorrCounts = BasicCounts * Gain_Correction * Correction_Factor
Select Line Graph or Spectrum if the sensor results as RAW, Basic or Corrected Counts should be
presented as diagrams. The diagram windows include some function to adapt the graphical output in
wavelength and data (see Figure 26). The diagrams can be saved on hard disk as bitmap file or any
other format by selection the key combination Ctrl + Z.
Corrections: Offset in main window can used to enable/disable the offset correction (see
chapter 6.2.1) or Correction Vector can used to enable/disable the correction vector (see
chapter 6.2.1). NIR COMPENSATION can be used to enable or disable the NIR compensation
correction.
STATUS is a user interface and shows the GUI messages and/or failure reports.
9 LED current and light intensity and/or maximal driver current is depending on the used LEDs and connected power supply. Check the LED data sheet before using this LED setting. A too high LED current can destroy LEDs.

Document Feedback AS7341 11-Channel Spectral Sensor Software
Demo Kit Manual • PUBLIC UG000400 • v5-00 • 2019-Nov-25 56 │ 36
Figure 29:
Sensor Results in Line Diagram and as Spectrum

Document Feedback AS7341 11-Channel Spectral Sensor Software
Demo Kit Manual • PUBLIC UG000400 • v5-00 • 2019-Nov-25 56 │ 37
6.9 ALS Light Detection
ALS (Ambient Light Sensing) Light Detection identifies type of light, max (peak), CCT, lx (Ev
illumination intensity), CRI, and other spectral and color results based on a reconstructed spectrum of
Sensor results. Checking the check box in main window and pressing “Read Once” will generate an
open browser window to select the Calibration files. After selecting the respective calibration files, the
function opens a new pop-up window and shows the results as vector, graphics (spectrum as list or
diagram or xy-oriented color point in CIE1931 color space), calculated CIE1931 results, and the
detected light source from the SpectralMaskCompare if this function is enabled.
Figure 30:
Pop-Up Window Light Detection by Spectral Light Comparison
These functions can be used exactly only with a calibrated Sensor for Light Detection (see chapter 5)
where the calibration matrix has been specially adapted to this application. Otherwise, results may be
inexact until irrational and illogical.

Document Feedback AS7341 11-Channel Spectral Sensor Software
Demo Kit Manual • PUBLIC UG000400 • v5-00 • 2019-Nov-25 56 │ 38
After opening the Light Detection, please start at minimum one measurement to activate and actualize
all data and results in Light Detection.
The left side of the pop-up window shows the sensor results as matrix between 380nm and 1000nm
with wavelength and reconstructed Sensor results. Data from this matrix can be copied direct to
another window tools by copy/paste commands.
On the top of the pop-up windows are the results of all CIE1931 calculations as Tristimulus values, xy
coordinates, Y, u’v’, CCT, Peak and CRI. All these results, calculated standard values and accuracy
are depending on application, its conditions, deviations, and other effects. For more details, see
chapter 6.2 or application notes for Sensor calibration. Figure 30 shows the results from sensor and its
derived color and photometric quantities in numerical form and as spectral diagram. Figure 31 has the
same result but presented graphical in CIE1931 color space.
All diagrams can be saved on hard disk as bitmap file by selection the key combination Ctrl + Z.
Figure 31:
Diagram CIE1931 Color Space and Printed Results for Light Detection

Document Feedback AS7341 11-Channel Spectral Sensor Software
Demo Kit Manual • PUBLIC UG000400 • v5-00 • 2019-Nov-25 56 │ 39
If Light Detection is enabled then the GUI find out the nearest spectrum as masks, which is similar to
the measured light, and its reconstructed spectrum. The comparison works based on normalization
procedures. The method of normalization is selectable (1, 0-1, Center and Average) and can influence
the results of the SpectralMaskCompare.
1-/0-Normalization is recommend for width peak/food point oriented light sources. Centroid or average
should be used for light sources, which includes small peaks.
In general, the measured and recognized results will have deviations. Non-overlapping curves indicate
such deviations. The reasons are different conditions in the setup for measurements, spectral
differences of light sources (measured and specified), and interferences by mixed lightings, any
tolerances, and drifts over time or shifts over temperature, different field of views and others. The
more similar the types and specimens of the light sources are between measurement and mask and
the smaller the deviations of the measurement conditions, the better the result of the comparison will
be.
If the GUI will not identify a spectral mask within the given accuracy from the Init_file then customer
can specify a new spectral mask by pressing Add Mask. This will add the spectrum of the measured
light source (not normalized) as new mask by a new defined name. This new mask will be active
temporary and is active until end of the program. The mask will be only inserted to the mask file by
using the Save button.
The GUI will not check any duplets in the mask file during all activities (read, add, save). Therefore, be
careful and check names and masks before changing.
The function Light Detection will not recognize a light source in case of none existing mask file but
works for the CIE1931 calculations.
Figure 32 shows the process for Light Detection from ADC Raw Counts up to the spectrum, the
CIE1931 CCT until mask compare as well as the usage in the GUI.

Document Feedback AS7341 11-Channel Spectral Sensor Software
Demo Kit Manual • PUBLIC UG000400 • v5-00 • 2019-Nov-25 56 │ 40
Figure 32:
Process Flow Light Detection
Setup
Measure Dark
or other effects
Corrected
BC NIR
ADC RAW
Counts
Basic
Counts
Mapped
with CM
Mapped
Sensor
results
Corrected
Offset
CM files
CIE1931
CCT
XYZ
Xy
CCT
...
= Mask? Mask file
Light type
Peak
...
Teach
Initial list
Measure
Step /
continues
ProtocolSpectral graph
repeat
Process Flow Light Detection
Setup
Gain / TINT
CM = Correction Matrix

Document Feedback AS7341 11-Channel Spectral Sensor Software
Demo Kit Manual • PUBLIC UG000400 • v5-00 • 2019-Nov-25 56 │ 41
6.10 Reflection Mode
Reflection Mode is prepared to measure a reflected light based on AS7341 Evaluation Kit Reflection
(see Figure 2). After setup all parameters to get optimized counts, the function can be opened by
selection ‘Reflection’ in the section Application Specific Analyzes. A new Popup window (see figure
30) will open which shows the CIE1931 calculated results XYZ, xy, Lab as numeric result and in the
xy-diagram. Similar to the light detection, after checking the checkbox for reflection select the
Calibration files for reflection. By default, LED setting are enabled in flash mode with a default current
of 110mA. This function uses only wavelength in VIS range (SMUX Configuration mode 2). Therefore,
Tristimulus values XYZ are the base for correction matrix and mask file for color recognition.
Figure 33:
Pop-Up Window Color Recognition by Reflection Mode
After opening the Reflection Mode, please start at minimum one measurement to activate and
actualize all data and results in Reflection Mode.

Document Feedback AS7341 11-Channel Spectral Sensor Software
Demo Kit Manual • PUBLIC UG000400 • v5-00 • 2019-Nov-25 56 │ 42
In Detection, the GUI shows the recognized color from the mask file (point 1 of the xy-diagram) with
the nearest distance (smallest Delta E or Delta ab or (Delta ab (min) plus Delta L(min))10) to the actual
measured sensor value (point 2 in the xy-diagram).
Add Mask will insert a new mask in the mask file based. This new mask will be active temporary and is
active until end of the program. The mask will be only inserted to the mask file by using the SAVE
button. Pressed button Update Mask will replace a detected existing reference mask values with the
current measured values.
6.11 Tab Log
The Log file is to store Sensor setup and data in a CSV data Excel format based on the Windows
Setup11. Click Start Logging and/or Stop Logging to select the samples and close up the process by
Save Log to store the CSV file and/or Clear Log to delete the sampled Log data. Tittle and content in
log files are different for ALS, light and reflection measurements.
Figure 34:
Example CSV Logfile Titles for Light Detection
6.12 Flicker Log
The Flicker Log functions are identical to the menu Log functions. The only difference is that they
solely store the Hardware and FIFO Flicker data.
6.13 Detection Log
This is for light and reflection detection logging. After enabling either Light or Reflection detection,
select the Start from Detection Log Tab or Ctrl + a in main window will ask to save a .csv file. After
each measurement user can save the user light source by pressing save each detection or Ctrl + s.
10 The algorithm searches for the mask with the lowest brightness difference in an extended ‘ab’ range. The radial extension of the "ab" range can be defined in the Init_list. 11 It can results issues in notations (point, semicolon, and coma) in combination with Wizards to convert text into numeric values and tables. Use a standard editor of windows to replace notations before processing with a wizard in case of such format issues.

Document Feedback AS7341 11-Channel Spectral Sensor Software
Demo Kit Manual • PUBLIC UG000400 • v5-00 • 2019-Nov-25 56 │ 43
A new pop up window asks to enter name of user light source and user can select whether the light is
detected or not.
6.14 Flicker Detection
Light sources may be modulated at different frequencies as their power supply this cause the flicker of
the light source. Usually, light sources such as fluorescent tubes or incandescent bulbs flicker at the
frequencies proportional to their power supply. AC flicker caused by an alternating current power
supply that has supplied power varies at a frequency of 50 or 60Hz.
The AS7341 device is integrated ambient light flicker detection on chip.
In the GUI, two types of flicker detection methods are implemented – Hardware and FIFO methods as
shown in the Figure below. This window will pop up when clicking the Flicker detection in main
window. This disables in the same time the ALS measurements in Main Window. Selecting the Flicker
Detection - Hardware checkbox enables the hardware flicker detection and disables the FIFO method
of flicker detection and vise versa.
Figure 35:
Flicker Detection – Hardware
By default, the hardware flicker detection is selected. The hardware flicker detection detects the
presence of 100 Hz and 120 Hz flickering. Read Once button displays the status of flicker in ‘Flicker
status‘. The corresponding bit in FD status register exhibited as FD Status Bits. Clicking the Read
Continuous button will keep updating the FD samples. If the Stop after checkbox selected and number
of samples mentioned, then the mentioned samples are measured upon pressing Read Continuous.
Samples taken shows the number of finished measurements.
On the other hand, the FIFO method of flicker detection is selected and Flicker detection default
integration time, gain and threshold are configured. Use the parameters gain and integration time to
adapt the measurement to application specific requirements by unchecking the Automatic checkbox.
The FD Integration Time can be set by clicking the up and down arrow or by setting a value and
pressing enter. The respective Integration Time is calculated based on the formula ((Fd_time
+1)*2.78) and displayed in ms. The Gain can be picked by choosing one of values 0.5x, 1x, 2x, 4x, 8x,

Document Feedback AS7341 11-Channel Spectral Sensor Software
Demo Kit Manual • PUBLIC UG000400 • v5-00 • 2019-Nov-25 56 │ 44
16x, 32x, 64x, 128x, 256x, and 512x from the selection list. Similarly, FD Threshold can be selected as
1, 4, 8 and 16. FD Time and FD Gain defines the sampling rate, amplitude of counts and the
maximum number of counts.
Click the Read Once button and Flicker detection graph is updated with current samples of FIFO data
bytes. The output of the flicker channel in counts (raw data) is plotted against the corresponding
sample the number in the primary Y-axis (left) and X-axis respectively (bottom) as the red colored
graph. Clicking the Read Continuous button will keep updating the FD samples. If the Stop after
checkbox selected and number of samples mentioned, then the mentioned samples are measured
beginning with pressing ‘Read Continuous‘. The phrase Samples taken shows the number of finished
measurements. In a single cycle, FIFO_Lvl samples gives the maximum number of FIFO entries (each
2 Bytes) read out either before the overflow flag goes high or the maximum sample taken is less than
250. The sample levels added up back to back on consecutive measurement. Sampling Frequency is
the reciprocal of the Flickering integration time. The maximum detectable frequency is half of the
sampling frequency. Maximum detectable and detected flicker frequency are shown below the graph.
FD Saturation flags show the status of the saturation flag bit like FIFO overflow, FD trigger,
FDSat_Analog and FDSat_Digital. At lower FD_TIME, the chance of getting FIFO overflow is more.
Fourier analysis converts a signal from its original domain (often used) to a representation in the
frequency domain. Selecting the FFT checkbox computes the Fast Fourier Transformation and
enumerates the discrete results graphically. The FFT plot represented in blue with the amplitude of
FFT in secondary Y-axis (top) and Frequency represented in the secondary X-axis (right). The Clear
button clears out the last measurement data and plot.

Document Feedback AS7341 11-Channel Spectral Sensor Software
Demo Kit Manual • PUBLIC UG000400 • v5-00 • 2019-Nov-25 56 │ 45
Figure 36:
Flicker Detection - FIFO

Document Feedback AS7341 11-Channel Spectral Sensor Software
Demo Kit Manual • PUBLIC UG000400 • v5-00 • 2019-Nov-25 56 │ 46
6.15 Register Mapping
The Register Table window lists and allows writing all I2C registers values with the address, the name
and information about authorization to read or write.
Figure 37:
Register Mapping Table
Click the Read values from Sensor button to update the whole table. It is recommend updating the
table when coming to or leaving this Window. Write a value to a register by clicking the Current Value
cell that corresponds to the register and typing a new value into the cell. The value will be saved only
temporary in the window. Click the Write values to Sensor button to send the value into the sensor
device. After the update, by clicking the Read values from Sensor button the value in the register is
refreshed and confirmed. Use the Save register table to make an external copy of all register and
values into a csv-file.

Document Feedback AS7341 11-Channel Spectral Sensor Software
Demo Kit Manual • PUBLIC UG000400 • v5-00 • 2019-Nov-25 56 │ 47
Information
The application synchronizes the changes on the Main Window and the Register Table Page
automatically.
6.16 Tracer
The Tracer controls the software process by using pre-designed scripts in txt format. Such scripts can
be loaded, saved, proceeded, or cleared. Log is a protocol function and cab be saved or cleared.
Figure 41 shows the Window Tracer with an example code for a pre-designed script with log.
The following commands are implemented in the actual Tracer function:
Load Script: read the pre-designed text file or saved script
Save Script: save the current script
Run Script: execute the current script,
Clear Script: delete the text of the script text box,
Save Log: save the current log (right text box) file,
Clear Log: delete the text of the log text box.
Execute read, write commands and pauses by using the following syntax:
Read: ‘R Register_Address ‘ or ‘r Register_Address ‘ (e.g. ‘R 80 ‘)
Write: ‘W Register_Address Register value ‘ or ‘r Register_Address Register value ‘ (e.g. ‘R 80 00 ‘)
Pause: ‘PAUSE Time_ms ‘ (e.g. ‘PAUSE 1000 ‘ -> A pause of 1000 ms)
#Comment: -> e.g. ‘# Reading register 0x80 ‘

Document Feedback AS7341 11-Channel Spectral Sensor Software
Demo Kit Manual • PUBLIC UG000400 • v5-00 • 2019-Nov-25 56 │ 48
Figure 38:
List of Tracer Command and Examples
Tracer Command Syntax Function Explanation Usage Example
R < Register Addr> To read out specified register R 80
W < Register Addr ><Value> To write mention value to specified register
W 80 01
Gain <Value> To set gain < 0.5x, 1x, 2x, 4x, 8x, 16x, 32x, 64x, 128x, 256x, 512x >
Gain 256
Inttime <Atime><Astep> To set integration time Atime <0 - 255> and Astep <1 - 65534>
Inttime 0 60000
Mode <Value> To select the mode of the SMUX configuration < 0, 1, 2, 3, 4 >
Mode 2
Autogain <On/off>
To enable/disable optimized gain for detecting optimized gain when a saturation of Raw value is reached
Autogain on
Autogain off
Ledon <Value> To enable led with a current
<0-127> Ledon 50
Ledoff To disable led and led current to default value
Ledoff
Openlog Openlog to start logging Openlog
Readsamples<> Samples measured continuously for the value times
Readsamples 5
Readtime < time in seconds> Read continuous measurement for given seconds
Readtime 10
Pause <value in ms> To set a delay of ms Pause 100
Savelog Saves the measured samples to .csv file
Savelog
Clearlog Clear the measured sample log Clearlog
# To comment out a line in tracer script
# r 60
# comment
Only if it will be supported from the hardware.
Ledleft<On/Off> Followed by ledon command. Command for switching left led on/off
Ledleft on
Ledleft off
LedTop<On/Off> Command for switching top led on/off
Ledtop on
Ledtop off
LedBottom<On/Off> Command for switching bottom led on/off
Ledbottom on
Ledbottom off

Document Feedback AS7341 11-Channel Spectral Sensor Software
Demo Kit Manual • PUBLIC UG000400 • v5-00 • 2019-Nov-25 56 │ 49
Information
Register address and register value are always specified as hexadecimal numbers without 0x.
Comments can be placed directly behind a command or in a new line. Upper and lower case is
neglected
Figure 39:
Tracer with Example in Script and Log Window

Document Feedback AS7341 11-Channel Spectral Sensor Error Messages List
Demo Kit Manual • PUBLIC UG000400 • v5-00 • 2019-Nov-25 56 │ 50
7 Error Messages List
Figure 40:
Error Message list
Error Message Explanations
Error during connecting the device:
An error occurred during connecting the FTDI device
Need to check the FTDI connection between the Sensor and the USB port and make sure that the FTDI cable or Sensor are not faulty
An error occurred during scanning for FTDI devices
Need to check the FTDI connection between the Sensor and the USB port and make sure that the FTDI cable or Sensor are not faulty
Analog Saturation: Intensity of ambient light has exceeded the max INT level for the spectral analog circuit
Indicates analog saturation, reduce the light intensity, Integration Time or gain to overcome the saturation
Digital Saturation: The maximum counter value has been reached
Indicates digital saturation, reduce the light intensity, Integration Time or gain to overcome the saturation. The maximum value range 65635 is reached
Digital and analog saturation has been reached Indicates both digital and analog saturation reached, reduce the light intensity, Integration Time or gain to overcome the saturation
Status SP_TRIG Error: WTIME is too short for the selected TINT
Spectral Trigger error: Indicates that there is a timing error. WTIME is too short for the selected ATIME. Increase the WTIME to overcome this issue
Error during reading the register value While reading the register value from the Sensor an error has been occurred
Error during setting Power On Error occurred set the PON bit in the Enable register (0x80). Disconnect the device and try again
Error during enabling or disabling the spectral measurement
Error during enabling or disabling the spectral Enable bit in Enable register (0x80)
Error during writing the configuration Error while writing the SMUX configuration
Error while starting the SMUX command Error while starting the SMUX command
An error occurred during enabling or disabling external LED
Setting the LED current produces an error
Status Over Temperature Detected: Device temperature is too high.
Over temperature detected, the device temperature is too high
Cannot detect the optimal gain. Please change the settings
The optimal gain was out of range, need change the settings for an optimal gain

Document Feedback AS7341 11-Channel Spectral Sensor Error Messages List
Demo Kit Manual • PUBLIC UG000400 • v5-00 • 2019-Nov-25 56 │ 51
Error Message Explanations
Unequal number of Correction factor in Init_file.txt The entered number of correction factor should be cross checked in Init_file
Error reading Light Detection light source matrix file:<file location >
Input string was not in a correct format
Crosscheck the corresponding file data. The data entered may be not in correct format or mismatching in the index
File Opened Error
Another process opens the log file to which the data is saved. Do not open the file between the measurement logging.
The Init_file was not found Make sure that the Init_file is in directory or with correct name, where the software files are installed as mentioned in chapter 6.2
Error opening the Init_file
Make sure that the Init_file is closed while operating the GUI. The changes made to Init_file should be saved and the software should be reopen to see the effect of changes
Error reading the Init_file
When the parameter in Init_file are not named correctly, no value is provided for a parameter, commented out or not in correct format and dimension, the corresponding parameter is selected from the default values. The Status box will displays this information with a blue status message.
Error opening <filename><file location> because it is used by another process
File not found or Save the changes made to file and close the file. In order to see the effects of change, close and reopen the GUI. Do not open the file while the software is running
CCT Out of Range During Light Detection, if the CCT calculated is out of range from the value defined in the Init_file.txt
Calculated Delta u'v' greater than given Delta u'v' During Light Detection, if the Delta u'v' calculated is greater than given Delta u'v' in the Init_file.txt
u' and v' not in limit During Light Detection, if the u' and v' calculated is not in the limit which is in Init_file.txt
An error occurred during writing the SMux configuration for FIFO Flicker detection
There was an error while configuring the SMUX for flicker detection
An error occurred during enabling or disabling Flicker Detection
Error occurred during the Fden bit in Enable register (0x80)
No samples were logged Take measurements for the process or saving data to log file
An overflow detected. Data has been lost in continuous measurement
Warning - An overflow detected. Data has been lost in continuous measurement

Document Feedback AS7341 11-Channel Spectral Sensor Error Messages List
Demo Kit Manual • PUBLIC UG000400 • v5-00 • 2019-Nov-25 56 │ 52
Error Message Explanations
Mask number is too big or Maximum number of mask entries reached
During writing the mask files to EEPROM the maximum limit of entry reached
Mask file contains wavelength that are not in calibration matrix file
Warning of not equal wavelength. Could use the mask compare even though they have different wavelength. But teach will overwrite old mask file with new wavelength entry
Header item: Wavelength or title was not found
In calibration file ‘wavelength’ is consider as the starting for calibration matrix, ‘Title’ is considered as starting for the reference file. If these are wrongly typed, the GUI generates an error
Unexpected line detected
When calibration or reference files does not have the expected number of values or error in the entry format. An empty matrix is considered in this case

Document Feedback AS7341 11-Channel Spectral Sensor Special Details for Other AS7341 Devices Using
the AS7341 Eval Kit GUI
Demo Kit Manual • PUBLIC UG000400 • v5-00 • 2019-Nov-25 56 │ 53
8 Special Details for Other AS7341 Devices Using the AS7341 Eval Kit GUI
The GUI supports further special forms of the AS7341 sensor as Demo and Eval Kit. Unless otherwise
stated, the details described here in this document also apply to these devices as far as possible.
Special and device application specific information is given in this chapter.
8.1 Additional Details When Using an AS7341 PEN with EEPROM
The sensor variant AS7341 PEN implements an EEPROM to save all Initialization, Calibration and
Mask files direct on the sensor device.
Therefore, these files must be loaded onto the EEPROM before they used for first time. A change of
the data on the EEPROM is direct not possible and only be realized by readout on disk, change on
directory and rewrite to EEPROM.
In AS7341 PEN, the data files are selected from EEPROM. The maximum Spectral mask entry for
light is 32 and maximum spectral entry for reflection is 500. Therefore, when writing the mask files
from the directory to the EEPROM, the mask data present in the first 32 columns in light mask
compare file and 500 columns in reflection mask file will be copied into EEPROM.
To teach or add more mask entries into PEN, limit the entry made during the writing process to
EEPROM. For example, if the light mask file contains 10 entries of spectral mask data, after writing
this file to EEPROM, the EEPROM still have possibility to add 22 spectral mask data in case of
lighting. Similarly, in case of reflection, if 50 entries were in the spectral mask for reflection file, after
loading this data to EEPROM, the EEPROM still have 450 entries space. Once the maximum number
of entries are reached in the PEN error message is generated upon adding new entries and this will
restrict new entry to EEPROM.
The EEPROM can be disabled to use the Initialization files from directory. Then, the GUI must be
restarted in order to be able to use the EEPROM again. All necessary EEPROM commands are listed
in Figure 41.
Figure 41:
EEPROM Commands for EEPROM Based AS7341 Eval Kits and Demonstrators
Command Description
Ctrl + E Initialize or Re-Write EEPROM with the files from directory
Ctrl + W Readout Initialization files from EEPROM to directory
Ctrl + D Disable EEPROM, GUI uses data directly from directory

Document Feedback AS7341 11-Channel Spectral Sensor Additional Documents
Demo Kit Manual • PUBLIC UG000400 • v5-00 • 2019-Nov-25 56 │ 54
9 Additional Documents
The following list includes a selection of available documents with more technical details for Sensor
and AS7341 Evaluation Kit. This list is not fixed and it is constantly changing. Ask us for new details.
[1] Sensor Data Sheet: AS7341_DS000504_NDA_1-00
[2] Application Note Diffuser Details: 2018-08-15__APN-opto-mechanics.pdf
[3] Application Note Flicker Measurement: AS7341_AN000605.pdf
[4] Application Note Hello World ‘: Overview to Sensor connection by using alternative interfaces
[5] Application Note SMUX configuration: AS7341 SMUX configuration
[6] Schematic Evaluation Kit: a0013a_CSS Evalboard AS7341_Basic.pdf
[7] 3D model and data of adapters (diffuser, backside)
[8] Application Note for White Balancing General Calibrated Sensors: AS7341_QG000139.pdf

Document Feedback AS7341 11-Channel Spectral Sensor Revision Information
Demo Kit Manual • PUBLIC UG000400 • v5-00 • 2019-Nov-25 56 │ 55
10 Revision Information
Changes from previous version to current revision v5-00 Page
V1-00 Initial version for release all
V2-00 Chapter 1.1 Aperture for diffuser 3
V2-00 Chapter 3.5 Software installation 14
V2-00 Tracer function 47
V2-00 Chapter 1.1 / 2 New Diffuser and adapter 3, 5
V3-00 Chapter 1.1,1.2,6.2,6.2.2,6.7,6.9.6.14 3-29
V4-00 Chapter 4, 5, 6, 8, 9 11-36, 47
V5-00 Chapter 3.3, 3.5 8-9, 12-13
● Page and figure numbers for the previous version may differ from page and figure numbers in the current revision.
● Correction of typographical errors is not explicitly mentioned.

Document Feedback AS7341 11-Channel Spectral Sensor Legal Information
Demo Kit Manual • PUBLIC UG000400 • v5-00 • 2019-Nov-25 56 │ 56
11 Legal Information
Copyrights & Disclaimer
Copyright ams AG, Tobelbader Strasse 30, 8141 Premstaetten, Austria-Europe. Trademarks Registered. All rights reserved. The material herein may not be reproduced, adapted, merged, translated, stored, or used without the prior written consent of the copyright owner.
Demo Kits, Evaluation Kits and Reference Designs are provided to recipient on an “as is” basis for demonstration and evaluation purposes only and are not considered to be finished end-products intended and fit for general consumer use, commercial applications and applications with special requirements such as but not limited to medical equipment or automotive applications. Demo Kits, Evaluation Kits and Reference Designs have not been tested for compliance with electromagnetic compatibility (EMC) standards and directives, unless otherwise specified. Demo Kits, Evaluation Kits and Reference Designs shall be used by qualified personnel only.
ams AG reserves the right to change functionality and price of Demo Kits, Evaluation Kits and Reference Designs at any time and without notice.
Any express or implied warranties, including, but not limited to the implied warranties of merchantability and fitness for a particular purpose are disclaimed. Any claims and demands and any direct, indirect, incidental, special, exemplary or consequential damages arising from the inadequacy of the provided Demo Kits, Evaluation Kits and Reference Designs or incurred losses of any kind (e.g. loss of use, data or profits or business interruption however caused) as a consequence of their use are excluded.
ams AG shall not be liable to recipient or any third party for any damages, including but not limited to personal injury, property damage, loss of profits, loss of use, interruption of business or indirect, special, incidental or consequential damages, of any kind, in connection with or arising out of the furnishing, performance or use of the technical data herein. No obligation or liability to recipient or any third party shall arise or flow out of ams AG rendering of technical or other services.
RoHS Compliant & ams Green Statement
RoHS Compliant: The term RoHS compliant means that ams AG products fully comply with current RoHS directives. Our semiconductor products do not contain any chemicals for all 6 substance categories, including the requirement that lead not exceed 0.1% by weight in homogeneous materials. Where designed to be soldered at high temperatures, RoHS compliant products are suitable for use in specified lead-free processes.
ams Green (RoHS compliant and no Sb/Br): ams Green defines that in addition to RoHS compliance, our products are free of Bromine (Br) and Antimony (Sb) based flame retardants (Br or Sb do not exceed 0.1% by weight in homogeneous material).
Important Information: The information provided in this statement represents ams AG knowledge and belief as of the date that it is provided. ams AG bases its knowledge and belief on information provided by third parties, and makes no representation or warranty as to the accuracy of such information. Efforts are underway to better integrate information from third parties. ams AG has taken and continues to take reasonable steps to provide representative and accurate information but may not have conducted destructive testing or chemical analysis on incoming materials and chemicals. ams AG and ams AG suppliers consider certain information to be proprietary, and thus CAS numbers and other limited information may not be available for release.
Headquarters
ams AG
Tobelbader Strasse 30
8141 Premstaetten
Austria, Europe
Tel: +43 (0) 3136 500 0
Please visit our website at www.ams.com
Buy our products or get free samples online at www.ams.com/Products
Technical Support is available at www.ams.com/Technical-Support
Provide feedback about this document at www.ams.com/Document-Feedback
For sales offices, distributors and representatives go to www.ams.com/Contact
For further information and requests, e-mail us at [email protected]