asian crisi-good report
TRANSCRIPT
8/8/2019 Asian Crisi-good Report
http://slidepdf.com/reader/full/asian-crisi-good-report 1/30
(1)
THE ASIAN FINANCIAL CRISIS AND WARNING INDICATORS – THEN AND NOW
DOMINICK SALVATORE AND FRED CAMPANO∗
This paper presents data on the financial crisis in East Asia that started in Thailand in July 1997
and then spread to other emerging Asian economies and the rest of the world, and the warning indicators that were used to predict that crisis. The causes of the current financial and economic
crisis in Asia are then examined as well as the reason that the same indicators could not predict
the current Asian crisis. Basically, Asian economies introduced significant structural changesafter the 1997–1998 crisis, which prevented a crisis similar to the one that afflicted them in
1997–1998. The current financial crisis in Asia was imported from abroad and resulted from a
contagion from the financial and economic crisis in the United States and other advanced nations when they sharply cut their imports and reduced their capital exports to Asian countries
and other emerging market economies.
I. I NTRODUCTION...................................................................................................................... 1 II.
THE 1997 FINANCIAL CRISIS IN EAST ASIA ........................................................................... 2
III. THE WARNING I NDICATORS OF THE 1997 FINANCIAL CRISIS IN EAST ASIA .......................... 5 IV. THE 2008 FINANCIAL CRISIS ............................................................................................... 12 V. WARNING I NDICATORS AND THE 2008 FINANCIAL CRISIS IN ASIA ...................................... 14 VI. STRUCTURAL CHANGES, WARNING I NDICATORS, AND THE CURRENT ECONOMIC CRISIS IN
ASIA .................................................................................................................................... 17 VII. CONCLUSIONS ..................................................................................................................... 19
I. I NTRODUCTION
The world is now in the midst of the deepest financial and economic crisis since the Great
Depression of 1929. The crisis started in the U.S. sub-prime mortgage market in 2006, it spread
to the entire U.S. financial system in 2007, and from there it spread to the U.S. real economy and
the rest of the world in 2008. This is the first global financial crisis of the 21st century.
∗ Dominick Salvatore is Distinguished Professor and Director of the Ph.D. Program in Economics at
Fordham University in New York. He is a fellow of the New York Academy of Science and past Chairman of its
Economics Section. He is consultant to the United Nations, International Monetary Fund and World Bank. He
published many books and articles in the leading economics journals.
Fred Campano is Professor of Economics at Fordham University. He completed his undergraduate and
graduate work at Stanford University in 1967 and worked for thirty years in the Economics Projections Section of
the Department of Economics and Social Affairs of the United Nations. He wrote several articles and a book on
income distribution with Professor Salvatore.
8/8/2019 Asian Crisi-good Report
http://slidepdf.com/reader/full/asian-crisi-good-report 2/30
2 EAST ASIA LAW REVIEW [Vol. 5: 1
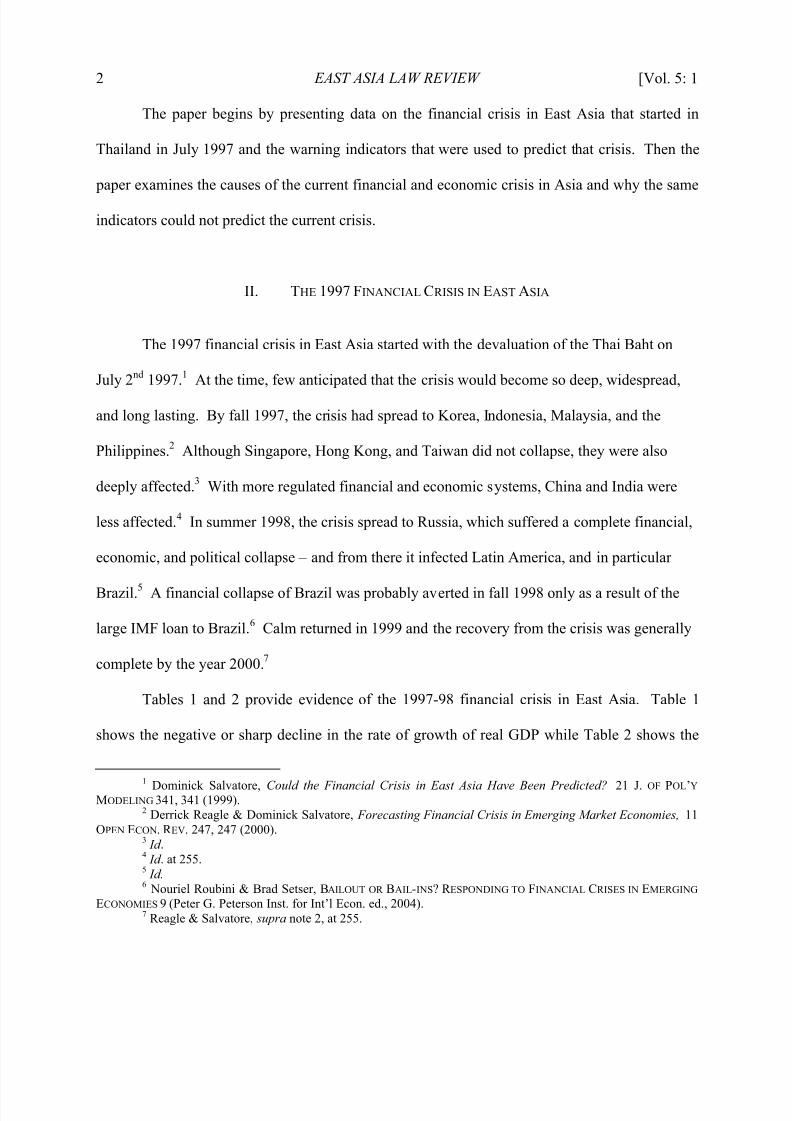
The paper begins by presenting data on the financial crisis in East Asia that started in
Thailand in July 1997 and the warning indicators that were used to predict that crisis. Then the
paper examines the causes of the current financial and economic crisis in Asia and why the same
indicators could not predict the current crisis.
II. THE 1997 FINANCIAL CRISIS IN EAST ASIA
The 1997 financial crisis in East Asia started with the devaluation of the Thai Baht on
July 2nd
1997.1
At the time, few anticipated that the crisis would become so deep, widespread,
and long lasting. By fall 1997, the crisis had spread to Korea, Indonesia, Malaysia, and the
Philippines.2
Although Singapore, Hong Kong, and Taiwan did not collapse, they were also
deeply affected.3
With more regulated financial and economic systems, China and India were
less affected.4
In summer 1998, the crisis spread to Russia, which suffered a complete financial,
economic, and political collapse – and from there it infected Latin America, and in particular
Brazil.5 A financial collapse of Brazil was probably averted in fall 1998 only as a result of the
large IMF loan to Brazil.6
Calm returned in 1999 and the recovery from the crisis was generally
complete by the year 2000.7
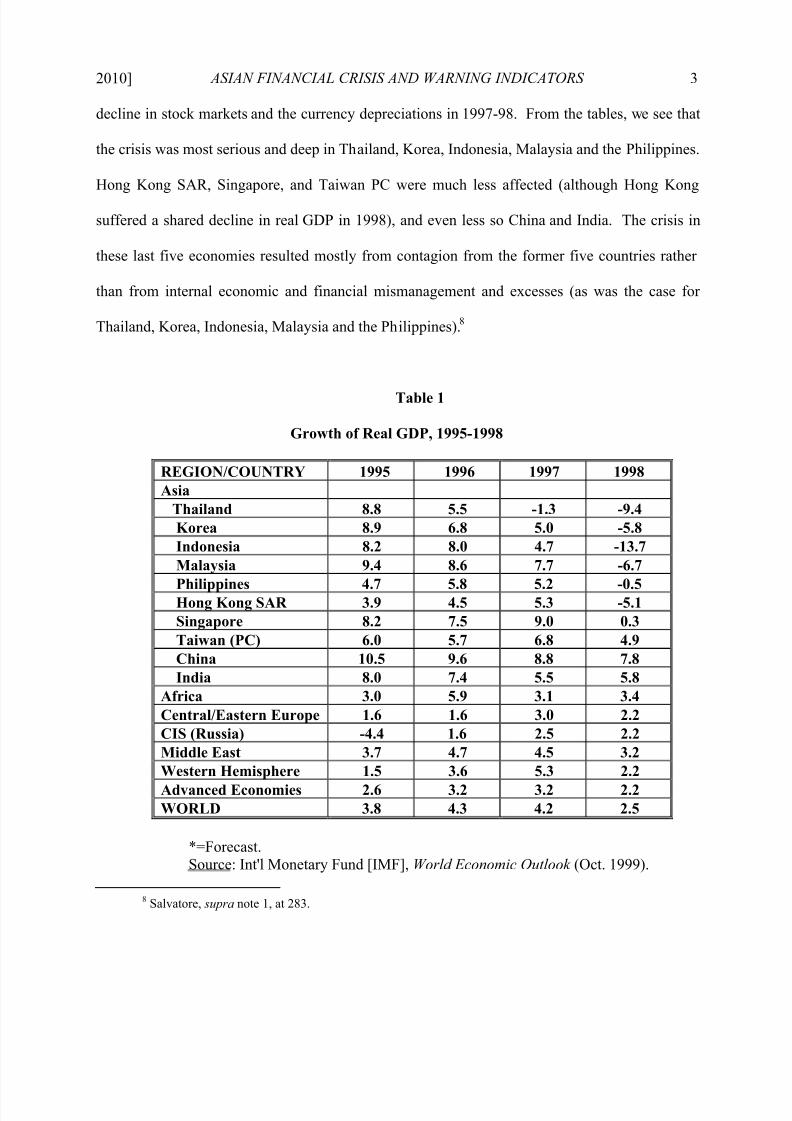
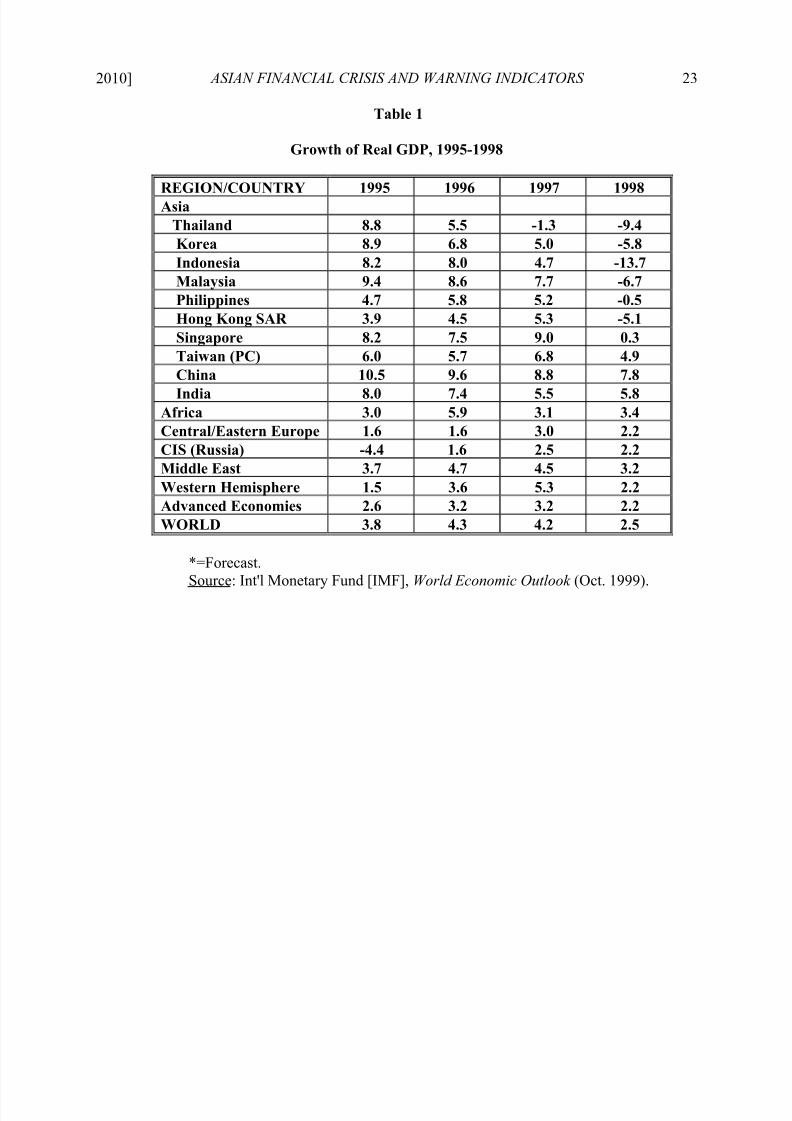
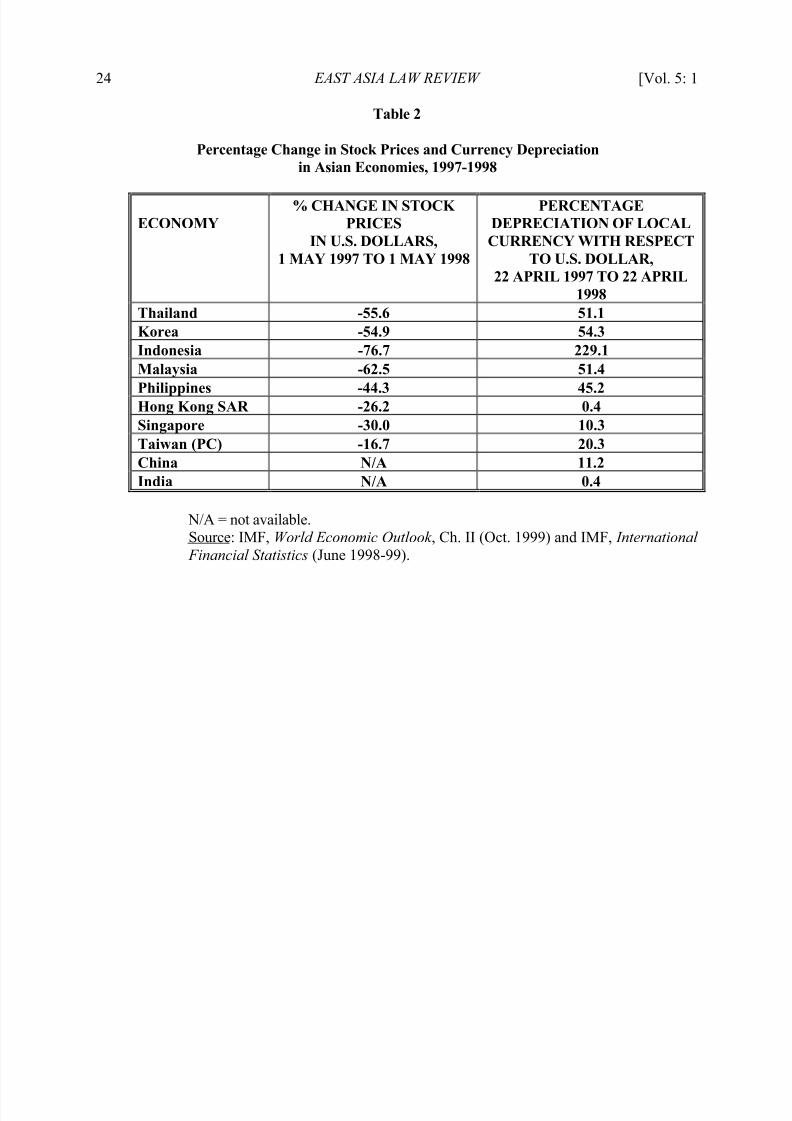
Tables 1 and 2 provide evidence of the 1997-98 financial crisis in East Asia. Table 1
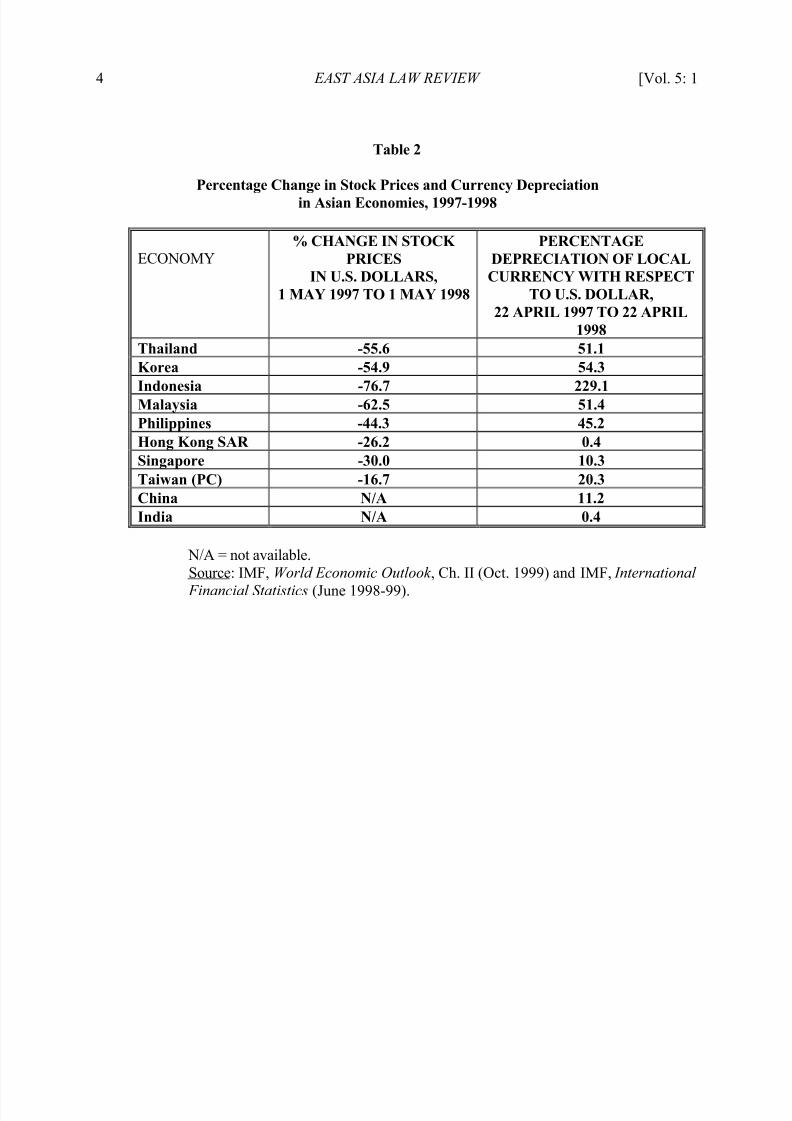
shows the negative or sharp decline in the rate of growth of real GDP while Table 2 shows the
1
Dominick Salvatore, Could the Financial Crisis in East Asia Have Been Predicted? 21 J. OF POL’YMODELING 341, 341 (1999).
2 Derrick Reagle & Dominick Salvatore, Forecasting Financial Crisis in Emerging Market Economies, 11
OPEN ECON. R EV. 247, 247 (2000).3 Id .4 Id . at 255.5 Id. 6 Nouriel Roubini & Brad Setser, BAILOUT OR BAIL-INS? R ESPONDING TO FINANCIAL CRISES IN EMERGING
ECONOMIES 9 (Peter G. Peterson Inst. for Int’l Econ. ed., 2004).7 Reagle & Salvatore, supra note 2, at 255.
8/8/2019 Asian Crisi-good Report
http://slidepdf.com/reader/full/asian-crisi-good-report 3/30
2010] ASIAN FINANCIAL CRISIS AND WARNING INDICATORS 3
decline in stock markets and the currency depreciations in 1997-98. From the tables, we see that
the crisis was most serious and deep in Thailand, Korea, Indonesia, Malaysia and the Philippines.
Hong Kong SAR, Singapore, and Taiwan PC were much less affected (although Hong Kong
suffered a shared decline in real GDP in 1998), and even less so China and India. The crisis in
these last five economies resulted mostly from contagion from the former five countries rather
than from internal economic and financial mismanagement and excesses (as was the case for
Thailand, Korea, Indonesia, Malaysia and the Philippines).8
Table 1
Growth of Real GDP, 1995-1998
REGION/COUNTRY 1995 1996 1997 1998Asia
Thailand 8.8 5.5 -1.3 -9.4Korea 8.9 6.8 5.0 -5.8Indonesia 8.2 8.0 4.7 -13.7Malaysia 9.4 8.6 7.7 -6.7
Philippines 4.7 5.8 5.2 -0.5Hong Kong SAR 3.9 4.5 5.3 -5.1Singapore 8.2 7.5 9.0 0.3Taiwan (PC) 6.0 5.7 6.8 4.9China 10.5 9.6 8.8 7.8India 8.0 7.4 5.5 5.8
Africa 3.0 5.9 3.1 3.4Central/Eastern Europe 1.6 1.6 3.0 2.2CIS (Russia) -4.4 1.6 2.5 2.2Middle East 3.7 4.7 4.5 3.2Western Hemisphere 1.5 3.6 5.3 2.2
Advanced Economies 2.6 3.2 3.2 2.2WORLD 3.8 4.3 4.2 2.5
*=Forecast.Source: Int'l Monetary Fund [IMF], World Economic Outlook (Oct. 1999).
8 Salvatore, supra note 1, at 283.
8/8/2019 Asian Crisi-good Report
http://slidepdf.com/reader/full/asian-crisi-good-report 4/30
4 EAST ASIA LAW REVIEW [Vol. 5: 1
Table 2
Percentage Change in Stock Prices and Currency Depreciationin Asian Economies, 1997-1998
ECONOMY% CHANGE IN STOCK
PRICESIN U.S. DOLLARS,
1 MAY 1997 TO 1 MAY 1998
PERCENTAGEDEPRECIATION OF LOCALCURRENCY WITH RESPECT
TO U.S. DOLLAR,22 APRIL 1997 TO 22 APRIL
1998Thailand -55.6 51.1Korea -54.9 54.3
Indonesia -76.7 229.1Malaysia -62.5 51.4Philippines -44.3 45.2Hong Kong SAR -26.2 0.4Singapore -30.0 10.3Taiwan (PC) -16.7 20.3China N/A 11.2India N/A 0.4
N/A = not available.
Source: IMF, World Economic Outlook , Ch. II (Oct. 1999) and IMF, International
Financial Statistics (June 1998-99).

8/8/2019 Asian Crisi-good Report
http://slidepdf.com/reader/full/asian-crisi-good-report 5/30
2010] ASIAN FINANCIAL CRISIS AND WARNING INDICATORS 5
III. THE WARNING I NDICATORS OF THE 1997 FINANCIAL CRISIS IN EAST ASIA
From 1996 to 1999 a large number of studies were published that tried to identify various
macroeconomic and financial indicators that might have predicted the crisis, and many more
were published afterwards.9
A very large number of indicators were tried, but only a few
fundamental ones work best and predicted or could have predicted the 1997 East Asian crisis.10
In this paper we want to go back to these fundamental warning indicators to see if they could
have predicted the current Asian financial crisis. These warning indicators are: (1) the current
account deficit as a percentage of GDP; (2) the long-term debt as a percentage of GDP; (3) the
short-term debt as a percentage of GDP; (4) the current account minus foreign direct investments
as a percentage of GDP; (5) the debt service in relation to the nation’s exports, and (6) the
number of months of imports that the nation can finance with its international reserves. Let us
briefly examine each of these warning indicators and define approximate critical values for each.
(1) The first fundamental warning indicator is the current account deficit. A current
account deficit larger than 4-5 percent of GDP is generally regarded as unsustainable and can
lead to turmoil in foreign exchange markets, devaluation of the nation’s currency, and general
9 See Reborto Chang & Andres Velasco, Financial Crises In Emerging Markets: A Canonical Model (Fed.
Res. Bank, Working Paper No. 98-10, 1998); Giancarlo Corsetti, Paolo Pesenti & Nouriel Roubini, What Caused the
Asian Currency and Financial Crisis? Part I A Macroeconomic Overview (Nat’l Bureau of Econ. Research,
Working Paper No. 6833, 1998); Jeffrey A. Frankel & Andrew K. Rose, Currency Crashes In Emerging Markets:
Empirical Indicators (Nat’l Bureau of Econ. Research, Working Paper No. 5437, 1996); IMF, World Economic
Outlook (Oct. 1999); Graciela L. Kamiski, Currency and Banking Crises: The Early Warning of Distress, (Board of Governors of Fed. Res. Sys., Int’l Fin. Discussion Papers No. 629, 1998); Graciela Kaminski, Saul Lizondo &
Carmen M. Reinhart, Leading Indicators of Currency Crises IMF Western Hemisphere Department (1997); and
more recently, Swati R. Ghosh & Atishi R. Ghosh, Structural Vulnerabilities and Currency Crises, 50 IMF STAFF
PAPER 481 (2003), Marcelle Chauvet & Fang Dong, Leading Indicators of Country Risk and Currency Crises: The
Asian Experience, 89 FED. R ESERVE BANK OF ATLANTA ECON. R EV. 25 (2004) (noting articles that analyzed
macroeconomic and financial indicators in predicting the financial crisis).10 Reagle & Salvatore, supra note 2, at 247. See also Derrick Reagle & Dominick Salvatore, Robustness of
Forecasting Financial Crises In Emerging Market Economies with Data Revisions – A Note, 16 OPEN ECON. R EV.
209 (2005).
8/8/2019 Asian Crisi-good Report
http://slidepdf.com/reader/full/asian-crisi-good-report 6/30
6 EAST ASIA LAW REVIEW [Vol. 5: 1
financial and economic crisis.11
In 1996, the current account deficit as a percentage of GDP was
7.9 for Thailand, 4.9 for Malaysia, 4.8 for Korea, 4.7 for the Philippines, and 3.3 for Indonesia.12
For the major Asian countries less affected by the 1997 crisis, Hong Kong and India had current
accounts deficits as a percentage of GDP of 3.9 and 1.6, respectively, while Singapore, Taiwan,
and China had current accounts surpluses (respectively, of 13.9, 10.9, and 0.9 as a percentage of
GDP).13
Thus, the current account deficit in 1996 correctly signaled a crisis to come in four out
of the five East Asian countries (Thailand, Korea, Malaysia and the Philippines) that in fact fell
into crisis the following year (i.e., in 1997). The exception was Indonesia.14
These warning
indicators also correctly signaled no crisis in the other countries that in fact did not fall into crisis
in 1997 (Hong Kong, Singapore, Taiwan, China, and India).15
(2) The second warning indicator is the size of the nation’s total foreign debt as a
percentage of the nation’s GDP. Experience indicates that any value above 30 percent or so can
spell future trouble if the nation is unable to service and eventually repay the debt.16
The size of
this indicator was 59.7 percent for Indonesia, 50.3 percent for Thailand, 47.3 percent for the
Philippines, and 42.1 percent for Malaysia, and 32.1 percent for Korea.17
Hong Kong and
Singapore had no external debt in 1996.18
There is no data for Taiwan, but it very likely also had
no external debt in 1996, while the external debt as a percentage of GDP was only 15.8 for China
11 Salvatore, supra note 1, at 343.12
Id .13 Id .14 See id . (showing Indonesia’s account deficit to be under 4 percent, which partly explains why Indonesia
did not experience an economic crisis).15 IMF, International Financial Statistics (1998), Ch. IV; World Bank, Global Development Finance
(1998), Ch. 2.16 Id.; Reagle & Salvatore, supra note 2, at 248.17 Id .18 Giancarlo Corsetti, Paolo Pesenti & Nouriel Roubini, What Caused the Asian Currency and Financial
Crisis? Part I: A Macroeconomic Overview, 32 (Nat’l Bureau of Econ. Research, Working Paper No. 6833, 1998).
8/8/2019 Asian Crisi-good Report
http://slidepdf.com/reader/full/asian-crisi-good-report 7/30
2010] ASIAN FINANCIAL CRISIS AND WARNING INDICATORS 7
and 22.5 for India.19
Thus, this indicator correctly indicated in 1996 the possibility of financial
and economic crisis in the five East Asian countries that actually fell into crisis in 1997, and also
correctly indicated no crisis for those economies that did not face the crisis.
(3) The third indicator is the percentage of the short-term debt to GDP. Experience also
shows that any value for this indicator above 8-10 percent can easily lead a country to financial
difficulty because of the ease and speed with which this type of foreign capital can be withdrawn
from the nation.20
In 1996, this percentage was 27.7 for Malaysia, 20.8 in Thailand, 14.9 in
Indonesia, 10.3 in Korea, and 9.1 in the Philippines, but zero for Hong Kong and Singapore (and
very likely for Taiwan) and only 7.5 for India but 19.7 for China.21 Thus, this indicator also
signaled in 1996 potential troubles down the road for the five East Asian countries that did fall
into crisis in 1997. Only for China did this indicator predict a crisis that did not come.
(4) The fourth fundamental warning indicator of a potential financial crisis is the
current account minus foreign direct investments as a percentage of GDP. A negative value for
this indicator measures the portion of the nation’s current account (as a percentage of the
nation’s GDP) financed by portfolio investment or “hot money” inflows.22
These can just as
easily and quickly flow out and plunge the nation into a financial crisis. Past experience shows
that any value of this indicator in excess of negative 2 or 3 percent of GDP (the current account
deficit minus the FDI inflow as a percentage of GDP) can lead to future trouble for the nation.23
The value for these indicators in 1996 was -21.7 for Korea, -5.6 for Thailand, -3.1 for the
19 Id .20 Reagle & Salvatore, supra note 2, at 249. E.g., Graciela Kaminsky, Saul Lazondo, & Carmen M.
Reinhart, Leading Indicators of Currency Crisis 4, 41 (IMF Working Paper No. 79, 1997) (explaining the general
methodology and efficacy of indicators that signal crises).21 Id .22 Dominick Salvatore, Capital Flows, Current Account Deficits, and Financial Crises in Emerging Market
Economies, 12 I NT’L TRADE J. 4, 12 (1998).23 Reagle & Salvatore, supra note 2, at 249.
8/8/2019 Asian Crisi-good Report
http://slidepdf.com/reader/full/asian-crisi-good-report 8/30
8 EAST ASIA LAW REVIEW [Vol. 5: 1
Philippines, but +0.7 for Malaysia and +3.0 for Indonesia, as well as +0.7 for India, +23.6 for
Singapore, and +51.1 for China.24
This means that in 1996 this indicator correctly predicted the
crisis in three (Korea, Thailand, and the Philippines) of the five East Asian countries that actually
faced a crisis in 1997. It also correctly predicted no crisis for the other Asian economies
(Singapore, China, and India; no data was available for Hong Kong and Taiwan) that in fact did
not face the crisis.
(5) The fifth indicator is the debt service on the foreign debt of the nation as a percentage
of the nation’s export earnings. The larger the proportion of the nation’s export earnings needed
to service its foreign debt, the more precarious is the position of the nation since there are many
other development claims on its foreign earnings.25
For example, in the years before the 1997
Asian crisis, Thai and Malaysian banks had borrowed heavily in dollars on the inter-bank market
and were unable to repay when the crisis erupted.26
There are no clear-cut figures for the value
of this indicator signaling possible financial difficulties for the nation. The value of this
indicator in 1994 when Mexico got into trouble in 1995 was 28.1 percent.27
Only Indonesia had
a higher value for this indicator in 1996 (36.8 percent).28
The other four East Asian countries
that fell into crisis in 1997 had much lower values in 1996, so that this indicator, by itself, could
not have been taken as a sign of potential future financial problems for these nations. The value
of this indicator was zero for Korea, Hong Kong and Singapore, 8.2 for Malaysia, 11.5 for
Thailand, 13.7 for the Philippines, 24.1 for India, and 32.3 for China.29
No data was available
for Taiwan.
24 Id .25 Id .26 Id .27 Id .28 Id .29 Id .
8/8/2019 Asian Crisi-good Report
http://slidepdf.com/reader/full/asian-crisi-good-report 9/30
2010] ASIAN FINANCIAL CRISIS AND WARNING INDICATORS 9
(6) The last warning indicator of potential financial crisis in an emerging market is the
average number of months of imports the nation could finance with the international reserves at
its disposal. This indicator is particularly relevant under a fixed exchange rate regime. A value
smaller than 3 or 4 can be regarded as dangerously low and a clear warning signal of possible
future financial problems.30
Of the five East Asian countries that actually faced a crisis in 1997,
only the Philippines had a lower value for this indicator in 1996 (2.8 percent).31
In 1996,
Indonesia had a value of this indicator of 4.4, Thailand 7.0, Malaysia 7.2, and Korea 14.6.32
The
value of this indicator was 3.9 for Hong Kong, 4.4 for India, 11.9 for Singapore, and 12.8 for
China.33 Thus, this indicator predicted a crisis only in Indonesia and maybe Hong Kong. No
data was available to Taiwan.
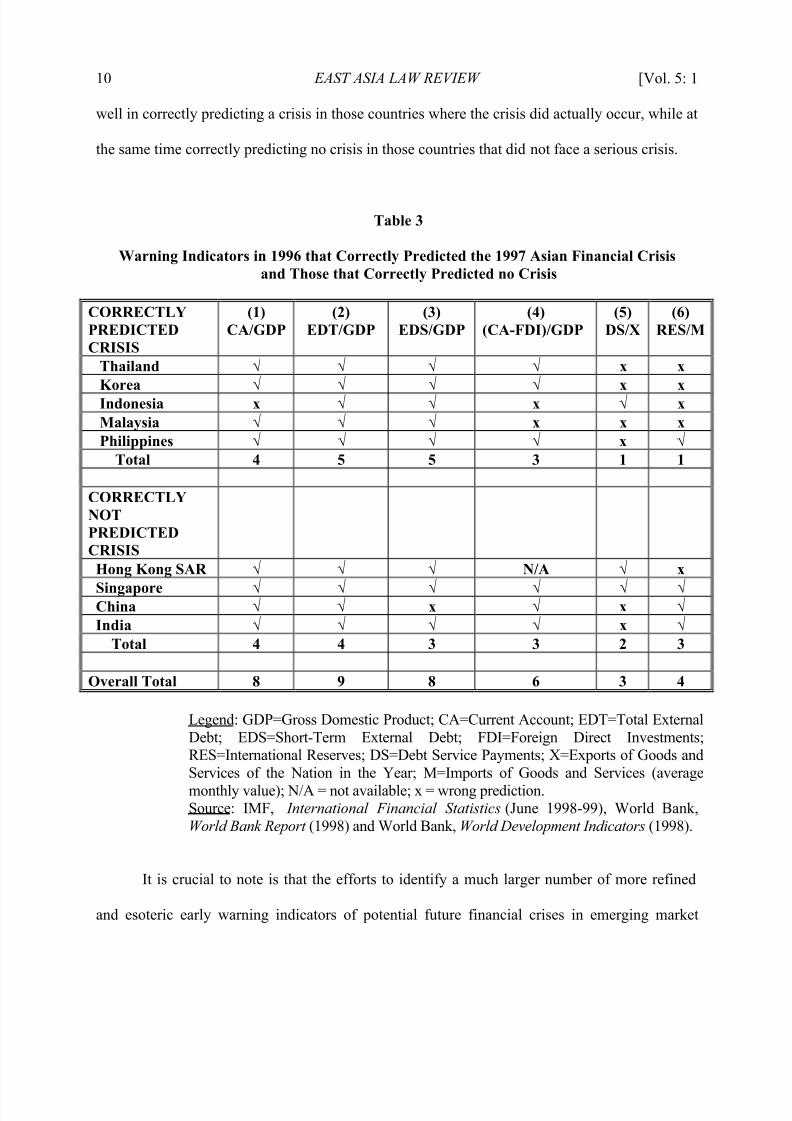
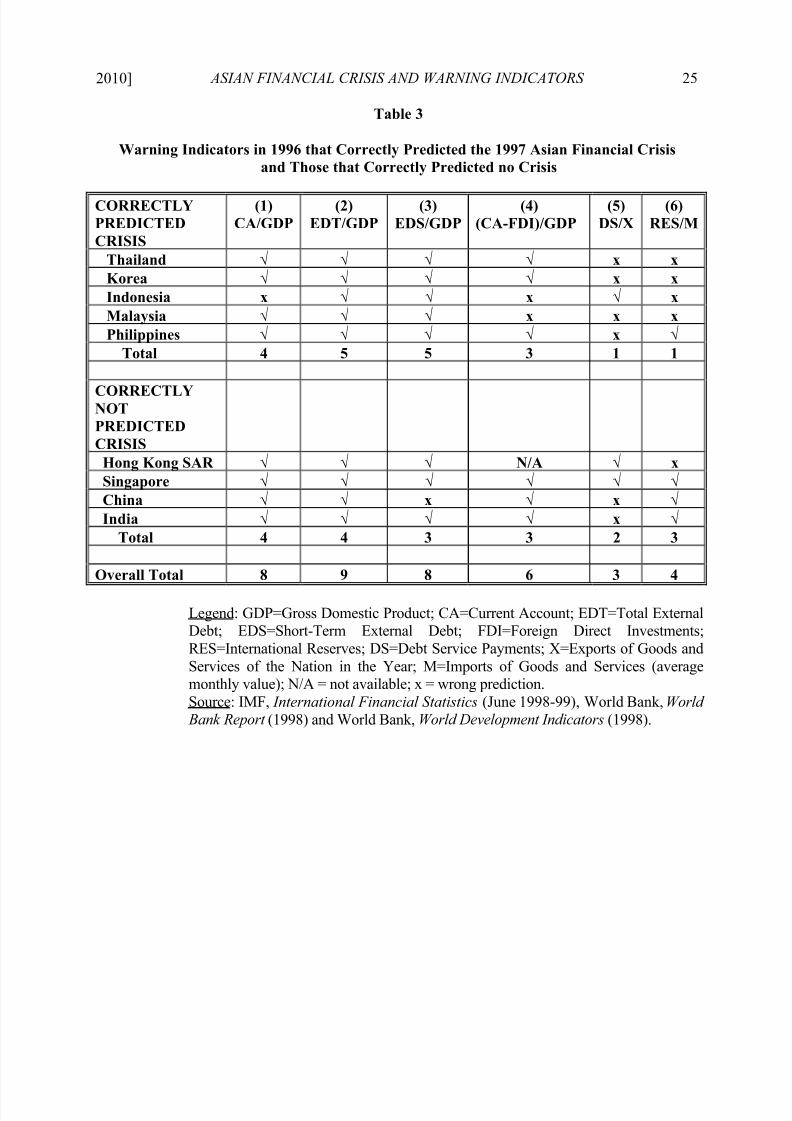
Table 3 summarizes the performance of each indicator in 1996. It incorrectly predicted
the crises that actually occurred in five East Asian countries (Thailand, Korea, Indonesia,
Malaysia, and the Philippines) in 1997 while correctly predicting the other major Asian
economies (Hong Kong, Singapore, China, and India) that avoided a serious crisis. As we can
see from the table, the total external debt as a percentage of GDP (EDT/GDP) indicator (2)
performed perfectly (being correct 9 out of nine times); the current account (CA/GDP) indicator
(1) and the short-term external debt (EDS/GDP) indicator (3) performed almost as well (being
correct 8 out of nine times), while the remaining three warning indicators (((CA-FDI)/GDP),
DS/X, and RES/M) did not perform as well (being correct, 6, 3, and 4 times, respectively). All
in all, we can say that the warning indicators (especially the first three) performed reasonably
30 Id .31 IMF, International Financial Statistics (2008).32 Id .33 Id .
8/8/2019 Asian Crisi-good Report
http://slidepdf.com/reader/full/asian-crisi-good-report 10/30
10 EAST ASIA LAW REVIEW [Vol. 5: 1
well in correctly predicting a crisis in those countries where the crisis did actually occur, while at
the same time correctly predicting no crisis in those countries that did not face a serious crisis.
Table 3
Warning Indicators in 1996 that Correctly Predicted the 1997 Asian Financial Crisisand Those that Correctly Predicted no Crisis
CORRECTLYPREDICTEDCRISIS
(1)CA/GDP
(2)EDT/GDP
(3)EDS/GDP
(4)(CA-FDI)/GDP
(5)DS/X
(6)RES/M
Thailand √ √ √ √ x x
Korea √ √ √ √ x xIndonesia x √ √ x √ xMalaysia √ √ √ x x xPhilippines √ √ √ √ x √
Total 4 5 5 3 1 1
CORRECTLYNOTPREDICTEDCRISISHong Kong SAR √ √ √ N/A √ x
Singapore √ √ √ √ √ √China √ √ x √ x √India √ √ √ √ x √
Total 4 4 3 3 2 3
Overall Total 8 9 8 6 3 4
Legend: GDP=Gross Domestic Product; CA=Current Account; EDT=Total External
Debt; EDS=Short-Term External Debt; FDI=Foreign Direct Investments;RES=International Reserves; DS=Debt Service Payments; X=Exports of Goods and
Services of the Nation in the Year; M=Imports of Goods and Services (average
monthly value); N/A = not available; x = wrong prediction.Source: IMF, International Financial Statistics (June 1998-99), World Bank,
World Bank Report (1998) and World Bank, World Development Indicators (1998).
It is crucial to note is that the efforts to identify a much larger number of more refined
and esoteric early warning indicators of potential future financial crises in emerging market
8/8/2019 Asian Crisi-good Report
http://slidepdf.com/reader/full/asian-crisi-good-report 11/30
2010] ASIAN FINANCIAL CRISIS AND WARNING INDICATORS 11
economies generally proved to be futile and unnecessary. All that their efforts provided was a
large number of additional but crisis-specific indicators of little general value and usefulness.
Furthermore, the six warning indicators presented and used above are very easy to measure and
broad enough to encompass many other indicators and less general ones.
For example, a great deal of effort is made to measure the degree by which an emerging
market currency might be overvalued. But many emerging market economies deliberately keep
their exchange rate overvalued so as to attract foreign capital as the counterpart of the current
account deficit. Thus, measuring the degree of possible overvaluation of the nation’s currency
does not provide the type of market information that is being sought. It is only if the
overvaluation is so large as to result in an unsustainable current account deficit that the nation
may get into difficulty. But this is exactly what our first or current account deficit as a
fundamental warning indicator tells us.
To be sure, no one can predict a crisis or its timing with certainty. The above warning
indicators (especially the first three), however, do seem to provide rough but useful early signals
that a nation is heading for a crisis. Some economists34
use two additional warning indicators as
predictors for financial crises in Latin America. These are the rate of savings of the nation as a
percentage of GDP and the budget deficit as a percentage of GDP. A rate of national savings too
low in relation to the investment opportunities and needs of an emerging economy can attract
enough capital from abroad to fill the shortfall. Too large a capital inflow, however, can lead to
trouble if it then is quickly withdrawn at the first sign of trouble in the nation. This is precisely
what happened in Mexico in 1994, which led to the 1995 crisis in the nation. Similarly a budget
34 See Salvatore, supra 21 (highlighting Salvatore’s work that includes two additional factors, the rate of
savings of the nation and budget deficit, in analyzing the financial crisis).
8/8/2019 Asian Crisi-good Report
http://slidepdf.com/reader/full/asian-crisi-good-report 12/30
12 EAST ASIA LAW REVIEW [Vol. 5: 1
deficit much larger than 3-4 percent of GDP can also lead to excessive borrowing abroad and a
crisis. This is in fact what got Brazil in deep trouble in 1998.35
But inadequate savings and excessive and unsustainable budget deficits were not the
cause of the 1997-98 crisis in East Asia. In fact, Asian countries (especially China and except
for the Philippines and India) generally save more than enough for their internal investment
needs and export a great deal of capital. Similarly, Asian countries do not have excessive budget
deficits and some have even surpluses. Therefore, savings and budget deficits did not need to be
used as fundamental warning indicators of possible crisis for Asian countries – the countries of
interest in this paper.
IV. THE 2008 FINANCIAL CRISIS
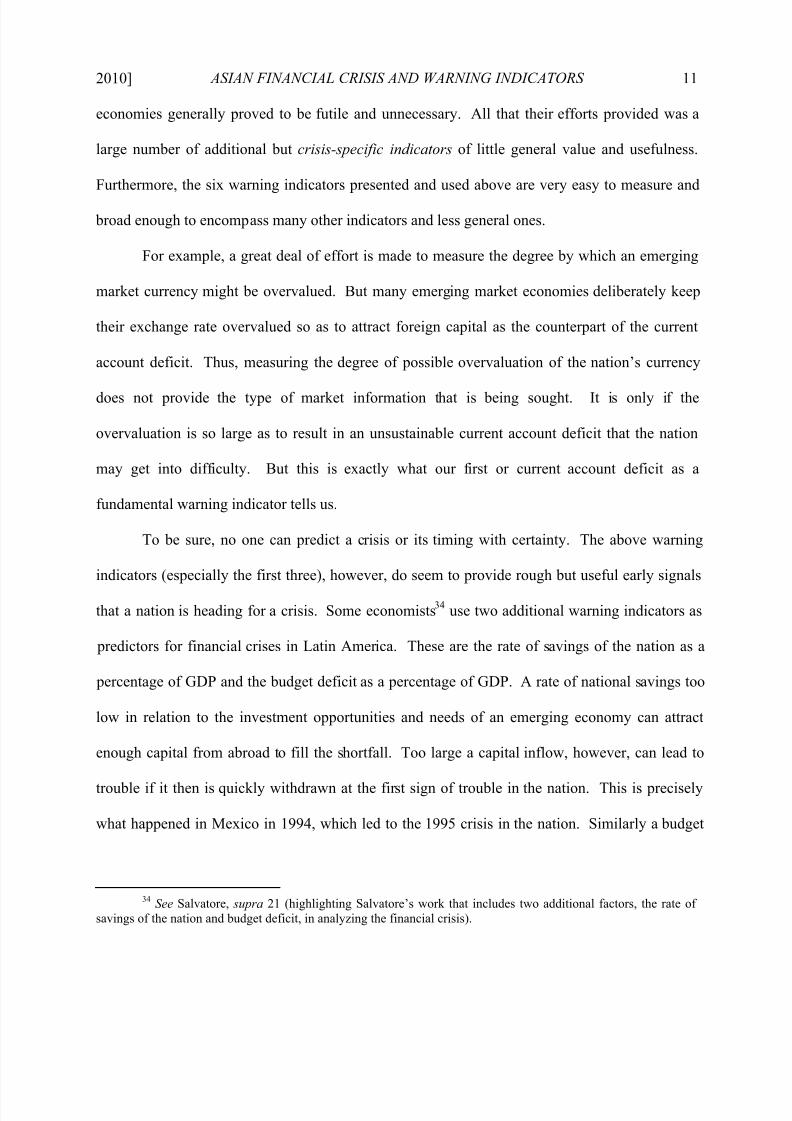
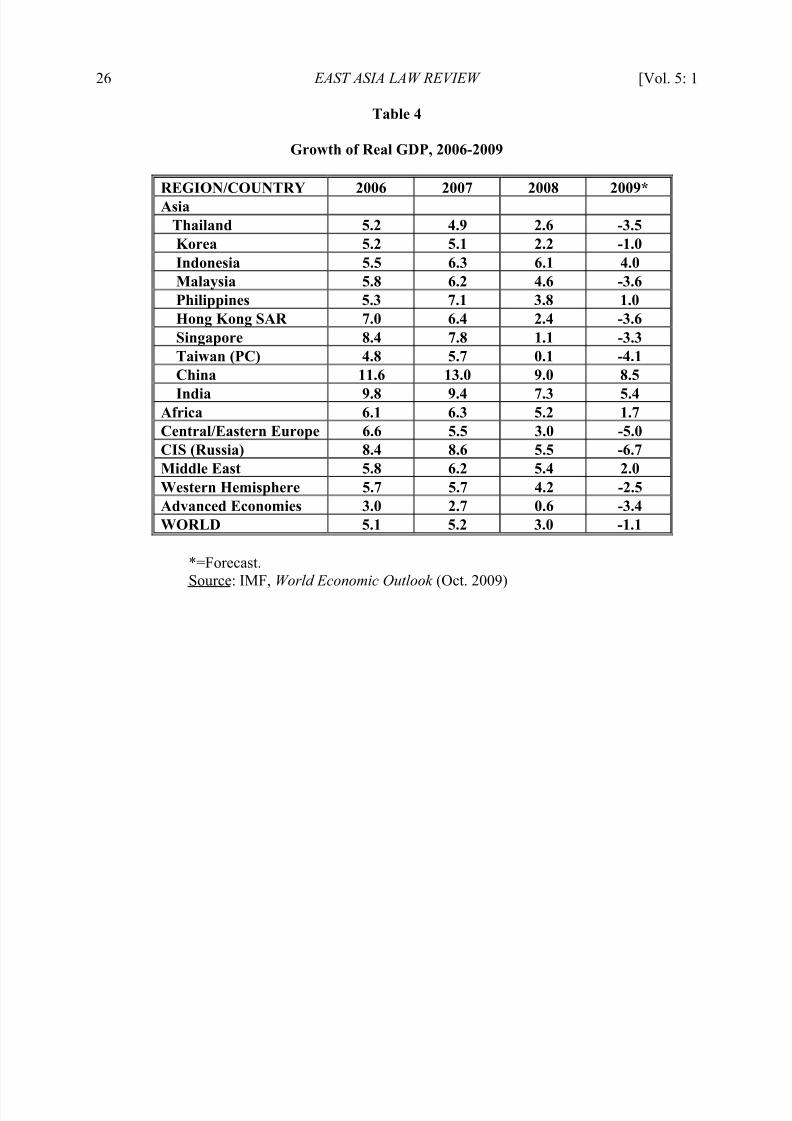
The recent global financial crisis was evidenced, among other things, by the sharp decline
in growth rates in 2008 and negative growth rates in 2009 in most countries and regions of the
world.36
Thailand, Korea, and Malaysia faced negative growth in 2009, but Hong Kong,
Singapore and Taiwan fared even worse with growth rates, respectively of -4.5, 10.0, and -7.5.37
Although both China’s and India’s growth rates were lower in 2009 than in 2008, they remained
relatively high.38
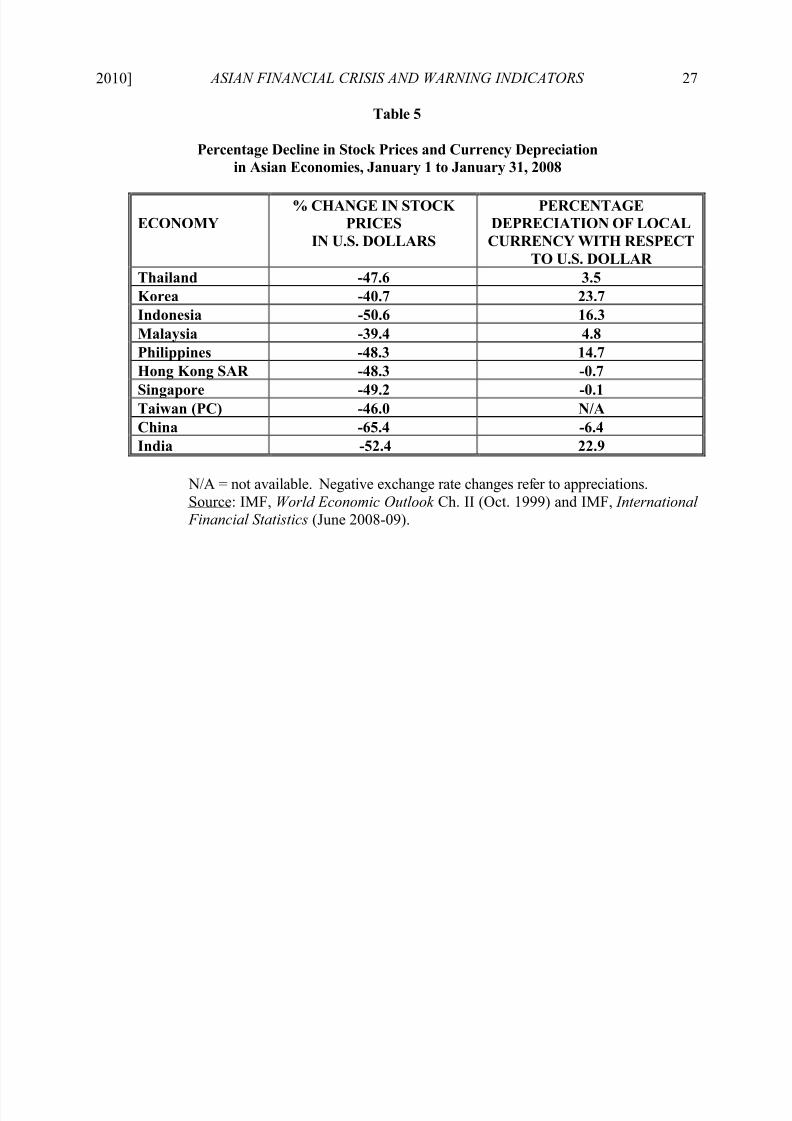
Table 5 shows that stock markets declined more or less by the same
percentages in 2009 as in 1998, but the currencies of most Asian economies did not depreciate as
much (with the Hong Kong dollar, the Singapore dollar, and the Chinese yuan actually
appreciating in 2009).39
35See Salvatore, supra 1, at 346.
36 IMF, World Economic Outlook at 71-75 (Apr. 2009).37 Id. 38 Id. 39 Id.
8/8/2019 Asian Crisi-good Report
http://slidepdf.com/reader/full/asian-crisi-good-report 13/30
2010] ASIAN FINANCIAL CRISIS AND WARNING INDICATORS 13
Table 4
Growth of Real GDP, 2006-2009
*=Forecast.
Source: IMF, World Economic Outlook (Oct. 2009).
Table 5Percentage Decline in Stock Prices and Currency Depreciation
in Asian Economies, January 1 to January 31, 2008
REGION/COUNTRY 2006 2007 2008 2009*Asia
Thailand 5.2 4.9 2.6 -3.5Korea 5.2 5.1 2.2 -1.0Indonesia 5.5 6.3 6.1 4.0Malaysia 5.8 6.2 4.6 -3.6Philippines 5.3 7.1 3.8 1.0Hong Kong SAR 7.0 6.4 2.4 -3.6Singapore 8.4 7.8 1.1 -3.3Taiwan (PC) 4.8 5.7 0.1 -4.1China 11.6 13.0 9.0 8.5India 9.8 9.4 7.3 5.4
Africa 6.1 6.3 5.2 1.7Central/Eastern Europe 6.6 5.5 3.0 -5.0CIS (Russia) 8.4 8.6 5.5 -6.7Middle East 5.8 6.2 5.4 2.0Western Hemisphere 5.7 5.7 4.2 -2.5Advanced Economies 3.0 2.7 0.6 -3.4WORLD 5.1 5.2 3.0 -1.1
ECONOMY% CHANGE IN STOCK
PRICESIN U.S. DOLLARS
PERCENTAGEDEPRECIATION OF LOCALCURRENCY WITH RESPECT
TO U.S. DOLLAR Thailand -47.6 3.5Korea -40.7 23.7Indonesia -50.6 16.3
Malaysia -39.4 4.8Philippines -48.3 14.7Hong Kong SAR -48.3 -0.7Singapore -49.2 -0.1Taiwan (PC) -46.0 N/AChina -65.4 -6.4India -52.4 22.9

8/8/2019 Asian Crisi-good Report
http://slidepdf.com/reader/full/asian-crisi-good-report 14/30
14 EAST ASIA LAW REVIEW [Vol. 5: 1
N/A = not available. Negative exchange rate changes refer to appreciations.
Source: IMF, World Economic Outlook Ch. II (Oct. 1999) and IMF, International Financial Statistics (June 2008-09).
V. WARNING I NDICATORS AND THE 2008 FINANCIAL CRISIS IN ASIA
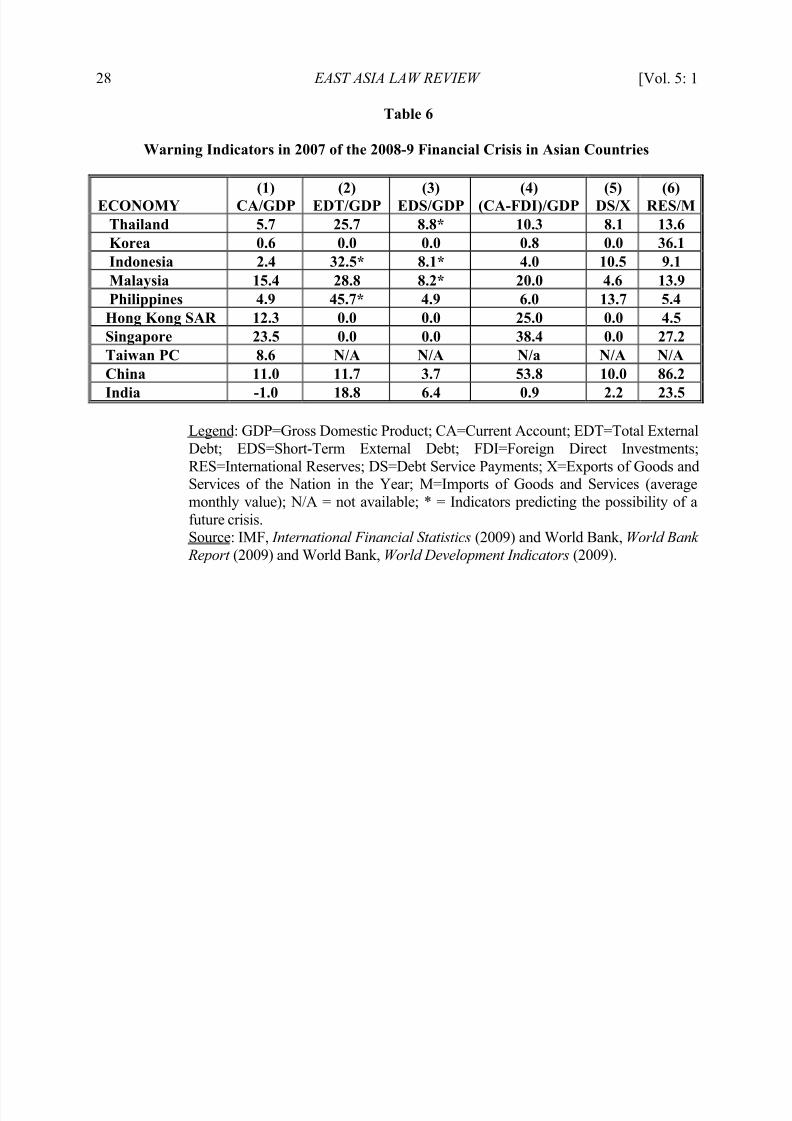
Table 6 shows the growth of real GDP from 2006 to 2009 (2009 forecasted) for the
individual Asian countries of interest, as well as other groups of countries, and for the world as a
whole. We saw in Section 3 that a current account deficit as a percentage of GDP (CA/GDP) in
excess of 4-5 percent is one warning indicator that a crisis may be imminent. From Table 6, we
see that all countries, except India, had a surplus in the current account and CA/GDP was only
-1.0 for India.40
Thus, according to this indicator, no crisis was imminent in any of the 11 Asian
countries shown in the table.
40 Id .; World Bank, World Bank Report (2009); World Bank, World Development Indicators (2009).
8/8/2019 Asian Crisi-good Report
http://slidepdf.com/reader/full/asian-crisi-good-report 15/30
2010] ASIAN FINANCIAL CRISIS AND WARNING INDICATORS 15
Table 6
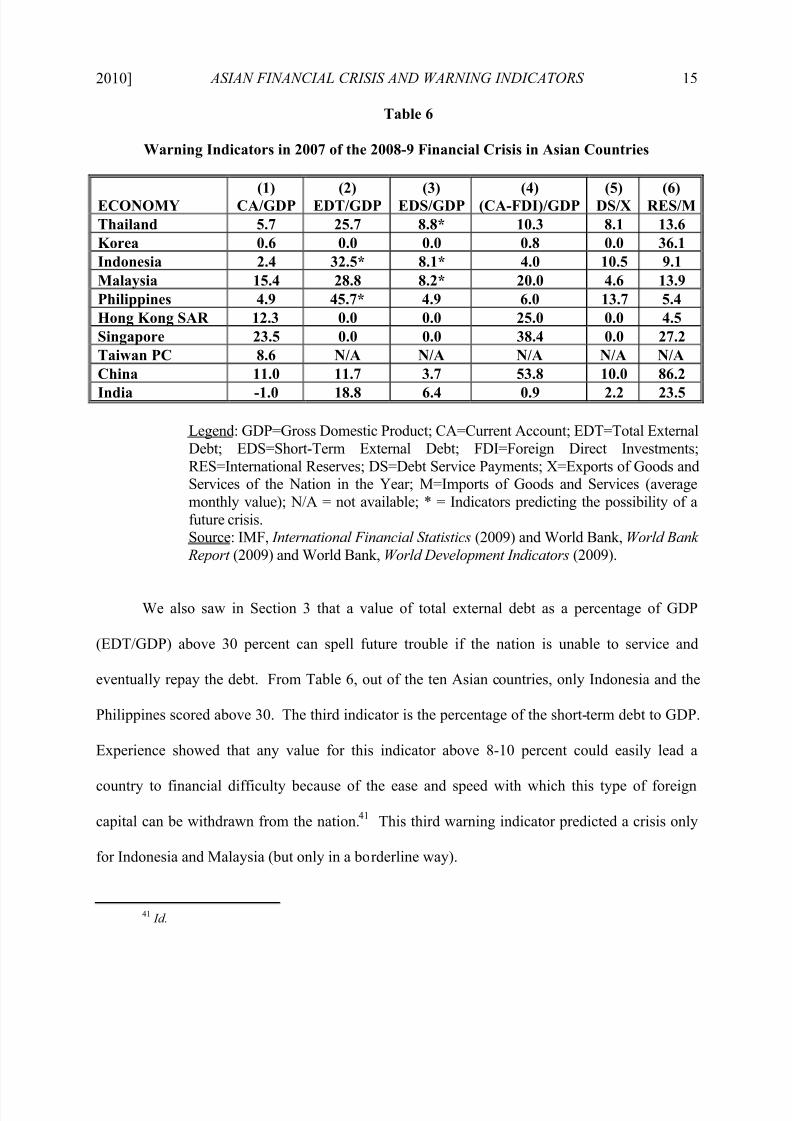
Warning Indicators in 2007 of the 2008-9 Financial Crisis in Asian Countries
ECONOMY(1)
CA/GDP(2)
EDT/GDP(3)
EDS/GDP(4)
(CA-FDI)/GDP(5)
DS/X(6)
RES/MThailand 5.7 25.7 8.8* 10.3 8.1 13.6Korea 0.6 0.0 0.0 0.8 0.0 36.1Indonesia 2.4 32.5* 8.1* 4.0 10.5 9.1Malaysia 15.4 28.8 8.2* 20.0 4.6 13.9Philippines 4.9 45.7* 4.9 6.0 13.7 5.4Hong Kong SAR 12.3 0.0 0.0 25.0 0.0 4.5Singapore 23.5 0.0 0.0 38.4 0.0 27.2Taiwan PC 8.6 N/A N/A N/A N/A N/AChina 11.0 11.7 3.7 53.8 10.0 86.2
India -1.0 18.8 6.4 0.9 2.2 23.5
Legend: GDP=Gross Domestic Product; CA=Current Account; EDT=Total External
Debt; EDS=Short-Term External Debt; FDI=Foreign Direct Investments;
RES=International Reserves; DS=Debt Service Payments; X=Exports of Goods andServices of the Nation in the Year; M=Imports of Goods and Services (average
monthly value); N/A = not available; * = Indicators predicting the possibility of a
future crisis.Source: IMF, International Financial Statistics (2009) and World Bank, World Bank
Report (2009) and World Bank, World Development Indicators (2009).
We also saw in Section 3 that a value of total external debt as a percentage of GDP
(EDT/GDP) above 30 percent can spell future trouble if the nation is unable to service and
eventually repay the debt. From Table 6, out of the ten Asian countries, only Indonesia and the
Philippines scored above 30. The third indicator is the percentage of the short-term debt to GDP.
Experience showed that any value for this indicator above 8-10 percent could easily lead a
country to financial difficulty because of the ease and speed with which this type of foreign
capital can be withdrawn from the nation.41
This third warning indicator predicted a crisis only
for Indonesia and Malaysia (but only in a borderline way).
41 Id.
8/8/2019 Asian Crisi-good Report
http://slidepdf.com/reader/full/asian-crisi-good-report 16/30
16 EAST ASIA LAW REVIEW [Vol. 5: 1
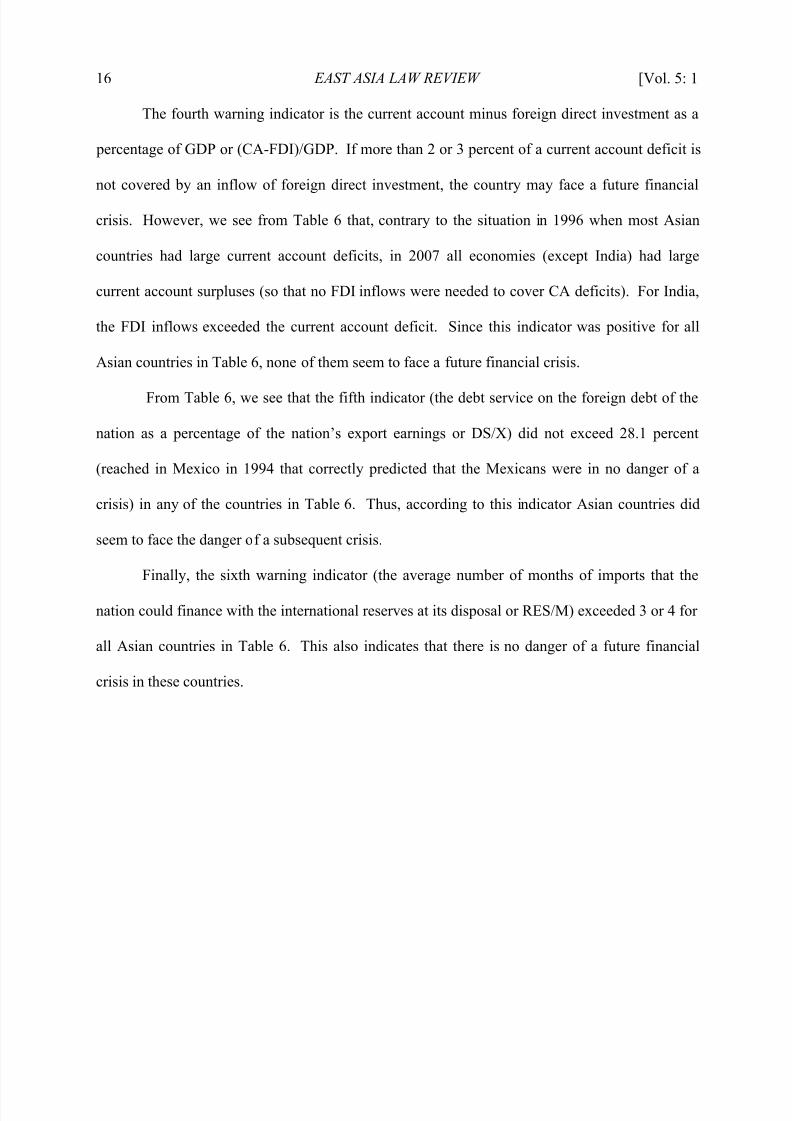
The fourth warning indicator is the current account minus foreign direct investment as a
percentage of GDP or (CA-FDI)/GDP. If more than 2 or 3 percent of a current account deficit is
not covered by an inflow of foreign direct investment, the country may face a future financial
crisis. However, we see from Table 6 that, contrary to the situation in 1996 when most Asian
countries had large current account deficits, in 2007 all economies (except India) had large
current account surpluses (so that no FDI inflows were needed to cover CA deficits). For India,
the FDI inflows exceeded the current account deficit. Since this indicator was positive for all
Asian countries in Table 6, none of them seem to face a future financial crisis.
From Table 6, we see that the fifth indicator (the debt service on the foreign debt of the
nation as a percentage of the nation’s export earnings or DS/X) did not exceed 28.1 percent
(reached in Mexico in 1994 that correctly predicted that the Mexicans were in no danger of a
crisis) in any of the countries in Table 6. Thus, according to this indicator Asian countries did
seem to face the danger of a subsequent crisis.
Finally, the sixth warning indicator (the average number of months of imports that the
nation could finance with the international reserves at its disposal or RES/M) exceeded 3 or 4 for
all Asian countries in Table 6. This also indicates that there is no danger of a future financial
crisis in these countries.
8/8/2019 Asian Crisi-good Report
http://slidepdf.com/reader/full/asian-crisi-good-report 17/30
2010] ASIAN FINANCIAL CRISIS AND WARNING INDICATORS 17
VI. STRUCTURAL CHANGES, WARNING I NDICATORS, AND THE CURRENT ECONOMIC CRISIS IN
ASIA
From the above, it seems that Asian countries should not have fallen into a crisis in 2008
and 2009. But they did. This, however, does not mean that the warning indicators are not
useful. As we have seen in Section 3 above, our warning indicators did a remarkably good job at
predicting the crisis in those Asian countries that did in face a crisis in 1997-98, while at the
same time (and for the most part) correctly predicting no crisis in those Asian economies that did
not face the crisis in 1997-98. But our warning indicators are useful in predicting a crisis of
domestic or internal origin—that is, when the nation faces serious structural problems, such as
excessive and unsustainable trade deficits, over-borrowing (especially of financial capital) and
other financial excess.
The current Asian crisis, however, has an entirely different origin. It resulted when
advanced nations got into trouble and faced deep recession and as a result sharply cut their
imports from and their capital exports to emerging markets.42
Contagion, not internal structural
imbalances, caused Asian economies to also face the current crisis. Most Asian economies seem
to have learned the hard lesson from the 1997-98 crisis and restructured their economies to avoid
excessive trade deficits, over-borrowing (especially of short-term volatile financial capital) and
other financial excesses, and sharply reduced their carry-on trade.43
These were not the causes of
the present Asian crisis. As a repercussion of and contagion from the crisis in advanced
42 IMF, supra note 35.43 The carry-on trade refers to the situation where the nation’s financiers and investors borrow short-term
funds in foreign currencies, such as dollars and yen, at the prevailing low interest rates abroad, and then invest those
funds in the real estate and other long-term investment at huge profits. If, however, the domestic currency
depreciates as a result of excessive and unsustainable trade deficits and borrowing, the investors are unable to repay
their foreign loans denominated in foreign currencies, banks fail or stop lending, what started out as a financial crisis
becomes a crisis of the real estate sector, dragging the economy into recession. This is in fact an important cause of
the 1997-8 East Asian crisis.
8/8/2019 Asian Crisi-good Report
http://slidepdf.com/reader/full/asian-crisi-good-report 18/30
18 EAST ASIA LAW REVIEW [Vol. 5: 1
countries, the crisis currently facing Asian economies is both much less severe than in 1997-98
and less severe than the crisis currently facing advanced economies countries.44
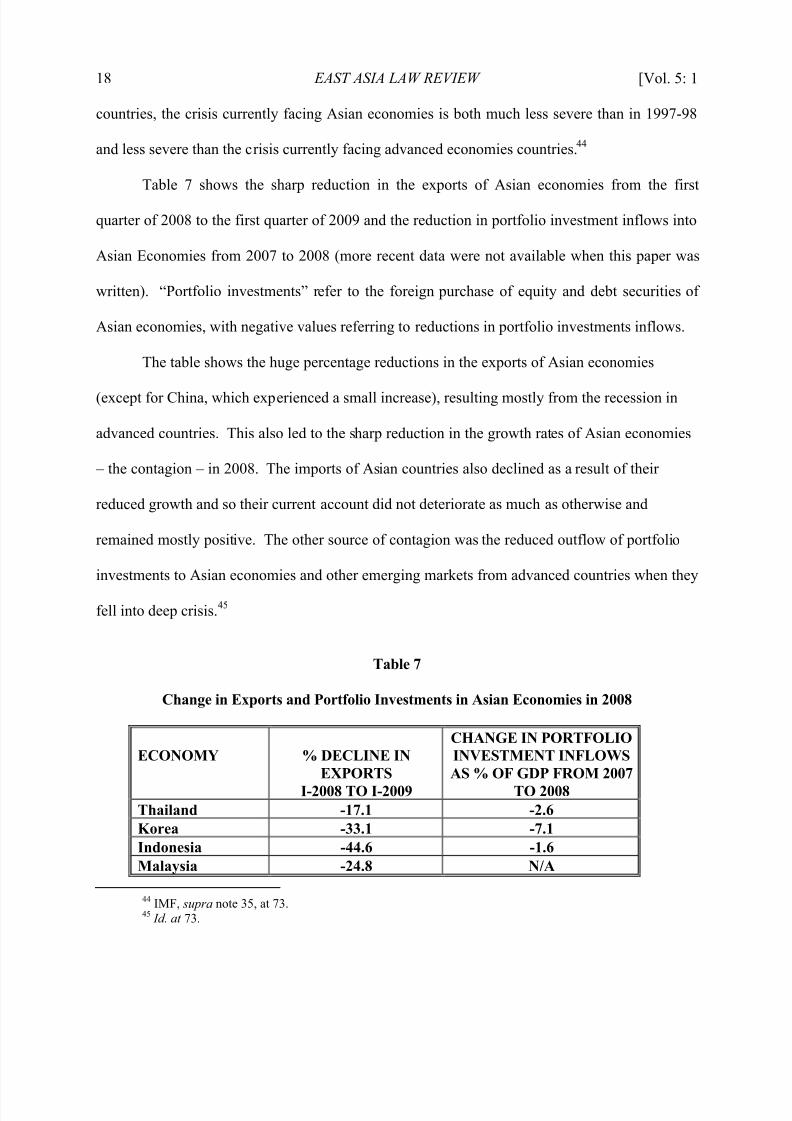
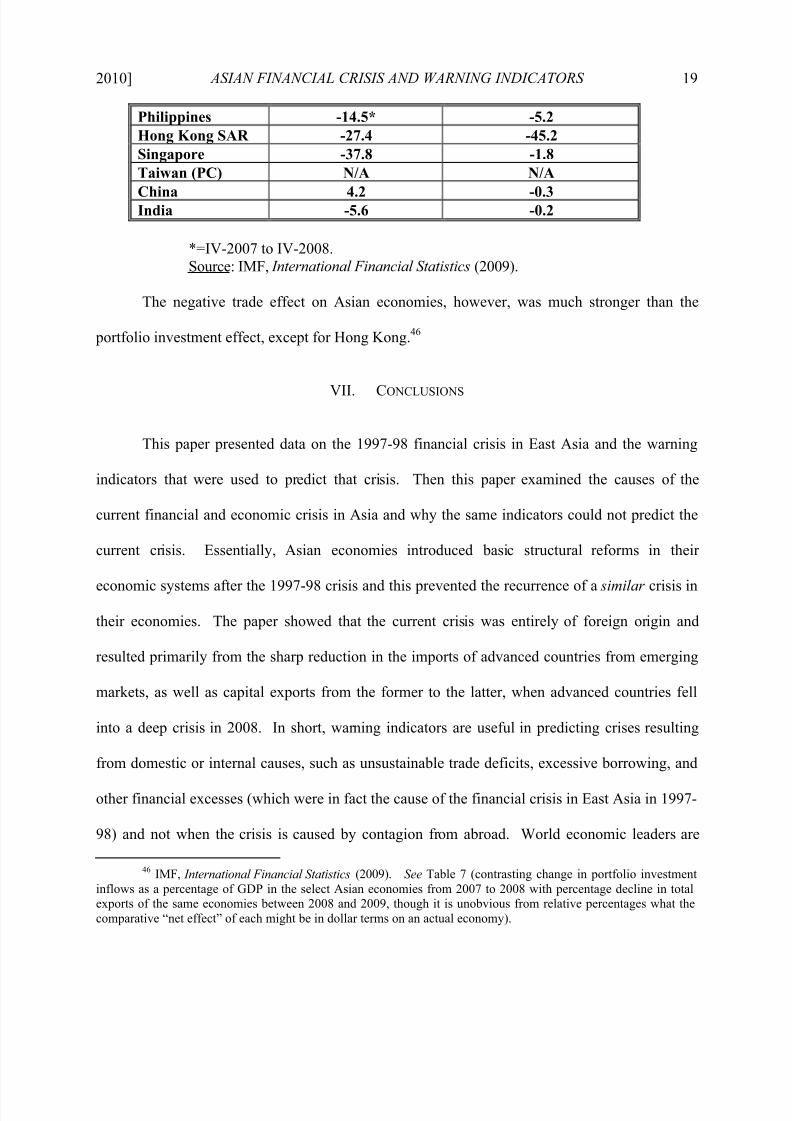
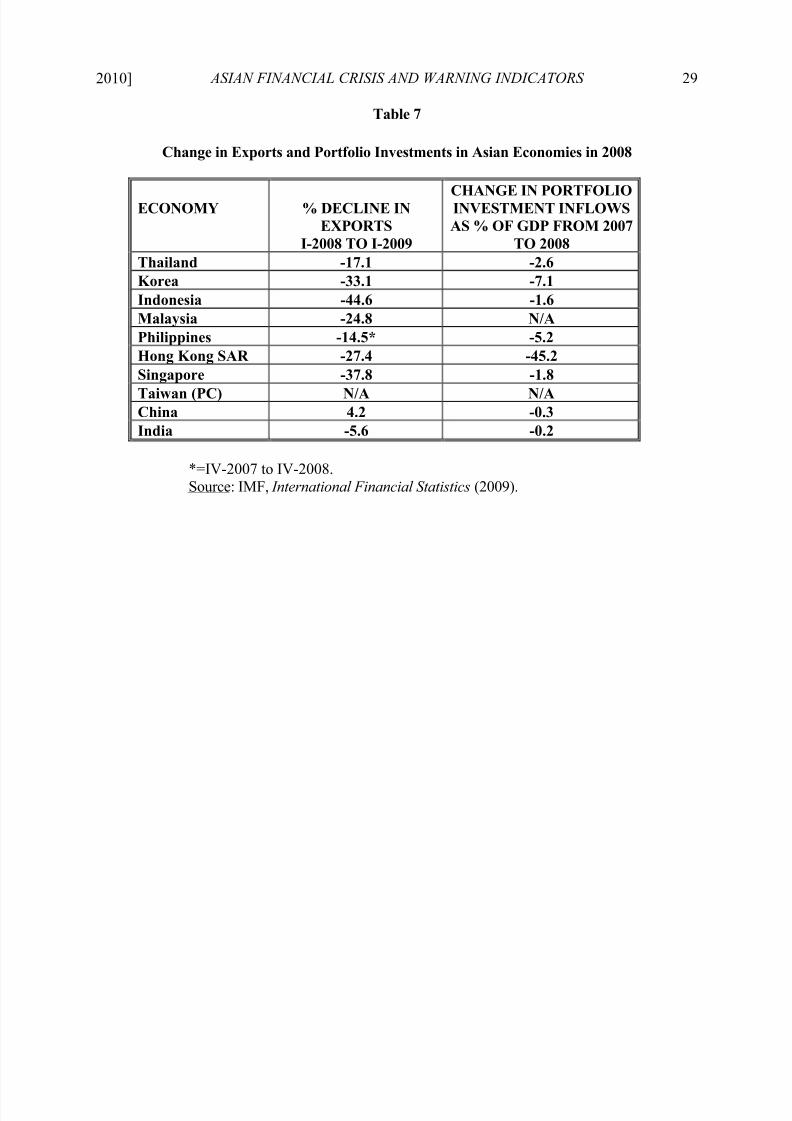
Table 7 shows the sharp reduction in the exports of Asian economies from the first
quarter of 2008 to the first quarter of 2009 and the reduction in portfolio investment inflows into
Asian Economies from 2007 to 2008 (more recent data were not available when this paper was
written). “Portfolio investments” refer to the foreign purchase of equity and debt securities of
Asian economies, with negative values referring to reductions in portfolio investments inflows.
The table shows the huge percentage reductions in the exports of Asian economies
(except for China, which experienced a small increase), resulting mostly from the recession in
advanced countries. This also led to the sharp reduction in the growth rates of Asian economies
– the contagion – in 2008. The imports of Asian countries also declined as a result of their
reduced growth and so their current account did not deteriorate as much as otherwise and
remained mostly positive. The other source of contagion was the reduced outflow of portfolio
investments to Asian economies and other emerging markets from advanced countries when they
fell into deep crisis.45
Table 7
Change in Exports and Portfolio Investments in Asian Economies in 2008
ECONOMY % DECLINE INEXPORTS
I-2008 TO I-2009
CHANGE IN PORTFOLIOINVESTMENT INFLOWSAS % OF GDP FROM 2007
TO 2008Thailand -17.1 -2.6Korea -33.1 -7.1Indonesia -44.6 -1.6Malaysia -24.8 N/A
44 IMF, supra note 35, at 73.45 Id. at 73.
8/8/2019 Asian Crisi-good Report
http://slidepdf.com/reader/full/asian-crisi-good-report 19/30
2010] ASIAN FINANCIAL CRISIS AND WARNING INDICATORS 19
Philippines -14.5* -5.2Hong Kong SAR -27.4 -45.2Singapore -37.8 -1.8Taiwan (PC) N/A N/A
China 4.2 -0.3India -5.6 -0.2
*=IV-2007 to IV-2008.
Source: IMF, International Financial Statistics (2009).
The negative trade effect on Asian economies, however, was much stronger than the
portfolio investment effect, except for Hong Kong.46
VII. CONCLUSIONS
This paper presented data on the 1997-98 financial crisis in East Asia and the warning
indicators that were used to predict that crisis. Then this paper examined the causes of the
current financial and economic crisis in Asia and why the same indicators could not predict the
current crisis. Essentially, Asian economies introduced basic structural reforms in their
economic systems after the 1997-98 crisis and this prevented the recurrence of a similar crisis in
their economies. The paper showed that the current crisis was entirely of foreign origin and
resulted primarily from the sharp reduction in the imports of advanced countries from emerging
markets, as well as capital exports from the former to the latter, when advanced countries fell
into a deep crisis in 2008. In short, warning indicators are useful in predicting crises resulting
from domestic or internal causes, such as unsustainable trade deficits, excessive borrowing, and
other financial excesses (which were in fact the cause of the financial crisis in East Asia in 1997-
98) and not when the crisis is caused by contagion from abroad. World economic leaders are
46 IMF, International Financial Statistics (2009). See Table 7 (contrasting change in portfolio investment
inflows as a percentage of GDP in the select Asian economies from 2007 to 2008 with percentage decline in total
exports of the same economies between 2008 and 2009, though it is unobvious from relative percentages what the
comparative “net effect” of each might be in dollar terms on an actual economy).

8/8/2019 Asian Crisi-good Report
http://slidepdf.com/reader/full/asian-crisi-good-report 20/30
20 EAST ASIA LAW REVIEW [Vol. 5: 1
now meeting to see how to reform the financial sector in advanced countries and the architecture
of the entire world economic system to prevent similar global crises in the future and to restart
rapid growth in the world economy.
8/8/2019 Asian Crisi-good Report
http://slidepdf.com/reader/full/asian-crisi-good-report 21/30
2010] ASIAN FINANCIAL CRISIS AND WARNING INDICATORS 21
References
Chang, R., and A. Velasco (1998). The Asian Development Crisis. Federal Reserve Bank
of Atlanta, Working Paper 98-11.
Chauvet, M. and F. Dong (2004) “Leading Indicators of Country Risk and Currency Crises:The Asian Experience.” Economic Review, Federal Reserve Bank of Atlanta,
12(1): 25-37.
Corsetti, G., P. Pesenti, and N. Roubini (1998). What Caused the Asian Currency and Financial
Crisis? Part I: A Macroeconomic Overview. NBER Working Paper No. 6833.
Eichengreen, B. and R. Hausman, eds. (2005) Other People’s Money: Debt Denomination and
Financial Instability in Emerging Market Economics. Chicago: University of Chicago
Press
Ghosh, S. T. and A. R. Ghosh (2003) “Structural Vulnerabilities and Currency Crises.” IMFStaff Papers 50(3): 481-506.
IMF (1998, 1999). World Economic Outlook. Washington D.C. International Monetary Fund,
May and October.
IMF (1998, 1999). International Financial Statistics. Washington D.C. International Monetary
Fund, June.
IMF (2009). Global Financial Stability Report. International Monetary Fund, Washington, D.C.
Kaminski, G., S. Lizondo, and C. Reinhart (1998). Leading Indicators of Currency Crises. IMFStaff Papers 45 (1): 1-45.
Kaminski, G., and C. Reinhart (1998). Currency and Banking Crises: The Early Warning of
Distress. International Finance Discussion Paper No. 629. Washington, D.C.: Board of Governors of the Federal Reserve System.
Reagle D. and D. Salvatore (2000), “Forecasting Financial Crises in Emerging MarketEconomies,’’ Open Economies Review 11 (3): 133–150.
Regale, D. and D. Salvatore (2005), ‘‘Robustness of Forecasting Financial Crises in Emerging
Market Economies with Data Revisions,’’ Open Economies Review 16 (3): 209–216.
Roubini, N. and B. Setser (2004), Bailout or Bailins? Responding to Financial Crises in
Emerging Economies. Washington, D.C.: Institute for International Economics.
Salvatore, D. (1998). Capital Flows, Current Account Deficits, and Financial Crises in
Emerging Market Economies. International Trade Journal 12 (1): 5-22.
8/8/2019 Asian Crisi-good Report
http://slidepdf.com/reader/full/asian-crisi-good-report 22/30
22 EAST ASIA LAW REVIEW [Vol. 5: 1
Salvatore, D. (1999), Could the Financial Crisis in Asia Have Been Predicted? Journal of
Policy Modeling, 31 (3): 341-348.
World Bank (1998). Global Development Finance. Washington, D.C.: World Bank.
8/8/2019 Asian Crisi-good Report
http://slidepdf.com/reader/full/asian-crisi-good-report 23/30
2010] ASIAN FINANCIAL CRISIS AND WARNING INDICATORS 23
Table 1
Growth of Real GDP, 1995-1998
REGION/COUNTRY 1995 1996 1997 1998Asia
Thailand 8.8 5.5 -1.3 -9.4Korea 8.9 6.8 5.0 -5.8Indonesia 8.2 8.0 4.7 -13.7Malaysia 9.4 8.6 7.7 -6.7Philippines 4.7 5.8 5.2 -0.5Hong Kong SAR 3.9 4.5 5.3 -5.1Singapore 8.2 7.5 9.0 0.3Taiwan (PC) 6.0 5.7 6.8 4.9China 10.5 9.6 8.8 7.8
India 8.0 7.4 5.5 5.8Africa 3.0 5.9 3.1 3.4Central/Eastern Europe 1.6 1.6 3.0 2.2CIS (Russia) -4.4 1.6 2.5 2.2Middle East 3.7 4.7 4.5 3.2Western Hemisphere 1.5 3.6 5.3 2.2Advanced Economies 2.6 3.2 3.2 2.2WORLD 3.8 4.3 4.2 2.5
*=Forecast.
Source: Int'l Monetary Fund [IMF], World Economic Outlook (Oct. 1999).
8/8/2019 Asian Crisi-good Report
http://slidepdf.com/reader/full/asian-crisi-good-report 24/30
24 EAST ASIA LAW REVIEW [Vol. 5: 1
Table 2
Percentage Change in Stock Prices and Currency Depreciationin Asian Economies, 1997-1998
ECONOMY% CHANGE IN STOCK
PRICESIN U.S. DOLLARS,
1 MAY 1997 TO 1 MAY 1998
PERCENTAGEDEPRECIATION OF LOCALCURRENCY WITH RESPECT
TO U.S. DOLLAR,22 APRIL 1997 TO 22 APRIL
1998Thailand -55.6 51.1Korea -54.9 54.3Indonesia -76.7 229.1Malaysia -62.5 51.4
Philippines -44.3 45.2Hong Kong SAR -26.2 0.4Singapore -30.0 10.3Taiwan (PC) -16.7 20.3China N/A 11.2India N/A 0.4
N/A = not available.Source: IMF, World Economic Outlook , Ch. II (Oct. 1999) and IMF, International
Financial Statistics (June 1998-99).
8/8/2019 Asian Crisi-good Report
http://slidepdf.com/reader/full/asian-crisi-good-report 25/30
2010] ASIAN FINANCIAL CRISIS AND WARNING INDICATORS 25
Table 3
Warning Indicators in 1996 that Correctly Predicted the 1997 Asian Financial Crisisand Those that Correctly Predicted no Crisis
CORRECTLYPREDICTEDCRISIS
(1)CA/GDP
(2)EDT/GDP
(3)EDS/GDP
(4)(CA-FDI)/GDP
(5)DS/X
(6)RES/M
Thailand √ √ √ √ x xKorea √ √ √ √ x xIndonesia x √ √ x √ xMalaysia √ √ √ x x xPhilippines √ √ √ √ x √
Total 4 5 5 3 1 1
CORRECTLYNOTPREDICTEDCRISISHong Kong SAR √ √ √ N/A √ xSingapore √ √ √ √ √ √China √ √ x √ x √India √ √ √ √ x √
Total 4 4 3 3 2 3
Overall Total 8 9 8 6 3 4
Legend: GDP=Gross Domestic Product; CA=Current Account; EDT=Total ExternalDebt; EDS=Short-Term External Debt; FDI=Foreign Direct Investments;
RES=International Reserves; DS=Debt Service Payments; X=Exports of Goods and
Services of the Nation in the Year; M=Imports of Goods and Services (averagemonthly value); N/A = not available; x = wrong prediction.
Source: IMF, International Financial Statistics (June 1998-99), World Bank, World Bank Report (1998) and World Bank, World Development Indicators (1998).
8/8/2019 Asian Crisi-good Report
http://slidepdf.com/reader/full/asian-crisi-good-report 26/30
26 EAST ASIA LAW REVIEW [Vol. 5: 1
Table 4
Growth of Real GDP, 2006-2009
REGION/COUNTRY 2006 2007 2008 2009*Asia
Thailand 5.2 4.9 2.6 -3.5Korea 5.2 5.1 2.2 -1.0Indonesia 5.5 6.3 6.1 4.0Malaysia 5.8 6.2 4.6 -3.6Philippines 5.3 7.1 3.8 1.0Hong Kong SAR 7.0 6.4 2.4 -3.6Singapore 8.4 7.8 1.1 -3.3Taiwan (PC) 4.8 5.7 0.1 -4.1China 11.6 13.0 9.0 8.5
India 9.8 9.4 7.3 5.4Africa 6.1 6.3 5.2 1.7Central/Eastern Europe 6.6 5.5 3.0 -5.0CIS (Russia) 8.4 8.6 5.5 -6.7Middle East 5.8 6.2 5.4 2.0Western Hemisphere 5.7 5.7 4.2 -2.5Advanced Economies 3.0 2.7 0.6 -3.4WORLD 5.1 5.2 3.0 -1.1
*=Forecast.
Source: IMF, World Economic Outlook (Oct. 2009)
8/8/2019 Asian Crisi-good Report
http://slidepdf.com/reader/full/asian-crisi-good-report 27/30
2010] ASIAN FINANCIAL CRISIS AND WARNING INDICATORS 27
Table 5
Percentage Decline in Stock Prices and Currency Depreciationin Asian Economies, January 1 to January 31, 2008
ECONOMY% CHANGE IN STOCK
PRICESIN U.S. DOLLARS
PERCENTAGEDEPRECIATION OF LOCALCURRENCY WITH RESPECT
TO U.S. DOLLAR Thailand -47.6 3.5Korea -40.7 23.7Indonesia -50.6 16.3Malaysia -39.4 4.8Philippines -48.3 14.7Hong Kong SAR -48.3 -0.7
Singapore -49.2 -0.1Taiwan (PC) -46.0 N/AChina -65.4 -6.4India -52.4 22.9
N/A = not available. Negative exchange rate changes refer to appreciations.
Source: IMF, World Economic Outlook Ch. II (Oct. 1999) and IMF, International Financial Statistics (June 2008-09).
8/8/2019 Asian Crisi-good Report
http://slidepdf.com/reader/full/asian-crisi-good-report 28/30
28 EAST ASIA LAW REVIEW [Vol. 5: 1
Table 6
Warning Indicators in 2007 of the 2008-9 Financial Crisis in Asian Countries
ECONOMY(1)
CA/GDP(2)
EDT/GDP(3)
EDS/GDP(4)
(CA-FDI)/GDP(5)
DS/X(6)
RES/MThailand 5.7 25.7 8.8* 10.3 8.1 13.6Korea 0.6 0.0 0.0 0.8 0.0 36.1Indonesia 2.4 32.5* 8.1* 4.0 10.5 9.1Malaysia 15.4 28.8 8.2* 20.0 4.6 13.9Philippines 4.9 45.7* 4.9 6.0 13.7 5.4Hong Kong SAR 12.3 0.0 0.0 25.0 0.0 4.5Singapore 23.5 0.0 0.0 38.4 0.0 27.2Taiwan PC 8.6 N/A N/A N/a N/A N/AChina 11.0 11.7 3.7 53.8 10.0 86.2
India -1.0 18.8 6.4 0.9 2.2 23.5
Legend: GDP=Gross Domestic Product; CA=Current Account; EDT=Total External
Debt; EDS=Short-Term External Debt; FDI=Foreign Direct Investments;
RES=International Reserves; DS=Debt Service Payments; X=Exports of Goods andServices of the Nation in the Year; M=Imports of Goods and Services (average
monthly value); N/A = not available; * = Indicators predicting the possibility of a
future crisis.Source: IMF, International Financial Statistics (2009) and World Bank, World Bank
Report (2009) and World Bank, World Development Indicators (2009).
8/8/2019 Asian Crisi-good Report
http://slidepdf.com/reader/full/asian-crisi-good-report 29/30
2010] ASIAN FINANCIAL CRISIS AND WARNING INDICATORS 29
Table 7
Change in Exports and Portfolio Investments in Asian Economies in 2008
ECONOMY % DECLINE INEXPORTS
I-2008 TO I-2009
CHANGE IN PORTFOLIOINVESTMENT INFLOWSAS % OF GDP FROM 2007
TO 2008Thailand -17.1 -2.6Korea -33.1 -7.1Indonesia -44.6 -1.6Malaysia -24.8 N/APhilippines -14.5* -5.2Hong Kong SAR -27.4 -45.2Singapore -37.8 -1.8
Taiwan (PC) N/A N/AChina 4.2 -0.3India -5.6 -0.2
*=IV-2007 to IV-2008.Source: IMF, International Financial Statistics (2009).

8/8/2019 Asian Crisi-good Report
http://slidepdf.com/reader/full/asian-crisi-good-report 30/30
30 EAST ASIA LAW REVIEW [Vol. 5: 1