asia/world energy outlook 2015 - ief · geological coverage • the world is geographically divided...
TRANSCRIPT

Asia
/Wor
ld E
nerg
y O
utlo
ok 2
015
IEE
J ©
201
5
421st Forum on Research Works Asia/World Energy Outlook 2015 – Analyses of oil pricing and climate change measures under new circumstances – 21 October 2015 YANAGISAWA Akira and Yuhji MATSUO The Institute of Energy Economics, Japan

Asia
/Wor
ld E
nerg
y O
utlo
ok 2
015
IEE
J ©
201
5
“History doesn’t repeat itself, but it does rhyme”
1
❖ Oil price
Source: BP
Mark Twain
• Decreases in demand and increases in supply by non-OPEC countries following high price after the oil crises
• Severer competition in OPEC
• Easy supply-demand balance affected by the Netback pricing
• Decreases in emerging economies’ demand on the Asian financial crisis
• Expansion of OPEC production quota and excess production by the members over their quota
• Sharp drop of demand on the Lehman shock
• Expansion of production capacity by Saudi Arabia and others
• Increases in supply by non-OPEC and OPEC countries
• Slow growth of global demand
0
50
100
1970 1980 1990 2000 2010 2015
$201
4/bb
l
Asia
/Wor
ld E
nerg
y O
utlo
ok 2
015
IEE
J ©
201
5
Various factors involve oil price
2
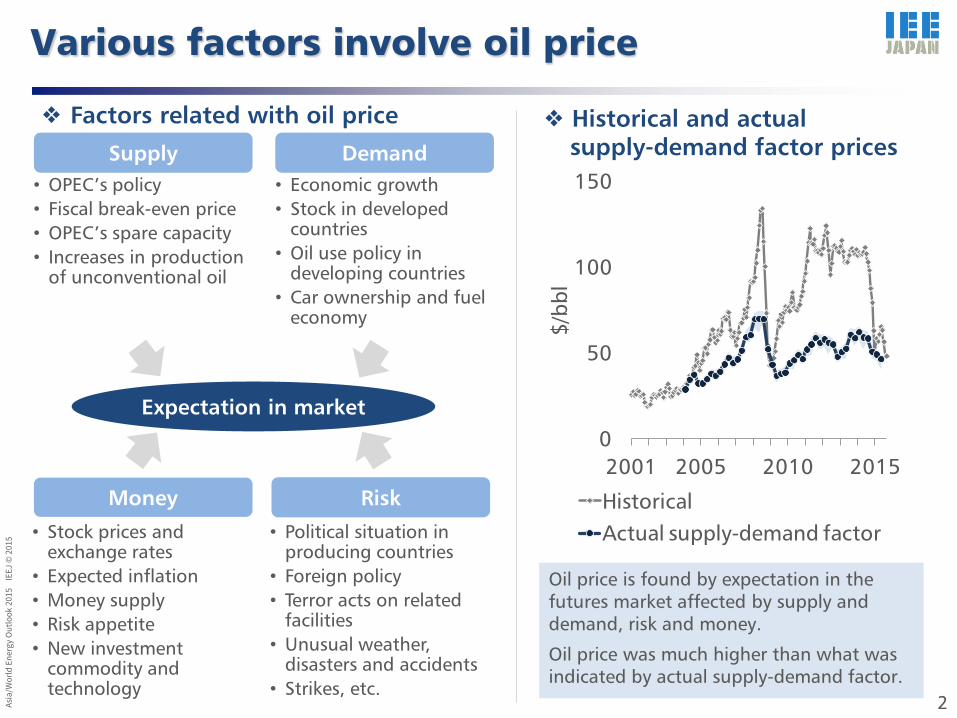
❖ Factors related with oil price ❖ Historical and actual supply-demand factor prices
Expectation in market
Supply • OPEC’s policy • Fiscal break-even price • OPEC’s spare capacity • Increases in production
of unconventional oil
Money
• Stock prices and exchange rates
• Expected inflation • Money supply • Risk appetite • New investment
commodity and technology
Risk
• Political situation in producing countries
• Foreign policy • Terror acts on related
facilities • Unusual weather,
disasters and accidents • Strikes, etc.
• Economic growth • Stock in developed
countries • Oil use policy in
developing countries • Car ownership and fuel
economy
Oil price is found by expectation in the futures market affected by supply and demand, risk and money.
Oil price was much higher than what was indicated by actual supply-demand factor.
Demand
0
50
100
150
2001 2005 2010 2015
$/bb
l
HistoricalActual supply-demand factor
Asia
/Wor
ld E
nerg
y O
utlo
ok 2
015
IEE
J ©
201
5
3
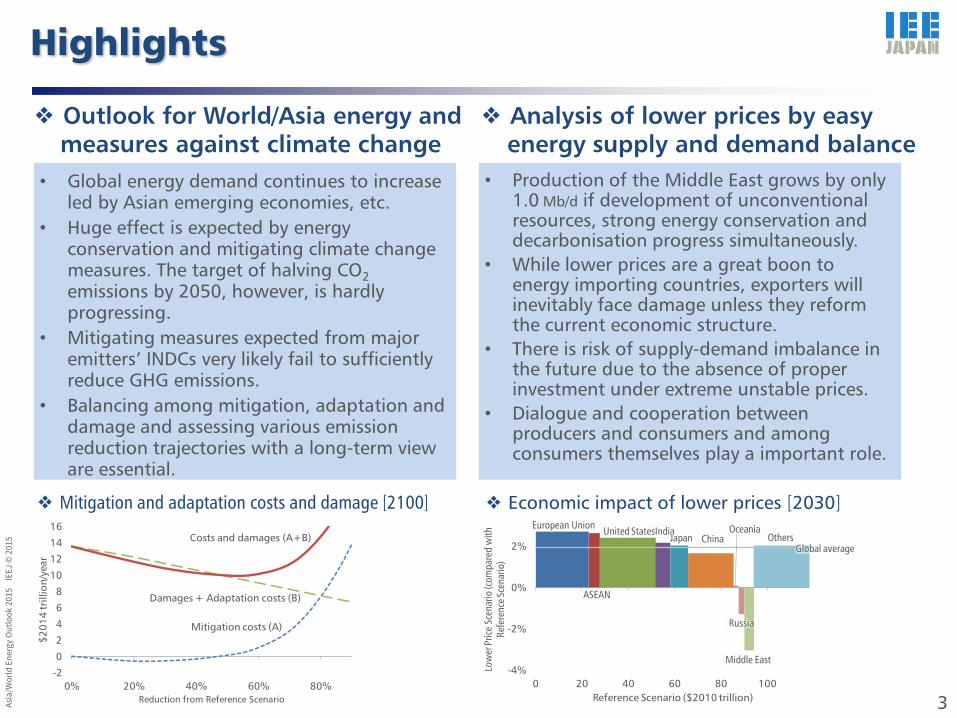
Highlights
• Global energy demand continues to increase led by Asian emerging economies, etc.
• Huge effect is expected by energy conservation and mitigating climate change measures. The target of halving CO2 emissions by 2050, however, is hardly progressing.
• Mitigating measures expected from major emitters’ INDCs very likely fail to sufficiently reduce GHG emissions.
• Balancing among mitigation, adaptation and damage and assessing various emission reduction trajectories with a long-term view are essential.
• Production of the Middle East grows by only 1.0 Mb/d if development of unconventional resources, strong energy conservation and decarbonisation progress simultaneously.
• While lower prices are a great boon to energy importing countries, exporters will inevitably face damage unless they reform the current economic structure.
• There is risk of supply-demand imbalance in the future due to the absence of proper investment under extreme unstable prices.
• Dialogue and cooperation between producers and consumers and among consumers themselves play a important role.
❖ Outlook for World/Asia energy and measures against climate change
❖ Analysis of lower prices by easy energy supply and demand balance
❖ Mitigation and adaptation costs and damage [2100] ❖ Economic impact of lower prices [2030] European Union
ASEAN
United StatesIndiaJapan China
Oceania
Russia
Middle East
OthersGlobal average
-4%
-2%
0%
2%
0 20 40 60 80 100
Low
er P
rice
Scen
ario
(com
pare
d w
ith
Refe
renc
e Sce
nario
)
Reference Scenario ($2010 trillion)
-2
0
2
4
6
8
10
12
14
16
0% 20% 40% 60% 80%
$201
4 tr
illio
n/ye
ar
Reduction from Reference Scenario
Mitigation costs (A)
Damages + Adaptation costs (B)
Costs and damages (A+B)

Asia/World Energy Outlook through 2040

Geological Coverage
• The world is geographically divided into 42 regions. • Especially the Asian energy supply/demand structure is considered in detail, dividing the area into 15 regions.
- United States - Canada
North America
- Australia - New Zealand
Oceania - South Africa (Rep. of) - North Africa - Other Africa
Africa
-Saudi Arabia - Iran - Iraq - UAE - Kuwait - Qatar - Oman - Other Middle East
Middle East - Japan - China - India - Taiwan - South Korea - Hong Kong - Indonesia - Malaysia - Philippines - Thailand - Vietnam - Singapore - Myanmar - Brunei Darussalam - Other Asia
Asia
- United Kingdom - Germany - France - Italy - Other OECD Europe
OECD Europe - Russia - Other FSU - Non-OECD Europe
Former Soviet Union (FSU) & Non-OECD Europe
- Mexico - Brazil - Chile - Other Latin America
Latin America
5
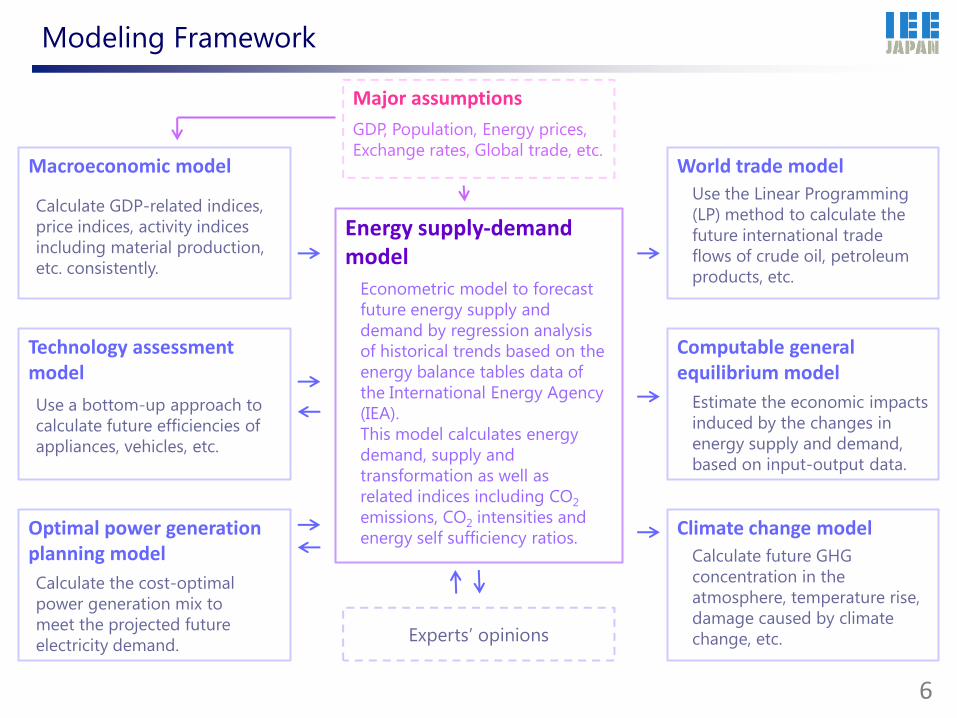
Energy supply-demand model
World trade model
Computable general equilibrium model
Climate change model
Use the Linear Programming (LP) method to calculate the future international trade flows of crude oil, petroleum products, etc.
Estimate the economic impacts induced by the changes in energy supply and demand, based on input-output data.
6
Calculate future GHG concentration in the atmosphere, temperature rise, damage caused by climate change, etc.
Major assumptions
GDP, Population, Energy prices, Exchange rates, Global trade, etc.
Technology assessment model
Optimal power generation planning model
Calculate GDP-related indices, price indices, activity indices including material production, etc. consistently.
Use a bottom-up approach to calculate future efficiencies of appliances, vehicles, etc.
Calculate the cost-optimal power generation mix to meet the projected future electricity demand.
Econometric model to forecast future energy supply and demand by regression analysis of historical trends based on the energy balance tables data of the International Energy Agency (IEA). This model calculates energy demand, supply and transformation as well as related indices including CO2 emissions, CO2 intensities and energy self sufficiency ratios.
Experts’ opinions
Macroeconomic model
Modeling Framework
0
500
1000
1500
2000
2500
China India Japan ASEAN Other Asia
N. America
L. America
OECD Europe
Non-OECD
Europe
Africa Middle East
Oceania
1980
2013
2040
millions
China 19%
India 18%
ASEAN 8%
Japan 1.8%
Other Asia 8%
Africa 16%
L. America 9%
N. America 5%
OECD Europe 8%
Non-OECD
Europe 5%
Middle East 3% Oceania 0.4%
China 15%
India 18%
ASEAN 8%
Japan 1.3%
Other Asia 8%
Africa 22%
L. America 8%
N. America 5%
OECD Europe 6%
Non-OECD
Europe 4%
Middle East 4% Oceania 0.4%
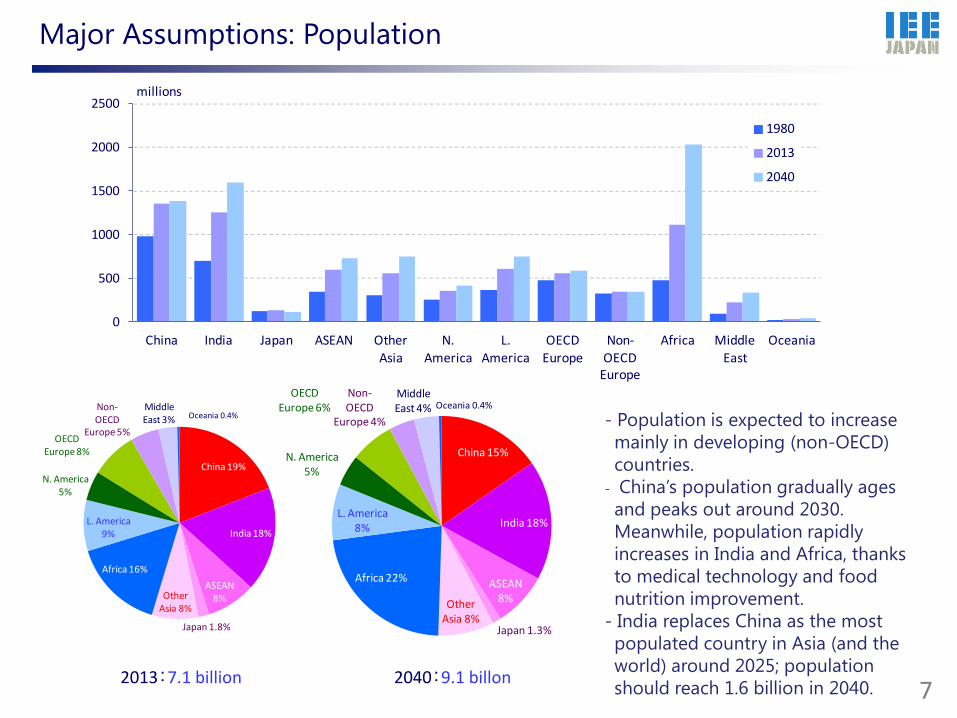
7 2013:7.1 billion 2040:9.1 billon
Major Assumptions: Population
- Population is expected to increase mainly in developing (non-OECD) countries.
- China’s population gradually ages and peaks out around 2030. Meanwhile, population rapidly increases in India and Africa, thanks to medical technology and food nutrition improvement.
- India replaces China as the most populated country in Asia (and the world) around 2025; population should reach 1.6 billion in 2040.

United States23%
Japan8%
OECD Europe
26%
China11%
India3%
ASEAN3%
Others26%
United States21%
Japan7%
OECD Europe
23%China15%
India5%
ASEAN4%
Others26%
United States19%
Japan6%
OECD Europe
18%China19%India
7%
ASEAN5%
Others26%
United States26%
Japan14%
OECD Europe
35%
China2%
India1%
ASEAN2%
Others20%
2.9
5.0
4.3
1.9
2.8
4.5
1.5
2.7
2.2
4.4
2.3
2.6
1.5
6.5
5.2
2.9
7.2
4.1
2.4
3.3
3.3
1.9
2.6
2.7
5.2
5.6
6.5
2.1
6.2
9.9
0.0 2.0 4.0 6.0 8.0 10.0 12.0
World
Asia excl.Japan
Non-OECD
OECD
MiddleEast
Africa
OECDEurope
LatinAmerica
NorthAmerica
ASEAN
Taiwan
SouthKorea
Japan
India
China
1980-2013
2013-2040
Average annual growth rate, %
1990 (nominal) 2013 (real)
2025 (real) 2040 (real)
8
Major Assumptions: Economic Growth Note: Real values are in 2010 USD
- While the world economy is facing a variety of challenges, it is assumed to achieve strong growth over the medium to long term.
- In the Reference Scenario, China’s real GDP in 2040 is ahead of the United States and is 3.5 times that of Japan. India also overtakes Japan in the late 2030s; it is 1.4 times that of Japan in 2040.

0
500
1000
1500
2000
0
20
40
60
80
100
120
140
1990
2000
2014
2020
2030
2040
LNG (right)
Crude oil
Steam coal (right)
USD/t
Historical ← → Forecast
USD/bbl
Reference Lower Price
2013 2020 2030 2040 2020 2030 2040
Real 105 75 100 125 70 75 80Nominal 105 84 137 209 79 103 134
Japan Real 842 554 663 730 498 507 528 USD/t Nominal 842 624 909 1,221 561 696 883
Japan Real 16.3 10.7 12.8 14.1 9.6 9.8 10.2 USD/MBtu Nominal 16.3 12.0 17.6 23.6 10.8 13.5 17.1
Europe Real 8.2 8.5 9.8 11.7 6.8 7.3 8.1 USD/MBtu Nominal 8.2 9.6 13.5 19.6 7.7 10.0 13.6
USA Real 4.4 4.5 5.6 6.8 3.4 3.7 3.9 USD/MBtu Nominal 4.4 5.1 7.7 11.4 3.8 5.1 6.5
Real 98 89 106 132 86 96 108Nominal 98 100 145 221 97 132 181
Crude oil USD/bbl
Natural gas
Steam coal USD/t
- Prices are for calendar years. Real prices are in 2014 dollars. - Japan’s energy prices are on a CIF import basis.
- In the Reference Scenario, crude oil prices rise gradually again to $100/bbl by 2030 due to robust demand growth in non-OECD countries, emerging geopolitical risks and financial factors, oil supply constraints reflecting rising depletion rates for oil fields, etc. LNG prices will rise accordingly, with the existing price disparity shrinking due to expanding interregional trades.
- In the Lower Price Scenario, energy prices remain lower due to the dull growth in demand in accordance with the diffusion of energy saving technologies, as well as further promotion of unconventional resources development.
CIF import prices for Japan
9 Solid line: Reference, Dashed line: Lower Price
Major Assumptions: Primary Energy Prices

Scenarios
Reference Scenario
Advanced Technologies Scenario
This scenario reflects past trends as well as energy and environment policies that have been introduced so far. This scenario does not reflect any aggressive policies for energy conservation or low-carbon measures.
In this scenario, energy conservation and low-carbon technologies are promoted for maximum impacts, as each country is assumed to implement powerful policies to enhance energy security and address climate change issues.
Lower Price Scenario In this scenario, it is assumed that energy savings will be pursued as stringently as in the Advanced Technologies Scenario, while assuming large increases in unconventional oil and natural gas production, resulting in considerable relaxation of supply and demand.
10
Assumptions for the Advanced Technologies Scenario
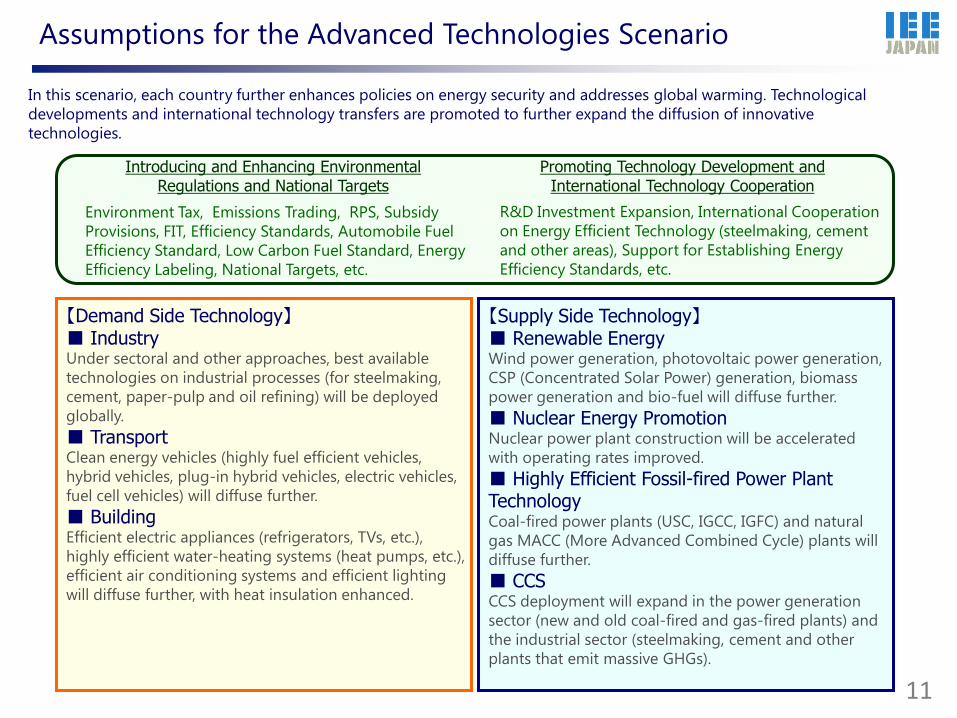
【Demand Side Technology】 ■ Industry Under sectoral and other approaches, best available technologies on industrial processes (for steelmaking, cement, paper-pulp and oil refining) will be deployed globally. ■ Transport Clean energy vehicles (highly fuel efficient vehicles, hybrid vehicles, plug-in hybrid vehicles, electric vehicles, fuel cell vehicles) will diffuse further. ■ Building Efficient electric appliances (refrigerators, TVs, etc.), highly efficient water-heating systems (heat pumps, etc.), efficient air conditioning systems and efficient lighting will diffuse further, with heat insulation enhanced.
In this scenario, each country further enhances policies on energy security and addresses global warming. Technological developments and international technology transfers are promoted to further expand the diffusion of innovative technologies.
【Supply Side Technology】 ■ Renewable Energy Wind power generation, photovoltaic power generation, CSP (Concentrated Solar Power) generation, biomass power generation and bio-fuel will diffuse further. ■ Nuclear Energy Promotion Nuclear power plant construction will be accelerated with operating rates improved. ■ Highly Efficient Fossil-fired Power Plant Technology Coal-fired power plants (USC, IGCC, IGFC) and natural gas MACC (More Advanced Combined Cycle) plants will diffuse further. ■ CCS CCS deployment will expand in the power generation sector (new and old coal-fired and gas-fired plants) and the industrial sector (steelmaking, cement and other plants that emit massive GHGs).
Introducing and Enhancing Environmental Regulations and National Targets
Environment Tax, Emissions Trading, RPS, Subsidy Provisions, FIT, Efficiency Standards, Automobile Fuel Efficiency Standard, Low Carbon Fuel Standard, Energy Efficiency Labeling, National Targets, etc.
R&D Investment Expansion, International Cooperation on Energy Efficient Technology (steelmaking, cement and other areas), Support for Establishing Energy Efficiency Standards, etc.
Promoting Technology Development and International Technology Cooperation
11

96%
59%
20%
2%
1%
1%
2%
31%
40%
7%
12%
1%
20%
1%7%
0%
20%
40%
60%
80%
100%
Refe
renc
e
Adv.
Tech
.
2010 2040
Fuel Cell
Electric
Plug-in Hybrid
Hybrid
Compressed
Gas
ICE(Gasoline,
Diesel)
25%
27%
29%
31%
33%
35%
37%
39%
41%
43%
45%
1990 2013 2040
Assumptions for the Advanced Technologies Scenario
Thermal efficiencies of coal-fired power plants
Solid lines: Reference Dashed lines: Advanced Tech.
OECD
Non-OECD
The share of vehicle sales by type (world)
・ In the Advanced Technologies Scenario for the transport sector, clean energy vehicles diffuse drastically and fuel efficiency is improved. In the power sector, low carbon technology diffuses and highly efficient fossil-fired power plant technology are introduced.
・ In the industrial, residential and commercial sectors, the technologies that become available in the near future are heavily introduced. 12

0
1,000
2,000
3,000
4,000
5,000
6,000
7,000
8,000
9,000
10,000
1990 2000 2013 2020 2030 2040
Million tons of oil equivalent
22
24
58
167
447
533
622
3,281
0 1,000 2,000 3,000 4,000
North America
Oceania
OECD Europe
FSU & Non-OECDEurope
Middle East
LatinAmerica
Africa
Asia
Mtoe
Primary Energy Demand by Region
2013 13,600
↓ 2040
19,000 (1.4-fold increase)
World
Reference Scenario
Asia
North America
OECD Europe
FSU / Non-OECD Europe Latin America
Middle East Africa
Oceania
5,400 Mtoe
8,700 Mtoe
Average Annual Growth Rate (2013-2040)
1.8%
2.3%
1.8%
1.8%
0.5%
0.1%
0.5%
0.0%
Increase (2013-2040)
・ Under the steady economic growth assumption, Asian energy consumption in 2040 increases 1.6-fold from the present level (from 5.4 billion tons in 2013 to 8.7 billion tons in 2040).
・ Non-OECD countries account for about 90% of global energy consumption increase between 2013 and 2040. 13

Primary Energy Demand (Asia)
・ Energy demand in China and India increase rapidly in line with economic growth. Their share of Asian energy demand expands 70% in 2040.
・ Japan’s energy consumption declines as a result of progress in energy efficiency combined with a maturing economy and a decreasing population. Its share of Asian energy consumption shrinks from 8% to 5%.
2013 5,400 ↓
2040 8,700
(1.6-fold increase)
2013 3,000 780
↓ 2040
4,200 1,800 (1.4-fold inc.) (2.3-fold inc.)
Asia
China & India
Reference Scenario
41% 40%
56% 55%52% 49%
15%15%
14%
15%
18%21%
21%18%
8%
7%
6%
5%
0
1,000
2,000
3,000
4,000
5,000
6,000
7,000
8,000
9,000
10,000
1990 2000 2013 2020 2030 2040
Others
Taiwan
Malaysia
Vietnam
Thailand
Indonesia
South Korea
Japan
India
China
Million tons of oil equivalent
14

0
500
1000
1500
2000
2500
3000
3500
4000
1990 2000 2013 2020 2030 2040
Mtoe
0
1000
2000
3000
4000
5000
6000
1990 2000 2013 2020 2030 2040
Mtoe
28%
Primary Energy Consumption by Source Solid lines: Reference Dashed lines: Adv. Tech.
World Asia
Oil
Coal
Natural gas
Other renewables
Nuclear Hydro
31%
The percentages indicate the shares of total global/Asian primary consumption
29%
23%
24%
24%
51%
41%
33%
24%
19%
29%
21%
25%
24%
10%
16%
15% 11%
18% 14%
12% 12%
16%
5%
6%
10%
2%
6% 10%
2% 2% 2% 2%
3%
Fossil share 81%→78% (Ref. )
71% (Adv. Tech. )
Fossil share 84%→81% (Ref. )
71% (Adv. Tech. )
• In both the Reference and Advanced Technologies Scenarios, oil continues to be the largest share of primary energy consumption and remains a major energy source up to 2040.
• In Asia, coal remains the largest share among energy sources. In the Advanced Technologies Scenario, coal consumption declines substantially while retaining the largest share among energy sources.
• Share of fossil fuel declines until 2040, while maintaining the 70% in the Advanced Technologies Scenario. 15

0%
10%
20%
30%
40%
50%
60%
70%
80%
90%
100%
1990 2000 2013 2020 2030 2040
Coal
Natural gas
Oil
65%
41%
46%
24%8%
7%
77% 78%
78%
0%
20%
40%
60%
80%
100%
120%
1990 2000 2013 2020 2030 2040
Coal
Natural gas
Oil
69%
57%
60%
43%28%
26%
93%98%
98%
0%
10%
20%
30%
40%
50%
60%
70%
80%
90%
100%
1990 2000 2013 2020 2030 2040
Coal
Natural gas
Oil
69%
57%
58%
30%
18%
17%
92% 91%
89%
16
・ While Asia including China and India have scarce oil and natural gas resources, coal resource are abundant and this contributes to stabilize energy self-sufficiency.
・ Asian fossil fuel self-sufficiency rate has been decreasing and it keeps decreasing not only in the Reference Scenario where demand rapidly increases but also in the Advanced Technologies Scenario where energy saving technologies are heavily introduced.
Asia China India
Energy self-sufficiency in Asia Solid lines: Reference Dashed lines: Adv. Tech.

16829326
61143
321
112
234
79
227
326
73
145
4
137
749
1,381
0
1,000
2,000
3,000
4,000
5,000
6,000
7,000
8,000
0
200
400
600
800
1,000
1,200
1,400
1,600
Reference Adv. Tech.
2005 2013 2040
GW TWh
91
367494
20
79
277
22
34
69
219
394
117
205
239
17
105
141
59
318
998
1,579
0
1,000
2,000
3,000
4,000
5,000
6,000
7,000
8,000
0
200
400
600
800
1,000
1,200
1,400
1,600
Reference Adv. Tech.
2005 2013 2040
GW TWh
128 19147
90
68 73
86
134
115 121
120
139
140 128
122
152
46 49
107
162
379 388
610
868
0
1,000
2,000
3,000
4,000
5,000
6,000
7,000
8,000
0
200
400
600
800
1,000
1,200
1,400
1,600
Reference Adv. Tech.
2005 2013 2040
Others
OECD Europe
N. America
Other Asia
India
China
GW
Nuclear Wind Solar PV
17
Power Generation (right)
Outlook for nuclear and renewable power generation capacities
・ In the Reference Scenario, global nuclear, photovoltaic generation capacity, and wind power expand 1.6-fold, 3.1-fold, and 5.5-fold, respectively, from 2013 to 2040. In the Advanced Technologies Scenario they are 2.2-fold, 5.0-fold, and 10.1-fold, respectively.
• In particular, expansions in Asia are significant and China and India account for nearly half in all technologies in the Advanced Technologies Scenario.

39%
63%
53%
38%
13%
19%
15%3%
1%
1%4%
9%
18%
14%
11%
14%
4%
7%
14%
2,215
9,481
19,519
16,649
0
2,000
4,000
6,000
8,000
10,000
12,000
14,000
16,000
18,000
20,000
Reference Adv. Tech.
1990 2013 2040
TWh
Power generation mix in 2040
・ In 2040, coal still accounts for the largest share of power generation. Natural gas-fired power plants globally increase on the introduction of natural gas combined cycle plants. Renewable energy sources including wind and solar energy also expand their share of power generation.
・ In the Advanced Technologies Scenario, coal’s share of power generation declines to 24%, while nuclear, hydro and other renewable energy sources expand their respective shares.
Coal-fired
Natural gas-fired
Oil-fired
Nuclear
Hydro
Other renewables
World Asia
37%
41%35%
24%15%
22%
28%
21%
11%
4%
3%
2%
17%
11%
11%
18%
18%
16%
13%
15%
1%
6%
11%
19%
11,826
23,307
39,509
33,671
0
5,000
10,000
15,000
20,000
25,000
30,000
35,000
40,000
45,000
Reference Adv. Tech.
1990 2013 2040
TWh
18

19
Nuclear Wind Solar PV
4
Unit: TWh 2013 (dashed line) →2040 Reference (inner circle) / 2040 Adv. Tech. (outer circle)
112 → 911/1,362 139
→ 560/753 15
→ 140/243
34 → 308/591
34 → 132/462
3.4 → 39/93
9.3 → 132/216
5.2 → 23/30 14
→ 77/102
139 → 282/345
1.1 → 7.1/11
1.6 → 18/25
42 → 32/63
1.3 → 6.9/16
0.3 → 3.6/8.5
0 → 133/280
0.5 → 2.3/5.7
1.2 → 15/33
China
Japan
India
S. Korea
ASEAN
Taiwan
- Nuclear power generation will continue to increase in China, India and Korea. Vietnam becomes the first country to operate a nuclear power plant in Southeast Asia, followed by other ASEAN countries.
- Wind power expands in China and India. Its diffusion in ASEAN will be limited because of the complex topography.
- Solar power grows at the highest rate. Due to the low load factors, however, it falls behind wind power in terms of power output.
Nuclear and renewables power generation expansion in Asia
12,991 Mtoe
11,313Mtoe
2040Reference
2040Adv. Tech.
UnitedStates
OECDEurope
JapanOther OECD
China
IndiaOther Asia
OtherNon-OECD
Other
Transport
Industry
0
2,000
4,000
6,000
8,000
10,000
12,000
14,000
1990 2000 2013 2020 2030 2040Refer-ence
2040Adv. Tech.
Mtoe
Transport
Non-energyuse
6,2817,085
9,173
10,309
11,735
12,991
Industry
Other
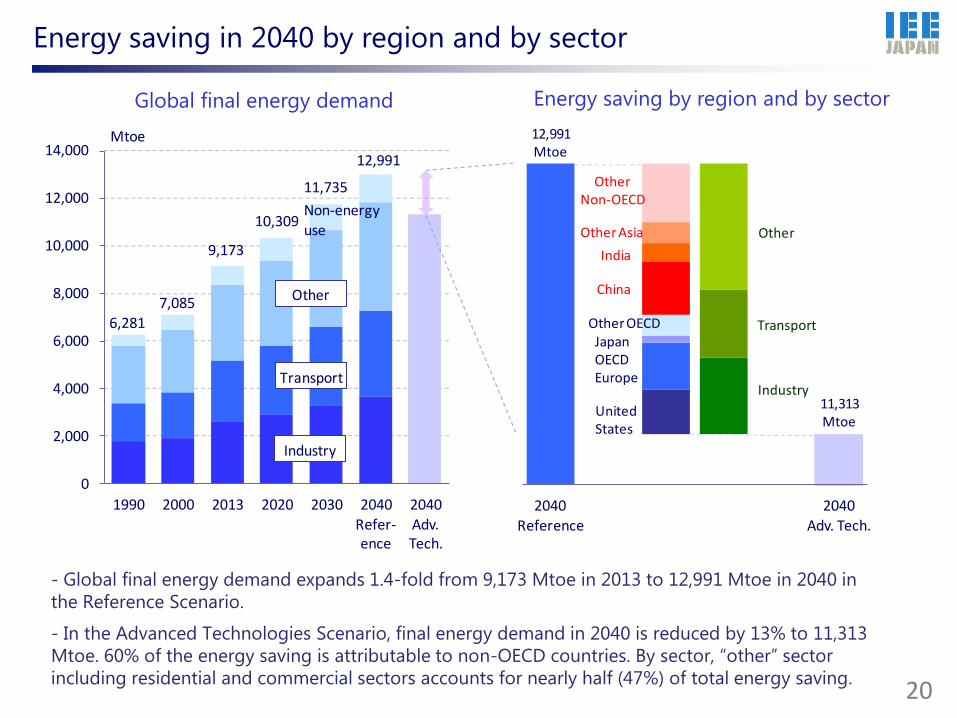
Energy saving in 2040 by region and by sector
- Global final energy demand expands 1.4-fold from 9,173 Mtoe in 2013 to 12,991 Mtoe in 2040 in the Reference Scenario.
20
Global final energy demand Energy saving by region and by sector
- In the Advanced Technologies Scenario, final energy demand in 2040 is reduced by 13% to 11,313 Mtoe. 60% of the energy saving is attributable to non-OECD countries. By sector, “other” sector including residential and commercial sectors accounts for nearly half (47%) of total energy saving.

-60
-30
0
30
60
-0.6
-0.3
0.0
0.3
0.6
N. A
mer
ica
L. A
mer
ica
OEC
DEu
rope
Non
-OEC
DEu
rope Afric
a
Mid
dle
East As
ia
Oce
ania
Cumulative costs/benefitsup to 2040, 2014 USD trillion
Energy saving,Mtoe
Cost
Benefit
Annual energysaving in 2040(right)
-200
-150
-100
-50
0
50
100
150
200
-2.0
-1.5
-1.0
-0.5
0.0
0.5
1.0
1.5
2.0
N. A
mer
ica
L. A
mer
ica
OEC
DEu
rope
Non
-OEC
DEu
rope Afric
a
Mid
dle
East As
ia
Oce
ania
Cumulative costs/benefitsup to 2040, 2014 trillion USD
Energy saving,Mtoe
Cost
Benefit
Annual energy saving in 2040(right)
Costs and benefits of energy saving technologies
High-efficiency vehicles
21
- In the case of high-efficiency lighting such as light-emitting diodes (LED), the benefits induced by energy saving outweigh the costs, resulting in net positive benefits. On the other hand, in many cases the energy saving measures that need huge initial investments bring net negative benefits, because the investments cannot be recouped by energy saving. In these cases, vigorous policies including subsidies and tax incentives are needed to promote energy saving.
- Taking only the “beneficial” energy saving actions is not sufficient to achieve ambitious CO2 reduction targets. Maximum deployment of energy saving technologies, including the more “costly” ones, is indispensable.
High-efficiency lighting

0
10
20
30
40
50
60
Reference Adv. Tech.
2014 USD Trillion
ThermalNuclear
Renewables
Distribution &transmission
Production &transportation
Additional investments
for energy saving
32
52
38.0
14.6 12.5
26.0
19.7 8.1
8.9 4.5
6.0
1.2
3.7
1.7 1.8
4.9 4.1
0.4
1.1 0.6
0.4
0.1
China
India Other Asia
North America
OECD Europe
Non-OECD Europe, FSU
Latin America
Oceania
Middle East
Africa
Japan 1.0 4.0
22
Additional investments in the Advanced Technologies Scenario (cumulative up to 2040)
Cumulative CO2 emissions without CCS, Gt
Cumulative additional investments, 2014 USD trillion
・ On the supply side, while energy supply decreases in the Advanced Technologies Scenario, investments on renewable energy (etc.) expand and the cumulative investments up to 2040 are the same level as the Reference Scenario.
・ On the demand side, additional investments of over 20 trillion USD are required for energy savings. Asian countries, including China and India, account for 42% of the additional investments.
Conclusion: Asia/World Energy Outlook through 2040
• Global and Asian primary energy consumption increase 1.4-fold and 1.6-fold, respectively, through 2040. As energy demand expands rapidly, Asia’s energy self-sufficiency rate continues to fall and that change may destabilize the world energy markets. It also results in increasing global CO2 emissions, causing severe damages to the environment.
• Asian emerging countries, including China and India, hold the key to reducing CO2 and GHG emissions. Without their cooperation, the international community is not able to address the climate change problem. All countries and regions have to adopt maximum measures of efficiency, while maintaining sustainable economic growth.
• The key to solving these problems are energy saving and the decarbonization of energy use. Energy saving measures include the penetration of the technologies that bring more benefits than costs. With only these “beneficial” technologies, however, it would not be possible to achieve a sufficient level of energy saving. Every effort should be made to realize the maximum possible saving of energy consumption, taking more “costly” measures as well.
23

Asia
/Wor
ld E
nerg
y O
utlo
ok 2
015
IEE
J ©
201
5
What do lower prices produce?

Asia
/Wor
ld E
nerg
y O
utlo
ok 2
015
IEE
J ©
201
5
We may see lower prices than in the Reference Scenario
Easy supply-demand balance due to factors in supply and demand sides is assumed in the Lower Price Scenario. Real oil price in 2030 in the scenario is premised to be cheaper by 25% than in the Reference Scenario.
25
❖ Background of the scenarios ❖ Assumption of oil price
Reference Lower Price
Demand Energy conservation and fuel switching in transport sector progress along with the trend.
Strong energy conservation and fuel switching by non-fossil fuel progress.
Supply Conventional resources Development in each country follows its historical trend.
Unconventional resources Production growth in the United States declines in and after 2020s.
Slow development is seen in other countries.
Conventional resources Competition among low-cost producers such as OPEC, Russia, etc. continues.
OPEC effectively loses its power as a cartel organisation.
Unconventional resources Reach the highest levels both inside and outside the United States.
Note: Future prices are in $2014.
75
100
70 75
0
50
100
150
1990 2000 2010 2020 2030$/
bbl
Reference Lower Price
Asia
/Wor
ld E
nerg
y O
utlo
ok 2
015
IEE
J ©
201
5
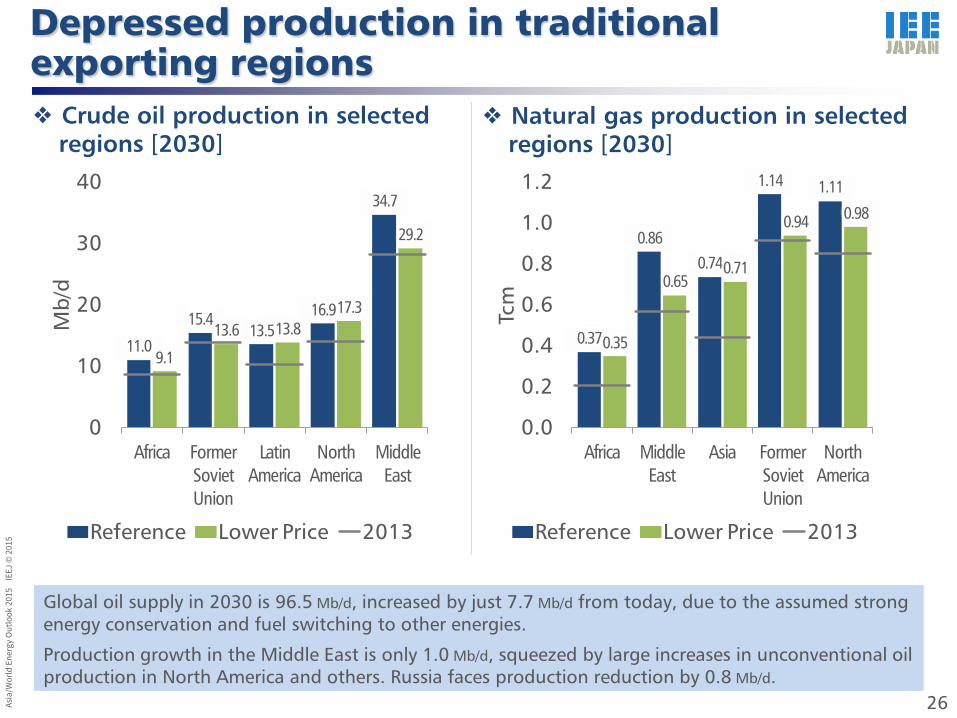
Depressed production in traditional exporting regions
Global oil supply in 2030 is 96.5 Mb/d, increased by just 7.7 Mb/d from today, due to the assumed strong energy conservation and fuel switching to other energies.
Production growth in the Middle East is only 1.0 Mb/d, squeezed by large increases in unconventional oil production in North America and others. Russia faces production reduction by 0.8 Mb/d.
26
❖ Crude oil production in selected regions [2030]
❖ Natural gas production in selected regions [2030]
0.37
0.860.74
1.14 1.11
0.35
0.650.71
0.94 0.98
0.0
0.2
0.4
0.6
0.8
1.0
1.2
Africa Middle East
Asia Former Soviet Union
North America
Tcm
Reference Lower Price 2013
11.0
15.413.5
16.9
34.7
9.1
13.6 13.817.3
29.2
0
10
20
30
40
Africa Former Soviet Union
Latin America
North America
Middle East
Mb/
d
Reference Lower Price 2013
Asia
/Wor
ld E
nerg
y O
utlo
ok 2
015
IEE
J ©
201
5
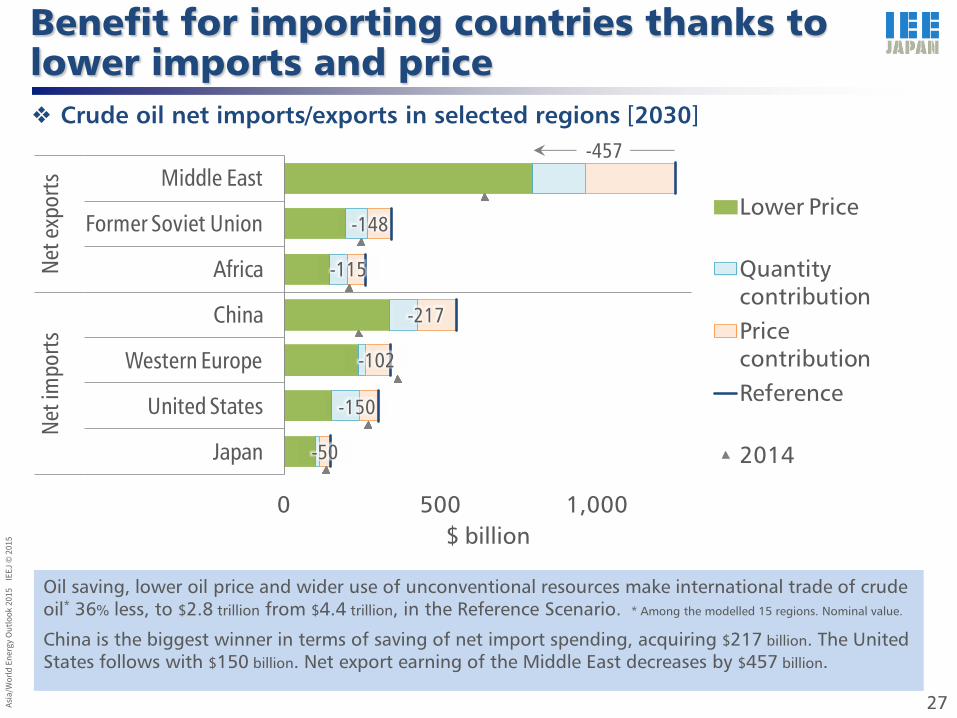
Benefit for importing countries thanks to lower imports and price
Oil saving, lower oil price and wider use of unconventional resources make international trade of crude oil* 36% less, to $2.8 trillion from $4.4 trillion, in the Reference Scenario.
China is the biggest winner in terms of saving of net import spending, acquiring $217 billion. The United States follows with $150 billion. Net export earning of the Middle East decreases by $457 billion.
27
❖ Crude oil net imports/exports in selected regions [2030]
* Among the modelled 15 regions. Nominal value.
0 500 1,000
Japan
United States
Western Europe
China
Africa
Former Soviet Union
Middle East
Net i
mpo
rtsNe
t exp
orts
$ billion
Lower Price
QuantitycontributionPricecontributionReference
2014
-457
-148
-115
-217
-102
-150
-50

Asia
/Wor
ld E
nerg
y O
utlo
ok 2
015
IEE
J ©
201
5
Lower prices support the global economy varying by region
Lower prices and consumption of oil and natural gas vitalise importing countries’ economies through less outflow of national welfare and improvement of real purchasing power. The global economy expands by 1.9%. The situation exerts downward pressure on oil producing countries in the Middle East and others, whose revenue depends heavily on energy exports.
28
❖ Changes in real GDP [2030, compared with the Reference Scenario] European Union
ASEAN
United StatesIndiaJapan China
Oceania
Russia
Middle East
OthersGlobal average
-4%
-2%
0%
2%
0 20 40 60 80 100
Low
er P
rice
Scen
ario
(com
pare
d w
ith
Refe
renc
e Sce
nario
)
Reference Scenario ($2010 trillion)

Asia
/Wor
ld E
nerg
y O
utlo
ok 2
015
IEE
J ©
201
5
Lurking risks of high price and volatility
Oversupply since 2014 is as much as 1 Mb/d, the largest in the last 16 years. We, however, have no experience that oversupply at such a scale continues for three or more years in the last three decades.
The crude oil futures market has grown much faster than actual oil supply and demand. We cannot deny that money and geopolitical factors have a huge influence on oil price again.
29
❖ Global oil supply-demand balance ❖ Global oil demand and volumes of futures
1Q-3Q
Note: Futures of WTI at NYMEX and Brent at ICE. Source: IEA, CME, ICE
-2
-1
0
1
2
1990 2000 2010 2015
Over
dem
and
Mb/
d
Over
supp
ly
354
1,545
85 950
500
1,000
1,500
2005 2010 2015M
b/d
Futures volume Oil demand

Asia
/Wor
ld E
nerg
y O
utlo
ok 2
015
IEE
J ©
201
5
30
Summary: Lower energy prices
▌ Similarities can be found between fall of oil price this time and in 1980s: 1. Huge contribution by increases in supply from new sources, 2. Independent from demand factor caused by economic shock, and 3. Competition among OPEC members.
▌ Oil market fundamentally has a nature that draws cycles. Therefore, oil price turns to rise sooner or later. The similarities, however, suggest possibility that current low price does not end in short term.
▌ Oil price was much higher than indicated by actual supply-demand factor since 2011. We cannot deny that money and geopolitical factors have huge influence on oil price again.
▌ There is risk of supply-demand imbalance in future due to absence of proper investment under extreme unstable prices. Dialogue and cooperation between producers and consumers and among consumers themselves play an important role for sustainable development.
▌ We can assume $75/bbl or lower oil price if policy-driven fossil fuel saving and wider utilisation of unconventional resources by technology development ease supply-demand balance.
▌ Global oil supply in 2030 is 96.5 Mb/d, increased by just 7.7 Mb/d from today, due to assumed strong energy conservation and fuel switching. Production growth in the Middle East is only 1.0 Mb/d squeezed by large increases in unconventional oil production in North America, etc. Russia faces production reduction by 0.8 Mb/d.
▌ Lower import quantity and price result in substantial low import spending for crude oil. Largest fruits are in hands of China.
▌ Reduction in energy import spending supports global economy with 1.9% of expansion, especially for importing countries. Situation exerts downward pressure on oil producing countries in the Middle East and others, whose revenue depends heavily on energy exports.
❖ How do we see the current oil price? ❖ Impact by lower prices [2030]
Addressing climate change issues

Note: Total figures include international bunkers.
- The share of the ANNEX I countries with reduction obligations under the Kyoto Protocol was 40% in 1990. It declined to 22% in 2013, and will decline further to 15% by 2050.
0
5
10
15
20
25
30
35
40
45
50
1990 2000 2013 2030 2030Adv. Tech.
+CCS
2050 2050Adv. Tech.
+CCS
GtCO2
21.223.5
32.9
39.5
45.9
23.3
32.6
Australia, etc. Russia Japan Europe
China
India
Other Asia
United States
Others
32
CO2 Emissions by region
- Global energy-related CO2 emissions will increase 1.4 times from 2013 to 2050. The expansion is especially rapid in India and other Asian countries, as well as Africa, the Middle East and Latin America.

21.223.5
32.9
35.7
39.5
42.7
45.9
33.532.6
28.2
23.3
15
20
25
30
35
40
45
50
1990 2000 2013 2020 2030 2040 2050
GtCO2
省エネルギー
バイオ燃料
太陽光・風力等
原子力
燃料転換
CCSレファレンス
技術進展+CCS2050年半減
GtCO2 ShareEnergy saving 8.3 37%Biofuel 0.2 1%Wind, solar, etc. 3.0 14%Nuclear 2.4 11%Fuel switching 1.4 6%CCS 7.2 32%Total 22.6 100%
CO2 reduction share in 2050
33
CO2 Emissions Reduction by Technology (World)
・ In the Advanced Technologies Scenario, the global CO2 emissions are reduced by various technological options, including energy saving, enhancement of power generation efficiency, renewables, nuclear and CCS. Altogether these options contribute to large CO2 emissions reduction.
・ To achieve halving global CO2 emissions from current levels, additional measures such as innovative technological development and eco-friendly urban development are required in the long-term.
Energy saving Biofuel Wind, solar, etc. Nuclear Fuel switching CCS Reference Adv. Tech. +CCS 50% reduction by 2050
34
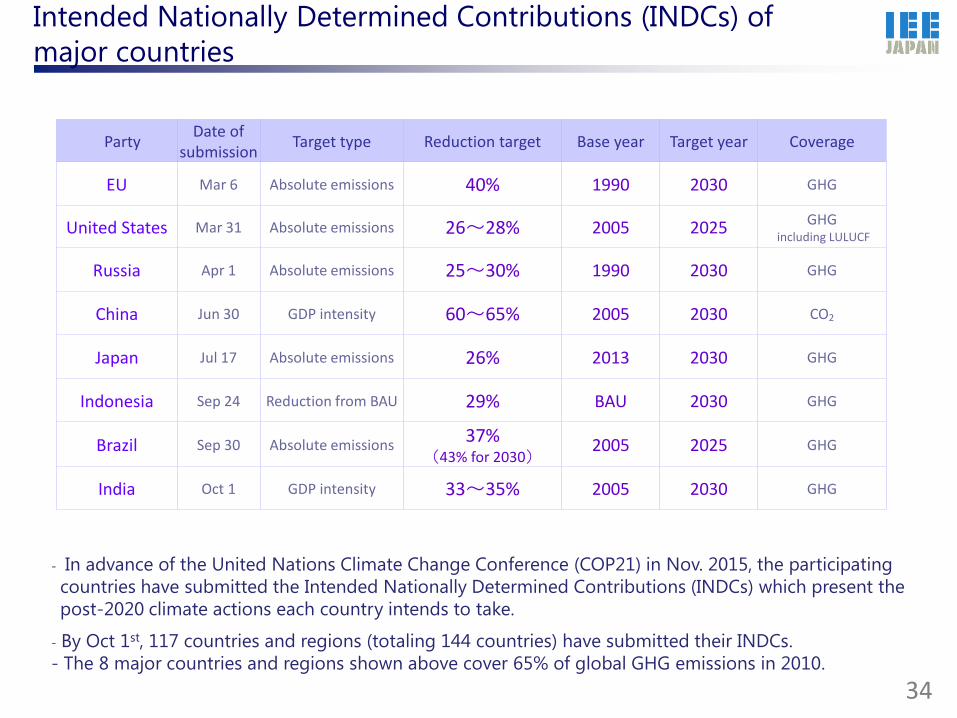
- In advance of the United Nations Climate Change Conference (COP21) in Nov. 2015, the participating countries have submitted the Intended Nationally Determined Contributions (INDCs) which present the post-2020 climate actions each country intends to take.
- By Oct 1st, 117 countries and regions (totaling 144 countries) have submitted their INDCs. - The 8 major countries and regions shown above cover 65% of global GHG emissions in 2010.
Party Date of submission Target type Reduction target Base year Target year Coverage
EU Mar 6 Absolute emissions 40% 1990 2030 GHG
United States Mar 31 Absolute emissions 26~28% 2005 2025 GHG including LULUCF
Russia Apr 1 Absolute emissions 25~30% 1990 2030 GHG
China Jun 30 GDP intensity 60~65% 2005 2030 CO2
Japan Jul 17 Absolute emissions 26% 2013 2030 GHG
Indonesia Sep 24 Reduction from BAU 29% BAU 2030 GHG
Brazil Sep 30 Absolute emissions 37% (43% for 2030)
2005 2025 GHG
India Oct 1 GDP intensity 33~35% 2005 2030 GHG
Intended Nationally Determined Contributions (INDCs) of major countries

0
10,000
20,000
30,000
40,000
50,000
60,000
70,000
1990 1995 2000 2005 2010 2015 2020 2025 2030
ReferenceAdv. Tech.INDCIEA Bridge50% reduction by 2050
MtCO2-eq
Comparison of INDCs with the Reference/Adv. Tech. Scenarios
35
- The future evolution of global GHG emissions suggested by the INDCs of the 8 parties traces a path similar to that of the Reference Scenario. Thus, climate actions based on the INDCs are not sufficient to reach the Advanced Technologies Scenario, being far behind the target of “50% reduction by 2050.”
0 500
1,000 1,500 2,000 2,500 3,000 3,500 4,000 4,500
1990 2000 2010 2020 2030
MtCO2-eq
0
200
400
600
800
1,000
1,200
1,400
1,600
1990 2000 2010 2020 2030
MtCO2-eq
0
1,000
2,000
3,000
4,000
5,000
6,000
1990 2000 2010 2020 2030
MtCO2-eq
0
1,000
2,000
3,000
4,000
5,000
6,000
7,000
1990 2000 2010 2020 2030
ReferenceAdv. Tech.INDC
MtCO2-eq
0 1,000 2,000 3,000 4,000 5,000 6,000 7,000 8,000 9,000
1990 2000 2010 2020 2030
MtCO2-eq
0
2,000
4,000
6,000
8,000
10,000
12,000
14,000
1990 2000 2010 2020 2030
ReferenceAdv. Tech.INDC
MtCO2
United States EU
China India Russia
Japan
36
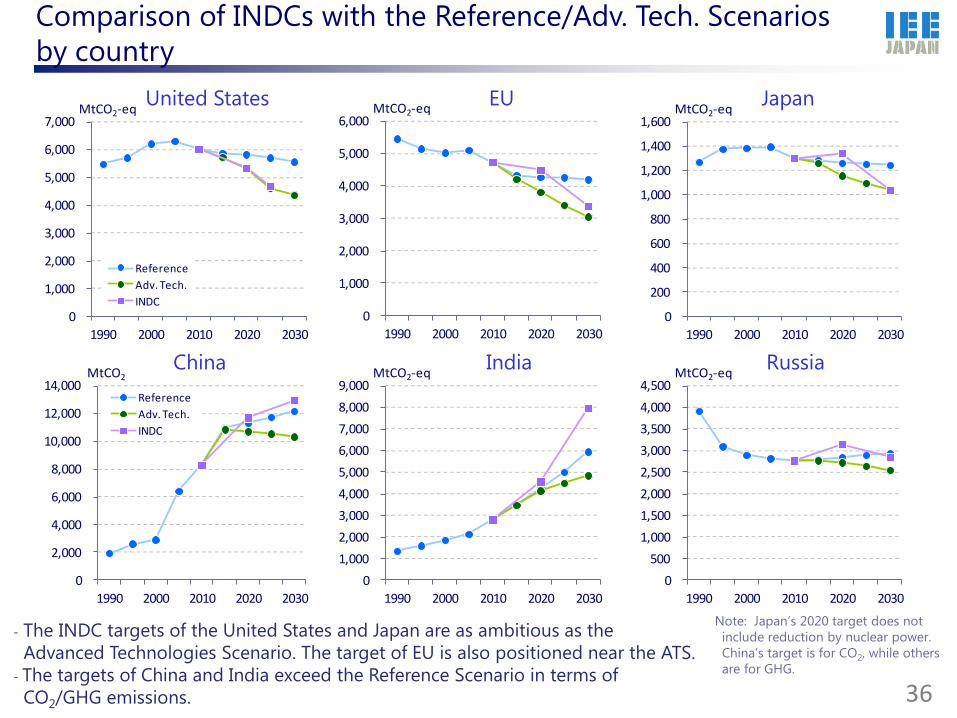
- The INDC targets of the United States and Japan are as ambitious as the Advanced Technologies Scenario. The target of EU is also positioned near the ATS. - The targets of China and India exceed the Reference Scenario in terms of CO2/GHG emissions.
Note: Japan’s 2020 target does not include reduction by nuclear power. China’s target is for CO2, while others are for GHG.
Comparison of INDCs with the Reference/Adv. Tech. Scenarios by country

1990 2000 2010 2020 2030
0
20
40
60
80
100
120
140
0
50
100
150
1990 2005 2013 2020 2030
2005=100 1990 2000 2010 2020 2030
0
20
40
60
80
100
120
140
0
50
100
150
1990 2005 2013 2020 2030
2005=100
Comparison of CO2/GHG intensities (China and India)
China India
Reference
Adv. Tech. INDC
INDC Reference Adv. Tech.
INDC: 60 to 65% reduction from 2005
INDC: 33 to 35% reduction from 2005
- In most countries including emerging nations, the GHG intensity (i.e. GHG emission divided by real GDP) has rapidly been declining, even though total GHG emission has been increasing. - The continuation of the historical trends (the Reference Scenario) shows that the targets are hardly challenging.
Assumed the reduction rate of CO2 intensity as identical to that of GHG intensity.
37
38
Mitigation
GHG emission Climate change
Adaptation
Damage
Trade-off
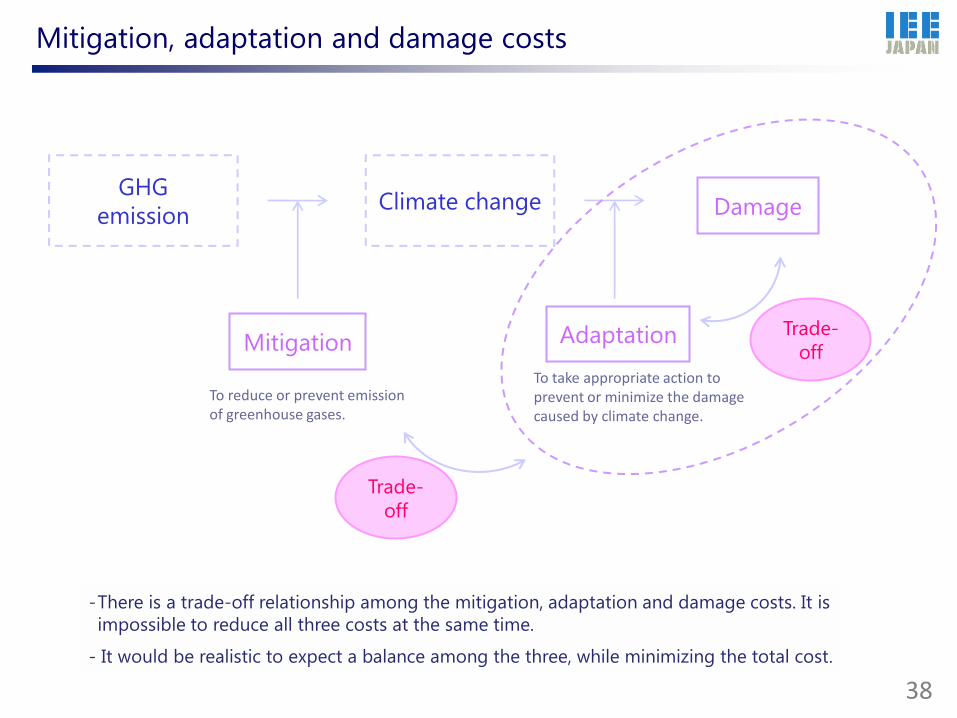
To take appropriate action to prevent or minimize the damage caused by climate change.
Trade-off
-There is a trade-off relationship among the mitigation, adaptation and damage costs. It is impossible to reduce all three costs at the same time.
- It would be realistic to expect a balance among the three, while minimizing the total cost.
To reduce or prevent emission of greenhouse gases.
Mitigation, adaptation and damage costs

300
400
500
600
700
800
900
2000 2020 2040 2060 2080 2100
レファレンス相当
技術進展+CCS相当
2050年半減
ppm
0
1
2
3
4
2000 2020 2040 2060 2080 2100
レファレンス相当
技術進展+CCS相当
2050年半減
°C
39
GHG concentration Temperature change from 1850-1900
-The results of the Reference Scenario correspond to a level of GHG concentration in the atmosphere in 2100 in the range of 760-860 ppm (CO2-eq.), with the average temperature rise from 1850-1900 reaching between 2.8-4.0°C the same year.
- On the other hand, the Advanced Technologies Scenario is comparable to GHG concentrations in 2100 of 540-600 ppm (CO2-eq.), with the average rise in temperature between 1.7 and 2.4°C. This is lower than 2.5°C and possibly lower than 2°C by 2100.
Reference Adv. Tech. +CCS 50% reduction by 2050
Reference
Adv. Tech. +CCS
50% reduction by 2050
ppm CO2-eq.
Reference, Adv. Tech. and “50% reduction by 2050” scenarios

0100200300400500600700800900
2000 2020 2040 2060 2080 2100
CO2換算ppm 843
663
495
ppm CO2-eq
-100
10203040506070
2000 2020 2040 2060 2080 2100
Gt
50.4
15.4
-3.4
RCP6.0 (720-1000ppm category)
RCP4.5 (580-720ppm categories)
RCP2.6 (450ppm category)
Concentration of CO2-eq in 2100,
ppm CO2-eq
Sub-category
Change in GHG emissions from 2010 to 2050, %
2100 temperature change relative to 1850-1900 (℃)*
450 (430-480)
Overshoot (vast majority) -72 to -41 1.5 - 1.7
(1.0 - 2.8)
500 (480-530)
No overshoot -57 to -42 1.7 - 1.9 (1.2 - 2.0)
Overshoot -55 to -25 1.8 - 2.0 (1.2 - 3.3)
550 (530-580)
No overshoot -49 to -19 2.0 - 2.2 (1.4 - 3.6)
Overshoot -16 to +7 2.1 - 2.3 (1.4 - 3.6)
(580-650) -38 to +24 2.3 - 2.6 (1.5 - 4.2)
(650-720) -11 to +17 2.6 - 2.9 (1.8 - 4.5)
(720-1000) +18 to +54 3.1 - 3.7 (2.1 - 5.8)
*Temperatures in parentheses include carbon cycle and climate system uncertainties
Scenarios in IPCC AR5 WG3
Source: IPCC AR5 WG3
- For the Representative Concentration Pathway (RCP) 2.6, which is a typical scenario for the “450ppm” category, the GHG concentration is estimated around 500 ppm CO2-eq in 2100. In a longer term, the concentration declines to some 450 ppm.
- This scenario assumes 64% reduction of fossil CO2 from 2010 to 2050, and negative emissions after 2070. It is much more ambitious than the “50% reduction by 2050” target. 40
Fossil CO2 emissions
CO2-eq concentration
RCP6.0
RCP4.5
RCP2.6 Decline to ~450ppm
※Calculated using MAGICC 6.0 Meinshausen, M., S. C. B. Raper and T. M. L. Wigley (2011). "Emulating coupled atmosphere-ocean and carbon cycle models with a simpler model, MAGICC6: Part I – Model Description and Calibration." Atmospheric Chemistry and Physics 11: 1417-1456.
450 ppm category in IPCC 5th Assessment Report
-2
0
2
4
6
8
10
12
14
16
0% 20% 40% 60% 80%Reduction from the Reference Scenario
2014 USD trillion/year
Total (A+B)
Damage +adaptation cost (B)
Mitigation cost (A)
-2
0
2
4
6
0% 20% 40% 60%
2014 USD trillion/year
Reduction from the Reference Scenario
50% reductionby 2050
Adv. Tech+CCS
Mitigation cost (A)
Damage +adaptation cost (B)
Total (A+B)
41
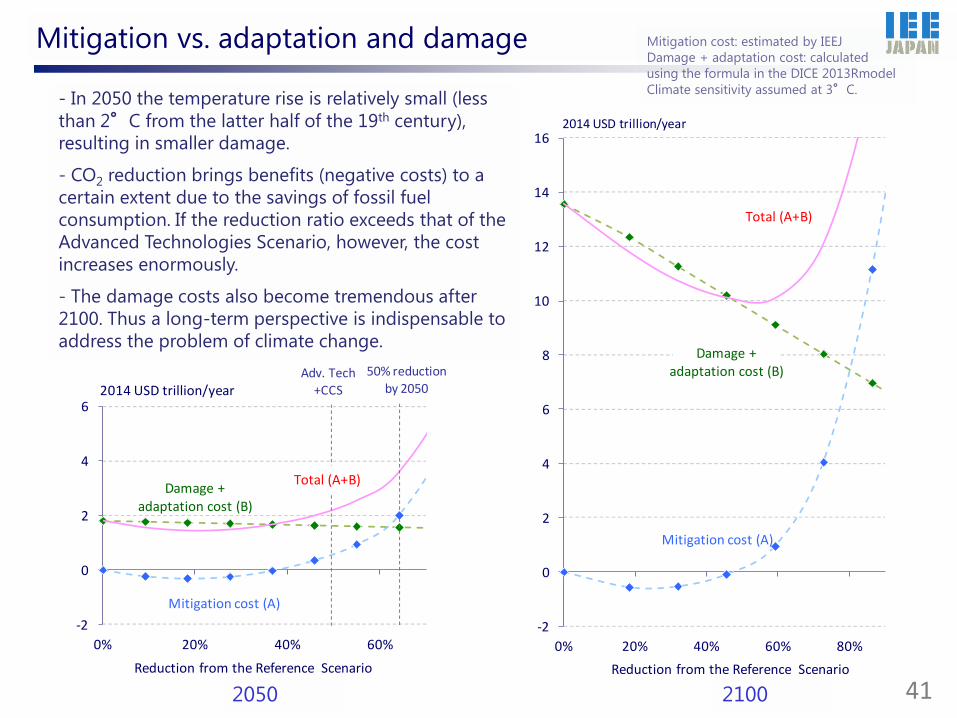
- In 2050 the temperature rise is relatively small (less than 2°C from the latter half of the 19th century), resulting in smaller damage.
- CO2 reduction brings benefits (negative costs) to a certain extent due to the savings of fossil fuel consumption. If the reduction ratio exceeds that of the Advanced Technologies Scenario, however, the cost increases enormously.
- The damage costs also become tremendous after 2100. Thus a long-term perspective is indispensable to address the problem of climate change.
2050 2100
Mitigation cost: estimated by IEEJ Damage + adaptation cost: calculated using the formula in the DICE 2013Rmodel Climate sensitivity assumed at 3°C.
Mitigation vs. adaptation and damage
-100
0
100
200300
400
500
600
700
0% 20% 40% 60%
Marginal Abatement Cost
Reduction from BaU
Steephike
Gradual increase
0
500
1000
1500
0 1 2 3 4 5 6 7 8 9 10
42
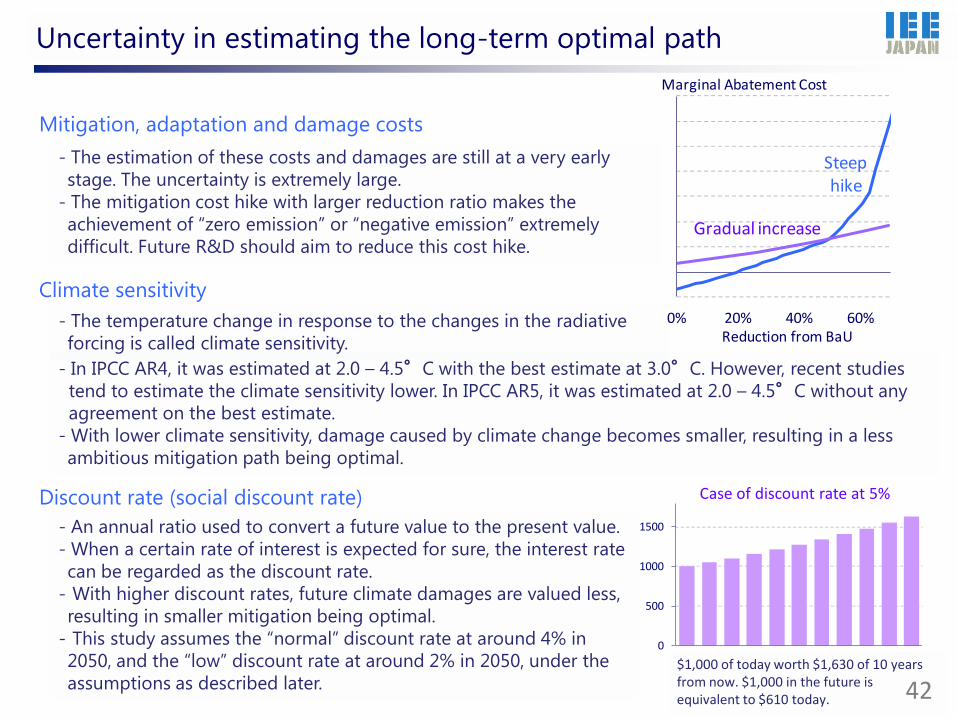
- The estimation of these costs and damages are still at a very early stage. The uncertainty is extremely large.
- The mitigation cost hike with larger reduction ratio makes the achievement of “zero emission” or “negative emission” extremely difficult. Future R&D should aim to reduce this cost hike.
- The temperature change in response to the changes in the radiative forcing is called climate sensitivity.
- An annual ratio used to convert a future value to the present value. - When a certain rate of interest is expected for sure, the interest rate can be regarded as the discount rate.
- With higher discount rates, future climate damages are valued less, resulting in smaller mitigation being optimal.
- This study assumes the “normal” discount rate at around 4% in 2050, and the “low” discount rate at around 2% in 2050, under the assumptions as described later.
Climate sensitivity
Discount rate (social discount rate)
Mitigation, adaptation and damage costs
Case of discount rate at 5%
$1,000 of today worth $1,630 of 10 years from now. $1,000 in the future is equivalent to $610 today.
Uncertainty in estimating the long-term optimal path
- In IPCC AR4, it was estimated at 2.0 – 4.5°C with the best estimate at 3.0°C. However, recent studies tend to estimate the climate sensitivity lower. In IPCC AR5, it was estimated at 2.0 – 4.5°C without any agreement on the best estimate. - With lower climate sensitivity, damage caused by climate change becomes smaller, resulting in a less ambitious mitigation path being optimal.

0
5
10
15
20
25
30
35
40
45
50
1990 2010 2030 2050 2080
Reference
Adv. Tech.
50% reduction by 2050
GtCO2
Sensitivity analysiscompared with the "normal" assumptions:
① Mitigation cost: 2 times
② Damage: one half
③ Climate sensitivity: 2.5°C
④ Damage: 2 times
⑤ Mitigation cost: one half
⑥ "Low" discount rate
①
②
④
⑥
③
⑤
Optimal path for climate sensitivity of 3°C and "normal" discount rate assumption
43
- The optimal path considering mitigation and adaptation costs and climate damage shows a downward trend of CO2 emission from the current level, although the uncertainty is very large.
-These calculations suggest that the paths to reduce 50% or more from current levels by 2050 result in enormous mitigation costs compared with the damage, and cannot be regarded as optimal, even assuming lower discount rates.
- In order to achieve zero or negative emissions in a longer term, technological innovation would be needed to reduce the cost hike with larger CO2 reduction ratios.
Example of the calculation of the long-term optimal path

The “social discount rate” ρ can be formulated as follows (Ramsey’s formula):
44
δ: Pure rate of time preference g: Growth rate of per capita consumption η: Elasticity of marginal utility with respect to consumption
Calibrate the parameters to match the observed market interest rates.
Example: δ=1.5%、η=1.45 (DICE 2013R model)
⇒ Discount rate: 5% in 2010, 4% in 2050 and 3.5% in 2100
Set the parameters normatively irrespective of the observed interest rates, from the viewpoint of intergenerational justice.
Example: δ=0.1%、η=1.0 (Stern review)
ρ=δ+ηg
“Standard” assumption
“Low” assumption
0%
1%
2%
3%
4%
5%
6%
2010 2050 2100 2150
「標準」想定
「低」想定
⇒ Discount rate: 3.5% in 2010, 2% in 2050 and 1.5% in 2100
If the economic (and consumption) growth rate declines in the future, the discount rate also declines according to this formula.
“Standard” assumption
“Low” assumption
Social discount rate

45
Technology Overview and challenges
Reducing the production
of CO2
Next generation nuclear power
Advanced nuclear technologies under development worldwide, including fast breeder reactors, high temperature gas-cooled reactors, molten salt reactors and small modular reactors.
Nuclear fusion
Unlike the conventional nuclear technologies that exploit the energy released by the fission of heavy nuclei, nuclear fusion makes use of the energy released during the reaction (fusion) of light nuclei. This technology could possibly result in a almost limitless supply of energy, without producing spent fuels as high-level radioactive wastes.
Space Solar Power System (SSPS)
A system that transmits energy from space-based solar power plants to the ground in the form of microwaves or laser beams. It can generate power stably with almost no influence from the weather. Reducing the costs of mass transition through space is one of the major challenges.
Preventing the release
of CO2 to the atmosphere
Bioenergy and Carbon Capture and Storage (BECCS)
The technology to capture and store the carbon dioxide released by burning biofuels. If the biofuel can be regarded as carbon neutral, this technology makes it possible to achieve negative emissions. Barriers to large-scale deployment of BECCS include risks related to transport and provision of biomass feedstock.
Utilizing the produced
CO2
Carbon Capture and Utilization (CCU)
The technologies to capture and use carbon dioxide as industrial materials, etc. Large-scale processing of CO2 is one of the major challenges.
Artificial photosynthesis A chemical process to convert sunlight, water and carbon dioxide into carbohydrates and oxygen. As with the BECCS technology, it could realize negative emissions. Major challenges include the development of the catalysis to split water into hydrogen and oxygen.
Innovative technology development towards the future

Conclusion: Addressing climate change issues
・ With the climate actions suggested by the INDCs of major countries, it would not be possible to curb GHG emissions to sufficient levels. It is strongly expected that each party tries its best to reduce GHG emissions further.
・ From this point of view, it is necessary to take actions against climate change considering various scenarios and options other than only the “450ppm” scenario.
・ At the same time, we should note that there is a trade-off relationship among the mitigation, adaptation and damage costs. It would be realistic to expect a balance among the three, while minimizing the total cost. Otherwise no international agreements would be obtained.
・ Long-term measures have to be taken beyond 2050 to reduce global CO2 emissions drastically. In addition to existing technologies, innovative technologies including CCS, CCU and artificial photosynthesis have to be developed to accomplish the target.
46