assessing impacts of value the tropical agricultural ... impacts of value chain development on...
TRANSCRIPT

Assessing Impacts of Value Chain Development on Poverty
EditorsRee Sheck
Jason Donovan Dietmar Stoian
A Case-Study Companion to the 5Capitals Tool
The Tropical Agricultural Research and Higher Education Center (CATIE) is a regional center dedicated to research and graduate education in agriculture, and the management, conservation and sustainable use of natural resources. Its members include the Inter-American Institute for Cooperation on Agriculture (IICA), Belize, Bolivia, Colombia, Costa Rica, Dominican Republic, El Salvador, Guatemala, Honduras, Mexico, Nicaragua, Panama, Paraguay, Venezuela, Spain and the State of Acre in Brazil.
The World Agroforestry Centre (ICRAF) is a CGIAR Consortium Research Centre. ICRAF’s headquarters are in Nairobi, Kenya, with five regional offices located in Cameroon, India, Indonesia, Kenya and Peru. The Centre’s vision is a rural transformation in the developing world as smallholder households strategically increase their use of trees in agricultural landscapes to improve their food security, nutrition, income, health, shelter, social cohesion, energy resources and environmental sustainability. The Centre’s mission is to generate science-based knowledge about the diverse roles that trees play in agricultural landscapes, and to use its research to advance policies and practices, and their implementation, that benefit the poor and the environment.
Bioversity International is a world leading research-for-development non-profit organization, working towards a world in which smallholder farming communities in developing countries are thriving and sustainable. Bioversity International’s purpose is to investigate the use and conservation of agricultural biodiversity in order to achieve better nutrition, improve smallholders’ livelihoods and enhance agricultural sustainability. Bioversity International works with a global range of partners to maximize impact, to develop capacity and to ensure that all stakeholders have an effective voice. Bioversity International is a member of the CGIAR Consortium.
Ass
essi
ng Im
pact
s of
Val
ue C
hain
Dev
elop
men
t on
Pove
rty

Assessing Impacts of Value Chain Development on PovertyA Case-Study Companion to the 5Capitals Tool
EditorsRee Sheck
Jason Donovan Dietmar Stoian
Tropical Agricultural Research and Higher Education Center (CATIE)World Agroforestry Centre Centre (ICRAF)
Bioversity International2013
Technical SeriesTechnical Report no. 396Rural Enterprise Development Collection no. 8

Designer: Rocío Jiménez
© Tropical Agricultural Research and Higher Education Center (CATIE), World Agroforestry Centre Centre (ICRAF) and Bioversity International, 2013
ISBN 978-9977-57-617-6
The opinions and statements expressed in this document are those of the authors and do not necessarily represent the views of CATIE, World Agroforestry Centre or Bioversity International. Total or partial reproduction is authorized provided the source is acknowledged.

3
ContentsAcknowledgements . . . . . . . . . . . . . . . . . . . . . . . . . . . . . . . . . . . . . . . . . . . . . . . . . . . . . . . . . . . . . . . . . . .5
An asset-based approach to achieving pro-poor value chain development: Introduction to 5Capitals case studies Dietmar Stoian and Jason Donovan . . . . . . . . . . . . . . . . . . . . . . . . . . . . . . . . . . . . . . . . . . . . . . . . . . . . . . . .7
Building assets through access to specialty coffee markets: Lessons from smallholders and cooperatives in NicaraguaJason Donovan . . . . . . . . . . . . . . . . . . . . . . . . . . . . . . . . . . . . . . . . . . . . . . . . . . . . . . . . . . . . . . . . . . . . . . . . 15
Linking smallholder fruit and vegetable farmers to supermarkets: An assessment of the Seed II project in Nariño, ColombiaCatalina Robledo de Eikenberg . . . . . . . . . . . . . . . . . . . . . . . . . . . . . . . . . . . . . . . . . . . . . . . . . . . . . . . . . . 36
Through the Garden Gate: Improving livelihoods of women in Afghanistan through horticultural productionLeah Katerberg . . . . . . . . . . . . . . . . . . . . . . . . . . . . . . . . . . . . . . . . . . . . . . . . . . . . . . . . . . . . . . . . . . . . . . . . 51
Interventions to expand market opportunities for makers of handwoven fabrics: Lessons from the Chanderi region, IndiaAdarsh Kumar . . . . . . . . . . . . . . . . . . . . . . . . . . . . . . . . . . . . . . . . . . . . . . . . . . . . . . . . . . . . . . . . . . . . . . . . . 63
Building a value chain for organic vegetables with smallholders in Appalachia, United StatesAimee Russillo . . . . . . . . . . . . . . . . . . . . . . . . . . . . . . . . . . . . . . . . . . . . . . . . . . . . . . . . . . . . . . . . . . . . . . . . . 83
Success in pro-poor value chain development linked to asset endowments: This and other lessons from the 5Capitals toolJason Donovan, Dietmar Stoian, John Fisk and Michelle F. Muldoon . . . . . . . . . . . . . . . . . . . . . . . . 104
4
Assessing Impacts of Value Chain Development on Poverty: A Case-Study Companion to the 5Capitals Tool
The 5Capitals toolkit provides those interested in value chain development with an innova-tive framework for assessing outcomes and impacts. The framework focuses on understanding the needs and circumstances of smallholders and local enterprises engaged in value chain development and helping shareholders in value chain development to design interventions that better respond to these actors.
The 5Capitals manual, titled 5Capitals: A Tool for Assessing the Poverty Impacts of Value Chain Development, was designed by an international team of development practitioners, researchers and donors and was tested extensively in Asia, Africa, the United States and Latin America. Design of the tool was led by CATIE with financial support from the Ford Foundation.
Since publication of the manual, CATIE has partnered with ICRAF and Bioversity International to provide additional tools and guidance for assessing the poverty impacts of value chain development. This case study companion represents an important outcome of this collaboration. We hope that the companion provides useful insights on implementation of the 5Capitals manual and how the results from implementation can form the basis of learning platforms among stakeholders in value chain development.

5
Acknowledgements
Assessing Impacts of Value Chain Development on Poverty: A Case-Study Companion to the 5Capitals Tool was supported with grants from the Ford Foundation, coordinated by the Tropical Agricultural Research and Higher Education Center (CATIE). We wish to thank the program officers at the foundation who made import-ant contributions to the conceptual and methodological frameworks that underpin the design of 5Capitals and for their support on this companion volume.
We are grateful to the team of specialists in value chain development and impact assessment who helped select and provided extensive preliminary comments on the five case studies presented here: Graham Thiele, International Potato Center; Shanna Ratner, Yellow Wood Associates; and Leah Katerberg, Technoserve.
Profound gratitude goes to Claudia Romero of the University of Florida who made important contributions as an external reviewer of the case study volume through her thoughtful and thorough comments.
The World Agroforestry Centre (ICRAF) and Bioversity International provided critical support during devel-opment of this case study companion through coverage of staff time and expenses for design and printing. This work was carried out under CGIAR research programs on Policies, Institutions and Markets (PIM) and Roots, Tubers and Bananas (RTB).
We are grateful to the authors of the case studies presented here for their willingness to revisit their studies and provide the information necessary for this publication. Thanks also go to the many farmers, artisans and representatives of businesses, NGOs and government agencies that contributed to the case studies.
Finally, we thank Rocio Jimenez of the CATIE communications office for her artful design of the document.
Ree Sheck Jason Donovan Dietmar Stoian Turrialba, Costa Rica Lima, Peru Montpellier, France


7
An asset-based approach to achieving pro-poor value chain development: Introduction to 5Capitals case studies
Dietmar Stoian and Jason Donovan1
SummaryOver the past decade, many governmental, private or donor-funded programs have adopted value chain development (VCD) to address goals related to poverty reduction and economic development. Underlying the design of these programs is the assumption that smallholders will climb out of poverty when they organize into rural enterprises, when these enterprises link them to business partners committed to win-win relationships, and when the chain actors have access to the right mix of technical, business and financial services. However, despite considerable investments in VCD, we have a poor understanding of whether the underlying assump-tions hold true. A major stumbling block to understanding has been the absence of sound metric systems to monitor progress and assess the impact of VCD initiatives. The 5Capitals tool, developed jointly by an alli-ance of research and development organizations, addresses this shortcoming by proposing an asset-based approach to assess the poverty impacts of VCD. The tool has been tested through 23 case studies carried out over two iterations in Asia, Africa, Latin America and North America. This chapter summarizes the process for development of the tool and the concepts that underpin its design, including the rationale for adopting an asset-based approach to pro-poor VCD. It introduces the five case studies selected for this volume to docu-ment the versatility of the tool for diverse value chains in various stages of development. It concludes with an overview of what the reader can expect in terms of insight from the case studies.
1 Dietmar Stoian is leader of the Commodity Systems and Genetic Resources Program for Bioversity International; Jason Donovan is a marketing specialist at the World Agroforestry Centre (ICRAF), based in Lima; Contact author: [email protected].

8
Assessing Impacts of Value Chain Development on Poverty: A Case-Study Companion to the 5Capitals Tool
1 Why focus on assets to understand value chain development?
Value chain development (VCD) gained momen-tum in the early 2000s in response to the Millennium Development Goals and other international and national initiatives aimed at reducing rural poverty. At the same time, two significant factors coalesced to help move VCD toward the top of the agenda of national and local governments, private com-panies and bilateral and multilateral donors and development organizations: 1) structural changes in international food and forest product markets (for example, increased demand for food quality and safety as well as environmental and social attributes) and 2) the need for greater impact and sustainabil-ity of development interventions through increased private-sector involvement. In many cases, the inter-ventions had diverse and potentially conflicting goals, such as poverty reduction, business develop-ment and environmental conservation.
Underlying these approaches is the assumption that investments in building stronger linkages between smallholder farmers and buyers or processors in higher-value markets will increase business perfor-mance, provide incentives for sustainable resource management and/or reduce poverty—either directly through increased incomes or employment or indi-rectly through spillover effects in local economies.2 We do not know the extent to which these assump-tions hold. Many VCD initiatives have failed to provide evidence on their expected outcomes, and
the few reports that exist tend to provide isolated information on employment and income and fail to address trade-offs between different livelihood activities.3 We know that effective approaches to poverty reduction require accountability by inter-vening organizations as well as learning focused on the impacts of development research and practice. However, there is consensus that accountability and learning related to rural development is in short supply.4,5,6 A narrow focus on employment and income as proxies for poverty reduction has come under criticism,7 particularly when the focus is on a given value chain with no attention to other livelihood activities geared toward the market or subsistence.8
In reality, VCD involving the poor takes place in a context of diversified smallholder livelihood strate-gies based on a combination of on-farm and off-farm activities, with farming—whether on one’s own land or someone else’s—being one among several live-lihood pursuits. The struggle to make a living often involves temporary or more permanent forms of migration, where remittances may be critical for productive investments and household consump-tion. Smallholders may have a surplus to sell in the market only for certain crops and not necessarily every year. Employment and income shift accord-ingly and smallholder priorities may not always be in line with the investment of capital and labor needed to upgrade their participation in a given value chain. Smallholders optimize their diversified livelihood systems rather than any particular subsystem, such
2 UNIDO (United Nations Industrial Development Organization). 2011. Pro-poor value chain development: 25 guiding questions for designing and implementing agroindustry projects. Vienna, Austria, UNIDO.
3 Zandniapour, L; Sebstad, J; Snodgrass, D. 2004. Review of evaluations of selected enterprise development projects. Microenterprise Report 3, Washington, D.C., USAID.
4 Horton, D; Mackay, R. 1999. Evaluation in developing countries: an introduction. Knowledge, Technology and Policy 11(4):5–12.
5 Roche, C. 2001. Impact assessment for development agencies: learning to value change. Oxford, UK, Oxfam GB.
6 Adato, M; Meinzen-Dick, R. 2002. Assessing the impact of agricultural research on poverty using the sustainable livelihoods framework. FCND Discussion Paper 128, IFPRI, Washington, D.C.
7 Ton, G; Vellema, S; de Ruyter de Wildt, M. 2011. Development impacts of value chain interventions: how to collect credible evidence and draw valid conclusion in impact evaluations? Journal and Chain Network Science 11(1):69–84.
8 Stoian, D; Gottret, MV. 2011. Ejes estratégicos para el fortalecimiento de cadenas. In Memorias del Simposio Regional “Cadenas productivas y desarrollo económico rural en Latinoamérica,” held February 9–11, 2011, in Quito, Ecuador. CONCOPE, Quito, Ecuador, pp. 125–149.

9
An asset-based approach to achieving pro-poor value chain development: Introduction to 5Capitals case studies
as production and commercialization of cash crops related to a specific value chain.
Against this backdrop, a focus on assets (human, social, natural, physical and financial capitals) offers a broader understanding of smallholder livelihood realities and needs.9 An asset-based approach sheds light on the access to and quality of the assets as well as the dynamics of asset building or erosion. It is the endowment with and the wise use of such assets that permits smallholder households to respond to shocks, adverse trends and seasonality and to take advantage of new market opportunities and institu-tional constellations.10,11,12
2 5Capitals—the tool development process
In response to the aforementioned shortcomings in VCD and assessment, an international alliance of research and development organizations, led by CATIE (Tropical Agricultural Research and Higher Education Center) and with financial support from the Ford Foundation, collaborated between 2008 and 2012 to develop a tool13 that incorporates the following principles and elements:
•Asset-based approach that views changes in livelihood and business assets (human, social, natural, physical and financial capitals) as appro-priate metrics for assessing poverty reduction and improved business performance in the upstream segments of the value chain
•Impact pathways, based on a predefined set of expected outcomes at household and enterprise levels that provides the basic framework for indicator selection and developing a theory of
change for achieving pro-poor and sustainable value chains (for a generic impact pathway, see figure 1).
•Insights from multiscale and multidimensional analysis to determine the combined effects of multiple-source interventions on asset building at the household and enterprise levels and to distinguish between changes induced by VCD and by the context
•Organizational learning through involvement of VCD stakeholders throughout the process and use of the findings to redesign VCD initiatives and reallocate resources accordingly
The tool, denominated 5Capitals to underline its asset-based approach, was expected to balance the conflicting goals of achieving sufficient rigor to pro-duce credible and useful results and providing a low-cost methodology that would be relatively easy to implement. Development of such a tool called for an international collaborative effort involving both researchers and development practitioners from Asia, Africa, Latin America and North America (for an overview, see table 1). The process took place in two phases. During phase 1 (June 2008–October 2009), a first version of the tool was developed and tested through 11 case studies in Asia, Africa and Latin America, selected to represent a range of private sector and public sector value chain interventions on the one hand and high and low investment on the other. In 2009, tool designers and case study collaborators convened again to identify lessons learned in tool application. During phase 2 (November 2009–March 2012), a new version of the tool was drafted, incorporating lessons learned in phase 1 and testing this enhanced version through 12 case studies in Asia, Africa, Latin America and
9 Stoian, D; Donovan, J; Fisk, J; Muldoon, M. 2012. Value chain development for rural poverty reduction: a reality check and a warning. Enterprise Development and Microfinance 23(1):54–69.
10 Chambers, R; Conway, G. 1991. Sustainable rural livelihoods: practical concepts for the 21st century. IDS Discussion Paper 26, IDS, Brighton.
11 Bebbington, A. 1999. Capitals and capabilities: a framework for analyzing peasant viability, rural livelihoods and poverty. World Development 27(12):2021–2044.
12 Scoones, I. 2009. Livelihoods perspectives and rural development. Journal of Peasant Studies 36(1):171–196.
13 Donovan, J; Stoian, D. 2012. 5Capitals: a tool for assessing the poverty impacts of value chain development. Turrialba, CR, CATIE, 70 p. (Technical Series 55, Rural Enterprise Development Collection no. 7).

10
Assessing Impacts of Value Chain Development on Poverty: A Case-Study Companion to the 5Capitals Tool
the United States (see table 1 for a list of all case studies). In April 2011, the team and special invitees gathered to identify lessons learned in tool applica-tion and VCD impact assessment. The findings of this meeting were incorporated into the final version of the tool that has since been published in English, Spanish and Portuguese.
3 The five case studies
Below we describe the five cases studies selected for inclusion in this volume. Table 2 summarizes and compares the key features of these cases.
•Nicaragua—certified coffee: Between 1999 and 2005, prices paid for green coffee were too low to allow coffee producers in Central America to cover their variable costs of production, causing
hardships to producers and laborers. Consensus emerged that support for building smallholder links to specialty coffee markets, including those for certified fair-trade and organic coffee, would improve the development prospects for small-holders in the short and long term: the specialty market exhibited rapid growth, in contrast to slow demand growth for bulk coffees. Access to these markets generally requires that smallhold-ers meet stricter quality requirements and, in some cases, obtain certification. This case exam-ines the outcomes for smallholders from their new link to value chains for certified coffee and from development interventions that were chan-neled through the cooperative Soppexcca. The case also examines Soppexcca’s capacity to build its assets and improve its overall business via-bility. The assessment, which was carried out by
Fig. 1. Generic impact pathway for VCD as envisioned in the 5Capitals tool
Contextual factors that influence outcomes
and impacts • Political-legal framework• Certification systems• Market forces• Other interventions (not
related to building/improving market linkages)
• Cultural factors• Internal processes (e.g.,
business strategies, preexisting asset endowments)
Interventions by external
actors and new interactions with
downstream businesses
• Training• Technical assistance• Grants and subsidies• Credit• Investments
OutcomesChanges in• Asset stocks • Production and
processing systems• Business relations• Resource use
ImpactsSmallholders• Employment, income• Livelihood security• Gender equity• Well-beingLocal enterprises • Economic viability• Environmental and
social responsibility
Outputs• Capacities and skills• Liquidity

11
An asset-based approach to achieving pro-poor value chain development: Introduction to 5Capitals case studies
CATIE, covered the period from 2005/2006 to 2008/2009. Household data collection included nearly 300 households, which were grouped for analysis according to their perceived ability to intensify their coffee production. The case high-lights the role of preexisting asset endowments in determining the outcomes of VCD.
•Colombia—fresh fruits and vegetables: Access to supermarkets by smallholder producers of fresh fruits and vegetables requires improvements in production and postharvest practices and, in many cases, investments in the organization of farmers to reduce costs for inputs and marketing.
In return, producers may benefit from higher prices and more stable marketing arrangements. Between 2006 and 2010, in Nariño, Colombia, the microfinance institution Contactar, in collab-oration with two local NGOs (Local Economic Development Agency of Nariño and Fundación Social), supported approximately 150 small-holder vegetable farmers who were organized into six producer associations. The interven-tions aimed to unite these associations under the umbrella of a second-tier association called La Alianza Hortofrutícola del Sur. In addition, smallholders gained access to microfinance
Table 1. Value chain cases and partners for developing 5Capitals (cases included in this volume highlighted in bold)
Value chain Country PartnerPhase 1 (June 2008–October 2009)
Organic banana Bolivia Bioversity International
Plantain El Salvador Catholic Relief Services (CRS)
Organic/fair trade coffee Nicaragua Tropical Agricultural Research and Higher Education Center (CATIE) and Lutheran World Relief (LWR)
Taro root Nicaragua CATIE and Technoserve
Dairy products Sri Lanka University of Plymouth and Swisscontact
Embroidery Pakistan Mennonite Economic Development Associates (MEDA)
Honey India EDA Rural Systems
Shrimp India M. Harper and R. Roy
Cereal Flour Burkina Faso LWR
Organic cotton Tanzania Royal Tropical Institute (KIT) and BioRe
Allanblackia nuts Tanzania KIT and FAIDA Market Link
Phase 2 (November 2009–March 2012)
Organic cotton India EDA Rural Systems
Fresh vegetables Kenya Farm Concern International
Fresh vegetables Afghanistan MEDADairy products Bolivia Swisscontact
Bean Ecuador Intercooperation
Handicraft India All Indian Artisans and Craftworkers Association (AIACA)Bean seed Uganda Community Enterprises Development Organisation (CEDO)
Plantain Dominican Republic Bioversity International
Poultry India R. Roy and M. Harper
Organic vegetables United States Liseed Consulting and Winrock-Wallace CenterSpecialty coffee Colombia Technoserve
Fresh fruits and vegetables Colombia Technoserve

12
Assessing Impacts of Value Chain Development on Poverty: A Case-Study Companion to the 5Capitals Tool
services, and support was provided to iden-tify demand for higher-value fresh vegetable products. The assessment was carried out by the Colombia office of Technoserve, focus-ing on changes in asset endowments between 2008 and 2010 from a sample of 47 households. This case also assesses changes in La Alianza Hortofrutícola del Sur and the relevance of these changes for its long-term viability.
•Afghanistan—fresh vegetables: Over the past decade, war and drought decimated the once- important horticultural sector in Afghanistan. Recently, the sector appears to be staging a come-back. A more stable business environment and external support have stimulated growth to the extent that horticultural products now account for 60% of Afghanistan’s total legal exports. However, women have largely been excluded from participation in this sector. This case assesses the outcomes of interventions by the Mennonite Economic Development Associates (MEDA) aimed at linking women to regional markets for fresh vegetables. Interventions focused on building the technical capacities of women farmers and facilitating the creation of a women-to-women marketing arrangement that would conform to cultural norms. The Afghan Women’s Business Council was a key partner, providing training to stakeholders and facili-tating the linkage between producers and their buyers (sales agents). Sales agents were women considered trustworthy by farmers and who had the capacity to interact with downstream buy-ers outside of the communities. The assessment, carried out by MEDA staff, focuses on changes in asset endowments between 2007 and 2010 for farmers from four different communities (n=130) and five sales agents.
•India–handicrafts: Chanderi, a city located in India’s Madhya Pradesh state, contains one of the largest concentrations of handloom weavers in North India. The town’s signature product is Chanderi fabric—a silk-and-cotton embellished fabric with woven patterns of gold-colored metal thread. The production of Chanderi fabric involves master weavers (who interact with down-stream buyers and subcontract wage weavers
for the production of cloth), input suppliers and wage weavers, among others. Traditionally, demand for Chanderi fabric has been linked to the demand for saris; however, in general, the recent market trend is one of declining sales and the exit of weavers from the sector. Interventions by various NGOs between 2003 and 2010 aimed to reverse this trend. They sought to increase the incomes and decision-making power of wage weavers through four major objectives, each with a distinct group of weavers: 1) organize weavers into enterprises partially or fully owned by weavers, 2) enhance product quality and promote innovation in design and production, 3) build technical and managerial capacity of weavers and 4) facilitate direct linkages between the weaver-owned enterprises and buyers for domestic and export markets. The assessment was carried out by the All India Artisans and Craftworkers Welfare Association in collabo-ration with Kaarak Enterprise Development Services. The case examines changes in assets for weaver households and the three weaver marketing associations formed through project interventions.
•United States–organic vegetables: Historically, tobacco had been a major contributor to the economy of the Appalachian region cover-ing southwestern Virginia and northeastern Tennessee—one of the most economically depressed regions of the United States. By the late 1990s, however, tobacco production began moving overseas and calls for the diversifica-tion of agricultural production grew. One effort by state governments and private foundations focused on production and marketing of certi-fied organic vegetables. Support was channeled through the NGO Appalachian Sustainable Development (ASD). With project funds, ASD launched Appalachian Harvest (AH)—a com-mercial operation for processing and marketing certified organic vegetables. AH constructed a modern processing facility, purchased trans-portation equipment and provided technical assistance to its growers. This case examines the outcomes of efforts to encourage smallholder production of certified organic vegetables and

13
An asset-based approach to achieving pro-poor value chain development: Introduction to 5Capitals case studies
link smallholders to regional supermarkets through AH. The assessment, carried out by Liseed Consulting, examined asset building by AH and a sample of its members from 2006 to 2010. The case provides a cautionary tale of VCD when livelihood strategies may not be in line with the demands of downstream buyers of organic produce.
4 What insights do the case studies offer?
The geographical spread and the focus on differ-ent crops, target markets and beneficiaries as well as differentiation in terms of the VCD stage allow
for a rich sample of value chain realities. The cases included in this volume focus on changes in asset endowments at two levels: the household level and the enterprise level. In particular, we are concerned with the enterprise(s) in the value chain that main-tain(s) direct relations with producing households. These are often small or medium enterprises in close proximity to the households. When referring to these enterprises in the general sense, as we do in this introductory chapter and in the summary chapter, we use the term local enterprise.14 Local enterprises come in a variety of forms, from loosely knit farmer groups to privately owned businesses with sophisticated processing operations. The vari-ety of forms is reflected in the cases. Each case study
14 In the 5Capitals tool, we used the term linked enterprise rather than the term local enterprise. The guide did not make assumptions about the nature or proximity of the actors that purchased from smallholders, thus the reason for the more generic term linked enterprise.
Table 2. Summary of the five case studies included in this volume
Case study Target market Key actors Major source of
intervention Stage of VCD
Nicaragua—certified coffee
European Union and United States
Cooperative Soppexcca; 500 smallholder coffee producers; US and European coffee buyers; various NGOs and projects
Various NGOs and private sector, with support channeled through cooperative
Advanced: cooperative well-established with professional management, linking long-term coffee producers to fair-trade certified markets
Colombia—fresh fruits and vegetables
Regional markets (sales to supermarkets)
La Alianza Hortofrutícola del Sur; six base associations; 150 smallholder vegetable and small-fruit producers, supermarkets, NGOs
Microfinance institution and local NGOs
Emerging: recently established second-tier producer association that links to new and relatively demanding buyers
Afghanistan—fresh vegetables
Regional markets for fresh vegetables
Women producers of fresh vegetables; 2,250 producers; women sales agents; local intermediaries for fresh vegetables
ProjectEmerging: new chain configuration, linking women farmers to women sales agents
India—Chanderi fabric (embellished hand-woven fabric)
National and export markets for handicrafts
45 master weavers; 3,659 wage weavers; 12 traders
Various projects, with support channeled through three producer associations
Emerging: three newly formed producer associations charged with linking weavers to buyers
United States—organic vegetables
Regional markets (sales to supermarkets)
Appalachian Harvest (a commercial operation of the NGO Appalachian Sustainable Development); 41 producers of certified organic vegetables; supermarkets
Various projects; government agencies and programs
Consolidating: new commercial operation of a well-established NGO that facilitates links to smallholders who recently converted to certified organic vegetable production

14
Assessing Impacts of Value Chain Development on Poverty: A Case-Study Companion to the 5Capitals Tool
refers to the local enterprise in a way that is specific to the context—for example, cooperative (in the case from Nicaragua), sales agents (in the case from Afghanistan) and weaver-owned enterprises (in the case from India).
The selected examples show that asset building is not a linear process: the building of one asset does not necessarily lead to the building of others. While there are examples where such positive feedback loops exist, there are also cases where asset stag-nation or even erosion has been observed. Asset building usually is not equally distributed across the five capitals. Under given conditions, certain assets may build up more rapidly than others, depending on the approach to VCD and the enabling condi-tions. A recurrent finding is that asset building is more likely and more vigorous the higher the origi-nal asset endowment of smallholder households and local enterprises. Below a certain level of minimum assets at the onset of the VCD, little prospects exist for meaningful asset building among the rural poor.
Each case study introduces the value chain approach pursued, the principal agents and the theory of change or impact pathway to the extent that it existed when the VCD initiative began. Findings from impact assessment are presented according to the five capitals at household and enterprise levels,
and inferences are made with regard to the rela-tionships between the two levels of asset building. The cases show that while there is a potential for asset building at the enterprise level to contribute to asset building at the household level, there is often a considerable time lag between the two. Emphasis is put on attributing measured or observed changes to VCD and/or to contextual factors that may have contributed to them. Each case concludes with the implications of the findings for redesigning the given intervention or designing new ones in similar con-texts. The volume presents a summary chapter with a comparative analysis of asset building and enabling conditions that cuts across cases.
We trust that readers—irrespective of their back-ground as research or development organizations, government agencies, private sector agents or rep-resentatives of civil society organizations—will find interesting insights for their work on value chains and inspiration for adopting an asset-based approach to the design, implementation, monitoring and assess-ment of value chain initiatives. The 5Capitals tool and this case study companion will help them to gain sound evidence of and insight into the poverty effects of VCD investments and, based on their application, to engage in social learning with the stakeholders of their VCD interactions and interventions in pursuit of their joint development goals.

15
Building assets through access to specialty coffee markets: Lessons from smallholders and cooperatives in Nicaragua
Jason Donovan1
SummaryLinking smallholders to value chains for specialty agricultural products, such as certified coffee, has formed an important element of rural development strategies in Latin America and elsewhere. However, little is known about the viability of these linkages or their impact on smallholders and their business organizations. This study focuses on the outcomes of efforts to link coffee farmers and their cooperative Soppexcca in Nicaragua to markets for certified fair-trade and organic coffee. During 1999–2005, Soppexcca received considerable support from NGOs, buyers and others for upgrading its capacities and those of its members. Outcomes are considered in terms the ability of Soppexcca and its members to build different types of productive assets. Results suggest that Soppexcca made significant advances in building its endowments of physical, human and financial capital. However, important gaps remained, and it continued to depend heavily on external sup-port. At the household level, most farmers built specific elements of their asset base and generally increased their resilience to shocks. However, many households struggled to make effective use of their gains to inten-sify or diversify production. Significant differences in asset building across the households highlighted the role of preexisting assets in determining outcomes. This case underscores the need for deeper discussions about the role of different stakeholders, the ultimate goals of development interventions and the need for increased coordination and mutual learning as part of the process. Particular attention should be paid to variations in asset endowments at the onset of value chain interventions to account for differences across households.
1 Jason Donovan is a marketing specialist with the World Agroforestry Center (ICRAF) in Lima, Peru. [email protected].

16
Assessing Impacts of Value Chain Development on Poverty: A Case-Study Companion to the 5Capitals Tool
1 Overview
1.1 IntroductionThe recent history of coffee production in Nicaragua is marked by the “coffee crisis”—a period between 1999 and 2005 of dramatically low coffee prices that had negative implications for the poor in Nicaragua and other coffee-growing regions. The average composite price used by the International Coffee Organization (ICO) for coffee fell by 21% in 1999, 25% in 2000 and 29% in 2001. In late 2001, the cof-fee price hit US$0.40 a pound—the lowest annual price since 1971.2 In Central America, prices paid for conventional green coffee did not allow produc-ers to cover their variable costs of production.3 The result was immediate economic and social hardships to producers and laborers. In addition, there were longer-term negative effects on coffee productivity due to reduced investment in coffee production. In Nicaragua, the crisis set off a chain reaction of negative events. Tax receipts dropped, forcing local governments to reduce services and lay off workers. Coffee plantations scaled back or closed. Reports of hunger in the main coffee-growing regions of Matagalpa and Jinotega appeared in the local
newspapers. During this period, the Nicaraguan gov-ernment provided no subsidies to smallholder coffee producers to defray costs or provide for subsistence.
Among multilateral and bilateral donors, academ-ics and NGOs, consensus emerged that the best response to the coffee crisis in Central America would be to develop value chains that linked small-holder coffee producers to specialty markets for coffee, including certified fair-trade and organic coffee.4,5,6,7,8,9 A discussion paper prepared for a 2002 workshop on the coffee crisis in Central America argued that “the region’s competitive advantage in the coffee market lies in having the adequate agroecological conditions to produce high quality coffees.”10 Recommended interventions focused on improving quality, facilitating certification, strengthening collective enterprises in coffee pro-duction zones where the production of high-quality product was most viable, and promoting diversifi-cation out of coffee for regions with less potential to produce quality coffee. The private sector also showed interest in helping develop specialty cof-fee value chains, mainly through collaboration with coffee cooperatives to improve coffee quality.11
2 Brown, O; Charveriat, C; Eagleton, D. 2001. Background study on the coffee market. Oxford: OxfamUK. Photocopy.
3 IADB/US Agency for International Development (USAID)/World Bank. 2002. Managing the competitive transition of the coffee sector in Central America. Discussion paper prepared for the regional workshop The Coffee Crisis and Its Impact in Central America: Situation and Lines of Action, Antigua, Guatemala, April 3–5.
4 USAID. 2003. USAID’s response to the global coffee crisis. Fact Sheet. http://www.usaid.gov/press/ factsheets/2003/fs030304_1.html (June 16, 2010).
5 Varangis, P; Siegel, P; Giovannucci, D; Lewin, B. 2003. Dealing with the coffee crisis in Central America: Impacts and strategies. World Bank Policy Research Working Paper 2993. World Bank, Washington, DC.
6 IICA. 2004. Cadena agroindustrial de café. Report prepared by IICA for the Nicaragua Ministry of Agriculture and Livestock (MAGFOR), Managua, Nicaragua.
7 Bacon, C. 2004. Confronting the coffee crisis: Can fair trade, organic, and specialty coffees reduce small-scale farmer vulnerability in Northern Nicaragua? World Development 33(3):497–511.
8 Kilian, B; Jones, C; Pratt, L; Villalobos, A. 2005. Is sustainable agriculture a viable strategy to improve farm income in Central America? A case study on coffee. Journal of Business Research 59(3):322–330.
9 Utting-Chamorro, K. 2005. Does fair trade make a difference? The case of small coffee producers in Nicaragua. Development in Practice 15(3/4):584–599.
10 IADB/US Agency for International Development (USAID)/World Bank. 2002. Managing the competitive transition of the coffee sector in Central America. Discussion paper prepared for the Regional Workshop, The Coffee Crisis and Its Impact in Central America: Situation and Lines of Action, Antigua, Guatemala, April 3–5.
11 Bacon, CM; Méndez, VE; Gliessman, SR; Goodman, D; Fox, JA. Eds. 2008. Confronting the coffee crisis: fair trade, sustainable livelihoods and ecosystems in Mexico and Central America. Cambridge, MA: MIT Press.

17
Building assets through access to specialty coffee markets: Lessons from smallholders and cooperatives in Nicaragua
This study examines the impacts of the interventions that linked smallholder coffee producers and their cooperative Soppexcca to specialty coffee markets in Nicaragua. At the household level, we explore the hypothesis that differences in household participa-tion in the higher-value markets reflect variations in its endowment of livelihood assets (namely natural, human, social, physical and financial capitals) and that these differences play a major role in determining the extent to which smallholders are able and willing to accept the risks associated with participation in these markets. At the enterprise level, we identify changes in various types of productive assets held by Soppexcca and make inferences on the implications of these changes for the cooperative’s long-term business viability. Section 2 provides contextual information on the case study in Nicaragua. Section 3 discusses the methods used for data collection. Sections 4 and 5 present the results on asset changes by Soppexcca and its members, respectively. In the final section, we discuss the implications of the findings for the design and assessment of development interventions aimed at linking smallholders to higher-value food markets.
1.2 Case study backgroundAmong agricultural products exported by Nicaragua, coffee is the most important. Between 2008 and 2011, for example, coffee exports from Nicaragua repre-sented roughly 25% of the country’s total value of
agricultural exports.12 However, Nicaragua’s average coffee productivity, at 672 kg/ha (green coffee), makes it the least efficient producer in Central America, at roughly 50% of the productivity of Costa Rica and 40% of the productivity of Guatemala.13 There are about 48,000 coffee farmers in Nicaragua, 80% hav-ing less than 3.5 ha of coffee in cultivation.14 Despite the large number of smallholders, farms larger than 3.5 ha produce more than 85% of the Nicaraguan coffee harvest due to higher intensity of management and better access to purchased inputs, mainly fertil-izers. In general, coffee producers are better-off than the landless or those who produce basic grains and tubers, mainly for subsistence. Even so, the poorest of coffee farmers often lack resources for agricultural production and basic living expenses and are vulnera-ble to negative changes in output and input prices and to production risks (such as drought and diseases).
This case study analyses changes in assets by small-holders in north-central Nicaragua who are linked to certified fair-trade and organic coffee markets through the cooperative Soppexcca. Soppexcca has about 500 members distributed among 18 base coop-eratives. Base cooperatives provide representatives for Soppexcca’s board of directors and facilitate coordination between Soppexcca and its members; however, base cooperatives do not provide services for the production or marketing of coffee. Soppexcca
12 FAO. 2013. FAOSTAT database. http://faostat3.fao.org/home/index.html. Accessed May 7, 2013.
13 Varangis, P; Siegel, P; Giovannucci, D; Lewin, B. 2003. Dealing with the coffee crisis in Central America: impacts and strategies. World Bank Policy Research Working Paper 2993. World Bank, Washington, DC.
14 Flores, M; Bratescu, A; Martínez, JO; Oviedo, JA; Acosta, A. 2002. Centroamérica: el Impacto de la caída de los precios del café. CEPAL, Mexico City.

18
Assessing Impacts of Value Chain Development on Poverty: A Case-Study Companion to the 5Capitals Tool
emerged in 2001 from the ashes of its predecessor cooperative, which dissolved due to unpaid debts to coffee buyers. Soppexcca’s membership more than doubled during the coffee crisis, as coffee producers sought credit and higher coffee prices. In addition to providing access to certified markets, Soppexcca offers annual credit for coffee production, multiyear credit for strategic coffee-related investments (for example, rehabilitation of coffee plantations, purchase of land and wet-milling equipment), and technical assistance for increasing coffee productivity and reducing envi-ronmental impacts of coffee production. In 2009, all of Soppexcca’s coffee exports were fair-trade certified and approximately 15% were also organic certified. Since its beginnings, Soppexcca has maintained strong ties with a small group of European coffee buyers. In more recent years, the cooperative has forged ties with US coffee buyers.
Fig. 1. Map of value chain that links Soppexcca and its members to international buyers of certified coffee in Nicaragua.
Cooperative-affiliated households• 500 households
with coffee plantations from 0.5 to 30 ha
• Coffee principal source of farm-derived income
• Farmers organized into 16 base cooperatives
• Base cooperatives with limited service offer
Coffee cooperative Soppexcca
• Founded in 2001 as private company, converted to cooperative in 2004
• Professional management• Strong links with international
buyers and service providers• Strict quality requirements
applied to members• Offers members technical
assistance, credit, inputs and access to development projects
European and US buyers of certified
coffee• Core group of
European buyers that played a key role in cooperative organization
• US coffee importers, which began purchasing in mid-2000s
• Offer credit and co-investments to Soppexcca
Other value chain actors
• Wholesalers• Retailers• Consumers
Service/input providers• NGOs and government agencies:
donations, health services• Coffee buyers (local
intermediaries) outside of the chain: access to credit; purchase of second-quality coffee
Service/input providers• NGOs: seed capital for internal credit program; grants for providing
technical assistance to members; skill development for administrative and technical staff
• Fair-trade lenders: credit for purchase of coffee harvest• Certification agencies: organic certification• Private companies: fertilizer for resale to members
Between 2000 and 2009, Soppexcca received finan-cial and technical support from NGOs and donors totaling some US$2.1 million. Other well-established cooperatives participating in certified coffee mar-kets in Nicaragua received similar levels of donor and NGO support prior to and during the coffee crisis.15 The considerable financial and technical sup-port provided to Soppexcca can be rationalized in the context of the coffee crisis, the inability of the Nicaraguan government to provide services to the coffee sector and the overall importance of coffee for achieving social and environmental goals. In general, support aimed to help Soppexcca respond better to the needs of coffee buyers and its coffee-producing members as well as to expand its membership base. Figure 1 identifies the key actors in the value chain that linked Soppexcca and its members to interna-tional markets, along with the providers of services
15 For the example of the cooperative PRODECOOP, see Ruben, R; Zuniga, G. 2011. How standards compete: comparative impact of coffee certification schemes in Northern Nicaragua. Supply Chain Management 16(2):98–109.

19
Building assets through access to specialty coffee markets: Lessons from smallholders and cooperatives in Nicaragua
to Soppexcca and its members. European and US coffee buyers provided credit to Soppexcca for the purchase of coffee from its members. Other coffee buyers, mainly local intermediaries, also provided important services for some Soppexcca members, providing short-term credit and access to markets for coffee of inferior quality.
2 Study design and methods
Data collection and analysis focused on iden-tifying changes in household assets during the four-year period between 2005–2006 and 2008–2009. Quantitative and qualitative data were collected to determine these changes, while mainly qualitative information was used to understand their relevance and the underlying reasons.
At the cooperative level, data collection focused on identifying changes in five outcome domains—human, physical, social and financial capital as well as enabling conditions. Natural capital was not included since Soppexcca does not engage directly in primary production. Each outcome domain had two to three indicators (third column, fig. 2). Changes in the out-come domains were expected to result, in part, from the outputs (second column, fig. 2) of the various interventions for value chain development that were channeled through Soppexcca (first column, fig. 2). The fourth column of figure 2 presents the impacts that can be expected should significant and positive changes be identified across the outcome domains.
Data collection at the cooperative level relied upon key informant interviews (n=8) and the collec-tion of secondary information during an 11-month period between March 2009 and January 2011. The Soppexcca staff interviewed included the directors of management, extension and credit and mem-bers of the board of directors. Staff members were consulted on various occasions during the data col-lection period. In addition, various interviews were carried out with Soppexcca’s buyers, local coffee buyers, NGO supporters and certification agencies. Soppexcca supplied valuable secondary informa-tion on membership, coffee exports, credit provision,
relations with buyers and overall business strategy. Information provided by Soppexcca was also triangu-lated with its members during household interviews.
At the household level, data collection focused on identifying changes in six outcome domains—natu-ral, physical, human, social and financial capital as well as enabling conditions. As before, the overall assessment of each outcome domain was based on the measured or observed changes of two to three key indicators. The outcome domains and their respective indicators are identified in the third col-umn of figure 3. Changes in the outcome domains are expected to result from either an improved ser-vice offer provided by Soppexcca or from services provided from outside of the chain (first column, fig. 3). The second column of figure 3 summarizes the outputs from these interventions.
Efforts were made to collect data from all of the households that belonged to selected base coopera-tives affiliated with Soppexcca. Among Soppexcca’s 18 base cooperatives, 11 were included in this study. Their selection was based on two criteria: the geo-graphic concentration of base cooperative members (to facilitate logistics) and the distance between the base cooperative’s office and Soppexcca’s office (to account for any potential difference in outcomes based on proximity to Soppexcca). Preference was given to base cooperatives with a higher concentra-tion of membership in a given geographic area. Base cooperatives with a greater geographic concentration of membership were likely to be those cooperatives with a relatively greater percentage of the smallest producers. In this way, the sample may have been biased toward relatively small, and potentially poorer, producers. The final selection of base cooperatives considered the distance from Soppexcca’s office. Three selected base cooperatives were less than 20 km from Soppexcca. Five base cooperatives were between 21 km and 60 km from Soppexcca, while three base cooperatives were more than 61 km from Soppexcca.
The selected base cooperatives included 324 regis-tered households in 2009. Among these households, 292 were interviewed (90%). Questions were directed to the male and female household heads and

20
Assessing Impacts of Value Chain Development on Poverty: A Case-Study Companion to the 5Capitals Tool
Fig. 2. Value chain development (VCD) outputs, outcome domains, and expected impacts at the cooperative level for Soppexcca, a coffee cooperative in Nicaragua
VCD interactions and interventions
VCD interactions• Long-term
contracts with certified fair-trade coffee buyers that include a floor price, social premiums, pre-financing and other services
• Long-term arrangement with buyers for debt repayment
• Technical and financial support from buyers for business management
VCD interventions• Grants for
building short- and long-term credit portfolios
• Grants for providing technical assistance and training to members
• Grants for infrastructure development
• Technical assistance in coffee management
• Technical assistance in organization and business management
Outputs from VCD interactions and
interventions
Service provision• Technical assistance:
staff trained in good practices for coffee production
• Funding obtained for operation of technical assistance program
• Funding obtained for operation of short- and long-term credit programs for members
Investment capacity• Funding obtained
for infrastructure expansion
• Access to no-interest prefinancing from coffee buyers
• Access to short-term finance for purchase of coffee harvest
• Access to credit from fair-trade lenders for infrastructure and prefinancing the coffee harvest
Business functions• Administrative staff
trained in business organization and management
• Increased access to working capital for purchase of coffee harvest
• Increased access to funds for making strategic investments
Human capital• Knowledge and
skills for business administration
• Capacities and skills to meet the service needs of affiliated producers
VCD outcome domains, by capital
Social capital• Improved information,
risk and benefit-sharing arrangements with buyers, members and service providers
Physical capital• Access to buildings
and other infrastructure for effective marketing and processing of coffee
• Access to machinery, equipment, tools for effective coffee marketing and processing
Financial capital• Increased cash flows
and reduced debt levels
• Adequate working capital
• Expanded credit portfolio
Enabling conditions• Access to public
infrastructure and services
• Access to grants and NGO-provided services
Expected VCD impacts
• Improved economic performance
• Higher client satisfaction
• Increased social benefits for local communities and society
• Higher response capacity to new market and policy trends

21
Building assets through access to specialty coffee markets: Lessons from smallholders and cooperatives in Nicaragua
other household members who directly participated in coffee production and harvest. As for households not interviewed, either its members refused to be interviewed (n=5) or were unavailable after two site visits (n=27). Refusal to participate perhaps reflected dissatisfaction with participation in value chains for certified coffee; however, these households represented a small proportion of the cooperative membership (< 4%). Being unavailable for interviews perhaps reflected access to off-farm opportunities for earning income and thus may bias the sample toward poorer coffee-producing households that depend solely on this product for their livelihoods.
Unless otherwise indicated, coffee quantities are presented as pre-dried parchment coffee—the state of coffee when it is sold by producers to buyers such as Soppexcca (100 lbs of export green coffee are commonly processed from roughly 200 lbs of pre-dried parchment coffee produced by farmers in north-central Nicaragua).
No baseline data existed on asset endowments, coffee production, or income flows; thus, recall infor-mation was used to understand changes in asset endowments. Insights into attribution were gained by asking respondents the extent to which they considered that changes in households assets were attributable to engagement with Soppexcca and the specialty coffee chain. In other cases, attribu-tion insights were gained by singling out the most
probable causes of the change from various potential causes identified by local stakeholders and research-ers. In addition to coffee-related financial assets, data collection focused on other major income sources (for example, off-farm wages, other agricultural activities, remittances), thus allowing insight into the relative importance of coffee income.
Two important contextual factors that likely impacted asset building were changes in coffee prices and rainfall levels. During the first three years of this period (2005–2008), international coffee prices increased significantly, from US$2.15/kg to US$3.16/kg, with prices dropping somewhat in 2009 (US$2.53/kg). The higher prices provided both the incentives and means for investments in productive assets. It also implied a more robust coffee sector in general, with increased competition and access to services, such as credit. In general, climate variation, resulting in increased variability in rainfall levels from one year to the next, appeared to significantly impact coffee production in Nicaragua.16 These fluc-tuations have coincided with the normal biannual fluctuations in coffee production to create stronger than usual production fluctuations. In 2006 and 2008, coffee production fell to 70,455 MT and 75,957 MT, while in 2007 and 2009, production rose to 100,000 MT and 91,131 MT, respectively.17 Thus, higher pro-duction risks associated with rainfall variability may have reduced ability to invest in coffee production for the most vulnerable households.
16 Haggar, J. 2008. Impact of climate change on coffee farming households in Central America and steps for adaptation in the future. Paper presented at the Annual Conference of the Specialty Coffee Association of America, May 2–5, Minneapolis, Minnesota.
17 FAO 2011. FAOSTAT database. http://faostat3.fao.org/home/index.html.

22
Assessing Impacts of Value Chain Development on Poverty: A Case-Study Companion to the 5Capitals Tool
Fig. 3. Value chain development (VCD) outputs, outcome domains and expected impacts among Soppexcca members through links to certified markets and related development interventions
VCD interactions and
interventions
Improved and expanded service offer by Soppexcca• Expanded
technical assistance program
• Expanded credit program
• Increased access to buyers and donor organizations
• Expanded access to fair-trade lenders
Outputs from VCD interactions and interventions
Outputs from improved service offer provided by Soppexcca• Improved
access to technical services
• Improved access to inputs
• Improved access to short- and long-term credit
• Access to long-term contracts for the selling of coffee
• Access to support services interfacing with development organizations and government agencies
VCD outcome domains, by capital
Natural capital• Productive capacity• Soil fertility• Water quantity and quality
Human capital• Knowledge, capacities and skills for
VC activities• Health and labor safety
Social capital• Improved information, risk and
benefit-sharing arrangements with buyers, members and service providers
Physical capital• Access to buildings and other
infrastructure for effective marketing and processing of coffee
• Access to machinery, equipment, tools for effective coffee marketing and processing
Financial capital• Cash flows and debt levels• Working capital• Investment capacity
Enabling conditions• Access to public infrastructure and
services• Access to government programs
• Improved well-being
• Higher resilience
• Enhanced nutrition and health
• Improved housing
• Higher capacity to mitigate adverse trends and shocks
• Better access to basic services (education, healthcare)
Expected VCD impacts

23
Building assets through access to specialty coffee markets: Lessons from smallholders and cooperatives in Nicaragua
3 Changes in assets of the cooperative
3.1 Human capitalSoppexcca benefited from relatively strong human capital endowments prior to the assessment period. A professional manager held the cooperative together during the worst of the coffee crisis, nego-tiating new contracts with buyers and obtaining new assistance from development agencies, continuing to provide strong leadership during the assessment period. Interviews with buyers highlighted the abil-ity of Soppexcca’s professional management to build relations based on trust and mutual respect. According to one buyer, “We feel a special trust with Soppexcca. They kept paying off the debt even though they didn’t have to.” Trust was reflected in tangible ways. For example, when Soppexcca expressed concerns about its difficulty to capture its members’ coffee due to high levels of local compe-tition during the harvest season, interviewed buyers agreed to adjust their price formula so that prices offered by Soppexcca were more in line with local prices. Another buyer noted that “if Soppexcca has to request an adjustment in its price, then there is always a good and transparent reason.”
Interviews with buyers, elected leaders and mem-bers also brought to light opportunities for future strengthening of human capital. Soppexcca’s buyers expressed concern over the high level of dependence on the professional manager for most business func-tions, while Soppexcca’s elected leaders expressed concerns over the general lack of timely information on business operations and financial performance available to them. Members often mentioned limited
access to technical services—despite an increase in staff from two to 12 during the assessment period—and the overall limited ability of extension staff to address their most pressing needs (for more details, see section 4.2). Soppexcca’s elected leaders gen-erally lacked the skills needed to effectively carry out their role in oversight and strategic planning. Addressing gaps in human capital endowments will be critical for increasing Soppexcca’s resilience to shocks (for example, departure of crucial staff) and achieving a more democratic form of governance.
3.2 Social capital Prior to the assessment period, Soppexcca enjoyed strong ties with coffee buyers, development organi-zations and its membership base. During the period, Soppexcca forged new ties with US coffee buyers while maintaining the strong relations that existed previously. The 2008–2009 harvest was sold to seven buyers: five from Europe that purchased 59% of the total volume exported and two from the United States that purchased the remaining 41%. The five European buyers had purchased about the same amount from Soppexcca every year since 1999. US buyers began to purchase coffee from Soppexcca in significant volumes in the 2003–2004 harvest. The addition of US buyers followed a period of rapid expansion in Soppexcca membership, which permitted increased export volumes. None of the interviewed buyers reported major problems with Soppexcca related to the quality of coffee delivered or compliance with contractual terms (including repayment of prefinanc-ing). One buyer regarded Soppexcca as the most reliable among the 10 cooperatives in Latin America from which it purchased coffee.

24
Assessing Impacts of Value Chain Development on Poverty: A Case-Study Companion to the 5Capitals Tool
The relations between Soppexcca and its members for cooperative governance were still evolving at the end of the period. In 2004, Soppexcca changed from a corporation to a cooperative and its eight-member elected board of directors met for the first time. Evidence during the assessment period indicated that the board faced major challenges in effective governance. The main reasons were insufficient skills in business and financial administration and limited access to information among elected members. A former board president noted that he received no prior training in basic business or in cooperative management. What skills and knowledge he acquired while on the board came from trial and error. A sim-ilar experience was reported by a former member of the Oversight Committee—the committee that reviews the financial operations of the cooperative. Informants noted that the board and the Oversight Committee generally did not have access to timely financial information, largely because of a lack of information rather than inaccessibility of informa-tion. Interviews highlighted the board’s reluctance to question, debate or probe Soppexcca’s manage-ment regarding strategic decisions and investments. According to one former board member, “Any effort to discuss the decentralization of Soppexcca’s administration drew criticism from the other board members because it was perceived to show a lack of respect for [the professional manager].”
3.3 Physical capital Prior to the assessment period, Soppexcca’s physi-cal capital endowments were fairly basic, consisting mainly of an office and warehouse space. By the end of the period, however, Soppexcca’s endowments had grown to include a dry-coffee processing plant, 11 offices for base cooperatives, a plant for the production of chicken manure fertilizer, two coffee houses and a cupping lab. Grants covered the costs of most of these investments. Purchase of the dry-coffee processing plant required long-term loans, grants and cooperative funds. The plant, which began operations in 2010, was expected to provide increased control of the produc-tion process and an additional income stream, offering an option for reduced dependence on donor support in the future. The fertilizer plant was not in operation during the period due to uncertainties regarding the
use of chicken mature from large-scale commercial broiler farms in organic coffee production. The newly constructed offices for base cooperatives offered the potential for greater consolidation of Soppexcca’s base cooperatives, which had yet to play a major role in the delivery of Soppexcca’s services (for example, credit, technical assistance) or in taking the initiative to offer additional services (for example, transporta-tion, collective purchase of inputs).
3.4 Financial capitalSoppexcca began and ended the period with a rel-atively high level of debt. However, during the period, it proved its capacity to repay debt and build trust with creditors. Soppexcca began the assess-ment period with a debt to coffee buyers of nearly US$500,000 and limited working capital or invest-ment capacity. During the period, the cooperative repaid its debt from funds obtained from the export of coffee. Shortly after doing so, however, it accu-mulated $280,000 in new debt for the purchase of the dry-coffee processing plant. On an annual basis, Soppexcca received loans from buyers and fair-trade lending organizations, totaling roughly US$700,000 in 2008–2009, which allowed Soppexcca to offer advance payment to its members for coffee delivery.
Soppexcca’s ability to provide short-term credit to its members doubled during the period, reach-ing $450,000. Reliable data on repayment rates by Soppexcca members was not available. However, interviews with Soppexcca staff highlighted that member delinquency in payment was a major prob-lem, largely due to the use of credit for purposes other than the purchase of coffee-production inputs as well as to weather, diseases and other natural factors that resulted in major fluctuations in yearly production. The increase in the credit portfolio was from financial support of NGOs and donors. Soppexcca also offered long-term credit for strate-gic investments by members (such as replanting of coffee plantations, which, in many cases, was critical following years of neglect during the crisis). The total size of the long-term credit portfolio varied from year to year. In 2007–2008, for example, US$83,303 was offered as long-term credit, all of which was derived from NGOs and donors.

25
Building assets through access to specialty coffee markets: Lessons from smallholders and cooperatives in Nicaragua
Soppexcca’s yearly income flows varied considerably based on negotiated prices and production volumes. Table 1 shows Soppexcca’s estimated income after paying growers and export and processing expenses between 2004–2005 and 2007–2008. Data on costs for operating Soppexcca’s administration was not available. However, the data in table 1 shows that rel-atively little was available for covering salaries and capital investments. Key informant interviews with Soppexcca staff confirmed that project funds covered much of Soppexcca’s administration costs and strate-gic investments. Given the recent major investments in the dry-processing mill, it is unlikely that, in the midterm, Soppexcca will be able to operate without continued subsidies from NGOs and projects. That said, an efficient dry-processing mill has the potential to reduce export and processing expenses and to open a new income source (for example, provide milling ser-vices to other growers/cooperatives). Its extension and credit programs remained fully dependent on grants.
3.5 Enabling conditionsNo major change was observed in terms of access to public infrastructure or access to public
Table 1. Calculation of income from the sale of fair-trade certified coffee (conventional and organically certified) by Soppexcca, 2000–2001 to 2007–2008
Volume green coffee sold (100 lbs green coffee)
Weighted average price for green
coffee (US$)
Total income (US$)
Purchase of coffee from
growers (US$)
Export and processing expenses
Income after grower, export and processing
expenses
Conventional
2004–2005 12,242 118.5 1,450,026 1,224,200 140,538 85,288
2005–2006 9,594 133.2 1,277,760 1,160,840 110,136 6,784
2006–2007 5,935 136.1 807,770 718,135 68,134 21,501
2007–2008 10,155 159.5 1,619,340 1,320,150 116,579 182,611
Organically certified
2004–2005 1,900 145.6 276,640 235,600 21,814 19,226
2005–2006 1,978 149.0 294,648 237,300 22,704 34,644
2006–2007 1,860 144.7 269,060 232,500 21,355 15,205
2007–2008 3,009 172.5 518,970 451,350 34,545 33,075
Source: Author’s calculations, based on data provided by Soppexcca
services. Soppexcca maintained strong relations with NGOs and donors during the assessment period. Soppexcca’s overall large endowments of human and social capitals, combined with its strong com-mitment to member welfare, helped make it an attractive partner for development organizations.
4 Changes in assets of coffee-producing households
Cluster analysis was carried out to identify differ-ences in livelihood strategies among the households. Clusters were formed using a two-step clustering technique using SPSS. Two variables with strong correlation that formed the basis for formation of the clusters were 1) area under coffee production in 2008–2009 and 2) percentage of total household income derived from off-farm sources in 2008. A three-cluster solution emerged from this analysis:
•Diversified small-scale farmers (DSF) (n=77): majority of household income derived from off-farm labor activities; relatively small area under coffee production; includes 28% certified organic producers (40% of all certified organic producers)

26
Assessing Impacts of Value Chain Development on Poverty: A Case-Study Companion to the 5Capitals Tool
•Specialized small-scale farmers (SSF) (n=162): majority of household income derived from cof-fee, with contributions from banana, citrus and other products; relatively small area under coffee production; includes 31 certified organic produc-ers (44% of all certified organic producers)
•Specialized large-scale farmers (SLF) (n=53): majority of household income derived from coffee; relatively large area under coffee pro-duction, includes 11 certified organic producers (16% of all certified organic producers)
Household-level results are reported for each of these clusters for the majority of indicators in each outcome domain.
4.1 Natural capitalThe total area under coffee production increased by nearly 30% between 2004–2005 and 2008–2009, from 570 ha to 736 ha (fig. 4). The highest change was recorded by households from the SSF cluster (31%), although changes only slightly smaller were recorded for households from the other clusters. Households identified whether their expansion resulted from the purchase of new land, land clearance and/or con-version of other production systems to coffee. They reported a total of approximately 104 ha of coffee
Fig. 4. Change in area under coffee production between 2004–2005 to 2008–2009, by cluster
0
1
2
3
4
5
6
7
DSF SSF SLF All households
Mean area (ha) undercoffee 2004–2005Mean area (ha) undercoffee 2008–2009
production that was expanded on previously existing land, thus requiring changes in land use (elimina-tion of annual crops, reduction of forest cover or bringing idle land into production). The most com-mon crop reduced was basic grains, produced for self-consumption and commercialization: roughly 50% of expanded coffee production was achieved through reduced basic grain production. Another 35% was achieved through cultivation of previously idle land. The remaining 15% resulted from removal of forest or reduction of cattle pastures.
Household interviews identified a mix of factors that allowed expansion of the coffee area, which typically included long-term credit from Soppexcca. Logistic regression showed the effects of credit, off-farm income and preexisting land size on expansion of area under coffee production. The strongest pre-dictor of the increased area was access to long-term credit, most of which was provided by Soppexcca (for details, see section 4.5). For each US$500 install-ment of credit obtained, households increased their odds of expanding area under coffee production by nearly five times (table 2). For households in the DSF and SSF clusters, growth in the area under cof-fee production likely reflects efforts to revive coffee area lost during the coffee crisis (due to neglect or

27
Building assets through access to specialty coffee markets: Lessons from smallholders and cooperatives in Nicaragua
removal for the planting of basic grains). On the other hand, the larger the preexisting landholding, the less likely a household was to have expanded its area under coffee production. In addition, the older the household or the higher its dependence on off-farm labor for income generation, the less likely it was to have expanded the area.
An understanding of the local context provides insights into why households from the DSF were the least likely to build their natural capital endowments despite the expansion of Soppexcca’s services and improved conditions for coffee marketing. For mem-bers of two base cooperatives, which together made up nearly 33% of the DSF cluster, a history of strug-gle to obtain, manage and retain their collectively owned coffee plantations impeded investments in natural capital. In one case, internal divisions among community members over how to produce and mar-ket the coffee for their collectively owned plantation resulted in 13 years of limited investment in cof-fee production. In 2003, individual land titles were obtained, with the help of Soppexcca. In another case, households linked through the collective own-ership of a former state-owned plantation incurred
Table 2. Multiple logistic regression showing effects of credit, off-farm income generation and preexisting land ownership on coffee expansion in Nicaragua (2004/2005–2008/2009)
(N=292)a b S.E. Sig. Odds ratio
Preexisting landholding (2004–2005) -.065 .025 .010 .937
Percentage income generated off-farm -1.230 .525 .019 .292
Age of Soppexcca member -.028 .013 .030 .972
Total credit received between 2004–2005 and 2008–2009 (US$500 units) 1.589 .282 .000 4.897
No. household members -.038 .065 .561 .963
Constant 1.532 .572 .007 4.627
a The model as a whole correctly classified 77.2% of all cases.
about US$80,000 in debt during the late 2000s for legal fees to fight off conflicting claims to their land. Until the debt is paid in full, the land title is being held in the custody of the legal representation.
The ability of households to make efficient use of their land under coffee production depends, in part, on their timely access to quality fertilizers. Coffee production mines nutrients from the soil, which, if not replaced through organic or inorganic fertiliz-ers, results in gradually declining productivity.18 The average coffee yield in Nicaragua is 1,383 kg/ha.19
Evidence from long-term experiments in Nicaragua suggests that shade-grown organic and conven-tional coffee production in the country can reach productivity levels of 1,487 kg/ha and 1,927 kg/ha, respectively, with moderate levels of fertilization.20
However, the average productivity for the sampled organic and conventional producers, at 726 kg/ha and 1,278 kg/ha, fell below these estimates. Among households in the DSF cluster, results were more discouraging, at 552 kg/ha for organic producers and 582 kg/ha for conventional producers. This suggests that lack of access to fertilizers remains a barrier to building natural capital.
18 Van der Vossen, H. 2005. A critical analysis of the agronomic and economic sustainability of organic coffee production. Experimental Agriculture 41(4):449–473.
19 Flores, M; Bratescu, A; Martínez, JO, Oviedo, JA; Acosta, A. 2002. Centroamérica: el Impacto de la caída de los precios del café. CEPAL, Mexico City.
20 Haggar, J; Barrios, M; Bolaños, M; Merlo, M; Moraga, P; Munguia, R; Ponce, A.; Romero, S; Soto, G; Staver, C; Virginio, E. de MF. 2011. Coffee agroecosystem performance under full sun, shade, conventional, and organic management regimes in Central America. Agroforestry Systems 82:285–301.

28
Assessing Impacts of Value Chain Development on Poverty: A Case-Study Companion to the 5Capitals Tool
All organic producers applied coffee pulp to their plantations as a source of fertilizer. For some, it was the main source. However, the coffee pulp available from a given farm likely provides only a fraction of the nutrients lost through coffee production. For some organic coffee producers, processed chicken manure, sold under the brand name Biogreen, pro-vided an important source of nutrients for organic coffee production. One 45-kg sack of Biogreen pro-vides 1 kg of nitrogen. However, between 2006–2007 and 2008–2009, on average, only 36% of organic producers applied Biogreen to their coffee plan-tations. Moreover, among these households, few were able to purchase enough Biogreen to allow reasonable productivity levels.21 The mean number of bags/ha of Biogreen applied ranged from a high of 21.9 in 2006–2007 to a low of 16.7 in 2008–2009. In general, these results suggest that nutritional requirements for organic coffee production were not being met.
Among households producing conventional cof-fee, the relatively high costs of inorganic fertilizer22 presents a challenge to replenishing soil nutrients lost to coffee production among cash-strapped pro-ducers. Data on inorganic fertilizer use (complete and urea) were collected from 152 households. Twenty-two households, or 14% of those sampled, reported no purchase of inorganic fertilizer during the entire period. For any one year, the percent-age of households reporting inorganic fertilizer usage in a given year varied from a high of 79% in 2008–2009 to a low of 61% in 2006–2007. Despite the overall increase in fertilizer application, how-ever, most households in the DSF cluster did not reach the estimated nitrogen threshold (39 kg of nitrogen/ha) for achieving reasonable productivity levels. Most households identified short-term credit from coffee buyers as the main factor contributing to fertilizer purchases.
4.2 Human capitalImplementation of good practices for coffee was an important focus of Soppexcca’s technical assistance. Results were mixed. On one hand, most households increased their skills for reducing environmental con-tamination and providing higher-quality coffee. The majority of households reported, for the first time, the application of select coffee harvesting practices (the select picking of ripe coffee berries) during the period (54%), as well as the treatment of wastewa-ter from wet milling (66%). Prior to the assessment period, these households harvested both ripe and unripe coffee (which reduced labor costs in harvest-ing but reduced the quality of green coffee exports) and allowed wastewater from wet milling to flow into nearby water sources. However, evidence sug-gests that skills for proper plantation management, including the pruning of coffee bushes and shade trees, which play an important role in determining coffee productivity, disease resistance and overall soil health, changed relatively little in response to Soppexcca-provided technical assistance.
Traditionally smallholders in Nicaragua do not prac-tice regular pruning or other forms of improved crop management on their coffee plantations. From a development perspective, the challenge is to iden-tify options for modernizing smallholder coffee production systems, which would provide benefits to producers through sustained yields and lowered costs in the long term, while at the same time maintaining or enhancing natural capital: biodiversity, protection from erosion, reduced contamination and enhanced nutrient cycling. Soppexcca facilitated the modern-ization of members’ crop management through its training and technical assistance program. However, according to Soppexcca staff, efforts to encourage more intensive tree management for coffee produc-tion have been ineffective, due in part to 1) a general reluctance by producers to trim or stump coffee trees that are productive and 2) the limited ability
21 To keep coffee yields at a reasonable level and maintain soil fertility, a minimum of 36 kg of nitrogen/ha needs to be supplied annually (Valkila, J. 2009. Fair-trade organic coffee production in Nicaragua—sustainable development or a poverty trap? Ecological Economics 68(12):3018–3025. This assumes that producers recycle their coffee pulp and use nitrogen-fixing shade trees—both of which are common practices among smallholders in Nicaragua.
22 Ganes-Chase, J. 2009. What’s with the weather? Coffee Talk, November, p. 10.

29
Building assets through access to specialty coffee markets: Lessons from smallholders and cooperatives in Nicaragua
of Soppexcca staff to engage intensively with pro-ducers for upgrading their crop management skills (interview R.R., November 24, 2009).
Households reported their perceptions on the util-ity of technical assistance for coffee production between 2007–2008 and 2008–2009. For most house-holds, Soppexcca was the only provider of training and on-site technical assistance and 44% (n=129) reported being dissatisfied or highly dissatisfied with technical assistance provision. Selected household responses shed light on the nature of the problem:
•“We were visited once in 2008, but the extension-ist didn’t provide technical advice; he arrived to inform us of a meeting at the cooperative.”
•“I lack advice when I need it: on one occasion I requested a visit from the extensionist because the coffee berries were falling off the branches, but he never came.”
•“He only comes to estimate the harvest. I am only able to consult with the extensionist during training events—that is how I have obtained technical assistance.”
•“Visits are only for estimating the harvest—the extensionist does not know my coffee planta-tion. He sends others from the community to assist me and does not provide advice.”
•“Sometimes he indicated which product I should use, but the extensionist did not indicate the doses and I burned the plants.”
Space here does not permit a full analysis of the quality of the governance and participation of mem-ber households in the management of Soppexcca. Nevertheless, a sense of ownership and governance
shared by members is an important cooperative principle. Findings showed that members had yet to acquire the skills and information needed for effective participation as members on the board of directors. One key informant noted that she received no training in basic business or in cooperative man-agement prior to assuming her post as a board member. She claimed that during her entire period on the board, she had little understanding of how the farm-gate price was calculated by Soppexcca or of the contract price for coffee between Soppexcca and its European and US buyers. Other informants noted that the board and Oversight Committee generally did not have access to timely financial information, though this was due mainly to the lack of informa-tion rather than inaccessibility.
Strong professional leadership at the cooperative, combined with a long-term commitment from buyers and NGOs to its development, as well as the institu-tional framework provided by fair-trade certification, played an important role in building Soppexcca’s organizational asset base. Yet, these achievements have come through external investment by buyers and donors rather than the development of human capital among the membership. Limitations to build effective internal leadership within the cooperative has resulted in a high concentration of power and information in the professional manager, hence vul-nerability of the organization and all the value chain relationships.
4.3 Social capitalFrom an individual or household perspective, the extent to which linkages with coffee buyers generate
30
Assessing Impacts of Value Chain Development on Poverty: A Case-Study Companion to the 5Capitals Tool
tangible benefits for maintaining and improving livelihoods forms an important element of social capital.23 Our discussion of social capital focuses on the additional benefits derived from collaboration with Soppexcca. In general, smallholders rarely have access to affordable credit in Nicaragua.24 Prior to joining Soppexcca, most households from the DSF (69%) and SSF (67%) clusters sold their coffee exclusively to markets in the towns of Jinotega and Matagalpa. In contrast, only 36% of households from the SLF used intermediaries to market their coffee prior to joining Soppexcca. Few households reported access to buyer-provided credit in the year prior to joining Soppexcca (20%) and even fewer reported having access to buyer-provided technical assistance (9%). Households from the SLF cluster were more likely to have forged linkages with direct exporters prior to joining Soppexcca and thus were more likely to have access to credit and higher prices.
Having forged new linkages with Soppexcca, most households retained their previous relationships with preexisting coffee buyers. Buyers differed in terms of services offered and the costs of doing busi-ness (table 3). Relative to other buyers, Soppexcca was the most demanding in terms of quality but offered the most extensive range of services. In 2008–2009, credit was available for most members without formal land titles or other forms of col-lateral at an interest of 16% for annual credit and 14% for long-term credit (three-year grace period, with three- to five-year payback period). Soppexcca was the only buyer that offered long-term credit. Beginning in 2007, Soppexcca employed a team of eight extensionists to provide technical assistance. In addition, Soppexcca provided safety nets for its members (use of Soppexcca vehicles for emergen-cies, donation of a coffin for death of a member or member’s spouse, credit/donations for cover-ing medical expenses) and access to development projects, which have played a role in expanding the options available for agricultural production (such as cocoa, small livestock). However, doing business
with Soppexcca was relatively costly. Payment for coffee was made in three installments, with the final installment (about 20% of total price) delayed until May-June. All credit and payment transactions required travel to Soppexcca’s office in Jinotega and producers assumed all costs and risks for transport of coffee to the warehouse.
Compared to Soppexcca, market buyers offered faster payment, with cash upon delivery of coffee and credit on demand; however, prices paid were generally lower and costs for credit were higher.
Few sampled households sold to direct exporters of coffee (n=5). Exporters provided annual credit on a contract basis, with land titles generally required as collateral (in cases where producers had a history of compliance with contractual obligations, land titles may not have been required). Annual credit during the 2008–2009 production season was offered at a 17% annual interest rate. Producers had the option to receive final payment (market price minus amount of annual credit) upon delivery of parchment coffee. Additional services, such as on-site technical assis-tance and pick up of parchment coffee, were not reported.
Data on coffee sales by buyer indicate the difficulty Soppexcca faced in increasing its capture of raw material from its members. For organically certified households, the mean percentage of coffee sold to Soppexcca between 2007–2008 and 2008–2009 was 73%, while for conventional producers, the mean per-centage was 57% (fig. 5). This suggests that price was not the major factor behind selling to buyers other than Soppexcca. Reponses presented below illustrate diverse reasons. The most common response was linked to the need to cover production expenses for harvest (n=31). In other cases, households identified emergencies and expenses as the main reason for selling to other buyers (n=8), poor quality (n=4) and restricted access to credit (n=2). Below are quotes from households in the DSF cluster.
23 Portes, A. 1998. Social capital: its origins and applications in modern sociology. Annual Review of Sociology 24:1–24.
24 Bastiaensen, J. 2005. Institutional entrepreneurship for rural development: the Nitlapán banking network in Nicaragua. In Rural development in Central America: markets, livelihoods and local governance, Eds. R. Ruben and J. Bastiaensen. New York: St. Martin’s Press.

31
Building assets through access to specialty coffee markets: Lessons from smallholders and cooperatives in Nicaragua
•“Don Osman pays better than Soppexcca; Soppexcca has too many price deductions, and he is less concerned with quality.”
•“Because my brother needed money, I sold cof-fee in the market to resolve his need.”
•“Due to delays in the provision of credit—the intermediary is much quicker. Soppexcca always delivers credit in June, while the intermediary delivers in May.”
•“The amount of credit offered by Soppexcca is very small…from the Atlantic [direct coffee exporter] I receive US$10,000 and Soppexcca
Table 3. Characteristics of trading relationships for coffee sold by Soppexcca members
BuyerTwo-year average farm gate price (2007–2008
to 2008-2009)
Payment conditions in 2008/2009
Services offered in addition to coffee marketing in 2008/2009
Soppexcca Organic: US$136Conventional: US$109
Floor price (fair trade)
Interest rate 1.2%/month
Initial payment with short-term credit (20%), partial payment upon delivery to warehouse (60%), final payment in June (20%)
Technical assistance
Certification
Fertilizer for purchase (delivered to farm)
Short- and long-term credit (no collateral required, interest rate 1.2%–1.3% per month)
Emergency credit
Other servicesb
Market buyers in Jinotega and Matagalpaa
Conventional: US$97
Full payment upon delivery
Price to producer: direct exporter price minus commission
Purchase of coffee
Exchange of basic food items for parchment coffee (before and after harvest)
Annual credit (no interest on credit taken prior to harvest; 5%/month interest on all other credit)
Village-based buyers Conventional: US$97
Land title not required for credit
Full payment upon delivery, price based on New York market price
Technical assistance
Annual credit (interest rate at 1.5%–2%/month)
Fertilizer for purchase (delivered to farm)
Transport of coffee to warehouse
Direct exporters Conventional: US$99
Contract required for credit (with collateral)
Final payment upon delivery, priced based on New York market price
Annual credit (Interest rate 1.5–2%/month)
a Information based on results from 18 key informant interviews carried out on-site with buyers of coffee at the markets of Jinotega and Matagalpa in August 2009b For example, emergency transport to hospital or donations for funeral expenses
has not provided any. Soppexcca also demands too much in terms of quality.”
•“Transport is very difficult from our farm to the road. The other buyer collects our coffee at the farm.”
4.4 Physical capitalImprovements in infrastructure at the household level played a major role in Soppexcca’s strategy for improving coffee quality. Physical capital for wet milling includes the construction/refurbishment of mill enclosures, construction/refurbishment of

32
Assessing Impacts of Value Chain Development on Poverty: A Case-Study Companion to the 5Capitals Tool
fermenting tanks or the purchase/repair of machines for depulping and pumping water. The average investment by households in the DSF cluster was US$198 during the four-year period, skewed upward by a few households; among the 72 households in the cluster, only 12 (17%) reported cash invest-ments for improved wet milling (fig. 6). Investments by SSF, while significantly higher than those of the DSF cluster, remained low at US$593. Moreover, 70 SSF households, or nearly half the cluster, reported no cash investments during the period. Investments by SLF household, at nearly three times those of SSF households, showed considerably less variation within the cluster. Credit by Soppexcca contributed US$97,847 to investments in wet-milling infrastruc-ture and machinery, or roughly 48% of total reported household expenditure.
Households also reported any acquisition of machinery, tools and infrastructure for agricultural production, in addition to those used for wet mill-ing during the four-year period. The extremely low investment by households in the DSF cluster stands out, at US$91 (fig. 6); investments they made were generally confined to basic tools for production of coffee and basic grains (machetes, shovels, sprayers). Similar to experiences in the building of physical
Fig. 5. Percentage of coffee sold to Soppexcca, by producer type and cluster (two-year average from 2006–2007 to 2008–2009)
0
10
20
30
40
50
60
70
80
90
DSF SSF SLF All households
Conventional Organic
capital for wet milling, households in the SSF cluster achieved higher investments than their DSF coun-terparts, but the absolute level of investments was low. In general, findings suggest that households from DSF and SSF clusters struggled to build their physical capital endowments for farm production compared to investments by SSF households, which included relatively large purchases of mechanized machinery for the production of coffee, livestock and off-farm business activities.
Secure shelter is a basic physical capital require-ment for livelihood maintenance and improvement. Irrespective of cluster, most households faced chal-lenges in upgrading key features of their existing domestic infrastructure. Housing for Soppexcca members was typically a one-room hut, with a zinc roof, dirt floor and in some cases a latrine. Few house-holds reported cash investments for additions to or improvements in their housing. In the case of the DSF, 83% of households did not report any cash investment in housing. Average expenditures for DSF households was roughly US$470; however, the mean was highly
Fig. 6. Purchase of tools, equipment and machinery, 2006–2007 to 2008–2009
0
200
400
600
800
1000
1200
1400
1600
1800
2000
Mean investment (US$) in wet-millingmachinery and infrastructure
Mean investment (US$) in all othertools, equipment and machinery
DSF SSF SLF Allhouseholds

33
Building assets through access to specialty coffee markets: Lessons from smallholders and cooperatives in Nicaragua
influenced by one household that spent more than US$16,000 on a house in the town of Jinotega with savings accumulated while working in the United States—not derived from coffee or farming. The results for SSF and SLF clusters were similar, at 71% and 81%, respectively. Reported expenditures prob-ably underestimate total investments, as timber and other products were likely sourced on the farm and materials were often donated by projects (for exam-ple, zinc roofing materials, latrine infrastructure).
4.5 Financial capitalThe ability of households to build natural and phys-ical capital was strongly related to their access to long-term credit. Between 2004–2005 and 2008–2009, 164 sampled households received credit for the pur-chase of land or expansion of coffee production. The average amount of credit was US$1,271, with roughly 93% provided by Soppexcca. Among the clusters, the average amount varied from a low of US$889 for households in the SLF cluster to a high of nearly US$1,319 for households in the SSF cluster. Among households in the DSF cluster, an average of US$957 in credit was received, all of which was provided by Soppexcca. While Soppexcca was not an important provider of finance in quantitative terms, engagement with the cooperative was important for other reasons. Most of all, it provided insurance in the form of emer-gency financial support in times of illness (medical costs) and death (funeral expenses), which otherwise would have resulted in asset erosion.
As noted previously, most sampled households (57%) reported no access to short-term credit prior to joining Soppexcca. During the assessment period, opportunities for obtaining short-term credit increased, in part due to linkages with Soppexcca, with only 12% of sampled households reporting no access to credit. Forty-four households, about 15% of the sample, reported no use of short-term credit during the assessment period. Among households that received short-term credit, most (n=160, 55%) reported Soppexcca as their only source of credit. Other credit sources included specialized lending organizations, coffee buyers, NGOs and, to a lesser extent, informal lenders and commercial banks. Collateral requirements varied. While the terms
offered by Soppexcca were relatively favorable, the average amount provided was small. For exam-ple, in 2007–2008, the mean annual credit amount for DSF households was US$197, US$390 for SSF households and US$1,805 for SLF households. Even for households with relatively small coffee holdings, Soppexcca-provided credit was unlikely to cover variable production costs, much less facilitate more strategic investments in asset building.
Results of the distribution of benefits of sales through Soppexcca were illuminating. It was not uncommon for smallholders to divert sales from formal to infor-mal channels. Informal channels provided producers with an additional source of credit, as well as a mar-ket for coffee that did not meet Soppexcca standards. Table 4 presents estimates of the income benefit for Soppexcca members from coffee sales, taking into account sales to Soppexcca and to other buyers and allowing for the differences in farm-gate prices between coffee buyers. Among households from DSF and SSF clusters that produced conventional coffee, the actual income benefits from participation in Soppexcca were small, at US$29/year and US$78/year, respectively. Income benefits would have been more than twice the actual benefits if households had sold all of their production to Soppexcca. Organic certified households from the DSF and SSF clusters experienced higher income benefits than their con-ventional counterparts, at US$77/year and US$94/year, respectively. However, these households also struggled to maximize their income benefits from participation in formal markets. On average, organi-cally certified households captured only 27% of the total possible income benefits due to selling coffee to other buyers. For producers of conventional cof-fee, the limited price benefit generated through sale of coffee to Soppexcca may have facilitated their decision to sell to other buyers. For both types of pro-ducers, the need to sell coffee outside of Soppexcca often reflected an urgent demand for credit linked to coffee production, for responding to emergencies and to smoothing income generation over the year.
4.6 Enabling conditionsNo major change was observed in terms of access to public infrastructure or access to public services

34
Assessing Impacts of Value Chain Development on Poverty: A Case-Study Companion to the 5Capitals Tool
during the assessment period. Various households received support from buyers of coffee other than Soppexcca, and in some cases, these services were similar to those provided by Soppexcca (see dis-cussion in 4.3). Few households reported access to government programs or projects for intensifying or diversifying on-farm production.
5 Conclusions
The development of Soppexcca has been a costly endeavor for Soppexcca, its members and its supporters. However, overall, Soppexcca has demon-strated its ability to operate in a challenging business environment and respond to the needs of buyers and some member needs. Soppexcca is not alone in having received considerable external support: the literature highlights the high level of support given to some cooperatives in Latin America that partici-pate in certified markets—for example, El Ceibo in
Table 4. Estimated annual income benefit from coffee sales to Soppexcca (two-year average, 2007–2008 to 2008–2009)
Cluster
Average total coffee production (45-kg sack
green coffee)
Potential annual income
(US$) if all coffee is sold
to Soppexccaa
Potential income benefit
(US$) if all coffee is sold
to Soppexccab
Actual annual income from
coffee sales (US$), considering sales
to other buyers
Actual income
benefit (US$) from sales to Soppexcca
Percent captured
of potential income benefit
Conventional
DSF 5.9 637 63 609 29 45
SSF 18.0 1,944 191 1,866 78 41
SLF 100.2 10,822 1,065 10,326 495 46
Total 31.3 3380 333 3,238 142 43
Organic
DSF 6.6 898 255 821 77 30
SSF 9.5 1,292 367 1,198 94 26
SLF 49.4 6,718 1,908 6,279 440 23
Total 14.0 1,904 541 1,758 146 27
a The following two-year average farm gate prices (2007–2008 to 2008–2009) were offered by Soppexcca: US$136/45-kg sack for organic coffee and US$109/45-kg sack for conventional coffee. b Difference in income generated from all coffee production being sold to Soppexcca versus income generated from all coffee being sold to other buyers. A farm-gate price of US$97/45-kg sack was used for estimating income from sales to other buyers.
Bolivia and Forestcom in Guatemala. In the context of the coffee crisis, it is not difficult to justify NGO and donor support to the sector: the external envi-ronment was particularly unfavorable for coffee and smallholder coffee production was important for both social and environmental reasons. There are few articles that discuss the role of different patterns of external support in cooperative development. The Soppexcca case highlights the long pathway for cooperative development despite extensive external support. Soppexcca is a costly success, but if it keeps going, those costs will be recovered. A particularly interesting dynamic is the valuable and consistent support from coffee buyers, not just NGOs.
Soppexcca’s experiences show how large preexisting endowments of human and social capital provided a solid foundation for rapid asset accumulation during the assessment period. During the early period of Soppexcca’s development, interventions by the pri-vate sector played a critical role in building human

35
Building assets through access to specialty coffee markets: Lessons from smallholders and cooperatives in Nicaragua
capital, which in turn facilitated the building of social capital. However, longer-term interventions that focused on building Soppexcca’s physical and financial capitals and improving Soppexcca’s service offer for its members were carried out exclusively by NGOs. Support from NGOs and fair-trade lenders allowed Soppexcca to build infrastructure for coffee processing, build its technical assistance program for quality enhancement and expand its short-term credit services for members. Despite major gains in assets during the assessment period, however, Soppexcca remained highly vulnerable to asset ero-sion from both internal and external shocks. This case highlights the need for closer collaboration between chain stakeholders and external service providers, such as NGOs, based on mutual learning and accountability.
Results at the household level showed both the poten-tial and the limitations of value chain interventions to facilitate asset building by the poor. On one hand, through their link to value chains for certified coffee, many households expanded their access to short-term and long-term credit, improved the quality of their coffee production and reduced their vulnerabil-ity to asset erosion and food insecurity. These results were especially important given that prior to the assessment period, coffee growers in Nicaragua had experienced a prolonged period during which coffee prices fell below production cost (2001–2003). On the other hand, many households struggled to meet their basic needs, which required them to sell their coffee outside of the value chain and limited their ability to build their asset endowments. The poor-est households, which tended to depend heavily on off-farm income, were the least able to benefit from participation in the value chain. In many cases, these households struggled to purchase basic production inputs, implement good production practices for cof-fee and secure title to their land.
Finally, did Soppexcca and its links with buyers and NGOs help the poorest? The analysis of asset building presented here suggests that links to specialty cof-fee markets and related development interventions
can achieve a broader set of outcomes than merely favorable prices and market access, including build-ing a sustainable and more competitive value chain, building more viable cooperatives and building spe-cific assets by the poorest farming households. It was shown that all of these outcomes were import-ant to achieving a viable value chain in the specialty coffee subsector that had potential to provide a pathway out of poverty for many of the households linked to it. However, the Soppexcca experience also showed that such achievements did not come cheap; they resulted from years of investments by coffee buyers, donors and civil society, Soppexcca staff and Soppexcca’s members. Nevertheless, the better-endowed specialized large-scale (SLF) house-holds were the primary beneficiaries in terms of financial capital and most other areas of asset build-ing. The experiences of diversified small-scale farmer (DSF) households who seem to fall below a respon-siveness threshold showed that rural poverty goals might best be achieved by helping those households with the smallest asset endowments to transition out of agriculture.
This study highlights the complexities, challenges and dilemmas for achieving poverty reduction through links to specialty coffee markets and related development interventions. The interactions among capitals require an approach to value chain develop-ment that recognizes the complexities and trade-offs among asset types that are by no means discrete but often complementary and sometimes antagonistic. Among these dilemmas is the ethics of targeting development efforts at the not-so-poor, thereby influencing policies that mediate or encourage the migration of the poorest out of farming and into the nonfarm economy—or even out of rural areas. The Soppexcca case underscores both the poten-tial that exists for achieving pro-poor value chain development and the need for deeper discussions about the role of different stakeholders, the ultimate goals of development interventions, and the need for increased coordination and mutual learning among cooperatives, their members and external supporters as part of the development process.

36
Linking smallholder fruit and vegetable farmers to supermarkets: An assessment of the Seed II project in Nariño, Colombia
Catalina Robledo de Eikenberg1
SummaryThis case study examines the outcomes of interventions to link smallholder fruit and vegetable farmers in southwestern Colombia to supermarkets through a project-supported enterprise. Data was collected from 47 households. Data collection also included focus groups and key informant interviews. The study shows that the interventions generally succeeded in improving the livelihoods of the fruit and vegetable farmers. This improvement was achieved, in part, through interventions aimed at creating La Alianza Hortofrutícola del Sur, an enterprise made up of six agricultural associations that united some 150 farmers to sell their produce, at higher prices, directly to supermarkets in the region. By the end of 2010, the enterprise had achieved sales of seven tons of fruits and vegetables per month directly to supermarkets in the cities of Pasto and Cali. The participating households experienced positive changes in different types of asset endowments. Among sig-nificant changes were the following: 1) revenue from fruit and vegetable sales more than doubled, 2) access to credit increased substantially, 3) new skills acquired in product diversification led to a 41% increase in the number of products harvested, 4) participation of women in key productive activities increased signifi-cantly and 5) important improvements were made to homes and farms. However, the viability of La Alianza Hortofrutícola del Sur in this value chain is still dependent on project staff. This dependency represents a risk for the sustainability of the value chain. The member farmers do have a clear vision of how to solve this issue via consolidation of a fully fledged, for-profit local enterprise that commercializes the products and finances necessary personnel.
1 Catalina Robledo de Eikenberg, country director-Colombia, Technoserve, [email protected].

37
Linking smallholder fruit and vegetable farmers to supermarkets: An assessment of the Seed II project in Nariño, Colombia
1 Overview
1.1 BackgroundIn general, discussions on the participation of smallholders in value chains for fresh horticultural products have focused on the rising standards for fresh produce and the challenges that these pres-ent for smallholder suppliers.2,3,4 This paper looks at the role of development interventions in helping smallholders in Colombia gain access to supermar-ket buyers of fresh horticultural products. The value chain development assessed in this report was under-taken in the second phase of the project entitled Territorial Model of Rural Economic Development with Social Inclusion, hereafter referred to as Seed II. Its aim was to enhance the quality of life of fruit and vegetable farmers through increased incomes from a more-efficient value chain and higher-quality products.
The first phase of Seed (2006–2008) supported 714 farmers in 13 value chains with technical assistance, access to markets and access to finance. However, according to project directors, a drawback of the initial phase was that the cost of administration and technical procedures absorbed about 70% of the budget. A lesson for the next phase was to focus on a smaller number of high-potential value chains to be more effective. Thus, Seed II focused only on coffee
and horticulture (the latter having been a surprise success, with registered sales about 500% larger than expected).
The Seed II project was presented to the Ford Foundation in February 2008 for funding by a con-sortium of three organizations:
•Contactar (a rural microfinance institution)•Local Development Agency of Nariño (Spanish
acronym ADEL)•Fundación Social (local NGO)
The project was approved with a budget of US$600,000, and the municipal government pro-vided matching funds. Seed II was a 24-month project that began March 1, 2008. Though the project had objectives in addition to value chain development, including functioning as an inte-grated territorial development project that would strengthen the implementing agencies and work with local governments, this evaluation focuses only on the value-chain component.
Seed II identified coffee and fresh produce as the products having high potential for value chain development. Within the produce value chain, the project supported a total of 150 fruit and vegeta-ble farmers located in the municipality of Pasto in southwestern Colombia (fig. 1) that were organized
2 Reinhardt, N. 1987. Modernizing peasant agriculture: lessons from El Palmar, Colombia. World Development 15(2):221-247.
3 Dolan, C; Humphrey, J; Harris-Pascal, C. 1999. Horticulture commodity chains: the impact of the UK market on the African fresh vegetable industry. Working Paper, 96, Brighton: Institute of Development Studies.
4 Reardon, T; Timmer, CP; Berdegué, JA. 2003. The rise of supermarkets in Africa, Asia, and Latin America. American Journal of Agricultural Economics 85(5):1140-1146.

38
Assessing Impacts of Value Chain Development on Poverty: A Case-Study Companion to the 5Capitals Tool
into six producer associations: Asocofradia, Asofruit, Asoprogua, Aproborca, Pakaisu and Coopsur. The project united these associations in a second-level organization called La Alianza Hortofrutícola del Sur (hereafter referred to as La Alianza), which functioned as the local enterprise to sell products directly to supermarkets in Pasto and Cali.
The assessment covers only the Seed II phase, but it is important to note that a third phase con-tinues from 2010 to 2012. Its aim is to consolidate the results achieved during Seed II to ensure sus-tainability beyond the intervention for value chain development, especially as related to strengthening the local enterprise.
Seed II included the following program components: 1. Services for managerial development and
institutional strengthening The focus was on La Alianza, a second-tier organization created to commercialize the produce of six associations directly to
supermarkets. All participants received technical training, particularly in the area of postharvest high-quality management, as well as distribution, logistics, accounting and finance.
2. Financial services This included access to individual and group loans from Contactar and the formation of self-managed rotating savings and credit associations (ROSCAs).
3. Research Research focused mostly on market demand and new product development (various broccoli-related research activities).
4. Systematization and monitoring Though the objective to create a database of the farmers was not fulfilled, a management information system was developed for La Alianza. However, during this phase it was managed only by project staff, not by the farmer associations.
1.2 Objectives of value chain developmentThe overall objective of Seed II was to contribute to the socioeconomic development of small-scale farmers in Nariño Department in Colombia through a broad set of strategies that included a value chain component as well as governance and access to finance. However, this report focuses solely on the interventions.
The main elements of Seed II in horticulture in Nariño follow.Implementation period: March 2008–March 2010Stakeholders:
•Contractor: Microfinance institution•ADEL: Local Development Agency of Nariño•Fundación Social: Local NGO
Main interventions:•Technical assistance focused on postharvest
management•Formation and strengthening of La Alianza, a
second-tier organization that commercializes the produce of the six associations and sells directly to supermarkets
•Research on market demand and new product development
Fig. 1. Map of Colombia indicating the focus of the Seed II project in the eastern corner of Nariño Department
Pasto
La UniónNariño
Panamá
Ecuador
Perú
OcéanoPacífico

39
Linking smallholder fruit and vegetable farmers to supermarkets: An assessment of the Seed II project in Nariño, Colombia
Main objectives:•Increase farmers’ revenue by 30%•Increase levels of associativity among the
associations•Create one second-level organization•Change aspects of local policy making as a result
of the Seed project
2 Methodology
The assessment of the value chain component of the project followed the 5Capitals tool.5 This tool focuses on identifying and measuring changes in different types of assets (social, human, natural, physical and financial)—a multidimensional tool offering a more integrated perspective on poverty impacts.
An important characteristic of the tool is its use of both qualitative and quantitative data collection and analysis and a variety of information sources. There is strong emphasis on cross-checking and triangu-lating that information. The primary data collected (household surveys) is triangulated through focus groups, key informant interviews and secondary data in order to assess changes in assets and identify whether a specific change is due to the intervention. This is a challenging process since a change is often the result of a combination of causes, not solely the intervention.
Assessment, using this methodology, takes place at two levels along the value chain: the household and the local enterprise. The latter takes into account that enterprises with direct and sustained contact with smallholders often play a major role in their long-term access to higher-value markets and there-fore have significant influence on long-term poverty reduction.
2.1. Steps carried out in the assessmentFive main steps were carried out (table 1), steps derived directly from 5Capitals.
2.2 Sample designDesigning a representative sample for the deploy-ment of the household survey required determining a minimum number of farmers from the total popu-lation, taking care that the number had no particular bias.
For the sample to be representative, a standard mathematical calculation was used, assuming a z-distribution and aimed for a significance level of 95%, resulting in the 47 horticultural farmers to be interviewed.
Care was taken to have sufficient interviewees from each of the six different farmers’ associations in the program. Since all farmers were in the same subregion, concentrated in a small area, no geo-graphical bias existed.
2.3 Data collection methods For the analysis, we used both primary and second-ary data. For the primary data collection, we used three different methods:1. Household surveys with a total of 47 horticulture
farmers2. Two focus groups with members of the six
producer associations (before and after the data collection and analysis), which was crucial to interpreting and identifying the accuracy of the numbers
3. 10 key informant interviews •directors of the three organizations participating
in the project • two technicians involved in the project •project director • three supermarkets •external consultant involved in Seed I and Seed II
As for secondary data, we used publicly listed prices, such as NYC-traded coffee prices, the internal Colombian coffee prices, the USD-COP exchange rate for relevant time periods, etc.
5 Donovan, J; Stoian, D. 2012. 5Capitals: a tool for assessing the poverty impacts of value chain development. Turrialba, CR, CATIE, 70 p. (Technical Series 55, Rural Enterprise Development Collection no. 7).
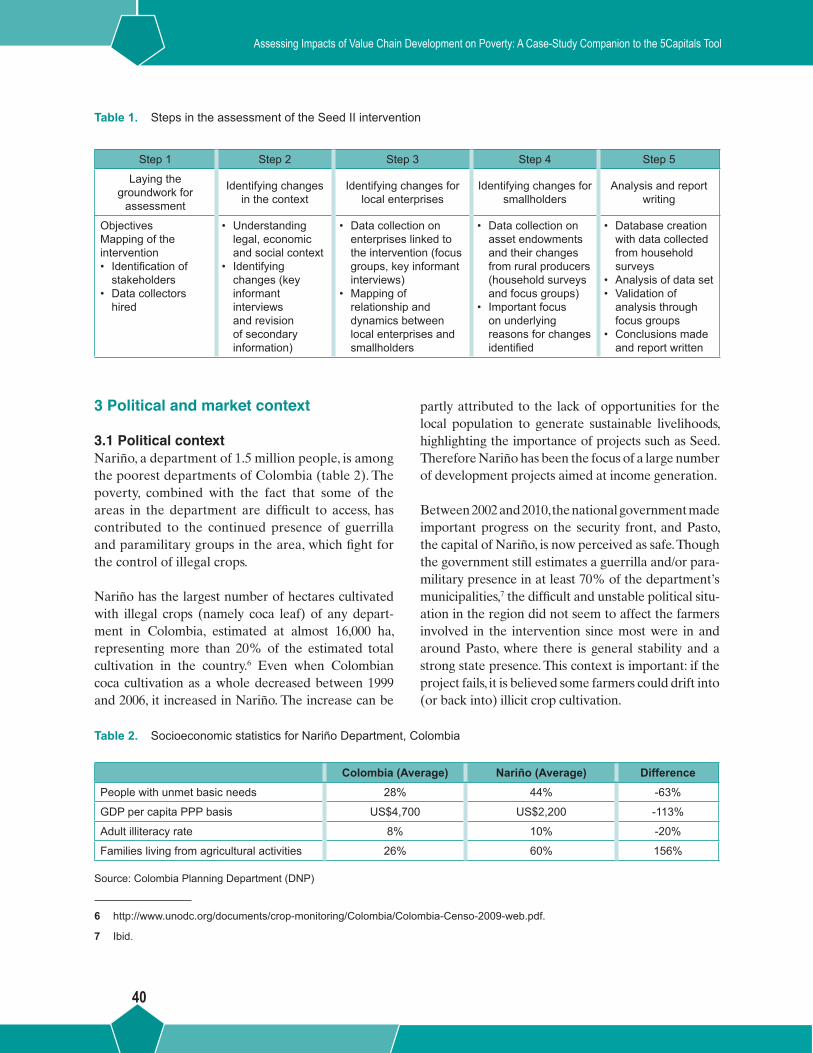
40
Assessing Impacts of Value Chain Development on Poverty: A Case-Study Companion to the 5Capitals Tool
3 Political and market context
3.1 Political context Nariño, a department of 1.5 million people, is among the poorest departments of Colombia (table 2). The poverty, combined with the fact that some of the areas in the department are difficult to access, has contributed to the continued presence of guerrilla and paramilitary groups in the area, which fight for the control of illegal crops.
Nariño has the largest number of hectares cultivated with illegal crops (namely coca leaf) of any depart-ment in Colombia, estimated at almost 16,000 ha, representing more than 20% of the estimated total cultivation in the country.6 Even when Colombian coca cultivation as a whole decreased between 1999 and 2006, it increased in Nariño. The increase can be
partly attributed to the lack of opportunities for the local population to generate sustainable livelihoods, highlighting the importance of projects such as Seed. Therefore Nariño has been the focus of a large number of development projects aimed at income generation.
Between 2002 and 2010, the national government made important progress on the security front, and Pasto, the capital of Nariño, is now perceived as safe. Though the government still estimates a guerrilla and/or para-military presence in at least 70% of the department’s municipalities,7 the difficult and unstable political situ-ation in the region did not seem to affect the farmers involved in the intervention since most were in and around Pasto, where there is general stability and a strong state presence. This context is important: if the project fails, it is believed some farmers could drift into (or back into) illicit crop cultivation.
Table 1. Steps in the assessment of the Seed II intervention
Step 1 Step 2 Step 3 Step 4 Step 5
Laying the groundwork for
assessment
Identifying changes in the context
Identifying changes for local enterprises
Identifying changes for smallholders
Analysis and report writing
ObjectivesMapping of the intervention• Identification of
stakeholders• Data collectors
hired
• Understanding legal, economic and social context
• Identifying changes (key informant interviews and revision of secondary information)
• Data collection on enterprises linked to the intervention (focus groups, key informant interviews)
• Mapping of relationship and dynamics between local enterprises and smallholders
• Data collection on asset endowments and their changes from rural producers (household surveys and focus groups)
• Important focus on underlying reasons for changes identified
• Database creation with data collected from household surveys
• Analysis of data set• Validation of
analysis through focus groups
• Conclusions made and report written
Table 2. Socioeconomic statistics for Nariño Department, Colombia
Colombia (Average) Nariño (Average) DifferencePeople with unmet basic needs 28% 44% -63%
GDP per capita PPP basis US$4,700 US$2,200 -113%
Adult illiteracy rate 8% 10% -20%
Families living from agricultural activities 26% 60% 156%
Source: Colombia Planning Department (DNP)
6 http://www.unodc.org/documents/crop-monitoring/Colombia/Colombia-Censo-2009-web.pdf.
7 Ibid.

41
Linking smallholder fruit and vegetable farmers to supermarkets: An assessment of the Seed II project in Nariño, Colombia
Within this political context, it is also important to note that regional policy making by the local author-ities is not closely articulated with international cooperation projects led by donors and NGOs. Projects often overlap or even contradict each other. For example, the focus groups revealed that some of the agricultural best practices taught were not in line with those previously taught by other pro-grams. However, in general, the farmers rated the Seed project higher in all variables assessed in the survey in comparison with other development pro-grams in which they had participated. Additionally, a substantial achievement was that the horticultural project intervention raised matching funds and sup-port from some of the local mayors’ offices.
3.2 Market contextThe market context had the greatest influence on results achieved by the Seed project. Within the Nariño region, the most widely produced fruits and vegetables have been potatoes, plantains, maize, sugar cane, green peas, spring onions and carrots, with a strong concentration on potatoes, which accounted for more than 50% of the value of all agri-cultural production in the department.8 The project intervention helped farmers diversify their crops, with a special focus on fruits rather than vegetables, which brought successful results.
The fruit and vegetable market is predominantly local; most perishable goods are not imported or exported, in part due to Colombia’s year-round temperate climate that enables relatively stable
production throughout the year. In fact, the price dynamics for these products are quite regional, with the main driver being total supply of the product. In this context, farmers have a limited ability to nego-tiate with buyers.
Thus, the ability of fruit and vegetable farmers in the Seed project to sell their produce to supermarkets outside the Nariño area, escaping the regional mar-ket dynamics, is important, especially in the months when the supply of a particular product is high. The value chain project offered the advantage of direct negotiation with supermarkets, which gave farmers stability in the price they received throughout the year as well as a premium price for high-quality pro-duce. Since supermarkets will not buy directly from small producers, producers must sell collectively, which led to Seed II‘s emphasis on uniting efforts of small farmer groups.
4 Changes in business assets
Setting up an upstream enterprise in the horticul-tural value chain was one of the main objectives of Seed II (see fig. 2 for a map of the horticultural value chain). One project staff member was in charge of the relations between the newly formed alliance among producers groups—La Alianza, which functions as the local enterprise—and the supermarkets. At the end of Seed II, the enterprise was still dependent on the project staff person for commercialization of products.
8 Ministerio de Agricultura y Desarrollo Rural de la República de Colombia. Anuario Estadístico 2008.

42
Assessing Impacts of Value Chain Development on Poverty: A Case-Study Companion to the 5Capitals Tool
4.1 Human capitalA key change in human capital identified at the local-enterprise level involved increasing skills for commercialization with supermarkets (marketing, logistics and negotiation capabilities). A central element was the process of determining products in demand at the supermarkets to guide farmers in their planting (instead of planting products that could be in excess supply). This capability was cen-tralized in project staff and must be institutionalized during consolidation of La Alianza. One supermar-ket (Alkosto, with stores in Nariño and Cali and five other locations in the country) mentioned in the interview that La Alianza provided the best quality vegetables that it had, which led Alkosto to work with other farmers’ associations.
Learning in the areas of bookkeeping, accounting and finance at the level of La Alianza has remained for the most part solely in the hands of the proj-ect person in charge of commercialization with the
supermarkets. The financial planning system was managed by another project staff person.
The farmers have a clear vision of how to solve this dependence by consolidating the local enterprise to commercialize the products through members of La Alianza, creating enough revenue to pay for neces-sary qualified staff.
4.2 Social capitalSeed II worked toward the consolidation of La Alianza for the aggregation of produce, which was critical for reaching the minimum quantities required to sell directly to supermarkets (a small amount was still sold to other intermediaries but most of the production went to supermarkets). The creation of this alliance was the main change identified in social capital. By the end of 2010, the six cooperatives working together through La Alianza commercialized seven tons of fruits and vegetables per month, sold directly to eight chain supermarkets in the cities of Pasto and Cali.
Fig. 2. Value chain map for the Seed II horticultural value chain
Before the Seed II project
Input suppliers
Producers
Local trader
Local markets
Supermarkets
Con
sum
ers
After the Seed II project
La Alianza Hortofrutícola
del SurSupermarkets
No profit margin for La Alianza (all proceeds go to the farmer)
Input suppliers
Producers
Con
sum
ers

43
Linking smallholder fruit and vegetable farmers to supermarkets: An assessment of the Seed II project in Nariño, Colombia
The project intervention has been extremely suc-cessful in terms of social capital built. The different associations have increased their strength through this increasingly sophisticated alliance. For exam-ple, a recent analysis by project staff indicated the need to look into new commercialization channels, such as restaurants and bakeries, in order to achieve high growth in the future—growth in demand from supermarkets has reached a peak and will tend to stabilize over the next three years. Farmers working independently would not have been able to carry out this kind of analysis or capitalize on it.
The creation of the local enterprise was also the cat-alyst for many of the positive results in terms of asset building among farmers, identified in section 5.
4.3 Physical capitalLa Alianza slowly gained productive assets at a com-mercial level that were previously subsidized by the project. Namely, in 2009 it rented a storage space in Cali, which was logistically crucial for selling to super-markets in that city. Since Cali is the third-largest city in Colombia, much larger than Pasto, it has a much greater demand for products. Additionally, La Alianza bought 3,800 baskets, eight weights, a mill for making compost and a minivan. These were important mile-stones toward making the operation sustainable.
4.4 Financial capitalTotal monthly revenues of La Alianza increased significantly, from about US$7,000 in 2009 to about US$30,000 in 2010 (fig. 3).
Crop diversification promoted by the intervention put La Alianza in position to sell new products to the supermarkets that often brought higher prices than traditional products. The product providing the greatest revenue changed from the potato (the tra-ditional crop) to uchuva, a fruit native to Colombia, Peru and Ecuador that previously was not cultivated at all. Cultivation of potatoes decreased by 19%, while the cultivation of fruits increased by almost 200% (fig. 4). However, even though importance of the potato product decreased relative to other products, the income derived from potatoes doubled during the same period, showing that even with the traditional crop, selling to supermarkets was a much better commercial proposition (fig. 5).
5 Changes in household assets
Various positive changes were identified among small-scale farmers, most stemming from creation of La Alianza to sell produce directly to supermarkets. The most important changes were a sharp increase
Fig. 3. Monthly revenues received by La Alianza per product (2009–2010), plus differences by product between the two years
Monthly revenues in May 2009(US$)
Monthly revenues in December 2010(US$)
Difference(US$)
2,4062,3275580
2,42500
5,7134,475
9,557
1,9804,890
1,3691,533
Uchuva
1,533
Cauliflower
3,307
WhiteOnions
2,149
Lettuce
8,999
Strawberries
1,980
Broccoli
2,465
Potatoes
1,369

44
Assessing Impacts of Value Chain Development on Poverty: A Case-Study Companion to the 5Capitals Tool
in revenues (fig. 5) and a significant increase in the participation of women in farm activities, increase in collective activities and increase in access to credit (fig. 6).
5.1 Natural capital The average landholding per farmer was 1.1 ha, which did not change during the study period. In 2010, 64% of farmers cultivated their own plot of land, 23% used a common local sharecropping sys-tem, known as medianería, in which a landowner makes his land available to a farmer who cultivates it and shares the final produce with the landowner in equal parts), and 13% rented land.
Given the important increases in income during the study period, the greatest surprise during the assess-ment was that there were no land acquisitions and no changes observed in the type of land tenancy. During extensive interviews about this issue in focus groups, the farmers stated that acquiring land would require large lump-sum savings that they still didn’t have. Rather, the increases reported by the farmers in the volumes harvested (on average 18%) came mostly from increases in productivity through the use of
fertilizers, which they were able to afford through the increased income; through the use of land that farmers already had but were not using; or through land cultivated under the sharecropping system.
5.2 Human capitalDuring the intervention, farmers received training in key skills in postharvest management, product diversification negotiation, ecological practices and bookkeeping. However, as detailed in this section, what was learned was not always put into practice.
Probably the most critical skills acquired were in postharvest product management, which was crucial to achieving the high-quality products required to sell directly to supermarkets. Although this does not show numerically through the data collected in the household surveys, it came out clearly in the focus groups. Empirically, it was demonstrated by the fact that no deliveries to supermarkets were rejected in 2010, contrary to previous years. Moreover, in inter-views, supermarket representatives (notably Alkosto) mentioned that La Alianza represented one of its top-quality fruit and vegetable providers. This high quality has progressively allowed La Alianza to
Fig. 4. Economic improvement changes identified in smallholders’ assets
19.0
57.0
3.4
2.6
1.9
11.0
9.1
15.9
56.2
46.3
4.6
3.6
2.6
20.6
20.6
18.8
20072010
% revenues from fruits
% revenues from traditional products (potatoes, maize)
Frequency of joint sales (scale of 1 to 5)
Frequency joint acquisition of inputs (scale of 1 to 5)
Total annual revenues (US$MM real)
Total annual revenues (US$MM nominal)
Total volume harvested in the year (thousands KG)
Number of products cultivated 41%
% Change
18%
126%
88%
38%
34%
-19%
196%
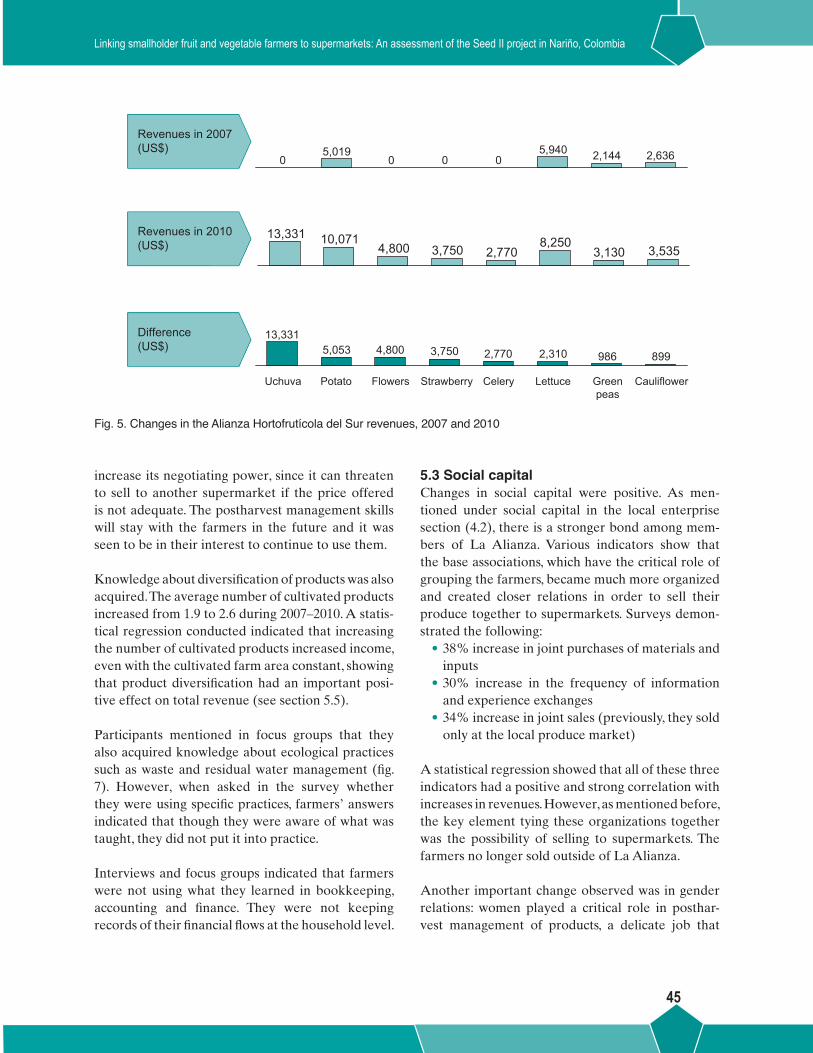
45
Linking smallholder fruit and vegetable farmers to supermarkets: An assessment of the Seed II project in Nariño, Colombia
Fig. 5. Changes in the Alianza Hortofrutícola del Sur revenues, 2007 and 2010
Revenues in 2007(US$)
Revenues in 2010(US$)
Difference(US$)
2,6362,1445,940000
5,0190
3,5353,1308,250
2,7703,7504,80010,07113,331
8999862,3102,7703,7504,8005,05313,331
CauliflowerStrawberry Lettuce Greenpeas
CeleryFlowersPotatoUchuva
increase its negotiating power, since it can threaten to sell to another supermarket if the price offered is not adequate. The postharvest management skills will stay with the farmers in the future and it was seen to be in their interest to continue to use them.
Knowledge about diversification of products was also acquired. The average number of cultivated products increased from 1.9 to 2.6 during 2007–2010. A statis-tical regression conducted indicated that increasing the number of cultivated products increased income, even with the cultivated farm area constant, showing that product diversification had an important posi-tive effect on total revenue (see section 5.5).
Participants mentioned in focus groups that they also acquired knowledge about ecological practices such as waste and residual water management (fig. 7). However, when asked in the survey whether they were using specific practices, farmers’ answers indicated that though they were aware of what was taught, they did not put it into practice.
Interviews and focus groups indicated that farmers were not using what they learned in bookkeeping, accounting and finance. They were not keeping records of their financial flows at the household level.
5.3 Social capitalChanges in social capital were positive. As men-tioned under social capital in the local enterprise section (4.2), there is a stronger bond among mem-bers of La Alianza. Various indicators show that the base associations, which have the critical role of grouping the farmers, became much more organized and created closer relations in order to sell their produce together to supermarkets. Surveys demon-strated the following:
•38% increase in joint purchases of materials and inputs
•30% increase in the frequency of information and experience exchanges
•34% increase in joint sales (previously, they sold only at the local produce market)
A statistical regression showed that all of these three indicators had a positive and strong correlation with increases in revenues. However, as mentioned before, the key element tying these organizations together was the possibility of selling to supermarkets. The farmers no longer sold outside of La Alianza.
Another important change observed was in gender relations: women played a critical role in posthar-vest management of products, a delicate job that

46
Assessing Impacts of Value Chain Development on Poverty: A Case-Study Companion to the 5Capitals Tool
men perceived women could do better than men. Additionally, in the surveys, only 43% of participants indicated women were involved in farm management in 2007, growing to 49% in 2010 (a 15% increase). More importantly, in 77% of the cases, women were involved in planting and harvesting activities, com-pared to only 47% in 2007 (a 64% increase). One can argue that the intervention led to this result by including women in all training programs and other project-related activities.
5.4 Physical capitalAn important change in physical capital was a 43% increase in mobile phone ownership, from 61% to 87%, almost universal access. In focus groups, house-holds said that this was possible due to the increase in income and that it represented an important change in their lives because it was a tool that helped with critical activities:
•Logistics, most notably bringing the product to market
•Coordinating with other members of the associ-ation for joint activities
Fig. 6. Positive changes identified in household assets as a result of the Seed II intervention
•Dealing with household emergencies•General coordination through a low-cost
mechanism
In fact, in the study period, land-line usage decreased from 10% to 4%. It is undeniable that mobile technol-ogy is a big and very useful tool in these remote rural areas where communication has often been difficult. It would be interesting to explore further usages of this technology, especially of SMS (sending short mes-sages via mobile phones), in project interventions.
A second area where physical capital increased was improvements for the home and farm. Although the improvements did not clearly appear in house-hold surveys, it was a major area identified in focus groups. During the 2007–2010 period, 17% of house-holds made some kind of investment in their farms and/or farm machinery. Farmers reported that they invested about 30% of the extra income earned during the three-year period and that a large part of the investment was for improvements to the farms and houses. The most frequent investments were for
4.0
61.0
43.0
10.0
3.8
47.0
40.0
87.0
49.0
4.0
4.9
77.0
20072010
Access to loans
Mobile phone
Fixed land line on the farm
Frequency of information and experience exchangeswith other farmers (scale of 1 to 5)
Women's involvement in planting and harvesting
Women's involvement in farm administration
% Change
15%
64%
-60%
43%
30%
900%

47
Linking smallholder fruit and vegetable farmers to supermarkets: An assessment of the Seed II project in Nariño, Colombia
farm inputs (notably fertilizers), with 64% of house-holds investing at least once during the 2007–2010 period, spending an average of US$2,000 for all investments made.
During the focus groups in the ex post data analy-sis, the main finding was that farmers used most of their increase in income on consumption (clothes, household durables, better food). They had a strong perception that this increased consumption improved their quality of life. Though it was ini-tially thought that farmers would invest a larger part of their increased income, their use of it was both understandable and valid.
5.5 Financial capitalThe main positive change identified from 2007 to 2010 among farmers in this intervention was a sharp increase in annual revenues of 88% in real terms, from about US$5,300 to US$11,400 per farm. It is important to note that these revenues were the main source of income supporting the family: household surveys indicated that income from fruits and vege-tables represented 86% of total family revenues. The rest of the income was mostly from raising animals.If we disaggregate the source of the increase, we see that most of it originated from a higher price per unit for the products. While price increased about 70% in real terms, the harvested volume increased by
Fig. 7. Comparison of ecological practices used by farmers in 2007 and 2010
only 18%. We can definitely attribute this increase in income to the project intervention, which had an impact through two fronts:
•Creation of La Alianza that allowed farmers to sell to supermarkets, which paid a higher price for top quality, and to sell directly, which kept money that usually went to the intermediary in the hands of the farmers.
•The training program on postharvest manage-ment prepared farmers to meet the high-quality standards of the supermarket, thus, enabling them to receive a premium for high product quality.
Additionally, the focus-group farmers repeatedly stated that they felt that their income had not only increased but had also become more stable. This was not observed numerically in the household surveys but was a very important change for the farmers—this stability allowed them to plan better and avoid negative shocks, such as a dramatic drop in the price of their produce or default in payment to the farmer by a middleman. Although supermarkets did slightly vary payment according to the amount of supply of specific produce in the season, they paid on time and had not defaulted on any payment.
A drawback in our analysis was that we were not able to estimate the farmers’ production costs through the household survey because their production
Farmers in 2007
Farmers in 2010
Change
0%2%7%
Composting oforganic residues
Ecologicalmanagement ofresidual waters
Ecomanagementof solid residues
95%64%
31%
95%63%
29%

48
Assessing Impacts of Value Chain Development on Poverty: A Case-Study Companion to the 5Capitals Tool
expenditures were intrinsically intertwined with their household expenditures, prohibiting an accu-rate calculation of net income. However, we did compile data from the database of La Alianza to identify the products that were the most profitable to produce (fig. 8). According to that data, the most profitable products were strawberry, green peas, uchuva and broccoli.
The number of specific products cultivated in the list of most profitable products did increase in the 2007–2010 period, indicating that farmers diversi-fied, moving from one or two traditional products to include others grown less frequently in the region but that proved to be highly profitable—most nota-ble was the case of the uchuva (Physalis peruviana), also known as cape gooseberry, which is related to the tomatillo. However, the data indicated that the production of green peas decreased, although it is the second most profitable product, which could suggest that farmers have yet to grasp the concept of profitability per product. This situation could be improved by making them more aware of their
financial flows through the practice of basic book-keeping. Though this was conceptually part of Seed II, in practice most farmers did not do it.
On a different financial front, households increased their assets, accessing savings and credit mecha-nisms previously unavailable to them. The most prominent saving structure that emerged as a result of the project was that of self-managed rotating credit and savings associations (ROSCAs). These are informal structures in which a group of people that trust each other begin to make monthly con-tributions to a fund, from which low-interest loans are made to members. For farmers in the horticul-ture value chain, the average monthly contribution in Colombian pesos was equivalent to US$10 and some of them already had the capacity to receive loans up to the equivalent of US$300, to be repaid in two or three months.
Some 57% of households said they started sav-ing through the ROSCAs and they found it very useful for the accumulation of lump sums, plus it
Fig. 8. Most profitable products and the percentage of change in product cultivation as a result of the intervention
Net income from unit of product (US$)
% change in product cultivation (2007–2010)
3,207.2
2,283.6
1,142.7
966.0
874.7
Strawberry
Green peas
Uchuva
Lettuce
Cauliflower
Spinach
3,757.4
Curly cabbage
Broccoli
Celery
Beetroot
776.9
659.5
956.3
655.4
0%
67%
15%
44%
18%
150%
600%
1,000%
-27%
400%

49
Linking smallholder fruit and vegetable farmers to supermarkets: An assessment of the Seed II project in Nariño, Colombia
strengthened their sense of belonging to the pro-ducers’ group. This change was a direct result of the intervention since the microfinance institution Contactar trained the groups in the creation and management of these ROSCAs and closely moni-tored their development.
The major increase in access to credit came both through ROSCAs and through loans from Contactar and other providers. Before the project, only 2% of households had a loan, increasing dramatically to 57%.
However, of households having a loan, only 29% came from Contactar (with an average loan size of about US$800). In the focus groups, participants mentioned repeatedly that they only took loans from Contactar as a last resort because of higher annual interest rates, which were about 33%. The farmers preferred loans from the ROSCA because they were cheaper and the interest paid went back into the ROSCA fund, which belonged to them and the community.
There were major increases in total revenue, access to secure savings mechanisms and access to credit. So, the changes related to financial capital were important, especially considering the short time period.
6 Conclusions
The Seed II project in Nariño, Colombia, proved to be quite successful at improving the livelihoods of fruit and vegetable farmers. This was achieved through a combination of interventions aimed at 1) creating a second-level organization, La Alianza, which united some 150 farmers to sell their pro-duce directly to supermarkets in the region, and 2) carrying out a training program in postharvest man-agement directed to meeting supermarket quality standards (table 3 shows results of the key perfor-mance indicators based on calculations of values not adjusted for inflation). Because the project did not collect data on farmer costs, the percentage of increase in the farmers’ net income could not be
Table 3. Results of key performance indicators
Indicator Target Result% increase in farmers’ revenue 30% 126%
% increase in farmers’ net income 25% N/A
% of participating organizations that increase their “associativity” level 80% 100%
% of members of the technical team improving their abilities and skills to support farmers 100% 100%
Number of second-level organizations created 1 1
Changes in the municipal and departmental public policy making as a result of the project YES NO

50
Assessing Impacts of Value Chain Development on Poverty: A Case-Study Companion to the 5Capitals Tool
provided. The project also provided one full-time employee in charge of the commercialization with supermarkets, including the identification of prod-ucts most in demand, to guide selection of products to plant.
As demonstrated through household surveys and focus groups, the participating households experi-enced positive changes in various different types of asset endowments (fig. 9).
However, in the case of this horticulture value chain, the viability of La Alianza is still fully dependent on project staff and external funding. This dependency represents a risk for the sustainability in key areas, especially commercialization. On the other hand, members of La Alianza do have a clear vision of how to solve this issue, which is via the consolidation of the local enterprise, with its own staff person to han-dle commercialization with the supermarkets.
A lesson learned from this experience is that the consolidation of an upstream enterprise is a long process requiring various stages before the enter-prise reaches full maturity. Additionally, this case study indicates that the opportunity for small farm-ers to commercialize their produce directly to large institutional buyers such as supermarkets represents a significant avenue for increasing their revenues rapidly. Meeting the quality standards of such sophis-ticated but reliable buyers requires important skills that interventions can help them develop.
Finally, all other project components revolved around one key achievement: selling directly to supermarkets rather than to intermediaries or the local produce market. Without this important step on the commer-cialization front, the rest of the other improvements in the value chain intervention would have had little impact on their own. It is clear that a good definition of the commercialization component in any project intervention is critical to the success of the project.
Fig. 9. Positive changes in household asset endowments
Positive changes in various types of smallholder endowments
Financial capital
• 126% increase in revenues
• 400% increase in access to credit
• Access to safe saving mechanisms
Human capital
• Skills acquired in postharvest management and productdiversification (41% increase in the number of products harvested)
Social capital
• Increase in associativity among producers’ associations
• 64% increase in the participation of women in key productive activities
Physical capital • Improvements in home and farm
• 41% increase in access to mobile phones

51
Through the Garden Gate: Improving livelihoods of women in Afghanistan through horticultural production
Leah Katerberg1
SummaryThis case study examines the outcomes and impacts of the project Through the Garden Gate, which was implemented by the Mennonite Economic Development Associates (MEDA). The project aimed to improve livelihoods of women in Afghanistan’s Parwan Province through promoting horticulture production and the strengthening of linkages to fruit and vegetable markets. Producers were linked to markets through sales agents, who were also lead farmers. The assessment covers the period between 2007 and 2011. Following an examination of the political, legal, regulatory and market context for fruit and vegetable production and marketing in Afghanistan, data was collected from a sample of producers and sales agents on changes in cap-ital assets (human, social, natural, physical and financial) and the reasons for the change. The assessment illuminated key results for both producers and sales agents, based on the five types of capital. For producers, changes included improved yields in production levels, improved skills related to farming practices, improved use of tools and equipment and effective use of natural resources, along with soil conservation. Both house-holds and sales agents indicated improved access to microfinance, market information, resource sharing and socialization. Improved decision making by female members was also observed.
1 Leah Katerberg managed monitoring and evaluation for Mennonite Economic Development Associates’ (MEDA’s) value chain projects in Asia, Africa, Eastern Europe and Latin America. She is now program manager for TechnoServe’s cotton value chain initiative in Tanzania.

52
Assessing Impacts of Value Chain Development on Poverty: A Case-Study Companion to the 5Capitals Tool
1 Overview
1.1 BackgroundAfghanistan has undergone 30 years of conflict and violence and is now among the least developed countries in the world. Thirty-five percent of the labor force is unemployed2 and 36% of the popula-tion lives below the national poverty line.3 However, the economy has steadily improved over the past decade, due to the infusion of billions of dollars in international assistance and investments, as well as remittances from expatriates.4
Horticulture has always been important to the econ-omy of Afghanistan. During intense years of conflict, however, entire orchards and irrigation systems were destroyed, and four years of drought in the late 1990s threatened to decimate what was left. The country’s Ministry of Agriculture, Irrigation and Livestock has initiated many projects throughout the country to develop the agricultural economy by increas-ing production and productivity, improving natural resource management and physical infrastructure, and developing the market. Horticulture-related products now account for 60% of Afghanistan’s total legal exports,5 and agriculture, the mainstay of the nation’s economy, involves more than 75% of the labor force.6
Through the Garden Gate (TTGG), a project of the Mennonite Economic Development Associates (MEDA), engages communities and households, women’s organizations, private sector institutions and public sector agencies and programs in facilitat-ing the creation of robust horticultural value chains that integrate women entrepreneurs.
Project objectives are to improve agricultural pro-ductivity and build access to markets for women farmers in Parwan Province (fig. 1) that result in increased family incomes and enable isolated rural women to become economic contributors through horticultural value chain development and mar-ket integration. The aim was to reach 2,250 women farmers in four years (2007–2011), generating an impact for more than 10,000 family members and the economic well-being of their communities. Major funding was provided by the Canadian International Development Agency (CIDA).
1.2 Approach and InterventionsTTGG brings together a number of key partners. The key facilitating partner is the Afghan Women’s Business Council (AWBC), an organization estab-lished in 2003 through the financial and technical support of the United Nations Development Fund for Women that has experience working with rural
Fig. 1. Map of Afghanistan showing Parwan Province, site of the Through the Garden Gate project
2 Integrated Regional Information Network (IRIN) (2009). Food still unaffordable for millions. Retrieved on December 12, 2010, from http://www.irinnews.org/Report.aspx?ReportId=83417.
3 World Bank. Afghanistan country data, 2010. Retrieved on December 12, 2010, from http://data.worldbank.org/country/afghanistan.
4 USAID. 2009. Objective: accelerating market-led growth in agriculture.
5 World Bank.2010. Afghanistan country data, 2010. Retrieved on December 12, 2010, from http://data.worldbank.org/country/afghanistan.
6 World Bank. 2011. Poverty reduction in Afghanistan, 2011. Retrieved on April 30, 2011, from http://web.worldbank.org/WBSITE/EXTERNAL/COUNTRIES/SOUTHASIAEXT/EXTSAREGTOPPOVRED/.

53
Through the Garden Gate: Improving livelihoods of women in Afghanistan through horticultural production
women and holds community trust. AWBC delivers project training and facilitates the establishment of linkages with other stakeholders. While women are the targeted project beneficiaries, men are also encouraged to participate and therefore the project works closely with local community development councils for both men and women. These local coun-cils assist with community mobilization, ensuring local project support. Other key partners include the Ministry of Rural Rehabilitation and Development and the Ministry of Women’s Affairs, which repre-sent the Afghan government. The project also works
Fig. 2. Through the Garden Gate value chain map for women farmers in Parwan Province
with private-sector institutions, entrepreneurs and public-sector agencies to endeavor to build capac-ity. Private entrepreneurs include input suppliers (seeds, fertilizers, equipment) as well as financial institutions (providers of loan services) and produce buyers (fig. 2).
An innovative women-to-women business model, which conforms to local cultural norms while promot-ing and facilitating participation of women, is used in project delivery. Key interventions include technical assistance, dissemination of market information, and
RETAILER
Wholesalers sell to retail outlets and grocery chains within Afghanistan, as well as exporters to access markets in Pakistan.
WHOLESALE:LOCAL
WHOLESALE: EXPORT
Sales agents are linked to wholesalers to reach local and export retailers
PROCESSOR Sales agents are linked to processing facilities such as dehydrators, cold storage and packaging.
SALES AGENT Mobile women farmers are linked to the 20 women farmers under each lead farmer and purchase vegetables from within group.
PRODUCER Women farmers produce a variety of fresh vegetables on small plots (kitchen gardens).
INPUT SUPPLY Input suppliers are linked to clients for access to seeds, fertilizers, irrigation equipment, pesticides and tools.
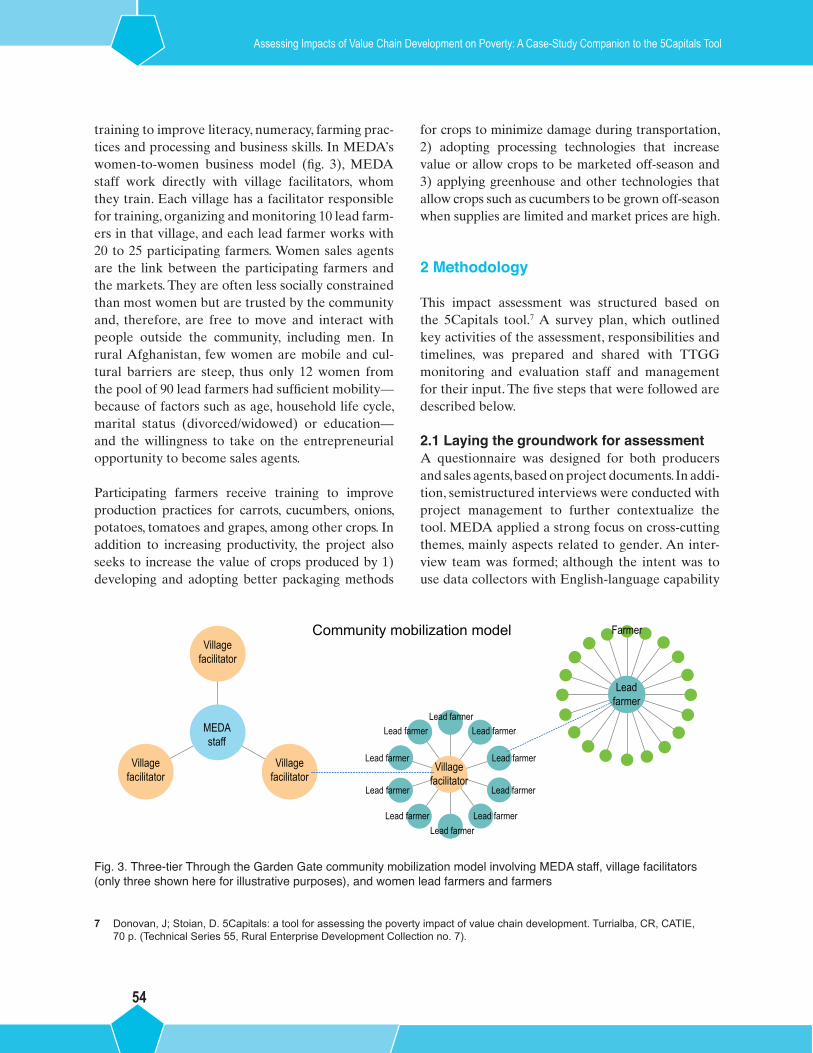
54
Assessing Impacts of Value Chain Development on Poverty: A Case-Study Companion to the 5Capitals Tool
training to improve literacy, numeracy, farming prac-tices and processing and business skills. In MEDA’s women-to-women business model (fig. 3), MEDA staff work directly with village facilitators, whom they train. Each village has a facilitator responsible for training, organizing and monitoring 10 lead farm-ers in that village, and each lead farmer works with 20 to 25 participating farmers. Women sales agents are the link between the participating farmers and the markets. They are often less socially constrained than most women but are trusted by the community and, therefore, are free to move and interact with people outside the community, including men. In rural Afghanistan, few women are mobile and cul-tural barriers are steep, thus only 12 women from the pool of 90 lead farmers had sufficient mobility—because of factors such as age, household life cycle, marital status (divorced/widowed) or education—and the willingness to take on the entrepreneurial opportunity to become sales agents.
Participating farmers receive training to improve production practices for carrots, cucumbers, onions, potatoes, tomatoes and grapes, among other crops. In addition to increasing productivity, the project also seeks to increase the value of crops produced by 1) developing and adopting better packaging methods
Fig. 3. Three-tier Through the Garden Gate community mobilization model involving MEDA staff, village facilitators (only three shown here for illustrative purposes), and women lead farmers and farmers
for crops to minimize damage during transportation, 2) adopting processing technologies that increase value or allow crops to be marketed off-season and 3) applying greenhouse and other technologies that allow crops such as cucumbers to be grown off-season when supplies are limited and market prices are high.
2 Methodology
This impact assessment was structured based on the 5Capitals tool.7 A survey plan, which outlined key activities of the assessment, responsibilities and timelines, was prepared and shared with TTGG monitoring and evaluation staff and management for their input. The five steps that were followed are described below.
2.1 Laying the groundwork for assessmentA questionnaire was designed for both producers and sales agents, based on project documents. In addi-tion, semistructured interviews were conducted with project management to further contextualize the tool. MEDA applied a strong focus on cross-cutting themes, mainly aspects related to gender. An inter-view team was formed; although the intent was to use data collectors with English-language capability
7 Donovan, J; Stoian, D. 5Capitals: a tool for assessing the poverty impact of value chain development. Turrialba, CR, CATIE, 70 p. (Technical Series 55, Rural Enterprise Development Collection no. 7).
Community mobilization modelVillage
facilitator
Villagefacilitator
Villagefacilitator
MEDAstaff
Farmer
Leadfarmer
Lead farmer
Villagefacilitator
Lead farmer
Lead farmer
Lead farmerLead farmer
Lead farmerLead farmer
Lead farmer
Lead farmer
Lead farmer

55
Through the Garden Gate: Improving livelihoods of women in Afghanistan through horticultural production
to minimize translation efforts, the scarcity of such individuals within the project area made it necessary to hire local-language (Dari) interviewers as well as a translator.
The sample frame was developed with geographical representation as the primary filter. At the time of the assessment, project activities had been under-taken in nine villages, three of which had been added in year three. To acquire deeper data and robust impact results, the first six villages were considered for the population-level assessment, and in order to maintain logistical feasibility, four of these were ran-domly selected. While MEDA typically administers impact assessment surveys to a statistically signif-icant sample of clients in order to operate within budgetary constraints, a sample of 125–130 respon-dents from the four villages was randomly selected. It was estimated that each questionnaire would require 45 minutes to administer and thus a sample of 130 respondents would require 20 person-days, in addition to translation time for questionnaires from Dari into English and back.
Most villages within the project areas operated with a small number of sales agents, designated as the enterprise-level for the purpose of this assessment. At least one of these was included in the survey for each of the four selected villages. Table 1 shows the final number of respondents in each village at both the household and enterprise levels.
2.2 Understanding the contextProject management and staff were interviewed to provide a preliminary understanding of the politi-cal, economic and social context within the TTGG
Table 1. Respondents by village
VillageHousehold-
level respondents
Enterprise-level respondents
(sales agents)Balaghel 32 1
Dashto Opyan 32 2
Khuja Saran 32 1
Qalai Khana 32 1
Total 128 5
project areas. Findings, in this section became input for development of the final versions of the ques-tionnaire, ensuring questions were relevant and culturally appropriate.
2.3 Identifying changes for smallholder farmers and sales agentsThe data collection team underwent a one-day train-ing before testing questionnaires in the field. This included a thorough review of the project and the questionnaire and mock interviews within the team to identify any translation errors. On day two each inter-viewer conducted a household-level questionnaire with a client outside of the sample and the afternoon was spent determining final necessary revisions to the questionnaire. The full survey was then conducted over the following week. Each day the hired transla-tor entered data collected the previous day into the questionnaire database (developed in CSPro).
The data collection team was also trained on the enterprise-level questionnaire, with field testing the following day. A total of five respondents (out of a total of 12 sales agents) were included in the sample.
2.5 Analysis and report writingAn assets-based approach to the analysis of impact data was prescribed by the tool and was used in pre-vious pilot applications of the tool by organizations in countries around the globe to add considerable breadth and organization in analysis and reporting. This approach was applied to the analysis as well as categorization of results.
While the development of a Microsoft Access database questionnaire was attempted, it was not completed by the time of data collection and there-fore a database developed in CSPro was utilized by the translator for data entry. Data cleaning was undertaken and items of discrepancy were discussed with interviewers and the translator; follow-up with respondents was carried out when necessary.
Data was analyzed using SPSS and CSPro tabulation and also exported to Excel for descriptive statistics. The project leader and coordinator noted and dis-cussed preliminary results.
56
Assessing Impacts of Value Chain Development on Poverty: A Case-Study Companion to the 5Capitals Tool
3 Political, legal, regulatory and market context
Since the collapse of the Taliban in October 2001, many positive changes have occurred in Afghanistan. More than 3 million students and 30,000 female teachers returned to schools. The enrollment rate for 6- to 9-year-olds increased by 40% between 2005 and 2008. The new democratic government began to rebuild and repair Afghanistan’s institutional and economic infrastructure. One of the country’s most important political achievements was the design and ratification of the constitution in January 2004. In November of that year, presidential elections took place and Afghans elected their president. Much improvement is still needed, however. Overall school enrollment stands at 35%.8
Health-related indicators dropped, for the most part, during Afghanistan’s volatile years. Life expectancy is 44 years as compared to an average of 59 years among low-income countries; only 27% of Afghans have access to safe drinking water and only 5% to adequate sanitation.9
Horticultural-related products account for 60% of Afghanistan’s total legal exports.10 During intense years of conflict, entire orchards and irrigation systems were destroyed and four years of drought (1998–2001) decimated what remained. Many trees were cut down and burned for fuel.
With recent rehabilitation and restoration of infra-structure, agriculture has been the center of focus for the Afghan government as well as the devel-opment community. Traditionally, Afghanistan has been noted for its diversity of several species of global significance, such as carrot, radish, cherry, plum, apricot, peach, pear, apple, walnut, pistachio, fig, grape, pomegranate, melon and almond. The
Ministry of Agriculture, Irrigation and Livestock has initiated many projects throughout the country, with international support, to develop its legal agri-cultural economy through increasing production and productivity, natural resource management, improved physical infrastructure and market development.
In spite of the influx of funds from the international community, along with the revival of the local econ-omy, the business environment is still uncertain and insecure. Most investments in the economy are highly liquid and short-term. According to a World Bank ranking, ease of doing business in Afghanistan stands at 167 (out of 183), two points lower than a year ago. Of the 10 topics related to the regulatory environment for start and operation of a new busi-ness, Afghanistan ranks last in investor protection, 162 in contractual enforcement, 170 in property reg-istration and 128 in credit services.11 Neighboring Iran, in comparison, stands at 129 for ease of doing business, 167 in investor protection, 49 in contractual enforcement, 156 in property registration and 89 in credit services.
4 Changes in business assets
Changes resulting from project interventions were categorized according to a livelihoods framework of capital assets. Here we present the narrative of key results from the impact assessment for sales agents, determined from analysis of questionnaire data. Changes at the household level are in section 5.
Changes were observed at all five livelihood assets levels and in most cases can be directly attributed to the project. Due to the nature of the project model, there were only a small number of sales agents (12) and therefore five respondents were chosen.
8 World Bank. 2010. Retrieved from http://www.worldbank.org.af.
9 Ibid.
10 Ibid.
11 World Bank. 2011. Doing business. Retrieved from http://doingbusiness.org/rankings.

57
Through the Garden Gate: Improving livelihoods of women in Afghanistan through horticultural production
4.1 Natural capitalThere was no strong evidence of increase in natural assets. Most respondents, however, expressed that they encouraged farmers to use drip irrigation and natural compost to minimize waste of water and improve soil quality, and as section 5 notes, adoption of such technologies and practices were high among smallholder farmers.
4.2 Human capitalAll five respondents participated in trainings on basic business management and best farm practices delivered by the project. Skills learned included record keeping, cost pricing, communication and negotiation skills, packaging, basics of processing, storage and quality control, and grading. Nearly all felt that their increasing knowledge in these skills has helped them run their businesses more effectively. In addition, when asked if they engaged in contractual agreements with farmers, all respondents reported that they did. These contractual agreements included quality standards, prices and packaging details.
4.3 Social capitalRegarding vertical relationships, nearly all household-level respondents received market
information related to price, product demand and logistics—in addition to purchasing services—through project-linked upstream enterprises. There was no evidence of receiving credit, inputs, packages or storage facility from upstream value-chain actors.
Collective participation by sales agents in training activities with other lead farmers created opportuni-ties for increased social capital. Although this aspect was not directly addressed by the questionnaire, key informant interviews with project management during the context analysis revealed that sales agents and other lead farmers learned together and passed on knowledge to each other.
4.4 Physical capitalRespondents also reported owning storage facilities subsidized by the project. This has helped them in smoothing income and meeting seasonal variation of product demand.
Almost all sales agents noted use of solar dryers for processing that have been purchased from and sub-sidized (50%) by the project. This not only increased product quality but also contributed to added value. Respondents said they have been able to share the use of this technology with producers in their groups, another contribution to social capital mentioned in section 4.3.
4.5 Financial capitalThere was strong evidence of a growing trend over the past three years in terms of the volume of value-chain products purchased from producers in their groups. In some cases, volumes more than doubled in three years.
Sales agents also expressed that the type of buyer was more diversified due to recent changes in prod-uct quality. This was as a result of the knowledge they gained through project extension services from the project.
All respondents at this level expressed that their access to credit increased due to linkages developed by the project and to the number of providers. Two of the five sales agents said that they preferred not to get loans because the interest charge is not acceptable in
Highlights of results for sales agents •All reported increased knowledge about
best farming practices and basic business management for improving techniques of smallholder farmers.
•All noted increased physical assets related to their field (for example, solar dryer, storage, compost bins).
•Almost all reported increased quality of tar-geted produce under VCD.
•All reported increased volumes purchased from target farmer groups.
•All reported increased knowledge/training capacity on hazards related to pesticide spray and use of chemical fertilizers.
•Almost all engaged their client farmers in contractual agreements for their business transactions.

58
Assessing Impacts of Value Chain Development on Poverty: A Case-Study Companion to the 5Capitals Tool
Islam. The other three obtained loans from microf-inance institutions through project connections and the interest rates were highly subsidized. Loan sizes were very small given the volume of their businesses.
5 Changes in household assets
The narrative of key results from the impact assess-ment at the household level, determined from analysis of questionnaire data, is presented here.
Highlights of results for farmers•Value of value-chain produce doubled over
the past four years (46%, when adjusted for inflation 13%).
•98% of the farmers received training to enhance skills.
•74% of participants reported increased expenditure on food items. (see section 5.2).
•88% of farmers noted increased participation in decision making.
•Income from value chain-related products was ranked first or second in priority by 93%.
5.1 Natural capitalWhen respondents were asked about productivity over the past three years, 67% reported an increase.
Primary reasons were the use of newly acquired knowledge about farming practices such as appli-cation of compost, farm management and weeding. Crop rotation and use of compost were the key methods practiced to avoid soil degradation. The project team, through community facilitators, pro-vided training on these methods.
Nearly all those interviewed reported that water contamination was not a problem for their commu-nity, both before project interventions and currently. It was unclear, however, whether respondents knew that their water was not contaminated or whether they merely assumed it was not since they had expe-rienced no negative effects from its use.
Nearly all respondents felt that efficiency of water usage has improved through the project’s intro-duction of drip-irrigation kits. Prior to use of the irrigation kits, availability of water was not sufficient for all farmers in the region, resulting in low yield and weak crops. Various training sessions on good farm-ing practices and management have also resulted in improved use of natural resources, particularly soil (compost management) and water (irrigation and water management).
Changes in overall landholdings (table 2) were neg-ligible at 2%, while land used for value-chain-related production increased by only 4%. However, the total value of production of value chain crops increased
Table 2. Changes in landholdings and total produce reported by participants as a result of project intervention (2007–2010)
Total land (jareebs*)
Land used for
production
Land used for VCD
products
Average value of VCD products per farmer, most
recent harvest (US$**)
VCD value (US$), inflation-
corrected***2007 2.63 1.63 1.10 128.95 128.95
2008 2.64 1.63 1.13 173.61 -
2009 2.68 1.69 1.14 163.07 -
2010 2.69 1.68 1.15 255.07 197.93
Difference over base 0.05 0.05 0.04 126.08 68.93
% change over base year 2.1 2.9 3.8 98 35
*1 jareeb equals 2,000 square meters.**1 afghani (AF) equals about US$0.02.*** Cumulative inflation rate for the period was 22.4% (Source: http://data.worldbank.org/country/afghanistan).

59
Through the Garden Gate: Improving livelihoods of women in Afghanistan through horticultural production
by 98% since the introduction of the project, or 35% when adjusted for inflation. This implies increased density of production and/or increased efficiency due to improved techniques or inputs.
Compost is used as fertilizer by 98% of respondents and 78% of them report cow manure as the most popular type of compost. Only one farmer out of 128 used chicken manure as fertilizer.
5.2 Human capitalA significant change was also observed in human capital. The project offered 20 major training ses-sions related to basic business skills and best farm practices, including:
•Land preparation•Irrigation and water management•Pest and disease management•Fertilizer application•Weed control•Seedling production•Greenhouse purchase and preparation•Harvest handling•Vegetable storage•Environmentally friendly production and
harvest handling
Of respondents, 98% reported that they partici-pated in these trainings. Those interviewed said they were not aware of any similar training oppor-tunities in their communities. This was the same finding revealed by interviews with project manage-ment during the context analysis. Figure 3 shows the
degree to which farmers felt increased skill levels attained from these trainings resulted in impact on total production of farm-related produce.
Seventy-four percent of respondents reported increased food expenditure since involvement in the project. Most respondents felt that this was due to overall increased food prices, while 16% felt it rep-resented a real increase in expenditure on food (i.e., more nutritional, higher-value food) as a result of increased incomes from value-chain products. Table 3 shows changes in food expenditure by village.
Incidence of school re-enrollment12 over the four-year assessment period was high. There were 94 cases of school re-enrollments among the 128 respondent households. This was mainly due to con-struction of new school facilities or restoration of the school system. Only three respondents attributed re-enrollment to increased household income.
12 Signifies students returning to the classroom and excludes first-time enrollment.
Fig. 3. Farmers’ evaluation of impact from skills gained through project training
Significant impact
Modest impact
No impact
66%
29%
5%
Table 3. Changes in food expenditures by village during project intervention
Village name Number of respondents
Much increase Increase No change Decrease Much
decrease No response
Balaghel 32 4 11 9 7 1 0
Dashto Opyan 32 7 24 0 0 0 1
Khuja Saran 32 1 18 12 1 0 0
Qalai Khana 32 5 25 0 1 0 1
Total 128 17 78 21 9 1 2

60
Assessing Impacts of Value Chain Development on Poverty: A Case-Study Companion to the 5Capitals Tool
The reported disparity in levels of illiteracy between male and female members of the household was significant: 47% for male household members com-pared to 64% for female members (see box 1: Focus on gender). The gap was even wider when the data was further segregated at level of education. Only five females had completed secondary education, compared to 38 males, and no females had entered postsecondary education. Without the existence of baseline data, it was not possible to adequately determine changes in these indicators.
5.3 Social capitalThe social capital of the producers also increased in terms of participation in farmer groups and collec-tive training. The project formed village-level farmer groups, which improved farmer interaction at the village level. These farmer groups served as a plat-form for trainings, and many of them also formed community saving groups. Participation in savings groups was high in two villages and low in the other two. While the data did not indicate clear reasons for the differences, project management associated low participation with inadequate social organization on the part of lead farmers/village facilitators.
When asked about satisfaction levels with the availability and quality of services obtained from upstream enterprises (sales agents), most par-ticipants said they were either satisfied or highly satisfied. A slight dissatisfaction was expressed regarding the availability of credit and extension ser-vices. While the questionnaires did not collect data regarding reasons for satisfaction and dissatisfac-tion, this information could have been collected by follow-up focus groups had further resources been available.
Interestingly, 88% claimed increased participation in overall decision making.
5.4 Physical capitalNearly all respondents reported that they received inputs from upstream enterprises linked with the project and 60% were very satisfied with this ser-vice. The level of attribution for this result, then, is high. While the survey did not collect data from
households regarding access to machinery, it was evident from key informant interviews with project management that the project had linked farmers with greenhouse providers and microfinance orga-nizations as well as other tool and equipment providers. Most households reported that they had purchased tools/machines since involvement with the project and of these, the majority stated the purchase of new equipment was made possi-ble mainly due to income gained from the sale of chain-related products. Training offered by the proj-ect on improved farming practices and tools also likely influenced participants’ decisions to purchase tools and equipment.
Most respondents reported that they have purchased tools and equipment related to farming through assis-tance from the project during the past four years. On average, respondents spent US$79 on purchase of equipment. Information on changes in infrastructure was not relevant and thus not collected, primarily because few significant infrastructure changes were made in project areas and because such changes would have little effect on the majority of the proj-ect’s clients, who sell in local markets.
5.5 Financial capitalTable 4 shows total revenue from value-chain prod-ucts, which increased about 46% in the last four years, or 13% when adjusted for inflation.
For 93% of respondents, project-related products represented their first or second most important source of income. Paid labor was found to be the most significant source of household income. Other major sources included nonchain agricultural pro-duce, remittances and other businesses.
Project interventions included the development of local savings groups, and while MEDA did not provide credit directly to its clients, it established access for producers to credit sources. Of house-holds interviewed, 26% participated in formal savings (for example, a bank account) at the time of the survey, while 59% were involved in infor-mal savings. All those involved in formal savings expressed an increase in savings rates since joining

61
Through the Garden Gate: Improving livelihoods of women in Afghanistan through horticultural production
Box 1. Focus on gender
During the second phase of the tool testing, MEDA placed a stronger focus on gender by integrating it into several question areas, as well as developing a gender-specific set of questions. All of the 133 respondents were included in the interview section about gender. While some results are included in the narrative results sections in this report, key results are described in more detail here.
Involvement in farming: Ninety-three percent of female producers felt that they are now more involved in the production of project-related products. Most attributed this change to their increased knowledge about farming and business. The possibility of work overloads or impacts on family health or nutrition was not mentioned by any of the women.
Decision making: Women now believe they are more involved in household decisions, with 83% reporting that their decision-making role has increased and attributing this increase principally to project activi-ties. While some felt this change is due to their higher level of socialization as members of a producer group, some said they have gained respect from fam-ily members by contributing to household income. Other female respondents indicated that increased knowledge from the farming and production trainings led to their increased power in decision making.
Women were presented with a list of 19 activities and asked whether these decisions are made by them, the male head of household or a combination. Figure 5 shows to what extent women exercised sole decision-making responsibility in each of these areas. While women exhibited a fairly low to moderate role in household decision making, they did tend to dominate decisions regarding savings and loans. Follow-up focus groups would be useful in helping to understand the reasons for this result and the extent to which it represents a change attributable to project activities.
Assistance from male family members: There was a significantly high response regarding assistance in pro-duction and marketing of products related to the value chain by male family members. The number of male family members assisting in the marketing of these products was twice that of female members, suggesting that male family members recognized the importance of the economic contribution made by female members and were willing to offer support when needed.
Resource allocation: While it has already been noted that land acquisition over the four-year period was generally low among producers, of the 12 families that acquired new land, three (one-fourth) claimed the land was owned by female household members. In a highly gender-insensitive society, this finding is significant.
Fig. 4. Percentage of females that make household decisions, by type of decision
0 10 20 30 40 50 60 70 80 90
Use of herbicidesCelebration of festivities
Family marriagesSales of assets
Food expenditureMobility/travel to marketplace
Health and medical careEducation of children
Maintenance/repair of housePurchase of other assets
Purchase of landAcquisition of loan/credit
SavingsPurchase of input supplies
Investment in productionAcquisition of building development services
Price negotiation of produceSale of value chain product
Harvesting
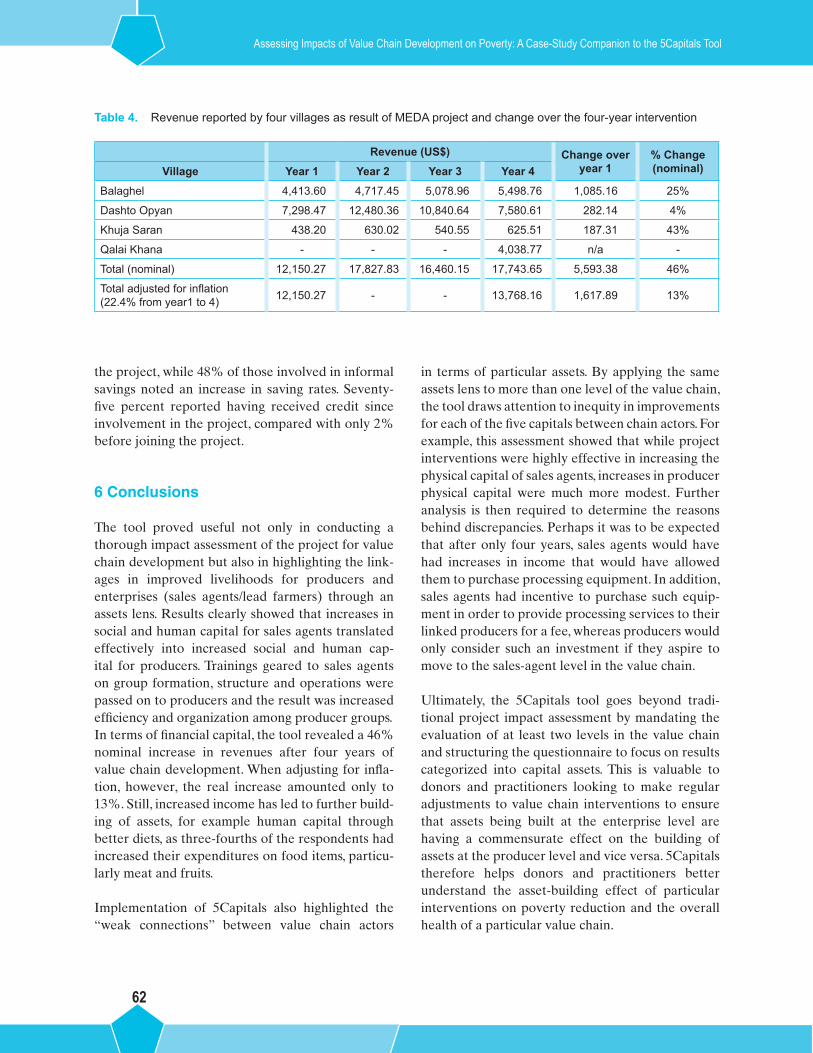
62
Assessing Impacts of Value Chain Development on Poverty: A Case-Study Companion to the 5Capitals Tool
the project, while 48% of those involved in informal savings noted an increase in saving rates. Seventy-five percent reported having received credit since involvement in the project, compared with only 2% before joining the project.
6 Conclusions
The tool proved useful not only in conducting a thorough impact assessment of the project for value chain development but also in highlighting the link-ages in improved livelihoods for producers and enterprises (sales agents/lead farmers) through an assets lens. Results clearly showed that increases in social and human capital for sales agents translated effectively into increased social and human cap-ital for producers. Trainings geared to sales agents on group formation, structure and operations were passed on to producers and the result was increased efficiency and organization among producer groups. In terms of financial capital, the tool revealed a 46% nominal increase in revenues after four years of value chain development. When adjusting for infla-tion, however, the real increase amounted only to 13%. Still, increased income has led to further build-ing of assets, for example human capital through better diets, as three-fourths of the respondents had increased their expenditures on food items, particu-larly meat and fruits.
Implementation of 5Capitals also highlighted the “weak connections” between value chain actors
in terms of particular assets. By applying the same assets lens to more than one level of the value chain, the tool draws attention to inequity in improvements for each of the five capitals between chain actors. For example, this assessment showed that while project interventions were highly effective in increasing the physical capital of sales agents, increases in producer physical capital were much more modest. Further analysis is then required to determine the reasons behind discrepancies. Perhaps it was to be expected that after only four years, sales agents would have had increases in income that would have allowed them to purchase processing equipment. In addition, sales agents had incentive to purchase such equip-ment in order to provide processing services to their linked producers for a fee, whereas producers would only consider such an investment if they aspire to move to the sales-agent level in the value chain.
Ultimately, the 5Capitals tool goes beyond tradi-tional project impact assessment by mandating the evaluation of at least two levels in the value chain and structuring the questionnaire to focus on results categorized into capital assets. This is valuable to donors and practitioners looking to make regular adjustments to value chain interventions to ensure that assets being built at the enterprise level are having a commensurate effect on the building of assets at the producer level and vice versa. 5Capitals therefore helps donors and practitioners better understand the asset-building effect of particular interventions on poverty reduction and the overall health of a particular value chain.
Table 4. Revenue reported by four villages as result of MEDA project and change over the four-year intervention
Revenue (US$) Change over year 1
% Change (nominal)Village Year 1 Year 2 Year 3 Year 4
Balaghel 4,413.60 4,717.45 5,078.96 5,498.76 1,085.16 25%
Dashto Opyan 7,298.47 12,480.36 10,840.64 7,580.61 282.14 4%
Khuja Saran 438.20 630.02 540.55 625.51 187.31 43%
Qalai Khana - - - 4,038.77 n/a -
Total (nominal) 12,150.27 17,827.83 16,460.15 17,743.65 5,593.38 46%
Total adjusted for inflation (22.4% from year1 to 4) 12,150.27 - - 13,768.16 1,617.89 13%
63
Interventions to expand market opportunities for makers of handwoven fabrics: Lessons from the Chanderi region, India
Adarsh Kumar1
SummaryThis study focuses on three interventions between 2003 and 2010 that sought to develop the value chain for embellished handmade fabric from the Chanderi region in India and the outcomes of these interventions on fabric makers and intervention-developed enterprises, partially or fully owned by weavers, that link them to markets. Through household surveys, stakeholder interviews and assessment of financial statements of weaver-owned enterprises, the study found that the interventions played a significant role in building various types of capital for poor weavers. The results of the household survey confirm wage increases, significant increases in standards of living and an increase in access to key development goods such as health, education and insurance services. Weavers cite increased transparency and a codified set of production allocation and payment practices as key improvements achieved through the value chain interventions. The weaver-owned enterprises formed through the interventions have contributed considerably to helping the region graduate to a higher level in design, product diversity and quality, market share, and new market linkages. However, it is unclear whether these enterprises will be sustainable after the intervention period when grant support for operations is withdrawn.
13 Adarsh Kumar was executive director the All India Artisans and Craftworkers Welfare Association (AIACA) during the study and is currently a member of its board of directors. [email protected].

64
Assessing Impacts of Value Chain Development on Poverty: A Case-Study Companion to the 5Capitals Tool
1 Overview
1.1 Background and stakeholdersThree interventions in the Chanderi region in India between 2006 and 2010 aimed to strengthen the structure of the value chain for embellished hand-made fabric and the outcomes of these interventions on fabric makers and enterprises wholly or partially owned by weavers (referred to here as weaver-owned enterprises) that link them to markets. The interven-tions were as follows:
•United Nations Industrial Development Organization (UNIDO) set up a cluster devel-opment program and created Bunkar Vikas Sansthan, Chanderi (BVSC), a weaver-owned enterprise; 2003 to 2006.
•Fabindia, acting through its subsidiary Artisans Microfinance Private Limited, promoted the weaver-owned enterprise Desert Artisan Handicraft Chanderi Limited (DAHCL); 2007 to present.
•Ministry of Textiles, through its integrated hand-loom cluster development program, implemented by Entrepreneurship Development Institute of India (EDI) in the Chanderi region, established Chanderi Handlooms Cluster Development Producers Company (CHCDPCL), which oper-ated as a weaver-owned enterprise; 2007 to present.
Chanderi is in the Ashok Nagar district of the state of Madhya Pradesh, a town that houses one of the biggest concentrations of handloom weavers in North India. Its signature product is a fine silk-and-cotton embellished fabric with woven patterns of zari (gold-colored metal threads). Traditionally, the sari has been the main product from the region, but other garments and furnishings have emerged through targeted interventions by outside agencies.
Handlooms continue to be a significant source of live-lihoods in India, employing 2.8 million households. But handloom-based livelihoods have been declining nationally due to factors such as increased competi-tion resulting from economic and trade liberalization and slow adoption of new technology. In Madhya Pradesh there was a 73% decline in the number of people employed in the sector between 1995 and 2010.
The value chain for Chanderi fabric involves a vari-ety of stakeholders. Historically, local traders have been an important part of the value chain, playing a key role in aggregating production and connecting to markets beyond the local area (table 1).
•Master weavers: Master weavers are highly skilled weavers who play the role of subcontrac-tors, take job orders from traders and manage a group of 10 to 15 weavers in fulfilling production targets. In recent years many master weavers have set up common sheds where their groups of weavers work, while some continue to hire weavers who work in their own houses.
•Weavers (wage workers): At the base of the value chain are skilled and semiskilled craft-workers who work for daily wages or a fixed wage per finished product. Weavers differ in skill levels, with a small number being highly skilled and a majority being moderately skilled to low-skilled workers. Not all weavers work through a master weaver. Most of them belong to margin-alized caste groups and their incomes fall near the poverty line.
•Ancillary workers (wage workers): A range of ancillary workers perform specialized pre- and post-weaving tasks, including motif design, warping and winding of yarn and dyeing. These workers provide services to master weavers and individual weavers and are paid for units pro-duced. For example, motif designers are paid for each new motif and warpers are paid per warp of yarn that they reel.
•Traders: Historically, local traders have been an important part of the value chain through which products from Chanderi reach beyond
Table 1. Chanderi value chain actors
Traders 12Master weavers 45
Input suppliers 20
Weavers 3,659
Ancillary workers 333
Source: UNIDO diagnostic study and stakeholder interviews

65
Interventions to expand market opportunities for makers of handwoven fabrics: Lessons from the Chanderi region, India
local markets. Traders have played a key role in aggregating production, working with 100 to 300 weavers through the master weavers. The traders established linkages in new geographic markets and provided raw materials and financing to craftworkers.
•Input suppliers: Small businesspersons who pro-vide yarn, metal thread, dyes, loom parts and other weaving machinery and tools to master weavers and directly to individual weavers.
•“New” weaver-owned enterprises: There have been three major interventions for value chain development in the Chanderi region and each intervention has promoted a different weaver-owned enterprise as the focal point for aggregation of production and sale of products. The objective of each was to create commer-cially viable intermediary institutions capable of negotiating between wage weavers and local and regional mainstream markets to improve the terms of trade and incomes of the weaving community. Detailed descriptions of the three weaver-owned enterprises are in section 1.3.
•Downstream actors: The main downstream actors that provide linkages to markets are wholesale dealers in urban areas like Mumbai, Delhi and Bhopal. These wholesale dealers have informal relationships with traders and master weavers from Chanderi to supply products. Some traders from the Chanderi region also operate as itinerant salesmen, visiting major cities and selling products door to door. These two chan-nels still account for a significant portion of sales from the region. In 2003, after the intervention of UNIDO, Fabindia, one of the largest retail chains in India, began sourcing products from the region. Fabindia has more than 100 stores nationwide and has built a successful business model around sale of Indian handmade products nationally and internationally.
•Service providers: Before the interventions, a local resource center and an office of Hast Shilpa Vikas Nigam2 operated in the Chanderi region. Until
1994 this marketing institution sourced up to 40% of the total production. However, by 2000, due to financial problems and reduction in government funding, purchases decreased to less than 10% of total production. After the UNIDO interven-tion (2003–2006), a number of other government agencies began to provide support services in the region. Chanderi Development Foundation was formed to address empowerment and welfare issues of the weaver community. More recently, Digital Green, a nonprofit to help producers through information technology, began to provide design-related services. Several small nongov-ernmental organizations (NGOs) also operated in the region. Most of the new community-level facilities built through the interventions, such as the dye houses and a yarn depot, were managed by the new weaver marketing associations.
1.2 Objectives of interventionsAlthough there were three distinct interventions by different implementing organizations between 2003 and 2010, their objectives were similar:
•Social intermediation and aggregation of weav-ers: Interventions sought to mobilize individual weavers into collectives, starting with self-help groups (SHGs)3 and then federating them into larger community-owned enterprises.
•Strengthening inputs and infrastructure: To enhance product quality and scale up production in the region, interventions introduced new tech-nology in the weaving and pre- and post-weaving processes, expanded provision of working capital to weavers, linked weavers to better quality yarn suppliers and introduced new product designs through design development projects. Grant sup-port was provided to build common infrastructure such as storage sheds and small-scale dyeing units.
•Capacity building: Training programs were held to enhance weavers’ capacities, both in terms of building skills to weave better products and improving business skills for managerial roles in the new weaver-owned enterprises.
2 A Madhya Pradesh government institution created in 1982 under the State Textile Corporation to provide support to weavers.
3 A self-help group is a registered or unregistered group of 10 to 20 producers who voluntarily come together to save small sums of money and lend that money among themselves—like savings and loan groups.
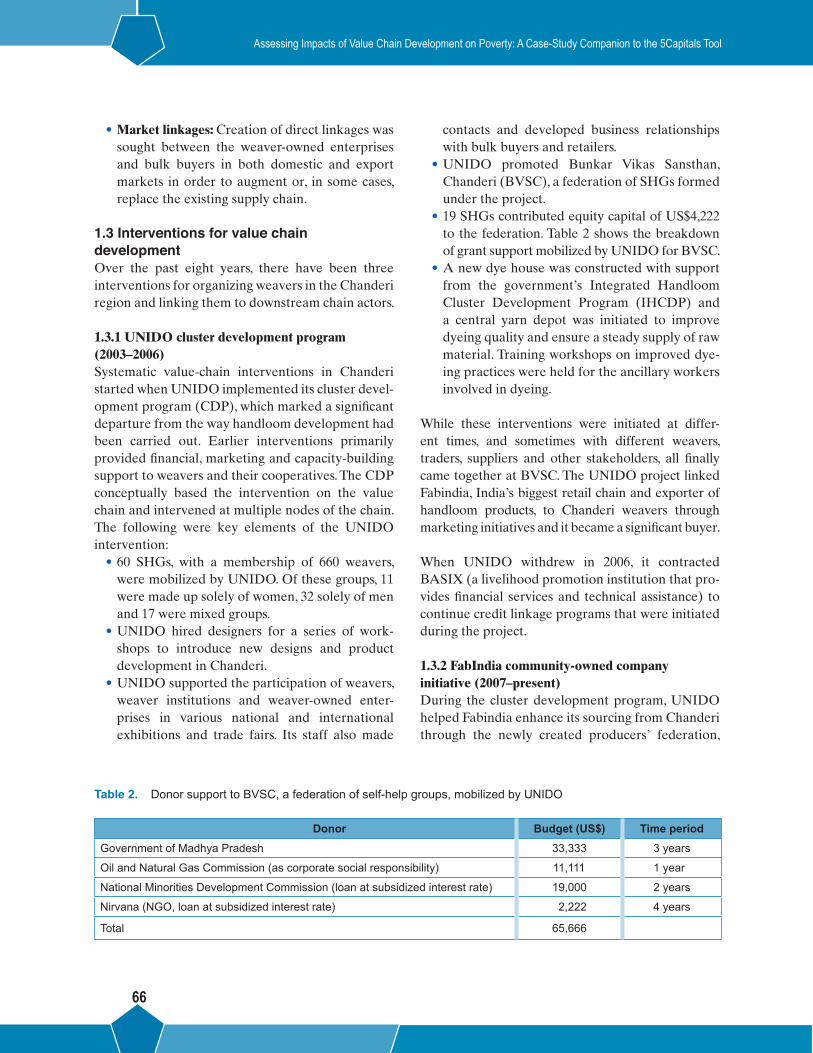
66
Assessing Impacts of Value Chain Development on Poverty: A Case-Study Companion to the 5Capitals Tool
•Market linkages: Creation of direct linkages was sought between the weaver-owned enterprises and bulk buyers in both domestic and export markets in order to augment or, in some cases, replace the existing supply chain.
1.3 Interventions for value chain developmentOver the past eight years, there have been three interventions for organizing weavers in the Chanderi region and linking them to downstream chain actors.
1.3.1 UNIDO cluster development program (2003–2006) Systematic value-chain interventions in Chanderi started when UNIDO implemented its cluster devel-opment program (CDP), which marked a significant departure from the way handloom development had been carried out. Earlier interventions primarily provided financial, marketing and capacity-building support to weavers and their cooperatives. The CDP conceptually based the intervention on the value chain and intervened at multiple nodes of the chain. The following were key elements of the UNIDO intervention:
•60 SHGs, with a membership of 660 weavers, were mobilized by UNIDO. Of these groups, 11 were made up solely of women, 32 solely of men and 17 were mixed groups.
•UNIDO hired designers for a series of work-shops to introduce new designs and product development in Chanderi.
•UNIDO supported the participation of weavers, weaver institutions and weaver-owned enter-prises in various national and international exhibitions and trade fairs. Its staff also made
contacts and developed business relationships with bulk buyers and retailers.
•UNIDO promoted Bunkar Vikas Sansthan, Chanderi (BVSC), a federation of SHGs formed under the project.
•19 SHGs contributed equity capital of US$4,222 to the federation. Table 2 shows the breakdown of grant support mobilized by UNIDO for BVSC.
•A new dye house was constructed with support from the government’s Integrated Handloom Cluster Development Program (IHCDP) and a central yarn depot was initiated to improve dyeing quality and ensure a steady supply of raw material. Training workshops on improved dye-ing practices were held for the ancillary workers involved in dyeing.
While these interventions were initiated at differ-ent times, and sometimes with different weavers, traders, suppliers and other stakeholders, all finally came together at BVSC. The UNIDO project linked Fabindia, India’s biggest retail chain and exporter of handloom products, to Chanderi weavers through marketing initiatives and it became a significant buyer.
When UNIDO withdrew in 2006, it contracted BASIX (a livelihood promotion institution that pro-vides financial services and technical assistance) to continue credit linkage programs that were initiated during the project.
1.3.2 FabIndia community-owned company initiative (2007–present)During the cluster development program, UNIDO helped Fabindia enhance its sourcing from Chanderi through the newly created producers’ federation,
Table 2. Donor support to BVSC, a federation of self-help groups, mobilized by UNIDO
Donor Budget (US$) Time periodGovernment of Madhya Pradesh 33,333 3 years
Oil and Natural Gas Commission (as corporate social responsibility) 11,111 1 year
National Minorities Development Commission (loan at subsidized interest rate) 19,000 2 years
Nirvana (NGO, loan at subsidized interest rate) 2,222 4 years
Total 65,666

67
Interventions to expand market opportunities for makers of handwoven fabrics: Lessons from the Chanderi region, India
BVSC. Building on this initiative, Fabindia, act-ing through its subsidiary Artisans Microfinance Private Limited, promoted a weaver-owned enter-prise, Desert Artisan Handicraft Chanderi Limited (DAHCL), and 450 shares were allotted to weavers. The following specific initiatives were undertaken:
•A private limited company, DAHCL, was reg-istered, which was later turned into an unlisted public limited company.
•A series of meetings in the region mobilized weavers to contribute equity capital and buy shares in the new company.
•Key business systems were introduced into the company through use of a standard template and a cadre of professionals trained in basic business practices. The training of professional staff from 14 such community-owned companies was car-ried out by All India Artisans and Craftworkers Welfare Association (AIACA) with grant sup-port from the Ford Foundation.
•Artisans Microfinance Private Limited mobi-lized and invested US$43,310 of equity capital and joined with Axis Bank to lend US$266,667 as working capital for the company.
As of December 2010, DAHCL functioned as an unlisted public limited company, having 17,500 out-standing shares. Some 932 weavers hold 35.72% of total shares. The shareholders include wage weav-ers, master weavers and traders. Between 2007 and 2010, DAHCL expanded its activities and member-ship base to other regions and its area of operations included five other locations in Madhya Pradesh and three in Chhattisgarh. Of the total of 932 share-holders, 456 are from Chanderi. DAHCL works through eight master-weaver suppliers who, in turn, fill orders through the network of weavers. The num-bers of weavers that execute orders from DAHCL vary with the orders.
1.3.3 Ministry of Textiles Integrated Handloom Cluster Development Program (2007–present)The Indian government’s Office of the Development Commissioner for Handlooms, Ministry of Textiles, launched a four- year Integrated Handloom Cluster Development Program (IHCDP) in 2006, targeting 20 selected handloom regions, including Chanderi.
The Entrepreneurship Development Institute of India (EDI) was chosen to implement the project in the Chanderi/Gwalior handloom region. The pro-gram’s objective was to empower handloom weavers and build their capacity to compete in markets through the following specific interventions:
•A total of 1,822 weavers were organized into 186 SHGs.
•The SHGs were federated into a produc-ers’ company, Chanderi Handlooms Cluster Development Producers Company Ltd (CHCDPCL), which was registered in May 2008 with 249 shareholders (237 weavers and 12 weaver SHGs), at US$2.20 per share.
•To enable weavers to manage the company, 23 training programs targeted aspects of business management; 455 weavers received skill devel-opment training to improve product quality.
•Design workshops in the region resulted in development of 130 new products.
•Common infrastructure constructed included a dye house, four warping sheds and a common facility center.
•Linkages were established with various com-mercial buyers and participation in 85 sales exhibitions generated US$583,333 in sales.
•Under a government-backed ICICI Lombard Health Insurance scheme, 2,141 weavers involved in the intervention were insured.
Since the project’s mandate was to work with all weavers, EDI has tried to involve weavers not cov-ered under the UNIDO intervention; however, there was some overlap in UNIDO and EDI beneficiaries.
1.3.4 History of assessments No systematic assessments had been carried to ascertain the impact of these interventions. Donor reports by UNIDO contain lists of physical project outputs (construction of infrastructure and budget expenditure) but only include anecdotal references to outcomes. This report is, therefore, the first to ascertain income and asset increases achieved in the region through the interventions. It should be noted that none of the interventions looked explic-itly at building household-level assets—other than human capital—and they did not include explicit

68
Assessing Impacts of Value Chain Development on Poverty: A Case-Study Companion to the 5Capitals Tool
strategies for that purpose. The focus of all interven-tions was to enhance incomes of household weavers, strengthen livelihoods through creating commer-cially sustainable weaver-owned enterprises and create linkages to new downstream market actors. Based on the interventions, the following outcomes at the household-weavers and weaver-owned enter-prise levels were expected:
•Increased wage payments and income for household weavers
•Increased financial assets for weaver households through improved access to credit
•Increased physical capital at the community level through creation of common production infrastructure and increased access of household weavers to such infrastructure
•Increased human capital through enhanced pro-duction skills of weavers
•Creation of commercially viable new weaver-owned enterprises
•Increased social capital through creation of producer groups and federations in the region and through greater decision-making power of primary producers in the value chain via the weaver-owned enterprises
2 Methodology
This study followed the 5Capitals tool.4 The assess-ment was carried out by AIACA5 in collaboration with Kaarak Enterprise Development Services (Kaarak).6 It began with desk research on the current context of handloom production and available reports of interventions in the Chanderi region. Inputs from the context analysis were incorporated into the design of data collection tools. This was followed by field-work to identify changes in asset endowments at the level of weaver and upstream enterprises. Fieldwork
included interviews with different stakeholders in the region to identify value chain dynamics as well as interaction with the weaver-owned enterprises and the local community to draw up a list of house-holds that had participated in the interventions for the household-level surveys. A detailed assessment of the three weaver-owned enterprises created from the interventions was also done.
2.1 Setting the basesWe began with desk research on the current con-text of handloom production and available reports of interventions in the Chanderi region. Inputs from the context analysis were incorporated into the design of data collection tools. Fieldwork followed, to identify changes in asset endowments at the level of weaver and upstream enterprises. The fieldwork included interviews with different stakeholders in the region to identify value chain dynamics and, for the household-level surveys, interactions with the weaver-owned enterprises and the local community to draw up a list of households that had participated in the interventions. A detailed assessment of the three weaver-owned enterprises created from the interventions was also done.
The research team visited the Chanderi region and held discussions with weavers, master weavers, trad-ers, implementing agencies, designers (who worked directly with weavers) and other key informants to better understand the value chain context. The team also reviewed project documents, diagnostic studies and interim and final reports. This helped identify direct, indirect and support stakeholders in the value chain, including numbers in each category. Three distinct interventions by different implement-ing agencies over the last decade were identified and a list of producing households (or beneficiaries) involved in the interventions was compiled.
4 Donovan, J; Stoian, D. 2012. 5Capitals: a tool for assessing the poverty impacts of value chain development. Turrialba, CR, CATIE, 70 p. (Technical Series 55, Rural Enterprise Development Collection no. 7).
5 AIACA, a membership-based body, promotes craft-based livelihoods. In addition to policy research and advocacy to create a favorable policy framework for enterprise growth, AIACA implements business development services to help crafts producer groups and enterprises connect to mainstream markets and scale up operations.
6 Kaarak is a consulting firm that assists a range of clients with livelihoods and enterprise promotion efforts.

69
Interventions to expand market opportunities for makers of handwoven fabrics: Lessons from the Chanderi region, India
2.2 Population and sample frameThere are an estimated 3,000 weavers in the Chanderi region. The three interventions organized households into the newly created weaver-owned enterprises of BVSC, DAHCL and CHCDPL (descriptions in section 1.3). Based on the list of par-ticipants in the enterprises, the population for the study was finalized at 705 weaver households.
These weaver households were grouped accord-ing to membership in two of the three enterprises: DAHCL and CHCDPL. Within each group, random sampling was done to select the households for data collection. Since all the members of BVSC (inter-vention 1) were also members of Fabindia-promoted DAHCL (intervention 2), the list of BVSC members was not taken as a separate grouping (table 3). The sample consisted of 219 households, out of which 76 households were target beneficiaries of CHCDPCL (intervention 3) and 143 were target beneficiaries of DAHCL (intervention 2).
2.3 Data collection Two senior staff of AIACA and Kaarak, with assistance from a research associate, conducted interviews with staff and stakeholders of the three enterprises. Annual operational and financial reports of the enterprises (where available) were analyzed for changes over time. Key informants for the study included representatives and staff of implementing organizations—EDI, Fabindia, relevant local gov-ernment departments (Handloom Department at Chanderi and Hasta Shilp Kala Vikas Nigam)—and local financial institutions. Regular meetings with
intervention agencies were organized to validate information collected and to seek their opinions on trends revealed by the data.
As for households, primary data was collected from 219 households using the predesigned and tested interview schedule. Each interview lasted about 40 to 45 minutes. A seven-member research team included one lead researcher, two supervisors and four enumerators. An orientation and training pro-gram was conducted for the team to ensure clarity of objectives and methodology of the research, famil-iarity with data collection instruments, and ideal ways of administering these instruments.
2.3.1 Data collection instrumentsThe data collection instruments included interview schedules for weavers and weaver-owned enter-prises and checklists for implementing agencies and key informants. Data collection instruments were finalized through the following process:
•Preparation of draft data collection instru-ments was based on a groundwork assessment (conducted by senior members of the research team) at the preliminary stage along with cur-rent understanding of intervention outputs and likely impact on the five asset categories. Eight focus group discussions (FGDs) were conducted with weavers and master weavers; two key infor-mant interviews were conducted with traders and the managing director of Chanderi Unit, Handloom Department, the government of Madhya Pradesh, who was also an ex-UNIDO team member from the Chanderi Cluster Development Program.
•Pilot testing of the instruments was done by the research team. During the first pilot test, 10 producer households were interviewed and two FGDs were conducted with master weav-ers. Based on the results, the interview schedule was redesigned to focus more on factual data after starting from opinions and perceptions. A second pilot test was done for the redesigned instruments.
•Minor changes were based on pilot testing and the instruments were finalized.
Table 3. Population for producing weaver households
Interventions Population Sample
UNIDO and Fabindia (Interventions 1 and 2)
456 households
143 households (intervention 2 shareholders—52 households, also part of intervention 1)
IHCDP-EDI (intervention 3) 249 households 76 households
70
Assessing Impacts of Value Chain Development on Poverty: A Case-Study Companion to the 5Capitals Tool
2.3.2 Identification of contextual changesKey informant interviews by senior research team members and FGDs were conducted along with revision of secondary information. Key informant interviews were with EDI, ex-UNIDO staff, FabIndia, DAHCL, Handloom Department at Chanderi, BASIX, one trader, six master-weavers, two mas-ter weavers cum traders, and four weavers, among others. Secondary information was collected from national census data, official government reports, annual reports of the Ministry of Textiles, diagnos-tic studies of the region by implementing agencies, annual reports of enterprises, project proposals written by the different implementing agencies in the past five years, the UNIDO project-completion report compiled in 2006, and articles and case stud-ies of Chanderi in newspapers and other journals.
2.3.3 Digitization of Survey DataSenior consultants reviewed the questionnaires and corrected errors that were identified. This process of rectifying errors was also undertaken after the initial data entry and the final digitized data was cleaned. A special form was designed in MS Access for data management. This form further reduced data entry errors.
2.3.4 AnalysisGiven random sampling of various units, the relative frequencies between agents under different inter-ventions were checked with population frequencies. Given the sample size relative to population, the sample did represent the population weights. Since the population itself was clustered; a random sam-ple was not required. Membership of the three weaver-owned enterprises was identified as an independent variable for analysis. Accordingly, all responses were initially tabulated to identify the significant ones. Further statistical analysis and tests—regression analysis, t-test, z-test, chi-square test, f-test and goodness-of-fit test—were conducted. The test results were generated into tables and graphs for analysis.
The final report was prepared based on the guide-lines provided in 5Capitals, which includes analysis of both qualitative and quantitative data.
3 Context
Attributing income and asset increases to specific interventions within Chanderi was challenging in the context of an 8% average GDP growth and 6% average annual inflation rate since 2003. Between 2003, when the first intervention was initiated and 2010, when this study was undertaken, nominal wages could be expected to rise approximately 44% from inflation alone for weavers who continued to work in handloom production.
Although the case study and sample survey in Chanderi did not include a control group, extrapo-lation was possible from documented evidence of sectorial trends, pre-intervention assessment reports within Chanderi, household interviews and available information on other handloom regions in North India where there have been no significant interven-tions from 2003 to 2010.
3.1 Sector overviewHandmade textiles continue to be a significant source of employment in India. Commonly referred to as “handlooms,” handmade textiles are second only to agriculture in number of rural livelihoods supported, accounting for 15% of textile production in the country. The Handloom Census of India conducted in 2010 shows 2.8 million households employed in handloom production and ancillary activities.7 Table 4 gives a detailed breakdown of employment figures from the census. Of households employed in the sector, 73% belong to socially marginalized caste and tribal groups that are disproportionately repre-sented among the poor in India.
The handloom sector is characterized by informal sector production, with weavers operating as either
7 Handloom Census of India 2009–2010, Office of the Development Commissioner (Handlooms), Ministry of Textiles and National Council of Applied Economic Research.

71
Interventions to expand market opportunities for makers of handwoven fabrics: Lessons from the Chanderi region, India
independent small producers or daily wage workers employed through informal contracts with local trad-ers and master weavers. A small percentage of weavers operate through cooperatives. In addition, a signifi-cant percentage of weavers (36%) are only employed part-time in handloom production, as a supplement to agricultural production and labor. Figure 1 and figure 2 show handloom census data on employment status and nature of employment (based on information from the 2009–2010 Handloom Census of India).8
3.2 Sector-specific government policy The government of India has historically sought to promote small-scale industries by legislating that a number of products can only be produced by small-scale units, as defined by number of employ-ees and capital used. The Handlooms (Reservation of Articles for Production) Act, 1985, reserved a wide range of textile products for production only by handloom weavers, with punitive measures
Table 4. Distribution of handloom households by type
Rural Urban Total %Weaver households 1,985,186 282,822 2,268,008 81
Allied worker households 316,009 75,116 391,125 14
Idle loom households 78,495 2,761 81,256 3
Others (no adult worker) 41,427 1,455 42,882 2
Source: Handloom Census of India 2009–2010, Office of the Development Commissioner (Handlooms), Ministry of Textiles and National Council of Applied Economic Research
Self-employed
Under master weavers
Under institutions
5%
34%
61%
0
20
40
60
80
100
Rural Urban All
Part-time
Full-time
Self-employed
Under master weavers
Under institutions
5%
34%
61%
0
20
40
60
80
100
Rural Urban All
Part-time
Full-time
Fig. 1. Distribution of handloom workers by employment status
Fig. 2. Distribution of weavers by nature of employment
prescribed to discourage factory-based production of these articles. Eleven categories of textile prod-ucts were covered by the act as of 2010.
However, since economic and trade liberalization in 1991, the policy framework has focused on promoting formal sector textile production by large industrial units and the 1985 act has not been enforced. It is no longer a significant deterrent against industrial production of the reserved articles. Despite rapid economic growth rates, handloom-based livelihoods continue to show a downward trend in number of people employed. Increased competition from lower-priced industrial textiles has also significantly disrupted employment and income levels. Between the handloom census in 1995 and the census in 2010, the number of weaver households declined 14%. Comparison of the 1995 and 2010 census data (table 5) also shows a change in the composition of producer households, with less-skilled, part-time workers exiting the sector.
8 Ibid.

72
Assessing Impacts of Value Chain Development on Poverty: A Case-Study Companion to the 5Capitals Tool
A 2007 NCEUS study9 found that in the two states with the largest number of handloom weavers, Uttar Pradesh and Andhra Pradesh, up to 63% of weavers continued to fall below the poverty line. Based on sample surveys in these states, the study highlighted the following problems:
•Declining demand for handloom products: There has been a decline in demand for tra-ditional handloom products, leading to a 40% decline in employment and production in these states. On one hand, lower-priced industrial products were displacing craft products among lower-income consumers in both urban and rural markets. On the other, craft products were also facing increased competition from branded, value-added products among higher-income con-sumers, especially in urban areas. The informal nature of the sector and multiple intermediaries between the producer and the market have ham-pered a competitive response in terms of both development of new products that respond to changing market conditions and investment in more efficient production and supply chains.
•Dependence on traders for raw materials and market linkages: The dependence on intermedi-aries for supply of raw materials and selling the finished product reduced the bargaining power of weavers in wage negotiations.
•Deferred payments and indebtedness: Informal contracts have led to exploitation of weavers by traders, especially in delay of payments for fin-ished products. The study found that deferred
Table 5. Key indicators of producer households (handloom census,1995 and 2010)
Number of weaver households (lakh*) 25.25 22.68
Number of handloom weavers (lakh*) 34.71 29.09
Average man-days worked per household 197 234
Share of full-time to part-time weavers 44% 64%
Share of households reporting less than 1 meter production 68% 48%
* Lakh is equal to 100,000Source: Handloom Census of India 2009-2010, Office of the Development Commissioner (Handlooms), Ministry of Textiles and National Council of Applied Economic Research
wage payments contributed to indebtedness among weavers. Most weavers surveyed were accessing credit from informal sources. The aver-age outstanding debt at the end of the assessment was US$511.
•Slow adoption of new technology: Most weav-ers still used pit looms—rudimentary looms with lower productivity—despite newer, more pro-ductive frame looms available in the market.
Due to its employment and livelihoods potential, the Indian government, through the Office of the Development Commissioner for Handlooms, has designed, financed and implemented various wel-fare and capacity-building programs for weavers and ancillary workers. From 1997 to 2009, the cen-tral government raised its annual budget allocation for handloom-sector support from US$45 million to US$73 million, an increase of 61%. But, until 2006, a bulk of government spending was routed through cooperatives via direct subsidies on the price of handloom fabric. In addition, various multilateral, bilateral and private donors have focused on han-dlooms as an area for livelihoods promotion efforts.
One of the key problems reported by weavers, including those involved in informant interviews in Chanderi, was volatility of yarn prices—significant even on a monthly basis. Volatility of raw material prices affected earnings of self-employed weavers and master weavers because they were not able to pass on the full cost of raw material increases to
9 National Commission for Enterprises in the Unorganized Sector. 2007. Report on conditions of work and promotion of livelihoods in the informal sector. Government of India. New Delhi, India: Academic Foundation.

73
Interventions to expand market opportunities for makers of handwoven fabrics: Lessons from the Chanderi region, India
upstream actors and consumers. Volume of pro-duction was also impacted since weavers were often unable to raise the additional working capi-tal required to maintain production levels. Figure 3 shows available yarn-price data from 2003 to August 2010,10 indicating a 65% increase. This data was collected from central markets in urban areas and anecdotal evidence suggested that fluctuations in yarn price were even higher in rural areas.
According to the 2010 census, the decline in handloom-based livelihoods in Madhya Pradesh was much higher than the national average. Census data (fig. 4) showed a 73% decline in the number of workers employed as weavers and ancillary workers there. Although various NGOs challenged the extent of the decline on the basis of undercounting rural workers in the census, the trend was not disputed. Though the census did not break down employment figures below the state level, it was estimated that up to 60% of the total weaver population of Madhya Pradesh was located in the Chanderi region.
3.3 Regional overviewThe 1995 census data, which provides a picture of the state before the interventions began in Chanderi, gave the average number of working days for weavers in the state as 207 days per year and average monthly earnings at US$33. The 2010 census showed that 73% of weaver households in the state did not own
6.00
0.00
1.00
2.00
3.00
4.00
5.00
Jan-
03
Jun-
03N
ov-0
3
Apr
-04
Sep
-04
Feb-
05
Jul-0
5D
ec-0
5
May
-06
Oct
-06
Mar
-07
Aug
-07
Jan-
08Ju
n-08
Nov
-08
Apr
-09
Sep
-09
Feb-
10
Jul-1
0
Under 18 yearsold-unclassified
Ancillary workersWeavers
0
10000
20000
30000
40000
50000
60000
1995 2010
6.00
0.00
1.00
2.00
3.00
4.00
5.00
Jan-
03
Jun-
03N
ov-0
3
Apr
-04
Sep
-04
Feb-
05
Jul-0
5D
ec-0
5
May
-06
Oct
-06
Mar
-07
Aug
-07
Jan-
08Ju
n-08
Nov
-08
Apr
-09
Sep
-09
Feb-
10
Jul-1
0
Under 18 yearsold-unclassified
Ancillary workersWeavers
0
10000
20000
30000
40000
50000
60000
1995 2010
1995 20100
20004000
60008000
10000
1200014000
16000
1800020000
Without loomsWith looms
a loom and were, therefore, wage workers. The data suggested a shift of weaver households from indepen-dent production on self-owned looms to contracted production on looms owned by master weavers, trad-ers and weaver-owned enterprises (fig. 5).
Within Chanderi, the two main livelihood options other than weaving were bead making and manual labor. A diagnostic study, which relied primarily on informant interviews with weavers and focus group discussions, was conducted by UNIDO in 2002, prior to the first intervention. The following information and trends in the Chanderi region were captured in the report:
Fig. 3. Hank-yarn prices (US$)
Fig. 4. Madhya Pradesh employment figures (1995 and 2010)
Source: Handloom Census of India 2009–2010, Office of the Development Commissioner (Handlooms), Ministry of Textiles and National Council of Applied Economic Research
Fig. 5. Madhya Pradesh weaver households by loom ownership
10 Ministry of Commerce, Government of India.

74
Assessing Impacts of Value Chain Development on Poverty: A Case-Study Companion to the 5Capitals Tool
•Of 3,659 working looms, 1,145 were linked to the local cooperatives, with an annual production of $3.3 million.
•Traditional products (saris) accounted for 90% of production.
•Historically, apex government marketing soci-eties purchased products from Chanderi to promote and support handloom-based liveli-hoods in the region. However, by 1996, due to increasing losses suffered by the apex marketing societies and the changed policy paradigm due to economic liberalization, government-funded purchases dipped from a high of 20% of total production to less than 10%.
•By 1996, more than 90% of total production was sold outside of local markets, with products primarily marketed through local traders who commissioned work by wage weavers.
•There was no evidence of an increase in weav-ers’ wages over the past five years (1997–2002).
•There was no institutional source of funds for working capital credit or capital investments—the main sources of credit for the weavers were local traders.
•There was limited social capital. Although there were 10 registered government-supported coop-eratives, not one was functional in 1995 and weavers reported that the cooperatives were used to route government benefits to master weavers, not household weavers. There was a lack of a trade union or other association to rep-resent the weavers’ interests.
3.4 Region used for comparisonOutside of Chanderi, the Benares handloom region provided a good counterpoint for comparison due to its similarity with the Chanderi handloom region.
•The main source of livelihoods in both regions was handlooms.
•The distance from major urban markets was similar.
•The product mix was comparable, including the use of similar raw materials.
•The religious and caste demographics were similar
A study by Singh and Naik11 in 2009 found that a majority of working weavers in the Benares region were 36 to 55 years old and that younger family members were choosing to migrate to urban areas, seeking low-skilled jobs rather than taking up tra-ditional livelihoods. From a sample size of 100 randomly chosen weavers, 35% reported a family income of less than US$478 a year from weaving and an additional 52% reported an annual family income between US$478 and $989, so 87% of weavers sur-veyed reported an annual income of less than $989 annually. The study supported other case studies that showed a steep decline in weaving livelihoods and outmigration due to increased competition from cheaper industrially produced goods, shifting con-sumer preferences and liberal trade policies. A local nonprofit, People’s Vigilance Committee on Human Rights, compiled evidence through interviews and case studies of malnutrition, endemic hunger and suicides among the weaving community.
After economic liberalization in 1991, available reports suggest a general trend of struggling to adapt to changing market conditions in handloom produc-tion areas. Handloom production and the value chain were unable to respond to increased competition and shifting consumer tastes due to lack of capital investments, access to credit and other shortcomings.
4 Changes in business assets
The research team studied three enterprises formed by the interventions for value chain development: BVSC, DAHCL and CHCDPCL. The findings concluded that despite having different legal enti-ties (society, public limited company and producer company, respectively), different management structures (producer-managed and profession-ally managed) and different objectives (welfare, producer ownership, aggregation of products), all three contributed significantly to helping members improve their position in the value chain in aspects such as design, product diversity and quality, market share, and new market linkages. The establishment
11 Singh, A; Naik, SD. 2009. Status of Banaras weavers: a profile. Karnataka Journal of Natural Sciences 22(2):408–411.

75
Interventions to expand market opportunities for makers of handwoven fabrics: Lessons from the Chanderi region, India
of these associations also helped reduce traditional exploitative relationships. Hence, institutional devel-opment, specifically with producer ownership and professional management, was a critical component of interventions for value chain development seek-ing to impact the incomes and living standards of poor producers.
4.1 Human capital 4.1.1 Professional staff introduced through weaver-owned enterprisesThe UNIDO and Fabindia interventions played a key role in bringing in professional staff that built the enterprises and introduced business systems that enabled commercial operations. However, capacity building of local producers to maintain and manage these business systems after the withdrawal of the implementing organization has had limited success.
Professional staff brought in by UNIDO helped establish business systems such as production fore-casting and order and inventory management in the enterprise, BVSC. UNIDO provided grant support to hire a professional CEO for BVSC from 2004 to 2006–2007. After the UNIDO project withdrew in 2006 and the professional CEO departed, sales rev-enue gradually declined: US$133,000 in 2007–2008; $100,000 in 2008–2009. It improved somewhat in 2009–2010, to $111,111, but was still lower than in 2007. From April to December 2010, BVSC gener-ated only US$40,000 in sales.
Although the BVSC management in 2010, made up mostly of weavers and master weavers, cited lack of market information and working capital as the main factors for declining sales, the lack of dedicated professional staff seemed to be a significant factor. With creation of new enterprises in Chanderi, BVSC has had to compete with others. But the weaver management seemed to lack business planning and forecasting skills, which also hampered the ability to raise debt capital from financial institutions.
DAHCL, which implemented the second interven-tion, also brought in trained professional staff and established various business systems that tied it closely to the procurement needs of Fabindia, its
largest commercial buyer. Due to the continued involvement of private sector organizations (Artisans Microfinance Private Limited and Fabindia) that stressed the importance of professional management and provided handholding support, DAHCL had retained its professional staff and continued to have well-functioning business management systems.
4.1.2 Training and capacity building of weaversAll three interventions provided training pro-grams to build the capacity of the weavers in both production-related aspects, such as new product design, and enterprise-management aspects, such as costing and pricing, production management, quality control, stock management, accounting and market-ing. Although there was evidence of significant impact from the production-related capacity-building efforts in terms of an increase in volume of new products produced in the region, efforts to train weavers to take over management of weaved-owned enterprises has had mixed success.
Unlike in the BVSC intervention, where trained weavers were unable to fill the gap left by the lack of professional staff, in CHCDPCL, the third interven-tion that was implemented by EDI, weavers were successfully managing the enterprise, albeit with continued grant support. Selected shareholders in CHCDPCL were trained to effectively manage it as an independent enterprise. Five members received training in design development, production planning and monitoring, quality control and marketing. These five weavers became directors of CHCDPCL and were assisted in drawing up a business plan for the first year. Initially, the company set a target of work-ing with 60 to 70 looms (with 48 weavers) producing up to 50 specialized designs, with a total output of 500 saris per month. This gradually increased to 100 looms (60 weavers) producing 75 designs, with a total output of 1,000 saris per month. Selection of looms for allocating production was being done in a transparent manner based on the skill required for specific products.
To effectively carry out business development and marketing, a sales and marketing promotion team of 10 shareholders was formed under the leadership

76
Assessing Impacts of Value Chain Development on Poverty: A Case-Study Companion to the 5Capitals Tool
of a local weaver. This team received training nec-essary to solicit orders, maintain quality and supply deadlines, develop institutional links and innovate in response to market demand. While decisions pertaining to the execution of orders, costing and pricing, production planning, work allocation and design selection were jointly taken by the directors of CHCDPCL, the responsibility for maintaining the company’s accounts, financial control and inter-nal audit was entrusted to an accredited chartered accountant.
4.2 Social capital4.2.1 Aggregation into registered enterprises All three interventions have contributed to mobi-lization of individual weavers into groups and creation of new institutional structures in the form of enterprises wholly or partially owned by weavers. The specific focus on inclusion of women in mobili-zation and aggregation of weavers has led to their increased representation and participation in deci-sion making in the SHGs and enterprises.
The establishment and growth of weaver-owned enterprises marked a significant change from the existing value chain structure in the region. Professionally run enterprises with modern business systems have been created, where earlier only a local network of traders controlled trade in handloom products. These enterprises have enabled weavers to supply a greater quantity of their products to large-scale formal retailers. Increased market linkages created through the interventions have brought an increase in total production, reflected in the survey data on monthly production reported by weaver households (see section 5).
The creation of these enterprises also had an impact on the traditional supply chain. Traders were forced to increase wages to match those paid by the enter-prises and adopt standard and transparent payment practices to compete with the new enterprises.
However, it is uncertain whether these improve-ments will be sustainable. Structurally, the trader and master weavers have been absorbed into the altered value chain in a way that preserves their control over
wage workers. Despite increased sales, the sustain-ability of two of the enterprises after withdrawal of the implementing organizations was also uncertain. In the oldest enterprise, BVSC, there has been no increase in membership since 2005. As a policy, BVSC sourced handlooms only from its members, and as of December 2010, only 50 member weavers were supplying products. Among the 52 surveyed households that were BVSC members, only 22 reported supplying to BVSC. In 2004, 70 weavers supplied products, which increased to 140 weavers in 2006–2007, the year that BVSC reported its highest revenues: US$171,111.
4.2.2 Standardization of payment norms and wage rates in the regionBVSC was the first enterprise in Chanderi to intro-duce better business practices and transparency measures in the production process. Developing and publicly posting information on payments for each category of product, quality parameters on the basis of which a product would be accepted or rejected, and the time period within which the payment was to be made changed accepted business practices in the region. Although the state handloom depart-ment did have regulatory framework and awareness programs to ensure minimum wages for weavers, it was not being implemented; master weavers and traders cited business viability as a reason for not paying minimum wages. BVSC, in collaboration with Fabindia, demonstrated that it was viable to increase wages and make payments in a timely manner.
The rates for handloom weaving were based on a weaver’s skill. BVSC started paying US$0.35 per meter for a particular type of fabric when other traders were paying $0.27 to $0.30 for the same fab-ric. In 2010, weaving rates were uniform throughout Chanderi and all of the weaver-owned enterprises paid the same rates—$0.49 to $0.56 per meter. Within BVSC, average daily wages paid to a weaver increased from $1.90 in 2004 to $2.80 in 2006 (not adjusted for inflation).
Other master weavers and traders and subse-quent weaver-owned enterprises created through value-chain interventions followed suit in order to
77
Interventions to expand market opportunities for makers of handwoven fabrics: Lessons from the Chanderi region, India
protect their business, which depended on informal relationships with weavers. Similarly, master weav-ers reported one of the main impacts of the DAHCL intervention was its professional and transparent approach in allocating work and making payments. See box 1 for a brief profile.
4.2.3 New relationships with donors and commercial buyers The weaver-led management of BVSC also learned to manage its independent participation in market-ing events such as exhibitions and fairs in metros in Mumbai and Delhi. It also began to interact directly with other buyers based in external markets and added a few new buyers.
CHCDPCL successfully developed supplier rela-tionships with a range of large established retailers as well as smaller boutique stores, including Lifestyle, Central Cottage Industries Corporation of India (CCIC), Ahilya Creations, Ranjana Fabrics and Tahiliani Designs. CHCDPCL only sold in the domestic market, with 60% of the sales being whole-sale and the rest as retail sales through Mrigneni, the state government’s top handloom marketing society.
4.3 Physical capitalSome of the significant physical assets that BVSC built include a dye house on its own land and a small office and warehouse within the dye house. These physical assets were purchased with the help of grants from development agencies—BVSC built no physical assets with its own income. DAHCL also leased office and warehousing space in the region.
All three weaver-owned enterprises focused on identifying and forming linkages with higher-quality yarn and dye suppliers, thereby playing a key role in making higher quality inputs available to weavers in the region.
4.4 Financial capitalAvailability of working capital credit remained an issue with BVSC, which received very little credit from commercial banks. Most of the credit it raised has been low-interest or zero-interest loans extended by development banks or corporations such as NMDC Limited and Graphite India Limited, as part of their corporate social responsibility programs. BVSC showed promise as a model for an enterprise owned and operated by producers. However, it has struggled to meet its core objective of weaver wel-fare vis-à-vis its business objective of making profit in a sustainable manner.
DAHCL reported profits of 2.02% in sales in 2007–2008, declining to 1.01% in 2008–2009 and rising to 2.01% in 2009–2010. The company paid a 10% divi-dend in 2007–2008 and a 20% dividend in 2008–2009 and 2009–2010. The reported market value of shares rose from $2.20 in 2007–2008 to $4.40 in 2008–2009 and was $5.30 in December 2009. The company had organized two share-trading rounds, in December 2009 and June 2010. However, only 473 shares (3% of total shares) had been traded. For an average arti-san shareholder, the investment of $22 (an average artisan shareholder has 10 shares) earned a dividend of $10, and the market value of the shares had gone up to $53. This translated into an investment return
Box 1: Profile of Asa Ram Kohli, DAHCL master weaver
Asa Ram has been supplying products to DAHCL since 2008. He now receives orders worth US$200,000 per year. He employs 15 weaving households in Pranpur, a village five kilometers from Chanderi town. He gets his raw material from the local Chanderi market. He believes that there has been a significant improvement in product quality due to the increased availability of good-quality yarn. He purchases from two main yarn traders in Chanderi. For yarn that requires dyeing, he uses the dyeing facilities available at BVSC; however, he is not satisfied with the dyeing quality. He took interest-free loans from his friends to start employing other weavers, which he repaid after one year. He owns 20 shares in DAHCL and is very satisfied with the timely payments and continuous work orders. He also holds a health insurance policy, which he obtained through the EDI intervention.

78
Assessing Impacts of Value Chain Development on Poverty: A Case-Study Companion to the 5Capitals Tool
rate of 45% in the past three years and a capital appreciation rate of 140%. However, in absolute terms, owning a part of DAHCL led only to an extra cash income of $10 and an increase in asset value of $31 for the average artisan shareholder. In addition, DAHCL did not source handloom products only from its artisan members.
Since DAHCL supplied only to Fabindia, its perfor-mance was directly linked to overall performance of the Fabindia retail chain, which grew significantly in the past three years. In the first financial year (2007), DAHCL achieved a sales turnover of about $244,444, which shot up to $1.25 million in 2008–2009 and to $1.3 million in 2009–2010 (table 6).
In its first year of operation (June 2008–March 2009), EDI/CHCDPCL produced saris and dress material worth $66,667, resulting in sales of nearly $49,000 that year, Production increased marginally to $73,288 in 2009–2010. During 2008–2009, apart from a 20% wage increase to weavers, the company also provided a dividend of 40% ($8.90 on a share value of $22.20) to its shareholders. In 2009–2010, the company enhanced the dividend payout to 60% ($13.30). Average annual wages paid to each weaver in 2008–2009 was $832, which increased to $1,007 for the financial year 2009–2010. However, the company was not profitable and relied on government grants for dividend payments.
5 Changes in household assets
5.1 Human capitalInterventions for value chain development over the past eight years in the Chanderi region brought systemic changes in the production system. In the traditional system, master weavers and traders had dedicated wage workers who worked exclusively with them. Master weavers gave raw materials and designs to wage weavers, who received wages for the finished product. It was not easy for wage weavers to shift their production to another master weaver, and exploitative practices—such as rejecting
products on quality grounds without setting clear quality parameters, arbitrary delays in wage pay-ments and deduction of wages against credit given to weavers—were rampant. Better terms of trade introduced by the weaver-owned enterprises forced master weavers and traders to reduce these exploit-ative practices in order to compete. The transparent systems in allocating production to individual weav-ers, clearly defined quality parameters, fixed wage rates and payment guidelines led to a weakening of the existing power structure of the traders and mas-ter weavers. Awareness programs organized by the implementing organization in the interventions also played a key role in the demand by wage weavers for fair practices from master weavers and traders.
Ninety-eight percent of weavers stated that they would like to continue with weaving as their primary occupation due to increase in wages, higher market demand and easy availability of work. New weavers made up 25% of the total weaving population and 54% of new weavers were in the 18–23 age group, which suggested that, unlike in other handloom regions,12 it was still considered a feasible livelihood option. The ability of wage weavers to negotiate wages also improved. Compared to five years ago, in 2010 84% of wage weavers reported that they felt more empowered when dealing with traders.
Traditionally, Chanderi products were expensive and known for their intricate designs. One major change by the interventions was introduction of modern designs with reduced production times, which made the products affordable to middle-class consumers. Also, new products were introduced, such as home furnishings, dress material and stoles. Simultaneously, raw material and dyeing-quality interventions improved the quality of the final product. It was found that 48% of BVSC members, 25% of DAHCL members and 17% of CHCDPCL members were making new products in addition to traditional products like saris. The survey also found that wage weavers making new products earned US$9.30 more per month than those making only traditional products.
12 Handloom Census of India 2009-10. Office of the Development Commissioner (Handlooms), Ministry of Textiles, and National Council of Applied Economic Research.

79
Interventions to expand market opportunities for makers of handwoven fabrics: Lessons from the Chanderi region, India
Interventions in training weavers in manage-ment practices have led to a cadre of trained producer-managers who are managing the enter-prises. Weavers trained through the interventions are now involved in multiple points of the value chain, including marketing, design development, enterprise management and quality control.
However, there were very few cases of wage weav-ers becoming entrepreneurs themselves. Wage weavers did not report any significant impact of capacity-building trainings: 96% of weavers were still unable to design their own products and were dependent on weaver-owned enterprises and mas-ter weavers for designs. The ability of the weavers to control related aspects of their occupation, such as dyeing, also showed no significant improvement despite investment by interventions in collective infrastructure. Weavers were dissatisfied with the quality of finished products through use of the dyeing unit promoted by EDI and run by BVSC. Although weavers reported a significant improve-ment in accessibility and quality of raw materials, a majority of them attributed this to general market conditions rather than specific interventions. Many weavers still purchased yarn from the local market rather than through the yarn depots set up through the interventions.
Traditionally, Chanderi had a uniform wage-rate sys-tem for both male and female weavers, and wages varied according to product design and intricacy of weaving. Earlier, women mainly carried out ancillary activities, mostly as unpaid household labor. Due to the interventions, a significant number of women took up weaving as their primary occupation; 37% of new weavers were women. The sex ratio of weav-ers (more than 17 years old) was 1: 0.85 and this ratio was 1: 0.93 in the 24–35 age group. Interventions
conducted numerous exposure visits to different regions and markets, which played a large role in leadership development and confidence building among women. By 2010, women weavers were par-ticipating in exhibitions in other parts of India and even abroad.
Among weaver households, 64% reported increased educational outcomes and attributed this to increased income from weaving. In the school-age bracket, 86% of children were enrolled in school. However, of the total population, only 7% were graduates and another 16% were educated only up to the secondary-school level.
With respect to nutritional intake, 66% of weavers reported improvement compared to five years ear-lier, and 60% reported that they could afford better medical services for their families, of which 23% attributed the improvement to the health scheme introduced by CHCDPCL and ICICI Bank and later adopted by other enterprises in the region.
5.2 Social capitalNew member-owned enterprises facilitated for-mation of new networks of weavers in the region, which led directly to improved wage rates. The weaver-owned structure of the enterprises and reg-ular shareholder and coordination meetings have strengthened networks of wage weavers in the region, but it was unclear whether this would lead to further improvements in incomes and living stan-dards of wage weavers after the interventions.
The networks, along with increased government-led activity in the region, were leading to increased access to government services. However, persistence of traditional value chain elements threatened sus-tainability of the structural changes in the value
Table 6. Sales of weaver-owned enterprises (in US$)
Enterprise FY 2007–2008 FY 2008–2009 FY 2009–2010BVSC 134,899 101,638 113,167
DAHCL 244,444 1,255,556 1,313,333
CHCDPCL NA 48,889 82,222

80
Assessing Impacts of Value Chain Development on Poverty: A Case-Study Companion to the 5Capitals Tool
chain: 88%, 86% and 58% of the total members of DAHCL, CHCDPCL and BVSC, respectively, still sold their products through traders and master weavers.
5.3 Physical capitalEven though there was a large increase in total regional production, there was no corresponding increase in weaving-related assets. There was no increase in the number of installed looms, sug-gesting that previously underutilized looms were running at higher capacity. Of weavers surveyed, 28% reported purchase of assets such as pre-loom and post-loom processing equipment. There was evidence of specific interventions by EDI in intro-ducing new tools and implements that resulted in productivity increases of up to 25%. Despite this, only 28% of weavers in the region have adopted the new tools—all received free through grant sup-port or at subsidized rates.
However, new community-level physical assets have been built through the interventions. A dyeing unit established by EDI was being managed by BVSC. A yarn depot was established by CHCDPCL. Warping sheds were constructed by all three implementing organizations, which has made the warping process easier during monsoons and summers. However, weavers felt that the quality of services provided by these community-level assets need to be improved. For example, weavers preferred to purchase pre-dyed yarn because they felt that the quality of the dyeing unit was poor. They also procured most of the yarn from the open market because they believed that the stock and quality of yarn at the yarn depot was poor.
At the household level, there was a significant increase in the purchase of consumer goods such as mobile phones, televisions, gas stoves and bicy-cles, which pointed to an improvement in standard of living. Among the households 74% reported purchasing a mobile phone in the past five years. However, very few reported purchase of larger assets: only 2% reported purchase of land and 6% reported purchasing a motorcycle. The mean value of total physical assets purchased by weavers since
2005 was only $204, although there could have been significant underreporting in the survey. DAHCL shareholders reported purchasing the highest aver-age value of assets, at $245.
5.4 Financial capitalA weaving household’s average monthly value of production increased from US$50 in 2005 to $87 in 2010, up $37—a 73% increase. However, further analysis at the household level showed that 81% of households reported monthly production increases of less than $33 (fig. 6), with much larger production increases for a minority of households that skewed the average upward. Removing these households from the analysis reduced the average monthly increase in production to $22. A higher number of households that had switched to more produc-tive jacquard looms reported higher production increases than other weavers.
The hypothesis was that the main determinant of differences in production and income increases were the strength of relationships to master weavers, who allocated production to wage weavers and therefore determined the number of annual employment days.The proportional change in production was strongly correlated to the proportional change in total income for weaver households; 97% of respondents (211 weavers) reported an increase in monthly produc-tion value. Of the 211 weavers reporting production and income increases, 177 weavers had not switched to more productive jacquard looms. Of the 211, 202 reported an increase in the number of employment days from weaving. Thus, survey data, corroborated by weaver interviews, suggested that the increase in production could primarily be attributed to increased employment due to increased demand for products through new market linkages created by weaver-owned enterprises.
As of February 2010, average monthly total income of surveyed weaver households was US$83 and aver-age monthly income from weaving was $71, up from $48 per month in 2005, for a 48% increase. Compared to data reported in the 1995 census, average monthly income increased by 115%, based on the monthly income of $33.

81
Interventions to expand market opportunities for makers of handwoven fabrics: Lessons from the Chanderi region, India
0
5
0
5
20
25
30
35
40
45
%
<=0 0–11 11–22 22–33 33–44 44–133 133–1733
Fig. 6. Proportion of households according to change in production (US$)
Despite repeated targeted interventions, there was no significant improvement in access to credit in the past five years. As of 2010, more than 90% of weav-ers still relied primarily on informal credit sources. The public sector bank in Chanderi, the State Bank of India (SBI), had distributed loans to 150 weavers in 2007 through the UNIDO intervention. However, the weavers failed to repay the loans and SBI decreased loans to weavers. From 2008 to 2010, SBI disbursed only 10 loans to weavers in the region.
UNIDO promoted the SHG model for enhancing savings and credit services to members. However, these groups ceased to function. After withdrawal of UNIDO as the implementing organization, the 13 SHGs of BVSC neither met regularly nor collected any member savings. Apna Kosh was set up as a credit cooperative run by BASIX to provide small loans to members, but very few weavers were members.
Interestingly, 83% of weavers surveyed reported an improvement in access to savings facilities and 50% of weavers reported an increase in monthly savings. The main savings instrument was a formal bank account at SBI.
6 Conclusions
There have been three distinct interventions for value chain development in the Chanderi handloom region with the objective of improving incomes and living standards of wage weavers. All focused on improvements in the following four areas: social intermediation and aggregation of weavers, strengthening production inputs and infrastructure, capacity building of weavers to increase their nego-tiating power in the value chain, and building new market linkages to increase total production in the region. The ultimate objective of all three was to build commercially sustainable weaver-owned and weaver-managed enterprises that would serve as the nodal point for production and sales of handloom products from the region.
The interventions have led to significant structural changes in the value chain for Chanderi handloom
products. Transparent systems in allocating produc-tion to individual weavers, clearly defined quality parameters, and fixed wage rates and payment guide-lines have led to a weakening of the existing power structure of the traders and master weavers. The creation of new market intermediaries in the form of the weaver-owned enterprises promoted through interventions has forced new market dynamics, leading to a reduction in exploitative practices and improved terms of trade for the wage weavers.
The results of the household survey confirm wage increases, significant increases in standards of living and increased access to key development goods such as health, education and insurance services. Weavers cite increased transparency and a codified set of production allocation and payment practices as key improvements achieved through the interventions.
The main impacts of the interventions can be sum-marized as follows:
•Relative to other handloom regions, weaving continued to be viable as a livelihood activity in Chanderi and new weavers were taking up the profession.
•New market linkages to formal sector retail-ers and exporters helped increase production volumes and incomes. Production increases of 73% and income increases of 48% for wage weavers suggested that the interventions have been successful in creating weaver-owned and weaver-operated enterprises that enable weavers

82
Assessing Impacts of Value Chain Development on Poverty: A Case-Study Companion to the 5Capitals Tool
to capture a greater component of value added in the region. But the ability of the enterprises to be commercially sustainable and continue oper-ation after the provision of grants, government subsidies and externally provided professional management was still unclear.
•No specific asset-building interventions were made as part of the interventions other than an attempt to introduce savings though SHGs and an intervention by BASIX to form savings and loan groups, both of which were unsuc-cessful. However, significant income increases led to accumulation of some assets. Significant improvement in standard indicators of poverty, such as purchase of mobile phones and televi-sions and upgrading to a semi-pukka and pukka house (permanent structures built with concrete and brick), suggested that interventions have played a role in reducing poverty, improving incomes and the standard of living in the region. The interventions have also led to a marked increase in the access to savings and insurance services.
•The greatest impact seems to be in terms of an increase in human capital. Weavers reported increased negotiating power vis-à-vis other value chain actors. They also reported increased access to health and educational services.
•Interventions have had a significant impact on empowering women and increasing their income. There was a structural change in the role of women in the value chain, from being unpaid household labor in ancillary activities to full-time weavers who were members of the weaver-owned enterprises.
•Three new weaver-owned enterprises were cre-ated in the region, leading to combined sales of US$3.3 million.
However, the following are areas where significant impact was not seen:
•There was no evidence of increased access to credit and access to credit was still reported as the main impediment to income growth by producers.
•Real average wage rates of weavers went up by only 4% through the interventions.
•Sustainability of weaver-owned enterprises after intervention, especially with regard to the ability of producers to manage these enterprises with-out professional assistance, was doubtful. Most of the total production in the region continued to be routed through traders, which is a threat to the sustainability of improvements for wage weavers in terms of trade achieved through the interventions.

83
Building a value chain for organic vegetables with smallholders in Appalachia, United States
Aimee Russillo1
Summary This case study focuses on a network of 41 small, rural growers facilitated by the Appalachian Harvest (AH) program in Central Appalachia in the United States. The network supplies value-added (organic) produce to supermarket chains, using the Appalachian Harvest® local and organic label to add value through coop-erative grading, packing and marketing of organic produce. The AH program was created by Appalachian Sustainable Development (ASD) with the help of government agencies and private foundations. The study looked to evaluate the AH program’s impact on strengthening farmers’ livelihood strategies and helping the AH program develop into a viable business operation. The assessment shows mixed results for the ASD inter-ventions. AH’s physical assets are now significant in terms of the packing facility and hold much opportunity for ASD, the community and the growers. In contrast, financial assets have not been built or could be seen as negative, making the entire network, and the human and social capital built, vulnerable to any changes in markets. Buyer connections to AH network are tenuous, with no written contracts and high dependency on one individual. There is limited investment in the network by any of the other value-chain players and very low exit barriers. Among producers, human capital has increased but heavy reliance on one-on-one personal interventions is not viable for new demands/expansion. AH members believe in the AH network as a vehicle for accessing differentiated markets and the interventions have contributed to general building of human and social assets. However, only a handful of growers have really benefited in terms of financial assets and reduced overall vulnerability.
1 Aimee Russillo works with Liseed Consulting, [email protected].
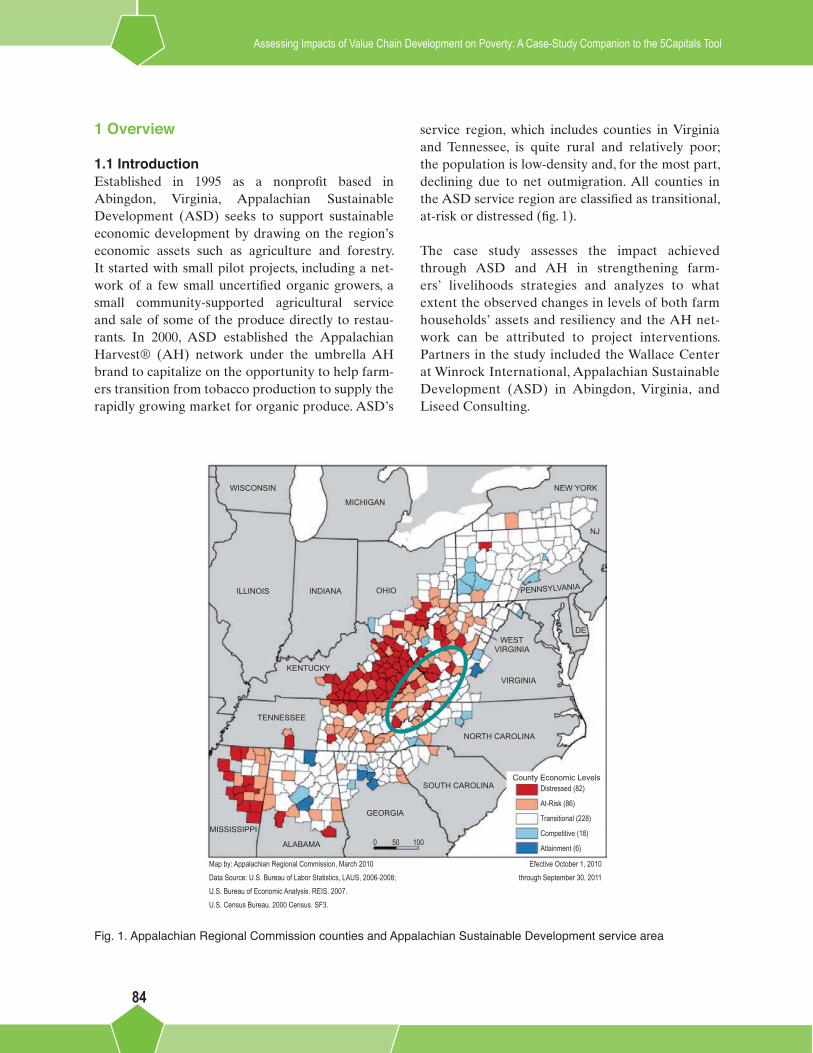
84
Assessing Impacts of Value Chain Development on Poverty: A Case-Study Companion to the 5Capitals Tool
1 Overview
1.1 IntroductionEstablished in 1995 as a nonprofit based in Abingdon, Virginia, Appalachian Sustainable Development (ASD) seeks to support sustainable economic development by drawing on the region’s economic assets such as agriculture and forestry. It started with small pilot projects, including a net-work of a few small uncertified organic growers, a small community-supported agricultural service and sale of some of the produce directly to restau-rants. In 2000, ASD established the Appalachian Harvest® (AH) network under the umbrella AH brand to capitalize on the opportunity to help farm-ers transition from tobacco production to supply the rapidly growing market for organic produce. ASD’s
service region, which includes counties in Virginia and Tennessee, is quite rural and relatively poor; the population is low-density and, for the most part, declining due to net outmigration. All counties in the ASD service region are classified as transitional, at-risk or distressed (fig. 1).
The case study assesses the impact achieved through ASD and AH in strengthening farm-ers’ livelihoods strategies and analyzes to what extent the observed changes in levels of both farm households’ assets and resiliency and the AH net-work can be attributed to project interventions. Partners in the study included the Wallace Center at Winrock International, Appalachian Sustainable Development (ASD) in Abingdon, Virginia, and Liseed Consulting.
Fig. 1. Appalachian Regional Commission counties and Appalachian Sustainable Development service area
WISCONSIN
MICHIGAN
NEW YORK
NJ
PENNSYLVANIA
DEWEST
VIRGINIA
VIRGINIA
NORTH CAROLINA
SOUTH CAROLINA
GEORGIA
ALABAMA
MISSISSIPPI
TENNESSEE
KENTUCKY
OHIOINDIANAILLINOIS
County Economic LevelsDistressed (82)
At-Risk (86)
Transitional (228)
Competitive (18)
Atlainment (6)0 50 100
Map by: Appalachian Regional Commission, March 2010Data Source: U.S. Bureau of Labor Statistics, LAUS, 2006-2008;U.S. Bureau of Economic Analysis. REIS. 2007.U.S. Census Bureau. 2000 Census. SF3.
Efective October 1, 2010through September 30, 2011

85
Building a value chain for organic vegetables with smallholders in Appalachia, United States
Though there is considerable potential in terms of the agricultural productivity and fast-growing demand for organic produce, the political and socio-economic situation is challenging, with cultural and social reluctance to take on risk and make changes and/or a distrust of outside organizations that can make working together difficult. Tight economic circumstances contributes to resistance by many farmers to change production away from crops and techniques they know.
1.2 Value chain development Interventions for the development of a value chain for organic vegetables were channeled through the AH program (fig. 2). AH, with the support of ASD, operates as both a service provider and upstream business-processing and marketing chain actor. A feasibility study conducted early in the project indi-cated that conditions in the region were appropriate for the production of organic produce and that mar-ket potential with regional wholesale supermarkets existed. However, the area lacked experience with organic production and the infrastructure for aggre-gation, washing and grading to meet rigorous retail market requirements.
At the grower level, ASD focused on building local organic food systems mainly through
• technical assistance for organic transition and production
• farmer support through the network•group certification umbrella•education and outreach programs•creation/support of regional farmers’ markets
•Healthy Family/Family Farms project, which purchases seconds from local farmers for local food banks
For the upstream enterprise, ASD created the AH label and a profit-oriented (or cost-recovery) local enterprise to buy organic produce grown by the AH network farmers and provide processing facil-ities, transport and logistics to wholesale markets, including:
• technical support to meet stipulated quality requirements
•centralized infrastructure for aggregation and washing/grading facility
•marketing under the umbrella AH certified brand of fresh local organic produce to retail markets
• transport and logistics from aggregation hub
The project aimed to create alternative, higher-value markets for farmers to help increase farm income and diversify into growing markets. In addition, creation of a community-based, value-adding infrastructure was seen as key to durable local wealth. The ASD intervention provided market-based incentives for sustainable production practices intended to increase biodiversity and rebuild soil health and fertility and reconnect consumers to the sources of their food.
During the study period, ASD received grants and soft loans totaling about US$1.5 million directed to the agriculture program, with much of the staff costs shared with the ASD forestry program, which ASD ended in 2010. Grants came primarily from private foundations but also from state and federal govern-ment programs (see section 4.4).

86
Assessing Impacts of Value Chain Development on Poverty: A Case-Study Companion to the 5Capitals Tool
2 MethodologyAssessment was based on the 5Capitals tool for value chain evaluation.2 The tool’s focus is on the livelihoods assets concept, looking at natural, human, social, physical and financial capitals. Based on its value chain experience, the Wallace Center at Winrock International selected ASD from a pool of six potential cases. The methodology relied on ASD financial and sales reports, donor grant evaluation reports, interviews with key informants, research carried out by other evaluators and buyers and household-level surveys. The assessment was car-ried out between July and December 2010. ASD staff provided access to organizational documents, grower lists, stakeholder lists and access to docu-ments prepared for an ongoing strategic planning process.
2.1 Characterizing the interventionThe first step was to identify the intervention’s intended changes (the theory of change), including overall goals, strategies to meet these goals, potential outcomes and impacts. The ASD theory of change (fig. 3) was formulated based on the project logic model from past grant evaluation reports prepared for various donors. Information collected from ASD, key informants and secondary research identified the interventions and chain actors.
Assumptions about long-term viability and how the change occurs included:
•growers remain in program•supply grows through expansion of existing
growers or entrance of new growers •price premiums offset higher production costs •continued growth in demand for AH products
2 Donovan, J; Stoian, D . 2012 . 5Capitals: a tool for assessing the poverty impacts of value chain development. Turrialba, CR, CATIE, 70 p . (Technical Series 55, Rural Enterprise Development Collection no . 7) .
Fig. 2. The role of the AH program in the value chain for organic vegetables, 2010
Inputs (upstream) Farmers 2010 Processing, Aggregation and Distribution Markets 2010
Number Not identified 40‒45 active organic farmers 1 PAD, 1 aggregation hub
31 accounts with 600-plus outlets, 2 food banks
Location Dispersed Southwest Virginia, Eastern Tennessee Duffield, Lynchburg, Virginia Regional
(East Coast)
Characteristics No economies, ad hocOrganic certification requires segregation, processing only organic
10% of buyers make up 90% of sales
ASD supportConsolidated purchase of organic soil, research collaboration
Technical assistance, partners with technical assistance providers
Own facilityMarketing and sales force, support
ASD Certified Organic PAD Processing,
Aggregation Distribution
Wholesale Markets
Organic Farmers
Inputs: soil
seeds

87
Building a value chain for organic vegetables with smallholders in Appalachia, United States
The sample frame was designed in this phase in order to test the theory of change during data collec-tion phases. Several months into the project, a clean list of growers identified only 41 members instead of the 100 anticipated at the outset, with the difference due to missing information on growers and gaps in records because of moves and a fire. The decision was made to survey 100% of these growers.
2.2 Identifying the political, legal and market context In this step, interviews with experts (technical assistance providers, academicians, etc.), Internet research, market reports and primary research identified a number of context factors influencing the outcomes of the intervention. A professional researcher was contracted to assist in accessing sev-eral national, state and local government databases for important background data. This information was used to adjust the household-level survey and provided important context for the analysis of household-level information.
Fig. 3. Appalachian Sustainable Development theory of change
2.3 Identifying changes for the upstream enterprise levelUnderstanding the changes for ASD as a NGO facil-itator is important for scaling up the intervention and for its pivotal role in the livelihood strategies of the AH network growers. Organizational source documents and donor evaluations and interviews with key stakeholders from the assessment provided data on the changes in asset endowments, income flows and institutional arrangements (e.g., contracts, requirements, risk/benefit sharing mechanisms) at ASD for the 2006–2010 time frame. Eight of the 12 wholesale buyers who make up 90% of the sales were interviewed.
2.4 Identifying changes at the household level The 5Capitals household questionnaire sample was reviewed and refined based on the context analysis and feedback from ASD staff and then pretested with three organic growers of mixed produce in the Appalachian region of Kentucky, providing valuable feedback on the tool. While these farmers did not
External factors• Political-legal context• Marketing context• Other interventions
Inputs• Grants• Loans• Technical• Assistance• Knowledge• Staff
Resources applied
Market Development
Market Education
Product Development
Production Distribution
Strategies
Set of activities to achieve objectives
and goals
Outputs• Expand
markets• Increase
public support
• Expand food product lines
• Improve production, processing and distribution
Short-term changes
directly caused by activities, deliverables
Outcomes• Changes in
assets
Short- and medium-term changes
that are the result of the outputs. Also
known as results
Impacts• Healthy and
food-secure communities
• Environment• Sustainable
livelihoods• Business
viability
Long-term effects: improved
conditions or change in status

88
Assessing Impacts of Value Chain Development on Poverty: A Case-Study Companion to the 5Capitals Tool
participate in the AH network and did not sell to retail buyers, their input permitted a cost-effective testing of environmental and socioeconomic ques-tions in the US context.
The adjusted sample framework included interviewing all current producers. Of the 41, 33 were AH-certified organic produce growers; the rest were free-range egg producers New methodological challenges appeared with data showing a high turnover rate in the AH net-work: 54% of all network members had two years or less in the program and average turnover over the past five years was 57%. So the case study team decided to use a qualitative approach, maintaining the live-lihood asset approach. Two main groups of growers were identified: 1) older, traditional farmers looking to transition into higher-value organic markets and 2) newer, idealistic growers looking to connect with their sustainability values. The household survey was conducted with nine growers through in-person inter-views lasting one and a half to two hours. Because of the high turnover rate, outreach to ex-network mem-bers involved 20-minute telephone interviews with four growers. ASD reviewed the shorter survey to understand why the intervention was not viable for these growers.
2.5 Analysis and identification of outcomes and impacts Information collected in the previous steps was ana-lyzed to determine 1) the changes in assets among grower households and ASD and the contribution of the intervention in bringing about the changes and 2) the intervention’s overall impact on well-being among households and long-term business viability of ASD.
3 Context analysis
Assessments are context specific, related to the mar-ket, political and cultural conditions in which ASD actors operate. These factors are often outside the control of the actors involved in the value chain. Areas of interest for the analysis include government policies related to the production and marketing of AH products, supply and demand for AH products
and prices for key inputs (for example, fertilizers) that can operate as barriers or contribute to the success of value chain development. A good under-standing of the context provides important input for adjustment of the assessment tool.
3.1 Political-legal context Laws and regulations at local, national and interna-tional levels affect the production and marketing of certified organic produce in the United States.
3.1.1 Organic certification and policiesHistorically, a diversity of organic standards and cer-tification existed in the United States. In 2002, the National Organic Program standards, administered by the US Department of Agriculture (USDA), took effect, regulating any product sold as certi-fied organic in the country. The existence of such standards for organic production and processing has allowed more conventional food companies to create organic product lines and enter the market, including private store brands.
Most US public programs that promote/facilitate production of organic products are funded directly or indirectly by the Food, Conservation and Energy Act (Farm Bill) The 2008 Farm Bill was the first to specifically address horticulture and organic agri-culture and significantly increased funding, nearly quadrupling government spending on organic agriculture, research and certification programs. However, total organic funding still makes up only about 1% of the 2008 Farm Bill budget.
3.1.2 Land tenure and credit Land tenure and availability of credit were less of an issue for these farmers than in developing countries. Credit through multiple sources, including credit cards, has been fairly accessible for regional grow-ers until the recent recession. Equipment costs were generally financed at low interest rates by the manu-facturer. Tighter overall credit in the past two years was not specific to farmers.
3.1.3 BarriersThe main barriers identified in the study include lack of infrastructure in rural economies, limited access to

89
Building a value chain for organic vegetables with smallholders in Appalachia, United States
crop insurance for diversified, small- to mid-size pro-ducers, and agricultural labor immigration policies.
Agriculture is a risky business, depending on fac-tors beyond the planning or control of growers. To address this, the USDA-Risk Management Agency (RMA) Federal Crop Insurance protects a farmer against production or revenue losses due to speci-fied reasons. The insurance policies are sold and serviced by private companies that have developed programs/products geared mostly to large-scale commodity crops. Even when they can access insur-ance, organic farmers face higher premiums and claims are paid out based on the value of conven-tionally grown crops, not the higher organic value. Not only is there no safety net in the event of yield reductions from weather, crop disease or insects, but lenders are wary of working with growers of nontra-ditional commodities if they have no guarantee of some minimum income level. For the ASD region, there were no organic revenue insurance policies for the crops grown by AH network producers.
Employment and labor laws and tax and other legal requirements were a major barrier for growers’ tak-ing on hired labor, legal or otherwise. Insurance, disability and social security costs added about 35% to costs. For migrant workers, housing had to be pro-vided. While immigrant and migrant labor has never been high in the ASD region, the recent economic downturn and immigration reform significantly reduced the option of using immigrant agricultural labor; costs far outweighed incremental potential sales. ASD growers found it hard to find extra help from local labor in peak seasons due to the unat-tractiveness of agriculture jobs (hard physical labor, seasonal employment, bad weather, few long-term prospects).
3.1.4 PopulationThe ASD service area consists mostly of sparsely populated counties—only two in Tennessee had a
population greater than 100,000. In Virginia, only Washington County had a population greater than 50,000. Population in the service region has been declining—more than 10% since 2000 in some parts. However, from 2000 to 2007, both Tennessee and Virginia had overall population growth that exceeded the US average.3 This suggests that county popu-lations in the ASD service area were declining for reasons apart from statewide economic conditions or other trends—limited economic opportunities likely contributed to the shift. This population decrease points to a rural brain-drain where educated young people leave the region in search of employment. This could affect ASD’s ability to recruit young, new growers, important since such producers have been crucial to the success of other programs promoting organic techniques elsewhere in the country.
Ethnically, the service region was more than 90% white. The median age was in line with state aver-ages: between 36 and 41.3 for men and 39.7 to 44.9 for women. By contrast, the average age of principal operators of farming operations was between 57 and 58.5 years,4 mirroring national agricultural labor force trends. Older farmers may be less inclined to adopt new techniques and practices such as those required to obtain certification under the ASD program.
3.1.5 Tobacco Settlement AgreementHistorically, tobacco was a major contributor to the region’s economy. A federal quota and price support system established in the 1930s during the Great Depression guaranteed its role in the economy for income and jobs. Tobacco was heavily promoted in the region over the next 50 years. When the price support system between tobacco corporations and states were disbanded in 1998, production fled overseas. Since 2002, the total acreage in tobacco production decreased in the ASD service area from 13,687 to 4,187 acres.5 Further tobacco reduc-tion could present added opportunities for AH to increase participating acreage.
3 RUPRI (Rural Policy Research Institute). www.rupri.org/Data & Resources—State Profiles, online searchable database. Accessed January 7, 2011.
4 US Census Bureau. 2010. Census Data.
5 USDA National Agricultural Statistics Service. 2002, 2007. Census of Agriculture.
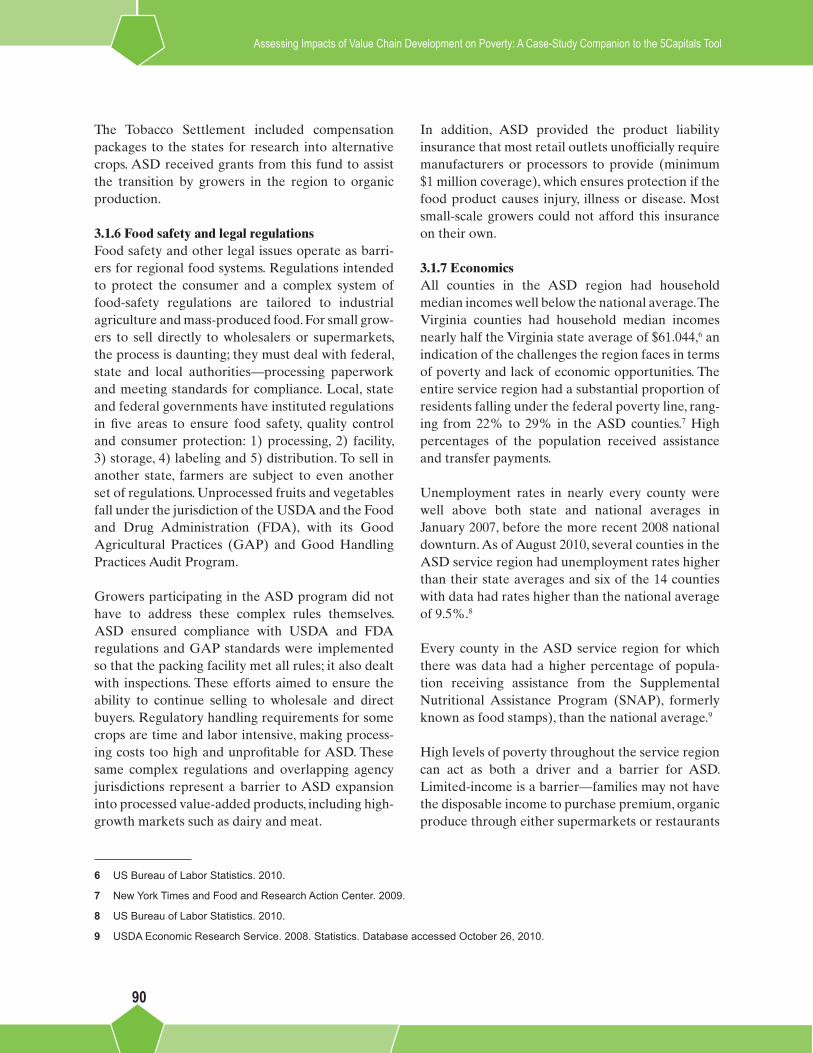
90
Assessing Impacts of Value Chain Development on Poverty: A Case-Study Companion to the 5Capitals Tool
The Tobacco Settlement included compensation packages to the states for research into alternative crops. ASD received grants from this fund to assist the transition by growers in the region to organic production.
3.1.6 Food safety and legal regulationsFood safety and other legal issues operate as barri-ers for regional food systems. Regulations intended to protect the consumer and a complex system of food-safety regulations are tailored to industrial agriculture and mass-produced food. For small grow-ers to sell directly to wholesalers or supermarkets, the process is daunting; they must deal with federal, state and local authorities—processing paperwork and meeting standards for compliance. Local, state and federal governments have instituted regulations in five areas to ensure food safety, quality control and consumer protection: 1) processing, 2) facility, 3) storage, 4) labeling and 5) distribution. To sell in another state, farmers are subject to even another set of regulations. Unprocessed fruits and vegetables fall under the jurisdiction of the USDA and the Food and Drug Administration (FDA), with its Good Agricultural Practices (GAP) and Good Handling Practices Audit Program.
Growers participating in the ASD program did not have to address these complex rules themselves. ASD ensured compliance with USDA and FDA regulations and GAP standards were implemented so that the packing facility met all rules; it also dealt with inspections. These efforts aimed to ensure the ability to continue selling to wholesale and direct buyers. Regulatory handling requirements for some crops are time and labor intensive, making process-ing costs too high and unprofitable for ASD. These same complex regulations and overlapping agency jurisdictions represent a barrier to ASD expansion into processed value-added products, including high-growth markets such as dairy and meat.
In addition, ASD provided the product liability insurance that most retail outlets unofficially require manufacturers or processors to provide (minimum $1 million coverage), which ensures protection if the food product causes injury, illness or disease. Most small-scale growers could not afford this insurance on their own.
3.1.7 EconomicsAll counties in the ASD region had household median incomes well below the national average. The Virginia counties had household median incomes nearly half the Virginia state average of $61.044,6 an indication of the challenges the region faces in terms of poverty and lack of economic opportunities. The entire service region had a substantial proportion of residents falling under the federal poverty line, rang-ing from 22% to 29% in the ASD counties.7 High percentages of the population received assistance and transfer payments.
Unemployment rates in nearly every county were well above both state and national averages in January 2007, before the more recent 2008 national downturn. As of August 2010, several counties in the ASD service region had unemployment rates higher than their state averages and six of the 14 counties with data had rates higher than the national average of 9.5%.8
Every county in the ASD service region for which there was data had a higher percentage of popula-tion receiving assistance from the Supplemental Nutritional Assistance Program (SNAP), formerly known as food stamps), than the national average.9
High levels of poverty throughout the service region can act as both a driver and a barrier for ASD. Limited-income is a barrier—families may not have the disposable income to purchase premium, organic produce through either supermarkets or restaurants
6 US Bureau of Labor Statistics. 2010.
7 New York Times and Food and Research Action Center. 2009.
8 US Bureau of Labor Statistics. 2010.
9 USDA Economic Research Service. 2008. Statistics. Database accessed October 26, 2010.

91
Building a value chain for organic vegetables with smallholders in Appalachia, United States
that source locally. As a driver, the high poverty and unemployment rates may serve as an incentive for growers to seek additional value streams for their products and thus increase interest in the AH program.
3.2 Market context, organic and certified organic agriculture The region of the ASD growers reflects primarily a rural lifestyle and agriculture plays an important role in the area’s socioeconomics. The relatively low population densities often mean that accessing new markets—such as wholesale or retail markets for organic produce—requires looking outside the ser-vice region.
Products sold through AH represented a small, niche market within the overall agricultural landscape of the service region. The average organic-certified farm was 3 acres, with only two farms having more than 6 acres.10 The small amount of agricultural acre-age under certification suggests that there was not a strong local market for certified produce or that the strength of the local market was not significant enough to overcome barriers to certification for indi-vidual producers. The small size and limited number of certified farms severely limited ASD’s ability to respond to a growing demand with consistent supply and to scale up or reach economies of scale with the central processing facility.
ASD growers’ products were sold almost exclusively to retail supermarket chains and had to meet buyer quality specifications on uniform size, color and lack of defects. Supermarket buyers generally followed USDA grading standards, with several retailers using standards that exceed the USDA’s. If quality speci-fications were not upheld, buyers generally refused the load at ASD expense.
There was usually a minimum volume and frequency to maintain a consistent supply of uniform prod-ucts. Some sales were direct but most were through
centralized distribution outlets, requiring ASD to ensure that its temperature- and humidity-controlled trucks were compatible with the buyer’s warehouse docks.
Written or verbal contracts and longstanding, service-oriented relationships between buyers and growers have become more common in the marketplace. Contracts can protect growers from fluctuating prices on the open market, reducing the price risk. However, ASD and its buyers had no writ-ten contracts, operating on verbal contracts based on trust that usually included specific terms regarding expected volumes, quality expectations, service per-formance and fee payments. Daily communication between ASD and buyers during the growing season was common for these sales arrangements.
Market requirements changed little over the study period. The supermarkets’ high aesthetic standards continued to be a major challenge to ASD growers, with some farmers interviewed estimating rejection of up to 60% of their products. These “seconds” were sometimes sold to alternative markets, such as for salsas or salad bars, or at cost to food banks, with significant reductions to producer income.
Prices paid to ASD by buyers reflected general fluctuations in organic produce market prices, with no identifiable market trends. Price premiums for organic products typically command 10% to 40% more than for similar conventionally produced products.11 ASD products continued to be more than conventional counterparts at the retail level.
On the cost side, bringing land into organic pro-duction is costly, often requiring either that fields lay fallow or be farmed organically for three years before marketing yields as organic. Organic farm-ing methods also tend to be labor and management intensive and have long been associated with small farms and family labor. Management of a certified organic farm is generally more intensive than on a
10 USDA Economic Research Service. 2008. Statistics. Database accessed October 26, 2010.
11 Winter, CK; Davis, SF. 2006. Organic foods, Journal of Food Science 71(9):R117–R124.

92
Assessing Impacts of Value Chain Development on Poverty: A Case-Study Companion to the 5Capitals Tool
conventional farm, with farmers walking their fields daily and hand weeding or using small tools. Standard farm equipment is typically used only larger-acreage organic farms. The market for organic inputs such as seeds, transplants and winter crops is relatively lim-ited, which can increase the costs for growers. High labor and management costs are partially offset by reduced inputs (chemicals, water, energy).
An emerging issue in the organic sector is the potential competition from new labels such as the “locally grown” label. Most market channels men-tioned are quickly expanding their local produce, considered one of the fastest growing food markets in the United States because of interest in support-ing local economies/communities, freshness of food and food safety concerns. In many cases, local prod-ucts are not organically certified, simply defined as sourced within a specific geographical range. As with farmers’ markets, this can increase opportunities for small-scale organic growers but can also undermine organic certification and the ASD supply pipeline.
3.3 Market structures3.3.1 Mainstream market outletsDuring the study period, market pathways for organic shifted significantly. Previously considered the domain of small local farmers and independent natural food stores, organic produce is now widely available under mainstream store brands in stores such as Kroger and Safeway, with the bulk of organic sales today in retail chains, clubs and regular super-markets. Since entering the market in 2006, Walmart is now the top seller of organics in the United States, which has the potential to push prices down through its economies of scale and cheaper imports.
Since organic farming tends to be labor intensive, developing countries with lower farm labor costs may have a competitive advantage for some organic products. Large supermarkets already have these global supply chains in place.
3.3.2 Growth in farmers’ marketsNationally and in the ASD region, farmers’ markets have experienced a resurgence over the study period, partly due to the local food movement and to federal
Farm Bill support programs. Farmers’ markets offer an attractive alternative for growers to sell directly to consumers, where the highest percentage of the retail price remains with the grower and quality stan-dards/requirements are more flexible. Costs involve transportation to the markets and nominal annual fees. ASD has a farmers’ market program that has been instrumental in increasing local markets in the region from two to 16. These markets require a sub-stantial time commitment by the farmer since some require regular participation to maintain a regular “spot” and the small size of most means the grower must participate in one or more several times a week during the harvest season.
Though farmers’ markets could be seen as compet-ing for AH supply, for ASD growers, volume is much lower than selling into mainstream markets and the time selling/marketing is much higher. It can be an excellent complementary value chain development strategy for selling products that do not meet the rig-orous supermarket quality requirements.
4 Changes in business assets
ASD was the only directly local enterprise engaging directly with ASD growers (fig. 4). It offered:
• focus on retail supermarkets as a leverage point•centralized aggregation, processing, transporting
and contracting•marketing staff that works closely with buyers
There were no dedicated input providers or part-nership arrangements with input providers such as banks or organic seed or soil providers due to the different needs and geographical dispersion of the growers. In ASD’s early years, organic inputs, par-ticularly seedlings, were not available in the region, so ASD made bulk purchases and sold them at cost. ASD encouraged network members to take on this business opportunity and initially nine growers pro-duced organic seedlings and transplants as a new income source. In the study period, organic inputs were more readily available through other outlets though supply was limited, particularly in small quantities at affordable prices, so costs could be
93
Building a value chain for organic vegetables with smallholders in Appalachia, United States
relatively high for a new farmer. ASD in this period only made bulk soil purchases for the network but encouraged network members to coordinate bulk purchases for better prices and reduced transport costs. As mentioned, ASD had no written contrac-tual relationships with retail buyers, nor did buyers offer opportunities for increased benefits, such as loans to growers.
In 2010, ASD had a modern facility located in Duffield, Virginia, with cooling, storage and several processing lines. At the end of the harvest season, there were 41 members of certified organic produce and free-range eggs. Demand exceeded supply by more than 200%. ASD maintained food product liability insurance, administered and maintained the group organic certification and owned the trucks for shipping to buyers.
A 2005 study changed the AH core strategy to a retail focus, so the period chosen for VCD assess-ment was 2006–2010. The following presents the current asset endowment (human, social, physical and financial) of ASD and the AH program, changes
OrganicFarmers
ASDCertified OrganicPAD (processing
aggregationdistribution)
“Sustainable” FarmersConventional Farmers
Inputs:soil,seeds
Wholesale:SupermarketsFood service Institutions
Direct: CSAs,farmers’ markets, restaurants
Segregated
Community grants
Farm
Products
Technicalassistance
Communityeducation
Research institutions (3)
Food banks
in these assets over the study period and factors that influenced these changes. Some numbers, which are noted, reflect a different time period due to unavail-ability of some data points.
4.1 Human capitalThe ASD staff as of December 2010 included 4.25 full-time equivalents (FTE) working in the AH program (managers for business, the facility, mar-keting and sustainable agriculture and a part-time agricultural education coordinator). During harvest, the AH facility hired an average of five additional workers, with up to 10 seasonal workers during peak days. The ASD financial manager and executive director provided the program administrative and strategic support. Five years ago, the AH program shared ASD staff and part-time and seasonal help. Several large grants in 2005 and 2006 enabled the program to hire dedicated staff to scale expansion into wholesale markets. The business manager was hired in 2006, shared with the forestry program. The full-time farmer support position came on in 2007. The hiring of a full-time facilities manager and mar-keting and sales manager in 2005 was instrumental
Fig. 4. Map of the ASD value chain for vegetables from Appalachia, including the principal chain for organic produce and ramifications for conventional and (nonorganic) “sustainable” produce
94
Assessing Impacts of Value Chain Development on Poverty: A Case-Study Companion to the 5Capitals Tool
to expanding the wholesale packing and distribution facility as well as recruiting and building the retail buyers network. With grant support, ASD installed a computerized system for tracking and account-ing, resulting in major improvements in inventory management and processing of grower payments. A full-time financial manager was hired in the past year and ASD switched to a more robust organizational accounting system, which will also help to monitor and analyze business data.
Staff turnover has been minimal, with a planned transition of the founder and executive director for 14 years made in 2009. The facility manager left toward the end of the 2010 harvest season but was replaced with an experienced manager.
The ASD staff was among its most valuable assets: growers, buyers and other stakeholders interviewed all pointed to dedicated and knowledgeable staff as the main reason for working with AH. Some buyers acknowledged that overstretched staff was an issue in responsiveness and a limiting factor in expanding the supply and staff reported working long hours and facing competing demands.
AH is a network, with no grower participation in aspects of the AH program local enterprise, nor are there any forms of grower committees.
4.2 Social capitalThe social capital of ASD was the strength of its linkages with growers and buyers of AH products, as well as the service providers, community and public institutions providing support to ASD. AH is a regional food system network and important to ASD, its members and the community in terms of increasing access to healthy, local foods. ASD man-aged both the independent supply and demand side. Most food processors/distributors manage one end of the supply chain or the other but are not respon-sible for both.
Relations with growers. On the producer side, the ASD network helped its members
•gain access to larger, premium-priced markets
•achieve consistency and quality control to reduce waste and increase price
•reduce risk: learn new production practices and marketing standards
•build a market presence for regional products•provide group certification
The group certification maintained by ASD not only provided a valuable low-cost service but created an important bond. Growers certified under AH were prohibited from marketing their product as organic certified in other markets, preventing leakage to alternative high-value markets. Few growers opted for independent certification due to costs (US$750–US$2,000 average in the region) and administrative requirements. This was shifting as government funds became available to offset up to 75% of costs, mak-ing group versus individual certification the same net cost to growers. While this gave growers more options, the risk would be to weaken the network bond. Only one grower had changed certification type so far. Selling directly to buyers and consum-ers (farmers’ markets) as organically certified was only possible for growers who managed their own individual certification. The benefits included higher margins and sales of seconds. However, the lower volumes and high time investments associated with farmers’ markets made this more of a complemen-tary strategy. Direct selling to other markets would also require marketing and sales time, liability insur-ance and regular, consistent-quality volumes.
A persistent challenge for ASD was recruiting and maintaining members committed to consistently and effectively produce for AH wholesale mar-kets. Turnover during the period averaged close to 60% (table 1), in which some of the numbers were inconsistent with donor or project reports but were based on accounting records and the assessor’s best estimate, with triangulation through interviews with ASD staff and farmers).
ASD invested in member recruitment through out-reach and education programs including workshops, conferences and farm tours. During the study period, ASD held or participated in almost 150 conferences, farms tours and workshops, reaching close to 2,700
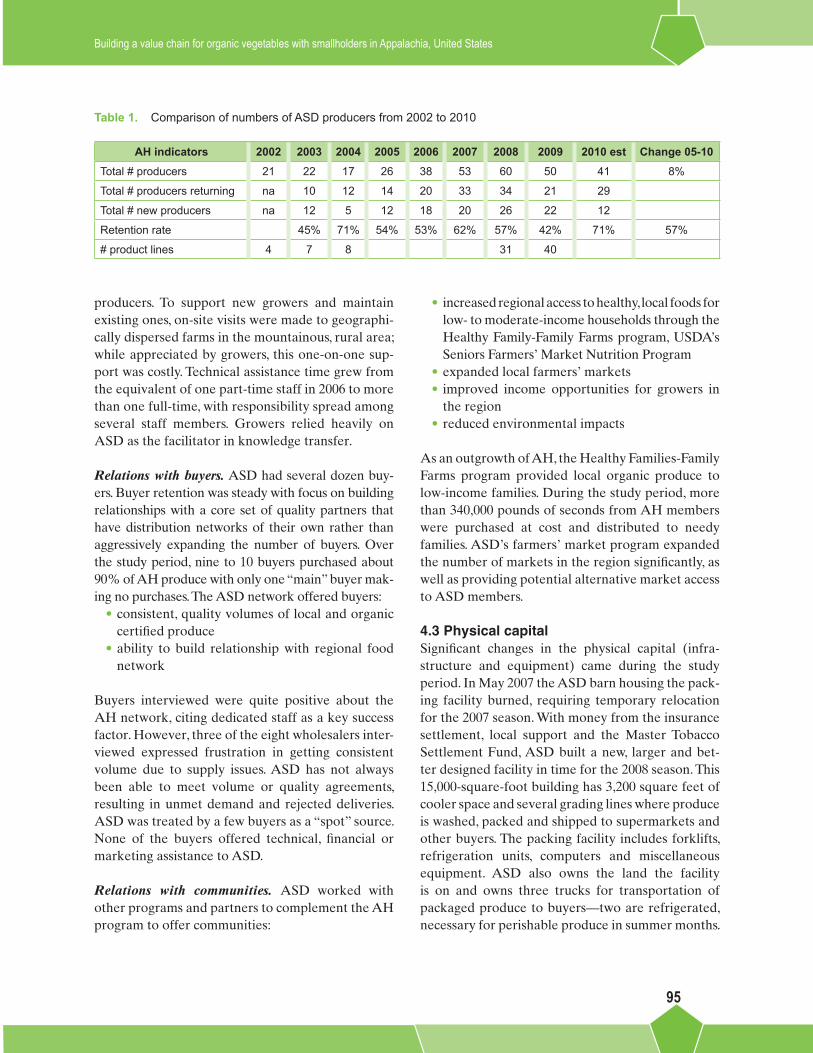
95
Building a value chain for organic vegetables with smallholders in Appalachia, United States
producers. To support new growers and maintain existing ones, on-site visits were made to geographi-cally dispersed farms in the mountainous, rural area; while appreciated by growers, this one-on-one sup-port was costly. Technical assistance time grew from the equivalent of one part-time staff in 2006 to more than one full-time, with responsibility spread among several staff members. Growers relied heavily on ASD as the facilitator in knowledge transfer.
Relations with buyers. ASD had several dozen buy-ers. Buyer retention was steady with focus on building relationships with a core set of quality partners that have distribution networks of their own rather than aggressively expanding the number of buyers. Over the study period, nine to 10 buyers purchased about 90% of AH produce with only one “main” buyer mak-ing no purchases. The ASD network offered buyers:
•consistent, quality volumes of local and organic certified produce
•ability to build relationship with regional food network
Buyers interviewed were quite positive about the AH network, citing dedicated staff as a key success factor. However, three of the eight wholesalers inter-viewed expressed frustration in getting consistent volume due to supply issues. ASD has not always been able to meet volume or quality agreements, resulting in unmet demand and rejected deliveries. ASD was treated by a few buyers as a “spot” source. None of the buyers offered technical, financial or marketing assistance to ASD.
Relations with communities. ASD worked with other programs and partners to complement the AH program to offer communities:
Table 1. Comparison of numbers of ASD producers from 2002 to 2010
AH indicators 2002 2003 2004 2005 2006 2007 2008 2009 2010 est Change 05-10Total # producers 21 22 17 26 38 53 60 50 41 8%
Total # producers returning na 10 12 14 20 33 34 21 29
Total # new producers na 12 5 12 18 20 26 22 12
Retention rate 45% 71% 54% 53% 62% 57% 42% 71% 57%
# product lines 4 7 8 31 40
• increased regional access to healthy, local foods for low- to moderate-income households through the Healthy Family-Family Farms program, USDA’s Seniors Farmers’ Market Nutrition Program
•expanded local farmers’ markets• improved income opportunities for growers in
the region•reduced environmental impacts
As an outgrowth of AH, the Healthy Families-Family Farms program provided local organic produce to low-income families. During the study period, more than 340,000 pounds of seconds from AH members were purchased at cost and distributed to needy families. ASD’s farmers’ market program expanded the number of markets in the region significantly, as well as providing potential alternative market access to ASD members.
4.3 Physical capitalSignificant changes in the physical capital (infra-structure and equipment) came during the study period. In May 2007 the ASD barn housing the pack-ing facility burned, requiring temporary relocation for the 2007 season. With money from the insurance settlement, local support and the Master Tobacco Settlement Fund, ASD built a new, larger and bet-ter designed facility in time for the 2008 season. This 15,000-square-foot building has 3,200 square feet of cooler space and several grading lines where produce is washed, packed and shipped to supermarkets and other buyers. The packing facility includes forklifts, refrigeration units, computers and miscellaneous equipment. ASD also owns the land the facility is on and owns three trucks for transportation of packaged produce to buyers—two are refrigerated, necessary for perishable produce in summer months.

96
Assessing Impacts of Value Chain Development on Poverty: A Case-Study Companion to the 5Capitals Tool
Initially ASD contracted out the logistics, but lack of control created problems getting fresh produce to markets in a timely manner. By the end of the assess-ment period, ASD contracted drivers using the ASD trucks; it also owned a plastic mulch layer that was rented to producers at a nominal rate. The major investments in physical capital were made possible through grants from private foundations and public (federal and local) sources as well as loans.
The ASD processing facility, while a key asset to a region that lacks infrastructure, was vastly underuti-lized, with one grading line never used and the warehouse only used for storage for a few egg ship-ments five months of the year. While staff could be a constraint during peak seasons, the physical capital was in place for major expansion of sales. Extending the growing seasons through greenhouses and hoop houses, as well as considering processing nonorganic (strictly segregated) products, could make better use of the physical assets.
To lower its carbon footprint, ASD has optimized transportation patterns, backhauled and transported non-AH products to improve truck utilization rates, created alternative income streams (shipping) and reduced food miles of product.
4.4 Financial capitalBoth ASD and the AH program operate on a tight budget with little margin to manage the economic downturn. Typical of a nonprofit social entrepre-neur, ASD invested in fixed assets, partially financed through debt,12 making it essentially asset rich and cash poor. The ASD hybrid business model con-sists of earned income, donations and loans. Income was generated through a percentage charged on all AH sales: 27% for pregraded produce and 35% for ungraded produce.
Historically ASD’s accounting system did not sepa-rate AH income and expenses, so the financials are based on ASD as a whole, not just the AH program, unless otherwise stated. Earned income covered
about one-third of the 2010 operating budget—the rest coming from grants, loans and sale of assets.
Expenses increased 35% in these years, but rev-enues grew less than 10% (fig. 5)—amounts are not adjusted for inflation. Total grants and loans received for the agriculture and forestry program from 2004 to 2010 grants was about $4.8 million. Of this amount, approximately $1.5 million was iden-tified directly for the agriculture program. Grants came primarily from private foundations but also from state and federal government programs, includ-ing various USDA programs for rural development, specialty crops and resource management programs, and state funds from the tobacco settlement.
The funding model during the assessment was overly dependent on grants and did not cover operating costs. In 2010, ASD closed its forestry social enter-prise and was selling off its assets to cover funder agreements, liabilities, deficits and day-to-day oper-ating expenses. ASD was operating with negative liquid net assets, making it vulnerable.
Sales increased 40% during the study period; how-ever, major investments in staff, infrastructure and other capital were made. The stated intention in various strategy documents was to break even from earned income within the next year or two. This break-even sales point, where sales revenues cover operating costs, was estimated conservatively by the business manager to be US$700,000. Since startup, ASD has struggled to meet demand or reach break-even volumes (fig. 6).
Staff salaries, farmer markets sales and ASD mem-ber sales all had positive impact on the financial assets of the local economy. Farmers’ market sales were not tracked. Accurate member sales figures were not available due to changes in accounting sys-tems and the 2008 fire, but an indication based on AH gross sales and a 35% commission showed the extra income generated through AH sales was close to $2 million from 2005 to 2010. Given a multiplier
12 Based on ASD financial reports, however, the business manager stated that this information was inaccurate and no assets were financed by debt. Additional clarifying information was not made available.

97
Building a value chain for organic vegetables with smallholders in Appalachia, United States
of 1.5–3 for the number of times locally generated income circulates within the local economy, impact on community assets could have reached US$2.6 to US$5.2 million (table 2).
ASD acquired several soft loans for the AH program through nonprofit community development financial institutions (CDFIs) and county development funds. During the study period, according to ASD financial records, the organization had loans for land and con-struction (warehouse, storage facility) totaling some US$400,000. There were no repayment issues. ASD does not offer credit to its members.
5 Changes among growers
Since the household-level analysis is qualitative based on in-depth interviews, this section discusses several issues important to understanding key success factors, barriers and obstacles to creating
$0
$500
$1,000
$1,500
$2,000
$2,500
2005 2006 2007 2008 2009 2010
Revenue
Expenses
$ in thousands
$-
$100,000
$200,000
$300,000
$400,000
$500,000
$600,000
$700,000
$800,000
2002 2003 2004 2005 2006 2007 2008 2009 2010
ASD Gross SalesEstimated breakeven
$0
$500
$1,000
$1,500
$2,000
$2,500
2005 2006 2007 2008 2009 2010
Revenue
Expenses
$ in thousands
$-
$100,000
$200,000
$300,000
$400,000
$500,000
$600,000
$700,000
$800,000
2002 2003 2004 2005 2006 2007 2008 2009 2010
ASD Gross SalesEstimated breakeven
Fig. 6. AH sales and break-even, based on ASD financial records (not adjusted for inflation)
livelihood strategies that build assets and resiliency (all specific to AH network members). It presents a snapshot of the asset endowments of the households surveyed, plus insights into changes, opportunities and obstacles to strengthening asset building and resiliency.
As mentioned, there was a high turnover in growers, averaging close to 60% over the study period. Of the 41 members, 34% had been in the program for four years or longer, 12% for three years, 24% for two years and 29% for one year.
All current AH members were classified under the USDA system as small family farms (annual gross sales less than US$250,000), with only 7% earning more than US$10,000 in AH sales in 2010. Almost all were classified as retired or residential/lifestyle; only one member had farming as the main occupa-tion, though that farmer still relied on the spouse’s income and health insurance coverage.
Table 2. Impact of financial assets on local economy (US$)
2005 2006 2007 2008 2009 2010Total ASD gross sales 237,057 368,423 513,227 572,667 464,390 517,619
Estimated farmer sales 154,087 239,475 333,598 372,234 301,853 336,452
Local multiplier 1.5 231,131 359,212 500,397 558,351 452,780 504,678
Local multiplier 3x 462,261 718,425 1,000,793 1,116,701 905,560 1,009,356
Note: Values not adjusted for inflation
Fig. 5. ASD revenue and expenses based on ASD financial records

98
Assessing Impacts of Value Chain Development on Poverty: A Case-Study Companion to the 5Capitals Tool
Of the 41 growers, 33 were in produce and eight were egg producers. Of the 1,375 total acres, 107 were cer-tified organic—average organic farm was 2.6 acres. Average farm income in 2010 was US$18,436 and the median income from AH sales was US$1,400.
There were two main categories of ASD growers with different strategies and costs:
•experienced traditional farmers, including multi-generational farmers: conventional, commodity, livestock and/or former tobacco—generally older, low risk, not organic.
•new farmers—minimal experience, idealistic, no transition, often younger
The ASD experienced growers also had the larger farms, both in organic acreage and overall farm size. However, farm size was still small, averaging less than 35 acres overall and 2.61 acres organic certified.
The relatively larger farm size of traditional farm-ers was due to inherited land (multigenerational growers) and farming as a livelihoods strategy (as opposed to ideology or lifestyle), with various farm income streams in terms of production and seasonal
diversification, making them more resilient. Access to farmland was a barrier for beginning or landless farmers. In this mountainous region, good bottom-land for vegetables was limited and development initiatives competed for affordable land.
Even though farming was an important part of the livelihood strategy of the traditional farmer, most had full-time, off-farm employment or were retired, with pensions. All new farmers relied on off-farm employment.
Table 3 highlights some of the key characteristics of ASD growers interviewed. Though it cannot be con-sidered representative or a random sample, it does provide interesting insights. Only the growers who took part in grower meetings held on October 25 and November 8, 2010, participated, resulting in a high degree of self-selection.
5.1 Natural capitalOrganic production acreage grew from 48 to 107 acres over the study period, due mainly to ASD outreach and efforts to motivate growers to join the network and for existing growers to increase organic-certification acreage. However, this number conceals the turnover, averaging 60%, with almost the same number of producers in 2006 (38) as in 2010 (41). In 2010, the average total organic certified acreage was 2.61 acres, up from 1.26 acres in 2006 (table 4).
All farmers interviewed were maximizing sustain-able agriculture practices in their organic production, with 30% of the growers using their own compost almost exclusively, the rest using approved organic
Table 3. Characteristics of AH members interviewed
Number of qualitative interviews
9
Produce/eggs Produce
Average years in program 4.75
Average years farming
three 3rd- or 4th-generation farmers, remainder 6.5 years
Former tobacco farmers 44%
Average age principal operator 55
Median age principal operator 51
Gender, principal operator 67% male, 11% female, 22% joint
Small family farm USDAcategory
retired residential/lifestyle farming
2 6 1
Table 4. ASD grower organic acreage
Total AH members 2006 2010
Number AH produce/eggs 38 total 33 produce/ 8 eggs
Total AH organic certified acreage 48 107
Average AH member farm acreage 1.26 2.61

99
Building a value chain for organic vegetables with smallholders in Appalachia, United States
products. All used winter cover crops to improve soil fertility as well as reduced tillage, mulching, cover crops and buffer zones for soil conservation. Most have implemented drip irrigation systems. Soil and water samples were taken every year according to organic certification standards, allowing growers to monitor and implement practices to ensure quality.
5.2 Human capitalThe interviews indicated that ASD-provided tech-nical assistance, farm tours and workshops were instrumental in members’ acquiring skills needed to transition to organic, grow new crops and meet qual-ity requirements. ASD’s close work with research institutions and technical assistance providers has changed the service offering in the region. Half of those interviewed participated in field trials and all responded affirmatively to the survey questions:
•Were you able to apply (technical assistance) information/techniques?
•How is your capacity to respond to recommen-dations provided?
Interviewees reported that their most valuable rem-edies and advice come from other farmers, which means that farm tours, the peer-learning network and the fact that staff are farmers were critical suc-cess factors. With ASD staff stretched, strengthening the farmer mentor program will be an important investment.
Those interviewed had high education levels: 78% had a university degree. All had children, many already adults, most of whom either had a degree, currently attended a university or planned to do so. About 60% did not think any of their children would go into agriculture though a few hoped that at least one offspring would take over the family farm. Only one, a fourth-generation farmer, expressed confi-dence that his children would go into farming—but only “after they get a degree and get a real job first...for insurance and a safety net.” Participation in ASD did not seem to have contributed to a change in abil-ity to send children for higher education.
All interviewed had health insurance, primarily through their or their spouse’s off-farm employment,
with no change over the study period. Participation in ASD did not appear to have contributed to an ability to maintain health insurance.
Almost all producers listed labor, rather than land, as limiting expansion. Most labor was provided almost exclusively by the family. In light of the dependence of most on off-farm employment, farming was done on nights, weekends and vacation time. Key infor-mants and ASD staff indicated that few members hired labor. All interviewees expressed difficulties in getting local agricultural labor. Several farmers looked into migrant labor, but costs outweighed additional earnings, considering housing, benefits, transportation and other elements. Supervision of hired employees when the farmer works full-time was another issue. Currently the migrant labor in the ASD sample was hired through a contractor who dealt with administrative and legal paperwork.
Most ASD larger farms were included in the inter-view sample: three had full-time, part-time or migrant labor. The two farmers using full-time labor were the full-time farmer and a retired self-employed farmer.
5.3 Social capitalThe ASD network provided an important part of the growers’ social capital. Most farmers indicated they would not be producing organic and/or conven-tional produce if it were not for ASD. Satisfaction with technical assistance provided was high (4.2 on a scale of 1 to 5); overall satisfaction with participation in the ASD network was also high (4.2 on a scale of 1 to 5). An important asset for many growers was that ASD deals with buyers—several said they want to be farmers, not marketers.
Interviews indicated requests for technical assistance were always addressed. The questions related to dif-ficulties in the area of production and marketing elicited a range of responses with no specific pattern:
•end price ASD receives not enough•commission too high for farmer to be profitable •product selection (who decides what and how
much)•access to local suppliers of inputs still limited•payments—improved over time (3x)

100
Assessing Impacts of Value Chain Development on Poverty: A Case-Study Companion to the 5Capitals Tool
•meeting product standards—high “loss” rates (2x)
• transport to packing facility difficult—frequent long trips during harvest, after work
Lack of a formal contract between ASD and buyers’ leaves the network vulnerable. Except for the group certification, there are no exit barriers for grow-ers, underscored by the continued high turnover of growers. If more growers choose independent certi-fication, there is the risk of further leakage out of the ASD supply chain when prices, convenience or other arrangements are more attractive. Growers surveyed indicated about 50% of their organic production sales went outside of the network. This may have been due to the high-quality standards and cull rates (estimated at about 60%). Some of this leakage made it to mar-kets with good prices, such as restaurants and farmers’ markets, and was an important income stream that could not be obtained through ASD.
Most growers indicated a strengthening of ASD’s capacity with staff and inventory systems over the study period. However, the peer learning group, or farmer-to-farmer support, seemed to be less avail-able, with reliance mainly on ASD directly for one-on-one support.
5.4 Physical capitalThough the survey attempted to get details on physical capital, in many cases it was not feasible to separate equipment, tools and infrastructure specific to AH production. Nor were values available since most of the larger infrastructures (barns) and equip-ment (tractors) were old and amortized long ago. However, the interviews revealed some interesting concepts.
For the third/fourth generation farmers, land, infra-structure, tools and equipment were often inherited, added over dozens of years and shared across pro-duction systems. These growers said that it would be “hard to do this from scratch” and prohibitive if costs couldn’t be spread.
Most growers had added small tools through cash purchases, with two interviewees taking on credit for larger infrastructure investments. Half of the growers took advantage of a US Department of Agriculture Natural Resource Conservation Service program to acquire hoop houses to extend grow-ing seasons—ASD promoted and facilitated these grants. Only one grower (new to farming) made sig-nificant investments in almost all categories, financed through credit and savings.
5.5 Financial capital The financial resources available to household mem-bers, including income, savings, investments, equity in a home or business, and supplies of credit were explored. Despite the region’s high level of poverty and food insecurity, the overall ASD grower profile was closer to the US median of US$50,000 house-hold income, due with few exceptions to off-farm employment. Only one grower did not have off-farm employment/retirement pay, but the spouse did and provided the family medical insurance. Accurate member sales figures were unavailable due to changes in accounting systems and the 2008 fire, but based on AH gross sales and a 35% commission, the extra income generated through AH sales was about US$1.7 million in the 2005–2010 period (table 5).
The US national average of farming household’s income from farming was 13%. The average for ASD growers interviewed was higher, but in this case, the
Table 5. ASD gross sales and estimated grower sales (US$)
ALL ASD members 2005 2006 2007 2008 2009 2010TOTAL AH gross sales 237,057 368,423 513,227 572,667 464,390 517,619
Estimated farmer sales** 154,087 239,475 333,598 372,234 301,853 336,452
** Based on 35% commission, based on the selling price, which ASD charged all of its members as a fee for storing, processing, ship-ping and marketing the products

101
Building a value chain for organic vegetables with smallholders in Appalachia, United States
median was more revealing. About half of the farm-ing income for interviewed growers came from ASD sales (table 6).
This suggests that ASD sales make up less than 10% of most interviewees’ income. There were no major shifts for the study period either from farming or off-farm income: most reported that their AH sales have not changed much over the study period. None of the growers interviewed had issues/problems with access-ing credit, but most were conservative with credit.
Interviews explored profitability in general terms. Diversified farmers, who either already had land and equipment (inherited or purchased over time) or had multiple market outlets perceived that their ASD sales were profitable. Several farmers were not sure and two knew they had lost money on ASD sales. Overall, participation in ASD does not appear to be contributing significantly to building members’ financial assets.
The lack of crop insurance for ASD growers meant lack of a safety net. Several farmers lost large por-tions of crops over the past several years due to weather-related problems. Availability of crop insurance at reasonable rates that pays for organic production was unlikely in even the medium term. Most growers addressed farming risk through diver-sification: expanding markets (farmers’ markets primarily), extending seasons (hoop houses) and alternative farm income (tourism, honey).
Interviewees indicated a medium to high sense of their farm financial security over the study period (table 7):
This overall trend was positive, although the change could not be attributed to ASD. Growers did express concern about the viability of ASD long term and for many, without ASD, they would discontinue grow-ing organic; for a few, it would mean getting out of farming completely. For those farmers, assuming the responsibilities and costs for the value chain activi-ties of ASD would not be viable in terms of risks and time investments and selling only in farmers’ mar-kets would not be economically viable.
Table 6: Income from farming
Income ASD interviewees (9) Average Median% of Income from farming 21 15
% of farming income from ASD 51 50
6 Conclusions
6.1 Business viability of ASD and the AH programASD and the AH program is presented as a market-based model for creating regional food sys-tems and building capital assets. While its hybrid social-entrepreneur model is attractive in the sense of having a market orientation, it is proving prob-lematic and is currently quite vulnerable. The need to operate and compete as a for-profit business to generate revenues can overwhelm the social mission and even become a liability for ASD. Whether the model can achieve financial sustainability remains unproven, but after a decade of highly subsidized efforts, business as usual is an option based on the composition of the capital assets.
The challenges of expanding organic certification supply for differentiated markets as a livelihoods strategy are not unique to ASD, the region or the country. ASD has successfully created the miss-ing backbone of physical infrastructure to build a regional food system, but all of the other capitals are limited or constrained by factors discussed.
Based on the context and analysis of ASD capital assets, there seem to be two main options:
Table 7. Financial security perception of ASD growers
Rated from 1 (not at all) to 5 (completely)
Average
How financially stable or secure would you say your farm is right now?
3.5
How financially stable or secure would you say your farm was last year?
3.8
How financially stable or secure would you say your farm was five years ago?
2.86

102
Assessing Impacts of Value Chain Development on Poverty: A Case-Study Companion to the 5Capitals Tool
1. Recognize the need to subsidize the model with soft funds over the long term and build this into plans, only a slight modification of business as usual recognizing that subsidies will be required to support growers’ transition to organic. However, after more than a decade of this strategy, there is a high risk of donor fatigue.
2. Spin off AH as a for-profit business with professional management. This could include various diversification strategies to maximize facility utilization rates and create alternative income streams with existing capacity, such as processing local produce, not organically certified, to the same large buyers; handling conventional produce in segregated lines; adding value-added processing and flash frozen. ASD is undergoing a strategic planning process and exploring diversification strategies and creating alternative income streams based on its knowledge of the region and markets. These strategies could use funds to subsidize organic production.
In October 2010, Nonprofit Finance Fund, a national community development financial institution, con-ducted a nonprofit business analysis that gave ASD and its board tools to help make informed decisions to increase efficiencies, sustain core services and tar-get new revenues. With new accounting systems at AH and ASD, along with a full-time financial man-ager, ASD should be better positioned to address issues restricting its ability to build assets.
6.2 Livelihood viability among ASD growersThe dependence on ASD for technical assistance and markets makes growers vulnerable to any changes in ASD services or activities. ASD success is closely tied to increasing sales, which depends on expand-ing supply. Though all current ASD growers could expand their production in terms of existing physical assets, labor appeared to be the constraining factor for small farms that rely completely on family labor, since family members hold full-time off-farm jobs.
The four interviewed growers who had left the program said the combination of high commission and low volume (due to rejects that did not meet
high-quality standards) made selling through ASD economically unviable. Another factor was the chal-lenge of getting fresh, quality product to the packing facility in a mountainous, geographically dispersed area, which also required more time away from family.
Asset endowment has not changed much for ASD growers, and the contribution from the intervention has been minimal, considering the investment. The farming income was important to several growers, but for others it was basically a break-even activity; three reported it as a loss. For all farmers, it came with the opportunity cost of consuming free time for family and other interests, particularly those holding full-time jobs. During the harvest season, most grow-ers spent several hours in their fields after work at full-time jobs. Harvesting and transporting produce to the packing plant often meant a three-hour round trip to the ASD facility. Many interviewees, or their spouses, questioned every year whether it was worth it. But the reply continued to be “yes” for most. Profit die not appear to be the main driver. Farming was a passion and way of life: organic being a way to farm as environmental stewards. As one grower commented, “I do this for my granddaughter.”
6.3 SynthesisThe basic questions of this study are these:
•Did the interventions contribute to asset build-ing and business viability of ASD?
•Did the interventions contribute to asset build-ing and business viability of ASD members?
The study shows that the value-chain interven-tions by ASD over the past decade, and particularly during 2006–2010, have had uneven results in con-tributing to asset building for ASD and its members. Overall resiliency and vulnerability to shocks were negative for ASD. Physical assets had become signif-icant in terms of the packing facility and held much opportunity for ASD, the community and growers in the region. However financial assets have not been built or could be seen as negative, making the entire network, and the human and social capital built, vul-nerable. The social capital foundation has been laid, but bonds were not strong. The network seemed to

103
Building a value chain for organic vegetables with smallholders in Appalachia, United States
be vulnerable to any changes in markets. Buyers’ connections to the network were tenuous for lack of written contracts and high dependence on one per-son. There was no solid investment in the network by any other value-chain player and exit barriers were very low. If service, quality or staff changed, buyers could simply decide not to source AH produce, leav-ing growers investing in seeds and sales especially at risk.
Human capital increased for ASD growers but relied heavily on one-on-one personal interventions that would not be viable for new demands/expansion. It would seem that ASD members believe in the net-work as a vehicle to differentiated markets and the interventions have contributed to general building of human and social assets. However only a handful of growers have really benefited in terms of financial assets and reduced vulnerability.

104
Assessing Impacts of Value Chain Development on Poverty: A Case-Study Companion to the 5Capitals Tool
Success in pro-poor value chain development linked to asset endowments: This and other lessons from the 5Capitals tool
Jason Donovan, Dietmar Stoian, John Fisk and Michelle F. Muldoon1
SummaryThis chapter summarizes the lessons learned from case studies based on the 5Capitals tool for assessing the poverty impacts of value chain development (VCD). The lessons are derived from analysis of the assets of smallholders and local enterprises at the onset of VCD, asset building resulting from interventions and interactions in the value chain, and enabling conditions for VCD. A major lesson is that success in VCD is linked to the assets that smallholder households have at their disposal prior to involvement in a value chain initiative. Positive feedback loops—where the building of one asset leads to the building of another—are more likely the higher their original asset endowments. While this is good news for better-off households, the lesson has other implications for poorer households, whose asset endowments are more constrained. Poor house-holds require support in building a minimum stock of productive assets that would allow them to effectively participate in value chains. A further lesson is that strengthening nonconsumptive assets, such as human and social capitals, helps buffer downswings in asset-building processes. As for local enterprises, the cases show their potential to complement household-level asset building, but this often implies a time lag as enterprises attempt first to build their own asset base. Furthermore, building assets such as physical and human capitals is easier than building social and financial capitals. Minimizing the vulnerability of local enterprises requires access to a diverse range of technical, business and financial services that, in turn, implies greater coordina-tion between chain actors and service providers. If services provided to smallholders and local enterprises are comprehensive and complementary, greater gains in asset building can be achieved in shorter periods of time. We conclude that an asset-based approach to VCD, as suggested by the 5Capitals tool, allows for a broader assessment and better targeting of VCD impacts that have the potential to continuously improve value chain initiatives that aim to achieve a high impact on poverty reduction among smallholders.
1 Jason Donovan is marketing specialist at the World Agroforestry Center (ICRAF). Dietmar Stoian is program leader of the Bioversity International Commodity Systems and Genetic Resources Program. John Fisk is director of the Wallace Center at Winrock International and Michelle F. Muldoon is a program officer at the Wallace Center. The authors would like to thank Ashley Taylor at Winrock for support in elaborating this chapter. Contact author: [email protected].

105
Success in pro-poor value chain development linked to asset endowments: This and other lessons from the 5Capitals tool
1 Introduction
The potential for smallholders to effectively par-ticipate in high-value markets for agricultural and forest products and strengthen their overall live-lihood resilience depends heavily on access to the right combination of assets, in sufficient quantities, at the right time. Similarly, local enterprises that have direct business relations with smallholders require a minimum level of asset endowments to evolve into viable operations and respond to the demands of buyers and raw material suppliers. This is a cen-tral theme of the case studies in this volume, all of which are based on the application of the 5Capitals tool for assessing the poverty impacts of value chain development (VCD).2 This summary chapter pulls together the evidence and draws out the implica-tions for the design and assessment of interventions by NGOs, government agencies and other external service providers. The lessons learned might also guide private enterprises that are interested in sup-porting VCD with smallholders through new forms of business interactions.
The focus on assets adds to the list of factors typi-cally considered crucial for successful business and VCD, such as access to basic infrastructure, enabling political-legal frameworks, and favorable macroeco-nomic and marketing conditions.3,4,5 Including the understanding of asset endowments and the process of asset building (and erosion) in the design and implementation of VCD initiatives requires an inte-grated approach and introduces a further layer of complexity to VCD, which often implies additional costs for baseline studies, monitoring and evaluation. These additional costs, however, can be considered necessary investments in light of the urgent need to provide sound evidence for poverty reduction through VCD and complementary approaches.
The chapter provides evidence about the poverty impacts of VCD by drawing on the findings of the five case studies presented in this volume. It is structured as follows: section 2 discusses five key lessons that emerged from the case studies. These lessons relate to smallhold-ers and their ability to build assets in response to VCD; the role of local enterprises, organizations and individ-uals that link them with other value chain actors; and the utility of the 5Capitals tool for current and future VCD initiatives. Section 3 presents recommendations for the design of interventions and interactions for VCD as well as for the assessment of VCD outcomes and impacts. The final section provides comments on how to increase the poverty impacts of VCD.
2 Lessons from the cases
Traditionally, assessments of VCD have focused on increased income flows by smallholders. In some of the cases presented in this volume, significantly higher income flows were detected during the periods under assessment; in other cases, income flows were not significantly higher but other important bene-fits arose from VCD. In Afghanistan, for example, income from the sale of fresh vegetables increased an average of 13% over a four-year period, with higher income flowing into the hands of the female farm-ers. In India, households weavers reported a nearly 50% increase in income from increased productivity and higher demand for their labor from downstream buyers. In Nicaragua, income increases for coffee producers were considerable but could only partially be attributed to VCD because the overall market trend was favorable. The steady rise in international coffee prices during the assessment period relative to prices for certified coffee not only contributed to increased income but also motivated the coffee grow-ers to participate in both conventional and certified
2 Donovan, J; Stoian, D. 2012. 5Capitals: a tool for assessing the poverty impacts of value chain development. Turrialba, CR, CATIE, 70 p. (Technical Series 55, Rural Enterprise Development Collection no. 7).
3 Cramer, C. 1999. Can Africa industrialize by processing primary commodities? The case of Mozambican cashew nuts. World Development 27(7):1247–1266.
4 Kaplinksy, R; Readman, J. 2001. Integrating SMEs in global value chains: towards partnership for development. United Nations Industrial Development Organization, Vienna.
5 Gorton, M; Dumitrashko, M; White, J. 2006. Overcoming supply chain failure in the agri-food sector: a case study from Moldova. Food Policy 31:90–103.

106
Assessing Impacts of Value Chain Development on Poverty: A Case-Study Companion to the 5Capitals Tool
coffee markets. In the United States, the overall share of on-farm to total income was relatively small, and no real increases in income were reported during the period under assessment. In some cases, such as those from Afghanistan and Nicaragua, important increases in access to credit were detected, which, in both cases, were directly linked to VCD interventions.
In all of the cases there were considerable advances in the building of human capital—made possible largely through VCD interventions. In the case from Afghanistan, improved knowledge about vegeta-ble production helped to almost double output of produce. In the case from Appalachia in the United States, former tobacco farmers acquired the knowl-edge and skills over a five-year period to produce organic vegetables and meet the quality require-ments of regional supermarkets. Human capital was built through a combination of technical assistance from the local buyer (with support from donors and NGOs) and support from other farmers who were linked to the organic vegetable value chain (through farmer field schools and peer learning, for example). Most of the farmers in the US case had high preexist-ing levels of human capital and complementary assets (such as physical and financial capitals), which likely facilitated the accumulation of human capital for the shift from tobacco to organic vegetables. Another interesting example of human capital accumula-tion came from Nicaragua, where members of the Soppexcca cooperative shifted to more environmen-tally friendly techniques for postharvest treatment of coffee as well as harvesting techniques that ensured higher quality of raw materials delivered to the coop-erative. Technical assistance provided by technicians of the cooperative played a major role in facilitating these shifts. On the other hand, Soppexcca members showed less ability to adopt more complex practices, such as good agricultural practices for coffee manage-ment, due to the lack of complementary assets (for example, ability to cover increased labor expenses), low levels of preexisting human capital, and gaps in the offer of technical assistance by the cooperative.
Physical capital also increased across the cases, with important implications for the building of other assets, such as natural and social capitals. In Afghanistan, for
example, households significantly increased vegeta-ble yields through the acquisition of microirrigation systems. In Nicaragua, many households acquired infrastructure for the postharvest management of cof-fee that resulted in reduced environmental impacts and improved coffee quality. The construction of cooperative offices in rural communities offered the potential for decentralization of Soppexcca services and improved coordination with the cooperative. In Colombia, many households gained access to mobile phones as a result of increased income, which facil-itated communication for the marketing of fresh vegetables. Households also reported increased pur-chase of production inputs and farming infrastructure. In India, roughly 30% of weaving households pur-chased new equipment for weaving, which increased productivity by about 28%. In the United States, the farmers had acquired relatively high levels of physi-cal capital over decades, if not generations, and thus did not report significant changes in physical capital endowments related to the interventions. Efforts in India to support the production of Chanderi fabric through the construction of community-level depots and processing facilities had yet to bear fruit, as the quality of the services provided was felt by weavers to be inferior to those provided by other market actors.
Advances in social capital were less prevalent among the cases. In Afghanistan, social capital formation took place against a backdrop of gender barriers and protracted conflict. Achievements included the par-ticipation of female famers in training, the creation of community-level savings groups and the build-ing of women-to-women enterprise linkages. In the Nicaragua case, social capital among coffee-producing members of Soppexcca was relatively high at the start of the assessment period and remained high throughout the study time frame. This result reflected Soppexcca’s relatively stable and effective man-agement structure, its ability to provide services for coffee production and to buffer price shocks through access to fair trade markets, and its commitment to supporting members’ livelihoods (for example, assis-tance with resolving land conflicts and provision of scholarships). Limited advances in the building of social capital in the US and Colombian cases raised serious questions about the sustainability of the

107
Success in pro-poor value chain development linked to asset endowments: This and other lessons from the 5Capitals tool
chains themselves. However, in both of these cases, the beginning of efforts to build a value chain was rel-atively new, generally coinciding with the beginning of the assessment period. These newly formed initia-tives aimed to link smallholders to highly demanding markets for fresh fruits and vegetables, which, argu-ably, requires a higher stock of social capital.
Advances in the building of natural capital were inconsistent across cases. The case from Nicaragua shows how sustained efforts by a cooperative and its NGO supporters facilitated the building of natural capital. In this case, most coffee-producing house-holds managed, often through a combination of their own income and cooperative credit, to expand their land area, establish new coffee plantations or reno-vate existing coffee plantations. Given the important role that coffee production plays in income genera-tion for most of these households, such advances are likely to generate positive feedback loops for overall asset building. However, the case also highlighted the need for households to better address produc-tivity issues in coffee production, including access to fertilizer for improved soil management and services and inputs for addressing coffee pests and diseases. The US case presented mixed outcomes. Organic vegetable growers were able to adopt more sus-tainable farming practices; however, overall organic acreage was small and there was limited expansion of plantations over the assessment period, reflect-ing, in part, that farming was a part-time activity for most of the households. Results in Colombia were also mixed: many vegetable-producing households were able to improve soil fertility through increased access to fertilizers as well as bring underutilized land into vegetable production, though few house-holds reported expanded acreage. In Afghanistan, while areas for vegetable production remained
unchanged, households were able to make better use of their land through access to drip-irrigation systems supported by VCD interventions. For a sum-mary of household-level asset building, see table 1.
The case studies underscore the critical role local enterprises play in providing services to smallhold-ers and the ability of these enterprises to respond to the demands of buyers further downstream. At the same time, it is evident that many of these enterprises struggle to develop into viable business operations. In Nicaragua, for example, most coffee farmers linked to Soppexcca identified the cooperative as their only source of technical assistance and credit. However, Soppexcca has struggled to balance the need to sup-port its growers and the need to build its own asset base. The cooperative remains vulnerable to reduc-tions in NGO support, changes in the staffing of key positions and fierce local competition for green cof-fee. Similarly, organic vegetable farmers in the United States received critical support from Appalachian Harvest (AH), the commercial operation of the NGO Appalachian Sustainable Development, which facili-tated their transition to organic production. However, AH struggled with high costs and low fidelity among its members, due in part to the strict quality require-ments placed on the membership to comply with buyer requirements. Case studies in both India and Colombia highlight the difficulties of rural small and medium enterprises (SMEs) to provide services to their members and to emerge as viable operations during the course of a single project intervention. This confirms the findings of a global review of rural community enterprises—an important subset of local enterprises—with case studies from Asia, Africa, Latin America and the United States by Donovan, et al.6 as well as findings from studies by Bernard and Spielman,7 Markelova et al.8 and Donovan and Poole.9
6 Donovan, J; Stoian, D; Poole, N. 2008. Global review of rural community enterprises: the long and winding road to creating viable businesses, and potential shortcuts. Technical Series, Technical Bulletin 29, Rural Enterprise Development Collection 2. CATIE, Costa Rica, Turrialba.
7 Bernard, T; Spielman, D. 2009. Reaching the poor through rural producer organizations? A study of agricultural marketing cooperatives in Ethiopia. Food Policy 34:60–69.
8 Markelova, H; Meinzen-Dick, R; Hellin, J; Dohrn, S. 2009. Collective action for smallholder market access. Food Policy 34:1–7.
9 Donovan, J; Poole, N. 2013. Asset building in response to value chain development: lessons from taro producers in Nicaragua. International Journal of Agricultural Sustainability 11(1):23–37.

108
Assessing Impacts of Value Chain Development on Poverty: A Case-Study Companion to the 5Capitals Tool
Table 1. Summary of asset building at the household level in the five case studies (+++ = significant advance in asset building; ++ = moderate advance in asset building; + = limited advance in asset building)
Case study Natural Physical Social Human FinancialNicaragua—certified coffee
++Considerable expansion of total area, expansion of area under coffee and renovated coffee plantations; soil fertility and plant productivity still low
++Expansion of equipment for postharvest management of coffee; lack by most of basic infrastructure, tools and inputs for other farming activities
++High preexisting levels, new/expanded services by Soppexcca (e.g., credit); side-selling still common and advances in member participation in Soppexcca governance limited
++New skills for most members that improve coffee quality and help reduce environmental impacts; skills for coffee plantation management still limited
+Reduced risk from access to certified coffee chain; access to credit, but credit often too small; VCD income impact limited by side-selling and sustained rise in conventional coffee prices
Colombia—vegetables
+No expansion of land or change in practices for reduced environmental impact/improved soil health; increased use of fertilizers due to increased income from vegetable production; no monitoring of soil or water quality
+Increased purchased of production inputs and higher consumption levels due to increased income; investments by a few in new tools and machinery
+New collaboration for the purchase of inputs and marketing through their linkage to La Alianza; La Alianza highly dependent on project funds
++Acquisition and implementation of new skills related to postharvest management (critical for access to supermarkets) and diversification of vegetable production
+++Increase in income of about 88% due to higher prices paid by supermarkets (vegetable production main income source); more stable income flows
Afghanistan—vegetables
+Improved productivity from irrigation, use of compost and increased planting density; no change in area under production; no monitoring of water or soil quality
+Various small tools and basic greenhouse infrastructure purchased for vegetable production, averaging a total of $79 over assessment period
++Extremely low preexisting levels of social capital; formation of village savings groups; new access to credit and production inputs from sales agents (buyers)
++New skills acquired, mainly by women farmers, related to production and post-harvest management productivity
++Average income increase of 46% through vegetable production; most households with first-time access to credit for agricultural production
India—cloth NAChanges in national capital not explored
+No increase in installed weaving looms; however, existing looms underutilized; increase in tools for pre- and post-loom processing in about one-third of households
+Weaver-owned associations facilitating increased local competition and higher wages, as well as access to training and other services; associations vulnerable to reduced project funding
++Small group of weavers able to achieve innovative designs and improving dyeing processes; however, most weavers not reporting major increases in skills or knowledge for weaving
++Increase in average monthly income of 48%, with vast majority of household income from weaving; access to credit still limited

109
Success in pro-poor value chain development linked to asset endowments: This and other lessons from the 5Capitals tool
In all of the cases, enterprises that worked directly with smallholders received considerable support from governments and development organizations that allowed the enterprises to provide services to their members and upgrade their own asset endowments. In some cases, upgrading at the level of the business translated fairly quickly into asset building at small-holder levels. For example, the building of physical capital by AH in the United states, including a modern packing facility and refrigerated trucks, allowed the enterprise to expand its supplier network and meet downstream buyers’ demands for fresh produce. In Colombia, subsidies for the purchase of storage space allowed La Alianza Hortofrutícola del Sur to rapidly diversify its urban-based buyers and subsequently offer higher prices to its members. In other cases, how-ever, there may be considerable time lags between enterprise upgrading and household-level asset building, likely reflecting the needs of enterprises to build their own asset endowments at the same time as they attempt to improve and expand their supply of raw material from smallholders. For example, in Nicaragua, Soppexcca‘s capacity to provide services to its members was built up over several years. More recently, Soppexcca chose to invest a considerable sum to purchase a dry-milling facility, which it con-sidered important for its long-term growth; however, because of that investment, improved services for its members may suffer in the short to medium term. Still, asset building at the enterprise level is likely to translate, sooner or later, into asset building at the household level.
The following general lessons related to the design, implementation and assessment of interventions and interactions for VCD can be gleaned from the case studies:
•Livelihood strategies matter in designing VCD: The case studies show that strategies pursued by households played a major role in shaping the outcomes and impacts of VCD. In some cases, livelihood strategies hindered household par-ticipation in the value chain. For example, in the United States, farmers with relatively large preexisting asset endowments were unwilling to intensify their participation in the value chain for organic fresh vegetables. This was reflected, in part, by the high percentage of households that exited the chain altogether or reduced their participation over time. Many of the sampled US farmers were retired or had off-farm jobs, and most considered their on-farm activities as supplemental sources of income. Given the strict quality requirements imposed by supermarkets, many farmers preferred to sell their vegetables through informal channels, such as local farm-ers’ markets. In Nicaragua, most smallholders depended heavily on on-farm income for sur-vival; however, overall limited asset endowments, combined with the need to reduce income risk and ensure food security, meant that many house-holds could not make the investments needed to intensify their participation in the value chain for certified coffee. On the other hand, evidence from India and Colombia showed that when
Case study Natural Physical Social Human FinancialUnited States—vegetables
+++Strongly increased commitment to enhanced soil fertility and soil conservation through reduced tillage, mulching, cover crops and buffer zones; monitoring of soil and water quality; almost doubled area under organic certification
+High preexisting levels of physical capital built up over decades prior to assessment period
++Trust relations with Appalachian Harvest (AH) based on professionalism and supply of quality services; high costs related to selling to AH (most produce sold outside of AH); AH still vulnerable to shocks
+++Build-up of considerable skills and knowledge related to conversion from tobacco to certified organic vegetable production sold to supermarkets—AH with an important role in the process
+Income from sale of organic vegetables to AH on average 10% of total income; off-farm income and alternative marketing outlets still important; credit accessible but crop insurance inaccessible
110
Assessing Impacts of Value Chain Development on Poverty: A Case-Study Companion to the 5Capitals Tool
interventions complemented livelihood strate-gies and did not require major trade-offs in the use of scarce assets, then households were more likely to make the investments needed for effec-tive chain participation. After all, resource-poor smallholders optimize their livelihood system as a whole, rather than any specific element of the system, such as production of market-oriented crops. The implicit dilemma between specializa-tion and diversification is yet to be adequately addressed by VCD initiatives or, at least, associ-ated trade-offs must be determined and efforts made to minimize them.
•Incomplete access to inputs and services length-ens impact pathways: The case studies highlight the difficulties smallholders and local enter-prises face in building their asset endowments over relatively short periods through improved access to inputs and services, in part because they do not have access to the right combi-nation of inputs and technical, business and financial services at the right time, given the het-erogeneity of asset endowments and response capacity among them. In general, commercial service providers face unfair competition from government-sponsored or subsidized inputs and therefore are unlikely to seek out smallholder and emerging rural enterprises. NGOs and other types of project-supported service providers, in turn, tend not to partner with others offer-ing complementary services, which is a missed opportunity for increasing the effectiveness of interventions for VCD. In most of the cases, inputs and services available to households for upgrading their on-farm productive capacities were incomplete. In Nicaragua and Colombia, for example, the main source of credit for annual production and strategic on-farm investments came from cooperatives and producer associ-ations, which was often insufficient, and access to local banks for credit was limited to only the largest producers. For many households, limited access to agricultural production inputs was a severe constraint. In Nicaragua, for example, households producing conventional and organic certified coffee were often unable to purchase fertilizers and appropriate agrochemicals for
pest and disease management despite improved access to credit because credits were often too small, credit was needed to meet immediate con-sumption needs, and costs of purchase inputs were relatively high. A shortage of labor for agricultural production was identified as a major limiting factor for smallholders in the US case study. Environmental and social responsibility was only addressed in the case of Nicaragua and the United States, though in both cases in an incomplete fashion.
•Insufficient asset endowments constrain small-holder participation in VCD: The case study in Nicaragua provides insights into how low lev-els of asset endowments limit the participation of poor households in more demanding value chains. In this case, asset endowments were alto-gether too low for some smallholder households to make the upgrading investments needed to engage in higher-value markets. Participation in the certified coffee value chain, for example, required a significant investment in renovating coffee plantations, expanding acreage, hiring labor, obtaining fertilization and maintaining certification. Roughly two-thirds of the sam-pled households were able to take advantage of credit, technical assistance and other services offered by the cooperative to expand and inten-sify their coffee production—these households had relatively large endowments of natural and financial capitals before the interventions for VCD were carried out. The remaining house-holds, however, generally struggled to intensify their coffee production, despite improved access to services and a significantly improved mar-keting environment. These households were much more likely to depend on off-farm income to meet their needs and faced harsh trade-offs in the allocation of time and assets for coffee production. They would need nonmarket inter-ventions, including social transfers, and technical assistance to prepare them for VCD. Yet, many value chain initiatives address smallholder households as a uniform stakeholder group with the same response capacity.
•Smallholders built certain elements of their asset base but major gaps remained: Whether

111
Success in pro-poor value chain development linked to asset endowments: This and other lessons from the 5Capitals tool
in response to changes in the context or access to new services, the case studies showed that smallholders generally built important elements of their asset base during the period under assessment. For example, the Colombia and Nicaragua cases highlighted important advances in financial capital. The US, Afghanistan and India cases reported important advances in human capital formation, while the Nicaragua case showed major advances in building natural capital. However, progress in asset building was uneven across the five asset classes. In the case of Colombia, smallholder vegetable producers generally built their endowments of physical, financial and human capitals but made markedly less progress in terms social and natural capitals. In the India and Afghanistan cases, advances were concentrated on human and social capital endowments. When interventions for VCD tar-get poor households, gains in asset endowments may be insufficient to allow for major advances in livelihood resilience. For example, while many coffee farmers in Nicaragua received credit and technical assistance for the first time through their affiliation with the coffee cooper-ative and their link to the specialty coffee value chain, the credit was often too small to permit strategic investments in coffee production, and access to technical assistance was often too spo-radic to facilitate major changes in production techniques.
•Vulnerable links to value chains: Across the cases, the local enterprises offered various ser-vices to their smallholder members or clients while responding to the demands of buyers fur-ther downstream and, in some cases, partnering with development organizations. The enterprises maintained their capital endowment during the assessment periods and achieved import-ant expansions of capital, especially physical and human capitals. In general, the evidence suggested that gains in social and financial capitals were more modest. Local enterprises were able to build or maintain their asset base despite having to operate in challenging business environments often characterized by poor infra-structure, limited access to critical inputs and
services, and policies that target large companies and urban SMEs rather than the rural sector. Still, asset building was incomplete for achieving economically viable enterprises during the peri-ods under assessment. An important conclusion by cases in Nicaragua and the United States was the high degree of vulnerability of local enter-prises to internal and external shocks, such as the departure of key staff or loss of external fund-ing sources. In Nicaragua, the cooperative faced important gaps in its asset base, particularly as regards human and financial capitals, which made it highly vulnerable to changes in the mar-ket context or the departure of one or two key staff.
•Asset-based approach to assessment of VCD allows for more impactful VCD: As noted previ-ously, most assessments of VCD focus on changes in income, output or other relatively simple indicators. Such types of assessments provide a minimal basis for judging the effectiveness of a specific intervention for VCD. However, given the complexity in which VCD takes place, such simple measures may lead to incorrect conclu-sions and missed opportunities to better inform the adjustment of current interventions and the design of future interventions. In Nicaragua, for example, poor smallholders achieved important advances in asset endowments but generally struggled to convert these gains into higher pro-ductivity or income flows. It would be amiss to conclude that the interventions for VCD in Nicaragua were unsuccessful or of limited impact. The case in Nicaragua highlighted gaps in social and human capitals for the enterprise, namely the limited ability of elected leaders to participate in strategy formulation and provide oversight to the administration, which left the enterprise highly vulnerable to changes in administration. Another example comes from the case in the United States, where the limitations of smallholders to intensify their participation in a demanding value chain—organic fresh vegetables—reflected eco-nomic preferences as well as lifestyle decisions. Implementation of 5Capitals is not for the faint of heart; it requires time, resources and a willing-ness to embrace considerable complexity. Not

112
Assessing Impacts of Value Chain Development on Poverty: A Case-Study Companion to the 5Capitals Tool
all of these factors will be present in any given VCD initiative. However, when poverty reduc-tion is the VCD objective and when VCD implies considerable investments for smallholders, then 5Capitals provides a useful framework for under-standing the potential and limitations of VCD.
•More learning and critical reflection is urgently needed: The case studies raised as many ques-tions as were answered regarding the relationship between VCD and asset building. For example, in the Colombian case, producers reported var-ious ways in which they increased their skills and knowledge for horticultural production; however, they also reported that productivity increased mainly because of improved access to fertilizers. Why were farmers unable to effec-tively use the information gained in training to their advantage? What changes should be made to future trainings and other interventions for VCD to better address productivity? In the case of Nicaragua, smallholders often considered the technical assistance provided by the cooperative to be inaccessible or otherwise not very useful. How can the cooperative provide its technicians with the right incentives and necessary tools to better address the members’ needs? In the case from Afghanistan, both lead farmers and other farmers reported gains in their endowments of physical capital. Were these gains sufficient for meaningful increase of on-farm productivity? What tools, machinery or infrastructure are most lacking? Answers to these questions require engagement by stakeholders in the VCD for critical reflection, strategy design and learning. Taken together, the cases also suggest import-ant questions for the design of VCD in general, including the existence of positive feedback loops, where the building of one asset (such as financial capital) leads to the building of oth-ers (such as human or physical capital), and the
existence of minimum asset thresholds, which may exclude or limit the ability of poorer house-holds to benefit from VCD. Future research is needed to identify viable ways to 1) maximize positive feedback loops at household level and between local enterprises and smallholders, 2) minimize asset stagnation or erosion, 3) ensure positive gender outcomes and impacts, and 4) minimize the trade-offs between market-ori-ented livelihood activities and those geared to subsistence.
3 Conclusions and recommendations
If VCD is to more effectively address rural pov-erty, its design and assessment must incorporate a deeper consideration of the complex needs and real-ities of the rural poor that includes recognizing that market-oriented activities, though important, are not exclusive elements of rural livelihood strategies. Subsistence-oriented activities focused on food and nutritional security may be equally important—if not more important. Both types of livelihood activ-ities, along with nonmarket values such as social and trust networks, have a strong gender dimen-sion that VCD needs to take into account.10,11,12 In many cases, VCD requires complementary programs aimed at economic growth, such as improvements in local infrastructure and services, political-legal frameworks, local markets for agricultural and forest products, and income generation through services and off-farm employment. Still, a severe knowledge gap exists regarding the interventions and interactions needed to build viable value chains with smallholders and effectively reduce rural pov-erty. Traditional measurements in terms of output, employment and income fall short because they provide only partial answers to what makes rural livelihoods resilient.
10 Coles, C; Mitchell, J. 2011. Gender and agricultural value chains: a review of current knowledge and practice and their policy implications. ESA Working Paper 11-05, FAO, Rome.
11 Laven, A. 2012. Challenging chains to change: gender equity in agricultural value chain development. Royal Tropical Institute (KIT), Amsterdam.
12 Riisgaard, L; Escobar, F; Ponte, S. 2010. Gender and value chain development. The Danish Institute for International Studies (DIIS), Copenhagen.

113
Success in pro-poor value chain development linked to asset endowments: This and other lessons from the 5Capitals tool
The application of the 5Capitals tool, as illustrated in the five case studies included in this volume, helps close this knowledge gap. It provides insights into broader livelihood changes in terms of critical livelihood and business assets at the level of smallholder households and the local enterprises that link smallholders with downstream chain actors. An asset-based approach to understanding the poverty impacts of VCD may mean higher costs than assessments focused on a few key indicators, but without any doubt these pay off as they allow VCD interventions and interactions to be redesigned in such a way that more significant and lasting impact can be achieved at both household and local enterprise levels.
Based on the key lessons from the case studies, we offer the following recommendations for the design and assessment of VCDs that include the rural poor:
•Enrich strategies for VCD with an understanding of household asset endowments: Interventions for VCD must account for variability in asset endowments and livelihood strategies among poor and vulnerable populations. Different measures are needed in each stage of the devel-opment life cycle to achieve poverty reduction among the most vulnerable—for example, stabi-lize household consumption and protect assets; smooth household income/acquire assets, expand household income/leverage assets, and stabilize income-generation and asset accumulation.
•Identify those households that require additional support to effectively participate in value chains: Successful participation in value chains requires minimum asset levels and capacities. Those who do not meet these require differentiated inter-ventions and technical assistance to create the necessary preconditions for their participation—for example, training to build human and social capital, rehabilitation of eroded natural capital, basic infrastructure investments and resolution of land-tenure conflicts. These interventions out-side the realm of VCD are critical to its success if the poorest sections of the rural population are to benefit from VCD.
•Prioritize interventions and other forms of support for building assets: Case studies of cooperative business development in developing
countries highlight the pitfalls of providing phys-ical capital during the start-up phase of business development. For example, subsidized process-ing equipment for farmer organizations may not contribute to development goals due to insufficient business skills, undependability of equipment (and inability to obtain replacement parts), poorly calibrated machinery or insuffi-cient attention to food safety. Often human and social capital must be built before considering major investments in physical capital. In other cases, natural capital may also need to be rebuilt before meaningful business development is pos-sible (including investments in physical capital and financial capital).
•Improve the links among technical, business and financial services: Integrated service providers (for example, providers that offer a range of technical, business and financial services to local enterprises and smallholders) are important during the initial stage of value chain formation or business development. However, the more demanding the value chain, the greater the pres-sure on business and smallholders to upgrade their capacities. This implies access to the right combination of services at the right time and the capacity to adapt as conditions change. There is an urgent need to make genuine efforts to link technical, business and financial services in ways that allow for meaningful asset build-ing at household and local enterprise levels. At the same time, there is a need to ensure that the linking of these services responds to the require-ments identified by chain actors rather than outside agents from public sector or civil society.
•Build awareness among donors and develop-ment practitioners about the advantages of using asset-based approaches for VCD design, imple-mentation and evaluation: In some cases, the increased complexity of asset-based approaches are outweighed by tangible benefits in terms of higher impact on poverty reduction, live-lihood resilience and viability of smallholder enterprises. In general, the more demanding the requirements for successful value-chain participation and the greater the vulnerabil-ity of smallholders and local enterprises, the

114
Assessing Impacts of Value Chain Development on Poverty: A Case-Study Companion to the 5Capitals Tool
greater the potential benefits from asset-based approaches to VCD design and assessment. It is necessary not only to build awareness about asset-based approaches for the design, monitor-ing and assessment of VCD but also to build the capacities of development practitioners and oth-ers to use these approaches.
•Promote comprehensive strategies for rural development: VCD is not a single avenue to rural poverty reduction. It needs to be combined with other approaches to rural development, such as sustainable rural livelihoods, territorial devel-opment and investments in rural infrastructure and services. The combination of approaches will better address the vulnerabilities faced by small-holders and local enterprises as they attempt to build their asset bases and intensify their
participation in more demanding markets for agricultural and forestry products. This implies changes in how VCD is designed, the partner-ships required for implementation and the way in which interventions are assessed.
•Identify innovative partnerships for joint learn-ing and continuous improvement: The diverse nature of stakeholders in VCD provides a great opportunity for joint learning. Each of them brings specific perspectives, skills and experi-ences to the table, but what is needed is to define appropriate forums and mechanisms for sharing and capitalizing on them. The outcome of such communities of practice and negotiation plat-forms will be highest when nurtured by genuine interest in learning and authentic commitment to continuous improvement.


Assessing Impacts of Value Chain Development on Poverty
EditorsRee Sheck
Jason Donovan Dietmar Stoian
A Case-Study Companion to the 5Capitals Tool
The Tropical Agricultural Research and Higher Education Center (CATIE) is a regional center dedicated to research and graduate education in agriculture, and the management, conservation and sustainable use of natural resources. Its members include the Inter-American Institute for Cooperation on Agriculture (IICA), Belize, Bolivia, Colombia, Costa Rica, Dominican Republic, El Salvador, Guatemala, Honduras, Mexico, Nicaragua, Panama, Paraguay, Venezuela, Spain and the State of Acre in Brazil.
The World Agroforestry Centre (ICRAF) is a CGIAR Consortium Research Centre. ICRAF’s headquarters are in Nairobi, Kenya, with five regional offices located in Cameroon, India, Indonesia, Kenya and Peru. The Centre’s vision is a rural transformation in the developing world as smallholder households strategically increase their use of trees in agricultural landscapes to improve their food security, nutrition, income, health, shelter, social cohesion, energy resources and environmental sustainability. The Centre’s mission is to generate science-based knowledge about the diverse roles that trees play in agricultural landscapes, and to use its research to advance policies and practices, and their implementation, that benefit the poor and the environment.
Bioversity International is a world leading research-for-development non-profit organization, working towards a world in which smallholder farming communities in developing countries are thriving and sustainable. Bioversity International’s purpose is to investigate the use and conservation of agricultural biodiversity in order to achieve better nutrition, improve smallholders’ livelihoods and enhance agricultural sustainability. Bioversity International works with a global range of partners to maximize impact, to develop capacity and to ensure that all stakeholders have an effective voice. Bioversity International is a member of the CGIAR Consortium.
Ass
essi
ng Im
pact
s of
Val
ue C
hain
Dev
elop
men
t on
Pove
rty