assessing the risk of oil spills in the mediterranean:...
TRANSCRIPT

This paper can be downloaded without charge at:
The Fondazione Eni Enrico Mattei Note di Lavoro Series Index: http://www.feem.it/Feem/Pub/Publications/WPapers/default.htm
Social Science Research Network Electronic Paper Collection:
http://ssrn.com/abstract=886715
The opinions expressed in this paper do not necessarily reflect the position of Fondazione Eni Enrico Mattei
Corso Magenta, 63, 20123 Milano (I), web site: www.feem.it, e-mail: [email protected]
Assessing the Risk of Oil Spills in the Mediterranean: the Case of the Route from the Black Sea to Italy
Andrea Bigano and Paul Sheehan
NOTA DI LAVORO 32.2006
FEBRUARY 2006 IEM – International Energy Markets
Andrea Bigano, Fondazione Eni Enrico Mattei and Ref., Ricerche per l’Economia e la Finanza, Milan, Italy
Paul Sheehan, Fondazione Eni Enrico Mattei and École Polytechnique Fédérale de Lausanne, Switzerland

Assessing the Risk of Oil Spills in the Mediterranean: the Case of the Route from the Black Sea to Italy
Summary Recent major spills on European coasts have highlighted the primary policy relevance for the EU of oil spills. This paper assesses the risks related to carrying oil to the EU along the route from the Russian Black Sea coast to Sicily, Italy (one of the most congested and strategically relevant European import routes). We develop a methodology based on Fault Tree Analysis, and we apply it to the most likely causes of an oil spill. We couple the resulting probabilities with data on expected spill size, types of oil carried and cleanup costs, to estimate expected costs for cleanup and loss of cargo. The route analysed appears to be a risky one; there is a “high” to “very high” risk of a spill along this route. The Turkish Straits turn out to be the major danger point; however, there is no obvious hierarchy amongst the other sites along the route. Keywords: Oil spills, Cleanup costs, Risk analysis JEL Classification: Q32, Q51, Q52, Q53 The methodology and the results presented in this paper have been derived in the framework of the FP6 Integrated Project on New Energy Externalities for Development Sustainability (NEEDS; www.needs-project.org), commissioned by the European Commission’s DG Research. FEEM is involved in NEEDS’ Research Stream 1c, and leads the Working Package dealing with the assessment of externalities concerning the extraction and transport of oil. This paper has greatly benefited from the interaction with NEEDS’ Research Stream 1c partners (Manfred Hafner, Shobet Karbuz, Evasio Lavagno, Ståle Navrud, François Parthiot, Ari Rabl). The authors are also very grateful for their comments and suggestions to Alessandro Lanza and Anil Markandya, and to Salvatore De Gaetano, Pietro Rossi and Andrea Carpignano for their technical input. All errors and opinions are ours.
Address for correspondence: Andrea Bigano Fondazione Eni Enrico Mattei Corso Magenta 63 20123 Milano Italy E-mail: [email protected]

2
1. Introduction
Assessing the externalities related to the extraction and transport of oil has proven in the last decades
an issue of primary policy relevance. Recent major spills such as the Erika on the French Atlantic
coast and the Prestige on the north-western Spanish coast have meant that public and governmental
attention is firmly focused on the issue of how to minimise the impact of such disasters. Given the
predicted global increase in energy demand, securing Europe’s future energy needs will become of
increasing geopolitical and strategic importance.
In order to arrive at a comprehensive evaluation of the external costs associated to importing oil into
Europe, one needs to take into account the likely future oil demand-supply scenarios, the relative
relevance of import routes and pipelines, the local specificities in terms of critical passages, the
differences in terms of burdens and environmental and socio-economic impacts along the different
routes and pipelines, and the development of oil spills prevention and remediation technologies and
regulations. Last but not least, the intrinsic stochastic nature of the phenomenon should be carefully
analysed. The role of the perception by the European citizens of the risk involved in carrying oil to
Europe and the role of the associated risk aversion are particularly important in this context. In order
to incorporate all these features into a consistent evaluation framework, one needs to develop a
methodology suitable to deal with probabilistic externalities.
In this perspective, we address the issue of creating a methodology for analyzing the risks related to
oil tanker accidents. A sample route from Novorossiysk on the Black Sea coast in Russia to Augusta
in Sicily, Italy, is used as a benchmark to test the developments of this methodology. The basic
scenario considers a Suezmax type tanker carrying approximately 145’000 tonnes of oil cargo.
Tankers of this class are the most likely to be used along this route. The Bosphorus cannot be
navigated by tankers larger than 150’000 tonnes; moreover, small tankers are unlikely to be used
along this route due to recent European regulations which have banned tankers cruising under the
flag of countries notorious for having lax regulatory criteria for registering ships – medium-sized and
large tankers are unlikely to be operated under these flags.
The selected route has a number of special features which make it of singular importance and
interest, not least the fact that it passes through the Bosphorus Straits, a highly congested and
navigationally difficult sea passage passing through the heart of Istanbul in Turkey.
Four locations along the route were chosen due to a combination of the high likelihood of an
accident happening in that particular site and the high environmental and socio-economic
consequences that such an accident would entail. The parts of the route not considered, through the
Black Sea and from the Aegean to Sicily, not only have a lower chance of a spill occurring due to a

3
relative lack of obstacles, but also should a spill occur the consequences would be, again relative to
the other sites, less severe due to the absence of a nearby coastline and the fact that the oil would be
naturally dispersed more quickly in the open sea. As a consequence their expected risk values are
orders of magnitude lower than those of the selected sites.
This paper is organised as follows. The next section describes the route under scrutiny. Section 3
introduces and discusses the methodology used. Section 4 presents the main results and Section 5
concludes.
2. The Route
2.1. Novorossiysk Novorossiysk is the largest port in Southern Russia and its oil terminal at Sheskhranis is responsible
for over 50% of Russian crude oil exports by sea. There is a second terminal at Novorossiysk, the
Caspian Pipeline Consortium’s (CPC) new oil terminal at Yuzhniy Ozerejevka. Oil is predominantly
pumped to the terminal from the Tengiz oilfield in Western Kazakhstan and oil fields in Azerbaijan.
The CPC terminal is situated 5 km offshore in waters more than 50-metre deep and is located west of
the Sheskhranis oil terminal.
2.2. Turkish Straits By Turkish Straits is meant the passage from the Black Sea, through the Istanbul Strait (Bosphorus),
the Sea of Marmara, and the Canakkale Strait (Dardanelles) into the Aegean Sea. It is the only sea
route out of the Black Sea and as such the only sea route through which Russian and Caspian exports
can reach the Mediterranean.
The Bosphorus passes through the heart of Istanbul, Turkey’s largest city with a population of
approximately 12 million. It is 31 km long and on average 0.8 nautical miles wide, though at its
narrowest point it is only 660 metres wide. Depth varies from 35 to 12 metres and vessels passing
through are required to make 12 course alterations, including one turn of 45° at the narrowest point
and another turn of 80°.
The Dardanelles is another waterway similar to the Bosphorus. It is 70 km long though it is not as
narrow as the Bosphorus: its narrowest point is 1.5 km wide. The accident risk is therefore much
lower as, firstly, it does not pass through the centre of a large city (reduced consequences) and
secondly, the topology allows for a safer passage (reduced incident probability). As such, when
referring to the Turkish Straits, a number of factors refer mainly to the Bosphorus, however, where
appropriate, data for the Dardanelles have been included.

4
Though a number of pipeline projects bypassing the Straits have been constructed or are being
planned1, their high transport costs per barrel mean that oil transport by tanker through the
Bosphorus is still by far the preferred transport route for exporters. At present roughly 1.7 million
barrels of oil per day (bpd) is moved through the Bosphorus. Predicted increases in Russian and
Caspian exports mean that by 2010 another 2-3 million bpd could be added. The International
Energy Agency (IEA) estimates that the Straits have a maximum capacity of 1.8 million bpd.
The Straits are classed as international waters and as such Turkey has an obligation under the
Montreux Convention of 1936 to permit free transport for merchant traffic. At that time there were
only approximately 17 vessel transits per day, weighing on average 13 tonnes and mostly carrying
grain. Today there are over 130 vessel transits a day of which roughly 15% are oil tankers, often as
big as 150’000 tonnes – the maximum size for the Turkish Straits. In addition to this 1.5 million
people commute from one side of the Bosphorus to the other each day, which makes it one of the
busiest waterways in the world.
Despite Russian opposition, Turkey unilaterally implemented certain traffic regulations in the Straits
following an accident in 1994, with the aim of enhancing the navigational and environmental safety
and security in the Straits which at that time already had a dense level of traffic. In 1998 Turkey
introduced further regulations governing vessel flow through the Straits including a five-fold
increase in passage tariffs to help pay for ship safety measures. Both the regulations in 1994 and
1998 were supported by the United Nations International Maritime Organisation (IMO). Turkey has
also recently completed installation of a new vessel tracking System (VTS) which should help
further reduce the risk of accidents.
2.3. Aegean Sea The Aegean Sea is located between the coasts of Greece and Turkey and the islands of Crete and
Rhodes. It covers an area of 210 square kilometres and contains over two thousand islands of
varying sizes, most of which belong to Greece. The Aegean is also filled with submerged rocks and
island populations that depend on fishing and tourism for their livelihood. It has been named as a key
area of the Mediterranean in need of protection by the World Wildlife Fund.
This area of the Mediterranean has a massive amount of tanker traffic, as it is here that tankers
travelling from the Black Sea and the Suez canal converge, increasing the likelihood of a collision.
1 On 9th November 2005, a project for a new bypass pipeline between Samsun (on the Black Sea) and Ceyhan (on the Mediterranean) was announced. Once realised, this pipeline will substantially relieve (by removing 1million bpd from the Turkish Straits traffic) but not completely solve the problem, if the projections of sustained demand growth for Russian and Caspian oil prove correct.

5
2.4. Augusta The port of Augusta in Sicily is the third largest in Italy after Trieste and Genoa in terms of oil
imports. It can handle tankers of up to 385000 dwt and serves the ISAB refinery, Italy’s second
largest. The port is situated in the Marina di Melilli between Siracusa and Augusta. The area is one
often frequented by tourists most of the year, and there is a nature reserve on the coast just south of
the port. In 2003, 31 million tonnes of oil were imported through Augusta.
3. Methodology
The risk analysis proceeds via the following framework pathway.
Figure 1. Outline of risk analysis methodology
3.1. Stage 1. Causes and probabilities of oil spill s The first task is to identify the possible causes of an oil spill. Ship-related oil pollution is attributed
mostly to operational discharges which have consistently overshadowed accidental discharges.
Apparently the majority of these discharges happen either close to the mainland or within port areas
and terminal stations resulting usually in small spills which are dealt with by the local authorities and
are seldom reported. Less frequently, the cause of an oil spill from a tanker is an accidental event.
The most likely causes of accidental oil spills are grounding and ship to ship collision. Fire and
explosion used to be significant causes of accident. Their importance is now negligible, due to recent
changes in unloading regulations that prevent the formation of explosive gas mixtures in the hull.
Structural failures, foundering and loading-unloading errors can also cause sizeable spills; in these
cases the human element, which can play a role also in case of grounding and collision is particularly
important.
The rest of this paper focuses on groundings and collisions as these are the two most likely sources
of accidental oil spills.
Identification of System Failures and Sequences
Assignment of Probability Values
Oil Outflow Distribution of Oil in the Environment
Environmental/Economic Effects
Overall Risk Assessment
Stage 1 Stage 3 Stage 2 Result

6
The probabilities of a grounding or collision incident occurring and causing oil to be spilled are
calculated via Fault Tree Analysis (FTA). The probabilities were calculated using data from Brown2
using human error performance values under various situations and previous oil spill statistics.
The Fault Trees in the Appendix show the possible accident trajectory of opportunity which could
lead to an oil spill, and standard probabilities were attributed to the initiator events. These are
combined using Boolean algebra techniques. If, for an event to occur, two or more causal events
need to happen (or not happen as the case may be), then the probabilities of these two events are
multiplied together. This new value gives the probability of each events occurring, commonly
known in Boolean algebra as the intersect of events. This is represented by an AND gate in the Fault
Tree. For example, in the Fault tree for grounding in the Appendix, for drift grounding to occur, four
events must happen simultaneously:
1. There is a loss of steering or propulsion.
2. There is an anchor failure.
3. There is a failure in the ability of assistance to prevent the grounding.
4. There is an unsafe wind or current which propels the vessel into a place where it grounds.
Only if all of these factors occur at the same time will grounding occur.
If, on the other hand, for an event to occur only one of any number of casual events is required for an
event to occur, these probabilities are added together. In Boolean algebra this is the union of events3
and is represented by an OR gate.
For there to be a failure of assistance to prevent grounding, any one of these events is sufficient.
1. Assistance is not requested.
2. Assistance does not arrive.
3. Assistance unable to prevent grounding.
For the sake of simplicity, where there is a pathway that is far more important (difference is more
than two orders of magnitude) than the others where only one is necessary (OR gate), only that
pathway is considered. These probabilities are per tanker passage.
These probabilities are then multiplied by the site-specific weightings which are listed in Table 1.
The weightings take into account the physical variations between the sites. For example, the chance
of assistance not arriving in the Bosphorus is a lot lower than it is for the Aegean. This is because the
Bosphorus is very highly monitored and there is plenty of assistance available along it. The Aegean
2 [25] 3 To be precise, the union is the sum of the probabilities minus the probability that the events occur simultaneously (intersect). As the probabilities used in this analysis were quite small, the intersect was negligible and therefore not considered.

7
on the other hand is very large, less well monitored and assistance is more scattered. The Aegean
therefore has a higher weighting factor for this event than the Bosphorus.
The pathways in the fault trees in the Appendix which are coloured light blue from the initiating
event through to the grounding/collision occurring are generic faults which are independent of the
location, i.e. they could happen anywhere along the route. Elements shaded in grey have a site-
specific weighting and as such shall be different for each location. The probability values on the
fault tree will be multiplied by the factors in the following Table to give the relative site probability
of this accident trajectory of opportunity.
Factor Novorossiysk Turkish Straits Aegean Sea Augusta
w1s Assistance unable to help 2 4 1 1
w2s Non Arrival of Assistance 2 1 4 1
w3s Desired track unsafe 4 5 2 4
w4s Grounding obstacle 4 5 1 4
w5s Other vessel 3 5 2 3
w6s Vision impairment 3 4 1 1
w7s Erroneous/untimely action 1 3 1 1
w8s Bad weather/currents 2 4 1 1
w9s Manoeuvre not possible 3 4 1 3
hs Passage Time (hours) 8 20 100 8
Table 1. Site specific factor weighting
Where:
1 = No increased risk 4 = High increased risk
2 = Slight increased risk 5 = Acute increased risk
3 = Medium increased risk
Combining FTA with site-specific weightings according to Equations (1) to (4) below, leads to the
probabilities of an accident occurring as at the four selected locations follows. The computed
probabilities are reported in Table 2.
P(Collision) =
w5s * P(vessel in erroneous position) * w9s *
P(Manoeuvre not possible) + w7s * P(Remedial action not taken) + P(Error not detected) (1)
P(Grounding) = P(Drift Grounding) + P(Powered Grounding) (2)
8
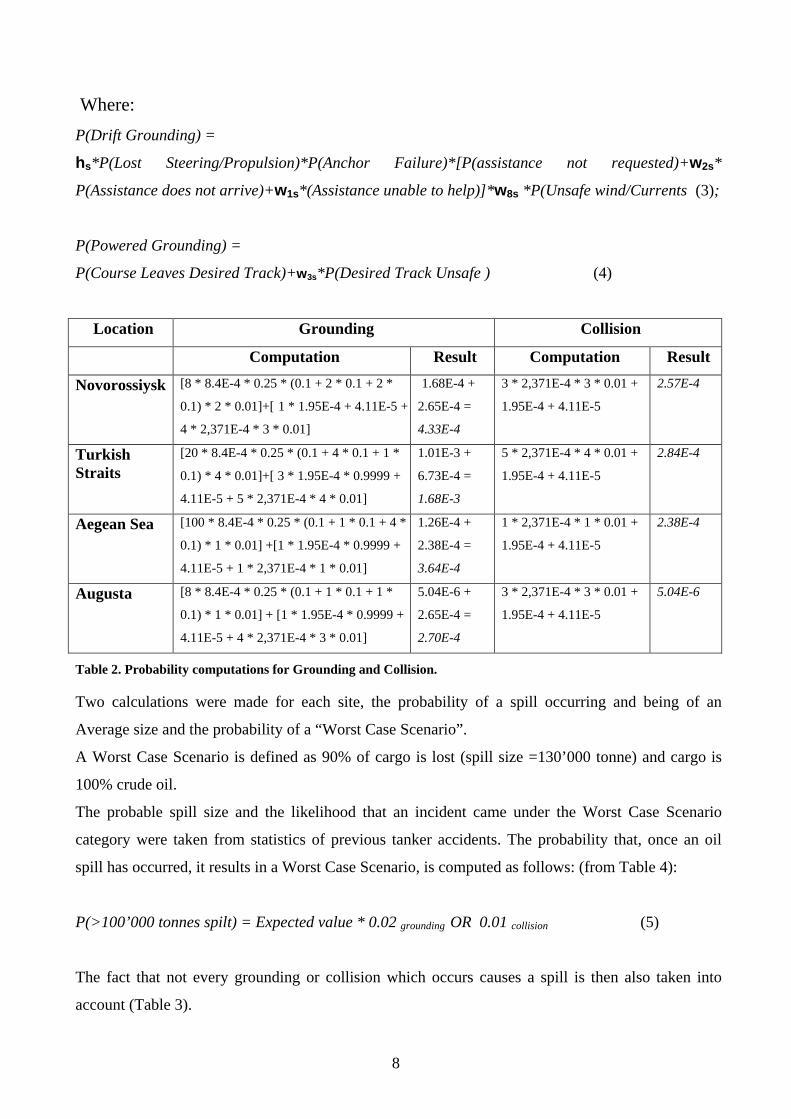
Where:
P(Drift Grounding) =
hs*P(Lost Steering/Propulsion)*P(Anchor Failure)*[P(assistance not requested)+w2s*
P(Assistance does not arrive)+w1s*(Assistance unable to help)]*w8s *P(Unsafe wind/Currents (3);
P(Powered Grounding) =
P(Course Leaves Desired Track)+w3s*P(Desired Track Unsafe ) (4)
Location Grounding Collision
Computation Result Computation Result
Novorossiysk
[8 * 8.4E-4 * 0.25 * (0.1 + 2 * 0.1 + 2 *
0.1) * 2 * 0.01]+[ 1 * 1.95E-4 + 4.11E-5 +
4 * 2,371E-4 * 3 * 0.01]
1.68E-4 +
2.65E-4 =
4.33E-4
3 * 2,371E-4 * 3 * 0.01 +
1.95E-4 + 4.11E-5 2.57E-4
Turkish Straits
[20 * 8.4E-4 * 0.25 * (0.1 + 4 * 0.1 + 1 *
0.1) * 4 * 0.01]+[ 3 * 1.95E-4 * 0.9999 +
4.11E-5 + 5 * 2,371E-4 * 4 * 0.01]
1.01E-3 +
6.73E-4 =
1.68E-3
5 * 2,371E-4 * 4 * 0.01 +
1.95E-4 + 4.11E-5
2.84E-4
Aegean Sea [100 * 8.4E-4 * 0.25 * (0.1 + 1 * 0.1 + 4 *
0.1) * 1 * 0.01] +[1 * 1.95E-4 * 0.9999 +
4.11E-5 + 1 * 2,371E-4 * 1 * 0.01]
1.26E-4 +
2.38E-4 =
3.64E-4
1 * 2,371E-4 * 1 * 0.01 +
1.95E-4 + 4.11E-5
2.38E-4
Augusta [8 * 8.4E-4 * 0.25 * (0.1 + 1 * 0.1 + 1 *
0.1) * 1 * 0.01] + [1 * 1.95E-4 * 0.9999 +
4.11E-5 + 4 * 2,371E-4 * 3 * 0.01]
5.04E-6 +
2.65E-4 =
2.70E-4
3 * 2,371E-4 * 3 * 0.01 +
1.95E-4 + 4.11E-5
5.04E-6
Table 2. Probability computations for Grounding and Collision.
Two calculations were made for each site, the probability of a spill occurring and being of an
Average size and the probability of a “Worst Case Scenario”.
A Worst Case Scenario is defined as 90% of cargo is lost (spill size =130’000 tonne) and cargo is
100% crude oil.
The probable spill size and the likelihood that an incident came under the Worst Case Scenario
category were taken from statistics of previous tanker accidents. The probability that, once an oil
spill has occurred, it results in a Worst Case Scenario, is computed as follows: (from Table 4):
P(>100’000 tonnes spilt) = Expected value * 0.02 grounding OR 0.01 collision (5)
The fact that not every grounding or collision which occurs causes a spill is then also taken into
account (Table 3).

9
3.2. Stage 2. Oil outflow assessment. Once the probabilities of each initiator event have been established, they are multiplied by a
weighting factor for each site, usually based on the physical characteristics, preventive measures and
level of spill preparedness of the location. This allows us to determine:
1. given that grounding or a collision has occurred, the probability that oil is spilt, and then,
2. given that oil is lost, the probabilities of different amounts of oil being spilt.
From 1993, all new tankers above 5’000 dwt were required to have double hulls or equivalent. 39%
of all tankers had double hulls in 2001.4 A report commissioned in the US after the Exxon Valdez
disaster in Alaska showed that double-hull designs reduced the number of spills (over the single-
hulls) by 54 percent for the 150’000-dwt tankers. However in collisions, the double-hull vessels had
a larger average spill size (given a spill) than the single-hulls, but the single-hulls had a larger
maximum spill. For the grounding scenarios, in comparing average spill size given a spill, the single-
hull vessel had a larger average spill than the double-hull in the 150’000-dwt size. The double-hull
designs had a larger maximum spill than the single-hulls.5
Cargo Spill Probability Ship Size (dwt)
Collision Grounding
single hull
double hull
single hull
double hull
Average Collision
Average Grounding
0 – 2,000 0.52 0.364 0.19 0.171 0.45916 0.18259
2,000–5,000 0.56 0.392 0.19 0.171 0.49448 0.18259
5,000–20,000 0.24 0.168 0.35 0.315 0.21192 0.33635
20,000 – 50,000 0.24 0.168 0.35 0.315 0.21192 0.33635
> 50,000 0.31 0.217 0.39 0.351 0.27373 0.37479
Average 0.39 0.273 0.3 0.27 0.34437 0.2883
Table 3. Spill probabilities for oil tanker collisions and groundings (data 1980 - 1995)6
Table 3 calculates the probability of a tanker collision or grounding provoking an oil spill. The
average probability takes into account the percentage of tankers with double hulls and their reduced
susceptibility to loss of cargo.
From the data available, it appears that the average tanker travelling from Novorossiysk to Augusta
is a Suezmax class tanker with a size of 145’000 dwt. Given there is an oil spill due to a collision or
grounding, the likelihoods of different quantities of oil being released are shown in Table 4. 4 [19] 5 [19] 6 [20]

10
Probability of Spill Size (tonnes) Type of Accident 0 – 1’000 1’000–
10’000 10’000–50’000
50’000–100’000
>100’000
Collision 0.65 0.22 0.07 0.05 0.01
Grounding 0.68 0.24 0.05 0.02 0.02
Table 4. Spill size probability for 145’000 tanker7
Values for Average and Worst Case scenario incident probabilities are calculated for each of the
selected sites per tanker passage. In the next section, the (cargo loss and cleanup) costs related to
these probabilities are combined with them in a consistent way in order to evaluate the risk an
expected cost per passage.
Collision Collision + Spill Grounding
Grounding + Spill Total
Novorossiysk
Average 2.57E-04 7.03E-05 4.33E-04 1.62E-04 2.49E-04
Worst Case 5.14E-06 1.41E-06 8.66E-06 3.25E-06 3.28E-06
Turkish Straits
Average 2.84E-04 7.77E-05 1.68E-03 6.30E-04 7.43E-04
Worst Case 5.68E-06 1.55E-06 3.36E-05 1.26E-05 8.31E-06
Aegean Sea
Average 2.38E-04 6.51E-05 3.64E-04 1.36E-04 2.16E-04
Worst Case 4.76E-06 1.30E-06 7.28E-06 2.73E-06 2.90E-06
Augusta
Average 2.57E-04 7.03E-05 2.70E-04 1.01E-04 1.85E-04
Worst Case 5.14E-06 1.41E-06 5.40E-06 2.02E-06 2.65E-06
Table 5. Grounding and collision spill probabilities
The average spill size for a tanker collision is found to be 8175 tonnes. The equivalent for a spill
caused by grounding is 6790 tonnes8. In 2% of grounding spills and 1% of collision spills, the
outflow will be of a “Worst Case Scenario” variety.
From Table 5, it follows that, along the whole route, the probability of an Average size spill is
1.39E-3, while the probability of a Worst Case spill is 1.71E-5.
7 [20] 8 Average grounding oil spill size = 500* 0.68 + 5,000*0.24 + 25’000*0.05 + 75’000*0.02 +125’000*0.02 = 6790 tonnes. Average collision oil spill size =500* 0.65 + 5,000*0.22 + 25’000*0.07 + 75’000*0.05 +125’000*0.01 = 8175 tonnes

11
3.3. Stage 3. Distribution of Oil in the Environmen t, Environmental and Economic Effects
The European average cleanup cost per tonne of crude oil spilt is $10’800. This value was then
adjusted using a modification factor again based on the physical characteristics of the environment
and the gravity of the impact an oil spill could have on them. The weightings (Table 7) vary
significantly depending on factors such as type and quantity of oil, location type, environmental
sensitivity, economic use and the response capabilities on site. These weighting factors and the
cleanup costs per tonne are listed in Table 8.
Combining weighting factors, cleanup cost per tonne and the quantity of oil spilt respectively in case
of grounding and collision, yields the total cleanup costs for Worst Case Scenario and Average size
spills in the different locations listed the third and sixth column of Table 9.
The cost of lost revenue is computed taking an arbitrary value of $50 per barrel ($370/tonne). For
Average size spills, this equates to $630’850 in case of collision and to $518’000 in case of
grounding. For the Worst Case Scenario (the spill size is independent from the cause in this case) the
loss in revenue rises to 48.1 million. The total cost to the carrier is the sum of the cleanup costs and
the loss in revenue.
The costs computed in this section will be then used in Section 4, where expected costs will be
computed as the product of the probability of occurrence and its monetised consequences at each
location9 and then summed over the whole route.
3.3.1. Modification Factors
The cleanup cost are based on the European average cost of $10’800 per tonne10 spilt.11 This has
been adjusted by the following modification factors which were calculated using previous oil spill
statistics. The ratings given are based on data available on the sites under scrutiny.
• Oil Type. This is the factor by which different types of oil affect the spill cost. Cleanup costs
for lighter crude and refined oils tend to be below the average spill cleanup cost. Heavier
crude and fuel oils, as well as emulsions, are considerably more persistent and viscous. These
oils are difficult to clean up using dispersants, skimmers and pumps, resulting in
9 To anticipate, for revenue loss this is dealt with in section 4.2, while for cleanup costs, this is shown in Table 9. 10 This assumption is likely to be too high, especially for a spill in the Russian Black Sea; however more precise data was not available at the time of writing. 11 [23]

12
considerably higher cleanup costs12. Typically only 10 – 20% of spilled oil is contained and
recovered.13
• Spill Size. As Figure 2 demonstrates, the cost of a spill does not increase linearly with the
size of the spill. Obviously a larger spill costs more to clean up than a smaller one, but there
is a maximum cost per tonne which occurs at around 7 tonnes, after which the cost of dealing
with the extra oil diminishes.
Figure 2. Spill unit cleanup cost (1 gallon = 0.0032 tonnes)14
Table 6 show the shares of different oil types by spill size. As the average spill size is greater than
700 tonnes we shall assume that 75% of the cargo is crude oil and the other 25% is refined products.
% Bunkers Crude Oil Refinery
Products Other
< 7 tonnes 22 51 15.7 11.3
7 – 700 tonnes 8 44 34.7 13.3
> 700 tonnes 3.6 67.8 25 3.6
Table 6. Oil spill sizes by oil type15
• Location Type. This factor accounts for whether the spill is found near a shoreline or in a
port.
12 [21] 13 [16] 14 [24] 15 [22]

13
• Area Sensitivity. Here the presence of national parks, areas of specific ecological interest are
accounted for as a potential to experience long term damage (months to years).
• Preparedness. This factor takes into consideration the availability of cleanup equipment and
personnel etc. and their efficiency (effective oil cleanup).
• Response Time. The time taken for a cleanup operation to commence.
• Human Use. The presence of habitations or economic activity (fishing/tourism) on the site
and their potential to experience long term damage.
• Weather. Previous spills16 have shown that weather can be counted as neutral as it either
helps to naturally disperse the oil or hinders cleanup.
Table 7 shows the modification factors by which the spill cost/tonne should be adjusted for Average
and Worst Case Scenarios for each location. In Table 8 the weightings are multiplied with the
European cost per tonne ($10’807.83)17 of the Average and Worst Case Scenario to give the cleanup
cost per tonne of such a spill.
16 The Braer spill in the Shetland Islands was one of the largest spills ever. Bad weather prevented a major retrieval operation from being put into effect through ultimately this same bad weather dispersed the spill to such an extent that major environmental damage was avoided. 17 $ = US Dollar = € 0.8211 (21/09/2005)

14
Weighting
Oil Type
Spill Size
Location Type
Area Sensitivity
Response Time
Preparedness Human Use Total
Novorossiysk
Average 0.5675 0.27 1.28 1.2 0.8 1.15 1 0.2165253
Worst Case 0.65 0.01 1.28 1.2 0.8 1.15 1 0.0091852
Turkish Straits
Average 0.5675 0.27 1.46 3.8 0.8 1.15 3 2.3462547
Worst Case 0.65 0.01 1.46 3.8 0.8 1.15 3 0.0995311
Aegean Sea
Average 0.5675 0.27 0.46 3.2 0.97 1 1.7 0.3719273
Worst Case 0.65 0.01 0.46 3.2 0.97 1 1.7 0.0157776
Augusta
Average 0.5675 0.27 1.28 1.2 1.15 1 1 0.2706566
Worst Case 0.65 0.01 1.28 1.2 1.15 1 1 0.0114816
Table 7. Weightings for Average and Worst Case spill scenarios
Weighting Cost/tonne
Novorossiysk
Average 0.216 2338.47337
Worst Case 0.009 99.201024
Turkish Straits
Average 2.346 25339.55128
Worst Case 0.099 1074.936096
Aegean Sea
Average 0.372 4016.815194
Worst Case 0.015 170.3984256
Augusta
Average 0.271 2923.091712
Worst Case 0.011 124.00128
Table 8. cleanup costs for Average and Worst Case spill scenarios.

15
4. Results
4.1 Inherent risk The expected damage, or “risk” can be defined as the expected unwanted consequences. Here the
unwanted consequences for the carrier are the probable costs that would have to be paid for cleanup
and loss of revenue. In this analysis the risk will be taken as product of the calculated spill
probabilities multiplied by the relevant damage costs.
i
n
ii DPM ∑
=
=1
1 (6)
where P = Probability of a spill, D = damage cost and i = the site being assessed. The risk for the
whole route (M) is the sum of these component risks.
Values for Average and Worst Case scenario incident probabilities are here calculated for each of
the selected sites per tanker passage, along with the consequent costs. The risk is then evaluated as
an expected cost per passage.
4.2. Loss in Revenue When thinking about the total cost of a spill, the cost of the oil lost must also be taken into account.
Due to the highly fluctuating oil prices, an arbitrary value of $50 per barrel ($370/tonne) was used to
calculate loss in revenue.
Average loss in revenue Collision = 8175 * 370 = $3’024’750 (7)
Average loss in revenue Grounding = 6790 * 370= $2’512’300 (8)
Worst case scenario loss in Revenue = 130’000 * 370= $48’100’000 (9)
4.3. Total Cost Total Average and Worst Case Scenario costs can be calculated for each location.
For example, if there was a Worst Case Scenario spill in the Bosphorus then the total cost would be
the sum of the cleanup cost and the loss in revenue:
Total Cost = 48’100’000 + 140’000’000 = $188’100’000 (10)

16
4.4. Risk The risk calculated here is the risk for the carrier, which is different than the risk for society. Carriers
are only likely to be liable for cleanup and lost revenue costs. The risk is the product of the
probability of occurrence and their monetised consequences. The tables below show the monetised
risk per transit for grounding and collision per location in US dollars.
The cleanup risk would be the amount a tanker should expect to pay in remediation of the damages
due to an oil spill caused by grounding or collision at each location.
Grounding Collision
Probability Cost ($) Expected Cost ($) Probability Cost ($) Expected Cost ($) Novorossiysk
Average 1,62E-04 1,59E+07 2,57E+03 7,03E-05 1,91E+07 1,34E+03 Worst case 3,25E-06 1,29E+07 4,19E+01 1,41E-06 1,29E+07 1,81E+01
Turkish Straits Average 6,30E-04 1,72E+08 1,08E+05 7,77E-05 2,07E+08 1,61E+04 Worst case 1,26E-05 1,40E+08 1,76E+03 1,55E-06 1,40E+08 2,17E+02
Aegean Sea Average 1,36E-04 2,73E+07 3,71E+03 6,51E-05 3,28E+07 2,14E+03 Worst case 2,73E-06 2,22E+07 6,04E+01 1,30E-06 2,22E+07 2,89E+01
Augusta Average 1,01E-04 1,98E+07 2,00E+03 7,03E-05 2,39E+07 1,68E+03 Worst case 2,02E-06 1,61E+07 3,26E+01 1,41E-06 1,61E+07 2,27E+01
Table 9. Expected cleanup costs for oil spills caused by groundings and collisions
The total cleanup expected cost is the sum of the grounding and collision clanup expected costs.
Figure 3 shows the expected cleanup costs of the Average and Worst Case Scenario spills for each
site.

17
Novoross
iysk
Turkish
Stra
its
Aegean Sea
Augusta
most likely
worst case
0
20000
40000
60000
80000
100000
120000
140000
$
Figure 3. Expected cleanup costs for oil spills caused by groundings and collisions
The expected loss in revenue for an Average size spill is18 1.39E-3 * 2’778’015 = $3861. The
expected loss in revenue for a Worst Case Scenario spill = 1.71E-5 * 48’100’000 = $822.
The total expected costs under the two scenarios, for a tanker travelling from Novorossiysk to
Augusta due to a collision or grounding is the sum of the expected loss in revenue due to the loss of
cargo and the expected cleanup costs for grounding and collision:
Total Route Expected Cost(Average spill) =
3916 + 124’491+5847 + 3685 +3861 = $141’800 (11)
Total Route Expected Cost (Worst Case Scenario) =
6.00E+01 + 1.98E+03 +8.93E+01 + 5.53E+01 + 822 = 2’202. (12)
4.5. Discussion Using the professional judgement risk equivalence values from the table below, we can say that there
is a “high” to “very high” risk of a spill occurring along this route(~1.0E-3 – 1.0E-4), and a medium
18 The revenue loss figure of $2’778’015 is computed as a weighted average of the figures computed in (7) and (8) for average size spills. The weights (approximately 0.481 for grounding and 0.519 for collision) are derived by comparing the relative shares of these events as accident causes.

18
risk of a Worst Case Scenario accident (~1.0E-6). This is corroborated by the data on previous
tanker spills in the Black Sea and Mediterranean areas.
Rating Categories Probability of Occurrence Professional Judgment on Risk Equivalence- Chance That Spill Will Occur
Will never occur None Zero Very low or no risk Rarely if Ever occurs 1X10⁻⁹ Low Unlikely to occur 1X10⁻⁷ Medium May occur 1X10⁻⁶ High Likely to occur 1X10⁻⁴ Very High Most likely to occur 1X10⁻³
Table 10. Professional judgement risk categories19
Unsurprisingly given their special nature and location, the Turkish Straits have the highest
probability of a spill occurring along with the gravest consequences. In fact, the Turkish Straits
account for over 70% of the risk of an oil spill along the route. This, and the fact that a major spill is
likely to occur due to a collision, is borne out by previous spill data – two of the largest spills on
record, the Independenta and the Nassia were both caused by collisions in the Bosphorus.
4.5.1. Comparison of spill costs It is interesting to look at how the spill costs compare to other historical spills. The Exxon Valdez
tanker disaster which happened off the coast of Alaska in 1989, spilling 35’000 tonnes of oil, had a
cleanup cost of roughly $2 billion20 ($2.73 billion in today’s money when adjusted for inflation).
A Worst Case Scenario spill in the Bosphorus where 130’000 tonnes of oil are lost would have a
calculated cleanup cost of $0.14 billion.
There is an order of magnitude difference in the two cleanup costs which can only partially be
explained, and this despite the higher spill volume in the case of the Bosphorus. One factor not taken
into account is the higher base per-unit oil spill cleanup costs in North America ($19’814.63). This is
roughly twice that of Europe ($10’807.83). A probable discrepancy arises from the incompleteness
of the weighting system. The data comes from the US Environmental Protection Agency (EPA) and
was meant to be used for mapping out oil spill risks in US waters. As the Bosphorus Strait is unique
in that it has very high tanker density, passes through the centre of Istanbul, and is difficult to
navigate, it is reasonable to assume that the EPA weighting factors do not take these circumstances
into account with sufficient emphasis. Unfortunately, cleanup data for actual accidents in the
Bosphorus is not available.
19 [3] 20 [26]

19
5. Conclusions
The route analysed appears to be a risky one: in terms of professional judgement risk equivalence
values used in a similar context by Hildrew (2001), we can say that there is a “high” to “very high”
risk of a spill occurring along this route(~1.0E-3 – 1.0E-4), and a medium risk of a Worst Case
Scenario accident (~1.0E-6). This is corroborated by the data on previous tanker spills in the Black
Sea and Mediterranean areas.
The total cost of transporting a Suezmax tanker load of crude oil from Novorossiysk to Augusta is in
the order of $1’200’00021. Therefore, the expected cleanup cost per passage due to tanker collisions
and groundings ($141’800) represents approximately 11,8% of the total cost. This cost can in a sense
be regarded as a lower bound for the premium an insurance company should charge to insure each
tanker passage along the route against cleanup and loss of revenue due to spills caused by collisions
and groundings.
It is quite conclusive from the results that the Turkish Straits are the major danger point along the
route, both in terms of occurrence probability and spill impact. However it is interesting to note that
there is no obvious hierarchy amongst the other sites. The fact that, for example, Novorossiysk has a
comparatively high spill occurrence probability yet a comparatively low impact, should, in principle,
provide reliable guidance to decision makers when considering investments into either spill
prevention or spill response programs.
The costs for cleanups and revenue losses due to tanker accidents are enormous, running into billions
of dollars in Worst Case scenarios. There have been huge improvements in tanker safety in the last
decade or so, as oil carriers realise that it is in their own interest as much as the public to avoid such
accidents as far as possible. As engineering standards improve, so the rate of accidents should
decrease. The analysis initiated with this paper can help making rational decisions about where
future investments into oil transit safety and further regulations from national and supra-national
authorities should be focused.
The analysis is currently being extended. Our research agenda includes the following issues:
• Refining the methodology: extend to other accident causes, anchor spill probabilities on more
recent data, create weightings from European spill statistics, use more accurate European
data for specific cleanup costs, factor in technology developments for spill prevention and
cleanup;
• Extending the coverage of the evaluation exercise: diversify by actual spill and tanker size,
apply the methodology to other tanker routes, adapt and apply the methodology to pipelines;
21 [5]

20
• Extending the scope of the evaluation exercise: include impacts on the environment and
socioeconomic activities, include risk aversion, apply benefit transfer methodology for the
evaluation of non-monetized impacts.
We expect the impact of these developments to be considerable. By way of illustration, consider that
back-of-the-envelope application of benefit transfer methodology indicates a willingness to pay for
Istanbul inhabitants up to 400 million dollars, in order to avoid an Average size spill in the
Bosphorus.

21
6. References
[1] ALEXOPOULOS, A. B., DOUNIAS, G., An Assessment of Vessel Source Oil Pollution Incidents in the Mediterranean Sea Using Inductive Machine Learning Methodologies, Aegean Working Papers, Issue 1, December 2003.
[2] EUROPEAN COMMISSION, World Energy, Technology and Climate Policy Outlook –
WETO – 2030, EUR 20366, 2003.
[3] HILDREW, James C., Case Study for Workshop on Environmental Valuation Oil Spills Preparedness, Caspian Environment Program: GEF/PIPP Training Component, 2001.
[4] HEISSELBERG, Lars Peter (Editor), GAC News, No. 1, January/February 2002
[5] ENI, Progetto di By-Pass del Bosforo: Stima del costo di trasporto via mare, Rome, March
2005.
[6] NITZOV, Boyko, The Bosphorus: Oil Through the Eye of a Needle [On-line], (page visited 29/06/2005), www.treemedia.com/cfrlibrary/ library/bosphorus/nitzov.html
[7] SOLIGO, Ronald, The Economics of Transport Routes for Caspian Oil [On-line] (page
visited 07/07/05) http://denizhukuku.bilgi.edu.tr/doc/Caspian_conference_bilgi_soligo.doc
[8] BRITO, Dagobert L., Congestion of the Turkish Straits: A Market Alternative February, 1999 [on-line] (page visited 08/07/05) www.ruf.rice.edu/~econ/papers/1999papers/08Brito.pdf
[9] WORLD WILDLIFE FUND, Mediterranean Marine Gap Analysis [On-line] 2004 (page
visited 13/07/05) <http://panda.bluegecko.net:8080/downloads/europe/background.doc
[10] Trade and Environment Database, Bosphorus Straits Regulation and Central Asian Oil, [On-line], (page visited 08/07/05) http://www.american.edu/TED/bosporus.htm
[11] BILARDO, Ugo, MUREDDU, Giuseppe, Traffico Petroliero e Sostenibilità
Ambientale, Unione Petrolifera, 2004. 350 p.
[12] EUROPEAN MARITIME SAFETY ORGANISATION, Action Plan For Oil Pollution Preparedness and Response, [On-line] 2004 (page viewed 25/06/05)
[13] ALEXOPOULOS, A. B., DOUNIAS, G., An Assessment of Vessel Source Oil
Pollution Incidents in the Mediterranean Sea Using Inductive Machine Learning Methodologies, Aegean Working Papers, Issue 1, December 2003.
[14] M.E.H.R.A., Factors Influencing Vessel Risks in UK Waters, Appendix 2[On-line]
1999 (page visited 05/08/05) www.defra.gov.uk/environment/consult/mehra/pdf/appx2.pdf
[15] FRIIS – HANSEN, Peter, DITLEVSEN, Ove, Nature preservation acceptance model applied to tanker oil spill simulations, Structural Safety, Vol. 25, No.1 pages 1 – 34, 2002.

22
[16] BROWN, A.J., AMROZOWICZ, M., Tanker Environmental Risk - Putting the Pieces Together", Joint SNAME/SNAJ Conference on Designs and Methodologies for Collision and Grounding Protection of Ships, San Francisco, 1996.
[17] BROWN, A.J., AMROZOWICZ, M, GOLAY, M, A Probabilistic Analysis of Tanker
Groundings, 7th International Offshore and Polar Engineering Conference, Honolulu, Hawaii, May, 1997.
[18] BROWN, A.J. (2001b), Collision Scenarios and Probabilistic Collision Damage, 2nd
International Conference on Collision and Grounding, Copenhagen, Denmark, pp. 259-272.
[19] Committee for evaluating Double Hull Tanker Design Alternatives, Special Report 259 – Environmental Performance of Tanker Designs in Collision and Grounding – Method for Comparison. National Academy Press, Washington D.C., 2001 [On-line] (page visited 08/08/05) http://trb.org/publications/sr/sr259.pdf
[20] M.E.H.R.A., Factors Influencing Vessel Risks in UK Waters, Appendix 6 [On-line]
1999 (page visited 24/08/05) www.defra.gov.uk/environment/consult/mehra/pdf/appx6.pdf
[21] ETKIN, Dagmar Schmidt, Cleanup Costs for Oil Spills in Ports, Port Technology International [On-line] (page visited 04/08/05) www.porttechnology.org/journals/ed8/download/08.237.pdf
[22] MARTINI, Natalia, PATRUNO, Roberto, Oil pollution Risk Assessment and
Preparedness in the East Mediterranean, 2005 International Oil Spill Conference [On-line] (page viewed 03/09/05) www.itopf.com/iosc2005martini.pdf
[23] ETKIN, Dagmar Schmidt, Comparative Methodologies for Estimating On-Water
Response Costs for Oil Spills 2001 Interanational Oil Spill Conference p.1281
[24] SIRKAR, Jaideep, AMEER, Paul, BROWN, Alan, GOSS, Patrick, MICHEL, Keith, NICASTRO, Frank, WILLIS, Wayne, A Framework For Assessing the Environmental Performance of Tankers in Accidental Groundings and Collisions, Transactions, SNAME
[25] BROWN, A.J., HAUGENE, B, Assessing the Impact of Management and
Organizational Factors on the Risk of Tanker Grounding, 8th International Offshore and Polar Engineering Conference, ISOPE-98-HKP-03, May 1998
[26] Mallen Baker, Companies in Crisis – What not to do when it all goes wrong – [On-
line] (page viewed 10/09/05) www.mallenbaker.net/csr/CSRfiles/crisis03.html [27] NAVRUD, S. Impact Pathway Approach (IPA) How to apply it and combine it with
Risk Assessment, NEEDS Research Stream 1c Meeting March 2005
[28] ITOPF, Black Sea Regional Profile, [On line] (page viewed 15/09/05) www.itopf.com/country_profiles/profiles/Blacksea.pdf
[29] ITOPF, Mediterranean Regional Profile, [On line] (page viewed 15/09/05)
www.itopf.com/country_profiles/profiles/Mediterranean.pdf

23
[30] ETKIN, Dagmar Schmidt, Modeling Oil Spill Response and Damage Costs, [On-line] (Page viewed 14/09/05) www.epa.gov/oilspill/etkin2_04.pdf

24
Ap
pen
dix
: F
ault
Tre
es f
or
Co
llisi
on
an
d g
rou
nd
ing
Co
llis
ion
Eva
siv
e a
cti
on
no
t p
os
sib
leO
the
r ve
ss
el
no
t d
ete
cte
d
Eva
siv
e a
cti
on
no
t ta
ke
n
Oth
er
ves
se
lIn
err
on
eo
us
po
sit
ion
*
De
sir
ed
tra
ck
un
sa
fe
Co
urs
e d
evi
ate
sfr
om
sa
fe
de
sir
ed
tra
ck
Un
tim
ely
a
cti
on
Err
or
no
td
ete
cte
d
Re
me
dia
l a
cti
on
no
tta
ke
n
Err
or
de
tec
ted E
rro
ne
ou
sa
cti
on
Un
tim
ely
ac
tio
n
Wro
ng
re
sp
on
se
Wro
ng
o
rde
rsR
es
po
ns
ed
ela
yed
Ord
ers
d
ela
yed
Info
no
t c
orr
ec
tly
us
ed
Me
as
ure
me
nt
err
or
Se
ns
or
err
or
Err
on
eo
us
ac
tio
n
Wro
ng
res
po
ns
eW
ron
g
ord
ers
Re
sp
on
se
d
ela
yed
Ord
ers
d
ela
yed
1,9
5E
-4
2.9
8E
-3
1,3
8E
-2
1,0
E-6
Vis
ion
im
pa
irm
en
t
Se
ns
or
err
or
1,0
E-6
0,0
5
4,1
1E
-5
0.9
99
9
2,3
71
E-4
Ma
no
uve
rn
ot
po
ss
ible
2.3
7E
-6
Me
ch
an
ica
lF
ail
ure
No
tim
eT
o r
es
po
nd
0.0
1
0.0
1
*=
Gro
un
din
g o
bs
tac
le f
or
gro
un
din
g t
ree
Annex 1 –Fault Trees

25
G
roun
ding
Pow
ered
G
roun
ding
Drif
t Gro
und
ing
Uns
afe
win
d/cu
rren
tA
ssis
tanc
efa
ilure
Anc
hor
failu
reLo
st
stee
ring/
prop
ulsi
on
Cou
rse
leav
esde
sire
d tr
ack
Des
ired
trac
k un
safe
Obj
ect
in p
ath
Eva
sive
act
ion
not t
aken
*
Err
or u
ndet
ecte
d or
not
cor
rect
ed*
Ass
ista
nce
not
requ
ired
Ass
ista
nce
does
not
arriv
e Una
ble
to
corr
ect s
hip E
nviro
nmen
tal
cons
trai
nt Ope
ratio
nal
erro
r
Mat
eria
lfa
ilure
Anc
hor n
ot
cons
ider
ed
Ope
ratio
nal
erro
rM
ater
ial
failu
re
0.01
0.3
0.25
8.4E
-4 p
er h
our
4.58
1E-6
2.37
E-4
*See
col
lisio
n tr
ee
Gro
undi
ng
Pow
ered
G
roun
ding
Drif
t Gro
und
ing
Uns
afe
win
d/cu
rren
tA
ssis
tanc
efa
ilure
Anc
hor
failu
reLo
st
stee
ring/
prop
ulsi
on
Cou
rse
leav
esde
sire
d tr
ack
Des
ired
trac
k un
safe
Obj
ect
in p
ath
Eva
sive
act
ion
not t
aken
*
Err
or u
ndet
ecte
d or
not
cor
rect
ed*
Ass
ista
nce
not
requ
ired
Ass
ista
nce
does
not
arriv
e Una
ble
to
corr
ect s
hip E
nviro
nmen
tal
cons
trai
nt Ope
ratio
nal
erro
r
Mat
eria
lfa
ilure
Anc
hor n
ot
cons
ider
ed
Ope
ratio
nal
erro
rM
ater
ial
failu
re
0.01
0.3
0.25
8.4E
-4 p
er h
our
4.58
1E-6
2.37
E-4
*See
col
lisio
n tr
ee

NOTE DI LAVORO DELLA FONDAZIONE ENI ENRICO MATTEI Fondazione Eni Enrico Mattei Working Paper Series
Our Note di Lavoro are available on the Internet at the following addresses: http://www.feem.it/Feem/Pub/Publications/WPapers/default.html
http://www.ssrn.com/link/feem.html http://www.repec.org
http://agecon.lib.umn.edu
NOTE DI LAVORO PUBLISHED IN 2006
SIEV 1.2006 Anna ALBERINI: Determinants and Effects on Property Values of Participation in Voluntary Cleanup Programs: The Case of Colorado
CCMP 2.2006 Valentina BOSETTI, Carlo CARRARO and Marzio GALEOTTI: Stabilisation Targets, Technical Change and the Macroeconomic Costs of Climate Change Control
CCMP 3.2006 Roberto ROSON: Introducing Imperfect Competition in CGE Models: Technical Aspects and Implications KTHC 4.2006 Sergio VERGALLI: The Role of Community in Migration Dynamics
SIEV 5.2006 Fabio GRAZI, Jeroen C.J.M. van den BERGH and Piet RIETVELD: Modeling Spatial Sustainability: Spatial Welfare Economics versus Ecological Footprint
CCMP 6.2006 Olivier DESCHENES and Michael GREENSTONE: The Economic Impacts of Climate Change: Evidence from Agricultural Profits and Random Fluctuations in Weather
PRCG 7.2006 Michele MORETTO and Paola VALBONESE: Firm Regulation and Profit-Sharing: A Real Option Approach SIEV 8.2006 Anna ALBERINI and Aline CHIABAI: Discount Rates in Risk v. Money and Money v. Money Tradeoffs CTN 9.2006 Jon X. EGUIA: United We Vote CTN 10.2006 Shao CHIN SUNG and Dinko DIMITRO: A Taxonomy of Myopic Stability Concepts for Hedonic Games NRM 11.2006 Fabio CERINA (lxxviii): Tourism Specialization and Sustainability: A Long-Run Policy Analysis
NRM 12.2006 Valentina BOSETTI, Mariaester CASSINELLI and Alessandro LANZA (lxxviii): Benchmarking in Tourism Destination, Keeping in Mind the Sustainable Paradigm
CCMP 13.2006 Jens HORBACH: Determinants of Environmental Innovation – New Evidence from German Panel Data SourcesKTHC 14.2006 Fabio SABATINI: Social Capital, Public Spending and the Quality of Economic Development: The Case of ItalyKTHC 15.2006 Fabio SABATINI: The Empirics of Social Capital and Economic Development: A Critical Perspective CSRM 16.2006 Giuseppe DI VITA: Corruption, Exogenous Changes in Incentives and Deterrence
CCMP 17.2006 Rob B. DELLINK and Marjan W. HOFKES: The Timing of National Greenhouse Gas Emission Reductions in the Presence of Other Environmental Policies
IEM 18.2006 Philippe QUIRION: Distributional Impacts of Energy-Efficiency Certificates Vs. Taxes and Standards CTN 19.2006 Somdeb LAHIRI: A Weak Bargaining Set for Contract Choice Problems
CCMP 20.2006 Massimiliano MAZZANTI and Roberto ZOBOLI: Examining the Factors Influencing Environmental Innovations
SIEV 21.2006 Y. Hossein FARZIN and Ken-ICHI AKAO: Non-pecuniary Work Incentive and Labor Supply
CCMP 22.2006 Marzio GALEOTTI, Matteo MANERA and Alessandro LANZA: On the Robustness of Robustness Checks of the Environmental Kuznets Curve
NRM 23.2006 Y. Hossein FARZIN and Ken-ICHI AKAO: When is it Optimal to Exhaust a Resource in a Finite Time?
NRM 24.2006 Y. Hossein FARZIN and Ken-ICHI AKAO: Non-pecuniary Value of Employment and Natural Resource Extinction
SIEV 25.2006 Lucia VERGANO and Paulo A.L.D. NUNES: Analysis and Evaluation of Ecosystem Resilience: An Economic Perspective
SIEV 26.2006 Danny CAMPBELL, W. George HUTCHINSON and Riccardo SCARPA: Using Discrete Choice Experiments toDerive Individual-Specific WTP Estimates for Landscape Improvements under Agri-Environmental SchemesEvidence from the Rural Environment Protection Scheme in Ireland
KTHC 27.2006 Vincent M. OTTO, Timo KUOSMANEN and Ekko C. van IERLAND: Estimating Feedback Effect in Technical Change: A Frontier Approach
CCMP 28.2006 Giovanni BELLA: Uniqueness and Indeterminacy of Equilibria in a Model with Polluting Emissions
IEM 29.2006 Alessandro COLOGNI and Matteo MANERA: The Asymmetric Effects of Oil Shocks on Output Growth: A Markov-Switching Analysis for the G-7 Countries
KTHC 30.2006 Fabio SABATINI: Social Capital and Labour Productivity in Italy ETA 31.2006 Andrea GALLICE (lxxix): Predicting one Shot Play in 2x2 Games Using Beliefs Based on Minimax Regret
IEM 32.2006 Andrea BIGANO and Paul SHEEHAN: Assessing the Risk of Oil Spills in the Mediterranean: the Case of the Route from the Black Sea to Italy

(lxxviii) This paper was presented at the Second International Conference on "Tourism and Sustainable Economic Development - Macro and Micro Economic Issues" jointly organised by CRENoS (Università di Cagliari and Sassari, Italy) and Fondazione Eni Enrico Mattei, Italy, and supported by the World Bank, Chia, Italy, 16-17 September 2005. (lxxix) This paper was presented at the International Workshop on "Economic Theory and Experimental Economics" jointly organised by SET (Center for advanced Studies in Economic Theory, University of Milano-Bicocca) and Fondazione Eni Enrico Mattei, Italy, Milan, 20-23 November 2005. The Workshop was co-sponsored by CISEPS (Center for Interdisciplinary Studies in Economics and Social Sciences, University of Milan-Bicocca).
2006 SERIES
CCMP Climate Change Modelling and Policy (Editor: Marzio Galeotti )
SIEV Sustainability Indicators and Environmental Valuation (Editor: Anna Alberini)
NRM Natural Resources Management (Editor: Carlo Giupponi)
KTHC Knowledge, Technology, Human Capital (Editor: Gianmarco Ottaviano)
IEM International Energy Markets (Editor: Anil Markandya)
CSRM Corporate Social Responsibility and Sustainable Management (Editor: Sabina Ratti)
PRCG Privatisation Regulation Corporate Governance (Editor: Bernardo Bortolotti)
ETA Economic Theory and Applications (Editor: Carlo Carraro)
CTN Coalition Theory Network