assessment of advanced coal-based electricity generation
TRANSCRIPT

Debyani Ghosh
Energy Technology Innovation Projecta joint project of the
Science, Technology and Public Policy Programand the
Environment and Natural Resources ProgramBelfer Center for Science and International
Affairs
S E P T E M B E R 2 0 0 5
2 0 0 5 - 0 2
Assessment of Advanced
Coal-Based Electricity
Generation Technology
Options for India: Potential
Learning from U.S. Experiences

Assessment of Advanced Coal-Based Electricity Generation Technology Options for India: Potential Learning from U.S. Experiences
Debyani Ghosh Energy Technology Innovation Project
September 2005
i
Citation This paper may be cited as: Ghosh, Debyani “Assessment of Advanced Coal-Based Electricity Generation Options for India: Potential Learning from U.S. Experiences”, BCSIA Discussion Paper 2005-02, Energy Technology Innovation Project, Kennedy School of Government, Harvard University, 2005. Comments are welcome and may be directed to Kelly Sims Gallagher at BCSIA, Kennedy School of Government, Harvard University, 79 JFK Street, Cambridge, MA 02138. The views expressed within this paper are the author’s and do not necessarily reflect those of the Science, Technology, and Public Policy Program, the Belfer Center for Science and International Affairs, or Harvard University. This paper is available at www.bcsia.ksg.harvard.edu/energy. The Energy Technology Innovation Project The overarching objective of the Energy Technology Innovation Project (ETIP) is to determine and then seek to promote adoption of effective strategies for developing and deploying cleaner and more efficient energy technologies in three of the biggest energy-consuming nations in the world: China, India, and the United States. These three countries have enormous influence on local, regional, and global environmental conditions through their energy production and consumption. ETIP researchers seek to identify and promote strategies that these countries can pursue, separately and collaboratively, for accelerating the development and deployment of advanced energy options that can reduce conventional air pollution, minimize future greenhouse-gas emissions, reduce dependence on oil, facilitate poverty alleviation, and promote economic development. ETIP's focus on three crucial countries rather than only one not only multiplies directly our leverage on the world scale and facilitates the pursuit of cooperative efforts, but also allows for the development of new insights from comparisons and contrasts among conditions and strategies in the three cases.

ii
Acknowledgements This paper draws on research carried out under the Energy Technology Innovation Project in the Belfer Center for Science and International Affairs, Kennedy School of Government, Harvard University, with support from the Energy Foundation, the Heinz Family Foundation, the William and Flora Hewlett Foundation, the David and Lucile Packard Foundation, and the Winslow Foundation.

iii
List of Acronyms AFBC Atmospheric Fluidized Bed Combustion ACFB Atmospheric Circulating Fluidized Bed Combustion BFBC Bubbling Fluidized Bed Combustion BHEL Bharat Heavy Electricals Limited BTU British Thermal Unit CAAA Clean Air Act Amendment CCPI Clean Coal Power Initiative CCT Clean Coal Technology CENPEEP Centre for Power Efficiency and Environmental Protection CFB Circulating Fluidized Bed CFBC Circulating Fluidized Bed Combustion CO2 Carbon dioxide gas CPRI Central Power Research Institute CURC Coal Utilization Research Council DOE Department of Energy EPA Environmental Protection Agency EPDC Electric Power Development Corporation EPRI Electric Power Research Institute ESP Electro Static Precipitator FBC Fluidized Bed Combustion FE Fossil Energy FGD Flue Gas Desulphurization GEP Greenhouse Gas Pollution Prevention GHG Green House Gas GW Giga Watt HHV Higher Heating Value IGCC Integrated Gasification Combined Cycle IPP Independent Power Producer LEBS Low Emission Boiler System LHV Lower Heating Value LNB Low NOX Burner MW Mega Watt MT Metric ton NEET National Environmental and Energy Technology NETL National Energy Technology Laboratory NOX Nitrogen oxides NRC National Research Council NSPS New Source Performance Standards NSR New Source Review NTPC National Thermal Power Corporation OT Oxygenated Treatment PC Pulverized Coal PFB Pressurized Fluidized Bed PFBC Pressurized Fluidized Bed Combustion PPA Power Purchase Agreement Ppm Parts per million PSDF Power Systems Development Facility RD3 Research, Development, Demonstration, and Deployment SC Super Critical

iv
SCPC Super Critical Pulverized Coal SCR Selective Catalytic Reduction SNCR Selective Non Catalytic Reduction SO2 Sulfur di-oxide gas TVA Tennessee Valley Authority USAID United States Agency for International Development USC Ultra Super Critical

v

vi
Executive Summary India has huge domestic reserves of coal and predominantly depends on coal-based
electricity generation to meet a substantial portion of its electricity generation requirements. Economic and security drivers are likely to ensure coal’s dominance in India’s energy scenario and especially in the electricity sector for many more years to come. Coal-based electricity is primarily generated from conventional sub-critical pulverized coal technologies, and most of these plants operate with low conversion efficiencies of coal to electricity. The poor performance of coal-based power plants in India is attributed to diverse factors: • problems related to the coal supply industry; • lack of performance standards; • insufficient incentives for performance improvements due to near-absence of market
competition, and distortions in the fuel supply and electricity market; • inadequate investments in public R&D efforts; • poor operational and management practices; • insufficient investments for technological advancements; • lack of information and awareness; and inadequate public policy initiatives. Regulations that reduce negative environmental impacts associated with coal use are inadequate. Increasing reliance on imported natural gas, due to rapid expansion of natural gas-based capacity over the past decade or so, raises serious concern about security and reliability of supply. The natural gas capacity has been driven to a large extent by inefficiencies and difficulties in coal supply. In this context, the country is increasingly facing the challenge of being able to utilize coal in an efficient manner, keeping in mind development priorities as well as the need to minimize harmful environmental impacts.
At present, there is little strategic thinking in India for advancements in the current technological stock, as well as for demonstration and deployment of advanced generation technologies in future based on coal. The country needs to embark on a path of strategic energy planning in its economic and security interests that lays a foundation for coal usage in an economically efficient and environmentally sustainable manner. There remains significant need and opportunities for advancements in coal-based electricity generation technologies in the country. As the growth in demand is likely to be substantial for setting up base load plants, possibilities of reaping scale economy advantages are significantly high. Additionally, many of the existing plants will soon be due for retirement and there is likely to be a turnover of the present technological stock. This potential for investments in substantial new capacities also presents opportunities for leapfrogging to advanced technologies. Along with the high growth rate in demand and energy supply, substantial investments in energy supply infrastructure are likely in future- therefore unlike in developed countries where the energy supply infrastructure is already locked in, there is scope for alterations in the present mix of energy supply options.
There is a lack of systematic assessment studies that evaluate different coal-based electricity generation technology options that would best be able to address economic, environmental, and energy security objectives. The absence of systematic assessment studies raise concerns surrounding the dangers of a priori picking a ‘technology winner’. Such studies also serve as extremely useful policy linkages by providing inputs to the policy maker on decision-making and formulating policies with respect to technology choices. This study is an attempt to fulfill these objectives. It reviews the historical and current state of knowledge with respect to research, development, demonstration, and deployment efforts (RD3) in different categories of coal-based electricity generation technologies along with ongoing efforts towards future advancements. In the United States, RD3 efforts related to coal have been long-standing, and have resulted in significant advancements in coal-based electricity generation technologies. A historical review of overall coal-related programmatic efforts as well as technology-specific experiences in coal-based generation advancements in the United States could potentially be useful for India in designing public policies and programs as well as making technology choices and launching technology-specific RD3 efforts.

vii
One would need to keep in mind overall, however, contextual country-specific differences in terms of the following factors- landscape features of coal and electricity industries in both countries, historical perspectives that relate to the manner in which these sectors evolved and currently operate, roles of actors and institutions and their networks, and national priorities and development plans, just to name a few.
This paper analyses levelised generation costs from different coal technologies for the Indian situation. It assesses their relative competitiveness with natural gas based technologies, changes in relative competitiveness among these technologies with variations in certain key factors such as natural gas and coal prices, rate of advancements in technologies and likely imposition of global environmental constraints for controlling carbon dioxide emissions. Based on the assessment of different technological options for India and drawing on the review of coal technologies as well as potential lessons from U.S. experiences, the paper makes suggestions for technology-specific RD3 efforts that India could engage in. It also discusses crosscutting factors that assume importance across all technology categories. The analysis in the paper is likely to be useful in laying a foundation for a ‘technology roadmap’ for the future and for prioritization of current and future energy research development, demonstration, and deployment (ERD3) efforts with respect to coal based generation technology advancements.
An assessment of India’s clean coal technology choices indicates that there is no silver bullet in terms of one technology that overcomes all the challenges. The country needs to develop a portfolio of clean coal technologies with varying degrees of RD3 efforts across these technologies depending on short, medium and long-term targets aimed at fulfillment of macroeconomic, security, and environmental objectives. Like in the U.S. case, development of a clean coal technology roadmap for India that outlines RD3 efforts in different advanced coal technologies will help prioritize the country’s needs in moving towards a sustainable energy future dependent on coal. Analysis in the paper shows that in the Indian context, competitiveness among coal and gas technologies is extremely sensitive to natural gas price variations. Coal technologies emerge competitive with combined cycle gas turbine technologies at relatively low levels of natural gas prices of $3.5/GJ and higher. Reforms aimed at improving efficiency of the electricity sector should be pursued simultaneously with coal market development that seeks alterations in present institutions, actors, supply, and prices.
Among coal technology options, the analysis here establishes the robustness of supercritical PC technology across a wide range of scenarios, thereby warranting top priority in ERD3 efforts. Supercritical PC is a commercially mature technology – so learning from technology development and deployment experiences in the United States and other countries will be relevant for India. Future regulations on SO2 emissions from power plants are likely to push deployment of supercritical PC with FGD as the most economic and best control technology. The analysis indicates that under the Indian situation, the efficiency advantage of supercritical is substantial enough to outweigh its higher costs, even with relatively high cost estimates and low coal prices. One needs to assess India’s R&D capabilities in development of advanced materials, however, as well as its manufacturing strengths related to supercritical development. Knowledge transfer and co-operation with the United States in the area of advanced materials development, as well as operating experiences, are likely to be useful for India. Among other coal technology options – AFBC deployment in India, as in the United States, is likely to be primarily pushed by independent power producers (IPPs), rather than Investor-Owned-Utilities (IOUs). Co-firing using different kinds of coal and biomass/wood waste, currently being demonstrated in the United States, may find some niche application areas in India, where a mix of coal and biomass can be used. Experiences from such ACFB projects in the United States may prove useful for the IPPs as well as industrial level power generators in India.
The fuel flexibility advantage of PFBC is similar to that of AFBC, and this technology also may find some niche application areas in India for fuels that are unsuitable for utilization in PC

viii
plants. PFBC is unlikely to emerge as an economic choice over supercritical PC except in niche application areas where waste fuels, which are unsuitable for use in PC, are to be utilized. Also, medium and long-term deployment opportunities for PFBC are likely to be limited due to competition from IGCC. Therefore, the market potential of PFBC needs to be systematically assessed before embarking on any RD3 efforts. U.S. experiences show that commercial deployment opportunities for first-generation systems are limited because they do not offer significant efficiency and/or economic advantages over conventional PC technology to justify their high capital costs. Demonstrations of first-generation PFBC systems may be considered as a transition strategy for second-generation PFBC development in India that is likely to have substantial performance improvements.
The primary driver for IGCC deployment is its superior environmental benefits. Analysis for the Indian case shows that first-generation IGCC without carbon capture has potential to reduce CO2 emissions by a tenth as compared to emissions from supercritical PC and by a fifth as compared to less efficient subcritical PC technologies. It is unlikely that first-generation IGCC will emerge as an economic choice over super-critical PC unless there are significant advancements in reducing costs and/or increasing efficiency in IGCC systems. IGCC becomes competitive with supercritical PC and PFBC only under a considerably high penalty level of $200/tonne of carbon and higher. But, IGCC competitiveness is significantly enhanced under a scenario that considers carbon capture and storage. Analysis results show that under such a scenario, the break-even tax level at which IGCC emerges as an economic choice over supercritical PC and PFBC is around $75 per tonne of carbon. Thus, addressing climate change by including a carbon capture and storage approach is likely to significantly enhance deployment opportunities for IGCC. A thrust on IGCC development and deployment efforts from the point of view of addressing climate change concerns will, therefore, have to be pursued for its own sake, as technology assessments point to a disjoint between technology choices and competitiveness among technologies for addressing local and global environmental concerns.
For the Indian situation, the break-even natural gas price at which IGCC (first-generation) become competitive with NGCC ranges from $5-5.5/GJ. Thus it may be useful for India to pursue IGCC development as a hedging strategy in light of future uncertainties with respect to natural gas prices. Learning experiences from first-generation IGCC plants may be useful for India, primarily in terms of operating and environmental performances. Economic estimates, derived from the U.S. projects, would have to be applied in the Indian context. U.S. experiences may provide some guidelines towards cost estimations. A crucial aspect of demonstration would be to test operation of several subsystems of an IGCC at full-commercial scale, as systems integration is one of the key aspects of IGCC development. Though operational and environmental performances of first-generation IGCC systems have been well demonstrated, exploring deployment opportunities will require addressing substantial reliability and availability concerns, and associated high-risk perception among utilities and investors. There remains a need to assess the viability of polygeneration options for India that has potential to significantly improve IGCC market potential by providing economies of scope. In India, demonstrations of advanced IGCC systems that are integrated with fuel cell operations should be undertaken only if first-generation IGCC projects have been demonstrated successfully. Finally, under a future scenario that imposes regulations on mercury emissions in India, IGCC would be preferred over other coal technology options due to its substantial cost advantages with respect to controlling mercury emissions as compared to other coal technologies.
It is necessary at the national policy planning level to have a coherent vision for the electricity and coal sectors in India that integrates objectives for both sectors. Without simultaneous pursuit of coal and electricity market reforms, a clean-coal technology vision for India is likely to fall short of attaining its objectives. Reforms in the coal industry with likely improvements in coal supply quality and reliability, along with economic attractiveness prospects of advanced coal technologies, are likely to induce greater private participation in this sector. Along with generators

ix
and coal suppliers, there needs to be increased participation of other relevant stakeholders such as foreign and domestic equipment manufacturers, banks and financial institutions, environmental agencies, regulatory organizations, research institutes, non-governmental organizations, and policy makers across different relevant government departments. An institutional mechanism for interactions among these different groups of stakeholders would enable information dissemination and learning on technology performances and costs. A primary requirement is to integrate sectoral policies relevant to clean-coal technology development and deployment efforts across different government portfolios handling energy and environment issues. The capability of public institutions in undertaking R&D activities need to be strengthened in terms of greater resource availability as well as building stronger human and infrastructure capabilities. Last, but not least, greater initiatives are needed on part of the government to generate mechanisms for international co-operation in advanced coal technology RD3 efforts involving different groups of public and private stakeholders.

1
1. Introduction 1.1 Context and relevance of present study India is the third largest coal producer in the world with more than 327 MT of coal consumption in the year 2000 (EIA, 2004). More than two-thirds of the coal produced in India is used for electricity generation. Current coal-based generation capacity in the country is close to 65 GW1. The growth in electricity capacity has not been able to keep pace with increasing demand leading to increasing shortages in electricity supply plaguing all sectors of the economy2. Substantial expansion of base-load capacity is likely to meet this shortfall as well as rapidly increasing new demand. The International Energy Outlook (EIA, 2004), forecasts that while the country’s economy is expected to expand more than three folds in the next 25 years and the electricity consumption more than double, coal use is likely to increase by 70 percent, implying that India will need to build close to 57 GW of additional coal-fired capacity in the next 25 years (EIA, 2004). The reliance on domestic coal is likely to continue for many more years to come due to substantial amount of domestic reserves3. While the growth in coal capacity has been relatively slow, natural gas based generation capacity in the country has been increasing very rapidly. There is increasing concern over the rapid expansion of natural gas based capacity over the past decade or so, driven to a large extent by inefficiencies and difficulties in coal supply. India has limited domestic reserves of natural gas and future likely growth in demand is likely to be met by imports, primarily in the form of liquefied natural gas (LNG) from middle-east countries. This has the danger of exposing the country to import vulnerabilities and price fluctuations as well as substantial investments in LNG supply infrastructure that is likely to be locked into the country’s energy system for long periods of time. Hydro based capacity accounts for only a quarter of the total capacity – future expansion of large hydro capacity is likely to be restricted due to significant social and environmental difficulties confronting such projects that result in their substantial time and cost overruns. Renewable capacity – comprising of small hydro, wind, biomass, and solar technologies – aggregates to a present capacity of about 4.8 GW, which is close to 4 percent of the overall power generation installed capacity4. Though renewable technologies are likely to increase their contribution in electricity generation, especially in niche application areas, their share relative to fossil energy sources is likely to remain small. Therefore, India’s energy landscape is likely to be dominated by coal for many years to come. The country needs to embark on a path of strategic energy planning in its economic and security interests that lays a foundation for coal usage in an economically efficient and environmentally sustainable manner.
In this context, there remains significant need and opportunities for advancements in coal-based electricity generation technologies in the country. As the growth in demand is likely to be substantial for setting up base load plants, possibilities of reaping scale economy advantages are significantly high. Additionally, many of the existing plants will soon be due for retirement and there is likely to be a turnover of the present technological stock. This potential for investments in substantial new capacities also presents opportunities for leapfrogging to advanced technologies.
1 The installed coal based capacity as on 31st May 2004 was 65.45 GW. See Ministry of Coal website at http://powermin.nic.in/JSP_SERVLETS/internal.jsp 2 The electricity supply position at the beginning of Tenth Plan (2002) is one of shortages both in terms of demand met during peak time and overall energy supply. The overall peaking shortage has been around 12% and energy shortages 7.5% (See Background Note at India-IEA Joint Conference on Coal and Electricity in India, 22-23 September- New Delhi). 3 India has total 246 billion tones of hard coal reserves, of which 92 billion tones are proven (See Ministry of Coal, Government of India, website at http://coal.nic.in/) 4 About 4,800 MW of power generating capacity based on renewable energy sources has been installed in the country so far. (See Annual Report 2003-04, Ministry of Non-Conventional Energy Sources, Government of India, http://mnes.nic.in/annualreport/2003_2004_English/ch5_pg1.htm

2
Along with the high growth rate in demand and energy supply, substantial investments in energy supply infrastructure are also likely in the future – therefore, unlike in developed countries where the energy supply infrastructure is already locked in, there is scope for alterations in the present mix of energy supply options.
At present, there is little strategic thinking in India for advancements in the current technological stock as well as for demonstration and deployment of advanced coal-based generation technologies in future. Over the past many decades, both coal and electricity industries in the country have been dominated by government ownership and public monopolies. Both sectors are currently undergoing reforms, albeit slowly, to alter ownership structure, induce private participation and competition, and reduce price controls. The success of energy planning efforts towards technological advancements is likely to be dependent to a large extent on the manner in which these reforms progress. Almost all coal-based generation plants operate on subcritical pulverized coal technology (which is the most commonly deployed technology for coal conversion throughout the world) and a large fraction of the current stock of plants continue to operate at low conversion efficiencies. The low level of performance of coal plants can be attributed to various factors such as difficulties in coal supply and problems of poor fuel quality, technical problems in operation and maintenance of plants, managerial inefficiencies and institutional bottlenecks, lack of information and awareness, and insufficient incentives for performance improvements.
There has been a gross under-investment in technological advancement and public R&D efforts, primarily due to shortages in funds and a lack of strategic thinking on part of policy-makers. Private ownership constitutes less than 10 percent of the overall generation capacity and is much more in gas-based generation than in coal power plants (IEA, 2000). Among all the public utilities, which have almost 90 percent ownership of the generation capacity, only the federal utility, NTPC, which owns almost a fifth of the generation capacity, has been engaged in R&D and demonstration efforts domestically and in co-operation with international institutions. State-level utilities with more than 60 percent ownership of the generation capacity have very little involvement in R&D efforts (IEA, 2000). In the overall national energy planning process, decision-making with respect to technology choices is plagued by the involvement of a large number of entities and a loose co-ordination among their activities. Energy, electricity, and environmental policies lack sufficient integration and are often not synchronized among different departments of the government.
Generation technology choices will need to address current and emerging future concerns on environmental impacts associated with coal use. Current concerns are primarily associated with particulate matter emissions from power plants and their attendant adverse implications on human health. Huge amounts of flyash generation by coal power plants and very low ash utilization levels that presents significant storage and disposal problems. On the coal mining side, there remain significant concerns on environmental impacts associated with coal mining and extraction. Present sulfur dioxide (SO2) emission levels from coal plants are not a current concern due to the very low sulfur content (0.2 to 0.7 percent) in Indian coal (IEA, 2000). But with the future likelihood of multiple large capacity plants becoming clustered within a small geographical area, there are rising concerns with respect to high regional concentrations of SO2 emissions and future requirements to control these emissions. Plants using imported coal containing higher sulfur levels are also likely to require future emission controls. With respect to emissions of trace metals such as mercury, current concerns in India are at best non-existent, unlike in the United States. Even for existing regulations, implementation and performance monitoring for compliance remain weak, primarily due to institutional problems. On the global climate change front, India has ratified the Kyoto protocol and is a participant in international climate change arrangements that would help lower global CO2
emissions. However, India is keen to keep in mind national economic and development priorities. Keeping all these aspects in mind, strategic energy planning can very well embark the economy on future trajectories with low energy and emissions intensities, while fulfilling economic and energy security objectives.

3
1.2 Contents of the study
India must make strategic choices with respect to utilization of its energy resources (that is predominantly coal now and is likely to be in the future) to meet the rapidly increasing energy demand of its growing economy while fulfilling economic, energy security, and environmental objectives. However, there is a lack of systematic assessment studies that evaluate different coal-based electricity generation technology options to address some of the issues discussed earlier. The absence of systematic assessment studies raise concerns surrounding the dangers of a priori picking a ‘technology winner’, but it is also clear that some existing but underutilized technologies could provide significant benefits to India. Such studies also serve as extremely useful policy linkages by providing inputs to the policy maker on decision-making and formulating policies with respect to technology choices. The current paper conducts an assessment of coal technologies for India, and is likely to be useful in laying a foundation for a ‘technology roadmap’ for the future and for prioritization of current and future energy research development, demonstration, and deployment (ERD3) efforts with respect to coal based generation technology.
The paper reviews the historical and current state of knowledge with respect to R&D, demonstration, and deployment efforts (RD3) in different coal-based electricity generation technologies along with ongoing efforts towards their future advancements. Along with a general review of technologies, the paper specifically looks at U.S. technology advancement experiences. It summarizes the technology specific efforts within the broader context of Department of Energy’s (DOE’s) fossil energy and coal-related R&D programs, the project experiences from DOE’s Clean Coal Technology (CCT) Demonstration program, and the factors affecting deployment of advanced coal technologies in the United States.
Potential learning from U.S. experiences in coal technology RD3 efforts is relevant to India due to a number of reasons. The United States, like India, is primarily dependent on coal to meet the majority of its electricity generation requirements and is likely to be so in future. Investments in gas-based generation capacity have been growing rapidly, largely driven by attractiveness of natural gas-based technologies and deregulation of the electricity sector, with little or no investments in coal plants over more than two decades. However, recent rising of natural gas prices and future uncertainties associated with gas supply and prices are prompting a renewed thrust in coal technology options. In this context, both countries are confronted with a similar challenge of reducing natural gas dependency by strengthening efforts towards coal technology advancements. The United States has a diverse history of experiences related to coal-based electricity generation advancements and is engaged in many ongoing efforts towards developing and implementing comprehensive future energy strategies that rely primarily on coal for electricity generation. There has been substantial public investment in coal-related R&D activities, and strong public-private partnership arrangements have characterized technology demonstration efforts. Overall coal-related programmatic efforts as well as technology-specific experiences in coal-based generation advancements in the United States could potentially be useful for India in designing public policies and programs as well as making technology choices and launching technology-specific RD3 efforts.
While drawing on U.S. experiences, one needs to keep in mind the broader contextual country-specific differences between India and the United States, such as: (1) the different historical evolution of the coal and electricity sectors in the two countries and the different manner in which they currently operate and are likely to do so in future; (2) current and future macroeconomic growth patterns along with different national priorities and development plans that are likely to affect future energy trajectories; (3) structural differences in institutions between the two countries and in the characteristics of different actors of relevance to coal technology advancement efforts; (4) differences in likely drivers for RD3 efforts and in factors affecting technology deployment; and (5) social and cultural differences that are likely to affect technology choice and decision-making among actors.

4
In terms of assessing coal technology choices for India, the paper presents a levelised cost analysis of different coal-based technologies and assesses their relative competitiveness with gas-based technologies. It also analyzes changes in relative competitiveness among these technologies with variations in certain key factors such as natural gas and coal prices, rate of advancements in technologies and likely imposition of global environmental constraints for controlling carbon dioxide emissions. Based on the assessment of different technological options for India and drawing on the review of coal technologies as well as potential lessons from U.S. experiences, the paper makes suggestions for technology-specific RD3 efforts that India could engage in. Finally, some of the crosscutting factors that assume importance across all technology categories are discussed.

5
2. Review of coal-conversion technologies for electricity generation This section briefly reviews different categories of coal technologies in terms of their
process, current status, performance evolution over a period of time, critical technology development areas, and finally, their cost. Technologies for converting coal into electricity can be broadly categorized into: • pulverized coal (PC) combustion
o sub-critical PC o super-critical PC (SCPC) o ultra-supercritical PC (USC)
• fluidized bed combustion o atmospheric fluidized bed combustion (AFBC) o pressurized fluidized bed combustion (PFBC))
• integrated gasification combined cycle (IGCC) These technologies have evolved over a period of time and are in differing stages of development and deployment. 2.1 Pulverized coal (PC) combustion technology
Pulverized coal (PC) combustion technology is the most widely deployed coal-conversion technology across the world for electricity generation. The process of pulverized coal (PC) combustion replaced the earliest system for coal-based power generation – the traveling grate stoker furnace. PC technology is a commercially mature technology for coal combustion with a large and extensive base of operating experiences and expertise (Beer, 2000). In a PC plant, coal is pulverized to a powder and combusted in a boiler using air (NRC, 1995). Before the coal is grounded, it can be cleaned at the mine to reduce ash and sulfur content. The heat from combustion is transferred to water flowing in tubes in the boiler wall to produce high pressure and high temperature steam that in turn drives a turbine connected to an electric generator (NRC, 1995). The condensed steam is then returned to the boiler. Though the technology is able to burn a wide range of coals, associated costs are higher than for burning uniform coal (NRC, 1995).
The evolution of PC combustion technology has led to progressive advancements in materials used to manufacture boilers and steam turbines, much better understanding of the water cycle chemistry, and improvements in heat loss reductions. The thermal efficiency of the generation cycle depends upon the temperature and pressure of steam, thermal efficiency of the boiler, efficiency of the turbine and size of the boiler and the turbine (Joskow and Rose, 1985). The evolution of the steam-electric generating technology has focused on improving the design thermal efficiency of generating units, primarily by increasing steam-operating pressures (Rose and Joskow, 1990). Until the 1960s, the primary design changes that historically led to large increases in thermal efficiency include increasing the number of reheat and preheat cycles using multiple bleed points from turbines to increase average cycle efficiency (NRC, 1995). Since that time, the primary technological frontier has been in increasing steam pressure, and to a lesser extent, increasing the unit size5 (Joskow and Rose, 1985). The subcritical pressure cycle with one stage of reheating at 2400-psig/1000°F (166 bar/538°C) cycle has been the dominant design in the past and continues to be the most often selected cycle (IEA, 1998). The net thermal efficiency (conversion of fuel energy to electricity input to the grid) of U.S. coal-fired generating plants employing and operating this technology averages 33 percent (based on HHV)6 (NRC, 1995).
Supercritical boiler represents a fundamental departure from the subcritical technology – water is heated to a temperature above 706 degrees F at a pressure above 3206 psi and it directly
5 For central generating stations, unit size increase from 350 to 700 MW is likely to increase design efficiency by only 0.5 percent (Joskow and Rose, 1985). 6 33 percent efficiency based on Higher Heating Value (HHV) translates to 36.4 percent based on Lower Heating Value (LHV).

6
vaporizes to dry superheated steam (Joskow and Rose, 1985). Supercritical PC plants operate at almost 3-percentage points higher efficiency than subcritical units (that represents an 8 percent relative improvement in efficiency) (NCC, 2003). PC plant efficiency can be increased in steps to 45 percent LHV using supercritical steam parameters (steam pressure in excess of 3206 psi and temperatures in excess of 1050 degrees F) (NCC, 2003). Figure 2.1 illustrates improvements in plant efficiency through measures such as reduction in waste heat loss, improved combustion to reduce excess air, and reduction in stack temperature. SC steam parameters of 3750 psi/1000 °F single or double reheat with efficiencies that can reach 42 percent (LHV) represent a mature, commercially available technology for U.S. power plants (NCC, 2003). The nominal design efficiencies based on lower heating value and at the full load condition for these plants are: Subcritical ~ 38 percent, SC ~ 41 percent and USC ~ 45 percent (IEA, 1998). The supercritical (SC) cycle at 3500 psig/1000°F (240 bar/538°C) cycle has been used for a smaller number of plants and the ultra-supercritical (USC) with two stages of reheating at 4500 psig/1100°F (311 bar/593°C) is the state-of-the-art “commercially” available plant (NCC, 2003; NCC, 2002; NCC, 2000). State-of-the-art plants with full environmental controls have efficiencies of 38 to 42 percent, with the higher number corresponding to new supercritical steam units operating in Europe (NRC, 1995). Operation under supercritical conditions eliminates equipment required for saturated steam extraction, recycling and heating equipment for
Figure 2.1 Improving efficiency in PC power plants
Figure 2.1 illustrates improvements in plant efficiency through measures such as reduction in waste heat loss, improved combustion to reduce excess air, and reduction in stack temperature. Source: Figure 3.1 in National Coal Council, 2003. ‘Coal-related Greenhouse Gas Management Issues’, May 2003.
saturated steam- but requires additional materials expenditure. Progressive improvements in materials technology for boilers and steam turbines, plus improved understanding of power plant water chemistry fueled the development of this technology7. Materials development, post World War II, primarily related to advances in metallurgical knowledge gained during the war and used in aircraft and artillery. New super alloy steel resisted metal fatigue and cracking, and withstood steam at higher temperatures and pressures, thereby providing greater thermal efficiencies (Hirsch, 1989). Early units encountered operating problems in using these materials under conditions of 7 See ‘Ultrasupercritical Steam Turbines: Next-Generation Design and Materials’ EPRI Online journal, ; 4/26/2002 9:25:43 AM

7
high steam pressure and temperatures and water contaminants – leading to low unit availability8. However, these initial operational problems have largely have been overcome with further technological advancements (Hirsch, 1989).
Ultrasupercritical (USC) technology employs significantly higher steam temperatures and pressures beyond those traditionally employed for supercritical plants, which then leads to new demands on steam turbine design9. Advanced SC and Ultrasupercritical (USC) plants operate under steam parameters of 4500 psi and above 1050 degrees F, resulting in cycle efficiencies greater than 45 percent (LHV) for bituminous PC power plants (IEA, 1998). The challenge for USC is to maintain equipment reliability and operational flexibility under advanced steam conditions. R&D efforts in the United States and elsewhere are in place to develop advanced materials for USC plants10 that can have efficiency increases up to 50 percent (LHV) (NCC, 2003). They are expected to be available for deployment by 2010. More efforts are needed in USC cycle design, including research on steam turbine materials.
Technical and economic constraints made 1000 to 1050 degrees F the maximum practical temperature for a Rankine steam cycle during the mid-sixties to the mid-eighties (Joskow and Rose, 1985). But with a long history of supercritical operating experiences existing at present, the reliability of supercritical units is assessed to be at least as good as that of conventional sub-critical plants (IEA, 1998). This has been the result of significant advancements in metallurgy, equipment design, and water treatment methods. EPRI studies on relative reliability of coal-fired subcritical and supercritical plants in the United States show that conventional subcritical units have better reliability during the first ten years of operation, but by the time a supercritical unit was ten years old, the average outage caused by the pressure parts of the supercritical unit had leveled off at less than 500 hours/year (approximately 6 percent of availability per year) for all U.S. units, while for subcritical units the level was the same but climbing (IEA, 1998). For high-slagging and corrosive coals, corrosion problems at high temperatures makes supercritical less suitable – coal with greater than 2 percent sulphur causes superheater and reheater difficulties (IEA, 1998). Some solutions to this include boiler design optimization, use of higher alloy materials, and boiler water and steam circuitry redesign. Boiler tube leaks are a major issue for plant operation, often being the cause of loss of reliability (IEA, 1998). The leaks are often caused by water chemistry problems. A technical solution is to combine a 100 percent condensate polishing plant with oxygenated treatment (OT) as the cycle chemistry (IEA, 1998). Use of OT has significantly increased reliability and operability of supercritical units – in the United States a large number of supercritical units has been converted to OT since the early nineties (IEA, 1998). A critical component needed for higher steam temperatures is the materials for high and intermediate pressure turbine rotor. Research and development through the initiatives of the American and Japanese utilities, EPRI and EPDC, as well as through the European Power Plant manufacturers, has resulted in important progress in the development of improved materials for these components (IEA, 1998).
Whilst most of the new pulverized coal combustion installed and commissioned in OECD countries during the 1990s is supercritical PC, this has been predominantly in those countries where the cost of the coal is high, such as Denmark, Germany, the Netherlands, Japan and Korea (IEA, 1998). Subcritical plants continued to be built in places where coal is relatively cheap, such as Australia, Canada and the United States (IEA, 1998). The selection of subcritical over supercritical PC technology has primarily been driven by low fuel costs, although site-specific factors, such as capital cost, load factor, labour rates, and capital cost, also affect the choice. Worldwide, there are around 500 SCPC units – 46 percent in the former USSR, 12 percent in Europe, and 10 percent in
8 Possibilities of using special, high-alloy metals (austenitic steels) to overcome these problems increased costs significantly and thereby restricted their use (Hirsch, 1989). 9 See ‘Ultrasupercritical Steam Turbines: Next-Generation Design and Materials’ EPRI Online journal, ; 4/26/2002 9:25:43 AM 10 Advanced materials are required for the boiler, steam turbine, and associated piping.

8
Japan (NCC, 2000). In the United States, the movement to higher-pressure supercritical units (SC) began in the early 1960s, continued into the 1970s and then reversed itself in the early eighties (Joskow and Rose, 1985). The reverse was partially caused by relatively low reliability of supercritical units due to initial operational difficulties, but these problems have largely been overcome (Joskow and Rose, 1985). Low level of deployment in the United States is primarily due to low coal prices that do not offer sufficient incentives for efficiency improvements (NCC, 2002). SCPC plants are likely to be the choice for new central power plants in the short and medium term because of the relatively high cycle efficiency and the long experience with pulverized coal combustion (NCC, 2003). Costs of these plants are being continually reduced through technological advancements and learning experiences from currently operating plants. Further developments towards ultra-supercritical (USC) coal plants with 50 percent single cycle efficiency are dependent on progress in materials R&D- USC applications are expected past 2010 (Beer, 2000). Environmental performance of PC plants
In terms of emissions of pollutants such as SO2, NOX, and particulates, PC power plants are able to meet current or anticipated emissions reductions with existing control technologies (NRC, 1995). SO2 emissions up to 98 percent can be controlled using a flue gas desulfurization (FGD) process, such as a wet limestone scrubber (IEA, 1998). Advanced limestone FGD scrubbers typically produce gypsum as a by-product that can be safely landfilled or can be used for manufacturing items such as wallboard (IEA, 1998). NOX emissions are primarily controlled using low NOX burners (LNBs). Post combustion control technologies such as selective catalytic reduction (SCR) and selective non-catalytic reduction (SNCR) can be employed for NOX emissions control, but these raise costs (IEA, 1998). PC plants can achieve very high level of particulate control – flyash is efficiently collected in devices such as Electrostatic Precipitators (ESPs) or fabric filters. In terms of emissions of trace substances such as metals and organics, most volatile and semi-volatile trace metals condense on flyash particles and are effectively removed with the flyash. Elemental mercury may be emitted with the flue gas – operating costs for control of mercury emissions from PC plants can be substantial, however. Some mercury control is likely from SO2 and particulate emissions control (NCC, 2002). Other elements exit with the ash and FGD by-products. Trace organic emissions from PC plants are extremely low. CO2 emissions from PC plants may be higher than higher efficiency IGCC due to the relatively low cycle efficiency of PC plants- but progressive advancements in ultra-supercritical technology can narrow this comparative advantage. CO2 removal from the flue gas for sequestration is much more technically complex and incurs higher costs as compared to that for IGCC (NCC, 2002). In the area of coal combustion, one of the latest developments is in the area of modified combustion technology that uses oxygen instead of air for combustion, thereby avoiding dilution with large volumes of nitrogen in the flue gas (NCC, 2000). The combustion products are re-circulated to the burner to reduce the flame temperature and increase CO2 concentration in the stack gases to well about 90 percent (NCC, 2000). This reduces the cost of carbon capture for sequestration as compared to conventional combustion systems that have a maximum CO2 concentration of 12-15 percent in the stack gas (NCC, 2002). In terms of disposal of solid waste, bottom ash and flyash can be safely land-filled. Trace metals are more likely to be leached with flyash adsorption rather than with slag material. Ash has potential to be used for a variety of applications such as cement/concrete production and waste stabilization/solidification. Cost estimates
The cost of electricity (COE) for coal-fired (PC) plants is dominated by the capital cost share at 52 percent, while fuel (29 percent), and fixed O&M (19 percent) account for the remainder (IEA, 1998). The relatively low share of fuel cost in the cost of electricity makes justifications for selection of advanced technology less favorable, especially in light of low coal prices. During the course of its development, there have been significant cost improvements for PC technology (Beer,

9
2000; NRC, 1995). Pulverized coal firing with flue gas de-sulfurization (PC/FGD) is still considered the lowest cost option when coal combustion technology is selected for large power generation plants. Typical capital costs of modern subcritical U.S. pulverized coal plants equipped with a FGD system range from about $1100-1500/kW, with typical electricity costs of about 40 to 55 mills/kWh (NRC, 1995). Capital costs of supercritical technology are largely a function of the availability of special materials and manufacturing capabilities in a particular region (IEA, 1998). Capital cost increases specific to the supercritical plant (e.g. associated with superior materials and other design features) are counter-balanced by the capital cost savings associated with the fact that the boiler and ancillary equipment can be smaller due to the increased efficiency (IEA, 1998). Studies also show that supercritical units have substantial economies of scale in construction, and may be less expensive to build than state-of-the-art subcritical units at scales above 500 MW (Joskow and Rose, 1985). A study by Joskow and Rose points at the following- at a scale of 300 MW (the smallest size of supercritical units in the sample), supercritical units are over 10 percent more expensive than subcritical units; the construction cost functions cross over at about 500 MW, where the average cost of supercritical units falls below that of 2400 psi units- the crossover range is between 500 and 600 MW; at 700 MW, supercritical units are about 7 percent less expensive per kW than subcritical units (Joskow and Rose, 1985). For ultrasupercritical technology, even though boiler and steam turbine costs are higher, balance of plant costs are expected to be 13 to 16 percent lower than those for existing boiler and cycle designs because of reduced requirements for coal handling, emissions control, and other auxiliary components11. 2.2 Fluidized Bed Combustion (FBC) technology
Technologies for coal conversion in a fluidized bed are broadly of two types- atmospheric fluidized bed combustion (AFBC) technology and pressurized fluidized bed combustion (PFBC) technology. 2.2.1 Atmospheric Fluidized Bed Combustion (AFBC) technology
The atmospheric fluidized bed combustion technology (AFBC) is a commercially mature technology that has been used worldwide for over 50 years, primarily in petrochemical and small industry steam generators (NRC, 1995). The sizes of AFBC units for these kinds of applications are a tenth to one hundredth of the size of commercial power plant generators (NRC, 1995). In the area of power generation, it is a mature technology with more than six hundred AFBC units operating worldwide in the size-range of 20 to 300 MW (EPRI, 2002a). But its aggregate capacity represents just around two percent of the overall coal-fired generation capacity in the world12. In the United States, there are 185 AFBC boilers with an aggregate capacity of 6 GW (Beer, 2000). The inherent advantage of AFBC lies in its fuel flexibility- AFBC boilers can be designed to burn a range of fuels, including bituminous and sub-bituminous coal, coal waste, lignite, petroleum coke, biomass, and a variety of waste fuels (EPRI, 2002a). AFBC for coal combustion is therefore utilized for burning low grade and difficult coal. FBC boilers represent the market for relatively small units, in terms of utility requirements13. Industrial and commercial operators in smaller sizes use them more extensively, both for the production of process heat, and for on-site power supply. Independent power producers, mainly in sizes in the 50 to 100 MWe range, use a few14.
11 See ‘Evaluating Materials Technology for Ultrasupercritical Coal-Fired Plants’ EPRI online journal article posted on January 15, 2003. 12 See ‘Atmospheric Fluidized-Bed Combustion Technology’s Status Reviewed’, EPRI online journal article posted on June 20, 2003. 13 See International Energy Agency (IEA) Clean Coal website at http://www.iea-coal.co.uk/site/database/cctpercent20databases/bfbc.htm 14 See International Energy Agency (IEA) Clean Coal website at http://www.iea-coal.co.uk/site/database/cct%20databases/bfbc.htm

10
AFBC is in turn of two types- bubbling fluidized bed combustor (BFBC) and circulating fluidized bed combustor (CFBC). During the fluidized bed combustion process, coal or secondary fuel (petroleum coke), primary air, and a solid sorbent (such as limestone), is introduced into the lower part of the combustor where initial combustion occurs (DOE, 2003b). The bed has less than 2 percent of coal, with the rest composed of coal ash and limestone, or dolomite, added to capture sulfur. The solid particles are suspended in a stream of upwardly flowing air. As the coal particles decrease in size due to combustion, they are carried higher in the combustor when secondary air is introduced. During the process, reduced size coal particles along with some of the sorbent are carried out of the combustor, collected in a cyclone separator, and recycled to the lower portion of the combustor (in case of CFBC). In all AFBC designs, coal and limestone are continuously fed into the furnace, and spent bed material, consisting of ash, calcium sulfate, and unreacted limestone, is withdrawn. Steam generating tubes are immersed in the bed for cooling. Primary sulfur capture is achieved by the sorbent in the bed. However, additional SO2 capture is achieved through the use of a polishing scrubber installed ahead of the particulate control equipment (DOE, 2003b). Steam is generated in tubes placed along the combustor’s walls and superheated in tube bundles placed downstream of the particulate separator to protect against erosion. The main distinguishing feature of a circulating fluidized bed (CFB) boiler is the separator device at the furnace gas outlet, which collects bed material entrained in the flue gas for recycle back to the furnace.15 In the bubbling bed type, as the coal particles are burned away and become smaller, they are elutriated with the gases, and subsequently removed as fly ash. In CFBCs, the most common form of separator is a cyclone, which is a steel shell lined with refractory. The recirculation results in carbon conversion efficiencies of over 98 percent, leaving only a small portion of unburned char in the residues.16 They have better performance and operating characteristics as compared to ‘bubbling bed’ units. They also have simplified design and are easier to scale up than bubbling bed units. But operating costs are higher primarily due to refractory maintenance and heat loss from the shell to ambient (Goidich and Lundqvist, 2001). In terms of environmental performance, ‘circulating beds’ have better sulfur capture and better carbon burnout as compared to bubbling units and also better NOX control characteristics (NCC, 2000). Circulating beds also require much lower (calcium to sulphur) Ca/S ratio for removal of SO2 and therefore the cost of residue disposal is much lower17.
Commercialization of CFB technology began back in the late 1970s, and it has since emerged as an environmentally acceptable technology for burning a wide range of solid fuels to generate steam and electricity power (Goidich and Lundqvist, 2001). Since that time there has been a steady scale-up into the utility boiler size range with implementation of many new design features to increase reliability and operational flexibility to meet utility boiler standards. It is in commercial operation by a large number of industrial users worldwide with units as large as 250 to 300 MWe in operation, and designs being developed for units as large as 600 MWe in size (Goidich and Lundqvist, 2001). The largest operating FBC is a 350 MW unit in Japan (Beer, 2000). A CFB boiler is attractive for both base load and load-following power applications because it can be efficiently turned down to 25 percent of full load (DOE, 2003b). The successful operating experience of conventional CFB boilers with cyclone separators, as well as the more recently developed Compact CFB boilers, have demonstrated the ability to scale-up unit size to meet the
15 See Darling Scott L. ‘Foster Wheeler’s Compact CFB; Current Status’. Foster Wheeler Energy International, Clinton, NJ, U.S.A. Publications at http://www.fwc.com/publications/tech_papers/powgen/compact.cfm 16 See Darling Scott L. ‘Foster Wheeler’s Compact CFB; Current Status’. Foster Wheeler Energy International, Clinton, NJ, U.S.A. Publications at http://www.fwc.com/publications/tech_papers/powgen/compact.cfm 17 See International Energy Agency (IEA) Clean Coal website at: http://www.iea-coal.co.uk/site/database/cct%20databases/bfbc.htm

11
requirements for utility power generation (Goidich, 2001). CFB boiler design is simple and proven – technology improvements are continually being developed and incorporated into the designs to enhance performance, increase operational flexibility, and to improve reliability in a cost effective way. Since maintenance is minimal in the CFB boiler, the availability of the boiler is relatively higher. The advantage of fuel flexibility often mentioned in connection with FBC units can be misleading- most efficient CFB operation is quite often specific to the design fuel. The method is principally of value for low-grade, high ash coals which are difficult to pulverize, and which may have variable combustion characteristics. It is also suitable for co-firing coal with low-grade fuels, including some waste materials. Though most often AFBC boilers operate under subcritical conditions, supercritical AFBC boiler designs are available in sizes up to 600 MW18. This combines the advantages of fuel flexibility and low emissions of CFB with higher thermal efficiency of supercritical steam pressures. One of the boiler manufacturers, Foster Wheeler, is building a plant of 460 MW capacity in Poland, with supercritical steam cycle, that is scheduled to start up in 200619. CFBC offers repowering opportunities for existing PC plants (with potential to extend plant life by 20 to 25 years) (Kavidass et.al, 1999). Studies conducted by one of the leading boiler manufacturers (Babcock and Wilcox), on feasibility of repowering PC fired boilers with CFB in many different countries (including United States, China, India, Ukraine, and Thailand) show that Internal Recirculation Circulating Fluidized Bed (IR-CFB) repowering is an economically viable option to utilize existing fuel or low grade fuel, reduce emissions, eliminate high maintenance pulverizers, and reduce auxiliary support fuel (oil/gas) consumption (Kavidass et.al, 1999). Environmental performance
Fluidized-bed combustion evolved from efforts to find a combustion process conducive to controlling pollutant emissions without external controls. It enables efficient combustion at temperatures of 1,400–1,700 ºF, well below the thermal NOX formation temperature (2,500 ºF), and enables high SO2-capture efficiency (around 90 to 95 percent sulfur control) through effective sorbent/flue gas contact (DOE, 2003b). Large quantities of solid wastes are generated as mixed ash and spent sorbent used for SO2 capture- this can be used as raw material for cement manufacturing, soil stabilization, concrete blocks, road base, structural fills, etc (Kavidass et.al., 2000). Low furnace temperatures characteristics of CFB technology produce low NOX emissions (emission is less than 100 ppm) (Kavidass et.al, 2000). But AFBC units have significant emissions of N2O, which is a green house gas (GHG). Global emissions from FBC units are 0.2 Mt/year, representing approximately 2 percent of total known sources (NCC, 2003). Typical N2O emissions from FBC units are in the range of 40-70 ppm (at 3 percent O2). This is significant because at 60 ppm, the N2O emission from the FBC is equivalent to 1.8 percent CO2, an increase of about 15 percent in CO2 emissions for an FBC boiler. (NCC, 2003) Several techniques have been proposed to control N2O emissions from FBC boilers, but additional research is necessary to develop economically and commercially attractive systems. AFBC performance and cost comparisons with PC plants
The potential competitiveness of AFBC for power generation as compared to pulverized coal combustion technology depends on achieving lower capital costs as compared to PC technology, improved environmental performance and operating efficiency. The capital costs of AFBC boilers are comparable to that of PC boilers, but often AFBC boilers have higher capital
18 See ‘Atmospheric Fluidized-Bed Combustion Technology’s Status Reviewed’, EPRI online journal article posted on June 20, 2003. 19 See ‘Atmospheric Fluidized-Bed Combustion Technology’s Status Reviewed’, EPRI online journal article posted on June 20, 2003.

12
costs than PC ones in case of high sulfur coal20. As compared to the capital cost of a PC w/o FGD and SCR, the capital cost of a CFB boiler is 5 to 10 percent higher- but as compared to the capital cost of a PC with fitted with post-combustion SO2 and NOX control equipments such as FGD and SCR, the capital cost of a CFB boiler is 8 to 15 percent lower (Kavidass et.al, 2000). Experience indicates that operating and maintenance costs are relatively lower than PC-fired boilers because of the ability to burn lower rank fuels, thus reducing fuel cost escalation uncertainty (Kavidass et.al, 2000). CFB boiler O&M costs at 85 percent capacity factor are 5 to 10 percent lower as compared to a PC boiler (Kavidass et.al, 2000). Since maintenance areas are very minimal in the CFB boiler, the availability of the boiler is relatively higher, often exceeding 90 percent (lack of pulverizers and stack gas scrubbers result in a simple design with low maintenance and high availability).21 Operating experiences from Europe and North America suggests that for a sulfur fuel (>0.5 percent sulfur) and less than 150 MW, a CFB boiler has 8-15 percent lower capital costs as well as 5-10 percent lower operating costs than a PC-fired boiler because of the FGD system (Kavidass et.al., 2000). In terms of operating efficiency, even though the combustion temperature of CFB is low, the fuel residence time in CFB is higher than PC that results in combustion efficiencies comparable to PC. AFBC can have slightly higher heat rates, and consequently lower efficiency than PC plants at the same plant size and steam conditions because of higher excess air and higher auxiliary power requirements (Beer, 2000). In the 100-200 MWe range, the thermal efficiency of FBC units is commonly a little lower than that for equivalent size PC units by 3 to 4 percentage points22. In CFBC, the heat losses from the cyclone/s are considerable. This lowers efficiency and even with ash heat recovery systems, there tends to be high heat loss associated with the removal of both ash and spent sorbent from the system23. Cost and performance data from one of the demonstration projects in the United States (the Nucla station repowering project with a net capacity of 100 MW) recorded a capital cost of $1123/kW with a normalized power production cost of 64 mills/kWh (DOE, 2003b).
2.2.2 Pressurized Fluidized Bed Combustion (PFBC) technology
Development of PFBC technology, which uses a combustion process similar to that of AFBC but with the boiler operating at higher than atmospheric pressure (0.5 to 2 MPa), started in 1969 with the operation of a PFBC test unit in England by the British Coal Utilization Research Institute (NRC, 1995). An 85 MWth PFBC unit was placed in the Grimethorp Experimental Facility set up in the UK during the eighties and funded by Germany, United Kingdom, United States, and International Energy Agency (IEA) (Beer, 2000). A R&D test facility was set up at the Stal Laval Company in Sweden for a 70 MWe demonstration plant to be built for the American Electric Power Company by co-operation between American Electric Power Service Company and Asea Brown Boveri (Beer, 2000). A number of other test and pilot facilities were constructed during the eighties in United States and Europe. Mini-plants to study environmental performance of PFBCs were set up at Exxon in New Jersey and at U.S. DOE’s Argonne National Laboratory (Beer, 2000). EPA, DOE, and the private sector have played a significant role in technology development efforts for over fifteen years in the United States. A number of PFBC plants of 70 MWe capacity started operating satisfactorily since 1991 and the technology was scaled up to 360 MW in 1999 in Japan
20 See ‘Atmospheric Fluidized-Bed Combustion Technology’s Status Reviewed’, EPRI online journal article posted on June 20, 2003. However, incorporating a tail-end-polishing scrubber in the case of high sulfur coal can reduce additional sorbent requirement and has the added benefit of reductions in emissions of mercury and of other air toxics 21 See Darling Scott L. ‘Foster Wheeler’s Compact CFB; Current Status’. Foster Wheeler Energy International, Clinton, NJ, U.S.A. Publications at http://www.fwc.com/publications/tech_papers/powgen/compact.cfm 22 See IEA Clean Coal website at: http://www.iea-coal.co.uk/site/database/cct%20databases/bfbc.htm 23 See IEA Clean Coal website at: http://www.iea-coal.co.uk/site/database/cct%20databases/bfbc.htm

13
(Beer, 2000). In PFBC, the bubbling-bed type is much more common than the circulating type in commercial scale units. Around 80 MW of PFBC capacity demonstrations has taken place in the United States and Europe to establish the technical viability of first-generation systems (NRC, 2000). Another 157 MW of capacity is being demonstrated in the United States and 350 MW in Japan (NRC, 2000). The leading developer and supplier of PFBC technology is ABB Carbon, with a number of licensors, such as Babcock & Wilcox in the United States and Ishikawajima Heavy Industries (IHI) in Japan (Tavoulareas and Charpentier, 1995). Other suppliers are Ahlstrom in Finland, Lurgi-Lentjes-Babcock in Germany, Ebara, Hitachi and Mitsubishi in Japan (Tavoulareas and Charpentier, 1995). In a PFBC, the combustor and hot gas cyclones are all enclosed in a pressure vessel. The need to pressurize the feed coal, limestone and combustion air, and to depressurize the flue gases and the ash removal system introduces some significant operating complications. The gas is cleaned downstream from the PFBC boiler, and expanded in a gas turbine. The combustion air is pressurized in the compressor section of the gas turbine. The technology uses both a steam and a gas cycle to achieve higher thermal efficiencies as compared to conventional PC combustion. The proportion of power coming from the steam to gas turbines is approximately in the ratio of 80:20. Generation by the combined cycle route involves unique control considerations, as the combustor and gas turbine have to be properly matched through the whole operating range. Advanced second-generation PFBC systems operate at pressures that are typically 10 to 15 times higher than atmospheric pressures- this allows pressurized gas from a PFBC unit to be cleaned and fed into a gas turbine along with waste-heat steam generation (NRC, 1995). The steam from the PFBC unit and from the waste–heat boiler is fed to a steam turbine for electricity generation. This operation in combined cycle mode of operation significantly increases efficiency. Additional cycle efficiency can be achieved by hot gas cleanup systems if the exhaust gas can be sufficiently cleaned without lowering its temperature. In a second-generation PFBC system (Figure 2.2), coal-water slurry undergoes mild gasification in a pressurized carbonizer to produce low heating value syngas and char (NCC, 2003). The char is combusted in pressurized circulating fluidized bed with high excess air, and the flue gas is cleaned of particulates and alkalis before entering the gas turbine by a hot gas cleanup system. Sulfur is captured in the carbonizer and the boiler by using dolomite. The low value syngas or the fuel gas from the carbonizer is cleaned of sulfur in the fluidized bed carbonizer, and of particulates and alkali by hot gas cleanup. It is then injected into the topping combustor where it raises the temperature at the inlet to the gas turbine to about 2280 degrees F (NCC, 2003). N2O decomposes at the elevated temperature in the topping combustor, and therefore N2O emissions are avoided. Further efficiency improvements possible with advanced gas turbine technology, and advanced steam parameters such as supercritical conditions with high-temperature double reheat.
PFBC offers significant design, performance, environmental compliance and cost advantages over AFBC technologies. PFBC systems are likely to attain substantially higher efficiency of 39 to 42 percent (as compared to 34 percent efficiency for AFBC) and advanced PFBC with topping combustor can attain 47 percent efficiency (NRC, 1995). For the same output, a PFBC unit requires less land area than does an AFBC unit. The compact design of the PFBC makes it suitable for shop fabrication and modular construction (Tavoulareas and Charpentier, 1995). Modular construction feature also enables incremental capacity additions by utilities to match load growth. It is an easier retrofit than AFBC for existing plants because of limited space requirements. It also offers all advantages as AFBC including sulfur capture in bed, low NOX emissions, capability to use low quality fuel, and enhanced efficiency of combined-cycle operation. PFBC appears to be best suited for applications of 50 MWe or larger (DOE, 2003b). In terms of repowering opportunities, PFBC is also very suitable for repowering existing coal plants and is compatible with higher-pressure steam cycles. Steam flows for PFBC units are compatible with existing steam turbines and therefore this technology is attractive for repowering units at existing power plant sites.

14
First-generation PFBC systems do not offer significant efficiency and/or economic advantages over conventional PC technology and are larger emitters of air pollutants as compared to coal technologies based on gasification. These factors are likely to restrict their deployment (NRC, 2000). Key performance and cost uncertainties in second-generation PFBC development are related to hot gas cleanup plus advanced turbine systems that is required for achieving 50 percent efficiency target (NRC, 2000). Concerns around commercial applications of the technology are related to ability of the turbines to withstand alkali vapors from the PFBC and to meet stringent future environmental requirements without costly add-on control systems (NRC, 2000). Ongoing efforts in development of hot gas particulate clean up systems have potential to improve efficiencies and reduce costs. Supercritical steam cycle parameters are under development for efficiency improvements. Performance improvements are possible with increased gas turbine inlet temperatures. A critical component for PFBC development is ceramic filters in the hot gas cleanup system (Weitzel et.al, 1996). The other areas that require particular attention are coal and sorbent preparation and feed systems, and effects of PFBC boiler gas contaminants on gas turbine performance, reliability, and life expectancy (Tavoulareas and Charpentier, 1995). Barriers in commercial deployment opportunities of second-generation PFBC systems arise due to slow progress in hot gas filter development, high turbine costs, and complex plant integration (NCC, 2003). With the current state of technology development and projections for the future, it remains uncertain whether advanced PFBC systems can achieve U.S. Department of Energy’s (DOE’s) goal of 20 to 25 percent reductions in electricity cost as well as capital cost reductions relative to current PC plants (NRC, 1995).
Figure 2.2 Second-generation PFBC with topping combustor
Source: Figure 3.2 in ‘Coal-related Greenhouse Gas Management Issues’, National Coal Council, May 2003, Washington D.C. Environmental performance
As with atmospheric FBC (CFBC or BFBC), the combustion temperature between 800-900°C in a PFBC has the advantage that NOx formation is less than in PCC, but N2O is higher (50–

15
100 ppm) (IEA, 1996). Depending on NOX emission limits, selective or nonselective catalytic reduction systems for NOx control may be needed in addition to the combustion controls inherent in FBC systems. SO2 emissions are reduced by the injection of the sorbent, and its subsequent removal with the ash. Fluidized bed systems were originally designed to meet the 90 percent SO2 removal requirements of the NSPS but have not yet demonstrated 98 percent or higher removal that is currently achieved with commercially available FGD systems (NRC, 1995). It is becoming difficult to meet increasingly stringent requirements for SO2 removal with high associated costs. Also, there are further developmental needs for emission control systems associated with second-generation PFBC systems. Hot gas cleanup systems for SO2 and particulate removal, are yet to achieve the performance, reliability or durability for commercial applications (NRC, 1995). CO2 emission reductions are in proportion to the efficiency gains achieved over conventional PC technology. PFBC attains very high levels of particulate control. The ash and spent sorbent are usually collected in control device such as a cyclone. Most semi-volatile and volatile trace metals condense on flyash particles and are removed with the ash. Mercury may be emitted with the flue gas. PFBC also generates larger quantities of waste as compared to a PC plant with FGD. A long-term technical challenge in the development of second-generation PFBC systems is the reduction or elimination of solid wastes- the second generation PFBC system generates more solid waste than today’s best commercial plants meeting stringent standards for SO2 removal (NRC, 1995). Cost estimates
Cost estimates for PFBC systems vary according to different sources. EPRI estimates costs of a 340 MW bubbling-bed supercritical PFBC boiler (42 percent efficiency) at $1381/kW (in 1992 dollars), with a total levelised cost of 37 mills/kWh (80 percent capacity factor, eastern bituminous coal) (NRC, 1995). In a World Bank paper on CCTs for developing countries, capital cost projections for PFBC are from 1150 to 1250 U.S.$/kW (Tavoulareas and Charpentier, 1995). Another World Bank Paper estimates PFBC investment costs of 1100 to 1500 $/kW (Oskarsson et.al, 1997). Table 2.1 summarizes results from capital cost projection studies for PFBC (these studies were based on costs in 1995 dollars and are nth of a kind plant cost for PFBC) from one of the equipment manufacturers, Babcock and Wilcox. A recent cost estimate performed on Japan’s 360-MWe PFBC Karita Plant (employing the same technology as the Tidd PFBC demonstration project in the United States24), projected a capital cost of $1,263/kW (1997$) (DOE, 2003b). Table 2.1 Cost estimates for PFBC Babcock & Wilcox PFBC EPRI PFBC Capacity, MWe 350 350 Heat rate, Btu/kWh 8129 8129 $/kW 991 1091-1249 Plant component, percent of capital cost Steam turbine PFBC Balance
11.6percent 36.9percent 51.5percent
12.5percent 33.4percent 54percent
Source: Weitzel P.S., McDonald D.K., Whitney S.A. 1996. ‘Directions and Trends for Commercial PFBC and Hot Gas Clean Up’. Paper presented at Pittsburgh Coal Conference, September 3-7, 1996, Pittsburgh, Pennsylvania, U.S.A 2.3 Integrated Gasification Combined Cycle (IGCC) technology
The process of coal gasification has been practiced for over two hundred years, but it was not until the late 1960s that pressurized gasifiers for synthesis gas production suitable for use in gas
24 No cost data are available from the Tidd PFBC demonstration project in the US.

16
turbine combined-cycle applications were designed (NRC, 2000). Technology for manufacture of liquid fuels in Germany during World War II forms the foundation for present day gasifiers (NRC, 1995). During the seventies oil crisis, gasification technology development was primarily around supply of coal-based transportation fuels, but subsequently the economics of gasification were rendered unattractive by the declining prices of petroleum products and natural gas. Only a few gasification units survived for manufacture of high-value products such as methanol, ammonia and chemicals (NRC, 1995). Integrated coal gasification combined cycle technology (IGCC) involves complete gasification of coal with air or oxygen to produce a high heating value syngas (syngas is primarily a mixture of hydrogen and carbon monoxide) that burns in a gas turbine and produces steam for a steam power cycle (NCC, 2003). Gasification of fuels such as coal, residue oil and tars, and petroleum coke takes place either by air or oxygen. Bituminous coal is the most commonly used feedstock for IGCC with a low level of operating experience with alternate fuels such as petcoke (Hooper, 2003). Figure 2.3 gives the flow diagram of an IGCC process (NCC, 2003). In the United States, IGCC development is seen to be critical as part of a long-term strategic plan to develop a stable and inexpensive energy supply based primarily on domestic resources (NRC, 2000). Sustained and increasing interest in IGCC is due to the fact that it provides favorable conditions for CO2 sequestration and possibilities for efficiencies exceeding 50 percent by the production of hydrogen and the combination of IGCC with fuel cell technology (Beer, 2000). IGCC integrates advances in high-pressure gasifiers with combination of advanced gas turbines and conventional steam turbines to produce electricity at thermal efficiencies at least 10 percent greater than conventional steam power plants and with much lower emissions (NRC, 2000). The technology also offers opportunities for the development of coal-based chemical processing as an adjunct to electricity production (NRC, 2000). First generation IGCC plants, demonstrated in the United States as part of DOE’s Clean Coal Technology (CCT) Program, have well demonstrated operational and environmental performance at commercial scale, although reliability and availability concerns remain. Existing IGCC demonstration plants in the United States have efficiencies below 40 percent, but recently commissioned plants in Europe have design efficiencies of 43 percent and 45 percent (mainly due to improved gas turbine, steam plant efficiencies, and better sub-system integration) (Beer, 2000). IGCC capital costs are higher as compared to conventional coal technologies, and therefore the impact of high capital cost on economic competitiveness remains to be resolved. Future prospects partly depend on first cost reduction and higher efficiencies.

17
Source: Figure 3.3: Integrated Gasification Combined Cycle in ‘Coal-related Greenhouse Gas Management Issues’, National Coal Council, May 2003, Washington D.C. The three major types of gasification are: entrained flow, fluidized bed, and moving fixed-bed (NRC, 1995):
Entrained flow gasifiers- Commercial technologies developed primarily in the United States (Texaco, Shell, and Destec) use entrained flow gasifiers. They have single train capacity, resulting from the small coal particle size and high operating temperature, corresponding to about 265 MW of electricity (NRC, 1995). Gasification systems based on these gasifiers are relatively compact, insensitive to most coal properties, involve short reaction times and produce little methane. The reaction takes place at high temperature, and therefore the products need quenching before cleaning, resulting in efficiency losses (efficiencies are lower than the other two types of gasification processes). The gas produced is relatively free of tars, hydrocarbons heavier than methane, and nitrogen compounds. Fluidized bed gasifiers- Gasification systems based on fluidized bed gasifiers offer an attractive option for using coal gasification for the supply of gaseous and liquid fuels, in addition to uses for power generation, because of their temperature characteristics and hot gas cleanup systems. The gas exit temperatures are lower as compared to entrained flow gasifiers and therefore more amenable to hot gas cleanup systems. This results in overall efficiency advantages as compared to entrained flow gasifiers that require gas cooling prior to gas cleanup (NRC, 1995). The coal throughput rates are higher, that in turn reduces unit size and costs. The ash produced is less inert than for entrained flow gasifiers, which requires careful disposal. The atmospheric version of fluidized bed gasifiers has been in commercial use for over 65 years, but no high-pressure systems are commercial- demonstration projects are underway in Europe and the United States (NRC, 1995). Moving fixed-bed gasifiers- Historically, this is the most widely used gasification system. In this process, coal moves down in the reactor counter-current to gas flow, which leads to higher efficiency (NRC, 1995). But these systems are more costly and complex than stationary bed systems. The coal throughput is also lower than fluidized bed units. The commercial Lurgi Process
Figure 2.3 Flow diagram for an IGCC process

18
yields an unfused ash clinker, and a slagging version has been developed in cooperation with British Gas (NRC, 1995). List of gasification technology suppliers and their installations
Table 2.2 shows IGCC processes having commercial-scale operating records. Among the different technology suppliers, Chevron Texaco is the most active licenser accounting for almost 40 percent of the IGCC capacity. Chevron Texaco’s gasification technology has been in commercial operation for over 40 years. It has the ability to use different kinds of feedstock such as natural gas, heavy oil, coal, and petroleum coke. There are 60 commercial plants in operation- 12 using coke and coal, 28 using oil, and the rest 20 using gas as feedstock. Among demonstration projects in the United States, Tampa Electric’s Polk IGCC power plant has Chevron Texaco gasifier installed. The E-Gas technology was originally demonstrated at LGTI IGCC plant (Dow Syngas project) that is no longer in operation. The Wabash River IGCC project in the United States, which is currently in operation, incorporated this technology. Shell’s experience with gasification started during the fifties and in 1972 it started development work on coal gasification processes. Shell used its experience at gasification plant operations at Amsterdam and Germany to construct a plant at its existing petrochemicals complex at Deer Park in Houston, Texas, to gasify 250 tonnes/day of bituminous coal. The Deer Park plant became operational in 1987 and demonstrated the ability to gasify a wide range of coals using the Shell process. In 1989, the Shell process was chosen for a 250 MW plant operation at Buggenum, the Netherlands. This plant is currently in operation. The Shell-Pernis IGCC of 127 MWe capacity started operation in 1997- it uses heavy oil as feedstock and produces power as well as hydrogen. The British Gas/Lurgi (BG/L) gasifier was designed during the seventies to produce a methane rich syngas in order to be able to efficiently manufacture synthetic natural gas (SNG) from coal. BG/L based IGCC plants include two at Fife Power in Scotland- a 120 MW plant using coal and sewage sludge and a 400 MW plant using coal and refuse derived fuel (RDF) as feedstock. This technology is being used at Kentucky Pioneer Energy IGCC demonstration project in the United States at 540 MW capacity. The Prenflo gasification process, developed by Uhde in Germany, was first incorporated in a plant in Germany, following which it was selected for the 318 MW Puertollano IGCC plant in Spain using coal and coke as feedstocks. The Noell gasification process technology, developed in Germany by Deutsches Brennstoffintut Freiberg for the gasification of pulverized brown coal, has been operating at Schwarze Pumpe since 1984, first on brown coal and then on sludge, ash-containing oils and slurries. This technology is being used in a 40 MW IGCC unit, fueled with coal and oil, at Schwarze/Pumpe (Germany) since 1996. The High Temperature Winkler (HTW) gasifier was developed by Rheinbraun in Germany, which owns and operates several lignite mines in Germany’s Ruhr region. It has been applied commercially for methanol and ammonia synthesis. An IGCC project using this technology is being planned in the Czech Republic. The KRW gasification process, originally developed by the M.W. Kellogg Company in the United States, was installed at the Sierra Pacific Power Company’s 99 MW Pinon Pine IGCC demonstration project. The plant after beginning operations encountered difficulties, primarily due to scaling-up problems and design and engineering deficiencies, and the project was discontinued. (DOE, 2002) Table 2.2 Gasifier Technology Suppliers
Technology supplier Gasifier Type
Solid Fuel Feed Type
Oxidant Power Installations
Chevron Texaco, U.S.A.
Entrained flow
Water Slurry
Oxygen Tampa Electric, Coolwater, Chevron Texaco-Eldorado IGCC plant, Eastman Chemical, Ube Industries, Motiva Enterprises, Deer Park
Global Energy E- Wabash River IGCC plant and Louisiana

19
Gas, U.S.A. Entrained flow
Water Slurry
Oxygen Gasification Technology IGCC Project
Shell, U.S.A./The Netherlands
Entrained flow
Nitrogen carrier/dry
Oxygen
Demkolec IGCC plant (Netherlands), Shell-Pernis IGCC plant (Netherlands), Harburg
Lurgi, Germany Moving Bed Dry Air Sasol Chemical Industries and Great Plains Plant
British Gas/Lurgi, Germany/UK
Moving Bed
Dry
Oxygen Global Energy Power/Methanol Plant (Germany), Kentucky Pioneer Energy IGCC project (U.S.A.)
Prenflo/Uhde, Germany
Entrained flow
Dry Oxygen Elcogas, Puertollano IGCC Plant (Spain), Furstenhausen in Saarland
Noell/GSP, Germany Entrained flow
Dry Oxygen Schwarze Pumpe, Germany
H T Winkler (HTW), RWE Rheinbraun/Uhde, Germany
Fluidized bed
Dry
Air or Oxygen
None
KRW, U.S.A. Fluidized bed
Dry Air or Oxygen
Sierra Pacific (Nevada, U.S.A.)
Source: Table 1A-1: Gasifier Technology Suppliers, in ‘Major Environmental Aspects of Gasification-Based Power Generation Technologies’, D.O.E., Office of Fossil Energy, National Energy Technology Laboratory, December 2002.
Areas for performance improvements and technology development
The performance of gasification systems varies depending on the use of air or oxygen for gasification, and hot or cold gas cleanup systems. Use of air avoids the cost and energy consumption in an air separation plant for oxygen production, but dilutes the exit gas stream with nitrogen, thereby increasing the size and costs associated with the gas cleanup system (NRC, 2003). The associated CO2 separation costs from the stream also increase making air-blown systems incompatible with carbon sequestration (NRC, 2003). For gas turbine power generation, air-blown systems are attractive as compared to oxygen blown systems. Gasification temperature control is a critical factor affecting performance. The temperature required to achieve a practical rate of reaction depends on the coal characteristics and the gasifier type. Air blown systems suffer from the drawback that they have essential requirement for a hot gas clean up system, due to the reduced heating value of the fuel gas. Use of catalysts helps in lowering of temperature while keeping the reaction rate high- this is being studied and piloted extensively and remains a promising opportunity for cost reductions (NRC, 1995). No single gasification system is likely to be optimal for all applications as extrapolation of solid reaction systems is extremely difficult (NRC, 1995). The most efficient system across different choices is the air-blown fluidized bed gasifier hot gas clean up plus in-bed sulfur removal (NRC, 1995). This system has three percentage-points higher efficiency as compared to oxygen blown entrained flow gasifier with cold gas cleanup (NRC, 1995). However, the former system has 4.5 percent higher CO2 emissions due to calcinations of limestone in the gasifier (NRC, 1995). For air blown systems, the use of hot gas cleanup rather than cold gas cleanup results in energy savings of 5 percent, and a corresponding electrical efficiency gain of 2 percentage-points (NRC, 1995). Efficiency advantage of hot gas clean up is likely to be less for oxygen blown systems. Energy losses in gasification and gas cleanup amount to about 15 to 20 percent of the total coal energy input, resulting in a loss of 5 to 10 percentage points in power generation efficiency (NRC, 1995). The hot gas cleanup system is still under development. Hot gas cleanup systems have potential to have one to three percentage point higher efficiency relative to cold gas cleanup and this is a major aspect undergoing present demonstrations (NRC, 1995).

20
Areas for further advancements in gasification-based power production systems are- gas turbine firing temperature, hot gas cleanup of the fuel gas, co-production of both chemicals and electricity, improvements in gasifier designs, and integration of gasification with advanced cycles and fuel cells (NCC, 2003). A key success factor for IGCC technology is integration of components in an operating system that requires further improvements in systems integration (NRC, 1995). Concerns on gasifier availability remain for which advanced refractory is being developed (NRC, 2003). Increases in efficiency to the 45 percent level, projected for second-generation systems, depend on the use of hot gas cleanup systems plus improvements in gasifier performance and optimized systems integration. Studies estimate that IGCC can achieve 47 percent efficiency by 2010 and may be able to attain higher efficiencies by 2020 when hot gas clean-up systems become commercially available (NCC, 2000). Efficiencies are expected to increase to 50 percent for advanced turbine systems (NRC, 2000). A major uncertainty associated with gas turbine applications for coal-based applications is the degree to which fuel-gas cleanup is necessary (NRC, 1995). The development of turbine materials capable of surviving the hostile environment of direct coal-fired systems represents a major challenge. All gasification systems make use of the state-of-the-art 1300 degrees C gas turbines (NRC, 1995). Technical issues arise related to the use of medium and low calorific value fuel gas in combustors, and the effect of gas composition and variability on combustion efficiency and emissions; corrosion and/or deposition on turbine blades; integration of coal gasification with novel combustion turbine thermodynamic cycles; and potential for low NOX technology (catalytic combustion) using coal syngas. A major issue associated with the use of coal-derived gas in advanced turbines is the effect of contaminants, such as sulfur and alkali metals, on turbine performance (NCC, 2002). The need for gasification systems to operate at lower temperatures in order to lower the impact of contaminants, places a penalty on the efficiency of the process. Therefore challenges remains for hot gas cleanup systems to reduce contaminants to levels acceptable for high-temperature advanced turbines. The critical issue for coal-fired systems is the extent to which corrosion-resistant turbine blade materials and coatings can increase the environmental tolerance of advanced turbines, thereby reducing the need for gas cleanup and associated efficiency penalties. It has been suggested that in systems using coal-derived fuel, coatings on advanced super alloys and the alloys themselves will need to form chromia rather than alumina scales for increased corrosion resistance (Beer, 2000). There is ongoing work in development of alternative turbine materials with higher-temperature capability than existing super alloys, notably monolithic ceramics and ceramic matrix composites (NRC, 1995). If constraints are imposed on carbon dioxide emissions, fuel-flexible turbines that fire hydrogen rather than syngas will need to be developed. Studies suggest that conversion of syngas into hydrogen for use in gas turbines would need to consider “cradle-to-grave” costs and environmental effects of the conversion from a fuel life-cycle and systems perspective (NRC, 2003). This would help determine potential trade-offs vis-à-vis carbon emissions, efficiencies and costs, and whether lost energy (and therefore more carbon emissions) compensates for the elimination of the diluents in the gas turbine. Gas-turbine development is also critical for the scaling-up of IGCC systems – turbines having higher firing temperatures and that utilize higher-pressure ratios and can be significantly larger, that would enable scaling-up of single train IGCC plants with 350 to 400 MW output leading to lower specific plant costs (NRC, 1995). Current IGCC technology has been scaled up to 530 MW, but 600 MW unit sizes are likely to evolve by 2011 (Shilling and Jones, 2003).
There are ongoing efforts to develop potentially lower cost gasification systems- in the United States testing and demonstration of prototype gasifiers with transport reactor and partial gasifier module as well as testing of pilot-scale novel gasifier that does not require oxygen separation, are being undertaken at the large pilot-scale PSDF (Power Systems Development Facility) in Wilsonville, Alabama (NRC, 2003). Development of fuel-flexible gasification technology is the primary component of DOE’s Vision 21 Program25 that requires development in
25 DOE’s Vision 21 Program is discussed in detail in Section 3

21
all five components of a gasification system (feed solids handling, air separation, gasification, gas cleanup, and power generation) to lower investment costs, improve efficiency, and availability (NRC, 2000a). A National Research Council report titled ‘Vision 21: Review of DOE’s Vision 21 Research and Development Program- Phase 1 (2003)’ concluded that the commercial deployment by 2008 of advanced fuel-flexible gasifiers and by 2010 of gasifier designs that meet Vision 21 requirements seem to be optimistic, looking at the current state of technology development and the time taken for commercialization (NRC, 2003).
IGCC also offers significant repowering opportunities by retrofitting existing plants with IGCC. Retrofitting existing plants can achieve efficiency of approximately 41 percent (HHV)26, which is a 5 to 10 percentage point improvement in efficiency (16 to 20 percent increase), with proportional reductions in emissions and solid waste production (NCC, 2003). Repowering (brown field application) also provides opportunities for cost reductions by optimizing the reuse of existing steam cycle equipment, cooling tower and other infrastructure (i.e., buildings, coal handling systems, plant water systems, existing substation and transmission system components). The estimated cost reductions are about 20 percent (NCC, 2003). Repowering opportunities exist for both coal-fired units as well as natural gas combined cycle (NGCC) units (NCC, 2001). Especially relevant in the current context of high and rising natural gas prices is the potential for transition from natural gas based systems to IGCC. IGCC systems are amenable to phased construction- that is building simple-cycle natural-gas-fired combustion turbines first, then converting to combined cycle, and finally adding coal gasification as gas prices increase or gas availability deteriorates (NRC, 1995). The flexible strategy is being viewed as a cost-effective way to make a transition from peaking application using gas turbine to mid-load and eventually to base load. But a number of technical issues may need to be resolved – combustion turbine optimized for simple or combined-cycle operation is not likely to be optimal for coal-fired IGCC systems; conversion to gasified coal lowers net power plant efficiency by 5 to 10 percentage points; and turbine design modifications may be needed to take full advantage of integration issues that are unique to coal based systems (NRC, 1995). Environmental performance
The environmental benefits of IGCC cannot be matched with any other fossil fuel technology27. In the IGCC process, sulfur in the coal is captured as hydrogen sulfide in the gasifier, which is removed in a conventional acid-gas removal system (NCC, 2001). The concentrated hydrogen sulfide can be recovered as elemental sulfur or sulfuric acid, and sold as commercial byproduct. The ash in the gasifier is recovered as a glassy, low permeability slag that can be used as a construction material (NCC, 2001). The hot gas cleanup in IGCC systems does not presently control nitrogen emissions (in the form of gaseous ammonia), which increases downstream costs and complexity for NOX controls in the gas turbine/heat recovery system (NRC, 1995). In the IGCC process, as much as 50 percent of the mercury in the coal feedstock is removed, much of it bound in the slag and sulfur byproducts (NCC, 2001). It is estimated that the cost of mercury removal from IGCC plants is about a tenth of the removal costs from a conventional coal-fired power plant (NCC, 2001). An IGCC demonstration plant in the United States at Wabash River is recorded to have achieved over 50 percent mercury removal without any additional equipment being installed (NCC, 2002). Emissions of other trace organic compounds is minimal, contaminated water discharges are negligible, and solid wastes are produced as vitrified material impervious to leaching in storage (NRC, 2000). In terms of environmental performance, the most attractive feature for IGCC as compared to other coal technologies is the ability to separate CO2 from the flue gas stream compatible with sequestration objectives (NRC, 2000). Of course, higher fuel conversion efficiency in IGCC comes with associated reductions in CO2 emissions. The CO2
26 41 percent efficiency based on HHV is equivalent to 45.3 percent efficiency based on LHV. 27 Emissions are only a fraction of those prescribed under New Source Performance Standards (NSPS) in the US.

22
removal from the flue gas stream is much easier and less costly as compared to that from a conventional coal-fired power plant due to its higher concentration (42 percent CO2 concentration in the flue gas stream produced by IGCC as compared to 12 percent concentration produced by combustion processes) (NRC, 2000a). There are varying estimates on the costs of CO2 separation and capture, associated with IGCC. According to a particular study, for an IGCC plant, the cost of CO2 separation and capture, would add about 25 percent to the cost of electricity – vis-à-vis 60-70 percent cost addition to a conventional gas or coal fired power plant in addition to a reduction in plant efficiency by a third (Holt et.al, 2003). CO2 capture is likely to raise IGCC capital costs by 15 percent and reduce efficiency by 6 percentage points (Holt et. al, 2003). Cost estimates
In an IGCC system, almost half of the total cost is due the gasifier and the combined-cycle power block (NRC, 2000a). Cost and performance estimations for an IGCC system vary according to different sources. An attempt is made here to synthesize cost estimations derived from different sources- all cost figures, unless otherwise mentioned, are in 2004 U.S. dollars. The two primary areas for improvements in IGCC economics are linked to development of advanced gas turbines with firing temperatures over 1370 degrees C and to development of reliable hot gas cleanup schemes (NRC, 1995). Systems studies suggest that integration of gasification with advanced cycles, such as the humidified air turbine, and compressed air storage with humidification, also has potential to reduce capital costs and provide competitive intermediate-load capacity (NRC, 1995).

23
Table 2.3 Cost estimations* for an IGCC system derived from different sources Source Cost estimations 1. National Research Council. 1995. Coal- Energy for the Future; $ 2002/kW1 2. National Research Council. 2001. Energy Research at DOE- was it worth it?
Energy Efficiency and Fossil Energy Research 1978 to 2000 $1094-1641/kW2
3. National Research Council. 2003. Review of DOE's Vision 21 Research and Development Program -- Phase 1
$1532-2188/kW3
4. National Research Council. 2000. Vision 21: Fossil Fuel Options for the Future $1532-2188/kW3 5. National Coal Council. 2003. Coal-Related Greenhouse Gas Management
Issues $1340/kW4
6. National Coal Council. 2001. Increasing Electricity Availability from Coal-Fired Generation in the Near-Term
$1422-1532/kW5
7. National Coal Council. 2002. Increasing Coal-Fired Generation Through 2010: Challenges & Opportunities
$1080-1287/kW6
8. DOE. 2003. Clean Coal Technology Programs: Completed Projects. $1729/kW7 9. DOE. 2003. Clean Coal Technology Programs: Completed Projects. $1890/kW8 10. Gasification Technologies Conference, 2003. Holt Neville, George Booras,
(EPRI) and Douglas Todd (Process Power Plants). A Summary of Recent IGCC Studies of CO2 Capture for Sequestration. Paper presented at The Gasification Technologies Conference San Francisco, CA October 12-15, 2003.
$1270/kW9 $1300/kW10
$1470/kW11
11. Rosenberg et.al., 2004. Financing IGCC- 3 Party Covenant. BCSIA Working Paper, Kennedy School of Government, Harvard University.
$1140-1580/kW12
* All figures are in 2004 U.S. dollars. 1 Cost estimation is for a 500 MW first-generation IGCC plant employing a state-of-the-art, oxygen-blown, entrained-flow gasification process (Shell technology) with cold gas cleanup, and using eastern bituminous coal. The net plant thermal efficiency is 42 percent. One does note that DOE cost estimates for a second-generation IGCC system at that time (capital cost of $1490/kW) was around 25 percent lower than this cost estimate. 2 Cost estimations were for the time during which the study was conducted. 3 This estimate is based on capital costs of IGCC plants operating in the U.S.. The study also quotes that experience gained from the operation of demonstration plants, as well as from the design, construction, and operation of coke and residual-oil-fired gasification plants can be used to reduce costs to the range $1,300 to $1,500/kW. However, to be competitive with natural-gas-fueled, combined-cycle units after 2015 at natural gas prices of $3.50-$4.00/MMBtu, the investment for a mature plant of this type will have to be reduced to less than $800/kW (overnight basis for engineering, procurement, and construction costs only) in an IGCC configuration that can achieve 45 percent (HHV) efficiency (equivalent to 49.7 percent efficiency based on LHV). Also there were significant scale-up requirements for single train gasifiers to 400-500 MW capacity levels with availability of about 90 percent required for IGCC plants to be competitive (at EPC cost of $800/kW and coal prices of $1.25/MMBTU) with natural gas combined-cycle power plants with natural gas price of $3.5-4/MMBTU. The estimates for investment requirements for future IGCC plants are likely to far exceed the Vision 21 Program goal of about $800/kW. 4 Cost estimate for a 500 MW IGCC plant. 5 This is the cost estimate for today’s IGCC plant with an efficiency exceeding 42 percent (based on HHV) (equivalent to 46.4 percent efficiency based on LHV). Cost goals for 2010 are set at $1094-1203/kW, based on 45 percent HHV efficiency (equivalent to 49.7 percent efficiency based on LHV); and 2020 cost goal is set at $985/kW, with an associated efficiency of 50 to 55 percent (based on HHV) (equivalent to 55 to 61 percent efficiency based on LHV). None of these cost estimates are based on CO2 capture. Beyond 2020, IGCC plants are expected to cost more than $1200/kW with greater than 50 percent HHV (equivalent to 55 percent efficiency based on LHV) efficiency and with CO2 capture. 6 These are GE estimates for EPC cost of next-generation IGCC systems. Cost estimates for 2010 are $990/kW for advanced air–blown systems and $1066/kW for oxygen-blown IGCC systems. 7 This cost estimate is for a new 250 MWe (net) IGCC plant based on the Polk Power Station configuration (demonstrated at Tampa), incorporating lessons learned. A capital cost of $1,360/kW was estimated for a new plant that allowed for benefits derived from economies of scale, technology improvements, and replication of proven configurations to eliminate costly reinvention.

24
8 This cost estimate is for the Wabash River demonstration plant in the U.S.. Based on the Wabash project experiences, capital cost estimates for a new 285 MWe (net) greenfield IGCC plant incorporating lessons learned, technology improvements, and a heat rate of 8,526 Btu/kWh are $1,413/kW for a coal-fueled unit and $1,350 for a petroleum coke-fueled unit. 9 Average cost estimates for an IGCC system based on Texaco Quench technology with a heat rate of 9450 Btu/kWh, without CO2 capture. 10 Average cost estimates for an IGCC system based on E Gas technology with a heat rate of 8550 Btu/kWh, without CO2 capture. 11 Average cost estimates for an IGCC system based on Shell technology with a heat rate of 8370 Btu/kWh, without CO2 capture. 12 Cost estimates for a Conoco Philips Gasifier with corresponding heat rate range of 8380-10224 Btu/kWh with varying coal types. The two ends of the range are for using bituminous Pitts#8 coal (lowest heat rate) and Lignite coal (highest heat rate).

25
3. Review of U.S. RD3 activities in coal-based electricity generation advancements
In the United States, RD3 efforts related to coal have been long-standing, and have resulted in significant advancements in coal-based electricity generation technologies. Concerted efforts have been made to make the country’s energy future strongly dependent on coal due to substantial domestic reserves and other economic and security objectives. Like the United States, India’s electricity generation is primarily dependent on coal and is likely to be so for many years to come. India is therefore faced with a similar challenge of utilizing its huge domestic reserves of coal in the most efficient and environmentally-friendly manner, while protecting the country’s economic and security interests. A historical review of overall U.S. RD3 efforts related to coal as well as technology-specific experiences, along with a discussion of current activities (of the specific categories of technologies being discussed in this paper), are likely to be useful for drawing potential lessons for India for its coal-based RD3 activities in the area of electricity generation. The drawing of lessons for India would of course have to consider broader contextual country-specific differences in a number of factors. These include landscape features of the coal and electricity industries in both countries, historical perspectives in which these sectors have evolved and currently operate, roles of actors and institutions and their networks, and national priorities and development plans, just to name a few.
This section broadly reviews the context in which U.S. coal-related RD3 efforts have been conducted in the United States and discusses some of the technology-specific experiences, primarily in R&D and demonstration efforts, and factors affecting deployment opportunities. The section is subdivided into two parts. The first part of the section reviews DOE’s R&D efforts related to coal (historically), from the point of view of advancements in electricity generation technologies, and demonstration efforts under DOE’s Clean Coal Technology (CCT) program. It also discusses some of the present initiatives and programs being undertaken- Vision 21, Clean Coal Power Initiative, and the Future Gen project, along with the Clean Coal Technology Roadmap. The second part of this section discusses technology-specific activities along with salient features of demonstration projects and deployment issues under the different technology categories. Potential learning for India from U.S. experiences is drawn in Section 5 of this paper. 3.1 Review of overall RD3 activities related to coal based generation advancements 3.1.1 Trends in DOE Fossil R&D activities related to coal
The U.S. Department of Energy’s (DOE’s) coal-related activities fall under two-budget categories: Fossil Energy (FE) R&D and the Clean Coal Technology (CCT) program (NRC, 1995). DOE’s role in technology commercialization and demonstration overlap these two categories. While DOE’s operation and management of a cost-shared facility as part of technology demonstration and commercialization efforts falls under the FE R&D head, its role in co-funding a program located at an industrial site and managed by the industrial partner falls under the CCT program head (NRC, 1995). The FE R&D program encompassing coal, oil, and natural gas, has existed since DOE’s inception and forms the continuing basis of DOE’s coal program. A national thrust to develop efficient, cost-effective and environmentally acceptable coal technologies started soon after the oil embargo of the 1970’s (NRC, 2000). During that time, the Synthetic Fuels Corporation was set up by the 1980 Energy Security Act to develop domestic non-conventional energy resources, such as coal-derived liquid fuels (NRC, 1995). The setting up of this corporation resulted in a rapid growth in DOE’s Fossil Energy (FE) R&D budget. Over the time period 1978-81, a substantial portion of the RD&D expenditure related to coal conversion and utilization, was spent on building and operating large commercial-sized demonstration plants for direct liquefaction and gasification (NRC, 2000). In 1978, the coal portion represented a very high 68 percent of the total expenditure, but its percentage fell with decline in funding for direct liquefaction and gasification (NRC, 2000). However, the economic attractiveness of this venture for manufacturing

26
liquid fuels from coal, primarily for transportation, greatly diminished with the concurrent decline in petroleum prices. The Reagan administration’s emphasis on private participation and decontrolling of energy markets resulted in significant reductions in federally sponsored fossil energy R&D, cancellation of synthetic fuels demonstration plant and phase-out of the Synthetic Fuels Corporation (NRC, 1995). This resulted in a marked drop in R&D funding for coal during the early eighties.
From 1992 to 1996, the annual funding level related to FE R&D expenditure experienced small variations around $500 million (in 2004 prices) (see Figure 3.1)28. The funding experienced a slight decline between 1997 and 2000, and beyond that time it again started rising. A sharp increase in FE R&D funding again occurred in 2002, with almost a 40 percent increase in FE R&D funding over 2000 levels. A large part of the variation in FE R&D funding can be explained by variations related to the coal portion of the funding (see Figure 3.2). Among coal, petroleum, and natural gas, the share of coal steadily declined between 1992 and 1997, at the expense of natural gas (see Figures 3.3 and 3.4). In 2000, coal share increased substantially from close to 40 percent to almost 70 percent share in the FE R&D expenditure. This increase in coal share was brought about by an allocation change of the fuel cell and advanced turbine related R&D activities from natural gas to coal. The coal share has continued to increase steadily beyond 2000 brought about by funding increase in coal as well as decline in petroleum and natural gas related expenditures.
Next we examine broadly what resulted from the funding fluctuations related to coal. Tables 3.1 and 3.2 give some of the expenditure details related to coal. The categories for coal funding were altered from 1993 and remained the same till 1999. They have been altered again from 2000. Completion of funding related to magneto hydrodynamics research brought about a part of the reduction in coal funding from 1994 onwards. R&D funding for AFBC development too was discontinued from 1993. The objective of the Advanced Clean Fuels Research component (that forms the first among the three broad categories related to coal R&D funding activities) of the coal R&D expenditure is to develop coal-derived transportation fuels, chemical, and other products at costs competitive with oil-derived products (NRC, 1995). Between 1993 and 1999, there has been a steady decline in funds allocated for advanced clean fuels research that primarily involves activities related to coal preparation, and direct and indirect liquefaction (see Table 3.3). Its share in the overall coal R&D funding declined from almost a third in 1993 to almost a tenth in 2000. This component has at present further declined to almost 7 percent. The Advanced Clean/Efficient Power Systems component, encompassing RD&D activities for advanced power generation technologies, develops coal combustion or gasification systems with set efficiency, emissions, and energy cost targets (NRC, 1995). This component forms a part of the overall FE R&D program budget for advanced power systems supporting combined cycle development, split between natural gas program (fuel cells and advanced turbines) and coal program (advanced combustion, PFBC, IGCC, indirectly fired-cycle, and advanced research and environmental technology components) (NRC, 1995) (see Table 3.2).
In should be kept in mind that in the development of advanced power systems, there is considerable overlap of activities among different budgetary categories such as the Coal FE R&D program, the FE natural gas R&D program and the CCT program (NRC, 1995). For example, in the 28 Note that data for assessment of trends in DOE’s coal-related R&D activities have been derived from the following sources: Department of Energy (DOE)- FY 1994 Congressional Budget, Statistical Table by Appropriation, April 9, 1993; FY 1995 Congressional Budget, Statistical Table by Appropriation, March 16, 1994; FY 1996 Congressional Budget, Statistical Table by Appropriation, February 2, 1995; FY 1997 Congressional Budget, Statistical Table by Appropriation, April 16, 1996; FY 1998 Congressional Budget, Statistical Table by Appropriation, February 5, 1997; FY 1999 Congressional Budget, Statistical Table by Appropriation, January 30, 1998; FY 2000 Congressional Budget, Statistical Table by Appropriation, January 30, 1999; Fossil Energy Budget for Fiscal year 2001- ; Budget for Fiscal year 2002- ; Budget for Fiscal year 2003- ; Budget for Fiscal year 2004- ;

27
development of PFBC systems- subsystem and component testing, environmental and economic studies, and pilot-plant tests for PFBC systems are funded under the fossil coal R&D program, while demonstration of first and second generation PFBC systems are under CCT program (NRC, 1995). The funding for advanced clean/efficient power system development related to coal increased between 1993 and 1995, experienced a decline, and then increased again in 1999. Its share in the overall coal R&D funding increased from almost 40 percent in 1993 to more than 70 percent in 1999. The highest funding within this component goes for gasification based combined cycle systems (see Figure 3.5). Share of funds allocated for advanced PFB related research declined between 1993 and 1999, as did funds for Indirectly Fired Cycle Development. Interestingly, the budget for advanced PC development declined from 50 percent of the funds allocated for IGCC in 1993 to only a third in 1995. But funds for advanced PC development increased from 1995 onwards and in 1998 it was substantially high at 70 percent of the funds allocated for IGCC development. Funds for advanced PFB development have been close to 80 to 90 percent of the funds allocated for IGCC development between 1993 and 1998, while in 1999 its share in relation to IGCC fell to less than a half.

28
Figure 3.1: Total Fossil Energy R&D expenditure (in millions of U.S. 2004 dollars)
Source: Data for the figure drawn from DOE’s Congressional Budget Tables for FY 1994 to FY 2004; See Footnote 29 for details of the sources.
Figure 3.2: Fossil Energy R&D and coal R&D expenditures (in millions of US 2004 dollars)
Source: Data for the figure drawn from DOE’s Congressional Budget Tables for FY 1994 to FY 2004; See Footnote 29 for details of the sources.
0
10 0
20 0
30 0
40 0
50 0
60 0
70 0
19 9 2 1 99 3 1 99 4 1 99 5 1 9 9 6 1 99 7 1 9 98 19 9 9 2 00 0 20 0 1 2 0 02 20 0 3 2 00 4 2 0 0 5
(B R)
0
100
200
300
400
500
600
700
19921993
19941995
19961997
19981999
20002001
20022003
2004
2005 (BR
)
T otal Foss il Energy R&D Coal

29
Figure 3.3: Fossil Energy R&D expenditure allocated to coal, petroleum, and natural gas (in million U.S. 2004 dollars)
Source: Data for the figure drawn from DOE’s Congressional Budget Tables for FY 1994 to FY 2004; See Footnote 29 for details of the sources.
Figure 3.4: Coal, petroleum and natural gas shares in Fossil Energy R&D expenditure
Source: Data for the figure drawn from DOE’s Congressional Budget Tables for FY 1994 to FY 2004; See Footnote 29 for details of the sources.
0
100
200
300
400
500
600
1 992
1993
1994
1 995
1 996
1997
19981 99
9200
0200
12 00
2200
3200
4
2005 (
BR)
Natural g as
Petroleu m
Coa l
0%
20%
40%
60%
80%
100%
1992
1 993
1 994
1 995
1996
1 997
1 998
1999
2000
2001
2002
2003
2004
2005 (
BR)
Na tu ral gas
Petro leum
Co al

30
Tab
le 3
.1: B
reak
up o
f co
al-r
elat
ed R
&D
exp
endi
ture
(in
mill
ions
of
cons
tant
200
4 U
.S.$
)
1992
29
1993
19
94
1995
19
96
1997
19
98
1999
20
0030
20
01
2002
20
03
2004
20
05
Adv
ance
d cl
ean
fuel
s re
sear
ch
59
.7
48.7
37
.0
22.0
17
.8
17.2
17
.0
21.3
24
.0
34.8
30
.8
31.2
16
.0
Adv
ance
d cl
ean/
effi
cien
t po
wer
sys
tem
s31
98
.1
114.
2 10
2.0
90.5
76
.0
80.3
95
.9
Adv
ance
d re
sear
ch a
nd
tech
nolo
gy
deve
lopm
ent
37.1
31
.9
34.2
29
.0
24.1
19
.5
19.2
21
.8
24.5
31
.6
28.6
32
.9
38.2
30
.5
Con
trol
tech
and
co
al p
repa
rati
on
62.7
Coa
l liq
uefa
ctio
n 48
.5
C
ombu
stio
n sy
stem
s 46
.3
H
eat e
ngin
es
22.3
Mag
neto
hydr
odyn
amic
s 49
.5
36.3
S
urfa
ce c
oal
gasi
fica
tion
13
.6
C
entr
al s
yste
ms32
12
0.8
206.
3 96
.6
92.7
89
.9
64.5
D
istr
ibut
ed
gene
ratio
n sy
stem
s33
46.5
53
.7
58.4
62
.8
40.3
49
.0
Sequ
estr
atio
n R
&D
9.
6 19
.2
32.4
39
.6
72.1
23
.0
Cle
an C
oal P
ower
In
itiat
ive
150.
4 14
7.0
178.
8 28
7.0
Tot
al c
oal
279.
9 22
6.0
197.
0 16
8.1
136.
5 11
3.2
116.
7 13
4.7
222.
7 33
4.9
401.
2 40
5.9
450.
5 47
0.0
Sour
ce:
Dat
a so
urce
d fr
om D
OE
’s C
ongr
essi
onal
Bud
get T
able
s fo
r FY
199
4 to
FY
200
4; S
ee F
ootn
ote
29 f
or d
etai
ls o
f th
e so
urce
s.
29
The
cat
egor
ies
unde
r w
hich
bud
geta
ry a
ppro
pria
tion
s ta
ke p
lace
are
sig
nifi
cant
ly d
iffe
rent
for
199
2 as
com
pare
d to
the
follo
win
g ye
ars.
30
In
the
year
200
0, th
e bu
dget
ary
cate
gori
zati
ons
alte
red
as c
ompa
red
to th
e fe
w p
rece
ding
yea
rs.
31 M
ost o
f th
e ac
tivi
ties
rel
ated
to a
dvan
cem
ents
in s
peci
fic
coal
tech
nolo
gies
hav
e be
en c
ondu
cted
und
er th
e A
dvan
ced
Cle
an/E
ffic
ient
Pow
er s
yste
ms
cate
gory
fr
om 1
993
to 1
999.
32
Cen
tral
sys
tem
s pr
imar
ily
incl
udes
the
foll
owin
g su
b-ca
tego
ries
- a)
Inn
ovat
ions
for
exi
stin
g pl
ants
(fo
rmer
ly A
R&
ET
); b
) A
dvan
ced
syst
ems
that
incl
ude,
L
EB
S, C
ombu
stio
n sy
stem
s, I
ndir
ectl
y fi
red
cycl
e, I
GC
C, P
ress
uriz
ed f
luid
ized
bed
, Tur
bine
s; a
nd c
) P
ower
pla
nt I
mpr
ovem
ent I
niti
ativ
e,
33 P
rim
aril
y in
clud
es f
uel c
ell r
elat
ed r
esea
rch
that
was
tran
sfer
red
from
gas
to c
oal i
n 20
00.

31
Tab
le 3
.2: C
oal R
&D
exp
endi
ture
rel
ated
spe
cifi
c te
chno
logi
es a
dvan
ced/
clea
n ef
fici
ent
pow
er s
yste
ms
(in
mill
ions
of
cons
tant
200
4 U
.S.$
)
1992
19
93
1994
19
95
1996
19
97
1998
19
99
2000
34
2001
20
02
2003
20
04
2005
A
dvan
ced
PC
po
wer
pla
nt
13.3
11
.1
13.0
8.
5 12
.1
10.4
17
.4
16.4
L
EB
S
2.1
A
FB
C
5.1
H
igh-
effi
cien
cy
PFB
19
.6
22.4
26
.0
28.8
21
.8
19.6
19
.4
16.0
12
.8
12.5
11
.0
C
ombu
stio
n sy
stem
s
10.2
4.
9
Hig
h-ef
fici
ency
IG
CC
23.6
31
.8
30.0
24
.6
24.7
24
.3
35.4
36
.9
36.0
43
.2
43.9
50
.4
34.5
In
dire
ct f
ired
cy
cle
14
.7
16.9
13
.5
13.7
11
.0
5.4
7.1
7.4
6.2
Adv
ance
d re
sear
ch &
env
. te
ch (
AR
&E
T)
4.3
26.3
20
.8
21.1
16
.1
10.4
13
.8
21.0
15
.4
20.6
23
.7
21.8
21
.7
18.1
T
urbi
nes35
46
.2
31.7
18
.6
16.7
12
.8
12.0
P
ower
Pla
nt
Impr
ovem
ent
Init
iati
ve36
99.3
0.
0 0.
0
0.0
Tot
al
42.4
98
.1
108.
5 10
2.0
88.2
76
.0
80.3
95
.9
120.
8 20
6.3
96.6
92
.7
89.9
64
.5
Sour
ce:
Dat
a so
urce
d fr
om D
OE
’s C
ongr
essi
onal
Bud
get T
able
s fo
r F
Y 1
994
to F
Y 2
004;
See
Foo
tnot
e 29
for
det
ails
of
the
sour
ces.
34
Fro
m 2
000
onw
ards
, fun
ding
und
er it
ems
list
ed in
Tab
le 3
.2 c
ome
unde
r th
e br
oad
subc
ateg
ory
of C
entr
al S
yste
ms.
Bef
ore
2000
, mos
t of
thes
e it
ems
wer
e fu
nded
und
er th
e br
oad
subc
ateg
ory
of A
dvan
ced
Cle
an/E
ffic
ient
Pow
er s
yste
ms.
35
Fun
ds r
elat
ed to
turb
ine
R&
D a
ctiv
ities
shi
fted
fro
m g
as to
coa
l por
tion
of
the
FE
R&
D b
udge
t cat
egor
ies
in 2
000.
36
The
Pow
er P
lant
Im
prov
emen
t Ini
tiat
ive
is a
n ou
tgro
wth
of
cong
ress
iona
l dir
ectio
n pr
ovid
ed in
the
fisc
al y
ear
2001
app
ropr
iati
ons
to D
OE
’s f
ossi
l ene
rgy
rese
arch
pro
gram
. It’
s or
igin
s lie
in th
e bl
acko
uts
and
brow
nout
s of
199
9 an
d 20
00. T
he o
bjec
tive
is to
ens
ure
pow
er s
uppl
y ad
equa
cy.
Pri
vate
sec
tor
fund
ing
for
proj
ects
is r
equi
red
to a
t lea
st m
atch
gov
ernm
ent’
s sh
are
of f
undi
ng s
uppo
rt. (
DO
E, 2
003d
)

32
Figure 3.5: Breakup of funding activities under Advanced Clean/Efficient Power Systems between 1993 and 1999 (in millions of 2004 U.S. dollars)
Source: Data sourced from DOE’s Congressional Budget Tables for FY 1994 to FY 2000; See Footnote 29 for details of the sources. The decline in PFB related funding activities continued 2000 onwards and no funds have been allocated for high efficiency PFB development since the last two years37,38 (see Tables 3.2 and 3.3). Funding for Vision 21 activities related to advanced combustion systems has also been stopped from 2003 (see Table 3.3), while hybrid combustion technology development funding started in 2002. Funds for gas stream cleanup declined significantly in 2004. On the other hand, funding for IGCC has been increasing consistently beyond 1999 and especially for activities related to Vision 21 activities (see Table 3.4). Specifically under the category of systems analysis/product integration subcategory (see Table 3.4), a National Academy of Science study pointed out that systems and engineering analyses activities conducted at different locations were insufficiently integrated and a major shortcoming was a lack of systematic assumptions and design premises across the centers (NRC, 2003). This precluded rigorous comparison or evaluations of technologies in a given category.
Critics point out that related to advanced power systems development, setting of efficiency and cost improvement targets in the Fossil Energy R&D program have been too optimistic and particularly challenging (NRC, 1995). On the other hand, emissions targets have been insufficiently challenging given the capabilities of current commercial technology and anticipated future environmental demands (NRC, 1995). As an example, advanced power systems efficiency was targeted to increase from 38 to 42 percent to 60 percent within a span of two decades (NRC, 1995). However, for emissions, targets were set at one-tenth of the 1979 federal New Source Performance Requirements (NSPS) of SO2, NOX, and particulates by 2010 (NRC, 1995). These efficiency and emissions objectives were to be attained at an overall cost of electricity generation that was 10 to 20 percent lower (NRC, 1995).
37Beyond 1999, the funding for activities related to coal gasification and combustion fall under the broad category of Central Systems. 38 Central systems include the following subcategories for funding: a) Innovations for existing plants (formerly AR&ET); b) Advanced systems- IGCC, Combustion systems, Turbines; c) Power plant Improvement Initiative.
0
20
40
60
80
100
120
1993 1994 1995 1996 1997 1998 1999
A R&ET
IFC
IGCC
PFB
PC

33
Table 3.3: Details of funding related to Pressurized Fluidized Bed+ (in millions of current U.S. dollars) Items 2000 2001 2002 2003 2004 2005
(BR)* Gas stream cleanup 3.92 2.739 4.09 5.31 1.35 0 Pressurized fluidized bed combustion
7.729 8.883 0 0 0 0
Hybrid combustion 0 0 3.11 4.227 3.539 0 Vision 21 0.2 0.2 3.41 0.457 0 0 Program Support 0.122 0.122 0.11 0.103 0.50 0 Total 11.971 11.944 10.72 10.097 4.939 0 * Budgetary request + Since funding for PFBC stopped from 2002, this category now is titled as Combustion systems including gas stream cleanup, hybrid combustion, Vision 21, and Program support Source: Data sourced from DOE’s Congressional Budget Tables for FY 1999 to FY 2004; See Footnote 29 for details of the sources. Table 3.4: Details of funding under Integrated Gasification Combined Cycle (in millions of current U.S. dollars) Items 2000 2001 2002 2003 2004 2005
(BR)* Gasification systems technology
18.054 17.432 21.7 20.352 29.334 15.305
Systems Analysis/Product Integration
3.528 3.981 3.652 2.843 3.96 4
Vision 21 12.481 12.573 16.208 19.662 16.83 14.8 Program Support 0.352 0.351 0.43 0.444 0.51 0.345 Total 34.415 34.337 41.99 43.301 50.372 34.45
* Budgetary request Source: Data sourced from DOE’s Congressional Budget Tables for FY 1999 to FY 2004; See Footnote 29 for details of the sources. The third component of the coal FE R&D budget, the Advanced Research and Technology Development component39, includes all DOE coal advanced research programs, but funds for advanced research programs (that includes research in cross-cutting areas) are not restricted to this category alone (NRC, 1995). Crosscutting issues include research in coal combustion and gasification, coal conversion and catalysis, and materials research40 (NRC, 1995). The coal related advanced research programs fall into two categories- programs within the Advanced Research and Technology Development (AR&TD) budget category and a set of technology specific programs falling under the general category of Advanced Research and Energy Technology (AR&ET) (AR&ET in turn falls within the Advanced Clean/Efficient Power Systems budget category) (Table 3.2) (NRC, 1995). Funding for crosscutting research maintained a third share in the coal R&D funding between 1993 and 1999- from 2000 its share has steadily declined from almost a fifth to a tenth, even though funds allocated continued to increase (Figure 3.6). The sharp decline in this area funding between 1993 and 1997 contributed to a decline in the overall coal R&D funding as observed earlier. Advanced Turbine Technology Program started receiving funds in 1992, and has been a major recipient since then, averaging somewhere between 30 to 40 million dollars till 2001. 2002 and 2003
39 This category from 2000 onwards is titled as Advanced Research. 40Opportunities in materials research relevant for coal technologies fall in three areas: advanced gas turbines; high-temperature high-pressure heat exchangers, and inorganic membranes (NRC, 1995).

34
saw a decline in funding to a level close to 15 to 20 million dollars, while in 2004 it had only about $13 million funding. The fuel cell program has been consistently funded at $40-50 million per year. Sequestration related R&D funding started in 2000 and has been increasing steadily- there has been a sevenfold increase since the beginning to now, with funding for present activities close to $70 million.
Figure 3.6 Funds for crosscutting research areas related to coal
Source: Data sourced from DOE’s Congressional Budget Tables for FY 1994 to FY 2004; See Footnote 29 for details of the sources. 3.1.2 The Clean Coal Technology (CCT) Program
The Clean Coal Technology (CCT) Program constitutes a major effort outside the traditional coal R&D projects undertaken by the DOE and its predecessor organizations. The program was initiated in 1986 and scheduled to run through 2004 (DOE, 2001). The origins of this lie in the acid rain debates of the early eighties. The recommendations of the Special Envoys on Acid Rain, submitted in 1987, were adopted and became a presidential initiative in March 1987 (DOE, 2001). U.S. and Canadian envoys recommended a five-year, $5 billion U.S. effort to curb precursors to acid rain formation—sulfur dioxide (SO2) and nitrogen oxides (NOX) (DOE, 2001). The Energy Policy Act of 1992 also specifically directs DOE to conduct demonstration and commercialization programs on coal-based technologies and the setting up of the CCT program constituted a major effort undertaken in that direction (NRC, 1995). The initial program emphasis was on controlling SO2 and NOX emissions from existing coal-based power generators through approaches such as coal processing, combustion modifications, post-combustion cleanup systems, and repowering with advanced power generation systems. As the CCT program evolved, the Clean Air Act Amendments (CAAA) of 1990 was drafted and the CCT program was responsive to shifts in environmental emphasis (NRC, 2000a). Aside from acid rain precursors, there were emerging concerns to control emissions of hazardous air pollutants (HAPs), also referred to as air toxics41 (DOE, 2001). The CCT program integrated this concern in the design of the projects. In turn, the existence of the CCT Program helped formulate the Clean Air Act Amendment (CAAA) of 1990 by providing real-time data on emission control capabilities (DOE, 2001). CAAA provided incentives for setting up clean coal projects by exempting them from environmental regulations such as New Source Performance
41 Title III of the CAAA listed 189 airborne compounds subject to control, including trace elements and volatile and semi-volatile compounds (DOE, 2001).
0
10
20
30
40
50
60
70
19931 994
1995
1996199 7
1998
1 999
2 000
2001200
22003
2004
2005 (BR)
AR&TD
AR&ET
Total

35
Standards (NSPS) & New Source Review (NSR) for pollutants (DOE, 2001). This waiver from environmental compliance provoked a very large number of project proposal submissions.
The early stages of the program had pollution control as the priority area. There was an emphasis on repowering technologies that could address pollution concerns as well as respond to growing power demands. This led to early awards of three key repowering projects—two ACFB projects and a PFBC project (DOE, 2001). As the program progressed, a number of environmental and energy issues combined changed the program emphasis towards seeking high-efficiency, low-emission power generation technologies for both repowering and new power generation. Energy demand projections in the United States showed the need for continued reliance on coal-based power generation, with significant growth required into the 21st century (DOE, 2001). Environmental issues included a growing concern over greenhouse gas emissions, capping of SO2 emissions, increasing attention to NOx in ozone non-attainment areas, and recognizing fine particulate emissions as a significant health threat. These issues prompted pursuing of projects in the area of advanced power generation systems that could provide major enhancements in efficiency and control of SO2, NOx, and particulates, without introducing external parasitic control devices. It led to projects in PFBC, initiation of projects in IGCC, and projects in advanced combustion and heat engines. The Congressional funding for the Program started in 1986 and the initial funding was for almost $400 million, to be spread over 1986 to 1988 (NRC, 1995). But in March 1987, in response to the Joint Canadian and U.S. Special Envoy recommendations concerning acid rain, President Reagan expanded the CCT program’s funding by $2.35 billion (NRC, 1995). The funds were to be offered in five solicitations for cost-shared projects in which industry would provide at least 50 percent of the cost of design, construction, and operation of the demonstration projects (DOE, 2001). The objective of these projects was to demonstrate advanced coal technologies at a large enough scale that would establish the basis for the commercial deployment of these technologies. This cost-sharing approach represented a marked departure from traditional DOE FE R&D Programs in that industry partners must contribute 50 percent of the costs (NRC, 1995). A unique feature was that each project was committed to repaying the government’s share of the project’s funding from the proceeds of successful commercialization of the technology. As of May 31, 2003, there were 36 active or completed projects that had resulted in a combined commitment by the federal government and the private sector of nearly $4.8 billion (DOE, 2003 b). DOE’s cost-share for these projects exceeded $1.5 billion, or approximately 32 percent of the total, while the remaining 68 percent contribution has come from private participants (DOE, 2003 b). CCT demonstration projects have been in four major product line categories- environmental control devices, advanced electric power generation, coal processing for clean fuels, and industrial applications, though majority of the projects constitutes advanced electric power generation systems and associated high-performance pollution control devices (DOE, 1999; DOE, 2001). It should be pointed out that many of the technologies demonstrated under Advanced Power System projects are the ones that were also targeted in the FE R&D program. As a result, a number of CCT demonstrations were considered demonstrations under the FE R&D Program, notably the first and second-generation PFBC, first- and second-generation IGCC, IGFC, and mild gasification technology demonstrations (NRC, 1995). Table 3.5 gives the detailed status of demonstration projects (ongoing and completed) under the CCT Program. Project specific details are discussed under specific technology categories in later sections. Figure 3.7 shows appropriations from the CCT Program.

36
Figure 3.7: Appropriations for CCT Program42 (in millions of 2004 U.S.$)
Note that the negative bars in the figure imply net payback from CCT demonstration projects Source: Data sourced from DOE’s Congressional Budget Tables for FY 1994 to FY 2004; See Footnote 29 for details of the sources. The cost-sharing approach adopted by DOE in the CCT program has raised criticisms. The Clean Coal Technology Council (CCTC) (CCTC represents coal, utility, manufacturing, design and construction industries and states) recommended revision of DOE’s cost-sharing approach (NRC, 1995). It suggested that DOE’s cost-sharing should be only on certain cost differentials (including both capital and operating costs) as compared to a conventional technology- financing of the ‘risk gap’ for a new technology as compared to a conventional one would also bring down DOE’s share from 50 percent of the total project cost (NRC, 1995). A study conducted by the National Academy concluded that an incentive program be developed and implemented in order to offset the capital and operating risks associated with early commercial applications of technologies demonstrated at a commercial scale (NRC, 1995). The National Coal Council, a federal advisory committee to the Secretary of Energy, recommended the setting up of a federal incentive program (with $1.1 billion of capital incentives and $0.3 billion in operating incentives over the 15 year period from 1995 to 2010) that could offset both capital and operating risks, based as a percentage of the cost (both capital and operating) differentials between a CCT and a conventional technology (NRC, 1995). A study conducted by the National Academy of Sciences in 1995 concluded that even though the CCT program can be considered to be an excellent start in the commercialization of advanced power generation technologies, further incentives in the form of federal cost-sharing programs were needed for commercial deployment of many of the technologies demonstrated in the program (NRC, 1995). The future of technologies demonstrated commercially would depend on a follow-up commercialization program that addressed cost and reliability concerns. Financial risks associated with second-and third-of-a-kind demonstration projects impede commercial acceptance of new power generation technologies. There are suggestions on providing tax incentives to encourage commercial deployment of demonstrated technologies so that they move along a “learning curve” that reduces technical risks to the point that these plants can attract commercial financing (NCC, 2003). This concept is embodied in the National Environmental and Energy Technology (NEET) legislation, introduced in both the House and the Senate. For existing facilities, the bill provides a production tax
42 Beginning in FY 2003, all CCT balances are considered to be part of the total Coal Program.
-200
-100
0
100
200
300
400
500
600
1992 1993 1994 1 995 199 6 1997 1998 1999 2000 2001 2002 2 003 20 04 200 5
(BR )

37
credit of 0.34 cents/kWh for retrofitting or repowering with CCT as defined in the bill so that it meets efficiency and emissions objectives (NCC, 2003). For new units, NEET provides a 10 percent investment tax credit, and production tax credits of varying amounts (NCC, 2003). A National Coal Council report made a specific set of recommendations for financial incentives to promote early commercialization of CCTs (NCC, 2002). These recommendations include- providing investment tax credit to the project owner’s equity; providing variable production tax credit tied to energy production and energy efficiency over the first 10 years of operation along with higher benefits to early implementation of high efficiency technologies; and set up a ‘risk pool’ to cover repairs or modifications necessary during startup and first three years of operation. This package was estimated to cost the government $1.5 billion over a 23-year period from 1999 to 2021 (NCC, 2002). Of that amount, the investment tax credit would cost $203 million while the production tax credit would account for $1.02 billion while the risk pool would be $276 million (NCC, 2002). Innovations in some particular areas, like the development of lower-cost low-NOX burners and lower cost sulfur dioxide controls have been quite useful and have led to widespread deployment of these technologies. Concerns on deployment of CCTs by both merchant plants and utilities remain and the DOE recognizes that “despite the performance and emission advantages of these technologies [IGCC and FBC], high capital costs threaten competitiveness in the utility market” (Tell Us, 2001). FBC seemed to be making some inroads due to its inherent fuel flexibility advantage- examples include a 440 MW Red Hills Power project plant that burns lignite and a Kentucky plant that would burn coal wastes (Tell Us, 2001). Studies on the CCT program also point to the fact that the program failed to achieve significant improvements in coal plant efficiencies (Tell Us, 2001). Coal gasification technologies linked with combined cycle units or fuel cells that could potentially exceed 50 percent efficiency offers promising prospects for the future, but demonstration plants are yet to come close to this performance level and commercialization in the United States seems many years away (Tell Us, 2001). A National Academy study also examined to what extent all of DOE’s coal program activities were in line with the mandate of the Energy Policy Act of 1992- the study noted a significant discrepancy in priorities (NRC, 1995). While the DOE programs related to coal focused on relatively near-term activities- notably the development, demonstration, and commercialization of coal-based power generation systems by 2010, at the expense of longer-term research programs, the EPACT endorsed development of a longer-term, more balanced spectrum of coal-based technologies (NRC, 1995). Last but not the least, critics point to the fact that the program has been plagued by mismanagement, and has been the target of seven GAO investigations over its 16-year life, largely as the result of project bankruptcies and overruns (Tell Us, 2001).

38
Tab
le 3
.5: S
tatu
s of
Adv
ance
d E
lect
ric
Pow
er G
ener
atio
n pr
ojec
ts im
plem
ente
d un
der
DO
E’s
CC
T P
rogr
am
Pro
ject
s T
echn
olog
y &
Fue
l P
roje
ct O
bjec
tive
P
roje
ct
fund
ing
Stat
us &
Acc
ompl
ishm
ents
Flu
idiz
ed b
ed c
ombu
stio
n N
ucla
CFB
de
mon
stra
tion
pr
ojec
t A
t Tri
-Sta
te
Gen
erat
ion
and
Tra
nsm
issi
on
Ass
ocia
tion
s In
c.’s
Nuc
la
stat
ion
site
Tec
hnol
ogy
Fos
ter
Whe
eler
’s a
tmos
pher
ic
circ
ulat
ing
flui
dize
d-be
d co
mbu
stio
n (A
CFB
) sy
stem
; 11
0 M
We
gros
s pl
ant c
apac
ity
and
100
MW
e ne
t pla
nt
capa
city
F
uel
Wes
tern
bitu
min
ous
coal
s ra
ngin
g fr
om 0
.5-1
.5 p
erce
nt
sulf
ur a
nd 1
7-23
per
cent
ash
To
dem
onst
rate
the
feas
ibil
ity
of S
CFB
te
chno
logy
at u
tilit
y sc
ale
and
to e
valu
ate
econ
omic
, en
viro
nmen
tal,
and
oper
atio
nal p
erfo
rman
ce.
Clo
se to
$16
0 m
illio
n D
OE
sha
re-
11
perc
ent;
Par
ticip
ant
shar
e- 8
9 pe
rcen
t
Pla
nt d
emon
stra
tion
star
ted
in 1
988
and
com
plet
ed in
19
91.
Eff
icie
ncy
achi
evem
ent w
as a
roun
d 30
per
cent
P
roje
ct r
epre
sent
s fi
rst r
epow
erin
g ap
plic
atio
n of
AC
FB
; de
mon
stra
ted
abil
ity
to b
urn
a w
ide
vari
ety
of c
oals
; co
mpr
ehen
sive
dat
abas
e de
velo
ped
enab
led
tech
nolo
gy
repl
icat
ion
in m
any
com
mer
cial
pla
nts;
N
ucla
con
tinu
es c
omm
erci
al o
pera
tions
.
JEA
Lar
ge-S
cale
C
FB C
ombu
stio
n D
emon
stra
tion
pr
ojec
t (B
row
nfie
ld
proj
ect)
at
Jac
kson
vill
e E
lect
ric
Aut
hori
ty’s
Nor
th-
side
sta
tion
Tec
hnol
ogy
Fos
ter
Whe
eler
’s a
tmos
pher
ic
circ
ulat
ing
flui
dize
d be
d co
mbu
stor
(A
CF
B)
297.
5 M
We
gros
s ca
paci
ty;
275
MW
e ne
t cap
acit
y;
Fue
l E
aste
rn B
itum
inou
s, 3
.39
pe
rcen
t sul
fur
(des
ign)
To
dem
onst
rate
AC
FB a
t 29
7.5
MW
e gr
oss
capa
city
(re
pres
entin
g a
scal
e-up
) &
34
perc
ent
effi
cien
cy b
ased
on
HH
V
(equ
ival
ent t
o 37
.5
perc
ent e
ffic
ienc
y ba
sed
on L
HV
); v
erif
y pe
rfor
man
ce e
xpec
tati
ons;
ac
com
plis
h gr
eate
r th
an
90 p
erce
nt S
O2
rem
oval
an
d 60
per
cent
NO
X
emis
sion
s re
duct
ions
Clo
se to
$30
9 m
illio
n D
OE
sha
re-
24
perc
ent;
Par
ticip
ant
shar
e- 7
6 pe
rcen
t
Pro
ject
con
stru
ctio
n co
mpl
eted
end
of
2001
; U
nsch
edul
ed o
utag
es e
xper
ienc
ed d
ue to
ope
ratio
nal
diff
icul
ties
dur
ing
earl
y st
ages
; pla
nt b
roug
ht b
ack
to
oper
atio
n ea
rly
2003
, ope
ratin
g on
ble
nds
of p
etco
ke/c
oal
sinc
e th
en.
Lar
gest
CFB
com
bust
or o
pera
ting
at c
omm
erci
al s
cale
in
the
wor
ld;
JEA
has
con
vert
ed a
sec
ond
boil
er to
the
new
tech
nolo
gy
enti
rely
wit
h it
s ow
n fu
ndin
g.
Ong
oing
dem
onst
rati
on a
ctiv
itie
s w
ith
four
coa
l ble
nds
Nex
t gen
erat
ion
CFB
coa
l ge
nera
ting
uni
t A
t Col
orad
o Sp
ring
s U
tilit
ies
Tec
hnol
ogy
Fos
ter
Whe
eler
’s c
ircu
latin
g fl
uidi
zed
bed
com
bust
or
(AC
FB)
150
MW
cap
acit
y an
d ad
vanc
ed s
elec
tive
non
-ca
taly
tic r
educ
tion
(SN
CR
);
Fue
l S
ub-b
itum
inou
s P
owde
r R
iver
B
asin
(P
RB
) bl
ende
d w
ith
To
dem
onst
rate
an
adva
nced
low
-em
issi
on
CF
B c
ombu
stio
n sy
stem
w
ith
96-9
8 pe
rcen
t sul
fur
rem
oval
, red
uced
li
mes
tone
con
sum
ptio
n,
and
an in
tegr
ated
trac
e m
etal
con
trol
sys
tem
that
re
mov
es 9
0 pe
rcen
t m
ercu
ry, l
ead,
and
oth
er
Clo
se to
$30
1 m
illio
n D
OE
sha
re-
10
perc
ent;
Par
ticip
ant
shar
e- 9
0 pe
rcen
t
Pro
ject
was
sel
ecte
d fo
r aw
ard
in J
an 2
003;
pro
ject
on
goin
g an
d is
exp
ecte
d to
last
for
six
yea
rs;
The
adv
ance
d co
ntro
l sys
tem
bei
ng d
emon
stra
ted
has
pote
ntia
l to
be a
ppli
cabl
e to
new
and
som
e ex
istin
g C
FB
unit
s an
d de
mon
stra
te f
uel f
lexi
bili
ty f
or w
este
rn a
nd
east
ern
coal
s as
wel
l as
was
te c
oals

39
coal
was
te, b
iom
ass,
pe
trol
eum
cok
e ac
id g
ases
Tid
d P
FB
C
dem
onst
rati
on
proj
ect
At t
he O
hio
Pow
er
Com
pany
’s
Jeff
erso
n co
unty
si
te
Tec
hnol
ogy
Bab
cock
and
Wil
cox
Com
pany
’s P
FBC
sys
tem
(u
nder
lice
nse
from
AB
B
Car
bon)
70
MW
e ne
t pla
nt c
apac
ity
F
uel
Ohi
o bi
tum
inou
s co
al w
ith
2-4
perc
ent s
ulfu
r
To
veri
fy P
FB
C
perf
orm
ance
exp
ecta
tion
s in
a c
ombi
ned-
cycl
e re
pow
erin
g ap
plic
atio
n at
ut
ility
sca
le;
Clo
se to
$19
0 m
illio
n D
OE
sha
re-
35
perc
ent;
Par
ticip
ant
shar
e- 6
5 pe
rcen
t
Pro
ject
sta
rted
ope
rati
on in
Mar
ch 1
991
and
com
plet
ed
oper
atio
ns in
Mar
ch 1
995.
T
idd
was
the
firs
t lar
ge-s
cale
ope
rati
onal
dem
onst
rati
on
of P
FBC
in th
e U
nite
d St
ates
, rep
rese
ntin
g a
13:1
sca
le-
up f
rom
a p
ilot f
acili
ty.
Eff
icie
ncy
was
rel
ativ
ely
low
(33
.2 p
erce
nt)
beca
use
the
unit
was
sm
all a
nd n
o at
tem
pts
wer
e m
ade
to o
ptim
ize
heat
rec
over
y; te
chno
logy
dem
onst
rate
d co
mm
erci
al
read
ines
s in
term
s of
ope
rati
ons;
led
to s
igni
fica
nt
refi
nem
ents
and
und
erst
andi
ng in
dif
fere
nt c
ompo
nent
s su
ch th
at in
clud
e tu
rbin
e de
sign
, sor
bent
uti
lizat
ion,
si
nter
ing,
pos
t-be
d co
mbu
stio
n, a
sh r
emov
al, a
nd b
oile
r m
ater
ials
. D
ue to
sm
all s
cale
of
oper
atio
ns, d
etai
led
econ
omic
s w
ere
not p
repa
red.
In
tegr
ated
Gas
ific
atio
n C
ombi
ned
Cyc
le (
IGC
C)
Pin
on P
ine
IGC
C
pow
er p
roje
ct a
t Si
erra
Pac
ific
C
ompa
ny’s
Ren
o si
te in
Nev
ada.
Tec
hnol
ogy
IGC
C u
sing
the
KR
W a
ir-
blow
n pr
essu
rize
d fl
uidi
zed-
bed
coal
gas
ific
atio
n sy
stem
; 10
7 M
We
gros
s pl
ant c
apac
ity
and
99 M
We
net p
lant
ca
paci
ty
Fue
l S
outh
ern
Uta
h bi
tum
inou
s co
al w
ith
0.5-
0.9
perc
ent
sulf
ur;
To
dem
onst
rate
air
-blo
wn
pres
suri
zed
flui
dize
d-be
d IG
CC
inco
rpor
atin
g ho
t ga
s cl
eanu
p; to
eva
luat
e a
low
-Btu
gas
com
bust
ion
turb
ine;
and
to a
sses
s lo
ng-t
erm
rel
iabi
lity,
av
aila
bilit
y, a
nd
mai
ntai
nabi
lity
at a
sca
le
suit
able
for
com
mer
cial
op
erat
ions
;
Clo
se to
$33
6 m
illio
n D
OE
sha
re-
50
perc
ent;
Par
ticip
ant
shar
e- 5
0 pe
rcen
t
Pro
ject
sta
rted
ope
rati
ons
in 1
998,
but
ope
rati
ons
wer
e te
rmin
ated
end
of
2000
; T
houg
h ce
rtai
n op
erat
iona
l suc
cess
es w
ere
dem
onst
rate
d du
ring
pro
ject
ope
rati
ons,
the
proj
ect c
ould
not
rea
ch
stea
dy-s
tate
ope
ratio
ns, p
rim
aril
y du
e to
pro
blem
s in
the
hot g
as p
artic
ulat
e fi
ltrat
ion
syst
em;
Tam
pa E
lect
ric
IGC
C p
roje
ct a
t T
ampa
Ele
ctri
c C
ompa
ny’s
Pol
k P
ower
sta
tion
Tec
hnol
ogy
Adv
ance
d IG
CC
sys
tem
usi
ng
Tex
aco’
s pr
essu
rize
d,
entr
aine
d-fl
ow, o
xyge
n-bl
own
gasi
fier
tech
nolo
gy;
315
MW
e gr
oss
plan
t cap
acit
y an
d 25
0 M
We
net p
lant
ca
paci
ty
Fue
l
To
dem
onst
rate
IG
CC
in a
gr
eenf
ield
com
mer
cial
sc
ale
util
ity
oper
atio
ns
usin
g a
pres
suri
zed,
en
trai
ned-
flow
, oxy
gen-
blow
n ga
sifi
er,
conv
enti
onal
col
d ga
s cl
eanu
p, a
nd a
n ad
vanc
ed
turb
ine
wit
h ni
trog
en
Clo
se to
$30
3 m
illio
n D
OE
sha
re-
49
perc
ent;
Par
ticip
ant
shar
e- 5
1 pe
rcen
t
Pro
ject
sta
rted
ope
rati
ons
in 1
996
and
com
plet
ed
dem
onst
rati
on o
pera
tion
s in
200
1;
Sign
ific
ant e
nvir
onm
enta
l and
ope
rati
onal
ach
ieve
men
ts;
plan
t ach
ieve
d 35
per
cent
eff
icie
ncy
(bas
ed o
n H
HV
) (e
quiv
alen
t to
38.6
per
cent
LH
V b
ased
eff
icie
ncy)
; pr
oble
ms
enco
unte
red
in r
efra
ctor
y li
ner
life
due
to
freq
uent
fue
l cha
nges
- fu
el s
witc
hed
over
to c
oal/
petc
oke
blen
d;
Cap
ital
cos
t est
imat
ion
base
d on
pro
ject
lear
ning

40
Coa
l, pe
tcok
e; p
etco
ke/c
oal
blen
ds; b
iom
ass;
in
ject
ion;
ex
peri
ence
s- $
1650
/kW
(in
200
1 $)
; P
lant
con
tinue
s co
mm
erci
al o
pera
tions
; W
abas
h R
iver
C
oal G
asif
icat
ion
Rep
ower
ing
proj
ect,
a jo
int
vent
ure
of D
yneg
y an
d P
SI
Ene
rgy
at
Vig
o C
ount
y in
In
dian
a
Tec
hnol
ogy
IGC
C u
sing
Glo
bal E
nerg
y’s
two-
stag
e, p
ress
uriz
ed,
oxyg
en-b
low
n, e
ntra
ined
-flo
w
gasi
fica
tion
syst
em-
E-G
as
tech
nolo
gy;
Cap
acit
y- 2
96 M
We
(gro
ss);
26
2 M
We
(net
);
Fue
l Il
lino
is B
asin
bit
umin
ous
coal
(p
etro
leum
cok
e al
so u
sed)
To
dem
onst
rate
uti
lity
repo
wer
ing
wit
h a
two-
stag
e, p
ress
uriz
ed,
oxyg
en-b
low
n, e
ntra
ined
-fl
ow I
GC
C s
yste
m;
effe
ctiv
ely
util
ize
high
-su
lfur
bitu
min
ous
coal
; an
d to
ass
ess
long
-ter
m
relia
bili
ty, a
vail
abil
ity,
an
d m
aint
aina
bilit
y of
the
syst
em a
t a f
ully
co
mm
erci
al s
cale
.
Clo
se to
$43
8 m
illio
n D
OE
sha
re-
50
perc
ent;
Par
ticip
ant
shar
e- 5
0 pe
rcen
t
Dem
onst
rati
on o
pera
tion
s st
arte
d in
199
5 an
d co
mpl
eted
in
199
9;
Tra
nsfo
rmed
a 1
950s
, 90
MW
e vi
ntag
e P
C p
lant
with
33
perc
ent e
ffic
ienc
y in
to a
262
MW
e IG
CC
pla
nt w
ith
a de
mon
stra
ted
effi
cien
cy c
lose
to 4
0 pe
rcen
t; Si
gnif
ican
t env
iron
men
tal a
nd o
pera
tion
al p
erfo
rman
ce
achi
evem
ents
; C
ost e
stim
atio
ns f
or th
e pr
ojec
t- $
1590
/kW
(in
199
4 $)
;
Ken
tuck
y P
ione
er
Ene
rgy
IGC
C
dem
onst
rati
on
proj
ect
at E
ast K
entu
cky
Pow
er C
ompa
ny’s
S
mit
h si
te
Tec
hnol
ogy
IGC
C u
sing
a B
G/L
(fo
rmer
ly
Bri
tish
Gas
/Lur
gi)
slag
ging
fi
xed-
bed
gasi
fica
tion
sys
tem
co
uple
d w
ith
Fue
l Cel
l E
nerg
y’s
mol
ten
carb
onat
e fu
el c
ell (
MC
FC
) C
apac
ity-
580
MW
e (g
ross
);
540
MW
e (n
et);
2 M
We
MC
FC
F
uel
Hig
h-su
lfur
Ken
tuck
y bi
tum
inou
s co
al a
nd p
alle
tized
re
fuse
-der
ived
fue
l
To
dem
onst
rate
the
relia
bili
ty, a
vail
abil
ity,
an
d m
aint
aina
bilit
y of
a
utili
ty s
cale
IG
CC
sys
tem
an
d th
e op
erab
ility
of
a m
olte
n ca
rbon
ate
fuel
cel
l fu
eled
by
coal
gas
.
Clo
se to
$43
2 m
illio
n D
OE
sha
re-
18
perc
ent;
Par
ticip
ant
shar
e- 8
2 pe
rcen
t
The
NE
PA
pro
cess
for
the
IGC
C p
lant
was
com
plet
ed
earl
y Ja
nuar
y 20
03-
the
IGC
C c
onst
ruct
ion
is li
kely
to
begi
n m
idw
ay in
200
4 an
d op
erat
ions
are
like
ly to
be
initi
ated
in 2
006.
T
he p
lant
eff
icie
ncy
is e
xpec
ted
to b
e 40
per
cent
(ba
sed
on H
HV
) (e
quiv
alen
t to
44.2
per
cent
bas
ed o
n L
HV
)-
com
mer
cial
app
lica
tion
is li
kely
to a
chie
ve 4
2 pe
rcen
t ef
fici
ency
(ba
sed
on H
HV
) (e
quiv
alen
t to
46.4
per
cent
ba
sed
on L
HV
).
Pro
ject
like
ly to
ach
ieve
90
perc
ent S
O2
and
NO
X
emis
sion
s re
duct
ions
. Fu
el c
ell p
orti
on o
f th
e pr
ojec
t has
bee
n re
loca
ted
to
Glo
bal E
nerg
y’s
Wab
ash
site
in A
ugus
t 200
3.
So
urce
: In
form
atio
n ha
s be
en c
ompi
led
from
the
foll
owin
g so
urce
s: D
OE
, 200
1a; D
OE
, 200
3b; 2
003d
; 200
3e.

41
3.1.3 Vision 21 Program The Vision 21 Program is an R&D Program funded through DOE’s Office of Fossil
Energy and NETL (NRC, 2003). It is focused on the development of advanced technologies ready for commercial deployment by 2015. Vision 21 is a collection of projects that involve conversion of fossil fuels into electricity, process heat, fuels, and/or chemicals cost effectively, with very high efficiency and very low emissions, with the overall objective of developing these technologies that would fit into Vision 21 energy plants (NRC, 2003). The projects have developed as an outgrowth of ongoing R&D activities in the Office of Fossil Energy Coal and Power Systems Program as well as a result of Vision 21 solicitations by DOE/NETL. The Vision 21 energy plants have a specific set of performance targets defined- for example, for coal-based systems the targeted efficiency is 60 percent based on higher heating value (HHV) (equivalent to 66 percent efficiency based on Lower Heating Value (LHV)), not accounting for the energy required for CO2 capture; near zero emissions of traditional pollutants, including smog and acid rain forming pollutants; no solid or liquid discharges; and carbon dioxide emissions reductions by 40 to 50 percent by efficiency improvements and zero emissions when coupled with carbon sequestration (NRC, 2003).
In the Vision 21 Program, the technologies are compartmentalized into modules and enabling and supporting technologies are distinguished. Twelve technology modules are to be developed (NRC, 2003). One of the primary components is the development of fuel-flexible gasification technology (NRC, 2003). The capital cost of the syngas generation plant, the “gasification island”, is projected to be about 65 percent of the total installed cost of the Vision 21 energy plant (NRC, 2003). Other technology modules include gas purification, gas separation, fuel cells, turbines, environmental control, sensors and controls, materials, computational modeling and virtual simulation, systems analysis and systems integration, synthesis gas conversion to fuels and chemicals, and combustion and high-temperature heat exchange. Figure 3.8 gives a schematic of the DOE Vision 21 plant (NCC, 2003). The gross and net power output of the plant are planned to be 561.3 MW and 520.9 MW respectively (NCC, 2003). Syngas is going to be produced in an oxygen-blown DESTEC gasifier and the gas after cleaning is sent for CO2 capture. The H2 part in the cleaned syngas, along with compressed air, is used to generate electricity in a solid oxide fuel cell while the CO component of the syngas is burnt in a combustion turbine that drives the compressor.
Specifically with respect to coal combustion technology development as part of the Vision 21 Program, there remain considerable uncertainties as to whether 60 percent efficiency could be attained with combustion technologies at a commercially viable plant investment level, nominally $800/Kw (NRC, 2000a). A report published by the National Research Council titled ‘Vision 21: Fossil Fuel Options for the Future’ concluded that perhaps 50 percent efficiency plants based on combustion technologies could be competitive in future as these require lower capital investments than gasification technologies (NRC, 2000a). It is not however certain that advanced coal combustion technologies such as first and second-generation PFBC technologies have lower capital costs as compared to IGCC.
In 2002, Vision 21 projects and activities spent around $50 million, which is almost a quarter of the Fossil Energy’s total R&D budget43. The National Research Council report titled, ‘Vision 21: Review of DOE’s Vision 21 Research and Development Program- Phase I (2003)’, while reviewing the funding of Vision 21 activities, concludes that, funding levels are not adequate for the Vision 21 projects and that there is an imbalance between program requirements and future funding levels (NRC, 2003). For the FY 2003, budget request for gasification is approximately $40 million that is barely enough to fund portions of the Vision 21 component development effort (NCC, 2002). The National Research Council study, ‘Vision 21: Review of DOE’s Vision 21 Research and Development Program- Phase I (2003)’ comments that the
43 Based on data from DOE’s Fossil Energy Budget for Fiscal year 2003;

42
Vision 21 is a very broad and inclusive program that would need to sharpen its focus on the development of cost-competitive, coal-fueled system for electricity production on a large-scale (200-500 MW) (NRC, 2003). This would require using gasification-based technologies that produce sequestration-ready carbon dioxide and near-zero emissions of conventional pollutants. Achieving it in turn would require a very strong component of systems integration and analysis that at present was being handled in a piecemeal manner.
Figure 3.8 Schematic of a Vision 21 Plant
Source: Figure 3.4 in ‘Coal-related Greenhouse Gas Management Issues’, National Coal Council, May 2003, Washington DC.
The National Research Council, 2003 report ‘Vision 21: Review of DOE’s Vision 21
Research and Development Program- Phase I (2003)’ also recommended that Vision 21 should have focus on R&D in areas that are high-risk and have “leapfrog” potential in which private industry investment in R&D is not likely (NRC, 2003). The report suggests that financial incentives in the form of tax incentives, which are better tied to performance than direct subsidies, could be implemented to offset the technical and financial risks associated with the introduction of Vision 21 technologies (NRC, 2003). In setting up public-private partnerships, a consortia arrangement to spread investment risks would allow better dissemination of demonstration project experiences as was demonstrated in the financing of the Coolwater project through a consortium (NCC, 2001). Another example of a successful consortium approach was the Power Systems Development Facility that is jointly developed by DOE, EPRI, and six industrial concerns (NRC, 1995). A 2001 National Research Council report ‘Vision 21: Fossil Fuel Options for the Future’ suggested that Vision 21 goals were very ambitious- the achievements of combined objectives of very high efficiency, near zero emissions, and competitive cost attainment were unprecedented and would require technological breakthroughs (NRC, 2000a). The assessment in this report concludes that commercial deployment of first generation Vision 21 plants is unlikely before 2020 and full commercial deployment is expected only by 2030 (NRC, 2000a).

43
Following-on demonstration activities under the CCT Program, demonstrations for advanced coal based generation technologies, especially IGCC, are likely to continue under the Clean Coal Power Initiative (CCPI) (DOE, 2003d). CCPI was established in the fiscal year 2002 to implement the President’s National Energy Policy recommendations to “fund research in clean coal technology” (DOE, 2003d). It responds to more stringent environmental standards in place, since the enactment of the CAAA, for pollutants such as ozone, particulate matter, and potentially mercury. Like the CCT Program, it is set up as a cost-shared partnership program between the government and the industry to demonstrate advanced coal-based, power generation technologies in order to accelerate their commercial deployment. It is a ten-year initiative tentatively funded at a federal cost share estimated at $2 billion with a matching industry cost share of at least 50 percent (NRC, 2003). Referring back to Table 3.2, funding for CCPI increased from 150 million U.S. dollars in 2002 to close to 180 million in 2004, with a Congressional request for almost $290 million in 2005. The first CCPI solicitation, CCPI-1, was designed to support the President’s proposed Clear Skies Initiative (CSI) through advanced pollution controls and the Global Climate Change Initiative through efficiency improvements for existing plants (DOE, 2003d). Subsequent rounds are scheduled on a two-year cycle. As part of CCPI-1, eight projects valued at more than $1.3 billion, including $317 million in federal cost sharing support, were selected for funding44 (DOE, 2004). Among the projects selected, there are two advanced power demonstration projects with a federal fund contribution of $517 million (DOE, 2004). The second round of solicitations under CCPI-II is likely to lay emphasis on IGCC and carbon sequestration projects. IGCC demonstration projects are going to be continued under CCPI. For this, federal cost share of $2 billion is estimated to be sufficient to provide for 50 percent funding of several full-scale IGCC plants on the road to commercialization (NRC, 2003). At present, DOE is reviewing proposals received under Round 2 solicitation. Among these is the proposal for setting up a 615 MW hybrid gasification system (project valued at $756.2 million with 18.5 percent cost sharing request for DOE) repowering project (DOE, 2004b). This would use a pressurized gasifier to produce syngas from lignite for combustion in a gas turbine combined cycle. The system is to be coupled with an atmospheric pressure circulating fluidized bed boiler to burn unused carbon in the form of char and ash from the gasifier and generate steam for use in a steam turbine, while utilizing the exhaust waste heat from the gas turbine. This technology has the potential to reduce capital costs and increase system reliability. 3.1.5 The FutureGen Project
FutureGen is a research prototype project that is budgeted to spend $10 billion over a period of 10 years with maximum cost sharing by DOE set at 80 percent (Der, 2003). The objective is to set up a 275 MWe facility that produces both electricity and hydrogen (employing advanced IGCC technology) and sequesters one million metric tonnes of carbon dioxide per year (Der, 2003). The integrated demonstration of different components is a key feature of the project. Industry is expected to provide 26 percent of the overall funding (DOE, 2004a). An oxygen-blown transport gasifier (under development at the Power Systems Development Facility (PSDF)) is likely to be demonstrated- it offers potential to reduce capital costs of IGCC by 20 percent from present designs due to its simple design and lower temperature of operation (DOE, 2004a). Other key components include- advanced ion transport membranes (ITM) for large-volume production of oxygen, advanced membranes for hydrogen separation, advanced gas cleanup technology, hydrogen-fueled gas turbines, fuel cell and fuel cell/turbine hybrids, and activities related to carbon sequestration (DOE, 2004a). Advanced crosscutting research in materials and in instrumentation, sensors, and controls is also critical to FutureGen’s success. A number of
44 The two active projects under CCPI are the NeCo Inc. project on Integrated Optimization Software demonstration and the We Energy Toxecon Retrofit project for Mercury and Multi-pollutant Control (DOE, 2004).
3.1.4 Clean Coal Power Initiative (CCPI)

44
technical and programmatic challenges remain to be overcome, with the latter mainly in the form of availability of funds and commitment by different stakeholders. The Clean Coal Technology Roadmap
In order to fulfill both long-term Vision 21 objectives as well as meet the short-term requirements of the existing fleet for cost-effective environmental control technologies to ensure regulatory compliance, a Clean Coal Technology Roadmap has been developed cooperatively by the National Energy Technology Laboratory, the coal and power industry represented by the Coal Utilization Research Council (CURC) and the Electric Power Research Institute (EPRI)45. The roadmap sets the following targets in terms of costs and performance achievements: Table 3.6: New plant performance targets in the Clean Coal Technology Roadmap Reference plant* 2010 2020 Vision 21 Plant efficiency (HHV) 40 percent1 45-50 percent2 50-60 percent3 Availability >80 percent >85 percent >90 percent Plant Capital cost ($/kW)
1000-1300 900-1000 800-900
Cost of electricity (c/kWh)
3.5 3-3.2 <3
98 percent SO2 removal 99 percent SO2 removal >99 percent SO2 removal
0.15 lb/10^6 Btu NOX 0.05 lb/10^6 Btu NOX <0.01 lb/10^6 Btu NOX 0.01 lb/10^6 Btu Particulate matter
0.005 lb/10^6 Btu Particulate matter
0.002 lb/10^6 Btu Particulate matter
Air emissions
90 percent Hg removal 95 percent Hg removal By-product utilization 30 percent 50 percent Near 100 percent * This is a plant that can be built using current state-of-the-art technology and meeting New Source Performance Standards (NSPS). 1 Equivalent to 44 percent efficiency based on LHV. 2 Equivalent to 50-55 percent efficiency based on LHV 3
Equivalent to 55-66 percent efficiency based on LHV Source- http://www.netl.doe.gov/coalpower/ccpi/pubs/CCT-Roadmap.pdf The roadmap does not set specific targets for CO2 emissions reductions- it sets broad carbon management goals with greater than 90 percent removal for CO2 (including sequestration) at less than 10 percent increase in the cost of electricity. 3.2 Technology specific ERD3 activities 3.2.1 Pulverized coal combustion RD&D activities related to PC combustion
Fossil R&D funds have supported activities related to improvements in currently available PC systems through integration with advanced combustion and emissions control technology and state-of-the-art supercritical generators. These activities formed part of the program for development of low emission boiler system (LEBS), the goal for which was set at demonstrating a 42 percent efficient system with emissions one-half to one-third of the NSPS by the year 2000 (NRC, 1995). The LEBS is a highly advanced pulverised coal-fired power plant
45 See Department of Energy (DOE), the Electric Power Research Institute (EPRI), and the Coal Utilization Research Council (CURC). “CURC/EPRI/DOE Consensus Roadmap”

45
that uses supercritical steam conditions and low-level heat recovery to achieve a targeted efficiency level of 42 percent efficiency that is significantly higher than efficiency levels of 33 to 35 percent existing in U.S. plants (NRC, 1995). This efficiency target approaches the limit that can be achieved with a simple Rankine (steam) cycle given materials of construction limitations and the targets were considered to be commensurate with the performance of state-of-the-art pulverized coal technology available. LEBS design features a novel U-fired furnace and moving-bed copper-oxide flue-gas cleanup system (Ruth, 1997). The furnace converts all of the coal ash into a glass-like slag that has a third of the volume of fly ash and is a high value product used as blasting grit and roofing granules. A fabric filter controls particulate matter. Reacting with copper oxide on an alumina sorbent and oxygen to form copper sulfate controls SO2. NOX control is achieved in the U-fired furnace by staged re-burning and by injecting ammonia upstream of the sulfated sorbent. DOE’s Pittsburgh Technology Centre along with three boiler manufactures (ABB Combustion Engineering, Babcock and Wilcox Company, and DB Riley) headed up technology teams, each with a “user” advisory panel comprised of utilities and non-utility generators, to develop LEBS in 1992 (Ruth, 1997). The cost of the LEBS Program, over its eight-year duration, was expected to be $85 million (Ruth, 1997). LEBS development is considered to be an evolutionary step in the development of industry-proven PC generating systems, taking advantage of advanced low NOX combustion and flue gas cleanup technologies, along with materials improvements for boiler tubes, while capitalizing on the experience base of power generators and the existing industry support structure. In 1997, the DB Riley team (now Babcock Borsig power) was selected to construct and operate a 91 MWe LEBS unit in Illinois (Ruth, 1997). In 2000, the Corn Belt Energy Corporation, a member-owned energy co-operative in Illinois committed to building the plant at an Illinois site (DOE, 2001a). The total plant costs are estimated to be $137 million, with cost sharing of $51 million by DOE and some state organizations (DOE, 2001a). The plant is expected to start production sometime during 2004. With respect to market deployment opportunities for LEBS in the United States, a National Research Council study ‘Coal-Energy or the Future’ concluded that market for LEBS in the United States was likely to be small, while the export market demand was likely be high (NRC, 1995). System components are proven and opportunities for cost reductions and performance improvements arose mainly through improved systems design and integration. The report was critical of DOE cost sharing in LEBS development- DOE investment required an assessment of the market potential with industry cost sharing at least 50 percent (NRC, 1995). The study also concluded that the LEBS system did not seem to offer opportunities for development of a substantially more-efficient, lower emission system and its development could be justified only if it attained significantly lower costs with comparable performance as existing systems. Specifically in the area of materials development for supercritical boilers, R&D efforts have been supported by NETL, co-funded by the Ohio Coal Development Office, and managed by Energy Industries of Ohio46. This has been in the area of materials development for construction of coal-fired boilers with advanced steam cycles capable of operating at much higher efficiencies than current state-of-the-art facilities (significant efficiency gains of at least 8 to 10 percent targeted through advanced materials technology application). Private participants included boiler manufacturers such as Alstom Power, Babcock Power, Babcock and Wilcox, and Foster Wheeler47. DOE R&D funding related to advanced pulverized coal power plant averaged
46 See ‘Evaluating Materials Technology for Ultrasupercritical Coal-Fired Plants’ EPRI online journal article posted on January 15, 2003 47 See ‘Evaluating Materials Technology for Ultrasupercritical Coal-Fired Plants’ EPRI online journal article posted on January 15, 2003

46
around 10 million dollars (in 2004 prices) between 1992 and 199748. In 1998, funding increased to around 17 million dollars and remained at that level before dropping to 2 million dollars in 2000. With completion of LEBS activities, from 2000 onwards, there has been no R&D funding for advanced PC related activities. It should be noted that activities funded under the ‘Combustion Systems’ head in 2003 and 2004 include hybrid combustion, gas stream cleanup and support for Vision 21 activities49 are not related to PC combustion.
In the area of ultra-supercritical (USC) development, EPRI is taking the lead in technology advancements- materials development aimed at steam temperatures in excess of 1300 degrees F and enabling further efficiency gains of up to 50 percent (LHV). This program is being undertaken by NETL, with the Ohio Coal Development Office, and with U.S. boiler manufacturers as participants and major contractors50. The SOAPP (state-of-the-Art power plant) design developed by Electric Power Research Institute (EPRI), Sergeant & Lundy and SEPRIL Services, has a design cycle efficiency of ~44 percent (LHV), based on turbine inlet steam conditions of 4500 psig and 1100°F (IEA, 1998). A National Research Council Study titled ‘Vision 21: Fossil Fuel Options for the Future’ forecasts 2015 as the likely time for deployment of this technology (NRC, 2000a). U.S. experiences in deployment of PC systems
Central generating units based on the Rankine cycle were first introduced in the United States around the turn of the 20th century and have since been the primary basis for electricity generation in the United States (Joskow and Rose, 1985). Most U.S. coal plants operate under subcritical conditions, which give lower efficiency (36 to 37 percent based on LHV) (NRC, 1995). Supercritical (SC) plants have a long history in the United States and there are more than 170 supercritical units operating (EPRI, 2002). These have three-percentage point higher efficiency than subcritical PC plants, without increased outages, over subcritical units. The first supercritical unit began service in 1957 at the Philo Plant of the Ohio Power Company (part of the of the American Gas and Electric System) with steam pressure of 4500 psi and steam temperature of 1150 degrees F (Hirsh, 1989). It established a record of the most thermally efficient unit of its time, designed to produce power at an efficiency of just over 40 percent. A subsequent unit installed in 1960 had a steam pressure of 5000 psi and steam temperature of 1200 degrees F (Hirsh, 1989). Despite all these early experiments with very high pressure and temperature steam in supercritical units, almost all supercritical units installed since 1960 have had steam conditions close to 3500 psi/1005 degrees F (Joskow and Rose, 1985). Some early supercritical units still continue to operate satisfactorily (NRC, 1995). The original Eddystone Unit 1 with the most advanced steam parameters of 4800 psi/1150 °F was constructed in1960 and is still in operation (NCC, 2003). This plant has significantly better efficiency than any plant of that era. The design efficiency of this plant was 43 percent (LHV) based on the original steam conditions and 41 percent (LHV) based on the plant’s re-rated conditions (NCC, 2003).
U.S. experiences with supercritical technology installed during the sixties and the seventies was generally unfavorable because of a lack of operator experience and reliability and maintenance problems (NRC, 1995). While the technology accounted for almost 60 percent of the new capacity by the mid seventies, it was almost abandoned in the mid-eighties (the installation
48 Data for assessment of trends in DOE’s R&D funding related to pulverized coal are drawn from DOE’s Congressional Budget, Fossil Energy, Statistical Table by Appropriation- FY 1994 to FY 2004; See Footnote 29 for source details. 49 R&D funding support for Vision 21 activities related to combustion systems have been discontinued from 2004. Advanced combustion systems, except perhaps oxygen based combustion, are unlikely to achieve the goals of a Vision 21 system (NRC, 2003). 50 See ‘Evaluating Materials Technology for Ultrasupercritical Coal-Fired Plants’ EPRI online journal article posted on January 15, 2003

47
rate for supercritical technology in the early eighties dropped to just 6 percent) (Joskow and Rose, 1985). Poor reliability along with high maintenance and replacement power costs made the overall economics of this technology unattractive (Joskow and Rose, 1985). Reliability problems and unexpectedly high maintenance costs for supercritical units during the seventies reduced or eliminated the expected savings from this technology (Rose and Joskow, 1990). However, early problems in first and second-generation supercritical boilers and steam turbines have been overcome (IEA, 1998). Experience over the past decade shows that the reliability and availability of the supercritical cycle, after more than two decades of research and development, can match or better the subcritical cycle for base load operation throughout the life of the unit (IEA, 1998). Studies on the relative reliability of coal-fired conventional PF and SCPF plants in the United States show that the conventional units have, in the past, had better reliability during the first ten years of operation (IEA, 1998). By the time a SCPF unit was ten years old, the average outage hours caused by the pressure parts had leveled off at less than 500 hours/year (approximately 6 percent/year unavailability) for all U.S. units, while for subcritical units the level was the same but climbing (IEA, 1998).
A third of the SC units are in the United States (NCC, 2002). No SC unit has been built in the United States since 1991, though a large number of plants are being built in Europe and Japan (NCC, 2002). One SC unit in the United States is being planned in the Midwest. We Power, which is a non-utility subsidiary of Wisconsin Energy, is planning to build future SCPC units- two 615 MW units are being planned at Oak Creek that are likely to be commercial by 2008-09 (Derenne, 2003). For the near-term (prior to 2007), supercritical and advanced supercritical cycles with steam conditions up to 4500 psi and temperatures up to 1100 degrees F have potential to have a significant share in power generation (NCC, 2002). New plants being added in the next five to ten years are very likely to utilize conventional subcritical and supercritical technology, but none of plants are likely to operate at steam conditions beyond 3750 psi/1000 degrees F/1100 degrees F (NCC, 2002). However, European power plants are being installed with advanced steam conditions. The reason for this is primarily relatively low fuel costs in the United States, as compared to other countries of Europe and Japan where supercritical technology is being built, makes economic justification for higher capital investments for higher efficiency plants difficult (NCC, 2002). 3.2.2 Fluidized bed combustion (FBC) RD&D activities related to AFBC
DOE has played a critical role in the evolution of FBC technology development (NRC, 2000). DOE involvement can be traced back to technology development, during the mid to late 1960s, by the Department of Interior’s Office of Coal Research (NRC, 2000). The objective was to develop a compact coal-boiler that could be pre-assembled at the factory and shipped to a plant site at a cost lower than conventional technology (NRC, 2000). During the mid sixties, the Government recognized that a fluidized bed boiler not only represented a potentially lower cost, more efficient way to burn coal, but also a much cleaner technology. A 500 kW fluidized bed test plant, built in Virginia in 1965, can be called the “grandfather” of U.S. fluidized bed combustors (Banales-Lopez and Norberg-Bohm, 2002). During the seventies, focus shifted to developing the technology as a substitute for oil-fired industrial boilers with objectives to improve efficiency and environmental performance. The first commercially successful fluidized bed was an industrial size atmospheric unit (equivalent to a 10 MW combustor) built with federal funds on the campus of Georgetown University in 1979 that continues to operate today (Banales-Lopez and Norberg-Bohm, 2002). The technology progressed to larger scale utility applications due, in large part, to Federal partnership programs with industry. During the early eighties, development for power generation applications started with support from DOE, EPRI, and the private sector (NRC, 1995). The technology development has been pushed primarily by independent power producers,

48
rather than by investor-owned utilities. During 1980 and 1987, 20 MW Bubbling bed AFBC was constructed and operated by TVA and EPRI (NRC, 1995). By the end of the eighties, the technology was commercial for industrial steam generation, cogeneration, and utility-scale applications (NRC, 1995). The eighties saw a focus on AFBC demonstrations and development of PFBC systems- both these categories of FBC technologies have been demonstrated under the CCT Program. R&D funding for AFBC development ended during the early nineties. AFBC demonstration projects
The Nucla ACFB repowering project, set up at Nucla-Montrose County-Colorado, was the first ACFB demonstration project under DOE’s Clean Coal Technology Program during 1988 to 1991 (see Table 3.5 under CCT program section) (DOE, 2001). This 100 MW capacity repowering project provided the database and operating experience requisite to making ACFB a commercial technology option at utility scale. Its objective was to demonstrate ACFB at the utility-scale and the plant capacity at that time was 40 percent larger than any ACFB unit51. This project represents the first repowering of a U.S. utility plant with ACFB technology and continues to operate commercially. Though the project operated with an average capacity factor of only 40 percent during the demonstration period and with an average availability of less than 60 percent, most of the technical problems were overcome during demonstration (DOE, 2001). The average availability was improved to 97 percent and the capacity factor to 66.5 percent during the last three months of its demonstration (DOE, 2001). In terms of environmental performance, the unit removed 95 percent SO2 and NOX emissions were low at 0.18 lb/106 BTU (DOE, 2001).
The next demonstration of ACFB under DOE’s CCT Program is the 297.5 MWe Jacksonville Electric Authority (JEA) project that started in 2001 (see Table 3.5) (DOE, 2001). This project’s objective is to demonstrate operating and environmental performance (to achieve greater than 90 percent SO2 removal and to reduce NOX emissions by 60 percent as compared to conventional technology) of ACFB at a scaled up unit size as compared to previously constructed facilities (DOE, 2001). During operation, the plant achieved a heat rate of approximately 34 percent (HHV) (equivalent to 37.5 percent efficiency based on LHV) and attained expected environmental performance (DOE, 2001). The fuel has been switched from its design of eastern bituminous coal to an 80/20 blend of petcoke and coal (DOE, 2001). A second 300 MW repowering unit at Jacksonville was commissioned three months after the commissioning of the 297.5 MW unit, that is completely privately financed (Goidich, 2001). This second unit has the distinction of being the largest ACFB in the world, as well as one of the cleanest (DOE, 2001). Performance data from these units is likely to provide benchmarks against which utility, independent power, and financial industries can assess large-scale application of CFB technology. A third next-generation ACFB demonstration project is ongoing at Colorado Springs Utilities to demonstrate a 150 MW advanced low-emission CFB combustion system that is expected to achieve 96–98 percent sulfur removal, while reducing limestone consumption to less than half of conventional CFB systems, and employ advanced selective non-catalytic reduction (SNCR) technology for NOX removal (DOE, 2001). The system also features an integrated trace metal control system that can remove up to 90 percent of mercury, lead, and other metals, as well as virtually all-acid gases in the flue gas (DOE, 2001). The plant is designed to use a suit of fuels including Powder River Basin sub-bituminous, Illinois and Pittsburgh eastern bituminous, waste coal and biomass/ wood waste while achieving high levels of emissions control (DOE, 2001).
51 See Darling Scott L. ‘Foster Wheeler’s Compact CFB; Current Status’. Foster Wheeler Energy International, Clinton, NJ, U.S.A. Publications at http://www.fwc.com/publications/tech_papers/powgen/compact.cfm

49
Deployment experiences with AFBC By the end eighties, AFBC was commercial for industrial steam generation, cogeneration,
and utility-scale applications in the United States. Among the 293 bubbling bed and 276 circulating bed units operating worldwide by mid-1993, almost 35 percent of the units were estimated to have been sold in the United States (NRC, 1995). AFBC capacity represented around 3.7 percent of the total cumulative non-utility operational capacity at the end of 1999 (Banales-Lopez and Norberg-Bohm, 2002). AFBC has been adopted mainly by independent power producers and co-generators qualified under Public Utilities Regulatory Policy Act (PURPA). PURPA primarily provided the spur for the development and diffusion of CFBC in the non-utility market as most of the AFBC units qualified among one of the three categories for non-utility generators (Banales-Lopez and Norberg-Bohm, 2002). Among the bubbling and the circulating types, EPRI estimates that 75 percent of the U.S. capacity is CFBC (NRC, 1995). At present, there are more than 170 fluidized-bed combustion boilers of varying capacities operating in the United States, primarily using low cost fuel and wastes as feedstock for smaller-scale operations, and every major U.S. boiler manufacturer offers an ACFB in its product line (NRC, 2000). CFBC is used for conversion and utilization of the abundant resources of waste coal scattered across the northeastern part of the United States (Hooper, 2003). The first CFB plant set up was by WMPI- the Gilberton Plant, which started operation in 1988, with a net capacity of 80 MW (Hooper, 2003). The plant successfully operated on culm and gob (with an ash content of 40-50 percent after beneficiation), which paved the way for setting up of similar plants (Hooper, 2003). AFBC systems in the size range of 250 to 400 MW are the most preferred for dispatch and availability reasons (NRC, 2000). In the utility market, the penetration of AFBC units has been almost negligible and there have been six AFBC units commissioned by utilities in the United States with an aggregate capacity of 600 MW (Banales-Lopez and Norberg-Bohm, 2002). The very low level of AFBC penetration among utilities is partly explained by difficulties in scaling up the technology. With respect to AFBC cost competitiveness with respect to PC boilers, AFBC is more competitive when low grade or high sulfur fuel was available. AFBC in general has a higher capital cost than PC boilers, which is offset by lower operating costs using low-grade fuel. Therefore this technology has been adopted widely by non-utilities, but higher capital costs relative to PC hinder technology adoption by utilities. Even though early operational problems with AFBC have been overcome and large-scale utility size demonstrations have been successful, it remains an inherently more risky technology in the minds of utilities as compared to the much more widely deployed and proven PC technology. RD&D activities related to PFBC
The development of PFBC systems in the United States started during the eighties, the primary drivers for its development cited as energy security and environmental concerns (NRC, 2000). Though funding support for AFBC development ended during the early nineties, PFBC development continues to be supported under the recently initiated clean Coal Power Initiative (CCPI). DOE’s R&D funding for PFBC development has ranged 20 to 30 million dollars from 1992 to 1998, after which the funding levels dropped (Table 3.2). Funds tied to PFBC development continued till 2001, at an approximate level of 10 million dollars (in 2004 prices)52. From 2002 onwards, R&D funds under ‘Combustion systems’ are being directed primarily towards gas stream cleanup and hybrid combustion activities along with some support for Vision 21 systems. Table 3.4 gives DOE’s targets for PFBC systems.
52 Data for assessment of trends in DOE’s R&D funding related to PFBC systems are drawn from DOE’s Congressional Budget, Fossil Energy, Statistical Table by Appropriation- FY 1994 to FY 2004; See Footnote 29 for source details

50
Table 3.7 DOE’s Program Goals for PFBC systems PFBC
Technology Goals First-generation Second-generation Improved second-generation
Net efficiency, percent 40 45 Greater than or equal to 50
Emissions, as fraction of NSPS S02 NOx Particulates
1/4 1/3
Not specified
1/5 1/5
Not specified
1/10 1/10
Not specified Air Toxics emissions relative to 1990 CAAA
Meet
Meet
Meet
Solid wastes Not specified Not specified Not specified Capital cost, $/kW* 1300 1100 1000 Electricity cost compared to current PC
10 percent lower 20 percent lower 25 percent lower
Commercial completion milestones
Commercial scale demonstrations- mid 1990s
Commercial scale demonstration- 2000
Commercial scale demonstration- 2007
Development status 70 to 80 MW demonstration projects ongoing
Systems development, integration, and testing ongoing
Development initiated
*Costs are in 1993 dollars Source: Table 7.2 in ‘Coal- Energy for the Future’, National Research Council, 1995. Developmental work related to PFBC has focused on developing second-generation systems for electric power generation with significant performance improvements (Table 3.4). Critics point to the fact that while performance targets set for PFBC development appeared to reasonable, capital cost targets for all generations of PFBC appeared to be optimistic (NRC, 1995). Testing for a fully integrated second-generation PFBC system at the 8 MW level has been conducted at the Power Systems Development Facility in Wilsonville, Alabama, sponsored by DOE, Southern Company Services, and EPRI (NRC, 1995). Its objective was to evaluate integration of all components, with emphasis on integration of hot gas cleanup ceramic filters and gas turbines. The PFBC Program was initiated by DOE to support private industry efforts in PFBC development, in order to meet national security and environmental objectives (NRC, 2000). A National Research Council study, ‘Energy Research at DOE- was it worth it?’ assessed that the PFBC program might have been supported by the DOE for too long (NRC, 2000). The study concluded that research over the last several years did yield valuable knowledge benefits but probably would not have realized economic benefits, even if research goals were met. Therefore the PFBC program would have benefited from a critical peer review before significant expenditures were made on full-scale demonstrations. First-generation PFBC technologies have limited market potential in the United States, but could offer significant export potential (NRC, 2000). DOE investment in first-generation systems therefore needs to be viewed solely as an entry towards development of more advanced second-generation PFBC systems (NRC, 2000). On the other hand, second-generation PFBC systems have much greater potential to meet future domestic power requirements and address environmental concerns as compared to first-generation PFBC systems (NRC, 2000). Second-generation systems require development of critical components such as hot gas cleanup systems for high-temperature and high-pressure particulate removal, advanced gas turbines, and address system integration and reliability requirements (IEA, 1998). The present

51
program performance goals with respect to advanced combustion system development is- by 2010, develop “hybrid” power systems that would integrate a coal gasifier with an advanced coal combustor to achieve thermal efficiencies above 50 percent at a capital cost of $1000 per kW or less; and by 2015, develop an advanced “hybrid” as a candidate core technology for the Vision 21 power plant53 . Hybrids could potentially combine a coal gasifier and a combustor arranged in a “topping cycle” that could result in lower-cost capital equipment, high performance fuel use, and improved environmental performance. The combination may be particularly suited for smaller power stations in the 200-300 MW range. The integrated system has potential to exceed 55 percent efficiency. DOE’s Office of Fossil Energy has set a goal of developing initial concepts for “hybrid” gasifier-combustor power systems by 2010, with more advanced versions ready for large-scale testing by 2015. This could then make “hybrid” technology a potential candidate for meeting Vision 21 objectives. PFBC demonstration projects
The Tidd PFBC demonstration project, with a net plant capacity of 70 MW, was the first large-scale operational demonstration of a first-generation PFBC in the United States funded under the CCT Program (Table 3.5) (DOE, 2001). It represented a 13:1 scale-up from the pilot facility (DOE, 2001). The project was started in 1992 and underwent demonstrations for five years. The plant achieved relatively low efficiency of 33.2 percent based on HHV (equivalent to 36.7 percent based on LHV), primarily on account of the small unit size and no attempt being made to optimize heat recovery (DOE, 2001). Therefore Tidd’s efficiency performance is not likely to be representative of what a larger scale plant using Tidd’s technology could attain. Successful demonstration of this project laid the foundation for further technology commercialization efforts in countries such as Sweden, Spain, and Japan (DOE, 2003e). Two other PFBC demonstration projects, McIntosh Unit 4A and 4B PCFB Demonstration Projects, funded under DOE’s CCT Program, have been terminated (DOE, 2001). The 4A demonstration of a combined cycle PCFB system was designed to handle a wide range of coals, including high sulfur coal, and had potential to compete with pressurized bubbling-bed fluidized-bed system. The project would have included first commercial application of hot gas particulate cleanup and would have been one of the first to use a non-ruggedized gas turbine in a pressurized fluidized-bed application (DOE, 2001). The 137 MW net capacity plant was to use Foster Wheeler’s PCFB technology integrated with Siemens Westinghouse’s hot gas particulate filter system (HGPFS) and power generation technologies (DOE, 2001). DOE provided half of the total project funding of almost $187 million with the other half provided by Lakeland Electric (DOE, 2001). Technical and economic issues related to the project could not be resolved that led to its termination (DOE, 2001). The 4B project, which was to follow on the 4A project, was also terminated. It involved a 103 MW net capacity addition to the 4A project that had an objective to demonstrate topped PCFB technology in a commercial setting and operation of gas turbine at higher inlet temperature in order to achieve cycle efficiencies in excess of 45 percent (DOE, 2001; DOE, 2003d). 3.2.3 Integrated Gasification Combined Cycle (IGCC) RD&D activities related to IGCC
DOE’s participation in gasification related R&D and demonstration activities fall into three categories- CCT programs, development programs and advanced research programs related to gasification. The CCT Programs involved gasification for power generation while the other two falls within the scope of the coal R&D program in DOE’s Office of Fossil Energy. DOE’s involvement in the development of IGCC system started almost two decades back (NRC, 1995).
53 Information on ‘hybrid’ systems has been drawn from U.S. D.O.E. Office of Fossil Energy, ‘Advanced Combustion Technologies’, at ; updated on August 11, 2004.

52
It evolved as an outgrowth of gasification related RD&D efforts that began during the seventies that led to setting up of Synfuel Corporation (NRC, 1995). The activities were driven by objectives to address national security with an upsurge in oil prices. Even after the dismantling of the Synfuel Corporation, R&D funding for gasification related efforts have continued and have steadily increased as these primarily represent a long-term investment in coal-fueled energy options (NRC, 1995). The R&D funding for IGCC did not vary much between 1992 and 1998, ranging from 20 to 30 million dollars (Figure 3.9)54. Later years saw funding increase related to IGCC activities and in 2004 there was a substantial funding increase to close to 50 million dollars. Since 1992 to 2004, DOE’s cumulative investment in gasification related R&D activities have approximated close to 400 million U.S. dollars (in 2004 prices). Figure 3.9 FE R&D funding for high efficiency IGCC (in millions of constant 2004 U.S.$)
Source: Data drawn from DOE’s Congressional Budget Tables for FY 1994 to FY 2004; See Footnote 29 for details of the sources. Gasification related activities are a very important component for achieving Vision 21 objectives- it incorporates development of advanced power generation systems for commercial application beyond 2015 (NRC, 2003). Since 2000, close to 30 to 40 percent of the total gasification R&D funding has been directed specifically towards Vision 21 activities (see Figure 3.4). The high efficiency IGCC budgetary category however does not include funds directed towards advanced turbine development, which forms an integral part of gasification systems development efforts. The National Research Council study, ‘Coal- Energy for the Future’, summarized DOE’s program goals for IGCC systems (NRC, 1995) (Table 3.8). Commenting on DOE’s targets, development status and likely future potential for IGCC systems, the study concluded that the market potential for first-generation IGCC, with target efficiencies in the range of 40 to 42 percent, was likely to have limited domestic market. However first-generation IGCC could offer significant export opportunities. Advanced second-generation systems with target efficiency of 45 percent are likely to have greater domestic potential (NRC, 1995). Development of second-generation systems is critically dependent on development of components such as high-temperature gas turbine, high-temperature and high-pressure particulate removal system, and hot
54 Data for assessment of trends in DOE’s R&D funding related to PFBC systems are drawn from DOE’s Congressional Budget, Fossil Energy, Statistical Table by Appropriation- FY 1994 to FY 2004; See Footnote 29 for source details
0
10
20
30
40
50
60
1993 1994 1995 1996 1997 1998 1999 2000 2001 2002 2003 2004 2005(BR)

53
gas desulfurization technology (for these components the durability and reliability was much lower than what would be necessary for commercial deployment) (NCC, 2002). The report, ‘Coal- Energy for the Future’, also observed that achieving DOE’s efficiency targets of 55 percent for IGCC in later years seemed to be quite optimistic- achieving this target would require substantial reductions in gasification related losses (NRC, 1995). Table 3.8 DOE’s Program Goals for Integrated Gasification-Based Systems
IGCC Technology Goals Second-generation
IGCCa Integrated Gasification Advanced Cycle
Integrated Gasification Fuel Cell
Net efficiency, percent 45 (by 2000) Greater than or equal to 50 (by 2010)
Greater than or equal to 60 (by 2010)
Emissions, as fraction of NSPS S02 NOx Particulates
1/10 1/10
Not specified
1/10 1/10
Not specified
1/10 1/10
Not specified Air Toxics emissions relative to 1990 CAAA
Meet
Meet
Meet
Solid wastes Not specified Not specified Not specified Capital cost, $/kW* 1200 1050 1100 Electricity cost compared to current PC
20 percent lower 25 percent lower 20 percent lower
Commercial completion milestones
Demonstration 2001 Demonstration 2004 Coal demonstration 2000
Development status Under development Development initiated Current activities focusing on natural gas-fired systems
a First-generation IGCC power systems are at the commercialization stage and have been demonstrated in the CCT Program *Costs are in 1993 dollars Source: Table 7.4 in ‘Coal- Energy for the Future’, National Research Council, 1995. IGCC demonstration projects
A large part DOE’s gasification related efforts have been directed towards technology demonstration activities. Industry’s investment over the same period has also been substantial. The first IGCC demonstration project, the Coolwater project during the eighties, took place without direct DOE sponsorship. It was a joint effort of Texaco-Southern California Edison (Edison International)-General Electric-Central Research Institute of Electric Power Industry (Japan)-EPRI (NRC, 2000). This project initiated DOE to support IGCC development during the CCT Program. A 100 MW IGCC plant was set up at Southern California Edison’s Cool Water Station in Daggert from 1984 to 1989 using the Texaco entrained-flow gasification process (NRC, 1995). Low natural gas prices and over-capacity made it uneconomical to continue plant operations and in 1990 the plant was sold to Texaco (NRC, 2000). The capital costs for this first IGCC plant was relatively high at $2600/Kw (NRC, 2000). The plant operations laid the groundwork, with the advent of new gas turbines, for scale-up demonstrations during the nineties. The Louisiana Gasification Technology Incorporated (LGTI) plant, located within the Dow Chemical Complex in Plaquemine, Louisiana, was selected by the U.S. Synthetic Fuels Corporation in 1987 to demonstrate the E-Gas (formerly Destec) coal gasification process (DOE,

54
2002). It operated from 1987 to 1995, and at full capacity produced 30,000 MMBtu of equivalent syngas per day (DOE, 2002). The success of this operation led DOE to sponsor the Wabash River Repowering demonstration project that utilizes the same E-GAS system.
Among IGCC demonstration projects under DOE’s CCT Program, two IGCC plants at present continue commercial operations after successfully completing demonstrations. These are the Polk Power station and the Wabash river plant); one project was unsuccessfully terminated (Pinon-Pine IGCC project) and the fourth (Kentucky Pioneer Energy IGCC project) is under construction (Table 3.5) (DOE, 2003b). During the nineties, around 600 million dollars was committed for the demonstration of IGCC technologies as part of the CCT Program- for these projects, while DOE had a 50 percent share in capital installation costs, its contribution towards incremental operating costs at the plant sites remains unclear (NRC, 2000). Tampa Electric Company’s Polk Power station is a green field plant that uses Texaco’s oxygen-blown entrained-flow gasifier with a design efficiency of 38 percent, while Cinergy/PSI Energy’s Wabash River Station is a repowering project at an existing site that uses Global Energy E-Gas (formerly Destec) oxygen-blown entrained flow gasifier with a design efficiency of 40 percent (DOE, 2001). The Polk power plant, which is the first green-field IGCC unit in commercial service, started demonstrations in 1996 that went on for five years (DOE, 2003d). The plant has been operating commercially since September 2001 and has recorded a performance level of 38.4 percent efficiency (based on LHV) (DOE, 2003d). Pressure to sustain commercial operations has led it to operation on a blend of equal amounts of coal and petcoke as fuel, the price of which is about a third of coal price and about a fifth of the price of natural gas- this often results in its qualification as the lowest cost dispatch unit (McDaniel and Hornick, 2003). Plant performance and reliability have significantly improved over its operating years- the plant had an on stream factor of almost 80 percent in its fourth operating year, a significant improvement over previous years (DOE, 2003d). Coal gasification component performs with high reliability, but operational problems remain, primarily with gas turbine operations and those associated with catalyst contamination and replacement (McDaniel and Hornick, 2003). Demonstration experiences from this project have led to setting up of a number of projects in Europe (DOE, 2003d).
Global Energy’s Wabash rive plant in Indiana is a re-powered IGCC unit in commercial service, and is the world’s largest single-train gasifier (DOE, 2001). This project re-powered a 90 MW vintage PC plant of the fifties with a 33 percent operating efficiency. Conoco Philips, the largest refiner in the United States, manages the project (NCC, 2003). The 262-MWe plant began operation in November 1995, completed demonstration operations in December 1999, and now operates in commercial service (DOE, 2003d). Like the Tampa plant, the Wabash plant uses petcoke as fuel to sustain commercial operations by generating low cost power (DOE, 2001). The second-stage of the gasifier has introduced a feed system for handling low-cost waste solids, but implementation remains uncertain due to lack of funds. Significant performance improvements were achieved over operating years- plant availability was a high 92.5 percent during 2000 with power block availability at 95 percent (NCC, 2001). The gasification part of the plant has not caused any downtime. Performance has been at the 40.2 percent efficiency level (based on LHV) (NCC, 2001). Repowering with IGCC led to significant performance improvements over previous PC plant- SO2 emissions reduced by almost 97 percent from 38.2 lb/MWh to 1.07 lb/MWh; NOX emissions reduced by almost 92 percent from 9.3 to 0.75 lb/MWh; emissions of Volatile Organic Compounds (VOCs) reduced by almost 90 percent from 0.85 to 0.09 lb/MWh; and CO2 emissions reduced by 14 percent from 0.64 to 0.55 lb/MWh due to efficiency increases (NCC, 2002).
The Sierra Pacific Power Company’s 99-MWe Piñon Pine IGCC Power Project using the KRW air-blown pressurized fluidized bed gasifier started operations in January 1998 (DOE, 2003d). The system achieved steady-state gasifier operation for short periods, but experienced difficulty with sustained operations, due to which it had to be terminated, end of 2000 (DOE, 2003d). The combined-cycle unit of the plant, however, continues commercial service. The fourth

55
IGCC demonstration project under DOE’s CCT Program is the 400 MW Kentucky Pioneer Energy IGCC project being built by Global Energy- it offers a setup for testing fuel cell operation on syngas from the coal gasifier (DOE, 2003d). Plant operations are likely to provide a database for designing an integrated gasification fuel cell (IGFC) system (DOE, 2003d). The gasifier design is based on success of the BGL process at the Schwarz Pumpe GmbH plant in Germany (NCC, 2001). The fuel cell portion of this project has been relocated to the Wabash IGCC site in order to advance schedules for IGFC operation. Since the CCT Program ended, demonstrations of improved IGCC technologies are going to continue under the CCPI program (NRC, 2003). Under this, specific cost and performance targets have been set for development of improved IGCC plants- improved gasifier performance at greater than 95 percent availability and greater than 82 percent cold gas efficiency; fuel flexibility up to 10 percent for large units and 30 percent for small units; use of fuel other than coal such as biomass, waste products, etc.; gasifier cost target of $150/kW (includes syngas cooling and auxiliary but not air separation) and syngas cost target of $2.50/MMBtu (at a coal cost of $1.25/MMBtu); improved feed system to operate at up to 70 atmospheres; and novel gasifier concepts that do not require oxygen but utilize instead internal sources of heat, e.g., residual heat produced by a high-temperature fuel cell (NRC, 2003). Future IGCC plants are being planned on heavy-oil and coke as fuel (costs of these plants would far exceed Vision 21 program goals of $800/kW) (NCC, 2002). Operations of these plants would enable testing of several subsystems such as syngas purification, solids feeding, and syngas combustion at full commercial scale, which is important for realizing Vision 21 objectives (NCC, 2002). Among the plants being planned for the future, We Power, which is a non-utility subsidiary of Wisconsin Energy, is planning to build future IGCC generating units (Derenne, 2003). It is planning to build a 600 MW two-train IGCC unit at Oak Creek at an estimated cost of $1739/kW (2003$) that is likely to be commercial by 2011 (Derenne, 2003). The plant plans to use Chevron-Texaco gasification technology and bituminous coal as feedstock. Prospects for integrating chemical plant operations along with combined cycle operations, while setting up combined power and chemicals manufacturing project (polygeneration) using gasification technology, are hindered by existing reliability concerns. The National Research Council study ‘Coal- Energy for the Future’, recommended that second and third generation gasification systems be given the highest priority for future new plant applications (NRC, 1995). Future IGCC projects are likely to demonstrate 45 percent efficiency (based on LHV) (NCC, 2003). Fuel cells powered by coal-derived synthesis gas can increase efficiency of gasification technology to greater than 70 percent if equipped with a gas turbine bottoming cycle (NCC, 2000). Advanced materials need to be developed for the bottoming cycle of an IGCC system to achieve DOE’s Vision 21 goal of 60 percent efficiency (based on HHV) (equivalent to 66 percent efficiency based on LHV) for coal-plants by 2015 (NCC, 2000). Activities under the systems analysis component for IGCC development have been found to be inadequate for developing competitive IGCC plants for the future with potential to meet Vision 21 objectives (NRC, 2003). A National Research Council study report, ‘Vision 21: Review of DOE’s Vision 21 Research and Development Program- Phase I’, recommended a more prominent role for systems analysis in the development of RD3 strategies. 3.3 Factors influencing deployment opportunities for advanced coal based generating technologies in the United States Factors affecting market potential for new plants
One of the factors strongly influencing market potential for setting up advanced coal generating units is alterations in the structure of the electricity industry in the United States. The electricity industry was heavily regulated during the time the CCT Program was initiated. More recent industry regulations, beginning in 1997, are likely to significantly affect commercial deployment opportunities for advanced coal technologies. Increased competition in the

56
deregulated electricity market discourages electricity suppliers from entering into long-term power purchase agreements (PPAs). Absence of PPAs impose greater financial risks on merchant facilities, which in turn would discourage them from undertaking capital intensive projects, characteristic of PFBC and IGCC technologies55. The high costs and financing requirements for advanced technologies as compared to conventional coal technologies hinders utility investments. Incentives are stronger for undertaking life-extension and performance improvement activities in existing plants rather than building additional capacity (IEA, 1998). Deregulation also favors modest capacity installations that can be easily installed- this imposes barriers in setting up capital intensive, relatively complex, large capacity plants. Siting of coal-fired power plants is proving to be difficult, as independent power producers have already exploited most of the desirable sites for coal-fired power plants (e.g. those close to a large industrial user) (Papay et.al, 1997). There remain significant reliability, availability, and maintainability concerns associated with technologies such as PFBC and IGCC, especially with respect to development of critical components such as hot gas cleanup systems, ceramic membranes, and turbine performances. These technologies also have significantly higher O&M costs as compared to conventional coal technologies. Higher first-of-a-kind and technology risk factors that accompany not-yet mature technologies pose financing difficulties56. In the development of technologies such as IGCC, there is a long-term potential to decrease costs through developments in new technologies such as ceramic membranes that could decrease oxygen production costs (Papay et.al, 1997). It is possible to lower capital cost through system optimization, i.e. being less conservative in redundant systems while maintaining high reliability (Papay et.al, 1997). This is likely to be mainly derived from learning experiences and may be difficult to achieve unless a number of plants are built. There are also further economies to be realized in a more expanded system that includes fuel production, delivery, combustion, and electricity transmission.
Future market deployment opportunities are also significantly influenced by the nature of future load forecast- base, intermediate, or peak. Forecast studies show that the growth-rate in base load capacity requirements in the United States is likely to be low (Tell Us, 2001). Most of this requirement in base capacity, over the next ten to fifteen years, could possibly be absorbed by measures such as capacity factor increase of existing plants, decreasing reserve margins, and by life extension of existing capacity57. The market for smaller capacity plants is likely to grow more rapidly in the future for which technologies such as fluidized bed combustion boilers, especially circulating fluidized bed boilers (CFBs), could be particularly useful- this is particularly relevant where low-grade fuels and alternate fuels (such as pet coke and biomass) are economically available58. This smaller-size market is also where competition between coal and natural gas will be the greatest. Technologies such as PFBC and IGCC, burning coal, could be the “swing” choices over natural gas based technologies for intermediate size power generating stations59. Regulatory barriers in advancements of generating stations
Coal power plant efficiencies in the United States have not improved in more than three decades (Tell Us, 2001). The addition of power consuming emission control technologies and evaporative cooling towers have more than offset any technical improvements in combustion
55 Mudd Michael J. 1997. ‘A Utility Perspective on the Deployment of CCTs Into the Next Millennium’ AEP Energy Services, Paper presented at Clean Coal Technology Conference, National Energy Technology Laboratory. http://www.netl.doe.gov/publications/proceedings/97/97cct/cct_pdf/97CCP4_1.PDF 56 See footnote 56. 57 See footnote 56. 58 See footnote 56. 59 See footnote 56.

57
efficiency, with a result that carbon emissions rate from these plants have slightly increased (Tell Us, 2001). Additionally, EPA’s enforcement of its New Source Review (NSR) rules is likely to have imposed barriers to availability and efficiency improvements at existing sources (NCC, 2001)60. The previous NSR rules were revised under the Bush administration in 2002 and Clear Skies Act was enacted61 (Tell Us, 2001). This has opened up possibilities of repowering and retrofitting existing coal-fired power plants with advanced technologies. Utilities’ perceptions of uncertainties associated with future environmental regulations along with difficulties in compliance planning often make them postpone new investment capacity decisions (NCC, 2002). Significant uncertainties remain with respect to future regulations on CO2 emissions and capture (NCC, 2002). Regulations on CO2 are likely to be a primary driver for efficiency increases using advanced technologies such as IGCC and pressurized fluidized bed as compared to currently deployed conventional PC and CFBC technologies. As discussed earlier, IGCC offers the added advantage of easy CO2 capture and separation for sequestration. Fuel mix, quality and relative fuel prices
One of the factors significantly affecting plant performance and thereby deployment opportunities for advanced coal-conversion are variations in fuel quality (IEA, 1996). Generation technology performance is significantly influenced by variations in fuel quality that makes standardization of plant designs difficult. It is necessary to ensure uniform fuel quality for easier plant standardization, plant availability improvements, and stabilization of performance of emission control equipments (Papay et.al, 1997). Ensuring uniform fuel quality requires blending and coal preparation procedures. This necessitates using an integrated, systems approach to coal preparation and delivery (mining, grinding, cleaning, transport, and the method of utilization), i.e., breaking apart the old “silo” approach among mining firms, transportation (railroads), and utilities/IPPs (Papay et.al, 1997). Use of coal water slurries is an example of such integration, and technologies such as IGCC and PFBC have already demonstrated the ability to use slurries to feed coal at high pressure (Papay et.al, 1997). In order to speed up plant optimization, a market could be developed for use of low price fuels such as heavy oils, petcoke, orimulsion, and biomass (Papay et.al, 1997). Use of coal with other fossil fuels like natural gas can improve environmental performance- an example could be the use of natural gas in the PFBC topping cycle in a second-generation PFBC plant (Papay et.al, 1997). Building a plant with some degree of fuel flexibility also helps hedge against fuel price fluctuations- for example, a CCGT plant can be built leaving space to add coal-handling equipment to convert to coal (Papay et.al, 1997). Historically, the relatively low price of coal in the United States as compared to other fossil fuels such as natural gas has led to very few deployments of efficient coal conversion technologies. The low level of deployment of supercritical PC technologies is primarily attributed to low coal prices that create insufficient incentives for efficiency enhancements. Almost three- 60 EPA’s NSR rule characterized existing plant upgrades that increased efficiency and availability of existing units, without increasing the unit’s pollution producing capacity, as “modifications” of existing facilities that are then subjected to NSR requirements (NCC, 2001). This approach is likely to have discouraged utilities in undertaking modifications, due to permitting delays and related expenses, along with added costs for emissions controls intended for new facilities. Due to legal actions against a number of companies and generation facilities since 1998 under the NSR section of the 1990 Clean Air Act Amendments, no new efficiency, availability, or environmental improvements occurred since that time (NCC, 2001). 61 Clear Skies Act of 2003 is a mandatory program, employing market-based cap and trading mechanisms, that is likely to reduce and cap emissions of sulfur dioxide (SO2), nitrogen oxides (NOX), and mercury from electric power generation to approximately 70 percent below 2000 levels (Tell Us, 2001). Concerns have been expressed that replacement of CAAA rules with Clear Skies Act could result in increasing emissions of pollutants (than would have taken place under CAAA) and worsening of environmental conditions (www.sierraclub.org/cleanair/clear_skies.asp)

58
quarters of the new generation capacity built in the United States since 1988 has been natural gas based, and this has been primarily driven by the price differential between natural gas and coal, shorter lead times for setting up a natural gas plant, and the decreasing capital cost of combustion turbines62. The price premium of natural gas-to-coal has historically been below 2 for several years and varied between 2.5 and 363. Though predictions were for the price differential to persist due to abundance of reserves coupled with advances in extraction technology and competition in the natural gas industry, recent experiences have proved otherwise. High natural gas prices experienced in recent times significantly increase deployment opportunities for deployment of coal-based generation technologies64.
62 See footnote 56. 63 See footnote 56. 64 Studies assessing competitiveness of CCTs relative to CCGTs point to the fact that natural gas costs would have to increase by about 50 percent (about $1.5 per MMBtu) relative to coal to make CCTs competitive with CCGT (Papay et.al, 1997). However, long-term natural gas price expectations generally are fairly flat (Papay et.al, 1997). Deployment of advanced natural gas processing technologies (e.g., Fischer Tropsch) could help ensure natural gas price stability at current levels and this could make CCGTs hard to beat on a life-cycle cost basis, except in markets with an abundance of cheap coal and/or wastes for combustion in CCT (Papay et.al, 1997).

59
4. Overview of coal and electricity sector landscape in India and levelised cost assessment of coal-based generation technology options
India has huge domestic reserves of coal and predominantly depends on coal-based
electricity generation to meet a substantial portion of its electricity generation requirement. The electricity demand in the country is growing fairly rapidly, in tandem with the country’s economic growth. The country continues to face significant capacity and energy shortages. Forecasts are projecting large additional capacity requirements, primarily of base load plants. In addition, a large number of plants are due to retire, which expands the market for setting up new plants. Almost all of the coal-based electricity is generated from conventional sub-critical pulverized coal technologies, and most of these plants operate with low conversion efficiency from coal to electricity. Diverse factors affect performance of these technologies. Some of these include – problems related to the coal supply industry; lack of performance standards and insufficient incentives for performance improvements due to near-absence of market competition, and distortions in the fuel supply and electricity market; inadequate investments in public R&D efforts; poor operational and management practices; insufficient investments for technological advancements; lack of information and awareness; and inadequate public policy initiatives. Coal use also has a large number of associated negative environmental impacts from the coal mining stage to emissions of pollutants and disposal of by-products from power plants. Economic and security drivers are likely to ensure coal’s dominance in India’s energy scenario and especially in the electricity sector for many more years to come. The country is increasingly facing the challenge of being able to utilize coal in the most efficient manner, while keeping in mind development priorities as well as the need to minimize harmful environmental impacts.
In this context, an assessment of opportunities and problems associated with advancements in coal-based electricity generation technologies attains great relevance. The first part of this section presents an overview of India’s coal and electricity industries and their interdependencies that are likely to be of relevance in addressing problems and opportunities for research development, demonstration, and deployment (RD3) efforts in coal-based generation technologies. The second part presents levelised cost assessments for different coal generation technologies in the Indian context and their comparisons with natural gas based generation technologies, along with alterations in relative competitiveness among these technologies with variations in key parameters such as fuel prices, rate of advancements in technologies, and likely imposition of environmental constraints.
4.1 Overview of India’s coal and electricity industries and their interdependencies
India is the third largest producer of coal in the world after China and the United States with total reserves of 240 billion tonnes and a reserve to production ratio of 260 (IEA, 2000). Coal accounts for greater than 70 percent of the primary energy supply in the country (CMIE, 2003). Its consumption has been growing fairly rapidly at an average annual rate of almost five percent over more than a decade, and the present coal consumption is greater than 300 million tonnes65 (IEA, 2000). Electricity generation in the country primarily depends on coal (more than 70 percent of the coal mined is consumed for electricity – coal based generation capacity is almost 60 percent of the total and three-quarters of the electricity generation is from coal), and is likely to do so for many more years to come due to the abundance of domestic reserves (IEA, 2000). The growth in future demand for coal from the electricity sector is likely to be substantial as the sector continues to expand rapidly. Coal demand is forecasted to increase at an average annual rate of 7 percent in the near future (IEA, 2000). Since more than 70 percent of the coal goes for electricity generation, the coal consumption for power generation alone is likely to reach 500 million tonnes by 2010 (Staats et.al, 1997). The electricity sector in the country faces 65 India’s coal consumption in 2003 was 359 MT (EIA, 2004)

60
enormous growth opportunities as the present level of electricity consumption is low and the economy continues to expand rapidly. India’s per capita electricity consumption approximates a meager 4 percent of that of the United States and is close to half of the Chinese per capita consumption (EIA, 2004). The present generation capacity is 112.6 GW, close to 60 percent of which is coal-based (Ministry of Power, India, 2005). Investments in coal based generation capacity to meet future power requirements are likely to be substantial. The demand-supply gap in the country is significant. Future projections are that the present capacity is likely to be doubled within the next decade to support an economic growth rate of about 6 percent (Mittal and Sharma, 2004). This can be considered as a conservative estimate going by the recent experiences in growth rates averaging more than 7.5 percent in the last 5 years. The majority of future capacity additions are likely to be coal-based.
Natural gas supply in the country for electricity generation is far more limited than that of coal. Not only are indigenous reserves relatively small, imports too are restricted due to a combination of geo-political concerns, high costs, and national energy security. Most of the private power capacity growth in India, however, has been based on natural gas due to the inherent advantages of setting up gas based power generation capacity – low investment requirements, shorter construction periods, and high efficiencies associated with combined cycle gas turbine technology. Out of the total IPP capacity commissioned in India, gas based capacity is almost eight times the capacity commissioned for coal (Perkins, 2005). This is in direct contrast to utilities that have almost eight times coal-based capacity commissioned as compared to gas. A large contributing factor towards private investment in gas instead of coal has also been due to the ease of setting up fuel supply linkages with gas as compared to coal and the poor quality of fuel supply. Though an increasing number of natural-gas based CCGT plants are being set up in India, primarily by private participants, there remain concerns about their relatively higher costs as compared to international levels. Therefore, the competitive advantage gained by gas-based power plants on account of their much lower capital investments as compared to coal based plants in other countries is partly offset under Indian conditions. A number of problems plague India’s coal and electricity sector and they need careful consideration before assessing opportunities for clean coal technology development and deployment opportunities in the country. One of the critical problems facing India’s electricity sector is the very poor quality of coal delivered to the power plants. Indian coal has very high level of ash content varying between 35 to 50 percent by weight and having a gross calorific value of 3000 to 5000 kcal/kg (IEA, 2000). A major portion of the ash is inherent in the coal, aggravating difficulties in removing it. Coal quality has been deteriorating due to shift in mining practices from underground mining to surface mining66 and depletion of better quality of coal reserves (Staats et.al, 1997). Compounded to that is the problem that there is very little washing of non-coking coal67 (Staats et.al, 1997). Almost a third of the power plants use coal with an ash content of more than 40 percent (IEA, 2000). There is need for further systematic studies on assessing costs and benefits for washing coal and impacts on power plant performances. Some studies point out to the fact that setting up washeries is not economically attractive given the current washery costs, beneficiation techniques, and the quality of Indian coal (Mathur et.al, 2003). But it should be noted that this kind of analysis is very sensitive to the delivered coal cost. The coal mines are located mainly in the eastern region of the country, far from the places of consumption. Therefore, almost two-thirds of the mined coal needs to be transported over very
66 The coal occurs at relatively shallow depths and about three-quarters of the coal extraction is by surface mining operations. Government policies too have favored surface mining due to its shorter development period and higher rate of coal recovery. (Staats et.al, 1997) 67 Recent information from the Ministry of Coal in India, the government department in charge of matters related to coal, reports existence of five washeries for non-coking coal with an aggregate raw coal handling capacity of 17 MT (http://coal.nic.in/)

61
long distances (almost two-thirds of the coal mined in India is transported across distances beyond 500 km) to be delivered to the power plants (IEA, 2000). The transportation costs for coal account for a substantial fraction of the delivered coal cost. Added to that is the fact that a large fraction of the coal for electricity generation is not washed prior to transportation that effectively increases the coal price per unit heat value. The transportation infrastructure, primarily owned by Indian Railways, which is a federally owned entity, is challenged to meet increasing coal supply requirements. Therefore, quite often, Indian power plants do not have sufficient coal supply to meet their requirements. Other than transportation bottlenecks, inadequate coal supply is also caused by insufficient expansions in mining capacity. Fueled by the problems plaguing the domestic coal industry, imported coal (imports are primarily from Australia and South Africa) has been rising slowly but steadily (Perkins, 2005). Use of imported coal is economical as compared to high ash Indian coal use primarily in costal regions that are long distances away from coalmines. Incentives to use imported coal also arise due to the much better coal quality. Power plant performances are grossly affected by the fluctuating and deteriorating coal quality supplied from Indian mines. One of the primary causes for low plant load factors (PLF) in Indian power plants is the poor coal quality (Sharmaa et.al, 2004)68. As the grids in India are weakly linked, gaps exist between the PLF and availability due to sub-optimal utilization of plant capacity. The boiler performance suffers as it has cope with considerable fluctuations in coal quality. Auxiliary power consumption for power plants remains relatively high at 7 percent (Sharmaa et.al, 2004). Power plant trials demonstrate that ash content reductions from 38 to 28 percent translate to overall conversion efficiency gains by 2 percentage points (IEA, 2000). Blending low quality domestic coal with high quality imported coal remains an option for overall fuel quality improvements, thereby leading to performance improvements in power plants. Most of the new power plants being built in the country are designed to handle high-ash low quality coal so as to enhance their performance as compared to older plants, but often at a high capital cost penalty. Problems confronting India’s coal sector are also inextricably linked to its institutional characteristics. Government ownership dominates the Indian coal industry. Coal India Limited is the world’s single largest coal supplier and produces more than 85 percent of the Indian coal (IEA, 2000). Indian mines have much lower productivity as compared to world standards69 primarily due to the low level of technological advancements resulting from lack of funding sources. Tight government control over the sector and restrictions on private and foreign participation have stifled innovation. Along with that, insufficient government support for technological advancements creates additional problems. There are ongoing efforts to attract foreign investment and for international collaboration to improve sector performance. For a long time in the Indian coal industry, government ownership resulted in tight price controls. But reforms have been initiated and the sector is gradually opening up. Partial deregulations of prices have taken place, but they still do not reflect production costs. The sector is also now open to coal imports and private participation is taking place in a limited manner. Though increasing amounts of coal imports are stepping up competitive pressures on the domestic coal industry, regulations on exclusive supply linkages continue to tie customers to domestic coal producers and hinder competition. Like the coal industry, the electricity industry in the country is predominantly owned and controlled by the government. Almost 60 percent of the generation capacity is owned and managed by state level utilities and a third of the capacity is owned by two federally owned and managed utilities (IEA, 2000). National Thermal Power Corporation (NTPC), the federally owned entity, is the single largest owner of coal capacity in the country and the world’s sixth
68 The plant load factor (PLF) from utilities in the state and central sector was a combined average of 70.85 in 2001–2002 (Perkins, 2004). 69 Productivity in Indian coal mines ranges from 152 tonnes to 2621 tonnes per miner per year, compared with about 12000 tonnes in Australia and the United States (IEA, 2000).

62
largest power producer with aggregate capacities exceeding 20 GW (IEA, 2000). Performance of NTPC’s plants is way better then those belonging to state level utilities primarily due to more efficient operation and management practices70. Investment-strapped utilities tend to extend plants much beyond their operating lives leading to poor plant performances. Private participation remains limited with capacity ownership of around 9 percent of India’s total installed capacity (IEA, 2000). Ongoing power sector reforms in India strive towards alterations in the institutional structure and ownership patterns while encouraging private and foreign participation as well as reforming the state level utilities into corporate business entities. India’s power sector is severely plagued by shortages in investments due to which the growth in capacity considerably lags the growth in demand. The primary cause of the poor financial health of the electricity industry is the policy of subsidization of electricity prices that in turn affects the coal industry too due to large defaults and delays in payments of coal prices. Along with the subsidization policies (that results in average tariffs for electricity being almost 20 percent below average costs), the astoundingly high levels of losses on account of commercial theft, non-billing, and poor metering practices greatly aggravates the precarious financial situation of the sector71 (Ghosh, 2001). The future projected coal based generation capacity addition is likely to be significant72. Looking into past experiences, actual power plant capacity installations have consistently fallen considerably short of planned capacity projections primarily due to the financial and institutional problems that the sector continues to encounter. Actual plant constructions are typically about half the official Plan target, and in recent years the gap between Plans and reality has grown (Tongia, 2003). The current Five Year Plan (2002-2007) envisages 60 GW of capacity additions based on an economic growth rate of 8 percent (Tongia, 2003). The investment requirement for this kind of new capacity addition is likely to approximate $90 billion over 5 years that is roughly 4 percent of the GDP (Tongia, 2003).
In view of the financial difficulties that the sector continues to face and the relatively slow progress in electricity industry reforms, meeting future forecasts for electricity demand poses a formidable challenge. However, the recently passed Electricity Act 2003 proposes a few landmark reforms in the electricity industry. It completely de-licenses generation, proposes setting up open-access in transmission and makes specific recommendations for setting up a competitive wholesale power market (Thakur et.al, 2004). This could therefore provoke more private and foreign participation as well as strong incentives for performance improvements in a competitive market. It is interesting to note that plant performance varies quite considerably with ownership patterns. NTPC plants have much better performance characteristics as compared to plants belonging to the state level utilities, primarily due to better operational and management practices as well as supply of better quality coal (IEA, 2000). Almost all of the scheduled IPP coal projects are designed to use better performing subcritical pulverized coal technology with a design thermal efficiency of 38 percent in contrast to the average 31.6 percent efficiency of plants belonging to the utilities (Sivaramakrishnan and Siddiqui, 1997). This performance variation is counted for by the vintage characteristics of the power plants. Among the plants being recently
70 State owned enterprises that dominate the electricity industry collectively lose 5 billion dollars per year, which is over one percent of the GDP. The losses would be higher if one does not account for the government subsidies of roughly two billion dollars from the state governments a well as myriad of cross subsidies, grants, and loans. (Tongia, 2003). 71 Estimates show that out of the total power generated, about 55 percent is billed and out of that only 41 percent is realized (Tongia, 2003). 72 To meet the goal of providing ‘Power for All by 2012’, the Central Electricity Authority has estimated that an additional 100 GW of generating capacity would be required by the end of India’s Eleventh Plan (2007-12). (Background note- India-IEA Joint Conference on Coal and Electricity in India, 22-23 September- New Delhi).

63
commissioned, there exist almost no variations among utility and IPP plants with respect to performance parameters (Perkins, 2005). Are environmental regulations a driver for coal-based electricity generation advancements?
Statutory environmental requirements for new power projects in India as well as regulations for existing projects are considerably less stringent than in the majority of the developed economies, and even in some developing economies (Couch, 1999). The present state of environmental regulations does not serve as a driver for investments in cleaner generation options. But there are increasing concerns on emissions arising from fossil fuel burning, predominantly coal, for electricity generation. Presently, there are no regulations for SO2 emissions from power plants. As compared to countries like the United States that have relatively high sulfur content in the coal, Indian coal is low in sulfur – run-of-mine coal in India has sulfur content of varying between 0.2 to 0.6 percent (IEA, 2000). Therefore, unlike in the United States, SO2 emissions from power plants are less of a cause of concern under Indian conditions. However, the situation is not likely to remain the same for long. The reason for this is that a large number of large capacity power plants (with capacities exceeding 500 MW) are coming up in clusters in regions that have high power demands. This aggregation of large capacity power plants within a small geographic area is likely to cause relatively high local and regional concentrations of SO2 thereby leading to acid rain concerns in those particular and neighbouring regions, depending upon the local and regional climatic conditions. In order address this concern, SO2 emissions control is likely to be required in areas where clusters of large capacity plants are set up. Current regulations mandate that all new power plants being built with more than 500 MW capacity have a space provision for future FGD installation73 (Sridharan, 2003). Like SO2
emissions, NOx emission levels from the power sector are not a cause of current environmental concerns due to the relatively low level of emissions. There are no current regulations on NOX emissions from power plants. Increasing amounts of particulate matter emissions from power plants are a cause of rising concern due to the detrimental effects of SPM emissions on human health. The size range of SPM particles are from a sub micron level to about 25 microns (Mittal et.al, 2004). Current regulations mandate all power plants to be fitted with ESPs for control of SPM emissions. But very often the operating efficient of the ESP is lower than the mandated 99.9 percent removal efficiency (Perkins, 2005). A number of operational and regulatory problems pose challenges to efficiency ESP performance. Quite often filters do not reach planned efficiency levels of 99.7 percent due to operating problems caused by the coal quality -- the ash is very often high in silica and alumina that creates resistance and results in very low collection efficiencies of conventional ESP (Lookman, 2002). To improve efficiency, the size of the collector plate needs to be increased that in turn raises costs. Innovations in particulate emissions control such as flue gas conditioning and baghouses have not been installed in India for advancements in particulate emissions control (Lookman, 2002). There has been very little further experimentation in these options after some early experiments were not successful. Other barriers are lack of information to power plant owners, high cost and financing difficulties, and uncertainties in coal quality and prices. The other primary environmental concern facing the Indian electricity sector is the increasing amount of fly ash generated from power plants. Government policies mandate the use of beneficiated/blended coal containing not more than 34 percent ash for power plants that are located 1000 km away from the mine-mouth and in urban/sensitive/critically polluted areas (Sridharan, 2003). Even after passing of this regulation, not much effort has been made towards coal beneficiation; therefore, power plants are switching to coal imports to comply with the regulations. Ash utilization levels in India remain extremely low (only 2 percent of the ash
73 The existing regulation with respect to SO2 emissions is only related to specifications of stack heights that vary with generation capacity (Sridharan, 2003).

64
generated in India is used commercially) as compared to many other countries (IEA, 2000). Present regulations exempt use of beneficiated coal by fluidized bed combustion (AFBC and PFBC) and gasification (IGCC) technologies, irrespective of their locations (Sridharan, 2003). India’s current share in global carbon emissions is 4 percent, with the current per capita carbon emissions in India being only a quarter of the world’s average and one-twentieth of the U.S. per capita carbon emissions (EIA, 2004). But carbon emissions are likely to increase rapidly as the country moves forward on its development trajectory. Coal is likely to continue its dominance in India’s energy scene for many more years to come. Power sector contribution to emissions is substantial. Between 1990 and 2001, India's carbon emissions increased by an astonishing 61%, a rate surpassed only by China's 111% increase during the same time period (EIA, 2004). The rise in India's carbon emissions has been exacerbated by the low energy efficiency of coal-fired power plants in the country. As such, India's contribution to world carbon emissions is expected to increase in coming years, with an estimated average annual growth rate between 2001 and 2025 of 3.0% in the EIA International Energy Outlook 2003 reference case (compared to 3.4% in China and 1.5% in the United States) (EIA, 2004). Power sector share in carbon emissions is close to 40 percent share (Garg and Shukla, 2002). There exists significant mitigation opportunities in the Indian electricity sector – advancements in coal based electricity generation technologies from the point of view of efficiency enhancements, both for existing as well as new plants, provide opportunities for addressing climate change concerns. 4.2 Ongoing efforts in advanced technology development efforts in India
Among all the Indian utilities, only NTPC invests a significant amount for R&D.74 According to its latest annual report, it has decided to set up a ‘Power Technology and Research Centre’ to conduct research in new technologies, alternate fuels, and non-conventional energy resources (NTPC, 2004). NTPC also participates in international research activities through its membership in the U.S. based Electric Power Research Institute (EPRI) (Tongia, 2003). In contrast, state level utilities engage in very little R&D activities with practically no budget allocation for R&D activities (Tongia, 2003). The Central Power Research Institute (CPRI) was set up by the federal government to undertake R&D activities in the power sector75. CPRI funds are solely derived from the central government with no contribution from utilities. Its mandate is quite limited and budgetary restrictions also lead it to engage itself only on transmission and some other related activities. Since the eighties, USAID and NETL together have been providing technical support to India’s electricity industry for efficiency enhancement and environmental performance improvements of power plants76. The project was extended in 1995 to include efforts to reduce carbon emissions from the electricity sector. For this purpose, the Greenhouse Gas Pollution Prevention project (GEP), collaboration between NTPC and USAID, is being implemented (NTPC, 2004). The project is designed to reduce GHG emissions per unit of electricity generated by efficiency improvements of existing plants and implementing advanced technologies for future coal-based power plants. While working on technical options for efficiency improvements, the project keeps in mind the coal supply constraints such as supply of coal of poor and fluctuating quality. Around 20 GW of existing coal-fired stations belonging to NTPC are the target for 2 percent improvements in heat-rate efficiency77. GEP is a part of USAID’s $45 million technical
74 Around 0.5 percent of NTPC’s profits are allocated towards R&D activities (NTPC, 2004) 75 See Central Power Research Institute website at http://powersearch.cpri.res.in/ 76 See NETL Media release- ‘NETL, USAID-India sign second phase of agreement to reduce pollution from coal-fired power plants’, www.netl.doe.gov/newsroom/media_rel/mr_usaid.html 77 See ; USAID-India website at http://www.usaid.gov/in/UsaidInIndia/Act_GEP.htm

65
assistance package to India for energy efficiency and clean energy technology efforts announced by President Clinton during his India visit78.
NTPC is planning to build a 1980 MW plant using 3x660 MW super-critical coal fired units that is likely to achieve a net efficiency of 36.4 percent as compared to 35.7 percent for equivalent subcritical units (Perkins, 2005). As part of the GEP project it is examining the feasibility of setting up a 100 MW IGCC demonstration plant based on domestic coal at one of its power stations in association with USAID (NTPC, 2004). Equipments for the IGCC project is likely to be supplied by BHEL, one of the largest government owned engineering and manufacturing firms in the country (NTPC, 2004). BHEL has entered into alliances with international corporations such as Siemens of Germany and Hitachi of Japan79. The GEP project has around $12 million allocated to it spread out over ten years from 1995 to 200580. A Centre for Power Efficiency and Environmental Protection (CENPEEP) has been set at NTPC with NETL assistance and USAID funding. This is primarily a training and technology demonstration centre to improve power plant efficiencies and achieve better environmental performance (NTPC, 2004). It has been set up to implement the Efficient Power Generation (EPG) component of the GEP project with a mandate to reduce GHG emissions per unit of electricity generated by improving the overall performance of coal-fired power plants. USAID extends technical assistance and training to CENPEEP through institutes such as U.S. DOE’s National Energy Technology Lab (NETL), Tennessee Valley Authority (TVA), Electric Power Research Institute (EPRI), and some others (NTPC, 2004). The board of this centre draws members from diverse institutions- representatives from different departments of the government such as finance and industry, private industry participants, and financial institutions. A MOU signed between the two countries in 2003 provides for the establishment of a sub-ministerial working group to consult in the areas of coal science, process modeling of advanced fossil technologies, effect of high-ash coal on boilers, cleanup of combustion wastes, and coal cleaning and preparation (NTPC, 2004). A part of the co-operation efforts, Indian technical teams have visited various energy sites in Pennsylvania (NTPC, 2004). 4.3 Levelised cost assessment of coal-based generation technologies for India 4.3.1 Overview of the approach and assumptions Levelized cost formulation
Levelized electricity generation cost represents the life cycle cost of generating a unit of electricity using a particular technology. It includes all relevant costs like investment, fuel cost, operations and maintenance (Ghosh, 2001). Levelized cost assessment of technological options serves as a useful indicator of relative competitiveness among the options as well as how their relative competitiveness changes with variations in different parameters such as fuel prices, discount rate, alterations in technological costs and performances, and internalization of environmental externalities in the generation cost assessment. The methodology spreads out all costs involved in building a facility and producing electricity over the economic life of the plant so the final kilowatt-hour costs can be directly compared. The total cost per unit of electricity is given by the following formulation: C/kWh = (Ka + FC + O&M + EX)/kWh Where C= total cost kWh= kilowatt hour
78 See footnote 77. 79 See news report- ‘BHEL to bid for equipment supplies to Dadri plant’. The Economic Times, April 2, 2004. 80 See footnote 77

66
Ka= capital cost on annualized basis, including construction FC= fuel cost O&M= annual operations and maintenance costs EX= annual environmental externalities Assumptions in the Indian context
As discussed in an earlier section, the subcritical PC plant is the most commonly used generation technology in India. The best estimates for costs and performances for different categories of coal technologies and natural gas based combined cycle technology have been compiled from different sources. For the reference scenario, data related to costs and performances of different types of technologies as well as the sources from which they have been derived are given in details in Table 4.1. The construction times for all coal technologies, except IGCC, is assumed to be three and a half years while for IGCC it is assumed to be four years. All electricity generation technologies are assumed to have a 30-year lifetime. Combined cycle technology based on natural gas has a lower construction time of three years. The reference scenario discount rate for levelized cost estimations is assumed to be 8 percent81. For comparing the levelized costs across different types of technologies, all technologies are assumed to have a capacity utilization factor of 85 percent. On the fuel supply side, Indian coal is characterized by high ash content (between 35 to 45 percent) and low sulphur content close to 0.6 percent (IEA, 2000). Domestic coal reserves are geographically unevenly distributed that necessitates coal transportation from mine-mouth to power plants while imported coal use is primarily taking place in coastal location plants. A third of the coal is expected to be consumed at the mine mouth, more than 40 percent at distances greater than 1000 km and the rest between 500 km and 1000 km (Staats et.al, 1997). Coal transportation across 1000 km distance leads to an almost doubling of the coal price at the mine-mouth (the average price of mine-mouth coal in India is close to a dollar per GJ) (IEA, 2000). Since a very small fraction of the coal is washed, transportation of the high ash coal across long distances creates additional difficulties. There are uncertainties with respect to future regulations on coal washing and on cost/benefits analysis for setting up washeries- therefore most of the power plants to be set up in future are being designed to handle high ash coal. Recent policy directives makes use of washed coal mandatory for plant locations that are located 1000 km from the mine-mouth (IEA, 2000). Due to limited washed coal availability, plants required to comply with this regulation are shifting to imported coal use. The present policy thrust is on setting up of mega power projects (plants with installed capacities greater than or equal to 1000 MW) near mine-mouths and strengthening of T&D networks rather than setting up of load center plants (CEA, 1999; CEA, 1999a). Coal supply and cost characteristics are given in Table 4.2. In locations far away from coalmines, the reliance on natural gas based generation is increasing, though its share in India’s overall power generation remains less than a tenth82. The economically exploitable domestic reserves of natural gas are estimated to be around 710 billion cubic meters that are which are likely to get exhausted by 2015 81 The discount rate assumption for the reference scenario is based on current Prime Lending Rate (PLR) in India and likely future expectations. The latest PLR for public sector banks (banks that are controlled by the government and which constitute the majority of banks) ranges between 10 to 11 percent. The range for foreign banks is 9 to 14 percent (except for a few exceptionally high PLR of 16 percent). The range for private banks is 9.75-13. (See Reserve Bank of India); Note: data on PLR are for the quarter ending September 2004). Based on the current PLR information and likely lowering of future interest rates with steady progress in economic reforms in India, the reference scenario assumes a discount rate of 8 percent. Analysis in later sections of this chapter studies implication of lowering discount rate on technology costs and competitiveness possibly associated with an accelerated economic reforms scenario as compared to the reference scenario. 82 See Ministry of Power for fuel wise break-up of installed capacity as on 31st May, 2004. As on 31st May 2004, India’s total installed capacity was 112.6 GW, of which gas based capacity aggregated to 11.8 GW.

67
(Ghosh, 2001)83. Current domestic natural gas price in India ranges between $2.5-3.5/GJ84. Due to limited natural gas reserves, expansion in gas based generation capacity will have to depend on imports. Infrastructure for LNG imports is being set up in many costal locations in India and long-term contracts for LNG supply are being set up with suppliers in the middle-east countries. The levelized cost assessment being presented here compares electricity generation cost at different natural gas prices with that for coal technologies and estimates the break-even prices of natural gas at which different coal technologies become competitive.
83 The production of natural gas in the country is expected to level-off at around 85 MMSCMD. The demand of gas registered with Gas authority of India Limited (GAIL) upto 1992 itself is of the order of 260 MMSCMD. Projections of gas demand made by a number of agencies indicate a wide and growing gap between demand & gas supply. (Information taken from Ministry of Petroleum and Natural Gas at http://petroleum.nic.in/ng.htm) 84 Natural gas prices in India remain controlled by the government department in charge of petroleum and natural gas (Ministry of Petroleum and Natural Gas). The floor price of natural gas in India. This Ministry has set the floor price of domestic natural gas at Rs. 2150/TCM and the ceiling price at Rs.2850/TCM (Ministry of Petroleum and Natural Gas- ). This translates to a natural gas price range of $2.5-3.5/GJ (at an exchange rate of 43 Indian rupees to the US dollar). The range takes into account the pipeline transportation costs at different points of consumption.

68
Table 4.1 Cost* and performance characteristics for technologies Technology Capital Costs
($/kW) O&M costs at 85% capacity factor (c/kWh)
Efficiency (%)
Subcritical PC w/o FGD 10941 0.6682
33
Subcritical PC with FGD 12763 1.0974
32.55
Supercritical PC with FGD6 12897 1.1088
389
Circulating fluidized bed combustion (CFBC)
116010
0.99711
3412 Pressurized fluidized bed combustion (PFBC)
142213 1.60714
4015 Integrated gasification combined cycle (IGCC)
147016 1.71817
40.818 Natural Gas Combined Cycle (NGCC)
51019 0.22120
5019
* All Cost figures, unless otherwise mentioned, are in 2004 U.S. dollars. 1Source- Oskarsson et.al, 1997; Shukla et.al. (1999) 2 Based on Fixed O&M costs of 32$/kW-year and variable O&M costs of 0.24c/kWh (Oskarsson et.al, 1997). 3 FGD installation adds about $180 dollars (in 2004 prices) to the costs of a subcritical PC plant (Oskarsson et.al, 1997). 4 Based on Fixed O&M costs of 46$/kW-year and variable O&M costs of 0.48c/kWh (Oskarsson et.al, 1997). 5 Auxiliary power consumption for a FGD unit approximates 1.5 percent of the electricity generation that effectively lowers the net plant efficiency (Oskarsson et.al, 1997). 6 Since supercritical PC plants are likely to come in unit capacities exceeding 500 MW and all new plants with capacities exceeding 500 MW sizes are likely to be fitted with FGD units in future, the assessment here considers supercritical plants PC plants to be fitted with FGD. 7
Supercritical PC cost for non-OECD countries is estimated to be 101 percent of subcritical PC costs (IEA, 1998). The capital cost estimate presented here also matches closely that presented in Beer, 2000. 8
Based on Fixed O&M costs of 47$/kW-year and variable O&M costs of 0.48c/kWh (IEA, 1998) 9 Estimates compiled from different sources show supercritical efficiency ranging between 38 to 40 percent (NRC, 1995; Beer, 2000; Rosenberg et. al., 2004). The lower end of operating efficiency is assumed for India due to the poor quality of Indian coal. 10 Capital cost of CFB is almost 90 percent the cost of a PC plant fitted with FGD (Beer, 2000). 11 Based on Fixed O&M costs of 42$/kW-year and variable O&M costs of 0.43c/kWh (estimations have been derived from Oskarsson et.al, 1997; and Beer, 2000) 12 Based on estimates from NRC, 1995 and DOE 2003d. 13 Source- NCC, 2002) and DOE, 2003d. 14 Based on Fixed O&M costs of 68$/kW-year and variable O&M costs of 0.7c/kWh. As compared to a PC plant fitted with FGD, O&M costs for a PFBC are higher by almost a third to 45 percent (Beer, 2000). 15 Estimate derived from NRC,1995 and NCC, 2002. 16 Source- Holt et.al., 2003 17 Based on Fixed O&M costs of 73$/kW-year and variable O&M costs of 0.74c/kWh. As compared to a PC plant fitted with FGD, O&M costs for IGCC are estimated to be higher by almost 55 percent (Beer, 2000). 18 Source- Holt et.al., 2003 19 Source- Rosenberg et.al., 2004 20 Based on Fixed O&M costs of 11$/kW-year and variable O&M costs of 0.08c/kWh (Shukla et.al, 1999).

69
Table 4.2 Coal supply and cost characteristics Type of coal supply Price
($/tonne) Heat Value (GJ/tonne)
Per unit heat value price ($/GJ)
Sulfur content (% by weight)
Ash content (% by weight)
Domestic coal at mine-mouth
16.31 18 0.9 0.6 40
Domestic washed coal transported 1000 km from mine-mouth
34 24 1.4 0.59 30
Imported coal 63.6 27.2 2.3 1.5 14 1 Source: Ghosh, 2001 4.3.2 Analysis Results
The reference scenario assumes technological performance and cost characteristics as outlined in Table 4.1. Technologies use domestic coal at mine-mouth with price and quality characteristics given in Table 4.2. Natural gas based combined cycle technology uses domestic natural gas priced at almost $2.6/GJ. Levelised cost assessment in reference scenario (Figure 4.1) shows that subcritical PC without post-combustion control equipments, which is the predominant generation technology in India, offers the cheapest generation source in spite of its relatively low efficiency as compared to other coal technologies. Subcritical PC fitted with FGD for SO2 control is substantially more expensive due to the high capital costs added on as well as the high auxiliary power consumption of the FGD unit that effectively lowers the plant efficiency (levelised generation cost is almost a fifth more than that of the most commonly used subcritical PC technology without any emissions control equipments).
Figure 4.1 Levelised cost assessment under reference scenario
The reference scenario assumes that all new supercritical plants being built in India are likely to be fitted with FGD units – present government regulation mandates keeping a space requirement for future fitting of FGD with all plant capacities greater than 500 MW. As has already been pointed out, supercritical units could have a slightly lower capital cost as compared to subcritical units due to reduced size of equipments. With large capacity clusters coming up in concentrated regions that are possibly subjected to acid rain conditions and where FGD installation would be mandatory, supercritical PC emerges as the most competitive choice (Figure
0
1
2
3
4
5
Su b-cr PC
w/o FGD
Su b-cr PC
w FGD &
LNB
Super-cr
PC w FGD
& LNB
CFBC PFBC IGCC NGCC
Technologies
Lev
elis
ed c
ost
(ce
nts
/kW
h)
Capital Fuel O&M

70
4.1). Therefore need for SO2 emissions control entails efforts directed towards supercritical development and deployment in India even in the near future. At present, there are no supercritical PC units deployed in India and experience in RD3 of supercritical PC technology remains limited. However, as mentioned earlier, NTPC, is planning to set up a supercritical PC plant with 3x600 MW capacity. Policy efforts need to be directed towards accelerating the development, demonstration, and deployment of supercritical technology in the country. India could learn from experiences from a number of countries in this area, including the United States, which has a long experience of supercritical technology development and deployment. Natural gas based combined cycle technology (NGCC) at domestic natural gas prices have far lower price of electricity generation than any of the coal technologies. Reference scenario results also show that CFBC is competitive with PC plants fitted with FGD (Figure 4.1). This could especially be useful for utilizing high sulfur imported coal (CFBC can capture 95 percent of SO2 emissions in the fluidized bed) and for utilizing low value feedstock. There are a number of industrial units in India that employ AFBC technology, but with successes in scaling up CFBC unit sizes to utility level applications in other countries, opportunities for utility-level power applications with CFBC could open up in India. Under the reference scenario, advanced coal technologies with high efficiency of conversion have substantially higher generation costs than conventional subcritical and supercritical PC technologies (Figure 4.1). PFBC generation costs are almost 40 percent higher and IGCC generation costs are 50 percent higher than the generation costs using conventional subcritical PC technology, primarily due to the substantially higher capital and O&M cost components. Therefore mechanisms to improve competitiveness of PFBC and IGCC need to bring down capital and O&M cost components.
The reference scenario assumes a discount rate of 8 percent for levelised cost estimations- access to cheaper capital to finance high investments for these technologies that effectively leads to lowering of the discount rate would improve the competitiveness of these technologies. Levelised generation costs from PFBC and IGCC under lower discount rates of 4 and 2 percent are compared with costs from different PC technologies at reference scenario discount rate of 8 percent (see Figure 4.2). At a discount rate of 4 percent, PFBC is competitive with sub and supercritical PC technologies fitted with FGD. With IGCC, a discount rate of 4 percent makes it closely competitive with subcritical PC technology fitted with FGD at 8 percent. Further lowering of discount rate to 2 percent substantially improves competitiveness for both PFBC and IGCC because both technologies have generation costs far lower than any kind of PC technology fitted with FGD. However, their costs even at a 2 percent discount rate remain higher than subcritical PC generation costs. Efforts to deploy PFBC and IGCC technologies therefore should be directed towards access to cheaper capital.
Next we compare relative competitiveness among coal and NGCC technology with natural gas price variations (Figure 4.3). Under reference scenario gas price of $2.6/GJ, NGCC has the lowest generation cost among all technologies. But the situation significantly alters at higher levels of gas prices. The relative competitiveness among coal and gas technologies is very sensitive to natural gas price variations. At a gas price just above $3/GJ, the subcritical PC technology (without FGD) starts competing with natural gas combined cycle technology (NGCC) and close to a gas price of $3.5/GJ, CFBC is competitive with NGCC technology. At a gas price of $4/GJ and higher, the electricity generation cost using NGCC is more than the generation cost even from conventional subcritical PC technology as well as advanced supercritical PC technology. The break-even gas price at which advanced technologies such as PFBC and IGCC are competitive with natural gas based technologies occur is slightly higher than $5/GJ gas price. The assessment of competitiveness among coal and gas technologies in this analysis presumes relatively conservative estimates for the costs and performances of advanced coal technologies such as PFBC and IGCC. With further developments of these technologies in future, it is very likely that the break-even natural gas price will be significantly lowered from the $5/GJ natural gas price.

71
Figure 4.2 Levelised cost comparisons at different levels of discount rates
Figure 4.3 Levelised cost comparisons under different gas price scenarios
3.0
3.2
3.4
3.6
3.8
4.0
S u b -c r
P C w/ o
F GD a t
8%
S u b -c r
PC w
FGD a t
8%
Su p e r-c r
P C w
F GD a t
8%
P F BC a t
4%
IGC C a t
4% .
P F BC a t
2%
IGC C a t
2% .
Co
sts
(c/k
Wh
)
0
1
2
3
4
5
6
Sub- cr P
C w
/o F
GD
Su b-cr P
C w
FG
D &
LN
B
Super -cr
PC w
FG
D &
LN
B
CFBC
PFBC
IGC
C
NG
CC
at $
2 .5/G
J gas
NG
CC at $
3 /GJ
gas
NG
CC
at $
3 .5/G
J gas
NG
CC at $
4 /GJ
gas
NG
CC a
t $4 .5
/GJ
gas
NG
CC
a t $5 /G
J gas
NG
CC a
t $5 .5
/GJ
gas
T e ch n o l o g i e s
Lev
elis
ed c
ost
(cen
ts/k
Wh
)
Cap ital F uel O & M

72
Relative to the growth in coal-based generation, the natural gas-based generation capacity has experienced a much more rapid growth in capacity additions, though its share in overall capacity is much smaller when compared to coal. Both domestic and foreign private investment in the power sector in India is primarily taking place in gas-based capacity additions due to the inherent advantages associated with NGCC technology. But possibly the other primary factor driving the gas based capacity additions are the problems associated with coal supply – the poor quality of coal and uncertainties with respect to coal supply and prices. There are substantial investments taking place in India in setting up LNG supply infrastructure with supply contracts from countries in the Middle East. As the analysis here shows, the competitiveness of coal-based technologies with respect to gas-based technologies is very sensitive to fluctuations in natural gas prices. Therefore national policy needs to be directed towards accelerating reforms in the energy supply market, in congruence with the development of advanced coal technologies. The growing dependence on natural gas can best be pursued as a short-term strategy in order to fulfill the supply shortages arising due to inefficiencies in the coal supply market. But coal market reforms are of utmost necessity to enhance energy self-reliance in the country and reduce vulnerabilities caused by international natural gas price fluctuations. Along with coal market reforms, there needs to be a thrust on development and demonstration of advanced coal technologies so that these technologies occupy an increasing share in generation in the mid to long-term energy futures. As already discussed, India’s domestic coal industry is plagued with inefficiencies in supply and prices, and suffers it from poor coal quality. Transportation linkages are insufficient, and transportation costs are very high per unit heat value of coal as unwashed coal with around 40 percent ash is transported. There is limited private participation in the sector and a large number of restrictions prevail with respect to setting up a competitive domestic coal supply market. This analysis attempts to assess the impact of coal industry reforms on the relative competitiveness of coal-based technologies. The present price of domestic unwashed coal at the pithead is close to a dollar per GJ. Washing for non-coking coal is absent in India, but the need for this is being increasingly realized. Long distance transportation, primarily by rail, increases coal prices by about one and a half times the mine mouth prices. Imported coal price estimates are close to $2.5/GJ. Though coal imports in certain coastal locations of the country are increasing, its share in the overall coal supply remains quite limited at less than 5 percent of the overall supply.
Figure 4.4 Competitiveness among coal technologies at varying levels of coal prices
2.5
3.5
4.5
5.5
6.5
7.5
8.5
1 1.5 2 2.5 3 3.5 4 4.5Coal prices ($/GJ)
Lev
eliz
ed c
osts
(c/
kWh)
Sub-cr PC w /o FG D
Sub-cr PC w F GD &
LN B
Sup er-cr PC w F GD &
LN B
CFBC
PFBC
IG CC

73
Even across wide coal price variations (ranging between $1 to $4.5/GJ), subcritical PC without FGD offers the cheapest generation source due to the relatively low fuel cost component in the generation cost (see Figure 4.4). But it may be interesting to observe alterations in relative competitiveness among other clean coal technologies with coal price variations and draw implications for the Indian situation. CFBC is a close competitor to supercritical PC fitted with FGD, with the latter becoming a cheaper option to CFBC even at relatively low coal prices of $2/GJ. Therefore CFBC is likely to be an economical choice over supercritical PC fitted with FGD at mine-mouth plants or for those situated very close to the mine-mouth (only for locations where SO2 emissions are required to be controlled). But for slightly higher coal prices that may be arising due to transportation needs, supercritical PC with FGD emerges as the technology of choice over CFBC due to the efficiency advantages of supercritical PC. One consideration that needs to be kept in mind is the availability of commercially deployable CFBC units in large unit sizes of 500 MW, which may be restricted to some extent in the near-term. Scaling up efforts for CFBC have been well demonstrated up to 300 MW unit sizes while further development efforts are on to scale up CFBC units to 660 MW unit sizes. On the other hand, deployment of high capacity supercritical units is quite well proven. At relatively higher coal prices starting from $3.5/GJ, the most basic subcritical PC technology without FGD and the much more cleaner and efficient supercritical PC fitted with FGD compete closely. Under a situation where SO2 emission controls are imposed, and for a choice among subcritical and supercritical PC technologies both fitted with FGD, the latter always emerges as the lower cost generation source over the entire range of coal prices. Even for setting up mine-mouth plants using domestic coal that needs to be fitted with FGD for SO2 control, supercritical technology is the choice over subcritical. Therefore in the situation where impositions of SO2 emissions controls are likely, supercritical technology warrants priorities in development and deployment efforts. PFBC competes closely with subcritical PC fitted with FGD when coal prices are higher at $3/GJ. The sensitivity of the relative competitiveness among the technologies with coal price variations also reveals that under reference scenario assumptions, the highest capital cost and most efficient IGCC technology becomes economical only to subcritical PC fitted with FGD only at coal prices close to $4/GJ and higher. This analysis therefore points to the fact that reforms in the coal industry in India and initiatives to set up a competitive coal market with higher degree of coal imports is very likely to emerge as a strong driver for advancements in cleaner coal technologies, and this further emphasizes what has been mentioned earlier, namely that coal and technology market development needs to take place simultaneously.
In terms of relative carbon emissions from different technologies (Figure 4.5) under reference scenario assumptions, advanced coal technologies such as PFBC and IGCC have around one-fifth less carbon emissions per unit of electricity generated as compared to conventional subcritical PC technology as well as CFBC85. But with respect to more efficient supercritical PC technology, the carbon emissions advantage is only 5 percent. Of course, as compared to NGCC, even advanced coal technologies emit substantially higher carbon emissions from IGCC are approximately double the emissions from NGCC. In terms of SO2 emissions performance (Figure 4.6), fluidized bed technologies do not offer advantages over PC plant fitted with FGD, as they are unlikely to attain the 98 percent emissions control attained with FGD systems. SO2 emissions per unit of electricity generation from fluidized bed technologies are almost two to three time emissions from PC plants with FGD. As compared to fluidized bed technologies, IGCC has superior performance: most of sulfur is captured during the conversion process in IGCC. But even with that and higher efficiency advantage of IGCC, SO2 emissions are almost 20 to 40 percent higher than PC with FGD. Since India has relatively low percentage of sulfur in the coal as compared to many other countries, comparisons in environmental
85 This relative comparison of carbon emissions does not include any carbon capture technologies.

74
performance based on SO2 emissions is unlikely to be the primary criterion driving technology choice. But in places where imported coal with relatively higher sulfur content is being used (mainly in coastal locations) where control of SO2 emissions is an important criterion, PC with FGD is likely to be favored over fluidized bed and gasification technologies. However, in the context of mercury emissions control, gasification technology has a substantial edge over coal combustion technologies in terms of cost-effective mercury control possibilities.
Figure 4.5 Carbon emissions comparison among different technologies
Figure 4.6 SO2 emissions comparison among different technologies∗ ∗Note that SO2 emissions from PC plants not fitted with FGD (uncontrolled emissions) are of the order of
7.3 g/kWh and 12 g/kWh using domestic and imported coal respectively under reference scenario assumptions. Effect of potential carbon tax imposition on relative competitiveness among technologies
An attempt is made to assess alterations in relative competitiveness among coal technologies and their competitiveness with natural gas-based technologies under climate
0
5 0
1 0 0
1 5 0
2 0 0
2 5 0
3 0 0
3 5 0
Sub- cr P C
w/o FGD
Sub-cr P C
w FGD &
L NB
Sup er -cr
P C w
FGD &
LN B
CFBC P FBC I GC C N GC C
Te ch n o lo g y
C e
mis
sio
ns
(gm
s o
f C
/kW
h)
0.0
0.2
0.4
0.6
0.8
Sub-cr PC w
FGD & LNB
Super-cr PC
w FGD &
LNB
CFBC PFBC IGCC
Technology
SO
2 em
issi
on
s (g
ms/
kWh
)

75
intervention scenarios- the analysis here uses carbon tax impositions at different levels as a proxy for such interventions. Large coal power plants in any country, which represent largest single point sources of CO2 emissions, are likely to be targeted for attention in any carbon related legislation. The carbon tax scenarios presented here are not meant to represent future predictions on carbon controls and prices, but are simply used to assess the impact of these on relative competitiveness among fossil-based coal and gas technologies. On a per-capita basis, India’s carbon emissions are remarkably low compared not only to industrialized countries but also other major developing countries.86 Yet India is the world’s fifth-largest emitter of CO2 as a result of its large population and the aggregate size of its economy – it accounted for 4.4 percent of the global carbon emissions in the year 2000 (EIA, 2004). The emissions are rapidly increasing as the country continues in its rapid development path. Similar to other developing countries, addressing climate change concerns remains a “common but differentiated responsibility” for India87. Addressing climate change concerns, while keeping in mind the nation’s developmental priorities, will especially require understanding the implications of investment decisions in electricity generation technologies that have very long life times and therefore significant influence on future carbon emissions trajectories88. At a relatively low tax level of $20/T of carbon, there is no change in relative competitiveness among different coal based technologies (see Figure 4.7). Of course coal competitiveness with respect to natural gas based technologies worsens under a carbon tax scenario as compared to the reference scenario. In contrast to the reference scenario, under the $20 carbon tax scenario, natural gas based technologies are competitive with supercritical PC and CFBC technologies even up to high gas prices of about $4/GJ. Only at gas prices reaching above $5-5.5/GJ do advanced PFBC and IGCC technologies become competitive with NGCC. The analysis here also tries to assess alterations in relative competitiveness among coal technologies at different levels of a carbon tax (Figure 4.8). Among pulverized coal technologies, supercritical competitiveness improves with progressively higher levels of carbon tax and at nearly $100/T of carbon tax level, supercritical PC has a lower cost of generation than even subcritical PC without FGD. The least efficient technology, subcritical PC fitted with FGD is the worst performing one, and even at relatively low tax level of about $50/T of carbon, its levelised generation cost is very close to more efficient and capital intensive technologies such as PFBC. Looking at the relative performance among supercritical, PFBC, and IGCC technologies one observes that supercritical PC, PFBC, and IGCC compete very closely at higher tax levels of $200/T of carbon and higher, though supercritical PC all along has the least cost of generation among these three technology categories even at considerably high tax levels of $300/T of carbon (needs to be kept in mind that the performance characteristics for these advanced technologies are based on reference scenario assumptions and the relative competitiveness among them would be altered with changes in performance characteristics). Thus under reference scenario assumptions, supercritical PC emerges as the winner among all technology categories even under a regime that imposes a strong penalty on carbon emissions. 86 Annual fossil-fuel-derived emissions per capita (in metric tons of carbon) for selected countries for the year 2000 were as follows: United States, 5.40; Australia, 4.91; Canada, 3.87; United Kingdom, 2.59; Japan; 2.55; Mexico, 1.19; China, 0.60; Brazil, 0.50; and India, 0.29. (EIA, 2004) 87 Refer to Article 10 of the Kyoto Protocol to the United Nations Framework Convention on Climate Change states- ‘All Parties, taking into account their common but differentiated responsibilities and their specific national and regional development priorities, objectives and circumstances, without introducing any new commitments for Parties not included in Annex I, but reaffirming existing commitments under Article 4, paragraph 1, of the Convention, and continuing to advance the implementation of these commitments in order to achieve sustainable development, taking into account Article 4, paragraphs 3, 5 and 7, of the Convention, shall:…’ 88 CO2 emissions from the power sector are estimated to be about 44 percent of the overall national emissions (Garg and Shukla, 2002)

76
What would be interesting to observe is how the relative competitiveness among supercritical PC, PFBC, and IGCC alter with progressive improvements in their cost and performance characteristics over a period of time under a zero carbon tax scenario as well as with under scenarios with different levels of taxes. The assumptions for progressive cost and performance improvements of these technology categories for the purposes of this analysis are given in Table 4.3 and are taken from National Coal Council Report titled ‘Increasing Electricity Availability From Coal-Fired Generation in the Near-Term, May 2001’. Table 4.3: Capital costs and performance projections for Supercritical PC, PFBC, and IGCC
Supercritical PC PFBC IGCC Year Capital costs ($/kW)
Efficiency (%)
Capital costs ($/kW)
Efficiency (%) Capital costs ($/kW)
Efficiency (%)
2010 930 42 930 45 1149 45 2020 820 44 875 47.5 985 52.5 Source: The National Coal Council. ‘Increasing Coal-Fired Generation Through 2010: Challenges & Opportunities’, May 2002. Figure 4.7 Levelised cost comparisons under reference and $20/t of carbon tax scenario for coal and gas technologies
0
1
2
3
4
5
6
Sub-cr
PC w
/o F
GD
Sub-cr P
C w
FG
D &
LN
B
Super- c
r PC
w F
GD &
LN
B
CFB
C
PF BCIG
CC
NG
CC at $
2.5/G
J gas
NG
CC at
$3/
GJ g
as
NG
CC a
t $3.
5/GJ g
as
NGCC a
t $4/G
J gas
NGCC a
t $4.5
/GJ g
as
NG
CC at
$5/
GJ gas
NG
CC at
$5.
5/GJ g
as
Lev
eliz
ed c
osts
(c/
kW
h)
N o carbon co s t $20/T o f Carbon cos t

77
Figure 4.8 Levelised cost comparisons for coal technologies under reference and carbon tax scenarios at different levels
Under a scenario with no penalty on carbon emissions, the relative ranking among the three technologies in terms of their levelised costs does not alter between now and 2020 (Figure 4.9). PFBC experiences almost a third reduction in generation costs between now and 2010 that considerably improves its position relative to the other two. Generation costs from both IGCC and supercritical decline by almost a fifth between now and 2010. IGCC has the largest decline in generation costs between 2020 and 2020 by almost 15 percent, while PFBC has the least decline between 2010 and 2020. The generation cost decline for supercritical from 2010 to 2020 falls in between PFBC and IGCC. Figure 4.9 Cost comparisons among supercritical PC, PFBC, and IGCC under zero carbon tax
Next we observe how the relative competitiveness among the three technology categories alter with different levels of taxes based on cost and performance characteristics of the
0
2
4
6
8
10
12
14
Sub-cr
PC w/o
FGD
Sub-cr
P C w
FGD &
L NB
Super-
cr PC w
FGD &
LNB
CFBC P FBC IGCC
Te chn ol ogy
Lev
eliz
ed c
ost
s ( c
/kW
h)
$20/T of C
$50/T of C
$100/T of C
$200/T of C
$250/T of C
$300/T of C
0
1
2
3
4
5
Pre s ent 2010 2020
Technology
Lev
eli
sed
co
st (
c/k
Wh
)
Supercritical PC PFBC IGCC

78
technologies in 2020 (Figure 4.10). Though the relative rankings among supercritical, PFBC, and IGCC remain unaltered from a reference scenario to a 100$ per tonne of carbon tax scenario, the gap between their relative competitiveness closes with progressively higher levels of tax. At a 100-dollar tax level- supercritical, PFBC, and IGCC are in very close competition. The relative ranking among the three technology categories is altered only at a considerably high tax level of $200 per tonne of carbon. At this and higher levels of taxes, IGCC is the least cost generation technology followed by PFBC. Thus with current projected levels of cost and performance improvements among supercritical, PFBC, and IGCC one observes that only if a relatively high tax of the order of $200 per tonne of carbon or higher is imposed will IGCC be able to compete with advanced PGBC and supercritical technologies of the future. However, along the three technologies, IGCC is the only technology that offers the ease and lowest cost option of capture of CO2 from the flue gas stream amenable for carbon sequestration89. But even assuming that sequestration works, the added costs of CO2 capture and sequestration to IGCC are substantial (Holt et.al, 2003). Table 4.4 gives an estimation of different IGCC technologies along cost and Figure 4.10 Cost comparisons among supercritical PC, PFBC, and IGCC under different carbon tax (in $/T of carbon) scenarios in 2020
performance parameters with and without carbon capture. The capital cost increase for IGCC technologies with CO2 capture relative to that without CO2 capture approximate between 30 to 40 percent. Along with added capital costs, the efficiency decline is almost by a fifth of the efficiency without CO2 capture. As a result of combination of these two factors, the resulting cost of electricity increase could be between a fifth to a third of the case without CO2 capture. Therefore, in the Indian situation too, assessment of relative competitiveness among advanced coal technologies under a scenario of carbon capture and sequestration will need to incorporate the associated costs for CO2 separation and capture.
89 The costs of CO2 capture and sequestration from new IGCC plants adds 40 to 50 percent to the cost of electricity and with new PC plants the added cost of electricity can be 80 to 90 percent. Also in order to remove the CO2 from the flue gas from the flue gas with amine scrubbing the SO2 and the NOX levels in the flue gas must be very low since these species react irreversibly with the amine. (Holt et.al, 2003)
0
2
4
6
8
10
Z ero tax $20/T $50/T $100/T $200/T $250/T $300/T
Ca rb on tax s cen arios
Lev
eli
zed
co
sts
(c/k
Wh
)
Supercritical PC PFBC IGCC

79
Table 4.4 IGCC studies with and without CO2 capture for Bituminous Coal Technology Without Capture With Capture
Costs ($/kW) 1270 1620 Heat rate (BTU/kWh) 9300 11300
Texaco Quench
COE ($/MWh) 46 57 Costs ($/kW) 1300 1850 Heat rate (BTU/kWh) 8550 11000
E Gas
COE ($/MWh) 46 62 Costs ($/kW) 1470 2020 Heat rate (BTU/kWh) 8370 10350
Shell
COE ($/MWh) 49 65 Source: Holt et.al, 2003 (Table 6) An assessment is made of levelised generation costs from IGCC with and without CO2 capture. Drawing on Holt et.al’s estimations, IGCC capital costs with CO2 capture are assumed to be around 40 percent higher than IGCC costs without CO2 capture in 2020, while the efficiency decline is almost by a fifth. Results from the analysis (Figure 4.11) show that the break-even carbon tax at which IGCC with CO2 capture becomes competitive with supercritical PC technology is close to $75 per tonne of carbon (this carbon tax level is much lower as compared to the break-even tax level of close to $200 per tonne of carbon at which IGCC without CO2 capture becomes competitive with supercritical PC). The added costs of electricity from IGCC due to CO2 capture is of the order of 40 percent. However, this estimation does not include pipeline transport and sequestration costs- estimates in Holt’s paper point this out to be of the order of 1.4-2.7 $/t of carbon. Figure 4.11 Cost comparisons among Supercritical PC, PFBC, and IGCC (with and without carbon capture) under different carbon tax (in $/t of carbon) scenarios in 2020
In their paper, Neville et.al suggest that one option to improve the competitiveness of IGCC technologies with capture and sequestration would be to use the proceeds from carbon tax as credit for the CO2 captured at the same carbon tax rate because this would enable capture and sequestration technologies to compete more readily, and at a lower carbon tax, with existing coal plants. There remain considerable uncertainties with respect to the development of sequestration
0
2
4
6
Z ero tax $20/T $50/T $75/T $100/T
Carbo n tax s cenarios
Lev
eli
zed
co
sts
(c/k
Wh
)
Supercritical PC PFBCIGCC w/o C c apture IGCC with C captu re

80
technologies in terms of whether sequestration works, the level of leakage that is acceptable of sequestered, variations in sequestration effectiveness among different geologic structures, and possibilities of seismic disruptions due to sequestration.
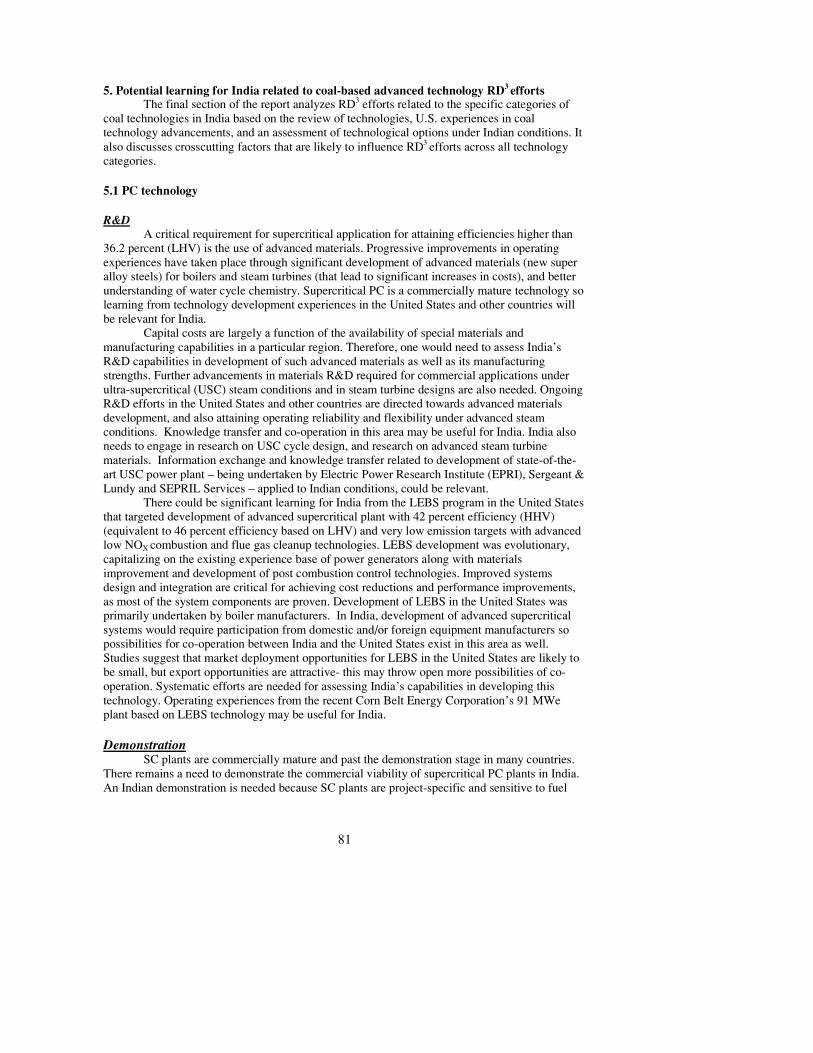
81
5. Potential learning for India related to coal-based advanced technology RD3 efforts The final section of the report analyzes RD3 efforts related to the specific categories of
coal technologies in India based on the review of technologies, U.S. experiences in coal technology advancements, and an assessment of technological options under Indian conditions. It also discusses crosscutting factors that are likely to influence RD3 efforts across all technology categories. 5.1 PC technology R&D
A critical requirement for supercritical application for attaining efficiencies higher than 36.2 percent (LHV) is the use of advanced materials. Progressive improvements in operating experiences have taken place through significant development of advanced materials (new super alloy steels) for boilers and steam turbines (that lead to significant increases in costs), and better understanding of water cycle chemistry. Supercritical PC is a commercially mature technology so learning from technology development experiences in the United States and other countries will be relevant for India.
Capital costs are largely a function of the availability of special materials and manufacturing capabilities in a particular region. Therefore, one would need to assess India’s R&D capabilities in development of such advanced materials as well as its manufacturing strengths. Further advancements in materials R&D required for commercial applications under ultra-supercritical (USC) steam conditions and in steam turbine designs are also needed. Ongoing R&D efforts in the United States and other countries are directed towards advanced materials development, and also attaining operating reliability and flexibility under advanced steam conditions. Knowledge transfer and co-operation in this area may be useful for India. India also needs to engage in research on USC cycle design, and research on advanced steam turbine materials. Information exchange and knowledge transfer related to development of state-of-the-art USC power plant – being undertaken by Electric Power Research Institute (EPRI), Sergeant & Lundy and SEPRIL Services – applied to Indian conditions, could be relevant.
There could be significant learning for India from the LEBS program in the United States that targeted development of advanced supercritical plant with 42 percent efficiency (HHV) (equivalent to 46 percent efficiency based on LHV) and very low emission targets with advanced low NOX combustion and flue gas cleanup technologies. LEBS development was evolutionary, capitalizing on the existing experience base of power generators along with materials improvement and development of post combustion control technologies. Improved systems design and integration are critical for achieving cost reductions and performance improvements, as most of the system components are proven. Development of LEBS in the United States was primarily undertaken by boiler manufacturers. In India, development of advanced supercritical systems would require participation from domestic and/or foreign equipment manufacturers so possibilities for co-operation between India and the United States exist in this area as well. Studies suggest that market deployment opportunities for LEBS in the United States are likely to be small, but export opportunities are attractive- this may throw open more possibilities of co-operation. Systematic efforts are needed for assessing India’s capabilities in developing this technology. Operating experiences from the recent Corn Belt Energy Corporation’s 91 MWe plant based on LEBS technology may be useful for India. Demonstration
SC plants are commercially mature and past the demonstration stage in many countries. There remains a need to demonstrate the commercial viability of supercritical PC plants in India. An Indian demonstration is needed because SC plants are project-specific and sensitive to fuel

82
costs and the availability and costs of advanced materials and components. Also demonstration of Reliability Availability and Maintainability (RAM) of SC units is critical under Indian coal conditions of high ash, low sulfur coal quality. There is a need to assess operating costs under Indian coal conditions and in that respect it may be difficult to translate experiences from other countries that have vastly different coal quality. Optimal plant designs will have to be developed and optimum cycle efficiency demonstrated under Indian conditions. At present, there are no SC plants operating in India and neither are there any demonstration units. Some recent reports however suggest that a 3x660 MW supercritical plant is being planned to be set up by NTPC. This is being planned as a commercial unit, and not as a demonstration plant.
Early operating problems with SC plants in the United States, primarily in plant reliability and maintenance, have been successfully overcome and significant reliability improvements were achieved for SC units so in this area it may be useful for India to look at U.S. learning experiences. Studies conducted by the Electric Power Research Institute (EPRI) in the United States also show that beyond ten years of operating life, the reliability of supercritical units is higher than that of subcritical ones. A critical factor affecting reliability of SC units is the type of coal – often problems arise with high slagging and corrosion coals at high temperatures, and associated plant modifications entail high costs. U.S. experiences show that the use of oxygenated treatment methods has successfully overcome water chemistry problems in order to avoid tube leakage, and this method has been widely deployed in a number of U.S. supercritical plants – this may be a useful aspect for India to look at.
For Ultrasupercritical (USC) technology, demonstrations would need to follow successful R&D efforts on materials. Even in the United States, these plants have not yet attained demonstration stage and are likely to be commercially deployed by 2010 to 2015. Deployment
Projections on future growth in electricity demand for India suggest that there remains a substantial need for the setting up of large capacity base load plants. Supercritical PC units are very suitable for setting up such large capacity base load units and could be preferable to subcritical plants because U.S. studies show that supercritical units exhibit significantly better scale economies than subcritical, at sizes above 400 MW unit sizes. Deployment experience from other countries show that fuel cost has been the primary driver for supercritical deployment as higher capital costs are more than offset by saving in fuel cost90. Deployment in countries where coal is relatively cheap has therefore been limited. For example, in the United States, no new supercritical PC plants have been built since 1991, primarily due to the low price of coal. For the Indian situation as well, one would need to assess deployment opportunities in the context of the current low coal prices in India. It is likely that reforms in the Indian coal industry that ensure higher prices and quality of supply could open up deployment opportunities for more efficient technologies like supercritical power technologies. Similar to the United States, there may be significant opportunities for retrofitting existing PC plants (having very low operating efficiencies) with advanced steam PC technologies in India. Technical solutions may not be hard to find through measures such as use of improved materials for steam generation and super-heater tubing, steam turbine advancements, and control system advancements.
Levelized cost analysis in the Indian context shows that supercritical PC plants with FGD have a lower generation cost than subcritical plants with FGD, even with relatively low mine-mouth coal prices, due to supercritical’s efficiency advantages especially when combined with 90 COE components for a PC plant are- capital cost share at 52 percent, fuel cost share at 29 percent, and fixed O&M share at 19 percent. The relatively low share of fuel costs as compared to the capital cost makes justification for a higher capital cost plant with greater efficiency of coal utilization difficult, especially in the context of low fuel prices (IEA, 1998).

83
FGD units that have high auxiliary power consumption. Future regulations on SO2 emissions from power plants are therefore likely to push deployment of supercritical PC with FGD as the most economic and best control technology. When comparing supercritical PC with FGD and subcritical PC without any post-combustion control equipments, the former becomes competitive only at relatively high coal price of $3.5/GJ and higher (which is an unlikely scenario).
An attempt is made to assess the relative competitiveness between supercritical and subcritical PC units under a scenario without regulations on SO2 emissions that do not require fitting PC plants with FGD. Analysis results under this scenario for the Indian situation provides some very interesting insights; even with very low coal prices of $1 to 1.5 per GJ, the efficiency advantage of supercritical far outweighs its higher capital and O&M costs as compared to subcritical PC (Table 5.1), which finally results in lower generation costs from supercritical even with mine-mouth coal prices. This result holds for assumptions on higher capital and O&M costs for supercritical PC as compared to subcritical PC in India (due to higher technology development and manufacturing costs), and with conservative efficiency estimate of 36 percent for supercritical. As can be seen from the results in Table 5.1, even with supercritical capital and O&M costs a fifth higher than equivalent subcritical PC and an operating efficiency of 36 percent, generation costs using mine-mouth coal are lower than generation costs from 33 percent efficient subcritical PC using domestic coal 1000 km away from mine-mouth. Table 5.1 Assessment of levelized generation costs* (c/kWh) from supercritical PC without FGD under different cost and performance scenarios
Super-cr PC efficiency Super-cr PC costs1
(in comparison to subcritical PC)
36% efficiency 38% efficiency
5% higher costs 3.09 3.04 10% higher costs 3.19 3.14 15% higher costs 3.29 3.25 20% higher costs 3.40 3.35 Sub-cr PC costs Sub-cr PC efficiency of 33 percent At a coal price of $1/GJ 3.17 At a coal price of $1.5/GJ 3.71
* These levelized cost estimates for supercritical are for mine-mouth coal price of $1/GJ 1 The cost comparison is made with respect to subcritical PC technologies- the estimates are both for capital and O&M costs. Thus, in India’s situation, the efficiency advantage of supercritical is substantial enough to outweigh its higher costs, even with relatively high cost estimates and low coal prices. It should be noted that supercritical capital cost assumptions for this analysis have been conservative, as compared to those derived from other sources. For example, estimates for supercritical costs applied to developing countries, predict only a 1 percent higher costs for supercritical as compared to subcritical units (IEA, 1998). Studies in the U.S. context point out that supercritical units in the 700 MW size range are almost 7 percent lower than subcritical units (Joskow and Rose, 1985) and capital costs are likely to be lower than subcritical PC plants due to reduced equipments for coal handling, emission control, and other auxiliary components. This would further enhance commercial deployment opportunities for SC plants in India. In terms of emissions performance, SC plants can achieve high degree of SO2, NOX, and particulate emissions control, but control of mercury emissions considerably raises operating costs. This may restrict deployment opportunities in the context of future strengthening of mercury emissions control. In terms of SO2 emissions control, PC plants with FGD have better emissions control (going up to 98 percent) as compared to fluidized bed and IGCC technologies.

84
Assessment in the Indian case shows that PC plants with FGD have SO2 emissions that are only a third to a quarter of emissions from FBC and IGCC technologies, per unit of electricity generated.
As already discussed, India has very limited reserves of natural gas and is likely to increasingly depend on gas imports for meeting its demand. The domestic natural gas is priced in the range of $2.5-3.5/GJ91 . As the levelized cost analysis shows, competitiveness among coal and natural gas technologies is very sensitive to natural gas price fluctuations. At a natural gas price of $3/GJ, subcritical PC technology without any post-combustion emission control equipments, starts competing with natural gas based combined cycle (NGCC) technology. Therefore in a scenario where no limitations are imposed on SO2 controls, the break-even natural gas price is as low as $3/GJ. When limitations are imposed on SO2 emissions (requiring PC plants to be fitted with FGD), the break-even natural gas price (price at which PC plants fitted with FGD becomes competitive with NGCC technologies) is raised to $4/GJ.
The competitiveness of coal technologies with respect to natural gas based technologies worsens under any kind of penalty for carbon emissions. Under a $20 carbon tax scenario, subcritical PC becomes competitive with NGCC only at natural gas prices of $3.5/GJ and higher, while supercritical PC with FGD is competitive only at gas prices close to $4.5/GJ. While assessing the relative competitiveness among different coal technologies at varying levels of carbon taxes, supercritical emerges as the lowest generation cost option among fluidized bed and IGCC technologies (with reference scenario cost and performance assumptions), even at very stringent penalty levels of $300/tonne of carbon tax. Thus addressing climate change concerns are unlikely to shift an emphasis from supercritical PC to more efficient PFBC and IGCC technologies, even under a strict control regime. This analysis is however carried out with first-generation supercritical PC, PFBC, and IGCC technologies. Even when progressive reductions in costs and performance improvements are considered for all technology categories, levelized cost analysis results show that the relative rankings among supercritical PC, PFBC and IGCC remain unaltered in 2020. However, under a scenario when carbon taxes are imposed, the relative rankings among technologies alter at a tax level close to 100 dollar per tonne of carbon. At that level, all three-technology categories compete closely and relative rankings are altered only at tax levels of 200 dollars and higher. The analysis here therefore establishes the robustness of the supercritical PC technology across a wide range of scenarios, thereby warranting top priority in ERD3 efforts. 5.2 AFBC R&D
AFBC development in India, similar to the United States, is likely to be primarily pushed by independent power producers (IPPs), rather than Investor-Owned-Utilities (IOUs). In India too, with restructuring and reforms in the electricity industry, IPP participation is likely to increase. IPPs could set up ACFB boilers in niche applications areas for fuels that are unsuitable for using in PC boilers. Economics of application are likely to improve with ongoing development efforts towards scaling up boiler unit sizes up to 600 MW. R&D efforts to operate ACFB boiler under supercritical steam conditions would reap double advantages by combining
91 Natural gas prices in India remain controlled by the government department in charge of petroleum and natural gas (Ministry of Petroleum and Natural Gas). The floor price of natural gas in India. This Ministry has set the floor price of domestic natural gas at Rs. 2150/MCM and the ceiling price at Rs.2850/MCM (Ministry of Petroleum and Natural Gas- ). This translates to a natural gas price range of $2.5-3.5/GJ (at an exchange rate of 43 Indian rupees to the US dollar). The range takes into account the pipeline transportation costs at different points of consumption.

85
fuel flexibility and low emissions advantage with higher thermal efficiency92. Knowledge from these development efforts, both in terms of scaling up as well as operation under supercritical steam conditions could be relevant for assessing ACFB applications in India. The other area in which development efforts are needed is N2O emissions reductions that remain relatively high from ACFB boilers as compared to other coal conversion technologies. Demonstration
ACFB boilers for power applications will need demonstration under Indian conditions, especially with respect to the fuel type and quality. Design and operating experiences from a CFB unit in the United States, demonstrating fuel flexibility under a wide variety of fuels, may be useful for India 93. Performance data from scaled-up, ongoing, JEA second-generation ACFB demonstration projects (300 MW capacity) may be relevant if assessments show that setting up of second-generation ACFB units is relevant under Indian conditions. Operating experiences from such plants may be useful for India to identify potential application areas for CFB boilers while testing operation under different kinds of fuels. Co-firing using different kinds of coal and biomass/wood waste being demonstrated in the United States may find some niche application areas in India where a mix of coal and biomass can be used. Experiences from such ACFB projects in the United States may prove useful for the IPPs as well as industrial level power generators in India. Deployment
ACFB applications in India are likely to be attractive due to the inherent advantages associated with the technology. Primary among this are- fuel flexibility, load flexibility, lower O&M costs as compared to PC, and high boiler availability. Reliability and performance flexibility of CFB boilers has also seen continuous improvements through learning experiences. If controls are imposed on SO2 and NOX emissions, ACFB is likely to emerge as a choice technology. Analysis results show that for achieving the same degree of emissions control, levelized generation costs from ACFB boilers are lower than that for subcritical or supercritical PC technologies with FGD. For making deployment attractive, problems associated with ACFB operation such as substantial amount of solid waste generation and nitrous oxide emissions will need to be addressed. In India too, like in the United States, deployment opportunities for CFB units in the short-term primarily depend on its competitiveness relative to PC plants. Technology adoption by utilities is likely to be restricted. But regulation in India too, like in the US94, could drive CFB adoption by Independent Power Producers and increase deployment opportunities. There may be potentially attractive opportunities for repowering old PC plants with CFB technology where a lot of the existing plant infrastructure can be utilized along with elimination of auxiliary components- this could be economically attractive for utilization of low-grade fuel along with attaining low emissions advantage. Operating experiences from the Nucla repowering project in the United States may be useful to assess such possibilities. 5.3 PFBC
92 A Foster Wheeler plant employing supercritical steam conditions is scheduled to start up in Poland in 2006. 93 A 300 MW CFB plant operates at Jacksonville- this unit was set up with complete private financing a short while after setting up of another 300 MW demonstration unit at Jacksonville in 2000 (see Section 3.2.2, page 43). 94 The landmark Public Utilities Regulatory Policy Act (PURPA) drove AFBC adoption in the United States by IPPs.

86
R&D The fuel flexibility advantage of PFBC is similar to that of AFBC, and this technology
too may find some niche application areas in India for fuels that are unsuitable for utilization in PC plants. India needs to be cautious before embarking on PFBC development efforts. A review of US experiences in this area suggests that the likelihood of reaping economic benefits from PFBC development was very low even if research goals were fulfilled. India may need to carefully consider this aspect before embarking on any developmental efforts related to PFBC systems, especially related to first-generation ones that are likely to have limited deployment opportunities. First-generation PFBC systems are well developed and demonstrated, while key components of second-generation systems are being developed. Developmental efforts for second-generation systems will need to carefully assess their market potential as medium and long-term deployment opportunities for PFBC, in the context of competition from IGCC, may be limited. PFBC has potential to attain 45 percent efficiency with lower capital costs than IGCC or PC with wet scrubbers. This fact will need to tested under Indian conditions with respect to fuel quality and prices, as well as equipment costs (whether manufactured indigenously and/or imported) and operating conditions. Demonstration
First generation PFBC systems have been demonstrated and have proved their technical viability. It may be useful for India to look into learning experiences from the 70 MW Tidd demonstration project in the US. However, this should be preceded by an assessment of the scope and viability (both technical and commercial) for PFBC technology applications (first and second-generation systems) in the short, medium, and long-term. Demonstrations of first-generation PFBC system may be considered a transition strategy for second-generation PFBC development in India. Development of the latter hinges on advancements in hot gas cleanup ceramic filters and gas turbines, along with system integration.
Learning from first-generation PFBC demonstration experience in the United States is of limited utility because the Tidd project is the only one from which information could be available and two other demonstration projects failed to take off due to technical and economic problems. Looking into the details of the failure aspects for these projects may be useful before launching any kind of effort related to PFBC demonstrations in India. It may be relevant for India to look into deployment experiences in other countries such as Sweden, Spain, and Japan that have built PFBC plants based on Tidd PFBC demonstration. Deployment
PFBC systems offer significant design, performance, and environmental compliance advantages over AFBC technologies that increase their attractiveness for commercial deployment. The potential for niche application in India will need to be assessed, especially using fuels that are unsuitable for PC plants. PFBC deployment is likely to be attractive for retrofitting purposes due to their compact footprint, and modular construction ability that enables easier incremental capacity additions adjusted to the load growth.
The market potential for first-generation PFBC systems will need to be assessed under Indian conditions. U.S. experiences show that commercial deployment opportunities for first-generation systems are limited because they do not offer significant efficiency and/or economic advantages over conventional PC technology to justify their high capital costs. Access to cheaper capital for PFBC investment can bring down costs substantially. Levelised cost analysis shows that reducing the discount rate by half (from the reference scenario rate of 8 percent) brings PFBC generation costs below supercritical PC generation costs. The break-even natural gas price at which PFBC (first-generation) become competitive with NGCC is close to $5/GJ. Therefore it may be worthwhile for India to assess PFBC deployment opportunities as a hedging strategy in light of uncertainties associated with NG prices and embark on RD&D efforts related to PFBC.
5.3 PFBC

87
Learning experiences from demonstration projects have potential to lead to further advancements along with associated cost reductions that can significantly improve competitiveness.
Levelized cost analysis for the reference scenario shows that PFBC generation costs are higher than PC generation costs by almost 40 percent. Substantially higher cost of generation from PFBC (due to higher capital and O&M costs) as compared to conventional PC technologies is likely to restrict their deployment in the short-term. Under a scenario where limitations are imposed on SO2 emissions, efficiency advantage of PFBC does not outweigh its higher capital and O&M costs relative to subcritical PC technologies with FGD, unless coal prices are at a high at $3.5/GJ and beyond. With supercritical PC, PFBC generation is competitive only at a coal price of $4.5/GJ and higher. Therefore from the standpoint of emissions advantage too, first-generation PFBC is unlikely to emerge as an economic choice over super-critical PC except in niche application areas where waste fuels, which are unsuitable for use in PC, are to be utilized. In the area of SO2 and NOX emissions control, PFBC does not offer any advantages over PC fitted with pollution control technologies. Similar to AFBC, PFBC deployment will need to address problems associated with substantial amount of solid wastes generation and N2O emissions. CO2 emissions from first-generation PFBC plants are only marginally lower as compared to that from advanced PC technologies. Analysis for India’s reference scenario shows that emissions from PFBC are only 5 percent lower than supercritical PC. Levelized cost analysis shows that in terms of PFBC competitiveness with supercritical PC under different levels of carbon taxes, even at a high level of tax at $300 per tonne of carbon, PFBC generation cost is higher than supercritical generation costs. Even second-generation PFBC, with lower costs and better performance as compared to first-generation PFBC, is unlikely to be competitive with supercritical in the year 2020 up to a tax level of $200. Deployment opportunities for second-generation systems might be restricted due to slow progress in hot gas filter development, high turbine costs, and complex plant integration. Thus it seems unlikely that PFBC emerges as an economic choice over supercritical under a scenario that imposes strict penalty on carbon emissions. IGCC becomes competitive with PFBC only at a carbon tax level of $200 and higher in 2020. 5.4 IGCC R&D
Ongoing R&D efforts in IGCC are geared towards development of second-generation systems with 47 percent or greater efficiencies. The development hinges primarily on advancements in high performance gas turbines that can handle firing at high temperature and hot gas cleanup systems. A limitation on carbon emissions is likely to initiate R&D on firing gas turbines with hydrogen instead of syngas. Scaling up of IGCC units is critically dependent on gas turbine development with higher firing temperatures. So far, current technology has been scaled up to 530 MW, and 600 MW unit sizes are likely to evolve by 2011. Another key issue in IGCC development is optimized systems integration. Future IGCC plants are likely to demonstrate 45 percent efficiency. But attaining 60 percent efficiency (HHV) (equivalent to 66 percent efficiency based on LHV) targets with fuel flexible-gasification technology, in consonance with DOE’s Vision 21 objectives, requires significant technological advancements. This is required in the areas of advanced materials for the bottoming cycle of an IGCC system, single-train gasifiers in 400 to 500 MW capacity range, low-cost oxygen separation plants, and improved refractories (that would address low reliability concerns surrounding gasifiers). Other development areas are ensuring consistently high-level of syngas quality, and potential for low NOX technology (catalytic combustion) using coal syngas.

88
Demonstration First-generation IGCC plants are in operation as demonstration facilities in the United
States. These plants demonstrated efficiencies of close to 38 and 40 percent at the Polk Power station and Wabash River site, respectively. Further demonstrations are required in the areas of improved gasifier availability, higher cold gas efficiency, and fuel flexibility. Learning experience from these projects is likely to be relevant for India, primarily in terms of operating and environmental performances. Considerable modifications are expected from U.S. experiences due to the hugely different quality of Indian coal from what was used in these plants. Economic estimates, derived from the U.S. projects, would have to be applied in the Indian context and U.S. experiences may provide some guidelines towards cost estimations. A crucial aspect of demonstration would be to test operation of several subsystems of an IGCC at full-commercial scale, as systems analysis is one of the key aspects of IGCC development. India at present is planning to set up a 100 MW IGCC demonstration project by NTPC, with USAID support. In the United States, further demonstrations are taking place for the operation of a fuel cell with syngas from a coal gasifier that could provide information for design of an integrated gasification fuel cell system (IGFC) with expected efficiency levels of 50 to 60 percent. This development aspect gathers relevance as part of efforts for transition to a hydrogen economy. Demonstrations in these areas are likely to be undertaken in India only if first-generation IGCC projects have been demonstrated successfully. There remains a need to assess viability of polygeneration options for India that has the potential to significantly improve IGCC market potential by providing economies of scope. Deployment
The primary driver for IGCC deployment is its superior environmental benefits as compared to combustion-based coal technologies. IGCC is the only coal-based technology that offers both ease and cost-effectiveness of CO2 separation from the flue gas stream for sequestration purposes, and most effective control of mercury. For the Indian situation, IGCC deployment is likely to gather relevance if meeting these environmental objectives assume importance, especially meeting mercury regulation standards. Analysis for the Indian case shows that first-generation IGCC without carbon capture has potential to reduce CO2 emissions by a tenth as compared to emissions from supercritical PC and by a fifth as compared to less efficient subcritical PC technologies.
In spite of successful demonstration projects for IGCC, there remains a high-risk perception among utilities and investors, which has hindered wider commercialization. This gap between IGCC demonstrations and commercial deployment needs to be addressed by some form of cost buy-down mechanisms for the technology in its early deployment phase. It is likely that risk mitigation instruments in the form of federal and regulatory incentives, guarantees and warranties, may be necessary for buying down the costs of the first initial units. Though operational and environmental performances of first-generation IGCC systems have been well demonstrated, there remain substantial reliability and availability concerns that restrict commercial deployment opportunities. Operating uncertainties remain due to difficulties in starting-up and shutting down (primarily due to difficulties in preheating and cooling down of the extensive refractory material), which hampers operational flexibility.
For present IGCC systems, achieving 90 percent availability required for commercial deployment in power applications remains challenging. While the Polk Power Station plant, operating commercially since completing demonstration in 1991, achieved significant improvements in plant performance and reliability over its operating years. Operational problems associated with gas turbine operations as well as managing high catalyst replacement rates (along with high associated costs) remain as hurdles. IGCC will further need to demonstrate its ability to handle wide variety of feedstock fuels because very often the IGCC design is tied to handling a

89
particular kind of feedstock. Fuel flexibility can promote deployment options and improve plant competitiveness. For example, Tampa and Wabash plants in the United States operate extensively on blends of coal and lower cost petroleum coke or coke alone (prices of a blend of coal and pet coke could be only a third of coal prices) in order to be able to generate power at competitive rates and qualify as the least cost dispatch units. In situations where IGCC is operated with different kinds of fuel, high levels of reliability, availability, and maintainability (RAM) of the IGCC system may become challenging.
The competitiveness of IGCC systems is further hampered by higher upfront capital costs and substantially higher O&M costs (especially related to refractory material) as compared to conventional technology. Levelized cost analysis for the Indian case shows that under the reference scenario, IGCC generation costs are almost 50 percent higher as compared to the generation costs from conventional PC technologies. Access to cheaper capital for investments in IGCC can bring down generation costs substantially. Lowering the discount rate by half to 4 percent from the reference rate of 8 percent brings down generation costs by a fifth and makes it competitive with subcritical PC plants with FGD. Further lowering of the discount rate to 2 percent can bring down IGCC generation costs even below supercritical PC generation costs. Capital access at a lower cost can be used as an incentive for buying down IGCC costs from First-Of-A-Kind plants. First generation IGCC plant costs are estimated to be 10 to 25 percent higher than costs of future plants and therefore the competitiveness of IGCC is likely to increase significantly in future. Levelised cost analysis in the Indian context shows that the efficiency advantages of first-generation IGCC do not outweigh its substantially higher capital and O&M costs even when coal is priced as high as $4/GJ. At this and higher coal price, IGCC is competitive with sub-critical PC w/FGD. But in comparison to super-critical PC, it has 10 percent higher generation costs. Therefore it is unlikely that first-generation IGCC will emerge as an economic choice over super-critical PC unless there are significant advancements in reducing costs and/or increasing efficiency in IGCC systems. In the context of IGCC’s competitiveness with natural gas based generation technology, levelized analysis under India’s reference scenario shows that the break-even natural gas price at which IGCC (first-generation) become competitive with NGCC is between $5 to 5.5/GJ.
Under a scenario that imposes penalty on carbon emissions, supercritical PC has lower generation costs than IGCC even when the penalty is as high as $300 per tonne of carbon tax. With assumptions on second-generation IGCC development that presumes significant cost and performance improvements, IGCC emerges as an economic choice over supercritical only at tax level of $200 per tonne of carbon and higher in the year 2020. At this level of tax, it also emerges as an economic choice over PFBC. Thus, considerably high penalties on carbon emissions (at the level of $200/tonne of carbon tax and higher) are likely to induce IGCC as an economic choice over other coal technologies such as supercritical PC and PFBC. But what may be interesting to observe is that IGCC competitiveness is significantly enhanced under a scenario that considers carbon capture and sequestration – analysis results show that under such a scenario, the break-even tax level at which IGCC emerges as an economic choice over supercritical PC and PFBC is around $75 per tonne of carbon, bringing it down considerably from the $200 level in the previous scenario. Thus addressing climate change concerns that include carbon capture and sequestration are likely to significantly enhance deployment opportunities for IGCC. As has been suggested by other authors (Holt et.al., 2003), the competitiveness of IGCC under such a scenario can be further improved by using the carbon tax proceeds as credits for the CO2 captured that would enable capture and sequestration technologies to compete at a lower carbon tax. One may explore repowering opportunities of existing PC plants with IGCC under Indian conditions because repowering of existing PC plants with IGCC has potential to achieve 5 to 10 percentage point improvements in efficiency and almost 20 percent reductions in costs by optimizing the use of existing infrastructure. This has been successfully demonstrated in the US

90
at the Wabash River project where a 1950s PC plant with 33 percent efficiency was repowered to a 262 MWe IGCC plant with almost 40 percent efficiency. Significant economies of scope could be realized by deploying IGCC for polygeneration purposes, i.e., developing coal-based chemical processing as an adjunct to electricity production with an IGCC system. Before that, a systematic assessment of polygeneration option for India will need to be undertaken. There remain reliability concerns in the area of integrating chemical plant operations with power plant operations and that will have to be overcome. 5.5 Cross-cutting issues Systematic technology assessment studies
Systematic studies to assess ERD3 opportunities in the Indian context with respect to different categories of coal technologies need to be conducted, so as to be careful not to pick the ‘winner’ technology a priori to launching RD3 efforts. The market potential for each of the technology categories needs to be assessed in the Indian context. These assessment studies are at present few and far between95. Such assessment studies are much more common in the United States that serve as policy guideline and feedback tools. It may well be worth for Indian stakeholders to look into assessment studies existing in the U.S. context and the manner in which they were applied for formulating technology strategies. Lessons from other country’s experiences such as the United States need to be evaluated in the Indian context in terms of criteria affecting technology choice. Country specific assessments should take into account technology and fuel characteristics, economic considerations, fulfillment of environmental objectives, ensuring energy security, and meeting national development priorities. Technology costs and competitiveness will need to be assessed on a project-specific basis. Consideration of fuel characteristics is especially important because of the vastly different nature of coal between the two countries. Technology costs and characteristics are likely to depend on the availability of indigenous development and manufacturing capabilities vis-à-vis the need for imports and technical collaborations. Availability of spares, materials and components is an important factor affecting technology choice. This is especially relevant for technologies such as IGCC that integrates a large number of different components with specific servicing requirements. Construction complexities may also be considerably higher for advanced technologies such as IGCC and may be one of the factors hindering technology adoption. Added to that is the consideration of availability of skilled manpower to undertake such construction activities.
The choice of technology and the plant capacity is determined by the size and nature of forecasted demand for base, intermediate, and peak power. India is expected to face a large increase in base demand for electricity and therefore significant opportunities exist for building large capacity base load plants. Other than the size and nature of demand, other external factors too are likely to influence capacity choices. Many places in India suffer from lack of adequate transmission capacity that may pose constraints in optimal capacity utilization and plant operations. A factor likely to affect technology choice for repowering of existing plants for capacity additions and performance enhancements is space requirement for new capacity additions. For example, in Germany, several coal fired plants in Germany have been re-powered
95 There are existing studies that incorporate considerations for advanced clean coal technology deployment in India. A recent IEA report (IEA, 2000) indicates that circulating fluidized bed combustion and pressurized fluidized bed combustion technologies are likely to be the preferred options from a technical considerations since they are amenable towards efficient utilization of low quality coal. Fluidized bed plants could also be potentially deployed at washeries for utilization of washery rejects. However, concerns remain on their commercial deployment. Also they are highly unlikely to be deployed in India in the short-term due to capital and financial constraints facing the electricity sector.

91
with AFBC where not enough space was available to fit a new PC boiler and FGD. The other factor that requires careful and simultaneous consideration during capacity planning is the issue of reliable coal supply, especially since a large number of existing plants continue to experience interruptions and suffer from poor quality coal supply. Ensuring reliable coal supply of appropriate quality is a key consideration during planning for new capacity. Assessment of competitiveness among alternate technologies should also incorporate coal-washing costs and associated plant performance improvements for a specific technology choice. Technologies that can utilize low-grade fuel such as fluidized bed and gasification technologies may be appropriate under conditions where coal is not likely to be washed. Integration of fuel market and electricity market reforms As already discussed, India has huge domestic reserves of coal with limited domestic reserves of natural gas. Economic and security concerns dictate that the coal is likely to occupy a dominant position in the country’s future energy landscape over a long time in the future. In spite of the significant domestic reserves of coal, underdevelopment of the coal market and inefficiencies in terms of supply, pricing, and institutions are prompting a shift to increasing reliance on natural gas with an attendant rapid growth in natural gas based capacity. A part of the gas requirements are being met using domestic reserves of gas, but a large portion of the capacity growth is being planned on imported LNG96 as domestic reserves are limited. Due to the inherent risks associated with coal supply in terms of supply quality and reliability as well as price distortions, most of the of the private investors in the power sector are building natural gas based plants and even the federally owned, NTPC, is planning a substantial portion of its future capacity growth on natural gas. The existing infrastructure for coal supply remains inadequate and many of the existing plants experience supply shortages. Planning for capacity expansion for meeting future growth in demand is not very well specified and there are significant barriers in terms of access to and availability of financing. The path of increasing reliance on imported natural gas for the future caused primarily by an underdeveloped coal market in India raises significant economic and security concerns because of increasing vulnerabilities to natural gas price and supply fluctuations. In this context, it may be worthwhile for India to learn from some of the recent U.S. experiences where current high natural gas prices and future expectations of high prices have provided an impetus for coal technology development and deployment efforts. As the analysis in the paper shows, in the Indian context, competitiveness among coal and gas technologies is extremely sensitive to natural gas price variations and coal technologies emerge competitive with combined cycle gas turbine technologies at relatively low levels of natural gas prices of $3.5/GJ and higher. Reforms aimed at improving efficiency of the electricity sector should be pursued simultaneously with coal market development that seeks alterations in the present institutions, actors, supply, and prices. Some initiatives have already been taken, but much remains to be accomplished. It is necessary at the national policy planning level to have a coherent vision for the electricity and coal sectors in India that integrates objectives for both sectors. This in turn could evolve into strategic planning for investments in different coal technologies that would enable utilization of the fuel in the most efficient manner. Without simultaneous pursuit of coal and electricity market reforms, a clean coal technology vision for India is likely to fall short of attaining its objectives.
96 Over the next decade, India’s demand for natural gas is projected to exceed supply. To reduce the supply gap, India has negotiated a 25-year import agreement for 7.5 million metric tons of LNG annually from Rasgas of Qatar. Rasgas will supply the first two-regasification terminals in India, which are expected to come on line in 2004, with capacities of 5.0 and 2.5 million tons per year. Shell, BG, and other companies are competing to enter India’s LNG market, negotiating innovative pricing deals with NTPC, to accommodate current political difficulties involved in setting end-user tariffs. (EIA, 2004).

92
Inter-sectoral linkages and interdependencies Conducting research in crosscutting areas such as materials development, and development of advanced turbines is essential for innovation in clean coal technology development. U.S. experiences illustrate the significant investments in conducting research in these areas and how these development efforts were integrated with R&D in coal based technologies. India’s efforts are not comprehensively integrated with electricity sector technology development efforts and existing linkages remain weak. Integrating capabilities existing in related sectors with electricity sector development efforts and setting up of institutional linkages along with explicit program targets and objectives would be key to progress in advanced coal based technologies. Activities undertaken by the Central Power Research Institute (CPRI), the federal R&D organization, is constrained by the availability of human and financial resources. Most of the work undertaken by CPRI is in the area of transmission and distribution with work on generation technology development almost non-existent. CPRI’s role needs to be strengthened and its efforts co-coordinated and integrated with other public and private technology development efforts. For some technologies such as IGCC, significant economies of scope could be realized if development and deployment activities are directed towards both electricity and chemicals sectors. For that it may be useful to integrate plans and programme objectives for development and deployment of IGCC in both these sectors. Clean coal technology roadmap – no ‘silver bullet’, portfolio approach needed.
U.S. experiences in development and deployment of advanced coal technologies involve a mix of different technologies with varying stages of progress and future development objectives depending on characteristics such as state of technology development, maturity of the technology, construction time, plant size, fuel flexibility, thermal efficiency, operating and environmental performance, availability-reliability-maintainability and economics of plant installation and operation. An assessment of India’s clean coal technology choices also indicates that there is no silver bullet in terms of one technology that overcomes all the challenges. India requires the development of a portfolio of clean coal technologies with varying degrees of RD3 efforts across these technologies depending on short, medium and long-term targets aimed at fulfillment of macroeconomic, security, and environmental objectives. Analysis in this paper shows that supercritical PC technology emerges as a robust option across different scenarios. Supercritical PC technology is a commercially mature technology with diverse operating experiences in different countries. In the short and medium term, it may be worthwhile for India to direct development and deployment efforts for this technology. But at the same time, advanced PFBC and IGCC technologies also emerge as attractive options for the future, and these technologies are still in the demonstration stages elsewhere in the world. For these technologies, development and demonstration activities could be initiated. But investing in them is likely to depend on the demonstrated and commercial performances of these technologies in developed countries and learning from these experiences. IGCC’s superior environmental performance as compared to other coal technologies may emerge as a driver for added thrust on its development, especially in the context of future regulations on mercury emissions and global climate change concerns.
For technologies such as CFBC that are achieving operating successes with scaled-up unit sizes, utilities as well as independent power producers could explore near-term opportunities for deployment in areas where fuels suitable for conversion in fluidized bed combustion units exist. Like in the U.S. case, development of a clean coal technology roadmap for India that outlines RD3 efforts in different advanced coal technologies will help prioritize the country’s needs in moving towards a sustainable energy future dependent on coal. Environmental regulations as likely drivers for clean coal RD3 efforts
The primary driver for clean coal technology development and deployment efforts in the United States has been environmental concerns and their associated regulations. Compared to the

93
United States and other developed countries, environmental legislation, implementation, and enforcement remain weak in India with attendant weaknesses in capabilities of institutions associated with formulation of regulations and their implementation and monitoring. The present situation along with uncertainties with respect to future regulations poses barriers for utility investments in generation technologies with enhanced environmental performance. Primary environmental concerns related to coal based electricity generation in India are particulate emission problems, fly ash utilization and disposal. The poor performance of generating plants in India with respect to particulate emissions control is much more of an institutional and enforcement problem rather than a technological problem97. No current regulations on SO2 emissions exist, but they are likely to be strengthened in the future. Therefore post-combustion SO2 control technology such as FGD retrofitted with existing PC plants as well as with new plants is likely to gain increasing relevance. The analysis in the paper shows that supercritical PC fitted with FGD emerges competitive with subcritical PC fitted with FGD and therefore the former is likely to emerge as the technology of choice. CFBC would be an appropriate technology for utilization of low-grade fuel and in areas where SO2 emissions require control. Advanced technologies such as PFBC and IGCC are also able to achieve superior performance in terms of SO2 emissions control, albeit at much higher costs. Therefore local environmental regulations that necessitate SO2 emissions reductions are unlikely to be drivers for engaging in RD3 efforts of these two technology categories. However, IGCC has unique advantages in terms of mercury emissions control making the likely future concerns on mercury emissions control more prone to emphasizing the merits of IGCC. In the context of addressing climate change concerns and on assessment of technologies that emerge competitive under a global carbon price regime, analysis in the paper shows that high efficiency technologies such as second-generation PFBC and IGCC emerge competitive with supercritical PC only under carbon prices of $200 per tonne of carbon and higher. However, incorporating the potential carbon capture and sequestration benefits of IGCC into the analysis brings down the carbon price to around $100 per tonne at which price IGCC emerges competitive with supercritical PC and PFBC. A thrust on IGCC development and deployment efforts from the point of view of addressing climate change concerns will therefore have to be pursued for its own sake, as technology assessments point to a disjoint between technology choices and competitiveness among technologies for addressing local and global environmental concerns. Stakeholder participation, information and awareness
A majority of the power plant owners in India face significant barriers regarding investments in capital-intensive, higher performance generation technologies. Almost two-thirds of the generation capacity in India is owned by state level utilities that continue to face a precarious financial situation. In most cases, these utilities do not have sufficient capital to meet operating expenses, let alone to invest in additional capacity. The shortages of investments and in terms of resource availability in the electricity sector is one of the prime reasons that the sector continues to fall short of building additional capacity to meet increasing demand. Reforms aimed at overcoming this situation with alterations in institutional structures, rationalization of electricity pricing, and steps towards lowering of distribution losses are slow and cautious. Under this situation, a majority of power plant owners are simply not in a position to invest in additional capacity without substantial support from the federal government. In addition to the investment constraints, state level utilities also sometimes lack institutional capabilities to engage in
97 As already mentioned, it is mandatory for all power plants to be fitted with an ESP with 99 percent particulate removal efficiency. But very often, actual performance falls short of set standards due to technical problems as well as failure of the state-level pollution control agencies to undertake strict monitoring and enforcement of standards.

94
technological advancements due to lack of human resources in terms of skills and knowledge availability, training level of personnel, and managerial capabilities.
The National Thermal Power Corporation, the federally owned utility, has undertaken most of the efforts with respect to technological advancements. It has also been engaged in much of the international co-operation efforts in technical collaborations in electricity generation till now. The majority of the power plant owners, i.e. the state level utilities, have limited participation in such efforts, however. There remains an urgent need to bring more of the power plant owners belonging to this group in planning and participation towards an advanced technology future in electricity generation. There is limited private participation in coal-based electricity generation and most of the private investment is taking place in natural gas based combined cycle technologies. For these private independent power producers the criteria for decision-making in investment decisions is often based on short-term risk evaluation rather than on long-term life-cycle costs. Similar to the situation in the United States, this is leading to private independent power producers in India favoring investments in natural gas based capacity rather than in coal. IPPs favor modest capacity additions that can be easily installed.
Barriers in setting up capital intensive, relatively complex, large capacity plants are significant. Institutional imperfections and inefficiencies in the coal industry further favor private choices towards natural gas. In a study conducted by the IEA that included a systematic survey of factors affecting foreign IPP decision-making in making technology choices in developing countries, reliability, technology cost, and financing constraints were voted the most important factors influencing decision-making in technology choices (IEA, 1998). Common perception exists on higher capital and operating costs, risk of reduced reliability in plant operations (both among IPPs and among engineering and technology supply partners) for advanced technologies. The technical barriers and risk perceptions vary considerably with the technology type- so a way forward would be to learn from other country experiences, conduct systematic technology assessment studies for India, and greater information dissemination on demonstrated technology costs and performances. Advanced technologies such as PFBC and IGCC have significant reliability, availability, and maintainability concerns along with higher O&M costs as compared to conventional coal technologies. Higher first-of-a-kind and technology risk factors that accompany less mature technologies pose financing difficulties. Lowering of technology costs as well as removal of perceptions on technical barriers are likely to be primarily derived from learning experiences and may be difficult to achieve unless a number of plants are built. Therefore, mechanisms would be needed for buying-down costs of the few initial units being built. There are also further economies to be realized in a more expanded system that includes fuel production, delivery, combustion, and electricity transmission. Higher cost perception is also due to higher risk premium in project-financed IPP plants but innovative financing arrangements that reduce risk premium and make IPP investment attractive in advanced technologies are likely to address this barrier. Drawing from U.S. experiences, such private investments are unlikely without significant public participation in technology demonstration activities. Other relevant factors guiding decision-making are government regulations, maintainability of the technology, technology risk and lender attitudes, technology maturity and environment. Among criteria ranking, the need for skilled operators scored low as it was relatively easy to find and train operators. Training and capacity development as well as availability of skilled resources is unlikely to be a constraint towards advanced technology development efforts in India, but programs need to be designed to be able to address these requirements. Fuel cost was perceived to be a disincentive towards improving efficiencies. Reforms in the coal industry with likely improvements in coal supply quality and reliability along with economic attractiveness prospects of advanced coal technologies are likely to induce greater private participation in this sector. Along with generators and coal suppliers, there needs to be increased participation of other relevant stakeholders such as foreign and domestic equipment manufacturers, banks and financial institutions, environmental agencies, regulatory organizations, research institutes, non-

95
governmental organizations, and policy makers across different relevant government departments. An institutional mechanism for interactions among these different groups of actors should be set up along with linkages for collaborations with foreign institutes and actors. This would enable information dissemination and awareness among the different groups on demonstrated technology costs and performances of different technologies, and assessment of technology choices over the short, medium, and long term. Public policy initiatives One of the primary areas in which greater public initiatives are needed is the integration of sectoral policies relevant to clean-coal technology development and deployment efforts across different government portfolios handling energy and environment issues- some of these include departments handling coal (Ministry of Coal), electricity (Ministry of Power), environment (Ministry of Environment and Forests), natural gas (Ministry of Petroleum and Natural Gas), and renewables (Ministry of Non-Conventional Energy Sources). The functioning of these entities very often lack sufficient co-ordination and policy objectives are segregated. Efforts should be made towards developing a long-term energy technology strategy for India of which clean coal technology efforts form a part. Such efforts could include representatives from these different government departments, but should preferably be coordinated by a single entity. This will enable integration of coal policies within the broad energy policies and objectives over the short, medium and long term. It will also facilitate creation of a ‘technology roadmap’ that outlines prioritization of technology ERD3 efforts over a specific time frame. Current public investment in clean technology R&D efforts is at best non-existent, other than the activities undertaken by NTPC. As is evident from U.S. experiences in clean coal technology development and demonstration efforts, government needs to play a significant role in setting-up mechanisms for public-private partnerships, making substantial investments in R&D activities and share risks in demonstration projects. Without government participation and investment in development and demonstration activities, both private and foreign participation in advanced technology demonstration and deployment efforts are likely to remain restricted. The capability of public institutions in undertaking R&D activities need to be strengthened in terms of greater resource availability as well as building stronger capabilities of the personnel involved in such activities. Stronger regulatory measures are likely to induce advanced technology development and deployment efforts. Such measures can include setting performance standards for power plants and requirements for benchmarking of performance against those standards. Also stricter environmental regulations with respect to emissions and waste disposal from power plants would be necessary for enhancing clean coal technology deployment efforts. Along with stricter legislation, implementation and monitoring measures need to be strengthened and current institutional weaknesses with respect to these activities strengthened. Last, but not the least, greater initiatives are needed on part of the government to generate mechanisms for international co-operation in advanced coal technology RD3 efforts involving different groups of public and private stakeholders. 5.6 Scope for further research The present work has attempted to lay a foundation for assessing technological options for India that is likely to facilitate decision-making with respect to technological choices and priorities with respect to advancements in coal-based electricity generation technologies. Based on a discussion of RD3 opportunities mentioned in this report, there remains ample scope for engaging in field-research activities in India that involve interactions with a variety of stakeholders who are currently engaged in RD3 efforts and are likely to be in future activities. Some of these stakeholders are power plant equipment manufacturers, public and private utilities, independent generators, coal supply and transportation companies, environmental agencies, policy makers at different levels (federal, state, and local) and in different government

96
departments, financing institutions and funding agencies, non-governmental organizations, and international agencies and institutions. There are five areas deserving of further research and analysis: (1) a systematic review of the existing efforts in India with respect to advancements in coal-based electricity generation technologies in terms of the activities that different sets of actors and institutions have been and are engaged in; (2) a field-level assessment of the need for clean-coal technology development and deployment, both in terms of existing plants as well as new capacity additions; (3) identification of specific areas in which clean-coal technology development and deployment opportunities exist in the short, medium, and long term, and identification of the barriers and opportunities in these areas; (4) technology assessment studies under existing Indian policies as well as likely future policy scenarios, formation of a hierarchy of clean coal technology options based on a set of criteria developed that addresses economic, environmental, and security concerns in the country; and finally, (5) suggestions for specific policy interventions that would promote and enhance clean-coal technology development and deployment efforts in the country.

97
References Banales-Lopez Santiago, Vicki Norberg-Bohm. 2002. ‘Public Policy for Energy Technology Innovation- a historical analysis of fluidized bed combustion development in the USA.’ Energy Policy 30 (2002) 1173-1180 Beer. J.M. 2000. ‘Combustion technology developments in power generation in response to environmental challenges.’ Progress in Energy and Combustion Science 26 (2000) 301–327 CEA (Central Electricity Authority). 1999. Power on Demand by 2012, Perspective Plan studies. New Delhi, India. CEA (Central Electricity Authority), 1999a. Perspective Transmission Plan 2011-2012. New Delhi, India. CMIE (Centre for Monitoring Indian Economy). 2003. India’s Energy Sector. Mumbai, India. Couch, G.R., 1999. Non-OECD Coal-Fired Power Generation—Trends in the 1990s. IEA Coal Research, London. 30 October–3 November 2000. Der Victor K. 2003. Future Gen: The Energy Plant of the Future. Presented at Gasification Technologies Conference 2003, San Francisco, October 12-15, 2003. Derenne Steve. 2003. Plant Economics, Performance, and Reliability. Paper presented at Gasification Technologies Conference 2003, San Francisco, October 12-15, 2003. DOE (Department of Energy). 1999. Clean Coal Technology Evaluation Guide, Final Report. U.S. Department of Energy, Assistant Secretary for Fossil Energy. Washington, DC 20585, December 1999 Department of Energy (DOE). 2001. Clean Coal Technology Demonstration Program: Program Update 2000, As of September 2000. U.S. Department of Energy, Assistant Secretary for Fossil Energy. Washington, DC 20585, April 2001. DOE (Department of Energy). 2001a. Clean Coal Today Newsletter. DOE/FE-0215P-53, Issue No. 53, Spring 2003. Department of Energy, Assistant Secretary for Fossil Energy. Washington, DC 20585. DOE (Department of Energy). 2002. Major Environmental Aspects of Gasification-Based Power Generation Technologies, Final Report, December 2002. Office of Fossil Energy, National Energy Technology Laboratory (NETL), Pittsburgh, PA. DOE (Department of Energy). 2003b. Clean Coal Technology Programs: Project Fact Sheets 2003. Includes Clean Coal Technology Demonstration Program, Power Plant Improvement Initiative, and Clean Coal Power Initiative Projects As of May 2003. U.S. Department of Energy, Assistant Secretary for Fossil Energy. Washington, DC 20585, October 2003 DOE (Department of Energy). 2003d. Volume 1 Clean Coal Technology Programs: Program Update 2003- Includes Clean Coal Technology Demonstration Program, Power Plant Improvement Initiative, and Clean Coal Power Initiative Projects As of May 2003. U.S. Department of Energy, Assistant Secretary for Fossil Energy. Washington, DC 20585.

98
DOE (Department of Energy). 2003e. Volume 2 Clean Coal Technology Programs: Completed Projects 2003. Includes Completed Clean Coal Technology Demonstration Program Projects As of May 2003. U.S. Department of Energy, Assistant Secretary for Fossil Energy. Washington, DC 20585, December 2003 DOE (Department of Energy). 2004. Clean Coal Today Newsletter. DOE/FE-0215P-54, Issue No. 54, Summer 2003. Department of Energy, Assistant Secretary for Fossil Energy. Washington, DC 20585. DOE (Department of Energy). 2004a. FutureGen- Integrated Hydrogen, Electric Power Production and Carbon Sequestration Research Initiative. March 2004. DOE (Department of Energy). 2004b. ‘President’s Clean Coal Initiative Attracts “Second Wave” of Technologies.’ Techline, July 26, 2004. http://www.netl.doe.gov/publications/press/2004/t1_CCPI_round2_proposals.html EIA (Energy Information Administration). 2004. International Energy Outlook (IEO) 2004. Energy Information Administration (EIA), 2004. EPRI (Electric Power Research Institute). 2002. Ultrasupercritical Steam Turbines: Design and Materials Issues for the Next Generation. Technical Report. . EPRI, Palo Alto, CA. March, 2002. EPRI (Electric Power Research Institute). 2002a. Atmospheric Fluidized Bed Combustion Guidebook- 2002 Update. EPRI, Palo Alto, CA. December, 2002. Garg Amit, P.R. Shukla. 2002. Emissions Inventory of India. Tata McGraw-Hill Publishing Company Limited, New Delhi, India. Ghosh Debyani. 2001. Long-Term Technology Strategies and Policies for Indian Power Sector. Doctoral dissertation, Indian Institute of Management, Ahmedabad, India. Goidich Stephen J., Ragnar G. Lundqvist. 2001. ‘The Utility CFB Boiler- Present Status, Short and Long Term Future with Supercritical and Ultra- Supercritical Steam Parameters’ Foster Wheeler Power Group, Inc., Perryville Corporate Park, Clinton, NJ, USA and FW Energia Oy, Finland. Presented at PowerGen Europe 2002 Milan July 11-13, 2001 Hirsh, Richard F. 1989. ‘Technical limits to progress in the 1960s and 1970s’, Chapter 7 in Technology and Transformation in the American Electric Utility Industry. Cambridge University Press. Holt Neville, George Booras, and Douglas Todd. 2003. ‘A Summary of Recent IGCC Studies of CO2 Capture for Sequestration’. Paper presented at The Gasification Technologies Conference San Francisco, CA October 12-15, 2003. Hooper Max. 2003. Waste Coal to Ultra Clean Fuels- applying the Shell Coal Gasification Process. Paper presented at Gasification Technologies Conference 2003, San Francisco, October 12-15, 2003. International Energy Agency (IEA), 1996. Factors affecting the take up of clean coal technologies. Paris, France.

99
International Energy Agency (IEA), 1998. Regional Trends in Energy-Efficient Coal-Fired Power Generation Technologies. Paris, France. International Energy Agency (IEA), 2000. Coal in the Energy Supply of India, Paris, France. Joskow Paul L., Nancy L. Rose. 1985. ‘The Effects of Technological Change, Experience, and Environmental Regulation on the Construction cost of Coal-burning generating units.’ The Rand Journal of Economics, Vol.16, no.1 (Spring 1985), 1-27. Kavidass S., Anderson G.L., Norton G.S. Jr. 2000. ‘Why Build a Circulating Fluidized Bed Boiler to Generate Steam and Electric Power?’ The Babcock & Wilcox Company, Barberton, Ohio, U.S.A., Presented at PowerGen Asia 2000, September 20-22, 2000, Bangkok, Thailand Kavidass S., Walker D.J., Norton G.S. Jr. 1999.‘IR-CFB Repowering: A Cost-Effective Option for Older PC-Fired Boilers’ The Babcock & Wilcox Company, Barberton, Ohio, U.S.A., Presented at POWER-GEN International ’99, November 30-December 2, 1999, New Orleans, Louisiana, U.S.A. Lookman Aziz A., Rubin Edward S. 2002. ‘Barriers to adopting least-cost particulate control strategies for Indian power plants.’ Energy Policy, Vol.26, No.14, pp 1053-1063 Mathur Ritu, Chanda Sharat, Tezukab Tetsuo. 2003. Optimal use of coal for power generation in India. Energy Policy 31 (2003) 319–331 McDaniel John E., Marck Hornick. 2003. POLK Power Station IGCC: 7th year of commercial operations- October 2002 to September 2003. Paper presented at Gasification Technologies Conference 2003, San Francisco, October 12-15, 2003. MOP (Ministry of Power) (2005). Ministry of Power, India- http://powermin.nic.in/JSP_SERVLETS/internal.jsp Mittal Moti L., C. Sharma. 2004. Anthropogenic Emissions from Energy Activities in India: Generation and Source Characterization. Emission from Thermal Power Generation in India. Part I. Ohio Super Computer Centre. http://www.osc.edu/research/pcrm/emissions/India.pdf NCC (National Coal Council). 2000. Research and Development Needs for the Sequestration of Carbon Dioxide as part of a Carbon Management Strategy, May 2000, Washington D.C. NCC (National Coal Council). 2001. Increasing Electricity Availability from Coal-fired Generation in the Near-Term, May 2001, Washington D.C. NCC (National Coal Council). 2002. Increasing Coal-Fired Generation Through 2010: Challenges & Opportunities, May 2002, Washington D.C. NCC (National Coal Council). 2003. Coal-Related Greenhouse Gas Management Issues, May 2003, Washington D.C. NRC (National Research Council). 1995. Coal- Energy for the Future. Committee on the Strategic Assessment of the U.S. DOE’s Coal Program, Board on Energy and Environmental

100
Systems, Commission on Engineering and Technical Systems, National Research Council. National Academy Press, Washington D.C. NRC (National Research Council). 2000. Energy Research at DOE- was it worth it? Energy Efficiency and Fossil Energy Research 1978 to 2000. Committee on Benefits of DOE R&D on Energy Efficiency and Fossil Energy, Board on Energy and Environmental Systems, Division on Engineering and Physical Sciences, National Research Council, National Academy Press, Washington D.C. NRC (National Research Council). 2000a. Vision 21: Fossil Fuel Options for the Future. Committee on R&D Opportunities for Advanced Fossil-Fueled Energy Complexes, Board on Energy and Environmental Systems. Commission on Engineering and Technical Systems, National Research Council, National Academy Press, Washington D.C. NRC (National Research Council). 2003. Vision 21. Review of DOE's Vision 21 Research and Development Program -- Phase 1 (2003). Committee to Review DOE’s Vision 21 R&D Program—Phase I, Board on Energy and Environmental Systems. Division on Engineering and Physical Sciences, National Research Council, National Academy Press, Washington D.C. NTPC (National Thermal Power Corporation). 2004. Annual Report 2003-2004. http://www.ntpc.co.in/ Oskarsson Karin, Anders Berglund, Rolf Deling, Ulrika Snellman, Olle Stenback, Jack J. Fritz 1997. ‘A Planner's Guide for Selecting Clean-Coal Technologies for Power Plants.’ World Bank Technical Paper No.387, The World Bank, Washington, D.C. Papay Lawrence T., Linda K. Trocki. 1997. ‘Clean Cal Technology Deployment: From Today Into the Next Millenium’. Paper presented at Fifth Annual Clean Coal Technology Conference at Tampa, Florida, January 7-10, 1997. Perkins, Richard. 2005. ‘Electricity sector restructuring in India: an environmentally beneficial policy?’ Energy Policy 33 (2005) 439–449. Rose Nancy L., Paul L Joskow. 1990. ‘The Diffusion of New Technologies: Evidence from the Electric Utility Industry.’ The Rand Journal of Economics, Vol.21, No.3 (Autumn 1990), 354-373.
Rosenberg, William G., Dwight C. Alpern, and Michael R. Walker. 2004. Deploying IGCC in This Decade with 3 Party Covenant Financing: Overview of Financing Structure. Belfer Center for Science and International Affairs, Kennedy School of Government, Harvard University, July 2004.
Ruth LA. 1997. The U.S. Department of Energy’s Combustion 2000 Program: Clean, Efficient electricity from Coal. Energy Conversion Management. Vol. 38, No.10-13, pp 1249-1257. Sharmaa Parameswara D., Nairb Chandramohanan P.S., Balasubramanian R. 2004. ‘Performance of Indian power sector during a decade under restructuring: a critique’ Energy Policy (article in press) Shilling Norm, Robert M. Jones. 2003. McDaniel and Hornick, 2003. The Response of Gas Turbines to a CO2 constrained environment. Paper presented at Gasification Technologies Conference 2003, San Francisco, October 12-15, 2003.

101
Shukla P.R., Debyani Ghosh, William Chandler, and Jeffrey Logan. 1999. Developing Countries and Global Climate Change. Electric Power Options in India. Pew Centre on Global Climate Change. Sivaramakrishnan, R., Siddiqi, T.A., 1997. Growth of electricity use in India, and strategies for reducing Greenhouse gas emissions. International Journal of Global Energy Issues 9 (4–6), 225–236. Sridharan P V. 2003. ‘Environment regulation for coal and electricity supply’. Paper presented at India-IEA Joint Conference on Coal and Electricity in India, 22-23 September 2003, New Delhi, India. Staats Gary, Rao Nagaraja, and Gollakota Sai. 1997. The Status and Future of Coal Preparation in India. Presentation at the 1997 Coal Liquefaction & Solid Fuels Contractors’ Review Conference, Pittsburgh, Pennsylvania; September 3, 1997 Stephen J. Goidich, Weitzel P.S., McDonald D.K., Whitney S.A., N. Oda. 1996. ‘Circulating Fluidized Bed Technology Utility-Scale Unit Experiences’ Paper presented at: Pittsburgh Coal Conference, September 3-7, 1996, Pittsburgh, Pennsylvania, U.S.A. Tavoulareas, E. Stratos, and Charpentier, Jean-Pierre. 1995. ‘Clean Coal Technologies for Developing Countries,’ World Bank Technical Paper No. 286, Energy Series, July 1995 Tell Us Report. 2001. Coal: America’s Past, America’s Future- May 2001 Thakur Tripta, Deshmukh S.G., Kaushika S.C., Kulshrestha Mukul. 2004. ‘Impact assessment of the Electricity Act 2003 on the Indian power sector.’ Energy Policy (article in Press). Tongia Rahul. 2003. ‘The Political Economy of Indian Power Sector Reforms’ Program on Energy and Sustainable Development, Publication Number WP-04, Stanford University, December 2003. Weitzel P.S., McDonald D.K., Whitney S.A. 1996. ‘Directions and Trends for Commercial PFBC and Hot Gas Clean Up’. Paper presented at Pittsburgh Coal Conference, September 3-7, 1996, Pittsburgh, Pennsylvania, U.S.A

102
Bibliography Ackerman Frank and Moomaw William. 1997. ‘SO2 Emissions trading: does it work?’ The Electricity Journal. August/September 1997, pp 61-66 Ackerman Frank, Biewald Bruce, White David, Woolf Tim, and Moomaw William. 1999. ‘Grandfathering and coal plant emissions: the cost of cleaning up the Clean Air Act.’ Energy Policy 27 (1999) 929-940. ASCI (Administrative Staff College of India). 1998. India: Environmental Issues in the Power Sector, Hyderabad, India. Allison Juliann Emmons, Lents Jim. 2002. ‘Encouraging distributed generation of power that improves air quality: can we have our cake and eat it too?’ Energy Policy, 30 (2002) 737-752. Arun T. G., Nixson F. I. 1998. ‘The Reform of the Power Sector in India: 1991 to 1997’. Journal of International Development J. Int. Dev. 10, 417-426 (1998) Awerbuch Shimon, Dillard Jesse, Mouck Tom, and Preston Alistair. 1996. ‘Capital budgeting, technological innovation and the emerging competitive environment of the electric power industry.’ Energy Policy, Vol.24, No.2, pp 195-202. 1996. Baldwin Samuel F., Sharon Burke, Joy Dunkerley, and Paul Komor. ‘Energy Technologies for Developing Countries: U.S. Policies and Programs for Trade and Investment.’ Annual Review of Energy and Environment. 1992. 17: 327-58. Belin F., Maryamchik M. D., Walker J., Wietzke D.L. 2001. ‘Babcock & Wilcox CFB Boilers Design and Experience’ The Babcock & Wilcox Company, Barberton, Ohio, U.S.A. Presented to: 16th International Conference on FBC, May 13-16, 2001, Reno, Nevada, U.S.A. CERI (Canadian Energy Research Institute), and TERI (The Energy and Resources Institute). 1995. Planning for the Indian Power Sector: Environmental and Development Considerations. Calgary, Canada; New Delhi, India. CEA (Central Electricity Authority). 1997. Fourth National Power Plan 1997-2012. New Delhi, India. CMIE (Centre for Monitoring Indian Economy). 1998. Survey of Investment Projects-Infrastructure. Mumbai, India. DOE (Department of Energy). 1994. The Clean Coal Technology Program: Lessons Learned. U.S. Department of Energy, Assistant Secretary for Fossil Energy. Washington, DC 20585, July 1994 DOE (Department of Energy). 1999a. Clean Coal Technology- the Investment Pays Off. U.S. Department of Energy, Assistant Secretary for Fossil Energy. Washington, DC 20585, November 1999. DOE (Department of Energy). 2003. ‘Coal’s Role in the Coming Decades– Energy Security in an Insecure World.’ Clean Coal and Power Conference 2003 Proceedings. The Ronald Reagan Building, International Trade Center, November 17–19, 2003 • Washington, DC

103
DOE (Department of Energy). 2003a. ‘India and United States Continue Collaboration’ Clean Coal Today Newsletter. DOE/FE-0462, Issue No. 55, Fall/Winter 2003. Department of Energy, Assistant Secretary for Fossil Energy. Washington, DC 20585. DOE (Department of Energy). 2003c. Clean Coal Today Newsletter. DOE/FE-0462, Issue No. 55, Fall/Winter 2003. Department of Energy, Assistant Secretary for Fossil Energy. Washington, DC 20585. Dossani Rafiq. 1999. ‘Reorganization of the power distribution sector in India’ Energy Policy (article in press) ESMAP (Energy Sector Management Associate Programme). 1998. India- Environmental Issues in the Power Sector, Report No. 205. The World Bank, Washington, D.C. ERM (Environmental Resource Management). 1997. Renewable Energy in India: A Special Study. New Delhi, India. General Accounting Office (GAO). 2001. Fossil Fuel R&D: Lessons learned in the Clean Coal Technology Program. Statement of Jim Wells, Director, Natural Resources and Environment. June 12, 2001 Ghosh Sajal. 2003. Sustainable Energy Policies for Clean Air In India. Background Paper Prepared for The Atlantic Council of USA. Confederation of Indian Industry, New Delhi, India. Internet: www.ciionline.org Hirsh, Richard F. 1999. Power Loss: The Origins of Deregulation and Restructuring in the American Electric Utility System The MIT Press, 1999. Kalam Abdul, 2003. ‘Key Issues And Options that Shape the Choice of Technology in Coal Mining’. Paper presented at India-IEA Joint Conference on Coal and Electricity in India, 22-23 September 2003, New Delhi, India. Kavidass S., Bakshi V.K., and Diwakar K.K.1997. ‘Overview and Status of the First 25 MWe IR-CFB Boiler in India’ Presented to: 14th International ASME Conference on Fluidized Bed Combustion May 11-14, 1997, Vancouver, British Columbia, Canada Lawrence T. Papay, Linda K. Trocki, Ronald R. McKinsey. 1997. ‘Clean Coal Technology Deployment: From Today into the Next Millenium’. Presented to: Fifth Annual Clean Coal Technology Conference at Tampa, Florida, January 7-10, 1997. Lee Henry, Darani Negeen. 1996.‘Electricity Restructuring and the Environment’ The Electricity Journal, December 1996. Markel, Kenneth Jr. 2003. Coal Power Program Roadmap. CCPI Round 2 Planning Workshop, National Energy Technology Laboratory (NETL), Pittsburgh, PA August 26, 2003 NCC (National Coal Council). 1988. Innovative Clean Coal Technology Deployment, November 1988, Washington D.C.
104
NCC (National Coal Council). 1995. A Critical Review of Efficient and Environmentally Sound coal Utilization Technology, May 1995, Washington D.C. NCC (National Coal Council). 1995. The Implications For Coal Markets of Utility Deregulation and Restructuring, November 1995, Washington D.C. NCC (National Coal Council). 1997. Vision 2020. The Role of Coal in U.S. Energy Strategy. February 1997, Washington D.C. NCC (National Coal Council). 1998. Coal's Role in Achieving Economic Growth and Environmental Stability, November 1998, Washington D.C. NETL (National Energy Technology Laboratory). 2004. NETL, USAID-India Sign Second Phase of Agreement to Reduce Pollution from Coal-Fired Power Plants. NETL media release, Immediate Release Nelson Randy A., Tietenberg Tom, and Donihue Michael R. 1993.‘Differential Environmental Regulation: Effects on Electric Utility Capital Turnover and Emissions.’ The Review of Economics and Statistics, Vol.75, No.2 (May 1993), 368-373 Ojha B.N. 2003. ‘Consumers’ Views on Coal Supply.’ Paper presented at India-IEA Joint Conference on Coal and Electricity in India, 22-23 September 2003, New Delhi, India. Prasad D L R, M S Venkat Ramayya. 2003. ‘Longwall Mining in India- experiences and expectations.’ Paper presented at India-IEA Joint Conference on Coal and Electricity in India, 22-23 September 2003, New Delhi, India. PCAST (President’s Committee of Advisors on Science and Technology). 1999. Powerful Partnerships- The Federal Role in International Cooperation on Energy Innovation. June 1999. PCAST (President’s Committee of Advisors on Science and Technology). 1997. Federal Energy Research and Development for the Challenges of the Twenty-first Century. November 1997. Sarma J S. 2003. ‘Restructuring of the Coal Sector in India’. Paper presented at India-IEA Joint Conference on Coal and Electricity in India, 22-23 September 2003, New Delhi, India. Shahi R.V. 2003. ‘Power Sector Development: the dominant role of Coal.’ Paper presented at India-IEA Joint Conference on Coal and Electricity in India, 22-23 September 2003, New Delhi, India. Topper John. 2003. ‘Environmental Standards and Controls and their Influence on Development of Clean Coal Technologies.’ Paper presented at India-IEA Joint Conference on Coal and Electricity in India, 22-23 September 2003, New Delhi, India. Woolf Tim, Biewald Bruce, White David. 1999.‘Electricity Market Distortions Associated with Inconsistent Air Quality Regulations.’ Prepared for the Project for a Sustainable FERC Energy Policy. Synapse Energy Economics. November 18, 1999 Woolf Tim, Biewald Bruce. 2000. ‘Electricity Market Distortions Associated with Inconsistent Air Quality Regulations.’ The Electricity Journal, April 2000. pp 42-49.

BELFER CENTER FOR SCIENCE AND INTERNATIONAL AFFAIRS
JOHN F. KENNEDY SCHOOL OF GOVERNMENT HARVARD UNIVERSITY
Discussion Paper Series
Last updated: Tuesday, 9/29/2005
The Belfer Center for Science and International Affairs (BCSIA) Discussion Papers, established in 1991, will be issued on an irregular basis with three programmatic subseries: International Security; Science, Technology, and Public Policy; and Environment and Natural Resources. Inquiries and orders may be directed to: Belfer Center for Science and International Affairs, Publications, Harvard University, 79 JFK Street, Cambridge, MA, 02138.
2005-09 Stephens, Jennie C., “Coupling CO2 Capture and Storage with Coal Gasification: Defining “Sequestration-Ready” IGCC.”
2005-08 Stephens, Jennie C., and Bob van der Zwaan. “CO2 Capture and Storage (CCS): Exploring the Research, Development, Demonstration, and Deployment Continuum.” 2005-07 Lee, Henry. "Dawning of a New Era: The LNG Story." April 2005. 2005-06 Stavins, Robert S. “The Effects of Vintage-Differentiated Environmental Regulation.” 2005-05 Lubowski, Ruben, Andrew Plantinga, and Robert Stavins. “Land-Use Change and Carbon
Sinks: Econometric Estimation of the Carbon Sequestration Supply Function.” 2005-04 Stavins, Robert S. “Environmental Economics.” 2005-03 Belloni, Roberto. "Is Humanitarianism Part of the Problem? Nine Theses." 2005-02 Ghosh, Debyani. "Assessment of Advanced Coal-Based Electricity Generation Technology
Options for India." 2005-01 Rosenberg, William G., Dwight C. Alpern, and Michael R. Walker. "The National Gasification
Strategy: Gasification of Coal & Biomass as a Domestic Supply Option." 2004-09 Srinivas, Smita, “Demand Policy Instruments for R&D: Procurement, Technical Standards and
the Case of Indian Vaccines12.” 2004-08 Rosenberg, William G., Dwight C. Alpern, and Michael R. Walker, "Deploying IGCC in This
Decade With 3 Party Covenant Financing." Vol. II 2004-07 Rosenberg, William G., Dwight C. Alpern, and Michael R. Walker, "Deploying IGCC in This
Decade With 3 Party Covenant Financing." Vol. I 2004-06 Rapporteur's Report, “Workshop on Integrated Gasification Combined Cycle: Financing
and Deploying IGCC Technology in this Decade.” 2004-05 Sagar, Ambuj and Pankaj Chandra. “Technological Change in the Indian Passenger Car
Industry.” 2004-04 Vladimir Dvorkin. “The Russian Debate on the Nonproliferation of Weapons of Mass
Destruction and Delivery Vehicles.” 2004-03 Loizides, Neophytos G., and Marcos A. Antoniades. "Settlers, Refugees, and Immigrants:
Alternative Futures for Post-Settlement Cyprus." 2004-02 Pressman, Jeremy. “If Not Balancing, What? Forms of Resistance to American Hegemony.” 2004 – 01 Rosenberg, William G., Dwight C Alpern, and Michael R. Walker. “Financing IGCC - 3Party
Covenant.”

BELFER CENTER FOR SCIENCE AND INTERNATIONAL AFFAIRS
JOHN F. KENNEDY SCHOOL OF GOVERNMENT HARVARD UNIVERSITY
Discussion Paper Series
Last updated: Tuesday, 9/29/2005
The Belfer Center for Science and International Affairs (BCSIA) Discussion Papers, established in 1991, will be issued on an irregular basis with three programmatic subseries: International Security; Science, Technology, and Public Policy; and Environment and Natural Resources. Inquiries and orders may be directed to: Belfer Center for Science and International Affairs, Publications, Harvard University, 79 JFK Street, Cambridge, MA, 02138.
2003-13 Garcia, Denise. "The Diffusion of Norms in International Security: The Cases of Small Arms
and Landmines." 2003-12 Garcia, Denise. "Analyzing the Issue of Curbing the Unrestricted Availability and Proliferation
of Small Arms and Light Weapons." 2003-11 Allison, Graham. “Implications for Public Policy of the Threat from Bioterrorism.” 2003-10 Aldy, Joseph, Scott Barrett, and Robert N. Stavins, “Thirteen Plus One: A Comparison of
Global Climate Policy Architectures.” 2003-09 Lubowski, Ruben N., Andrew J. Plantinga, and Robert N. Stavins, “Determinants of Land-Use
Change in the United States, 198201997: Results from a National Level Econometric and Simulation Analysis.”
2003-08 Oil and Security Executive Session Rapporteur's Report. 2003-07 Stavins, Robert N., “Market-Based Environmental Policies: What Can We Learn from U.S.
Experience (and Related Research)?” 2003-06 Snyder, Lori, "The Effects of Environmental Regulation on Technology Diffusion in the
Chlorine Manufacturing Industry." 2003-05 Polsky, Colin, "Assessing Vulnerabilities to the Effects of Global Change: An Eight-Step
Approach." 2003-04 Smith, Jay. "A Changing of the Guard: The U.S. National Guard and Homeland Defense." 2003-03 Lee, Henry, “Assessing the Challenges Confronting Distributive Electricity Generation." 2003-02 Saradzhyan, Simon. "Russia: Grasping Reality of Nuclear Terror." 2003-01 Kokoshin, A.A., “Nuclear Conflicts of the Twenty First Century.” 2002-18 Wils, Annababett, “On Accelerating the Global Literacy Transition.” 2002-17 Barrett, Scott and Robert Stavins. "Increasing Participation and Compliance in International
Climate Change Agreements." 2002-16 Gabbitas, Andrea, “Prospects for U.S.-Russian Nonproliferation Cooperation Under Bush and
Putin” 2002-15 Kokoshin, A.A., “Defense Leadership in Russia: The General Staff and Strategic Management
in a Comparative Perspective” 2002-14 Norberg-Bohm, Vicki. “The Role of Government in Energy Technology Innovation: Lessons
for the Energy Sector"

BELFER CENTER FOR SCIENCE AND INTERNATIONAL AFFAIRS
JOHN F. KENNEDY SCHOOL OF GOVERNMENT HARVARD UNIVERSITY
Discussion Paper Series
Last updated: Tuesday, 9/29/2005
The Belfer Center for Science and International Affairs (BCSIA) Discussion Papers, established in 1991, will be issued on an irregular basis with three programmatic subseries: International Security; Science, Technology, and Public Policy; and Environment and Natural Resources. Inquiries and orders may be directed to: Belfer Center for Science and International Affairs, Publications, Harvard University, 79 JFK Street, Cambridge, MA, 02138.
2002-13 Kasemir, Bernd and Andrea Suess. "Sustainability Information and Pension Fund
Investment." 2002-12 Stavins, Robert N., Alexander F. Wagner and Gernot Wagner. "Interpreting Sustainability in
Economic Terms: Dynamic Efficiency Plus Intergenerational Equity." 2002-11 Sekhpossian, Noune and Karen Filipovich. "Capitalizing on Russia's Forest Sequestration." 2002-10 Jonathan P. Caulkins, Mark A.R. Kleiman, and Peter Reuter, "Lessons of the 'War' on Drugs
for the 'War' on Terrorism" 2002-09 Michael Vatis, "Cyber Attacks: Protecting America's Security Against Digital Threats" 2002-08 Plantinga, Andrew J., Ruben Lubowksi, and Robert N. Stavins. “The Effects of Potential
Land Development on Agricultural Land Prices.”
2002-07 Mayer-Schonberger, Viktor. “Emergency Communications: The Quest for Interoperability In the United States and Europe.”
2002-06 Beering, Peter S., Paul M. Maniscalco, Hank Christen, Steve Storment, and A.D. Vickery. “Winning Plays: Essential Guidance from the Terrorism Line of Scrimmage.”
2002-05 Siebenhuner, Bernd. “How do Scientific Assessments Learn? A Comparative Study of the IPCC and LRTAP.”
2002-04 Pangyi, Robyn. “Consequence Management in the 1995 Sarin Attacks on the Japanese Subway System.”
2002-03 Sauer, Tom. “Beyond the ABM Treaty: A Plea for a Limited NMD System.” 2002-02 Orenstein, Mitchell and Martine Haas. “Globalization and the Development of Welfare
States in Post-communist Europe.” 2002-01 Lahsen, Myanna. “Brazilian Climate Epistemers’ Multiple Epistemes: Shared Meaning,
Diverse Identities and Geopolitics in Global Change Science.” 2001-22 de Bruijn, Theo and Vicki Norberg-Bohm. “Voluntary, Collaborative, and Information-Based
Policies: Lessons and Next Steps for Environmental and Energy Policy in the United States and Europe.”
2001-21 Gallager, Kelly Sims. “U.S.-China Energy Cooperation: A Review of Joint Activities Related
to Chinese Energy Development Since 1980.” 2001-20 Zhao, Jimin. “Reform of China’s Energy Institutions and Policies: Historical Evolution and
Current Challenges.”

BELFER CENTER FOR SCIENCE AND INTERNATIONAL AFFAIRS
JOHN F. KENNEDY SCHOOL OF GOVERNMENT HARVARD UNIVERSITY
Discussion Paper Series
Last updated: Tuesday, 9/29/2005
The Belfer Center for Science and International Affairs (BCSIA) Discussion Papers, established in 1991, will be issued on an irregular basis with three programmatic subseries: International Security; Science, Technology, and Public Policy; and Environment and Natural Resources. Inquiries and orders may be directed to: Belfer Center for Science and International Affairs, Publications, Harvard University, 79 JFK Street, Cambridge, MA, 02138.
2001-19 Alcock, Frank. Embeddedness and Influence: A Contrast of Assessment Failure in New England and Newfoundland.”
2001-18 Stavins, Robert. “Lessons from the American Experiment with Market-Based Environmental
Policies.” 2001-17 Research and Assessment Systems for Sustainability Program. “Vulnerability and Resilience
for Coupled Human-Environment Systems: Report of the Research and Assessment Systems for Sustainability Program 2001 Summer Study.”
2001-16 Eckley, Noelle. “Designing Effective Assessments: The Role of Participation, Science and
Governance, and Focus.” 2001-15 Barbera, Joseph A., Anthony Macintyre, and Craig DeAtley. “Ambulances to Nowhere:
America’s Critical Shortfall in Medical Preparedness for Catastrophic Terrorism.” 2001-14 Cavanagh, Sheila. “Thirsty Colonias: Determinants of Water Service Coverage in South
Texas.” 2001-13 Rapporteur’s Report. “Workshop on the Role of Science and Economics in Setting
Environmental Standards.” 2001-12 Hogan, William. “Electricity Market Restructuring: Reforms of Reforms.” 2001-11 Koblentz, Gregory. “A Survey of Biological Terrorism and America’s Domestic Preparedness
Program.” 2001-10 Lee, Henry, Philip Vorobyov, and Christiane Breznik. “Entering Russia’s Power Sector:
Challenges in Creating a Credible Carbon Trading System.” 2001-09 Pate, Jason and Gavin Cameron. “Covert Biological Weapons Attacks against Agricultural
Targets: Assessing the Impact against U.S. Agriculture.”
2001-08 Carment, David. “The Role of Bias in Third Party Intervention: Theory and Evidence.” 2001-07 Foster, Charles H.W. Foster and James N. Levitt, “Reawakening the Beginner’s Mind:
Innovation in Environmental Practice.” 2001-06 Donohue, Laura. “In the Name of National Security: “U.S. Counter-terrorism Measures,
1960-2000.” 2001-05 Koblentz, Gregory. “Overview of Federal Programs to Enhance State and Local Preparedness for Terrorism with Weapons of Mass Destruction.” 2001-04 Kayyem, Juliette. “U.S. Preparations for Biological Terrorism: Legal Limitations and the Need for Planning.”

BELFER CENTER FOR SCIENCE AND INTERNATIONAL AFFAIRS
JOHN F. KENNEDY SCHOOL OF GOVERNMENT HARVARD UNIVERSITY
Discussion Paper Series
Last updated: Tuesday, 9/29/2005
The Belfer Center for Science and International Affairs (BCSIA) Discussion Papers, established in 1991, will be issued on an irregular basis with three programmatic subseries: International Security; Science, Technology, and Public Policy; and Environment and Natural Resources. Inquiries and orders may be directed to: Belfer Center for Science and International Affairs, Publications, Harvard University, 79 JFK Street, Cambridge, MA, 02138.
2001-03 Foster, Charles H.W. and James S. Hoyte, “Preserving the Trust: The Founding of the Massachusetts Environmental Trust.”
2001-02 Coglianese, Cary. “Is Consensus an Appropriate Basis for Regulatory Policy?” 2001-01 Donahue, Laura and Juliette Kayyem. “The Rise of the Counterterrorist States,” 2000-33 Kates, Robert, William Clark, Robert Corell, J. Michael Hall, Carlo Jaeger, Ian
Lowe, James McCarthy, Hans Joachim Schellnhuber, et. al., “Sustainability Science.”
2000-32 Guston, David H., William Clark, Terry Keating, David Cash, Susanne Moser, Clark Miller, and Charles Powers. “Report of the Workshop on Boundary Organizations in Environmental Policy and Science.”
2000-31 Falkenrath, Richard. “Analytic Models and Policy Prescription: Understanding Recent
Innovation in U.S. Counterterrorism.” 2000-30 Merari, Ariel. “Israel’s Preparedness for High Consequence Terrorism.” 2000-29 Kohnen, Anne. “Responding to the Threat of Agroterrorism: Specific Recommendations for
the United States Department of Agriculture.” 2000-28 Falkenrath, Richard. “The Problems of Preparedness: Challenges Facing the U.S. Domestic
Preparedness Program.” 2000-27 Clark, William. “America's National Interests in Promoting a Transition toward
Sustainability.” 2000-26 Rapporteur’s Report. “Emissions Trading in Russia: Opportunities and Challenges.”
Conference October 5, 2000. 2000-25 Jaffe, Adam B., Richard G. Newell, and Robert N. Stavins. “Technological Change and
The Environment.” 2000-24 Gupta, Aarti. “Governing Biosafety in India: The Relevance of The Cartagena Protocol.”
2000-23 Eckley, Noelle. “From Regional to Global Assessment: Learning from Persistent Organic
Pollutants.”
2000-22 Keykhah, Modjeh. “Global Hazards and Catastrophic Risk: Assessments, Practitioners and Decision Making in Reinsurance.”
2000-21 Ogunseitan, Oladele. “Framing Vulnerability: Global Environmental Assessments and the African Burden of Disease.”
2000-20 Betsill, Michele M. “Localizing Global Climate Change: Controlling Greenhouse Gas Emissions in U.S. Cities.”

BELFER CENTER FOR SCIENCE AND INTERNATIONAL AFFAIRS
JOHN F. KENNEDY SCHOOL OF GOVERNMENT HARVARD UNIVERSITY
Discussion Paper Series
Last updated: Tuesday, 9/29/2005
The Belfer Center for Science and International Affairs (BCSIA) Discussion Papers, established in 1991, will be issued on an irregular basis with three programmatic subseries: International Security; Science, Technology, and Public Policy; and Environment and Natural Resources. Inquiries and orders may be directed to: Belfer Center for Science and International Affairs, Publications, Harvard University, 79 JFK Street, Cambridge, MA, 02138.
2000-19 Patt, Anthony. “Communicating Probabilistic Forecasts to Decision Makers: A Case Study
Of Zimbabwe.” 2000-18 Lund, David C. “Regional Abrupt Climate Change Assessment in the U.S.: Comparing the
Colorado and Columbia River Basins.” 2000-17 Biermann, Frank. “Science as Power in International Environmental Negotiations: Global
Environmental Assessments Between North and South.” 2000-16 Krueger, Jonathan. “Information in International Environmental Governance: The Prior
Informed Consent Procedure for Trade in Hazardous Chemicals and Pesticides.”
2000-15 Stavins, Robert N. “Economic Analysis of Global Climate Change Policy: A Primer.” 2000-14 Weeks, Jennifer. “Advice – and Consent? The Department of Energy’s Site-Specific
Advisory Boards.” 2000-13 Yereskovsky, Alexander. “The Global Security Environment and U.S.-Russian Strategic
Relations in the 21st Century: Partners or Rivals?” 2000-12 Clark, William et. Al. “Assessing Vulnerability to Global Environmental Risk.” 2000-11 Foster, Charles, H.W. and William B. Meyer, “The Harvard Environmental Regionalism
Project.” 2000-10 Cash, David. “‘In Order to Aid in Diffusing Useful and Practical Information’: Cross-scale
Boundary Organizations and Agricultural Extension.” 2000-09 Foster, Charles, H.W. et al., "Colloquium on Environmental Regionalism." 2000-08 Lee, Henry and Shashi Kant Verma, "Coal or Gas: The Cost of Cleaner Power in the
Midwest." 2000-07 Fischer, Markus, "The Liberal Peace: Ethical, Historical and Philosophical Aspects." 2000-06 Cash, David, "Distributed Assessment Systems: An Emerging Paradigm of Research,
Assessment and Decision-making for Environmental Change." 2000-05 Donohue, Laura K., "Civil Liberties, Terrorism, and Liberal Democracy: Lessons from the
United Kingdom." 2000-04 Golub, Alexander, "Russian Forests for Climate Change Mitigation: An Economic Analysis." 2000-03 Coglianese, Cary, "Policy Implications of Environmental Management Systems." 2000-02 Meyer, William B. and Charles H.W. Foster, "New Deal Regionalism: A Critical Review."

BELFER CENTER FOR SCIENCE AND INTERNATIONAL AFFAIRS
JOHN F. KENNEDY SCHOOL OF GOVERNMENT HARVARD UNIVERSITY
Discussion Paper Series
Last updated: Tuesday, 9/29/2005
The Belfer Center for Science and International Affairs (BCSIA) Discussion Papers, established in 1991, will be issued on an irregular basis with three programmatic subseries: International Security; Science, Technology, and Public Policy; and Environment and Natural Resources. Inquiries and orders may be directed to: Belfer Center for Science and International Affairs, Publications, Harvard University, 79 JFK Street, Cambridge, MA, 02138.
2000-01 Newell, Richard and Robert Stavins, "Abatement-Cost Heterogeneity and Anticipated Savings from Market-Based Environmental Policies."
R-99-01 Rapporteur's Report. "Workshop on Research and Policy Directions for Carbon Management." 99-20 Rufin, Carlos, "Institutional Change in the Electricity Industry: A Comparison of Four Latin
American Cases." 99-19 Rothenberg, Sandra and David Levy, "Corporate Responses to Climate Change: The
Institutional Dynamics of the Automobile Industry and Climate Change." 99-18 Stavins, Robert, "Experience with Market-Based Environmental Policy Instruments." 99-17 Jaffe, Adam, Richard Newell and Robert Stavins, "Energy-Efficient Technologies and
Climate Change Policies: Issues and Evidence." 99-14 Jung, Wolfgang. "Expert Advice in Global Environmental Decision Making: How Close
Should Science and Policy Get?" 99-13 Levy, David L. and Sandra Rothenberg, "Corporate Strategy and Climate Change:
Heterogeneity and Change in the Global Automobile Industry." 99-12 Biermann, Frank, "Big Science, Small Impacts -- in the South? The Influence of International
Environmental Information Institutions on Policy-Making in India." 99-11 Eckley, Noelle, "Drawing Lessons About Science-Policy Instruments: Persistent Organic
Pollutants (POPs) under the LRTAP Convention." 99-10 Gupta, Aarti. “Framing ‘Biosafety’ in an International Context: The Biosafety Protocol
Negotiations.” 99-09 Seng, Jordan. “If Iraq Gets the Bomb: Zealous Rogues, Old-Fashioned Tyrants, and Nuclear
Deterrence.” 99-08 Konoplyov, Sergei. “Analytical Centers in Ukraine.” 99-07 Foster, Charles, H.W. and David Foster. “Thinking in Forest Time: A Strategy for the
Massachusetts Forest.”
99-06 Pfaff, Alexander S. and Stavins, Robert N. “Readings in the Field of Natural Resource & Environmental Economics.”
99-05 Johnsen, Tor Arnt, Shashi Kant Verma and Catherine Wolfram. “Zonal Pricing and Demand-
Side Bidding in the Norwegian Electricity Market.” 99-04 Dietrich, William F. “Guide to Research Databases of Acid Rain Assessment and Policy
Literature.”

BELFER CENTER FOR SCIENCE AND INTERNATIONAL AFFAIRS
JOHN F. KENNEDY SCHOOL OF GOVERNMENT HARVARD UNIVERSITY
Discussion Paper Series
Last updated: Tuesday, 9/29/2005
The Belfer Center for Science and International Affairs (BCSIA) Discussion Papers, established in 1991, will be issued on an irregular basis with three programmatic subseries: International Security; Science, Technology, and Public Policy; and Environment and Natural Resources. Inquiries and orders may be directed to: Belfer Center for Science and International Affairs, Publications, Harvard University, 79 JFK Street, Cambridge, MA, 02138.
99-03 Grant, Richard. “Power and Prosperity: Challenges and Opportunities for Small States.” 99-02 Hahn, Robert W. and Robert N. Stavins. “What has Kyoto Wrought? The Real Architecture
of International Tradeable Permit Markets.” 99-01 Hahn, Robert W. “The Impact of Economics on Environmental Policy.” 98-27 Parris, Thomas and Charles Zracket and William Clark. “Usable Knowledge for Managing
Responses to Global Climate Change: Recommendations to promote collaborative assessments and information systems.”
98-26 Fisher-Vanden, Karen. “Technological Diffusion in China’s Iron and Steel Industry.” 98-25 Bunn, Matthew, Neil J. Numark and Tatsujiro Suzuki. “A Japanese-Russian Agreement to
Establish a Nuclear Facility for MOX Fabrication and Spent Fuel Storage in the Russian Far East.”
98-24 Holdren, John P. “Getting to Zero: Is Pursuing a Nuclear-Weapon-Free World Too Difficult?
Too Dangerous? Too Distracting?” 98-23 Stavins, Robert N. and Richard Newell. “Climate Change and Forest Sinks: Factors Affecting
the Costs of Carbon Sequestration.” 98-22 O’Neill, Kate. “(Not) Getting to ‘Go’: Recent Experience in International Cooperation over
the Management of Spent Nuclear Reactor Fuel.” 98-21 Lee, Henry. “Designing Domestic Carbon Trading Systems: Key Considerations.” 98-20 Patt, Anthony. “Analytic Frameworks and Politics: The Case of Acid Rain in Europe.” 98-19 Iles, Alastair. “The Evolution of Acidification Impact Frames in Europe: Interactions
Between Regional and National Assessment of Forest Conditions.” 98-18 Franz, Wendy E. “Science, Skeptics and Non-State Actors in the Greenhouse.” 98-17 Cash, David. “Assessing and Addressing Cross-Scale Environmental Risks: Information and
Decision Systems for the Management of the High Plains Aquifer.” 98-16 Moser, Susanne. “Talk Globally, Walk Locally: The Cross-Scale Influence of Global Change
Information on Coastal Zone Management in Maine and Hawai’i.” 98-15 Miller, Clark. “Extending Assessment Communities to Developing Countries.” 98-14 Bader, Pascal. “Targets and Strategies: The Role of Economic Assessments in European Climate Policy.” 98-13 Botcheva, Liliana. “Doing is Believing: Participation and Use of Economic Assessments in
the Approximation of EU Environmental Legislation in Eastern Europe.”

BELFER CENTER FOR SCIENCE AND INTERNATIONAL AFFAIRS
JOHN F. KENNEDY SCHOOL OF GOVERNMENT HARVARD UNIVERSITY
Discussion Paper Series
Last updated: Tuesday, 9/29/2005
The Belfer Center for Science and International Affairs (BCSIA) Discussion Papers, established in 1991, will be issued on an irregular basis with three programmatic subseries: International Security; Science, Technology, and Public Policy; and Environment and Natural Resources. Inquiries and orders may be directed to: Belfer Center for Science and International Affairs, Publications, Harvard University, 79 JFK Street, Cambridge, MA, 02138.
98-12 Farrell, Alex and Terry J. Keating. “Multi-Jurisdictional Air Pollution Assessment: A
Comparison of the Eastern United States and Western Europe.” 98-11 Keating, Terry J. and Alex Farrell. “Problem Framing and Model Formulation: The
Regionality of Tropospheric Ozone in the U.S. and Europe.” 98-10 Samson, Paul. “Non-State Actors and Environmental Assessment: A Look at Acid Rain and
Global Climate Change.” 98-09 VanDeveer, Stacy D. “European Politics with a Scientific Face: Transition Countries,
International Environmental Assessment, and Long Range Transboundary Air Pollution.” 98-08 Chayes, Abram. “A Suggested Model for Implementing the Clean Development Mechanism.”
98-07 Lynn-Jones, Sean M. “Why the United States Should Spread Democracy.” 98-06 Mitchell, Ronald and Ted Parson. “Implementing Joint Implementation: Developing a
Management and Performance System for the Kyoto Protocol’s ‘Clean Development Mechanism.’”
98-05 Hahn, Robert. “An Analysis of the First Government Report on the Benefits and Costs of
Regulation.” 98-04 Stavins, Robert N. “How do Economists Really Think about the Environment?” 98-03 Coglianese, Cary. “Getting the Message Out: Regulatory Policy and the Press.” 98-02 Stavins, Robert. “Market-Based Environmental Policies.” 98-01 Newell, Richard, Adam Jaffe and Robert Stavins. “The Induced Innovation Hypothesis and
Energy-Saving Technological Change.” 97-15 Foster, Charles, H.W. “Managing Resources as Whole Systems: A Primer for Managers.”
97-14 Anderson, Steven. “U.S. Electricity Restructuring and Environmental Policy: A Survey of Opinions in the Environmental Community.”
97-13 Verma, Shashi. “Getting Privatization Right: Establishing a Competitive Market for Electricity Generation in Brazil.”
97-12 Hahn, Robert. “Climate Change: Economics, Politics, and Policy.”
97-11 Keohane, Nathaniel, Richard Revesz and Robert Stavins. “The Positive Political Economy of Instrument Choice in Environmental Policy.”
97-10 Patt, Anthony. “Assessing Extreme Outcomes: The Strategic Treatment of Low Probability Impacts of Climate Change.”

BELFER CENTER FOR SCIENCE AND INTERNATIONAL AFFAIRS
JOHN F. KENNEDY SCHOOL OF GOVERNMENT HARVARD UNIVERSITY
Discussion Paper Series
Last updated: Tuesday, 9/29/2005
The Belfer Center for Science and International Affairs (BCSIA) Discussion Papers, established in 1991, will be issued on an irregular basis with three programmatic subseries: International Security; Science, Technology, and Public Policy; and Environment and Natural Resources. Inquiries and orders may be directed to: Belfer Center for Science and International Affairs, Publications, Harvard University, 79 JFK Street, Cambridge, MA, 02138.
97-09 Long, Marybeth and Alastair Iles. “Assessing Climate Change Impacts: Co-Evolution of Knowledge, Communities and Methodologies.”
97-08 Kandlikar, Milind and Ambuj Sagar. “Climate Science and Policy in India: Learning Some Lessons.”
97-07 Franz, Wendy E. “The Development of an International Agenda for Climate Change.”
97-06 Fisher-Vanden, Karen. “International Policy Instrument Prominence in the Climate Change Debate: A Case Study of the United States.”
97-05 Agrawala, Shardul. “Explaining the Evolution of the IPCC Structure and Process.”
97-04 Wright, Jan C. “‘Bright Lines’ and the Value of Life: Resolving the Dispute over the Regulation of Carcinogens.”
97-03 Parson, Edward A. and Karen Fisher-Vanden. “Joint Implementation and its Alternatives.”
97-02 Stavins, Robert N. “Economic Incentives for Environmental Regulation.”
97-01 Arbatov, Alexei G. “Military Reform in Russia: Dilemmas, Obstacles, and Prospects.”
96-03 de Nevers, Renee. “Sustaining the Transition? Western Efforts to Support Democracy and Prevent Conflict in Russia.”
96-02 Rogers, Elizabeth S. “Using Economic Sanctions to Prevent Deadly Conflict.”
96-01 Meade, Andre and Sydney Rosen. “The Mixed-Grass Prairie Reserve: Managing the Greater Badlands Region as a Whole System.”
95-14 Schatzki, Todd. “The Effects of Uncertainty on Landowner Conversion Decisions.”
95-13 Lee, Henry and Negeen Darani. “Electricity Restructuring and the Environment.”
95-12 Clark, William C. and Nancy M. Dickson eds. “The Press and Global Environmental Change: An International Comparison of Elite Newspaper Reporting on the Acid Rain Issue from 1972 to 1992.”
95-11 Zaborsky, Victor. “Crimea and the Black Sea Fleet in Russian-Ukrainian Relations.”
95-10 Stavins, Robert, Adam Jaffe, Steve Peterson, and Paul Portney. “Environment Regulation and the Competitiveness of U.S. Manufacturing: What does the Evidence Tell Us?”
95-09 Haran, Olexity. “Disintegration of the Soviet Union and the US Position on the Independence of Ukraine.”
BELFER CENTER FOR SCIENCE AND INTERNATIONAL AFFAIRS
JOHN F. KENNEDY SCHOOL OF GOVERNMENT HARVARD UNIVERSITY
Discussion Paper Series
Last updated: Tuesday, 9/29/2005
The Belfer Center for Science and International Affairs (BCSIA) Discussion Papers, established in 1991, will be issued on an irregular basis with three programmatic subseries: International Security; Science, Technology, and Public Policy; and Environment and Natural Resources. Inquiries and orders may be directed to: Belfer Center for Science and International Affairs, Publications, Harvard University, 79 JFK Street, Cambridge, MA, 02138.
95-08 Allison, Graham T., Owen R. Coté, Jr., Richard A. Falkenrath and Steven E. Miller. “Avoiding Nuclear Anarchy: Containing the Threat of Loose Russian Nuclear Weapons and Fissile Material.”
95-07 Falkenrath, Richard A. “The U.S.-Russian HEU Purchase Agreement: Achievements, Problems, Prospects.”
95-06 Stavins, Robert N. “The Costs of Carbon Sequestrian: A Revealed Preference Approach.”
95-05 Dietrich, William. “The Challenge of Selecting Goals: Case Studies Regarding the Use of Critical Levels.”
95-04 Ferenz, Michele N. and Stephan D. Sylvan. “The Design of a Palestinian-Israeli Water Commission: A Best Practices Approach.”
95-03 Stavins, Robert N. and Tomasz Zylicz. “Environmental Policy in a Transition Economy: Designing Tradable Permits for Poland.”
95-02 Not available.
95-01 Perlman, Brett A. “Pricing the Internet: How to Pay the Toll for the Electronic SuperHighway.”
94-10 Stavins, Robert N. “Correlated Environmental Uncertainty and Policy Instrument Choice.”
94-09 Falkenrath, Richard A. “The United States and Ballistic Missile Defense after the Cold War.”
94-08 Falkenrath, Richard A. “The United States, the Former Soviet Republics, and Nuclear Weapons: Problems and Policies of Denuclearization.”
94-07 Stavins, Robert N. and Adam Jaffee. “Environmental Regulation and Technology Diffusion: The Effects of Alternative Policy Instruments.”
94-06 Not Available.
94-05 Zaborsky, Victor. “Nuclear Disarmament and Nonproliferation: The Evolution of the Ukrainian Case.”
94-04 Lachow, Irving. “The Global Positioning System and Cruise Missile Proliferation: Assessing the Threat.”
94-03 Fairman, David, and Michael Ross. “International Aid for the Environment: Lessons from Economic Development Assistance.”
94-02 Hahn, Robert W. and Carol A. May. “The Behavior of the Allowance Market: Theory and Evidence.”
94-01 Bender, Rodd, Wyman Briggs, and Diane DeWitt. “Toward Statewide Unit Pricing in Massachusetts: Influencing the Policy Cycle.”

BELFER CENTER FOR SCIENCE AND INTERNATIONAL AFFAIRS
JOHN F. KENNEDY SCHOOL OF GOVERNMENT HARVARD UNIVERSITY
Discussion Paper Series
Last updated: Tuesday, 9/29/2005
The Belfer Center for Science and International Affairs (BCSIA) Discussion Papers, established in 1991, will be issued on an irregular basis with three programmatic subseries: International Security; Science, Technology, and Public Policy; and Environment and Natural Resources. Inquiries and orders may be directed to: Belfer Center for Science and International Affairs, Publications, Harvard University, 79 JFK Street, Cambridge, MA, 02138.
93-06 Hahn, Robert W. “An Economic Analysis of Scrappage.”
93-05 Hancke, Bob. “Technological Change and Its Institutional Constraints.”
93-04 Portney Paul R. and Robert N. Stavins. “Regulatory Review of Environmental Policy: The Potential Role of Health-Health Analysis”
93-03 Parson, Edward A. and Richard J. Zeckhauser. “Equal measures and Fair Burdens: negotiating environmental treaties in an unequal world.”
93-02 Stavins, Robert N. “Transaction Costs and the Performance of Markets for Pollution Control.”
93-01 Holla, Rogier A.H.G. “Cultural Attitudes and Institutional Forces: Explaining National Differences in Biotechnology Policy.”
92-13 Foster, Charles H.W. “Of Vert and Vision: Ensuring the Legacy of the Northern Forest of New England and New York.”
92-12 Hane, Gerald Jiro. “Research and Development Consortia in Innovation in Japan: Case Studies in Superconductivity and Engineering Ceramics.”
92-11 Vernon, Raymond. “The Triad as Policymakers.”
92-10 Jorgenson, Dale W. and Peter J. Wilcoxen. “Energy, the Environment and Economic Growth.”
92-09 Norberg-Bohm, Vicki and William C. Clark, et al. “International Comparisons of Environmental Hazards: Development and evaluation of a method for linking environmental data with the strategic debate management priorities for risk management.”
92-08 Hart, David. “Strategies of Research Policy Advocacy: Anthropogenic Climatic Change Research, 1957-1974.”
92-07 Dembinski, Matthias. “Ballistic Missile Proliferation and the New World Order: A Critical Survey of the Literature.”
92-06 Shlyakhter, Alexander I. and Daniel M. Kammen. “Estimating the Range of Uncertainty in Future Development from Trends in Physical Constraints and Predictions of Global Change.”
92-05 Eaton, Susan C. “Union Leadership Development in the 1990s and Beyond: A Report with Recommendations.”
92-04 Hahn, Robert W. and Robert L. Axtell. “Reevaluating the Relationship between Transferable Property Rights and Command-and-Control Regulation.”
92-03 Stavins, Robert N. and Bradley W. Whitehead. “The Greening of America’s Taxes: Pollution Charges and Environmental Protection.”

BELFER CENTER FOR SCIENCE AND INTERNATIONAL AFFAIRS
JOHN F. KENNEDY SCHOOL OF GOVERNMENT HARVARD UNIVERSITY
Discussion Paper Series
Last updated: Tuesday, 9/29/2005
The Belfer Center for Science and International Affairs (BCSIA) Discussion Papers, established in 1991, will be issued on an irregular basis with three programmatic subseries: International Security; Science, Technology, and Public Policy; and Environment and Natural Resources. Inquiries and orders may be directed to: Belfer Center for Science and International Affairs, Publications, Harvard University, 79 JFK Street, Cambridge, MA, 02138.
92-02 Parson, Edward A. “Protecting the Ozone Layer: The Evolution and Impact of International Institutions.”
92-01 Branscomb, Lewis M. “S & T Information Policy in the Context of a Diffusion Oriented National Technology Policy.”
91-15 Hahn, Robert W. and Robert N. Stavins. “Economic Incentives for Environmental Protection: Integrating Theory and Practice.”
91-14 Hahn, Robert W. “Government Markets and the Theory of the N th Best.”
91-13 Parson, Edward A. and William C. Clark. “Learning to Manage Global Environmental Change: A Review of Relevant Theory.”
91-12 Branscomb, Lewis M. “America’s Emerging Technology Policy.”
91-11 Lynn-Jones, Sean M. “International Security Studies after the Cold War: An Agenda for the Future.”
91-10 Rapporteur’s Report of the Executive Session: “Negotiating a Global Climate Change Agreement.” March 14-15, 1991.
91-09 Jorgenson, Dale W. and Peter J. Wilcoxen. “Reducing U.S. Carbon Dioxide Emissions: The Cost of Different Goals.”
91-08 Montgomery, John D., et al. “Values in Conflict: Policy Interactions in the Pacific Basin.”
91-07 Summary of Project 88/Round II Workshop Proceedings. “Incentive-Based Policies for Municipal Solid Waste Management.” May 16, 1991.
91-06 Proceedings of Project 88/Round II Forum. “Market-Based Strategies for Environmental Protection: A Tribute to Senator John Heinz of Pennsylvania.” May 16, 1991.
91-05 Foster, Charles H.W. and Peter P. Rogers. “Rebuilding the Nation’s Wetland Heritage: A Challenge for the 1990s.”
91-04 Lerner, Joshua. “The Impact of Patent Scope: An Empirical Examination of New Biotechnology Firms.”
91-03 Gaskins, Darius and Bruce Stram. “A Meta Plan: A Policy Response to Global Warming.”
91-02 Merchant, Gery E. “Freezing CO2 Emissions: An Offset Policy for Slowing Global Warming.”
91-01 Jaffee, Adam and Robert N. Stavins. “Evaluating the Relative Effectiveness of Economic Incentives and Direct Regulation for Environmental Protection: Impacts on the Diffusion of Technology.”