assessment of base capacity of open-ended tubular piles
TRANSCRIPT

Short title is appeared here.
Assessment of Base Capacity of Open-ended Tubular Piles
Installed by the Rotary Cutting Press-in Method
Yukihiro ISHIHARAi), Stuart HAIGHii) and Junichi KOSEKIiii)
i) Manager, Scientific Research Section, GIKEN LTD., Japan. ([email protected]) ii) Senior Lecturer, Department of Engineering, University of Cambridge, UK. ([email protected])
iii) Professor, Department of Civil Engineering, The University of Tokyo, Japan. ([email protected])
Abstract
The ‘press-in’ method is a piling technique that installs piles with a static jacking force while obtaining a reaction force from
previously installed piles. The applicable ground conditions of this method have been significantly expanded by the ‘Rotary
Cutting Press-in (RCP)’ method, whereby a vertical jacking force and a torque are applied simultaneously onto a pile with cutting
teeth on its base while water is injected around the pile base. In this paper, a method to estimate the base capacity of RCP piles is
proposed based on UWA-05 framework. The proposed method utilizes CPT or SPT results as input parameters and estimates the
plugging condition (Incremental Filling Ratio, IFR) from these results. Four static load tests on open-ended RCP piles were shown
to be well-predicted by the proposed method in terms of the base capacity, regardless of the embedment depth into a bearing
stratum.
Key words: Rotary Cutting Press-in, Base capacity, Open-ended pile (IGC: E04/K07)
1. Introduction
In the Press-in Method (International Press-in Association (IPA), 2016), a static jacking force is used to install a pile
while a reaction force is obtained from previously installed piles. The environmental impacts of noise and vibration are thus
lower than those for conventional piling methods, and the space for piling and cost of temporary works can be significantly
reduced. Recently, a technique called ‘Rotary Cutting Press-in’ (RCP) has been developed, expanding the applicability of
the Press-in Method to hard ground. In RCP, vertical and rotational jacking forces are applied simultaneously to a pile with
teeth on its base. Low-pressure water injection (as opposed to water jetting) is usually conducted during the penetration
process to reduce the penetration resistance and facilitate the piling work. A typical water injection system is described in
IPA (2016).
Since the Press-in Method is a relatively new piling method, and is more frequently used for construction of walls in
which the horizontal performance is most important, there has until recently been a lack of design methods for the axial
capacity of piles installed using this method. Deeks & White (2007) argued that the axial stiffness of jacked piles (including
those installed by Standard Press-in without water jetting or augering) measured in their centrifuge tests as well as in the
Manuscript
1 2 3 4 5 6 7 8 9 10 11 12 13 14 15 16 17 18 19 20 21 22 23 24 25 26 27 28 29 30 31 32 33 34 35 36 37 38 39 40 41 42 43 44 45 46 47 48 49 50 51 52 53 54 55 56 57 58 59 60 61 62 63 64 65

Short title is appeared here.
field load tests of Dingle (2006) was higher than that of driven or bored piles estimated by existing methods. White & Deeks
(2007) proposed a CPT-based method to estimate the axial capacity of jacked piles by modifying the values of coefficients
in the UWA-05 framework for driven piles (Xu et al., 2008). This suggested that jacked piles exhibit a higher capacity than
driven piles, if the capacity is defined as the resistance when the pile base displacement reaches one-tenth of the outer
diameter of the pile. The higher stiffness and capacity of jacked piles are attributed to the loading history; the static loading
and unloading at the end of installation leading to a stiffer response at the pile base when the pile is subsequently load tested
(White et al., 2010).
Hirata et al. (2009) collected field load test results of three RCP piles, most of which had a relatively small embedment
depth into a bearing stratum, and discussed the applicability of an SPT-based design method (Japan Road Association (JRA),
2002). They confirmed that the measured capacity was greater than the estimated values for driven piles, while the measured
stiffness fell between the estimated values for driven and bored piles. White et al. (2010) analyzed one of the three field
load test results of Hirata et al. (2009) and confirmed that the measured base capacity fell in between the estimated values
for driven and bored piles using UWA-05. These analyses, together with the fact that the embedment depth of the load
tested piles into a bearing stratum was relatively small, suggest that the effect of loading history, which is a source of the
high base response of jacked piles, can also be expected for RCP piles.
IPA (2014) summarized the results of Hirata et al. (2009) and presented methods to estimate the capacity and stiffness
of RCP piles, by referring to those for driven and bored piles specified by JRA (2012). According to the comparison of the
measured and the estimated base capacity provided in IPA (2014), the method provides very conservative values for the
base capacity. JRA (2012) was revised in 2017 (JRA, 2017), and the applicability of JRA (2017) to RCP piles is unknown.
This paper focuses on the base capacity of an RCP pile, and (1) gives an overview on the existing method to estimate
the base capacity of an RCP pile, (2) proposes a new estimation method and (3) assesses the validity of the proposed method
by comparing with field test results.
2. Existing method to estimate the base capacity of RCP piles
The base capacity of an open-ended pile (Qb,0.1Do), generally defined as the base resistance when the pile base has been
displaced a distance equivalent to one-tenth of its outer diameter (Do), is usually estimated by multiplication of a unit base
capacity at the corresponding base displacement (qb,0.1Do) and the gross (closed-ended) cross-sectional area (Ab,closed). In
other words, qb,0.1Do is taken as an apparent unit base capacity reflecting the plugging condition of an open-ended pile, being
the average of the stress of the soil on the pile annulus (qbp,0.1Do) and the resistance of the soil beneath the soil column inside
the pile (qbi,0.1Do). These symbols are illustrated in Fig. 1, together with those for the inner diameter of a pile (Di), the depth
of the pile base (z), the embedment depth into the bearing stratum (zbs) and the length of the soil column inside the pile (h).
It is often the case that piles are embedded into a bearing stratum with a sufficient strength and thickness to secure their
vertical bearing performance. As the pile ‘feels’ the strength of soils not only beneath but also above its base, some
embedment depth into the bearing stratum (zbs) is necessary to mobilize the full strength of that layer (Meyerhoff &
Valsangkar, 1977; White & Bolton, 2005). In addition, the plug strength (= qbi,0.1Do) also varies with zbs. These issues of the
partial embedment into the bearing stratum and the plugging condition have been considered in existing design codes in
different ways.
1 2 3 4 5 6 7 8 9 10 11 12 13 14 15 16 17 18 19 20 21 22 23 24 25 26 27 28 29 30 31 32 33 34 35 36 37 38 39 40 41 42 43 44 45 46 47 48 49 50 51 52 53 54 55 56 57 58 59 60 61 62 63 64 65

Short title is appeared here.
According to IPA (2014), the base capacity of an RCP pile can be safely estimated by equations (1) and (2):
Qb,0.1Do = Ab,closed × qb,0.1Do (1)
qb,0.1Do = 60 × min(Na1, 40) (2)
where Na1 is the so-called ‘bearing stratum N value’ obtained by using SPT N values recorded in the depth range from the
pile base to 4Do above the pile base (JRA, 2012). These expressions were obtained by modifying methods for driven piles
recommended by JRA (2012), taking into account that zbs is recommended to be equivalent to Do (IPA, 2014), determined
from the viewpoint of securing the capacity while assuring piling efficiency.
In JRA (2012), the base capacity of open-ended tubular driven piles can be estimated by equations (1) and (3):
qb,0.1Do
= 300 × min (zbs
5Do
, 1) × min(Na1, 40) (3)
Equation (3) implies that the unit base capacity (qb,0.1Do) is reduced from the fully mobilized case (zbs = 5Do) linearly with
zbs , as shown in Fig. 2, incorporating the effect of partial embedment into the bearing stratum and the plugging condition.
Equation (3) is similar to equation (2) if zbs is taken as equivalent to Do, as required by IPA (2014).
JRA (2012) was revised in 2017, and the concept of reducing the unit base capacity with the value of zbs was removed
(JRA, 2017). Instead, zbs is required to be greater than or equal to 2Do, and if this requirement is satisfied, qb,0.1Do is
consistently expressed as:
qb,0.1Do
= { 90 × min(Na2, 50) (Cohesive soil)
130 × min(Na2, 50) (Sand, Sand and gravel) (4)
where Na2 is the bearing stratum N value obtained by averaging the SPT N values in the depth range from the pile base to
3Do below the pile base. As RCP piles are usually embedded by Do, JRA (2017) cannot be applied to RCP piles.
3. A new method to estimate the base capacity of RCP piles
3.1. Framework of the proposed method
The Rotary Cutting Press-in method is usually adopted when the ground is hard, containing gravels or cobbles or
consisting of rocks. The framework of the proposed method will be based on UWA-05 (CPT-based), but due to the lower
applicability of CPT to such hard ground conditions, SPT results will also be utilized as input parameters. A feature of the
proposed method is the estimation of the plugging condition from the CPT or SPT results, without assuming values of zbs.
According to White & Deeks (2007), the base capacity of jacked piles can be estimated by equations (1) and (5), based
on the UWA-05 framework:
1 2 3 4 5 6 7 8 9 10 11 12 13 14 15 16 17 18 19 20 21 22 23 24 25 26 27 28 29 30 31 32 33 34 35 36 37 38 39 40 41 42 43 44 45 46 47 48 49 50 51 52 53 54 55 56 57 58 59 60 61 62 63 64 65

Short title is appeared here.
qb,0.1Do
= [0.15 + 0.75 × {1-FFR × (Di
Do
)2
}] × qc,ave
(5)
where qc,ave is the cone resistance averaged by the Dutch method (Lehane et al., 2005) and FFR (Final Filling Ratio) is the
value of IFR (Incremental Filling Ratio, expressed by equation (6)) at the end of pile installation.
IFR = dh
dz (6)
Here, dh and dz are the increments of h and z over the length of installation being considered. In UWA-05, equation (7) is
recommended to obtain FFR, if h is not measured.
FFR = min(1, (Di [m]
1.5 [m])
0.2
) (7)
According to White & Bolton (2005), the unit base capacity qb,pl, defined by a plunging load (the load at which continued
penetration occurs without any further increase in resistance), can be expressed as:
qb,pl
= 0.9 × qc,ave
(8)
regardless of Do. On the other hand, in SPT-based methods, qb,0.1Do of closed-ended driven piles has been widely accepted
in practice as:
qb,0.1Do
= 300 × min(N, 50) [kPa] (9)
where the value of 300 is based on the findings of Meyerhoff (1956) and the load test data of Kerisel (1961) and the BCP
Committee (1971) (AIJ, 2001). Assuming qb,pl = qb,0.1Do, equations (8) & (9) give:
qc,ave
≈ 333 × min(N, 50) [kPa] (10)
and equation (5) can be written as:
qb,0.1Do
≈ 333× [0.15 + 0.75 × {1-FFR × (Di
Do
)2
}]× min(N, 50) [kPa] (11)
As qb,pl will be greater than qb,0.1Do, equation (11) would provide a more conservative estimation of results than equation (5).
3.2. Estimation of IFR and FFR in axial jacking
1 2 3 4 5 6 7 8 9 10 11 12 13 14 15 16 17 18 19 20 21 22 23 24 25 26 27 28 29 30 31 32 33 34 35 36 37 38 39 40 41 42 43 44 45 46 47 48 49 50 51 52 53 54 55 56 57 58 59 60 61 62 63 64 65

Short title is appeared here.
The plugging condition of a tubular pile is governed by the equilibrium of the soil within it. Following the analysis
method of Randolph et al. (1991), this equilibrium can be investigated based on a series of infinitesimally thin disks. The
disk of soil at the bottom of the soil column inside the pile, with a thickness of dh, will be considered here, as shown in Fig.
3. During static penetration, this disk experiences a base stress (qbi) from the soil beneath, resisted by a frictional stress (τi)
mobilized at the soil-pile interface inside the pile, the weight of the disk and the stress on its top surface. The frictional
stress mobilized can be related to the base stress by:
τi= β × qbi
' (12)
where qbi′ is an effective base stress (obtained by subtracting pore water pressure from qbi) and β is the coefficient linking
qbi′ and τi. On the upper surface of disk in Fig. 3, a vertical stress (p) will act which is derived from the weight of the soil
above and the integrated stresses arising from the soil-pile friction. This stress could be assumed to be equal to the maximum
previously observed base stress (qBI).
The equilibrium of forces acting on the disk can hence be expressed as:
π × Di2
4 × q
bi = (π × Di × dh) × (β × q
bi') +
π × Di2
4 × (γ × dh) +
π × Di2
4 × q
BI (13)
where γ is the unit weight of soil. Assuming the pore water pressure at the pile base to be γw×h (where γw is the unit weight
of water), it can be shown that:
qbi =
qBI + γ × dh−
4βDi
× dh × γw
× h
1−4βDi
× dh
(14)
Randolph et al. (1991) solved this equation directly by assuming that maximum friction is always mobilized within the soil
plug, however this has been found to overestimate the observed base stress unless an adequate ‘effective length’ through
which the friction is mobilized is found. As the ratio of the base stress (qbi) to CPT cone resistance (qc) has been shown by
Lehane & Gavin (2001) to vary in proportion to IFR (equation 14), this can be used along with equilibrium of the soil
element to achieve an alternative analysis.
qbi
= λ × qc ×(1− IFR) (15)
where λ is a coefficient assumed as 0.9 based on Fig. 4. Combining equations (14) and (15), IFR is expressed as:
1 2 3 4 5 6 7 8 9 10 11 12 13 14 15 16 17 18 19 20 21 22 23 24 25 26 27 28 29 30 31 32 33 34 35 36 37 38 39 40 41 42 43 44 45 46 47 48 49 50 51 52 53 54 55 56 57 58 59 60 61 62 63 64 65
Short title is appeared here.
IFR = 1−q
BI + γ × dh−
4βDi
× dh × γw
× h
(1−4βDi
× dh) × λ × qc
= dh
dz (16)
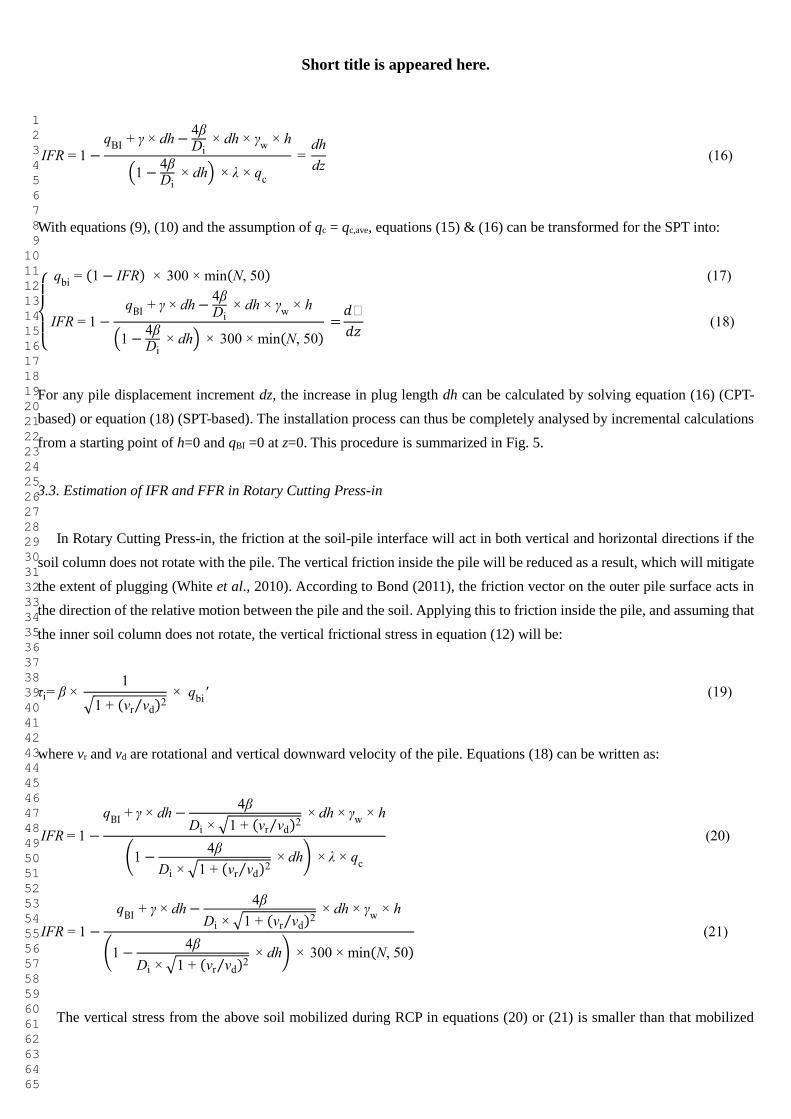
With equations (9), (10) and the assumption of qc = qc,ave, equations (15) & (16) can be transformed for the SPT into:
{
q
bi = (1− IFR) × 300 × min(N, 50) (17)
IFR = 1−qBI
+ γ × dh−4βDi
× dh × γw
× h
(1−4βDi
× dh) × 300 × min(N, 50) =𝑑ℎ
𝑑𝑧 (18)
For any pile displacement increment dz, the increase in plug length dh can be calculated by solving equation (16) (CPT-
based) or equation (18) (SPT-based). The installation process can thus be completely analysed by incremental calculations
from a starting point of h=0 and qBI =0 at z=0. This procedure is summarized in Fig. 5.
3.3. Estimation of IFR and FFR in Rotary Cutting Press-in
In Rotary Cutting Press-in, the friction at the soil-pile interface will act in both vertical and horizontal directions if the
soil column does not rotate with the pile. The vertical friction inside the pile will be reduced as a result, which will mitigate
the extent of plugging (White et al., 2010). According to Bond (2011), the friction vector on the outer pile surface acts in
the direction of the relative motion between the pile and the soil. Applying this to friction inside the pile, and assuming that
the inner soil column does not rotate, the vertical frictional stress in equation (12) will be:
τi= β × 1
√1 + (vr vd⁄ )2 × q
bi' (19)
where vr and vd are rotational and vertical downward velocity of the pile. Equations (18) can be written as:
IFR = 1−
qBI + γ × dh−
4β
Di × √1 + (vr vd⁄ )2 × dh × γ
w × h
(1−4β
Di × √1 + (vr vd⁄ )2 × dh) × λ × q
c
(20)
IFR = 1−
qBI
+ γ × dh−4β
Di × √1 + (vr vd⁄ )2 × dh × γ
w × h
(1−4β
Di × √1 + (vr vd⁄ )2 × dh) × 300 × min(N, 50)
(21)
The vertical stress from the above soil mobilized during RCP in equations (20) or (21) is smaller than that mobilized
1 2 3 4 5 6 7 8 9 10 11 12 13 14 15 16 17 18 19 20 21 22 23 24 25 26 27 28 29 30 31 32 33 34 35 36 37 38 39 40 41 42 43 44 45 46 47 48 49 50 51 52 53 54 55 56 57 58 59 60 61 62 63 64 65

Short title is appeared here.
during axial jacking as a consequence of the reduction in the vertical frictional stress based on equation (19). During the
subsequent load test (i.e. when the pile is vertically pushed without rotation after the end of RCP) the internal stresses will
be greater than those during installation, due to the lack of rotation. Taking this into account, IFR during a load test carried
out after the termination of RCP installation (i.e. FFR to be substituted into equation (5) or (11)) can be expressed as:
FFR = 1−{(qBI − γ × h) × √1 + (vr vd⁄ )2 + γ × h} + γ × dh−
4βDi
× dh × γw
× h
(1−4βDi
× dh) × λ × qc
(22)
FFR = 1−{(qBI − γ × h) × √1 + (vr vd⁄ )2 + γ × h} + γ × dh−
4βDi
× dh × γw
× h
(1−4βDi
× dh) × 300 × min(N, 50) (23)
The procedure for estimating FFR for RCP piles is summarized in Fig. 6.
4. Validation of the proposed estimation method based on experimental results
4.1. IFR during axial jacking of a model pile in dry sand
Kurashina (2016) carried out a model test on an axially jacked pile in which the model ground was prepared using air-
pluviation of air-dry silica sand #6, to a relative density (Dr) of 60%, in a soil tank 1000mm square with a height of 1700mm.
The depth of the model ground was 1650mm. The CPT profile of the model ground is shown in Fig. 7. An open-ended steel
tubular pile with Do = 101.6mm and Di = 83.5mm was used as a test pile as shown in Fig. 8. This consisted of two concentric
pipes with a load cell sandwiched between the heads of two pipes to measure the total frictional force on the inner pipe
(Qsi). A stroke sensor (DP-1000E) was placed near the top of the inner pipe to measure the length of the inner soil column
h using a wire attached to a steel weight on the surface of the inner soil. 320 grit sand paper was pasted on the inner surface
of the inner pipe. The internal friction angle of the soil was confirmed to be 38.7 degrees at Dr = 60% by triaxial compression
tests, and the friction angle at the soil-pile interface (δsp) was estimated as 33 degrees by a simple investigation shown in
Fig. 9.
The calculation was carried out with dz = 0.01m using the CPT-based equations. Two methods were adopted to obtain
β, one of which was based on equations (24) and (25) proposed by Randolph et al. (1991):
β = sinϕ × sin(Δ-δsp)
1+sinϕ × cos(Δ-δsp) (24)
Δ = sin-1 (
sinδsp
sinϕ) (25)
These equations provide minimum values of β based on an assumption that the soil near the edge of the soil column is at
1 2 3 4 5 6 7 8 9 10 11 12 13 14 15 16 17 18 19 20 21 22 23 24 25 26 27 28 29 30 31 32 33 34 35 36 37 38 39 40 41 42 43 44 45 46 47 48 49 50 51 52 53 54 55 56 57 58 59 60 61 62 63 64 65

Short title is appeared here.
active failure. An alternative is simply to introduce the coefficient of earth pressure (K) to express β as:
β = K × tanδsp (26)
Comparison of measured and estimated values of h and IFR are shown in Fig. 10. In the estimation, several K values
(0.2, 0.4, 0.6, 0.8, 1.0 and 1.2) were adopted to investigate their influence on the results. It can be seen that adopting
equations (24) leads to underestimation of h and overestimation of IFR by a factor of 3, while equation (26) provides
reasonable results when K is taken as 1.0.
Fig. 11 shows a comparison of measured and estimated qbi, where measured qbi is obtained by dividing the measured Qsi
by (πDi2/4). Together with Fig. 10, it can be confirmed that qbi is underestimated if IFR is overestimated and vice versa, and
that qbi and IFR are estimated well if K is taken as 1.0 in equation (26). These corresponding trends in h, IFR and qbi suggest
the validity of the discussion in Section 3.2.
Fig. 12 shows a comparison of measured Qsi, measured Q (head load) and estimated Qb,0.1Do. Ideally, Qb,0.1Do is expected
to be between Qsi and Q. However, it is seen in Fig. 12 that equation (26) with K = 1.0, which provides the best matches in
h, IFR and qbi, leads to an overestimation of Qb,0.1Do. One reason might be that in practical situations, IFR values during
installation will be larger than those during the load test, partly because the higher penetration rate during installation causes
higher excess pore water pressure and reduces friction at the soil-pile interface. As equation (5) implicitly accounts for this,
applying IFR values measured (or accurately estimated) in dry sand to equation (5) will lead to the overestimation of Qb,0.1Do.
4.2. Static load test results on full-scale RCP piles
Results of four static load tests on RCP piles were collected. Site profiles are shown in Fig. 13, where the profile in A-
2016 was estimated from 12 SPT results around the test point. Pile specifications and installation conditions are shown in
Table 1. During Rotary Cutting Press-in, a pile was installed with repeated penetration and extraction, where downward
displacement (ld) and upward displacement (lu) was applied alternately. In addition, the upper limits of vertical jacking force
(FUL) and torque (TUL) were manually set, and the pile was extracted by lu if jacking force (F) or torque (T) reached their
upper limits. Symbols nT and fw in Table 1 represent the number of teeth on the pile base and the flowrate of water injected
near the pile base respectively. The values of vd, vu and vr are nominal and can become smaller when the values of F or T
increase. The load test conditions and the measured base capacity are summarized in Table 2, where tLT is the elapsed time
from the end of installation to the start of load test. Details of T-2007 and F-2008 can be found in Hirata et al. (2009) and
IPA (2014), while those of A-2016 are reported by Ishihara et al. (2016).
In T-2007, F-2008 and N-2017, a pile with teeth on its base was installed by Rotary Cutting Press-in with water injection
down to 0.9Do or 1Do above the final depth. The injection of water was then stopped (allowing minimal use if necessary)
and Rotary Cutting Press-in was continued down to the final depth. At the end of installation, axial loading was conducted
for a period of time. The jacking force and displacement recorded during this axial loading (Ft, lt) are summarized in Table
1. In A-2016, a pile with teeth on its base was installed by Rotary Cutting Press-in without water injection to 2m below the
ground, and was then pressed-in (axially jacked without rotation) to the final depth. In all tests, h was measured manually
during installation intermittently or at the beginning and the end of installation, using a tape measure.
1 2 3 4 5 6 7 8 9 10 11 12 13 14 15 16 17 18 19 20 21 22 23 24 25 26 27 28 29 30 31 32 33 34 35 36 37 38 39 40 41 42 43 44 45 46 47 48 49 50 51 52 53 54 55 56 57 58 59 60 61 62 63 64 65

Short title is appeared here.
The load test conditions including the loading conditions were determined to follow the recommendations of JGS (2002),
except for the shorter tLT in A-2016 and the existence of adjacent piles within the distance of 3Do from the center of the test
pile in T-2007 and F-2008. The shorter tLT will lead to lower pile capacity, but would not have significant influence on base
capacity as the time effect is generally only significant for the pile shaft (e.g. Skov & Denver, 1988; Chow et al., 1998;
White & Deeks, 2007). The existence of adjacent piles may lead to greater base capacity, considering the findings of
Yetginer et al. (2006) where the penetration resistance increased with the increasing number of piles and that the group
effect in terms of capacity was slightly greater than 1.
In the load test, base capacity (Qb,0.1Do) was defined to be the axial load measured by the strain gauges attached to the
inner surface near the pile base when the base displacement during the load test was 0.1Do. The position of the strain gauges
was 1Do above the pile base in T-2007, F-2008 and N-2017, and was 0.5Do above the base in A-2016, which leads to greater
measured values of Qb,0.1Do than when they are positioned at the base. On the other hand, in all the tests, strain gauge readings
were offset to be zero just before the start of the load test. This leads to the uncertainty of the residual load at the pile base
after the pile was installed down to the final depth. As a result, the measured values of Qb,0.1Do are likely to be smaller than
the actual values, as suggested by many researchers (e.g. White & Bolton, 2005).
4.3. Comparison of load test results and estimation results on full-scale RCP piles
The calculation was conducted with dz in equation (6) being 0.1m. The values of SPT N were interpolated linearly with
depth, but were not averaged over a depth range. The unit weight of soil (γ) was assumed to vary from 14 to 20 depending
on the soil type. The internal friction angle of soil (ϕ) was estimated by equation (27) (RTRI, 2013) where σv’ is the effective
overburden pressure, and the friction angle at the soil-pile interface (δsp) was assumed to be two-thirds of ϕ. β was obtained
either by equation (24) or (26), with K varied from 0.3 to 0.6.Values of N at or deeper than 18.3m in Site T were assumed
to be 50. Regarding A-2016, to account for the change of installation techniques (from Rotary Cutting Press-in to Standard
Press-in) at z = 2.0m, the method in Fig. 6 was adopted for 0m ≤ z < 2.0m while that in Fig. 5 was adopted for z ≥ 2.0m.
ϕ=1.85 (N
0.01σv’ + 0.7
)0.6
+ 28 (27)
Fig. 14 shows a comparison of the measured and estimated values of h during Rotary Cutting Press-in. Measured h
values were comparable to z in every test, implying that the pile was installed in an almost fully unplugged manner. It can
be confirmed that the estimated h agrees with the measured trend in each test. The transition of the plugging condition at
5m<z<10m in F-2009 is well reproduced. Looking at the results more closely, a slight underestimation can be found in T-
2009 and N-2017. Considering that these underestimating trends appear where soft fine soils exist, one reason might be the
effect of pore water pressure. Excess pore water pressure generated around the pile base during installation in soft
(contractile) fine soils might have increased the base stress (qbi) and reduced the frictional stress (τi), which allows easier
invasion of the soil from beneath the pile base to inside the pile. Regarding the influence of β values, equation (24) and
equation (26) with K=0.3 provide similar results. Increasing the value of K in equation (26) has little influence on the
estimated h, except for z>7m in A-2016. It is suggested that the reduction of τi due to rotation, as expressed by equation
1 2 3 4 5 6 7 8 9 10 11 12 13 14 15 16 17 18 19 20 21 22 23 24 25 26 27 28 29 30 31 32 33 34 35 36 37 38 39 40 41 42 43 44 45 46 47 48 49 50 51 52 53 54 55 56 57 58 59 60 61 62 63 64 65

Short title is appeared here.
(19), is much more influential than the variation of K from 0.3 to 0.6.
Fig. 15 shows a comparison of FFR values estimated by UWA-05 (equation (7)) and the proposed method. FFR
estimated by the proposed method varies with depth, while that estimated by UWA-05 does not. Focusing on the depths of
pile base where load tests were conducted (indicated by dotted lines in Fig. 15), FFR estimated by the proposed method are
similar to those estimated by UWA-05. The influence of β values is small at these depths, while it becomes greater with
depth in some depth ranges (10m<z<15m and z>18m in T-2007, 10m<z<20m in N-2017 and 4m<z<9m in A-2016).
Fig. 16 shows a comparison of measured and estimated values of Qb,0.1Do. The depth ranges where β values are influential
to Qb,0.1Do correspond to those where they are influential to FFR. At the depths of pile base where load tests were conducted,
the influence of β values is relatively small, and the estimated values are in good agreement with the measured values except
for the 10-20% underestimation in F-2009. This underestimation is due to the overestimation of IFR (and FFR) in
12m<z<15m, which can be confirmed by comparing the inclination of the estimated h-z curves in Fig. 14 with that of the
trends of the measured plots in 12m<z<15m. One reason for this would be the dilatancy of sands. The proposed method
assumes that the vertical stress acting on the upper plane of the infinitesimally thin disk of soil at the bottom of the soil
column (p) does not exceed the maximum value of the base stress experienced previously (qBI). If the soil above the disk
shows positive dilatancy, however, p would exceed qBI, leading to smaller IFR and greater Qb,0.1Do.
Comparison of Qb,0.1Do measured in the load tests and that estimated by IPA (2014) and the proposed method is
summarized in Fig. 17. Up to 50% underestimation is found in IPA (2014), while better agreement can be confirmed in the
proposed method. Adopting equation (24) or equation (26) with K=0.3 provides generally conservative estimation. Taking
K as 0.6 provides the best correlation with the measured values but leads to up to 15% overestimation in some cases.
5. Effects of analysis parameters
5.1. Averaging of SPT N
In design, it is usually the case that the values of qc or N averaged over a certain depth around the pile base are adopted
to estimate qb,0.1Do. In this sub-section, the influence of three averaging methods will be investigated. The first uses the
linearly interpolated value at the depth of the pile base without averaging, as adopted in Section 4 (‘Not averaged’). The
second applies a simple arithmetic averaging to the values from the pile base to 3Do below the pile base (‘Averaged (0~
3Do)’) as recommended in JRA (2017). The third averages from 4Do above to 1Do below the pile base (‘Averaged (-4~
1Do)’) as recommended in AIJ (2001).
Fig. 18 shows a comparison of Qb,0.1Do measured in the field tests with those estimated by the proposed method with β
values being obtained by equation (26) with K=0.5. It can be confirmed that the influence of the averaging methods is
obvious only in the depth ranges where SPT N rapidly varies with depth (especially near the depth of the upper surface of
the bearing stratum), hastening or delaying the timing of sensing the bearing stratum. As a result, ‘Averaged in 0~3 Do’
leads to overestimation and ‘Averaged in -4~1 Do’ leads to underestimation of Qb,0.1Do.
5.2. Other installation factors
Water injection in Rotary Cutting Press-in is believed to be effective in cooling the cutting teeth and preventing damage
to them due to high temperature, as well as in smoothening the penetration by building up excess pore water pressure around
1 2 3 4 5 6 7 8 9 10 11 12 13 14 15 16 17 18 19 20 21 22 23 24 25 26 27 28 29 30 31 32 33 34 35 36 37 38 39 40 41 42 43 44 45 46 47 48 49 50 51 52 53 54 55 56 57 58 59 60 61 62 63 64 65

Short title is appeared here.
the pile base and reducing the effective stress, and by lubricating the pile-soil interface and reducing the pile-soil friction
inside and outside of the pile. The excess pore pressure effect will influence qbi and τi as discussed in Sections 4.1 and 4.3,
but this effect was not incorporated into the proposed method.
As discussed in Section 4.3, the effect of dilatancy of sands was also ignored. The proposed method assumes that the
vertical stress acting on the upper plane of the infinitesimally thin disk of soil at the bottom of the soil column (p) does not
exceed the maximum value of the base stress experienced previously (qBI). If the soil above the disk dilates, p would exceed
qBI, leading to smaller IFR and greater Qb,0.1Do.
The effect of cutting teeth on the pile base was not directly considered in the proposed method. However, it could be
interpreted that this effect is implicitly considered by an adoption of small β values based on equation (24) or equation (26)
with K=0.3-0.6.
In the static load tests, strain gauge readings were zeroed just before the load tests (after the end of installation). This
leads to an uncertainty of the residual stress in the pile and an undermeasurement of Qb,0.1Do. On the other hand, the strain
gauges for obtaining Qb,0.1Do in the load tests were positioned at some distance above the pile base. This will make the
measured values of Qb,0.1Do greater than the base capacity at the very base of the pile. Effects of these two factors were also
ignored in this paper.
6. Conclusions
A method to estimate the plugging condition (IFR and FFR) and the base capacity of RCP piles from CPT or SPT results
was proposed, based on the framework of UWA-05. Estimation results were compared with the field test results, and the
followings were revealed.
(1) IFR during installation is well reproduced by the proposed method, if the ratio of frictional stress to vertical stress inside
the pile (β) is estimated appropriately.
(2) The base capacity estimated from SPT results by the proposed method with appropriate β values shows good agreement
with the values measured in the load tests than those estimated by IPA (2014).
(3) Assumption of an active failure to obtain β, as proposed by Randolph et al. (1991), gives slightly conservative estimation
of base capacity. Taking K as 0.6 in β=Ktanδsp, with K being the coefficient of earth pressure and δsp being the friction angle
at the soil-pile interface, provides the best correlation with the measured values but leads to up to 15% overestimation in
some cases.
(4) Averaging SPT N values over a certain depth range, as recommended in many design codes, is not effective in improving
the validity of the proposed method.
(5) Water injection during installation, dilatancy of sands in the pile, and cutting teeth on the pile base would have some
influence on the estimation results, but were ignored in the proposed method. The effect of residual stress was also ignored
in the load tests. Further work is necessary to clarify the extent of the influence of these factors to directly incorporate them
into the proposed method, while collecting results from additional field tests to verify it.
Acknowledgements
The authors are grateful to Dr. Yoshiaki Kikuchi and Mr. Takashi Kurashina for advices and cooperation in the model
1 2 3 4 5 6 7 8 9 10 11 12 13 14 15 16 17 18 19 20 21 22 23 24 25 26 27 28 29 30 31 32 33 34 35 36 37 38 39 40 41 42 43 44 45 46 47 48 49 50 51 52 53 54 55 56 57 58 59 60 61 62 63 64 65

Short title is appeared here.
test quoted in Section 4.1.
References
Architectural Institute of Japan (AIJ). 2001. Recommendations for Design of Building Foundations, 485p. (in Japanese)
Bearing Capacity of Piles (BCP) Committee. 1971. Field tests on piles in sand. Soils and Foundations, Vol. 11, No. 2, pp. 29-50.
Bond, T. 2011. Rotary jacking of tubular piles. M.Eng. Project Report, Cambridge University Department of Engineering, 50p.
Chow, F. C., Jardine, R. J., Brucy, F. and Nauroy, J. F. 1998. Effects of time on capacity of pipe piles in dense marine sand. Journal
of Geotechnical and Geoenvironmental Engineering, Vol. 124, No. 3, pp. 254-264.
Deeks, A. D. and White, D. J. 2007. Centrifuge modelling of the base response of closed-ended jacked piles. Advances in Deep
Foundations, pp. 241-251.
Dingle, H. 2006. The testing and analysis of jacked foundation piles. M.Eng. Project Report, Cambridge University Department
of Engineering, 50p.
Hirata, H., Suzuki, T., Matsui, N. and Yasuoka, H. 2009. Bearing capacity performance of rotary press-in method (Gyropress
Method): part 1 (vertical capacity). Proceedings of the 65th JSCE (Japanese Society of Civil Engineers) Annual Meeting,
pp. 41-42. (in Japanese)
International Press-in Association (IPA). 2014. Design and Construction Manual for Earth Retaining Walls with Tubular Piles
Installed by Gyropress (Rotary Cutting Press-in) Method, 143p. (in Japanese)
International Press-in Association (IPA). 2016. Press-in retaining structures: a handbook, First edition 2016, pp. 4.23-4.24.
Ishihara, Y., Haigh, S. and Bolton, M. D. 2015. Estimating base resistance and N value in rotary press-in. Soils and Foundations,
Vol. 55, No. 4, pp. 788-797.
Ishihara, Y., Ogawa, N., Okada, K., Inomata, K., Yamane, T. and Kitamura, A. 2016. Model test and full-scale field test on vertical
and horizontal resistance of hatted tubular pile. Proceedings of the Third International Conference Geotec Hanoi 2016 -
Geotechnics for Sustainable Infrastructure development, pp. 131-139.
The Japanese Geotechnical Society (JGS). 2002. Method for static axial compressive load test of single piles. Standards of
Japanese Geotechnical Society for Vertical Load Tests of Piles, pp. 49-53.
Japan Road Association (JRA). 2002. Specifications for Highway Bridges: Part 1 Common & Part 4 Substructures, 567p. (in
Japanese)
Japan Road Association (JRA). 2012. Specifications for Highway Bridges: Part 4 Substructures, 586p.
Japan Road Association (JRA). 2017. Specifications for Highway Bridges: Part 4 Substructures, 569p. (in Japanese)
Kerisel, J. 1961. Deep foundation in sands: variation of ultimate bearing capacity with soil density, depth, diameter and speed.
Proceedings of the 5th International Conference on Soil Mechanics and Foundation Engineering, Vol. 2, pp. 73-83. (in
French)
Kurashina, T. 2016. Model pile penetration test on the mechanism of mobilization of base capacity of an open-ended pile. Master’s
thesis, Tokyo University of Science, 106p. (in Japanese)
Lehane, B. M. and Gavin, K. G., 2001. Base resistance of jacked pipe piles in sand. ASCE Journal of Geotechnical and
Geoenvironmental Engineering, Vol. 127, No. 6, pp.473-480.
Liyanapathirana, D. S., Deeks, A. D. and Randolph, M. F. 2001. Numerical modelling of the driving response of thin-walled
open-ended piles. International Journal for Numerical and Analytical Methods on Geomechanics, Vol. 25, No. 9, pp. 933-
1 2 3 4 5 6 7 8 9 10 11 12 13 14 15 16 17 18 19 20 21 22 23 24 25 26 27 28 29 30 31 32 33 34 35 36 37 38 39 40 41 42 43 44 45 46 47 48 49 50 51 52 53 54 55 56 57 58 59 60 61 62 63 64 65

Short title is appeared here.
953.
Meyerhoff, G. G. 1956. Penetration tests and bearing capacity of cohesionless soils. Journal of the Soil Mechanics and
Foundations Division, Vol. 82, Issue 1, pp. 1-19.
Meyerhoff, G. G. and Valsangkar, A. J. 1977. Bearing capacity of piles in layered soils. Proceedings of the 8th International
Conference on Soil Mechanics and Foundation Engineering, Vol. 1, pp. 645-650.
Railway Technical Research Institute (RTRI). 2013. Design Standards for Railway Structures and Commentary (Earth Structures).
(in Japanese)
Randolph, M. F., Leong, E. C. and Houlsby, G. T. 1991. One-dimensional analysis of soil plugs in pipe piles. Geotechnique, Vol.
41, No. 4, pp. 587-598.
Skov, R. and Denver, H. 1988. Time-dependence of bearing capacity of piles. Proceedings of the Third International Conference
on Application of Stress-Wave Theory to Piles, pp. 1-10.
White, D. J. and Bolton, M. D. 2005. Comparing CPT and pile base resistance in sand. Proceedings of the Institution of Civil
Engineers, Geotechnical Engineering 158, pp. 3-14.
White, D. J. and Deeks, A. D. 2007. Recent research into the behaviour of jacked foundation piles. Advances in Deep Foundations:
International Workshop on Recent Advances of Deep Foundations (IWDPF07), Kikuchi, Yoshiaki, Otani, Jun, Kimura,
Makoto and Morikawa, Yoshiyuki (eds.), Japan. CRC Press. pp. 3-26.
White, D. J., Deeks, A. D. and Ishihara, Y. 2010. Novel piling: axial and rotary jacking. Proceedings of the 11th International
Conference on Geotechnical Challenges in Urban Regeneration, London, UK, CD, 24p.
Xu, X., Schneider, J. A. and Lehane, B. M. 2008. Cone penetration test (CPT) methods for end-bearing assessment of open-and
closed-ended driven piles in siliceous sand. Canadian Geotechnical Journal, Vol. 45, No. 8, pp. 1130-1141.
Yetginer, A. G., White, D. J., Bolton, M. D. 2006. Field measurements of the stiffness of jacked piles and pile groups.
Geotechnique 56, No. 5, pp. 349-354.
1 2 3 4 5 6 7 8 9 10 11 12 13 14 15 16 17 18 19 20 21 22 23 24 25 26 27 28 29 30 31 32 33 34 35 36 37 38 39 40 41 42 43 44 45 46 47 48 49 50 51 52 53 54 55 56 57 58 59 60 61 62 63 64 65

Short title is appeared here.
List of notations
Ab,closed Cross-sectional area of the closed-ended pile
Di Inner diameter of the pile
Do Outer diameter of the pile
Dr Relative density of the soil
F Jacking force applied to the pile
FFR Final Filling Ratio (the value of IFR at the end of installation)
Ft Jacking force recorded in the axial loading at the end of installation
FUL Upper limit of F
fw Flowrate of water injected near the pile base
h Length of the soil column inside the pile
IFR Incremental Filling Ratio
K Coefficient of earth pressure
ld Downward displacement of the pile
lt Pile displacement recorded in the axial loading at the end of installation
lu Upward displacement of the pile
N SPT N value
Na1 SPT N value averaged by a method recommended by JRA (2012)
Na2 SPT N value averaged by a method recommended by JRA (2017)
nT Number of cutting teeth on the pile base
p Vertical stress on the upper plane of the thin disk of soil at the bottom of the soil column
qbi Stress on the bottom of the soil column inside the pile
qbi′ Effective stress on the bottom of the soil column inside the pile
qBI Maximum value of qbi observed previously (at shallower depths than the present depth of the pile base)
qb,pl Unit base capacity defined by a plunging load
qb,0.1Do Unit base capacity defined at the pile base displacement of 0.1Do
Q Load applied on the pile head
Qb,0.1Do Base capacity at a pile base displacement of 0.1Do
Qsi Total frictional force on the inner surface of the pile
qc CPT cone resistance
qc,ave CPT cone resistance averaged by the Dutch method
T Torque applied to the pile
tLT Time from the end of installation to the start of load test
TUL Upper limit of T
vd Vertical downward velocity of the pile
vr Rotational velocity of the pile surface
z Depth of the pile base
Notations, figures & tables

Short title is appeared here.
zbs Embedment depth into the bearing stratum
β Coefficient linking qbi′ and τi
γ Unit weight of soil
γw Unit weight of water
δsp Friction angle at the soil-pile interface
λ Coefficient linking qbi and qc
σv’ Effective overburden pressure
τi Frictional stress mobilized at the soil-pile interface inside the pile
ϕ Internal friction angle of soil

Short title is appeared here.
Fig. 1 Symbols related with base capacity
Fig. 2 Reduction of qb,0.1Do with zbs (after JRA (2012))
Fig. 3 Infinitesimally thin disk of soil at the bottom of the soil column

Short title is appeared here.
Fig. 4 Correlation between qbi/qc and IFR (after Lehane & Gavin, 2001)
Fig. 5 Procedure for estimating FFR of jacked piles from SPT N
Fig. 6 Procedure for estimating FFR of RCP piles from SPT N

Short title is appeared here.
Fig. 7 CPT profile of the model ground
Fig. 8 Test pile used in the model test
Fig. 9 Simple investigation to estimate δsp

Short title is appeared here.
Fig. 10 Comparison of measured and estimated h and IFR
Fig. 11 Comparison of measured and estimated qbi
Fig. 12 Comparison of measured Qsi, Q and estimated Qb,0.1Do

Short title is appeared here.
(a) T-2007 (b) F-2008 (c) N-2017 (d) A-2016
Fig. 13 Site profiles
(a) T-2007 (b) F-2008 (c) N-2017 (d) A-2016
Fig. 14 Comparison of measured and estimated h

Short title is appeared here.
(a) T-2007 (b) F-2008 (c) N-2017 (d) A-2016
Fig. 15 Comparison of UWA-05 and the proposed method in estimating FFR
(a) T-2007 (b) F-2008 (c) N-2017 (d) A-2016
Fig. 16 Comparison of measured and estimated Qb,0.1Do of RCP piles

Short title is appeared here.
Fig. 17 Comparison of IPA (2014) and the proposed method in estimating Qb,0.1Do
(a) T-2007 (b) F-2008 (c) N-2017 (d) A-2016
Fig. 18 Measured and estimated Qbf with different averaging techniques

Short title is appeared here.
Table 1 Pile specifications and installation conditions in static load tests
Table 2 Conditions and results of static load tests