asset management plan update - northpower
TRANSCRIPT

March 2020
Asset Management Plan Update
2020 - 2030

© COPYRIGHT 2020 Northpower Limited.
All rights reserved. This document is protected by copyright vested in Northpower Limited (Northpower). Any breach of Northpower’s copyright may be prevented by legal proceedings seeking remedies including injunctions, damages and costs. Any material prepared in breach of Northpower’s copyright must be delivered to Northpower immediately upon request by Northpower.
DISCLAIMER The information in this document is provided in good-faith and represents Northpower’s opinion as at the date of publication. Northpower does not make any representations, warranties or undertakings either express or implied, about the accuracy or the completeness of the information provided; and the act of making the information available does not constitute any representation, warranty or undertaking, either express or implied. This document does not, and is not intended to; create any legal obligation or duty on Northpower. To the extent permitted by law, no liability (whether in negligence or other tort, by contract, under statute or in equity) is accepted by Northpower by reason of, or in conjunction with, any statement made in this document or by any actual or purported reliance on it by any party. Northpower reserves all rights to alter, in its absolute discretion, any of the information provided in this document.
northpower.com

Asset Management Plan Update
2020 - 2030
Table of Contents
1. Asset Management Plan Update 12. Material Changes 5
2.1 Material changes to Network Development Plan2.2 Material changes to Life Cycle Asset Management Plan2.3 Material changes to Asset Management Practices2.4 Material changes to Expenditure Forecasts
3. Schedules 133.1 Schedule 11a: Report on Forecast Capital Expenditure3.2 Schedule 11b: Report on Forecast Operational Expenditure3.3 Schedule 12a: Report on Asset Condition3.4 Schedule 12b: Report on Forecast Capacity 3.5 Schedule 12c: Report on Forecast Network Demand 3.6 Schedule 12d: Report on Forecast Interruptions and Duration3.7 Schedule 14a: Mandatory Explanatory Notes on Forecast Information
4. Director Certification 31


Section 1: Asset Management
Plan Update


Northpower Limited | Asset Management Plan Update 2020-2030 Page 1
Section 1: Asset Management Plan Update
1 Asset Management Plan Update This supplement to our Asset Management Plan published in March 2018 (for the period 2018-2028) provides an update to Northpower’s approach to managing its assets and delivering the planned programmes of capital and operational spend, as well as planned maintenance work for the period 1 April 2020 to 31 March 2030.
Northpower’s 2018 Asset Management Plan is available from Northpower’s website at: http://northpower.com/about/disclosures/asset-management-plan. This update should be read in conjunction with the 2018 AMP (and subsequent 2019 AMP Update) and outlines how we are managing our Network assets for the efficient and reliable delivery of electricity to consumers.
Covered in this update are:
1. Material changes to the network development plans disclosed in the last AMP;
2. Material changes to the lifecycle asset management (maintenance and renewal) plans disclosed in the last AMP;
3. Material changes to Northpower’s asset management practices; and
4. An outline of the reasons for material changes to the previous disclosures in the Report on Forecast Capital Expenditure set out in Schedule 11a and Report on Forecast Operational Expenditure set out in Schedule 11b.
Stakeholder FeedbackNorthpower encourages feedback to enable continued improvement in meeting the needs of its consumers and stakeholders.
Feedback should be addressed to:
Roy HamiltonAsset Investment and Strategy Manager
NorthpowerPrivate Bag 9018Whangarei Mail CentreWhangarei 0148
Email: [email protected]


Section 2: Material Changes

Northpower Limited | Asset Management Plan Update 2020-2030 Page 5
Section 2: Material Changes
2 Material Changes
2.1 Overview Since the 2019 AMP Update we have continued to review the existing Asset Management Plan for the electricity business and our approach to investment and maintenance with a focus on continual improvement. The key inputs into this review have included:
• A full review of forecast changes in investment need relating to aging major items of plant and load growth for the 10-year planning period FY21-FY30.
• A full review of unit costs associated with our investment programmes, noting a general trend to increased delivery costs across all work delivery streams.
• Reviewing security of supply criteria against updated load and growth forecasts for high growth areas (primarily Mangawhai and Bream Bay).
• A review of Opex and Capex programs to ensure SAIDI and SAIFI remain in line with long-term averages, taking into account an aging asset base, increases in planned work and ongoing vegetation challenges.
This 2020 AMP Update summarises the resulting changes to our Asset Management Plan.
2.2 Material Changes to Network Development Plan
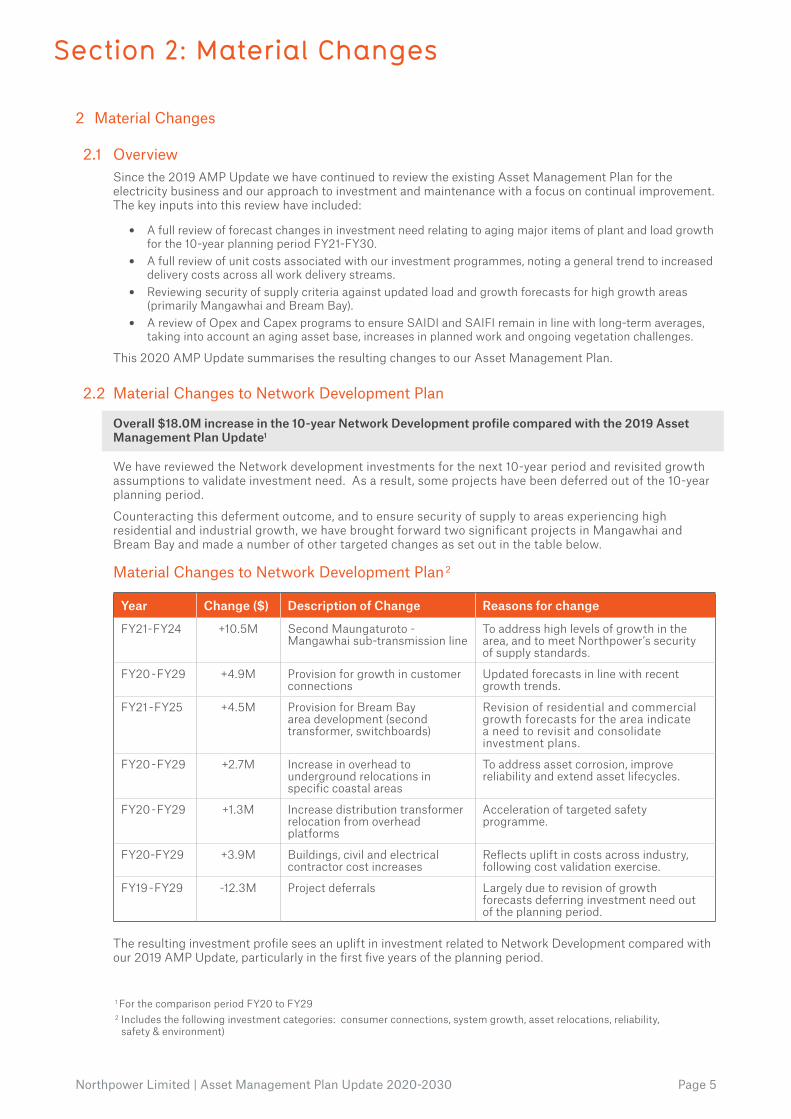
Overall $18.0M increase in the 10-year Network Development profile compared with the 2019 Asset Management Plan Update1
We have reviewed the Network development investments for the next 10-year period and revisited growth assumptions to validate investment need. As a result, some projects have been deferred out of the 10-year planning period.
Counteracting this deferment outcome, and to ensure security of supply to areas experiencing high residential and industrial growth, we have brought forward two significant projects in Mangawhai and Bream Bay and made a number of other targeted changes as set out in the table below.
Material Changes to Network Development Plan2
Year Change ($) Description of Change Reasons for change
FY21 - FY24 +10.5M Second Maungaturoto - Mangawhai sub-transmission line
To address high levels of growth in the area, and to meet Northpower’s security of supply standards.
FY20 - FY29 +4.9M Provision for growth in customer connections
Updated forecasts in line with recent growth trends.
FY21 - FY25 +4.5M Provision for Bream Bay area development (second transformer, switchboards)
Revision of residential and commercial growth forecasts for the area indicate a need to revisit and consolidate investment plans.
FY20 - FY29 +2.7M Increase in overhead to underground relocations in specific coastal areas
To address asset corrosion, improve reliability and extend asset lifecycles.
FY20 - FY29 +1.3M Increase distribution transformer relocation from overhead platforms
Acceleration of targeted safety programme.
FY20-FY29 +3.9M Buildings, civil and electrical contractor cost increases
Reflects uplift in costs across industry, following cost validation exercise.
FY19 - FY29 -12.3M Project deferrals Largely due to revision of growth forecasts deferring investment need out of the planning period.
The resulting investment profile sees an uplift in investment related to Network Development compared with our 2019 AMP Update, particularly in the first five years of the planning period.
1 For the comparison period FY20 to FY292 Includes the following investment categories: consumer connections, system growth, asset relocations, reliability,
safety & environment)

Page 6 Northpower Limited | Asset Management Plan Update 2020-2030
10-Year Network Development Investment Profile (2020 AMP vs. 2019 AMP) - $M
Legend
0
2
4
6
8
10
12
14
FY20 FY21 FY22 FY23 FY24 FY25 FY26 FY27 FY28 FY29
0
5
10
15
20
25
FY20 FY21 FY22 FY23 FY24 FY25 FY26 FY27 FY28 FY29
-
5
10
15
20
25
30
35
FY21 FY22 FY23 FY24 FY25 FY26 FY27 FY28 FY29 FY30
Network Development - 2020 AMPNetwork Development - 2019 AMP
Asset Life Cycle - 2020 AMPAsset Life Cycle - 2019 AMP
2019 OPEX Forecast
2020 OPEX Forecast
2019 CAPEX Forecast
2020 CAPEX Forecast
2.3 Material Changes to Asset Life Cycle Management
Overall $24.7M increase in the 10-year Asset Life Cycle Management profile compared with the 2019 Asset Management Plan Update.3
Our latest review of our Asset Life Cycle Management Plan noted a material increase in building, civils and electrical contractor market rates. We have validated that these increases are real and likely to persist into the future even with competitive pressure. We will continue to look at options available to ensure these project works are delivered in the most cost effective manner.
We have also revised and improved our overhead inspection standard to improve the quality of inspection data received, which in turn enables enhanced asset condition assessments and replacement decisions. The key changes proposed are set out in the table below:
Material Changes to Asset Life Cycle Management Plan4
Year Change ($) Description of Change Reason for change FY22 - FY23 +2.5M New mobile substation To enhance restoration of supply in fault
situations and enable supply to be maintained during rural substation maintenance.
FY20 - FY29 +2.3M Oil filled RMUs Increase in rate of replacement of RMUs as a result of condition based assessments.
FY21 - FY29 +1.3M New allocation corrective Capex - 110kV towers & equipment
To reflect increased need following condition assessments.
FY21 - FY27 +1.2M New network clearances 3D model (LiDAR)
To enable enhanced management of vegetation priorities and asset clearances.
FY22 - FY24 +1.2M Asset management system replacement
Replacement of end of life system.
FY21 - FY29 +2.5M Provision for overhead switch replacements
Increased need based on emerging defect rates in existing overhead switches.
FY20 - FY29 +15.7M Buildings, civil and electrical contractor cost increases
Reflects existing uplift in costs across industry, following cost validation exercise.
FY19 - FY29 -6.0M Targeted deferrals Result of validation of asset condition and resulting amendments to the asset’s Health Indices.
Section 2
3 For the comparison period FY20 to FY294 Includes the following investment categories: asset replacement and renewal, non-network assets
Northpower Limited | Asset Management Plan Update 2020-2030 Page 7
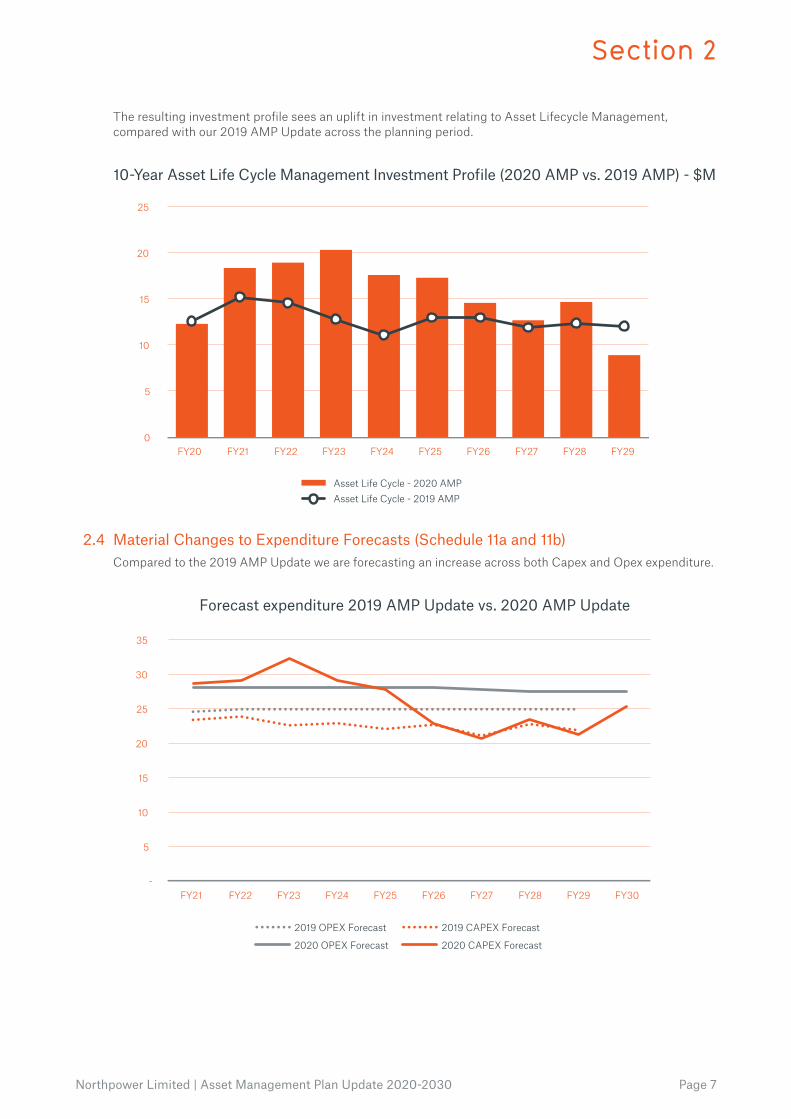
The resulting investment profile sees an uplift in investment relating to Asset Lifecycle Management, compared with our 2019 AMP Update across the planning period.
10-Year Asset Life Cycle Management Investment Profile (2020 AMP vs. 2019 AMP) - $M
Legend
0
2
4
6
8
10
12
14
FY20 FY21 FY22 FY23 FY24 FY25 FY26 FY27 FY28 FY29
0
5
10
15
20
25
FY20 FY21 FY22 FY23 FY24 FY25 FY26 FY27 FY28 FY29
-
5
10
15
20
25
30
35
FY21 FY22 FY23 FY24 FY25 FY26 FY27 FY28 FY29 FY30
Network Development - 2020 AMPNetwork Development - 2019 AMP
Asset Life Cycle - 2020 AMPAsset Life Cycle - 2019 AMP
2019 OPEX Forecast
2020 OPEX Forecast
2019 CAPEX Forecast
2020 CAPEX Forecast
2.4 Material Changes to Expenditure Forecasts (Schedule 11a and 11b)Compared to the 2019 AMP Update we are forecasting an increase across both Capex and Opex expenditure.
Forecast expenditure 2019 AMP Update vs. 2020 AMP Update
Legend
0
2
4
6
8
10
12
14
FY20 FY21 FY22 FY23 FY24 FY25 FY26 FY27 FY28 FY29
0
5
10
15
20
25
FY20 FY21 FY22 FY23 FY24 FY25 FY26 FY27 FY28 FY29
-
5
10
15
20
25
30
35
FY21 FY22 FY23 FY24 FY25 FY26 FY27 FY28 FY29 FY30
Network Development - 2020 AMPNetwork Development - 2019 AMP
Asset Life Cycle - 2020 AMPAsset Life Cycle - 2019 AMP
2019 OPEX Forecast
2020 OPEX Forecast
2019 CAPEX Forecast
2020 CAPEX Forecast
Section 2
Page 8 Northpower Limited | Asset Management Plan Update 2020-2030
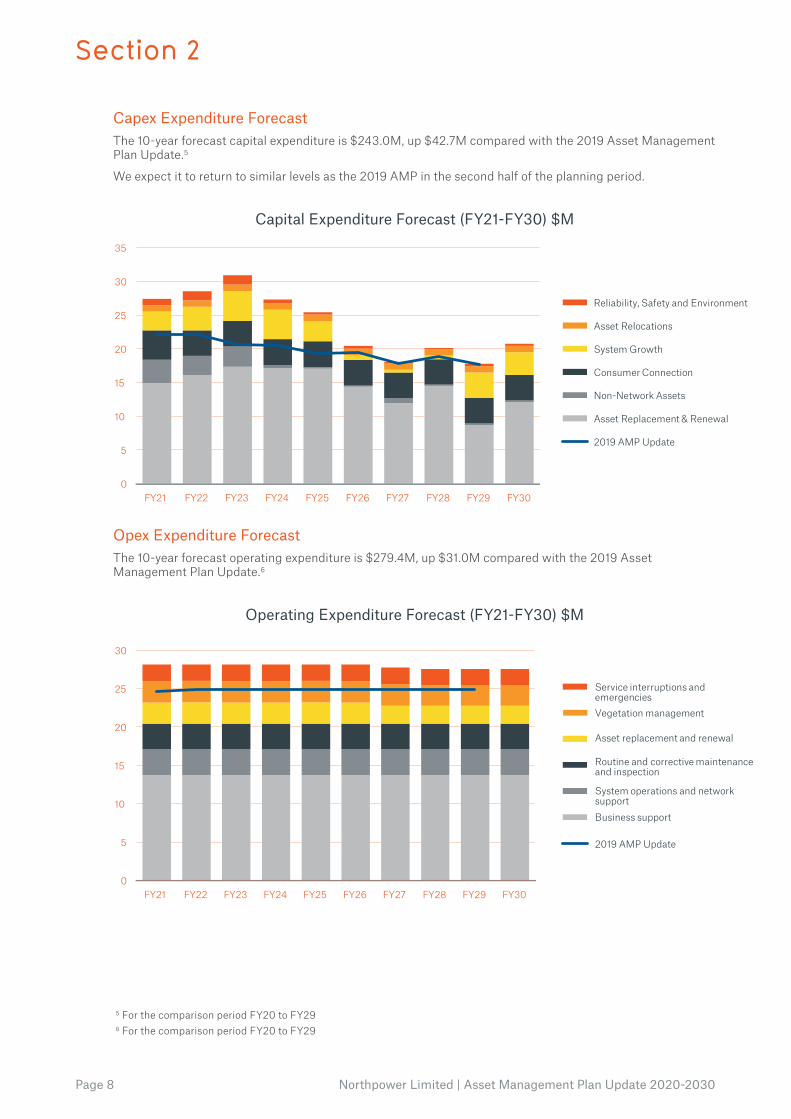
Capex Expenditure Forecast The 10-year forecast capital expenditure is $243.0M, up $42.7M compared with the 2019 Asset Management Plan Update.5
We expect it to return to similar levels as the 2019 AMP in the second half of the planning period.
Capital Expenditure Forecast (FY21-FY30) $M
0
5
10
15
20
25
30
35
FY21 FY22 FY23 FY24 FY25 FY26 FY27 FY28 FY29 FY30
Reliability, Safety and Environment
Asset Relocations
System Growth
Consumer Connection
Non-Network Assets
Asset Replacement & Renewal
2019 AMP Update
0
5
10
15
20
25
30
FY21 FY22 FY23 FY24 FY25 FY26 FY27 FY28 FY29 FY30
Service interruptions and emergencies Vegetation management
Asset replacement and renewal
Routine and corrective maintenance and inspection
System operations and network support Business support
2019 AMP Update
Capital Expenditure Forecast (FY21-FY30) $M
Operating Expenditure Forecast (FY21-FY30) $M
Opex Expenditure Forecast The 10-year forecast operating expenditure is $279.4M, up $31.0M compared with the 2019 Asset Management Plan Update.6
Operating Expenditure Forecast (FY21-FY30) $M
0
5
10
15
20
25
30
35
FY21 FY22 FY23 FY24 FY25 FY26 FY27 FY28 FY29 FY30
Reliability, Safety and Environment
Asset Relocations
System Growth
Consumer Connection
Non-Network Assets
Asset Replacement & Renewal
2019 AMP Update
0
5
10
15
20
25
30
FY21 FY22 FY23 FY24 FY25 FY26 FY27 FY28 FY29 FY30
Service interruptions and emergencies Vegetation management
Asset replacement and renewal
Routine and corrective maintenance and inspection
System operations and network support Business support
2019 AMP Update
Capital Expenditure Forecast (FY21-FY30) $M
Operating Expenditure Forecast (FY21-FY30) $M
Section 2
5 For the comparison period FY20 to FY29 6 For the comparison period FY20 to FY29
Northpower Limited | Asset Management Plan Update 2020-2030 Page 9
Responding to service interruptions and emergencies
+$2.11M Uplift to address aging network and an allowance for increased faults due to more significant weather events stressing end of life overhead assets.
Vegetation management +$4.80M An uplift in vegetation management to deliver a 5-year vegetation management cycle (better aligned with tree growth rates).
Routine and corrective maintenance and inspection activities
+$5.47M Increase in quantities of corrective maintenance to ensure focus remains on ensuring timeliness of rectifying defects and enhancing maintenance programmes, as well as an increase in contractor costs.
Asset replacement and renewal
+$573k Impact of contractor rates review for asset replacement and renewal activities.
System operations and network support
+$2.13M Reflects ongoing investment in ADMS and maintaining supporting systems, as well as enhanced operational capability and resiliency.
Business support +$15.94M Reflects increases in direct and indirect costs to support the network.
2.5 Material Changes to Asset Management PracticesThe 2019 AMP Update outlined a number of initiatives aimed to improve our asset management processes. Further refinement over the last year includes:
• Revision of our Network organisational structure to improve focus and outcomes in asset management and delivery of capital and maintenance works. This is supplemented by additional resources to support the asset strategy, delivery and operations functions.
• Refresh of the overhead inspection standards to facilitate better information capture, and ultimately asset management decisions.
• We have further developed our Asset Health Indices and Asset Criticality processes and framework. Several assets have had condition assessments undertaken (including some sub-transmission conductors and zone sub-station transformers), resulting in a re-classification of the asset’s Health Indices (and an adjustment to the investment plan).
Section 2 Section 2

Page 10 Northpower Limited | Asset Management Plan Update 2020-2030

Northpower Limited | Asset Management Plan Update 2020-2030 Page 11
Section 3: Schedules

Section 3
Northpower Limited | Asset Management Plan Update 2020-2030 Page 13
CommerceCommissionInformationDisclosureTemplate
NPAMPYBDisclosureSchedules2020v1.4.xlsx 1 CoverSheet
EDBInformationDisclosureRequirementsInformationTemplates
forSchedules11a–13
CompanyName NorthpowerLtd
DisclosureDate 31March2020
AMPPlanningPeriodStartDate(firstday) 1April2020
TemplatesforSchedules11a–13(AssetManagementPlan)TemplateVersion4.1.Prepared21December2017
Section 3
Page 14 Northpower Limited | Asset Management Plan Update 2020-2030
CommerceCom
miss
ionInform
ationDisclosureTem
plate
NPAM
PYB
Disc
losureSched
ules202
0v1.4.xlsx
4S11a.Cap
exForecast
Com
pany
Nam
eAM
PPl
anni
ngP
erio
d
SCHE
DULE
11a
:REP
ORT
ON
FO
RECA
STC
APIT
ALE
XPEN
DITU
RE
sch
ref
7Cu
rren
tYea
rCY
CY+1
CY+2
CY+3
CY+4
CY+5
CY+6
CY+7
CY+8
CY+9
CY+1
0
8fory
eare
nded
31M
ar2
031
Mar
21
31M
ar2
231
Mar
23
31M
ar2
431
Mar
25
31M
ar2
631
Mar
27
31M
ar2
831
Mar
29
31M
ar3
0
911
a(i):
Exp
endi
ture
on
Asse
tsF
orec
ast
$000
(in
nom
inal
dol
lars
)
10Co
nsum
ercon
nection
5,13
05,64
43,92
14,04
54,17
34,30
54,44
24,58
34,72
94,87
95,03
511
System
growth
4,50
92,77
53,55
64,60
84,64
73,27
882
042
360
44,42
74,03
712
Assetrep
lacemen
tand
rene
wal
11,452
14
,885
16
,385
18
,033
18
,152
18
,476
15
,857
13
,443
16
,647
10
,116
14
,412
13
Assetrelocations
490
945
965
984
1,00
41,02
41,04
41,06
51,08
71,10
81,13
014
Reliability,sa
fetyand
enviro
nmen
t:15
Qua
lityofsu
pply
--
--
--
--
--
-16
Legisla
tivean
dregu
latory
--
--
--
--
--
-17
Otherre
liability,sa
fetyand
enviro
nmen
t1,54
495
51,37
81,49
462
739
042
726
520
739
935
318
Tota
lrel
iabi
lity,
safe
tya
nde
nviro
nmen
t1,54
495
51,37
81,49
462
739
042
726
520
739
935
319
Expe
nditu
reo
nne
twor
kas
sets
23,125
25
,204
26
,206
29
,165
28
,603
27
,473
22
,590
19
,779
23
,273
20
,929
24
,967
20
Expe
nditu
reonno
n-ne
tworkassets
1,98
73,45
42,95
13,12
954
726
022
785
722
032
833
521
Expe
nditu
reo
nas
sets
25,112
28
,658
29
,157
32
,295
29
,150
27
,733
22
,816
20
,636
23
,492
21
,258
25
,302
22 23pl
usCo
stoffinan
cing
126
143
146
161
146
139
114
103
117
106
127
24le
ssVa
lueofcap
italcon
tributions
4,30
04,38
42,63
02,72
22,81
92,91
83,02
13,12
83,23
83,35
23,47
125
plus
Valueofvestedassets
--
--
--
--
--
-26 27
Capi
tale
xpen
ditu
refo
reca
st20
,938
24
,417
26
,673
29
,734
26
,477
24
,954
19
,909
17
,611
20
,372
18
,012
21
,958
28 29Assetscom
miss
ione
d19
,263
22
,464
24
,539
27
,355
24
,359
22
,957
18
,317
16
,202
18
,742
16
,571
20
,201
30Cu
rren
tYea
rCY
CY+1
CY+2
CY+3
CY+4
CY+5
CY+6
CY+7
CY+8
CY+9
CY+1
031
fory
eare
nded
31M
ar2
031
Mar
21
31M
ar2
231
Mar
23
31M
ar2
431
Mar
25
31M
ar2
631
Mar
27
31M
ar2
831
Mar
29
31M
ar3
0
32$0
00(i
nco
nsta
ntp
rices
)33
Con
sumercon
nection
5,79
55,64
43,84
13,88
43,92
93,97
44,01
94,06
64,11
34,16
04,20
934
Systemgrowth
4,87
32,77
53,48
34,42
54,37
53,02
574
237
552
53,77
53,37
535
Assetre
placem
enta
ndre
newal
9,88
114
,885
16
,048
17
,316
17
,088
17
,052
14
,348
11
,925
14
,478
8,62
512
,047
36
Assetre
locatio
ns25
594
594
594
594
594
594
594
594
594
594
537
Reliability,sa
fetyand
enviro
nmen
t:38
Qua
lityofsu
pply
--
--
--
--
--
-39
Legisla
tivean
dregu
latory
--
--
--
--
--
-40
Otherre
liability,sa
fetyand
enviro
nmen
t1,05
795
51,35
01,43
559
036
038
623
518
034
029
541
Tota
lrel
iabi
lity,
safe
tya
nde
nviro
nmen
t1,05
795
51,35
01,43
559
036
038
623
518
034
029
542
Expe
nditu
reo
nne
twor
kas
sets
21,861
25
,204
25
,667
28
,005
26
,927
25
,356
20
,440
17
,546
20
,241
17
,845
20
,871
43
Expe
nditu
reonno
n-ne
tworkassets
2,41
13,45
42,89
03,00
551
524
020
576
019
128
028
044
Expe
nditu
reo
nas
sets
24,272
28
,658
28
,557
31
,010
27
,442
25
,596
20
,645
18
,306
20
,432
18
,125
21
,151
45 46Su
bcom
pone
ntso
fexp
endi
ture
on
asse
ts(w
here
kno
wn)
47En
ergyefficien
cyand
dem
andsid
eman
agem
ent,redu
ctionofene
rgylosses
85
85
185
185
185
85
85
85
85
85
85
48Overheadtound
ergrou
ndcon
version
-55
055
055
055
055
055
055
055
055
055
049
Researchand
develop
men
t50
50
50
50
60
70
80
85
90
10
010
0
Nor
thpo
wer
Ltd
1A
pril
2020
–3
1M
arch
203
0
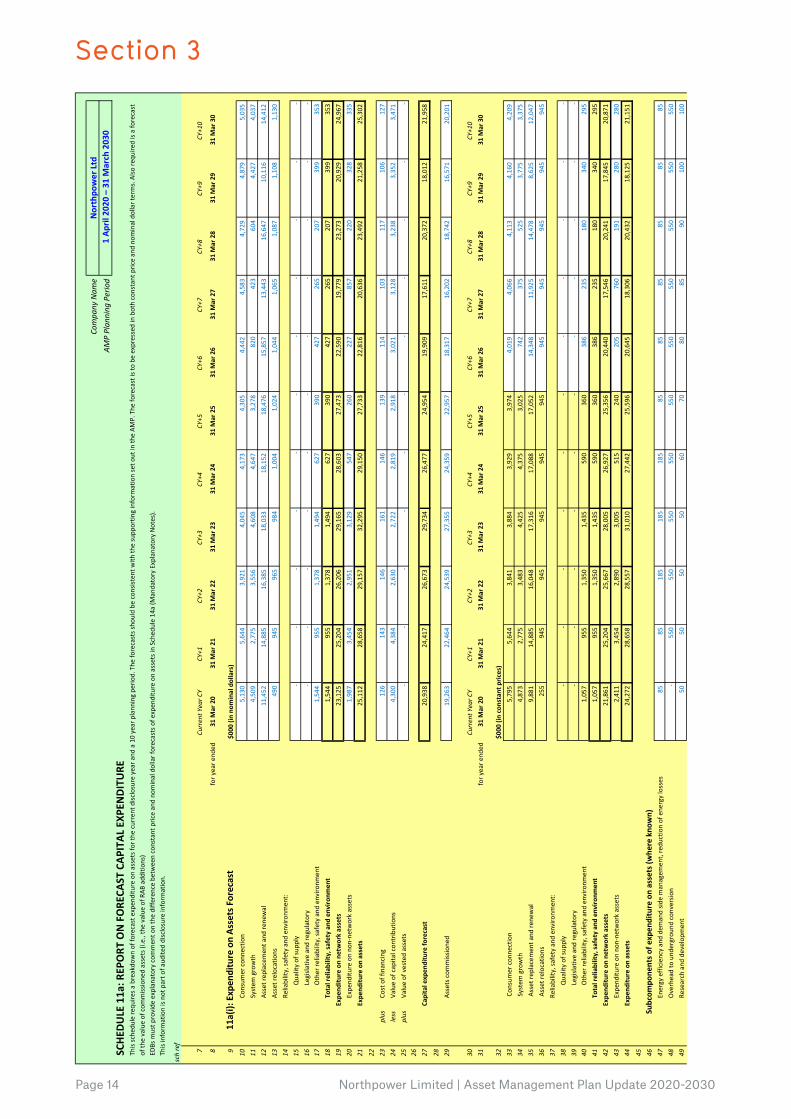
Thissche
dulere
quire
sabreakdo
wnoffo
recastexpen
ditureonassetsfo
rthe
currentdisc
losureyeara
nda10yearplann
ingpe
riod.The
forecastss
houldbe
con
sistentwith
thesupp
ortin
ginform
ationseto
utinth
eAM
P.The
forecastisto
beexpressedinbothconstantpric
ean
dno
minaldollarterms.Also
requ
iredisaforecast
ofth
evalueofcom
miss
ione
dassets(i.e.,thevalueofRAB
add
ition
s)
EDBsm
ustp
rovide
explana
torycom
men
tonthediffe
rencebe
twee
nconstantpric
ean
dno
minaldollarforecastsofe
xpen
ditureonassetsinSched
ule14
a(M
anda
toryExplana
toryNotes).
Thisinform
ationisno
tparto
faud
iteddisclosureinform
ation.

Section 3
Northpower Limited | Asset Management Plan Update 2020-2030 Page 15
CommerceCom
miss
ionInform
ationDisclosureTem
plate
NPAM
PYB
Disc
losureSched
ules202
0v1.4.xlsx
5S11a.Cap
exForecast
Com
pany
Nam
eAM
PPl
anni
ngP
erio
d
SCHE
DULE
11a
:REP
ORT
ON
FO
RECA
STC
APIT
ALE
XPEN
DITU
RE
sch
ref
Nor
thpo
wer
Ltd
1A
pril
2020
–3
1M
arch
203
0
Thissche
dulere
quire
sabreakdo
wnoffo
recastexpen
ditureonassetsfo
rthe
currentdisc
losureyeara
nda10yearplann
ingpe
riod.The
forecastss
houldbe
con
sistentwith
thesupp
ortin
ginform
ationseto
utinth
eAM
P.The
forecastisto
beexpressedinbothconstantpric
ean
dno
minaldollarterms.Also
requ
iredisaforecast
ofth
evalueofcom
miss
ione
dassets(i.e.,thevalueofRAB
add
ition
s)
EDBsm
ustp
rovide
explana
torycom
men
tonthediffe
rencebe
twee
nconstantpric
ean
dno
minaldollarforecastsofe
xpen
ditureonassetsinSched
ule14
a(M
anda
toryExplana
toryNotes).
Thisinform
ationisno
tparto
faud
iteddisclosureinform
ation.
50 51Cu
rren
tYea
rCY
CY+1
CY+2
CY+3
CY+4
CY+5
CY+6
CY+7
CY+8
CY+9
CY+1
052
fory
eare
nded
31M
ar2
031
Mar
21
31M
ar2
231
Mar
23
31M
ar2
431
Mar
25
31M
ar2
631
Mar
27
31M
ar2
831
Mar
29
31M
ar3
053
Diffe
renc
ebe
twee
nno
min
ala
ndc
onst
antp
rice
fore
cast
s$0
00
54Con
sumercon
nection
(665
)-
81
161
245
332
423
517
616
719
826
55Systemgrowth
(364
)-
73
183
272
253
78
48
79
652
662
56Assetre
placem
enta
ndre
newal
1,57
10
337
717
1,06
41,42
41,50
91,51
82,16
91,49
12,36
457
Assetre
locatio
ns23
5-
20
39
59
79
99
120
142
163
185
58Re
liability,sa
fetyand
enviro
nmen
t:59
Qua
lityofsu
pply
--
--
--
--
--
-60
Legisla
tivean
dregu
latory
--
--
--
--
--
-61
Otherre
liability,sa
fetyand
enviro
nmen
t48
7-
28
59
37
30
41
30
27
59
58
62To
talr
elia
bilit
y,sa
fety
and
env
ironm
ent
487
-28
59
37
30
41
30
27
59
58
63
Expe
nditu
reo
nne
twor
kas
sets
1,26
40
539
1,16
01,67
62,11
72,15
02,23
33,03
23,08
44,09
664
Expe
nditu
reonno
n-ne
tworkassets
(424
)-
61
124
32
20
22
97
29
48
55
65Ex
pend
iture
on
asse
ts84
00
600
1,28
41,70
82,13
72,17
12,32
93,06
13,13
34,15
166 67
CY+1
CY+2
CY+3
CY+4
CY+5
6811
a(ii)
:Con
sum
erC
onne
ctio
nfory
eare
nded
31M
ar2
031
Mar
21
31M
ar2
231
Mar
23
31M
ar2
431
Mar
25
69Co
nsum
erty
pesd
efin
edb
yED
B*$0
00(i
nco
nsta
ntp
rices
)
70Ca
pitalcon
tributions(N
etwork)
500
505
510
515
520
526
71Ca
pitalcon
tributions(C
ustomer)
4,30
04,38
42,57
62,61
42,65
32,69
372
Tran
sformerAcquisitionCo
st1,04
080
080
080
080
080
073
Tran
sformerCreditsfrom
Upg
rade
s(130
)(130
)(130
)(130
)(130
)(130
)74
Ripp
lere
laypu
rcha
ses
85
85
85
85
85
85
75
*inc
lude
add
ition
alro
wsi
fnee
ded
76Co
nsum
erc
onne
ctio
nex
pend
iture
5,79
55,64
43,84
13,88
43,92
93,97
477
less
Capitalcon
tributionsfu
ndingconsum
ercon
nection
4,30
04,38
42,57
62,61
42,65
32,69
378
Cons
umer
con
nect
ion
less
cap
italc
ontr
ibut
ions
1,49
51,26
01,26
51,27
01,27
51,28
1
7911
a(iii
):Sy
stem
Gro
wth
80Subtransmiss
ion
-50
02,50
04,00
02,00
01,50
081
Zone
substatio
ns4,74
81,65
050
030
02,00
01,40
082
Distrib
utionan
dLVline
s-
--
--
-83
Distrib
utionan
dLVcab
les
--
--
--
84Distrib
utionsubstatio
nsand
tran
sformers
50
550
300
50
300
50
85Distrib
utionsw
itchg
ear
--
108
--
-86
Othernetworkassets
75
75
75
75
75
75
87Sy
stem
gro
wth
exp
endi
ture
4,87
32,77
53,48
34,42
54,37
53,02
588
less
Capitalcon
tributionsfu
ndingsystem
growth
--
--
--
89Sy
stem
gro
wth
less
cap
italc
ontr
ibut
ions
4,87
32,77
53,48
34,42
54,37
53,02
5
90
Curr
entY
earC
Y
Section 3
Page 16 Northpower Limited | Asset Management Plan Update 2020-2030
CommerceCom
miss
ionInform
ationDisclosureTem
plate
NPAM
PYB
Disc
losureSched
ules202
0v1.4.xlsx
6S11a.Cap
exForecast
Com
pany
Nam
eAM
PPl
anni
ngP
erio
d
SCHE
DULE
11a
:REP
ORT
ON
FO
RECA
STC
APIT
ALE
XPEN
DITU
RE
sch
ref
Nor
thpo
wer
Ltd
1A
pril
2020
–3
1M
arch
203
0
Thissche
dulere
quire
sabreakdo
wnoffo
recastexpen
ditureonassetsfo
rthe
currentdisc
losureyeara
nda10yearplann
ingpe
riod.The
forecastss
houldbe
con
sistentwith
thesupp
ortin
ginform
ationseto
utinth
eAM
P.The
forecastisto
beexpressedinbothconstantpric
ean
dno
minaldollarterms.Also
requ
iredisaforecast
ofth
evalueofcom
miss
ione
dassets(i.e.,thevalueofRAB
add
ition
s)
EDBsm
ustp
rovide
explana
torycom
men
tonthediffe
rencebe
twee
nconstantpric
ean
dno
minaldollarforecastsofe
xpen
ditureonassetsinSched
ule14
a(M
anda
toryExplana
toryNotes).
Thisinform
ationisno
tparto
faud
iteddisclosureinform
ation.
91Cu
rren
tYea
rCY
CY+1
CY+2
CY+3
CY+4
CY+5
92fory
eare
nded
31M
ar2
031
Mar
21
31M
ar2
231
Mar
23
31M
ar2
431
Mar
25
9311
a(iv
):As
setR
epla
cem
enta
ndR
enew
al$0
00(i
nco
nsta
ntp
rices
)
94Subtransmiss
ion
500
-30
02,00
035
0-
95Zone
substatio
ns3,16
17,13
87,92
87,42
88,63
88,63
896
Distrib
utionan
dLVline
s5,02
05,34
95,44
95,64
95,84
96,04
997
Distrib
utionan
dLVcab
les
260
390
400
410
410
430
98Distrib
utionsubstatio
nsand
tran
sformers
565
541
594
571
624
591
99Distrib
utionsw
itchg
ear
300
1,06
81,09
397
897
81,01
310
0Othernetworkassets
75
400
286
281
241
333
101
Asse
trep
lace
men
tand
rene
wal
exp
endi
ture
9,88
114
,885
16
,048
17
,316
17
,088
17
,052
10
2le
ssCa
pitalcon
tributionsfu
ndingassetrep
lacemen
tand
rene
wal
--
--
--
103
Asse
trep
lace
men
tand
rene
wal
less
cap
italc
ontr
ibut
ions
9,88
114
,885
16
,048
17
,316
17
,088
17
,052
104
105
Curr
entY
earC
YCY
+1CY
+2CY
+3CY
+4CY
+510
6fory
eare
nded
31M
ar2
031
Mar
21
31M
ar2
231
Mar
23
31M
ar2
431
Mar
25
107
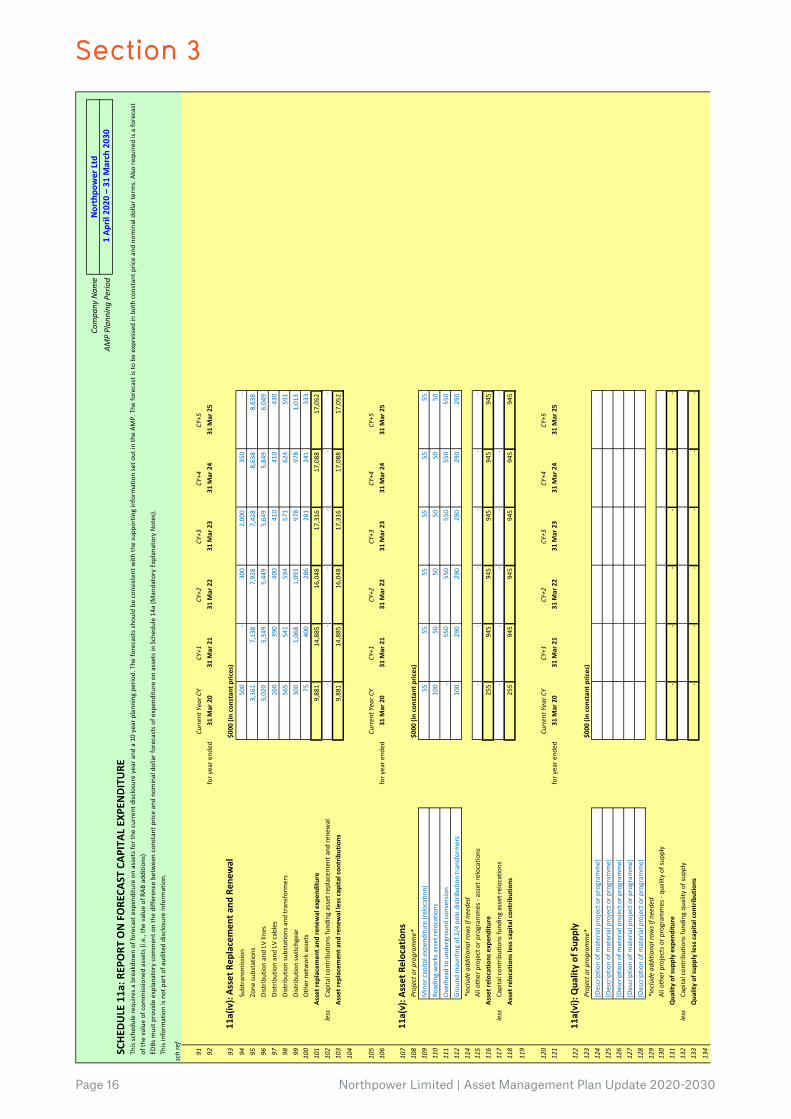
11a(
v):A
sset
Rel
ocat
ions
108
Proj
ecto
rpro
gram
me*
$000
(in
cons
tant
pric
es)
109
Minorcap
italexpen
diture(relocation)
55
55
55
55
55
55
110
Road
ingworksassetre
locatio
ns10
050
50
50
50
50
11
1Overheadtound
ergrou
ndcon
version
-55
055
055
055
055
011
2Grou
ndm
ountingof2/4poledistrib
utiontran
sformers
100
290
290
290
290
290
114
*inc
lude
add
ition
alro
wsi
fnee
ded
115
Allotherprojectorp
rogram
mes-assetrelocations
--
--
--
116
Asse
trel
ocat
ions
exp
endi
ture
255
945
945
945
945
945
117
less
Capitalcon
tributionsfu
ndingassetrelocations
--
--
--
118
Asse
trel
ocat
ions
less
cap
italc
ontr
ibut
ions
255
945
945
945
945
945
119
120
Curr
entY
earC
YCY
+1CY
+2CY
+3CY
+4CY
+512
1fory
eare
nded
31M
ar2
031
Mar
21
31M
ar2
231
Mar
23
31M
ar2
431
Mar
25
122
11a(
vi):
Qua
lity
ofS
uppl
y12
3Pr
ojec
torp
rogr
amm
e*$0
00(i
nco
nsta
ntp
rices
)12
4[Descriptio
nofm
aterialprojectorp
rogram
me]
125
[Descriptio
nofm
aterialprojectorp
rogram
me]
126
[Descriptio
nofm
aterialprojectorp
rogram
me]
127
[Descriptio
nofm
aterialprojectorp
rogram
me]
128
[Descriptio
nofm
aterialprojectorp
rogram
me]
129
*inc
lude
add
ition
alro
wsi
fnee
ded
130
Allotherprojectso
rprogram
mes-qu
ality
ofsup
ply
131
Qua
lity
ofsu
pply
exp
endi
ture
--
--
--
132
less
Capitalcon
tributionsfu
ndingqu
ality
ofsup
ply
133
Qua
lity
ofsu
pply
less
cap
italc
ontr
ibut
ions
--
--
--
134
Section 3
Northpower Limited | Asset Management Plan Update 2020-2030 Page 17
CommerceCom
miss
ionInform
ationDisclosureTem
plate
NPAM
PYB
Disc
losureSched
ules202
0v1.4.xlsx
7S11a.Cap
exForecast
Com
pany
Nam
eAM
PPl
anni
ngP
erio
d
SCHE
DULE
11a
:REP
ORT
ON
FO
RECA
STC
APIT
ALE
XPEN
DITU
RE
sch
ref
Nor
thpo
wer
Ltd
1A
pril
2020
–3
1M
arch
203
0
Thissche
dulere
quire
sabreakdo
wnoffo
recastexpen
ditureonassetsfo
rthe
currentdisc
losureyeara
nda10yearplann
ingpe
riod.The
forecastss
houldbe
con
sistentwith
thesupp
ortin
ginform
ationseto
utinth
eAM
P.The
forecastisto
beexpressedinbothconstantpric
ean
dno
minaldollarterms.Also
requ
iredisaforecast
ofth
evalueofcom
miss
ione
dassets(i.e.,thevalueofRAB
add
ition
s)
EDBsm
ustp
rovide
explana
torycom
men
tonthediffe
rencebe
twee
nconstantpric
ean
dno
minaldollarforecastsofe
xpen
ditureonassetsinSched
ule14
a(M
anda
toryExplana
toryNotes).
Thisinform
ationisno
tparto
faud
iteddisclosureinform
ation.
135
Curr
entY
earC
YCY
+1CY
+2CY
+3CY
+4CY
+513
6fory
eare
nded
31M
ar2
031
Mar
21
31M
ar2
231
Mar
23
31M
ar2
431
Mar
25
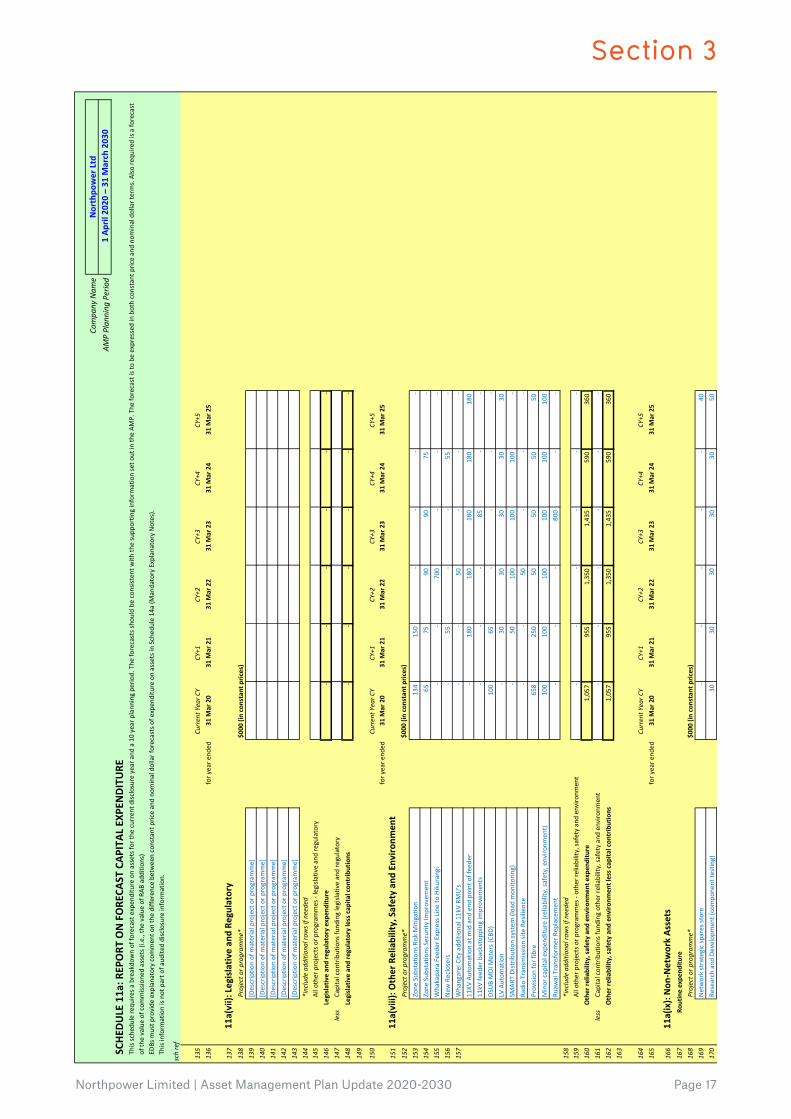
137
11a(
vii):
Leg
isla
tive
and
Regu
lato
ry13
8Pr
ojec
torp
rogr
amm
e*$0
00(i
nco
nsta
ntp
rices
)13
9[Descriptio
nofm
aterialprojectorp
rogram
me]
140
[Descriptio
nofm
aterialprojectorp
rogram
me]
141
[Descriptio
nofm
aterialprojectorp
rogram
me]
142
[Descriptio
nofm
aterialprojectorp
rogram
me]
143
[Descriptio
nofm
aterialprojectorp
rogram
me]
144
*inc
lude
add
ition
alro
wsi
fnee
ded
145
Allotherprojectso
rprogram
mes-legisla
tivean
dregu
latory
146
Legi
slat
ive
and
regu
lato
rye
xpen
ditu
re-
--
--
-14
7le
ssCa
pitalcon
tributionsfu
ndinglegisla
tivean
dregu
latory
148
Legi
slat
ive
and
regu
lato
ryle
ssc
apita
lcon
trib
utio
ns-
--
--
-
149
150
Curr
entY
earC
YCY
+1CY
+2CY
+3CY
+4CY
+5
151
11a(
viii)
:Oth
erR
elia
bilit
y,S
afet
yan
dEn
viro
nmen
tfory
eare
nded
31M
ar2
031
Mar
21
31M
ar2
231
Mar
23
31M
ar2
431
Mar
25
152
Proj
ecto
rpro
gram
me*
$000
(in
cons
tant
pric
es)
153
Zone
Sub
stationsRisk
Mitigatio
n13
415
0-
--
-15
4Zone
Sub
stationsSecurity
Improvem
ent
65
75
90
90
75
-15
5Wha
kapa
raFee
derE
xpressLinetoHikuran
gi-
-70
0-
--
156
New
Reclosers
-55
-
-55
-
157
Wha
ngareiCity
add
ition
al11kVRM
U's
--
50
--
-11
KVAutom
ationatm
idand
end
pointoffee
der
-18
018
018
018
018
011
kVfe
ederbackstopp
ingim
provem
ents
--
-85
-
-DS
UBMDIM
eters(CB
D)10
065
-
--
-LVAutom
ation
-30
30
30
30
30
SM
ARTDistrib
utionsystem
(loa
dmon
itorin
g)-
50
100
100
100
-Ra
dioTran
smiss
ionsiteRe
silience
--
50
--
-Provision
forfibre
658
250
50
50
50
50
Minorcap
italexpen
diture(reliability,sa
fety,enviro
nmen
t)10
010
010
010
010
010
0Ru
awaiTransform
erRep
lacemen
t-
--
800
--
158
*inc
lude
add
ition
alro
wsi
fnee
ded
159
Allotherprojectso
rprogram
mes-othe
rreliability,sa
fetyand
enviro
nmen
t-
--
--
-16
0O
ther
relia
bilit
y,sa
fety
and
env
ironm
ente
xpen
ditu
re1,05
795
51,35
01,43
559
036
016
1le
ssCa
pitalcon
tributionsfu
ndingothe
rreliability,sa
fetyand
enviro
nmen
t-
--
--
-16
2O
ther
relia
bilit
y,sa
fety
and
env
ironm
entl
essc
apita
lcon
trib
utio
ns1,05
795
51,35
01,43
559
036
016
3
164
Curr
entY
earC
YCY
+1CY
+2CY
+3CY
+4CY
+516
5fory
eare
nded
31M
ar2
031
Mar
21
31M
ar2
231
Mar
23
31M
ar2
431
Mar
25
166
11a(
ix):
Non
-Net
wor
kAs
sets
167
Rout
ine
expe
nditu
re16
8Pr
ojec
torp
rogr
amm
e*$0
00(i
nco
nsta
ntp
rices
)16
9Networkstrategicsparesstore
--
--
-40
17
0Re
searchand
Develop
men
t(compo
nentte
sting)
30
30
30
30
30
50
Section 3
Page 18 Northpower Limited | Asset Management Plan Update 2020-2030
CommerceCom
miss
ionInform
ationDisclosureTem
plate
NPAM
PYB
Disc
losureSched
ules202
0v1.4.xlsx
8S11a.Cap
exForecast
Com
pany
Nam
eAM
PPl
anni
ngP
erio
d
SCHE
DULE
11a
:REP
ORT
ON
FO
RECA
STC
APIT
ALE
XPEN
DITU
RE
sch
ref
Nor
thpo
wer
Ltd
1A
pril
2020
–3
1M
arch
203
0
Thissche
dulere
quire
sabreakdo
wnoffo
recastexpen
ditureonassetsfo
rthe
currentdisc
losureyeara
nda10yearplann
ingpe
riod.The
forecastss
houldbe
con
sistentwith
thesupp
ortin
ginform
ationseto
utinth
eAM
P.The
forecastisto
beexpressedinbothconstantpric
ean
dno
minaldollarterms.Also
requ
iredisaforecast
ofth
evalueofcom
miss
ione
dassets(i.e.,thevalueofRAB
add
ition
s)
EDBsm
ustp
rovide
explana
torycom
men
tonthediffe
rencebe
twee
nconstantpric
ean
dno
minaldollarforecastsofe
xpen
ditureonassetsinSched
ule14
a(M
anda
toryExplana
toryNotes).
Thisinform
ationisno
tparto
faud
iteddisclosureinform
ation.
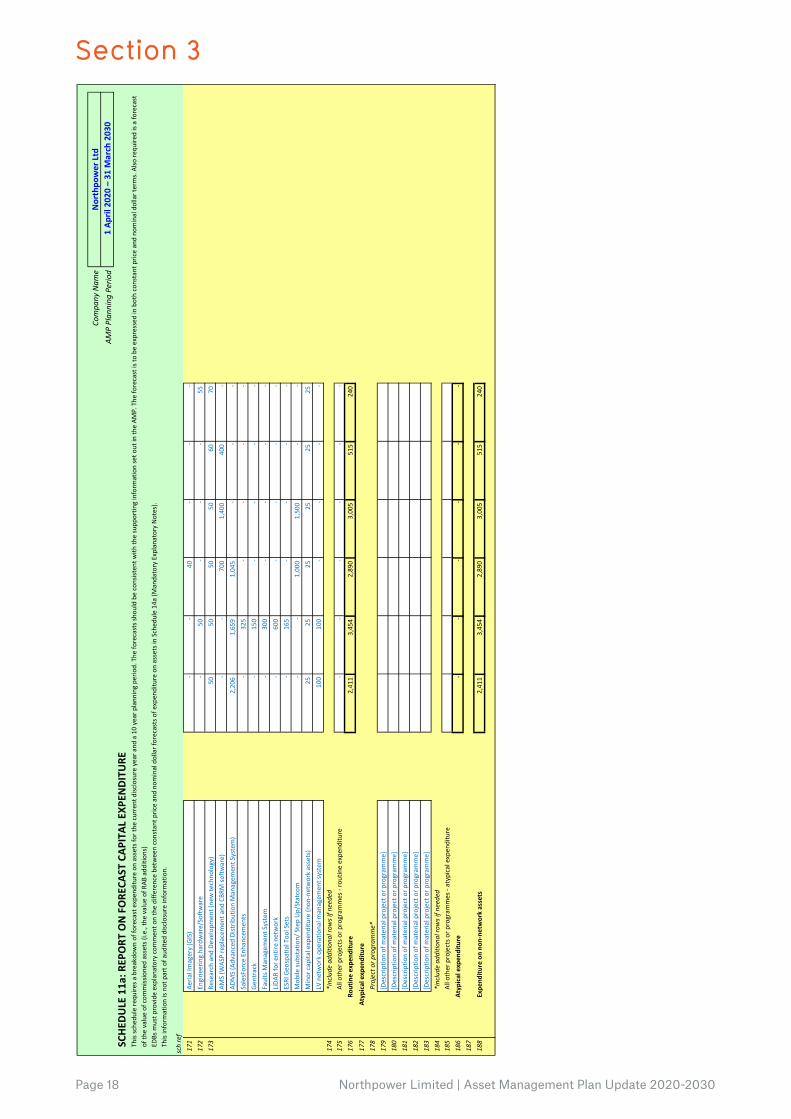
171
Aeria
lImagery(GIS)
--
40
--
-17
2En
gine
eringha
rdware/Software
-50
-
--
55
173
Researchand
Develop
men
t(ne
wte
chno
logy)
50
50
50
50
60
70
AMS(W
ASPreplacem
enta
ndCBR
Mso
ftware)
--
700
1,40
040
0-
ADMS(Advan
cedDistrib
utionMan
agem
entS
ystem)
2,20
61,65
91,04
5-
--
SalesForceEnh
ancemen
ts-
325
--
--
Gentrack
-15
0-
--
-FaultsM
anagem
entS
ystem
-30
0-
--
-LiDA
Rfore
ntire
network
-60
0-
--
-ESRIGeo
spatialToo
lSets
-16
5-
--
-Mob
ilesu
bstatio
n/StepUp/Statcom
--
1,00
01,50
0-
-Minorcap
italexpen
diture(n
on-networkassets)
25
25
25
25
25
25
LVnetworkop
erationa
lman
agem
entsystem
100
100
--
--
174
*inc
lude
add
ition
alro
wsi
fnee
ded
175
Allotherprojectso
rprogram
mes-routineexpe
nditu
re-
--
--
-17
6Ro
utin
eex
pend
iture
2,41
13,45
42,89
03,00
551
524
0
177
Atyp
ical
exp
endi
ture
178
Proj
ecto
rpro
gram
me*
179
[Descriptio
nofm
aterialprojectorp
rogram
me]
180
[Descriptio
nofm
aterialprojectorp
rogram
me]
181
[Descriptio
nofm
aterialprojectorp
rogram
me]
182
[Descriptio
nofm
aterialprojectorp
rogram
me]
183
[Descriptio
nofm
aterialprojectorp
rogram
me]
184
*inc
lude
add
ition
alro
wsi
fnee
ded
185
Allotherprojectso
rprogram
mes-atypicalexpen
diture
186
Atyp
ical
exp
endi
ture
--
--
--
187
188
Expe
nditu
reo
nno
n-ne
twor
kas
sets
2,41
13,45
42,89
03,00
551
524
0

Section 3
Northpower Limited | Asset Management Plan Update 2020-2030 Page 19
CommerceCom
miss
ionInform
ationDisclosureTem
plate
NPAM
PYB
Disc
losureSched
ules202
0v1.4.xlsx
9S11b
.Ope
xForecast
Com
pany
Nam
eAM
PPl
anni
ngP
erio
d
SCHE
DULE
11b
:REP
ORT
ON
FO
RECA
STO
PERA
TIO
NAL
EXP
ENDI
TURE
sch
ref
7Cu
rren
tYea
rCY
CY+1
CY+2
CY+3
CY+4
CY+5
CY+6
CY+7
CY+8
CY+9
CY+1
08
fory
eare
nded
31M
ar2
031
Mar
21
31M
ar2
231
Mar
23
31M
ar2
431
Mar
25
31M
ar2
631
Mar
27
31M
ar2
831
Mar
29
31M
ar3
0
9O
pera
tiona
lExp
endi
ture
For
ecas
t$0
00(i
nno
min
ald
olla
rs)
10Serviceinterrup
tionsand
emergencies
2,81
92,15
02,19
52,23
92,28
42,32
92,37
62,42
42,47
22,52
12,57
211
Vegetatio
nman
agem
ent
2,82
02,82
02,87
92,93
72,99
63,05
53,11
73,17
93,01
33,07
33,13
412
Routinean
dcorrectiv
emainten
anceand
inspectio
n3,32
63,32
03,41
03,45
83,52
73,61
93,66
93,74
33,84
13,89
43,97
213
Assetrep
lacemen
tand
rene
wal
2,99
42,73
42,79
22,84
82,90
52,96
33,02
22,63
12,68
42,73
82,79
214
Net
wor
kO
pex
11,959
11
,024
11
,276
11
,481
11
,711
11
,967
12
,184
11
,977
12
,009
12
,226
12
,470
15System
ope
ratio
nsand
networksupp
ort
2,66
33,39
63,46
73,53
73,60
83,68
03,75
33,82
83,90
53,98
34,06
316
Busin
esss
uppo
rt13
,182
13
,710
13
,998
14
,278
14
,563
14
,855
15
,152
15
,455
15
,764
16
,079
16
,401
17
Non
-net
wor
kop
ex15
,845
17
,106
17
,465
17
,815
18
,171
18
,534
18
,905
19
,283
19
,669
20
,062
20
,464
18
Ope
ratio
nale
xpen
ditu
re27
,804
28
,130
28
,742
29
,296
29
,882
30
,501
31
,089
31
,260
31
,678
32
,288
32
,934
19Cu
rren
tYea
rCY
CY+1
CY+2
CY+3
CY+4
CY+5
CY+6
CY+7
CY+8
CY+9
CY+1
020
fory
eare
nded
31M
ar2
031
Mar
21
31M
ar2
231
Mar
23
31M
ar2
431
Mar
25
31M
ar2
631
Mar
27
31M
ar2
831
Mar
29
31M
ar3
0
21$0
00(i
nco
nsta
ntp
rices
)22
Serviceinterrup
tionsand
emergencies
2,81
92,15
02,15
02,15
02,15
02,15
02,15
02,15
02,15
02,15
02,15
023
Vegetatio
nman
agem
ent
2,82
02,82
02,82
02,82
02,82
02,82
02,82
02,82
02,62
02,62
02,62
024
Routinean
dcorrectiv
emainten
anceand
inspectio
n3,32
63,32
03,34
03,32
03,32
03,34
03,32
03,32
03,34
03,32
03,32
025
Assetrep
lacemen
tand
rene
wal
2,99
42,73
42,73
42,73
42,73
42,73
42,73
42,33
42,33
42,33
42,33
426
Net
wor
kO
pex
11,959
11
,024
11
,044
11
,024
11
,024
11
,044
11
,024
10
,624
10
,444
10
,424
10
,424
27System
ope
ratio
nsand
networksupp
ort
2,66
33,39
63,39
63,39
63,39
63,39
63,39
63,39
63,39
63,39
63,39
628
Busin
esss
uppo
rt13
,182
13
,710
13
,710
13
,710
13
,710
13
,710
13
,710
13
,710
13
,710
13
,710
13
,710
29
Non
-net
wor
kop
ex15
,845
17
,106
17
,106
17
,106
17
,106
17
,106
17
,106
17
,106
17
,106
17
,106
17
,106
30
Ope
ratio
nale
xpen
ditu
re27
,804
28
,130
28
,151
28
,131
28
,131
28
,151
28
,131
27
,731
27
,551
27
,531
27
,531
31Su
bcom
pone
ntso
fope
ratio
nale
xpen
ditu
re(w
here
kno
wn)
32 33 34Directbilling*
35Re
searchand
Develop
men
t36
Insurance
37*
Dire
ctb
illin
gex
pend
iture
by
supp
liers
that
dire
ctb
illth
em
ajor
ityo
fthe
irco
nsum
ers
38 39Cu
rren
tYea
rCY
CY+1
CY+2
CY+3
CY+4
CY+5
CY+6
CY+7
CY+8
CY+9
CY+1
040
fory
eare
nded
31M
ar2
031
Mar
21
31M
ar2
231
Mar
23
31M
ar2
431
Mar
25
31M
ar2
631
Mar
27
31M
ar2
831
Mar
29
31M
ar3
0
41Di
ffere
nce
betw
een
nom
inal
and
real
fore
cast
s$0
0042
Serviceinterrup
tionsand
emergencies
--
45
89
134
180
226
274
322
372
422
43Ve
getatio
nman
agem
ent
--
59
117
176
235
297
359
393
453
514
44Ro
utinean
dcorrectiv
emainten
anceand
inspectio
n-
-70
13
820
727
934
942
350
057
465
245
Assetrep
lacemen
tand
rene
wal
--
57
113
170
228
288
297
350
403
458
46N
etw
ork
Ope
x-
-23
245
768
692
21,15
91,35
21,56
51,80
12,04
6
47System
ope
ratio
nsand
networksupp
ort
--
71
141
211
284
357
432
509
587
667
48Bu
sinesss
uppo
rt-
-28
856
885
31,14
51,44
21,74
52,05
42,36
92,69
1
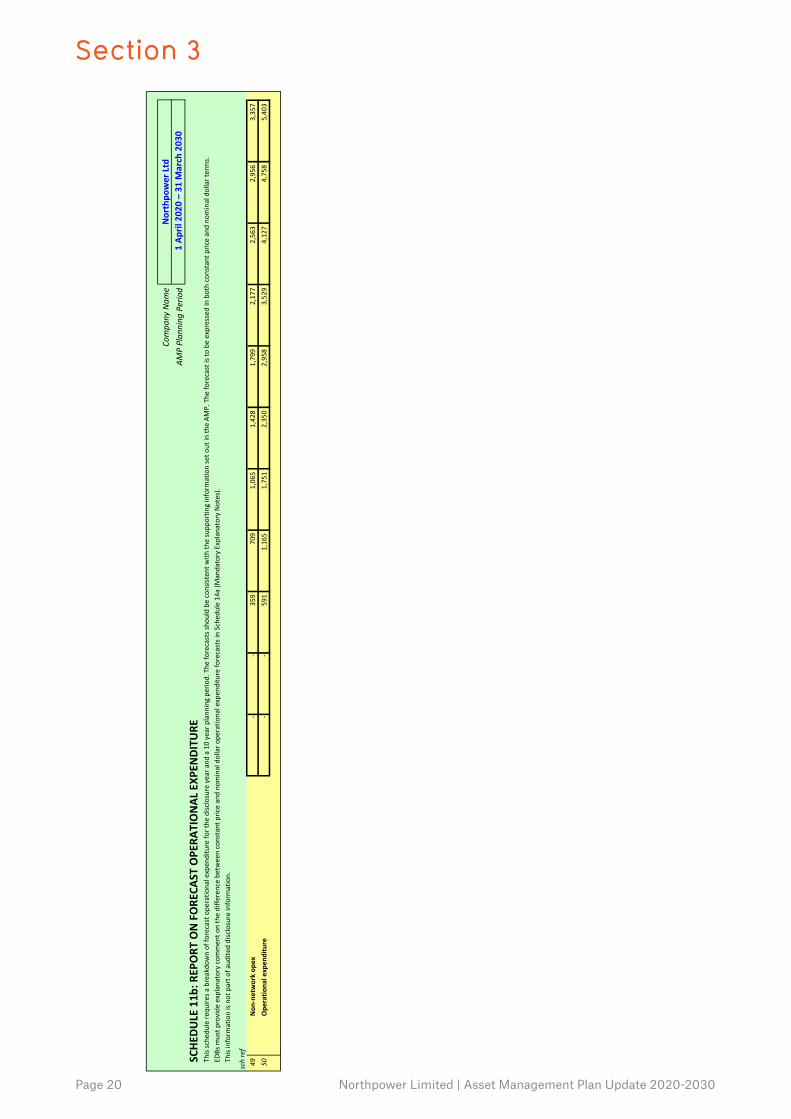
Nor
thpo
wer
Ltd
1A
pril
2020
–3
1M
arch
203
0
Thissche
dulere
quire
sabreakdo
wnoffo
recastope
ratio
nalexpen
diturefo
rthe
disc
losureyeara
nda10yearplann
ingpe
riod.The
forecastss
houldbe
con
sistentwith
thesupp
ortin
ginform
ationseto
utinth
eAM
P.The
forecastisto
beexpressedinbothconstantpric
ean
dno
minaldollarterms.
EDBsm
ustp
rovide
explana
torycom
men
tonthediffe
rencebe
twee
nconstantpric
ean
dno
minaldollaro
peratio
nalexpen
diturefo
recastsinSche
dule14a(M
anda
toryExplana
toryNotes).
Thisinform
ationisno
tparto
faud
iteddisclosureinform
ation.
Energyefficien
cyand
dem
andsid
eman
agem
ent,redu
ctionof
energylosses
Section 3
Page 20 Northpower Limited | Asset Management Plan Update 2020-2030
CommerceCom
miss
ionInform
ationDisclosureTem
plate
NPAM
PYB
Disc
losureSched
ules202
0v1.4.xlsx
10S11b
.Ope
xForecast
Com
pany
Nam
eAM
PPl
anni
ngP
erio
d
SCHE
DULE
11b
:REP
ORT
ON
FO
RECA
STO
PERA
TIO
NAL
EXP
ENDI
TURE
sch
ref
Nor
thpo
wer
Ltd
1A
pril
2020
–3
1M
arch
203
0
Thissche
dulere
quire
sabreakdo
wnoffo
recastope
ratio
nalexpen
diturefo
rthe
disc
losureyeara
nda10yearplann
ingpe
riod.The
forecastss
houldbe
con
sistentwith
thesupp
ortin
ginform
ationseto
utinth
eAM
P.The
forecastisto
beexpressedinbothconstantpric
ean
dno
minaldollarterms.
EDBsm
ustp
rovide
explana
torycom
men
tonthediffe
rencebe
twee
nconstantpric
ean
dno
minaldollaro
peratio
nalexpen
diturefo
recastsinSche
dule14a(M
anda
toryExplana
toryNotes).
Thisinform
ationisno
tparto
faud
iteddisclosureinform
ation.
49N
on-n
etw
ork
opex
--
359
709
1,06
51,42
81,79
92,17
72,56
32,95
63,35
750
Ope
ratio
nale
xpen
ditu
re-
-59
11,16
51,75
12,35
02,95
83,52
94,12
74,75
85,40
3
Section 3
Northpower Limited | Asset Management Plan Update 2020-2030 Page 21
CommerceCom
miss
ionInform
ationDisclosureTem
plate
NPAM
PYB
Disc
losureSched
ules202
0v1.4.xlsx
11S12a.AssetCon
ditio
n
Com
pany
Nam
eAM
PPl
anni
ngP
erio
d
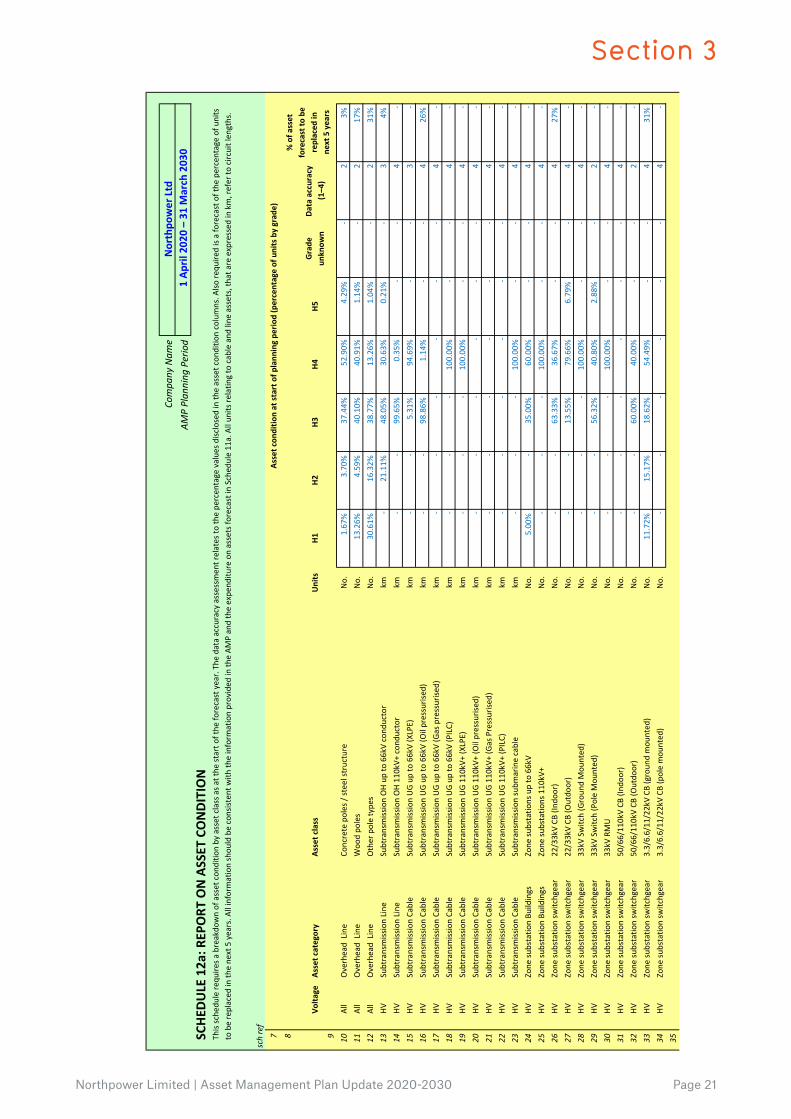
SCHE
DULE
12a
:REP
ORT
ON
ASS
ETC
ON
DITI
ON
sch
ref
7 8 9
Volta
geAs
setc
ateg
ory
Asse
tcla
ssU
nits
H1H2
H3H4
H5G
rade
un
know
nDa
taa
ccur
acy
(1–4
)
10All
OverheadLine
Concretepoles/stee
lstructure
No.
1.67
%
3.70
%
37.44%
52
.90%
4.29
%
-2
3%
11All
OverheadLine
Woo
dpo
les
No.
13.26%
4.59
%
40.10%
40
.91%
1.14
%
-2
17%
12All
OverheadLine
Otherpoletype
sNo.
30.61%
16
.32%
38
.77%
13
.26%
1.04
%
-2
31%
13HV
Subtransmiss
ionLine
Subtransmiss
ionOHup
to66kVcond
uctor
km-
21.11%
48
.05%
30
.63%
0.21
%
-3
4%
14HV
Subtransmiss
ionLine
Subtransmiss
ionOH11
0kV+
con
ductor
km-
-99
.65%
0.35
%
--
4-
15HV
Subtransmiss
ionCa
ble
Subtransmiss
ionUGup
to66kV(XLPE)
km-
-5.31
%
94.69%
-
-3
-16
HVSubtransmiss
ionCa
ble
Subtransmiss
ionUGup
to66kV(Oilpressurised
)km
--
98.86%
1.14
%
--
426
%
17HV
Subtransmiss
ionCa
ble
Subtransmiss
ionUGup
to66kV(Gaspressurise
d)km
--
--
--
4-
18HV
Subtransmiss
ionCa
ble
Subtransmiss
ionUGup
to66kV(PILC)
km-
--
100.00
%
--
4-
19HV
Subtransmiss
ionCa
ble
Subtransmiss
ionUG11
0kV+
(XLPE)
km-
--
100.00
%
--
4-
20HV
Subtransmiss
ionCa
ble
Subtransmiss
ionUG11
0kV+
(Oilpressurised
)km
--
--
--
4-
21HV
Subtransmiss
ionCa
ble
Subtransmiss
ionUG11
0kV+
(GasPressurise
d)km
--
--
--
4-
22HV
Subtransmiss
ionCa
ble
Subtransmiss
ionUG11
0kV+
(PILC)
km-
--
--
-4
-23
HVSubtransmiss
ionCa
ble
Subtransmiss
ionsubm
arinecable
km-
--
100.00
%
--
4-
24HV
Zone
substatio
nBu
ildings
Zone
substatio
nsupto66kV
No.
5.00
%
-35
.00%
60
.00%
-
-4
-25
HVZone
substatio
nBu
ildings
Zone
substatio
ns110
kV+
No.
--
-10
0.00
%
--
4-
26HV
Zone
substatio
nsw
itchg
ear
22/33kVCB
(Ind
oor)
No.
--
63.33%
36
.67%
-
-4
27%
27HV
Zone
substatio
nsw
itchg
ear
22/33kVCB
(Outdo
or)
No.
--
13.55%
79
.66%
6.79
%
-4
-28
HVZone
substatio
nsw
itchg
ear
33kV
Switch(Groun
dMou
nted
)No.
--
-10
0.00
%
--
4-
29HV
Zone
substatio
nsw
itchg
ear
33kV
Switch(PoleMou
nted
)No.
--
56.32%
40
.80%
2.88
%
-2
-30
HVZone
substatio
nsw
itchg
ear
33kV
RMU
No.
--
-10
0.00
%
--
4-
31HV
Zone
substatio
nsw
itchg
ear
50/66/11
0kVCB
(Ind
oor)
No.
--
--
--
4-
32HV
Zone
substatio
nsw
itchg
ear
50/66/11
0kVCB
(Outdo
or)
No.
--
60.00%
40
.00%
-
-2
-33
HVZone
substatio
nsw
itchg
ear
3.3/6.6/11
/22kVCB
(groun
dmou
nted
)No.
11.72%
15
.17%
18
.62%
54
.49%
-
-4
31%
34HV
Zone
substatio
nsw
itchg
ear
3.3/6.6/11
/22kVCB
(polemou
nted
)No.
--
--
--
4-
35
Nor
thpo
wer
Ltd
1A
pril
2020
–3
1M
arch
203
0 %o
fass
et
fore
cast
tob
ere
plac
edin
ne
xt5
yea
rs
Asse
tcon
ditio
nat
star
tofp
lann
ing
perio
d(p
erce
ntag
eof
uni
tsb
ygr
ade)
Thissche
dulere
quire
sabreakdo
wnofassetcon
ditio
nbyassetclassasa
tthe
starto
fthe
forecastyear.Th
eda
taaccuracyassessmen
trelatesto
thepe
rcen
tagevalue
sdisc
losedinth
eassetcon
ditio
ncolumns.A
lsore
quire
disaforecastofthe
percentageofunits
tobereplaced
inth
ene
xt5years.A
llinform
ationshou
ldbeconsisten
twith
theinform
ationprovided
inth
eAM
Pan
dtheexpe
nditu
reonassetsfo
recastinSched
ule11
a.Allun
itsre
latin
gtocab
leand
line
assets,th
atareexpressed
inkm,referto
circ
uitlen
gths.
Section 3
Page 22 Northpower Limited | Asset Management Plan Update 2020-2030
CommerceCom
miss
ionInform
ationDisclosureTem
plate
NPAM
PYB
Disc
losureSched
ules202
0v1.4.xlsx
12S12a.AssetCon
ditio
n
Com
pany
Nam
eAM
PPl
anni
ngP
erio
d
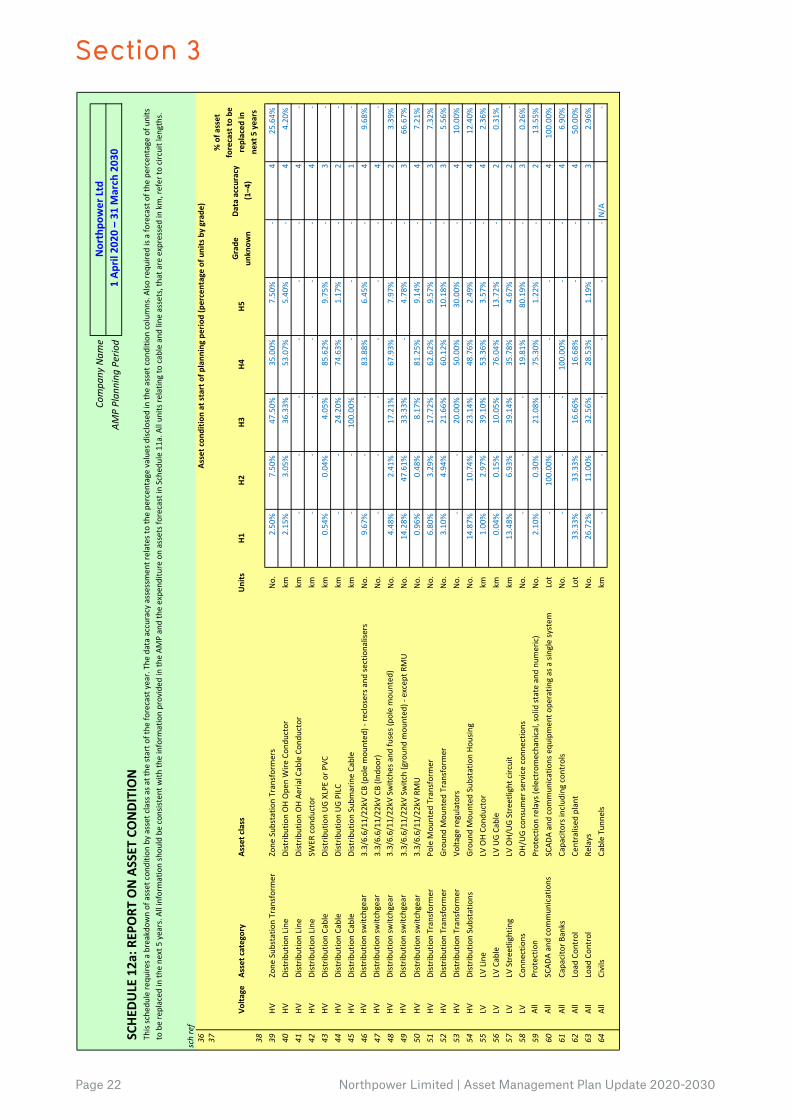
SCHE
DULE
12a
:REP
ORT
ON
ASS
ETC
ON
DITI
ON
sch
ref
Nor
thpo
wer
Ltd
1A
pril
2020
–3
1M
arch
203
0
Thissche
dulere
quire
sabreakdo
wnofassetcon
ditio
nbyassetclassasa
tthe
starto
fthe
forecastyear.Th
eda
taaccuracyassessmen
trelatesto
thepe
rcen
tagevalue
sdisc
losedinth
eassetcon
ditio
ncolumns.A
lsore
quire
disaforecastofthe
percentageofunits
tobereplaced
inth
ene
xt5years.A
llinform
ationshou
ldbeconsisten
twith
theinform
ationprovided
inth
eAM
Pan
dtheexpe
nditu
reonassetsfo
recastinSched
ule11
a.Allun
itsre
latin
gtocab
leand
line
assets,th
atareexpressed
inkm,referto
circ
uitlen
gths.
36 37 38
Volta
geAs
setc
ateg
ory
Asse
tcla
ssU
nits
H1H2
H3H4
H5G
rade
un
know
nDa
taa
ccur
acy
(1–4
)
39HV
Zone
Sub
stationTran
sformer
Zone
Sub
stationTran
sformers
No.
2.50
%
7.50
%
47.50%
35
.00%
7.50
%
-4
25.64%
40
HVDistrib
utionLine
Distrib
utionOHOpe
nWire
Con
ductor
km2.15
%
3.05
%
36.33%
53
.07%
5.40
%
-4
4.20
%
41HV
Distrib
utionLine
Distrib
utionOHAe
rialCab
leCon
ductor
km-
--
--
-4
-42
HVDistrib
utionLine
SWER
con
ductor
km-
--
--
-4
-43
HVDistrib
utionCa
ble
Distrib
utionUGXLPE
orP
VCkm
0.54
%
0.04
%
4.05
%
85.62%
9.75
%
-3
-44
HVDistrib
utionCa
ble
Distrib
utionUGPILC
km-
-24
.20%
74
.63%
1.17
%
-2
-45
HVDistrib
utionCa
ble
Distrib
utionSubm
arineCa
ble
km-
-10
0.00
%
--
-1
-46
HVDistrib
utionsw
itchg
ear
3.3/6.6/11
/22kVCB
(polemou
nted
)-re
closersa
ndse
ctiona
lisers
No.
9.67
%
--
83.88%
6.45
%
-4
9.68
%
47HV
Distrib
utionsw
itchg
ear
3.3/6.6/11
/22kVCB
(Ind
oor)
No.
--
--
--
4-
48HV
Distrib
utionsw
itchg
ear
3.3/6.6/11
/22kVSw
itche
sand
fuses(po
lem
ounted
)No.
4.48
%
2.41
%
17.21%
67
.93%
7.97
%
-2
3.39
%
49HV
Distrib
utionsw
itchg
ear
3.3/6.6/11
/22kVSw
itch(groun
dmou
nted
)-excep
tRMU
No.
14.28%
47
.61%
33
.33%
-
4.78
%
-3
66.67%
50
HVDistrib
utionsw
itchg
ear
3.3/6.6/11
/22kVRM
UNo.
0.96
%
0.48
%
8.17
%
81.25%
9.14
%
-4
7.21
%
51HV
Distrib
utionTran
sformer
PoleM
ounted
Transform
erNo.
6.80
%
3.29
%
17.72%
62
.62%
9.57
%
-3
7.32
%
52HV
Distrib
utionTran
sformer
Grou
ndM
ounted
Transform
erNo.
3.10
%
4.94
%
21.66%
60
.12%
10
.18%
-
35.56
%
53HV
Distrib
utionTran
sformer
Volta
gere
gulators
No.
--
20.00%
50
.00%
30
.00%
-
410
.00%
54
HVDistrib
utionSubstatio
nsGrou
ndM
ounted
Sub
stationHo
using
No.
14.87%
10
.74%
23
.14%
48
.76%
2.49
%
-4
12.40%
55
LVLVLine
LVOHCo
nductor
km1.00
%
2.97
%
39.10%
53
.36%
3.57
%
-4
2.36
%
56LV
LVCab
leLVUGCa
ble
km0.04
%
0.15
%
10.05%
76
.04%
13
.72%
-
20.31
%
57LV
LVStree
tligh
ting
LVOH/
UGStreetlightcirc
uit
km13
.48%
6.93
%
39.14%
35
.78%
4.67
%
-2
-58
LVCo
nnectio
nsOH/
UGconsum
erse
rviceconn
ectio
nsNo.
--
-19
.81%
80
.19%
-
30.26
%
59All
Protectio
nProtectio
nrelays(e
lectromecha
nical,solidstatean
dnu
meric)
No.
2.10
%
0.30
%
21.08%
75
.30%
1.22
%
-2
13.55%
60
All
SCAD
Aan
dcommun
ications
SCAD
Aan
dcommun
icationsequ
ipmen
tope
ratin
gasasing
lesy
stem
Lot
-10
0.00
%
--
--
410
0.00
%
61All
Capa
citorB
anks
Capa
citorsinclud
ingcontrols
No.
--
-10
0.00
%
--
46.90
%
62All
Load
Con
trol
Centralised
plant
Lot
33.33%
33
.33%
16
.66%
16
.68%
-
-4
50.00%
63
All
Load
Con
trol
Relays
No.
26.72%
11
.00%
32
.56%
28
.53%
1.19
%
-3
2.96
%
64All
Civils
CableTu
nnels
km-
--
--
-N/A
-
Asse
tcon
ditio
nat
star
tofp
lann
ing
perio
d(p
erce
ntag
eof
uni
tsb
ygr
ade)
%o
fass
et
fore
cast
tob
ere
plac
edin
ne
xt5
yea
rs

Section 3
Northpower Limited | Asset Management Plan Update 2020-2030 Page 23
CommerceCom
miss
ionInform
ationDisclosureTem
plate
NPAM
PYB
Disc
losureSched
ules202
0v1.4.xlsx
13S12b
.Cap
acity
Forecast
Com
pany
Nam
eN
orth
pow
erL
tdAM
PPl
anni
ngP
erio
d1
Apr
il20
20–
31
Mar
ch2
030
SCHE
DULE
12b
:REP
ORT
ON
FO
RECA
STC
APAC
ITY
sch
ref
712
b(i):
Sys
tem
Gro
wth
-Zo
neS
ubst
atio
ns
8
Exist
ing
Zone
Sub
stat
ions
Curr
entP
eak
Load
(MVA
)
Inst
alle
dFi
rm
Capa
city
(MVA
)
Secu
rity
ofS
uppl
yCl
assi
ficat
ion
(typ
e)Tr
ansf
erC
apac
ity(M
VA)
Util
isat
ion
of
Inst
alle
dFi
rm
Capa
city
%
Inst
alle
dFi
rm
Capa
city
+5
year
s(M
VA)
Util
isat
ion
of
Inst
alle
dFi
rm
Capa
city
+5
yrs
%
Inst
alle
dFi
rmC
apac
ity
Cons
trai
nt+
5ye
ars
(cau
se)
Expl
anat
ion
9Alexan
derS
tree
t13
15
N-1
13
88%
15
90%Noconstraintwith
in+5years
Load
tran
sferto
new
Mau
nuSub
station
10BreamBay
4-N
1-
--Other
SecurityOfSup
ply
11Da
rgaville
11
15N-1
176
%
15
82%Noconstraintwith
in+5years
12Hikurang
i6
5N-1Switcha
ble
312
5%
10
69%Noconstraintwith
in+5years
New
tran
sformers
13Ka
iwaka
2-N-1Switcha
ble
2-
--Noconstraintwith
in+5years
14Ka
mo
12
15N-1
782
%
15
93%Noconstraintwith
in+5years
15Kioreroa
12
20N-1
858
%
20
69%Noconstraintwith
in+5years
16Man
gawha
i7
-N
2-
--Other
SecurityOfSup
ply
17Mareretu
3-N
2-
--Noconstraintwith
in+5years
18Mau
ngatap
ere
78
N-1
692
%
10
63%Noconstraintwith
in+5years
Load
tran
sferto
new
Mau
nuSub
station
19Mau
ngaturoto
68
N-1
285
%
887
%Noconstraintwith
in+5years
20Ngu
nguru
3-N
3-
--Other
SecurityOfSup
ply
21One
rahi
815
N-1Switcha
ble
655
%
15
58%Noconstraintwith
in+5years
22Pa
ruaBa
y3
-N
3-
--Other
SecurityOfSup
ply
23Po
roti
3-N-1Switcha
ble
3-
--Noconstraintwith
in+5years
24Ru
akaka
710
N-1
571
%
10
78%Noconstraintwith
in+5years
25Ru
awai
3-N
3-
--
Noconstraintwith
in+5years
26Tikipu
nga
15
20N-1
13
76%
20
82%Noconstraintwith
in+5years
27Wha
ngareiSou
th12
10
N-1
10
119%
10
11
4%Noconstraintwith
in+5years
Load
tran
sferto
new
Mau
nuSub
station
29¹
Exte
ndfo
reca
stcap
acity
tabl
eas
nec
essa
ryto
disc
lose
all
capa
city
by
each
zone
subs
tatio
n
Thissche
dulere
quire
sabreakdo
wnofcurrentand
forecastcap
acity
and
utilisa
tionfore
achzone
substatio
nan
dcurren
tdistrib
utiontran
sformercap
acity
.The
dataprovided
shou
ldbeconsisten
twith
theinform
ationprovided
inth
eAM
P.In
form
ation
provided
inth
istableshou
ldre
lateto
theop
erationofth
ene
tworkinitsn
ormalsteadystateconfiguration.
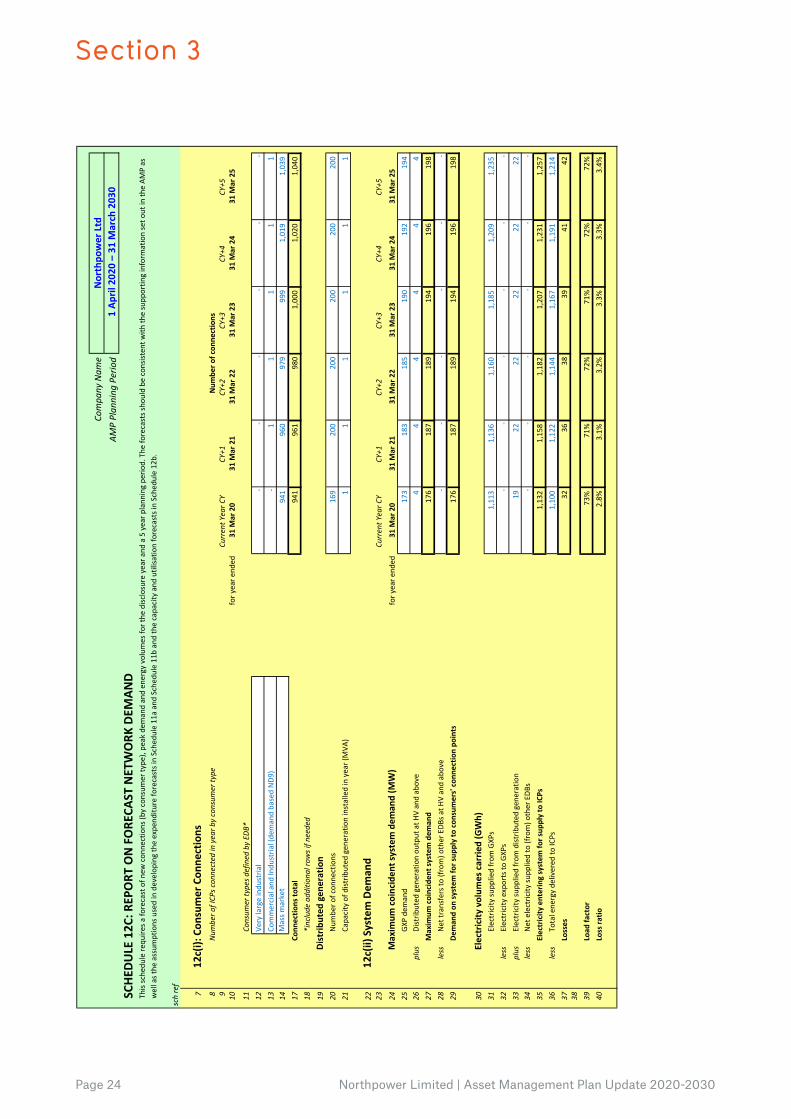
Section 3
Page 24 Northpower Limited | Asset Management Plan Update 2020-2030
CommerceCom
miss
ionInform
ationDisclosureTem
plate
NPAM
PYB
Disc
losureSched
ules202
0v1.4.xlsx
14S12c.Dem
andForecast
Com
pany
Nam
eAM
PPl
anni
ngP
erio
d
SCHE
DULE
12C
:REP
ORT
ON
FO
RECA
STN
ETW
ORK
DEM
AND
sch
ref
712
c(i):
Con
sum
erC
onne
ctio
ns8
Num
bero
fICP
scon
nect
edin
yea
rby
cons
umer
type
9Cu
rren
tYea
rCY
CY+1
CY+2
CY+3
CY+4
CY+5
10fory
eare
nded
31M
ar2
031
Mar
21
31M
ar2
231
Mar
23
31M
ar2
431
Mar
25
11Co
nsum
erty
pesd
efin
edb
yED
B*12
Verylargeindu
stria
l-
--
--
-13
Commercialand
Indu
stria
l(de
man
dba
sedND9
)-
11
11
114
Massm
arket
941
960
979
999
1,01
91,03
917
Conn
ectio
nsto
tal
941
961
980
1,00
01,02
01,04
018
*inc
lude
add
ition
alro
wsi
fnee
ded
19Di
strib
uted
gen
erat
ion
20Num
bero
fcon
nections
169
200
200
200
200
200
21Ca
pacityofd
istrib
uted
gen
erationinstalledinyear(MVA
)1
11
11
1
2212
c(ii)
Sys
tem
Dem
and
23Cu
rren
tYea
rCY
CY+1
CY+2
CY+3
CY+4
CY+5
24M
axim
umc
oinc
iden
tsys
tem
dem
and
(MW
)fory
eare
nded
31M
ar2
031
Mar
21
31M
ar2
231
Mar
23
31M
ar2
431
Mar
25
25GX
Pde
man
d17
318
318
519
019
219
426
plus
Distrib
uted
gen
erationou
tputatH
Van
dab
ove
44
44
44
27M
axim
umc
oinc
iden
tsys
tem
dem
and
176
187
189
194
196
198
28le
ssNettran
sfersto(from
)otherEDB
satH
Van
dab
ove
--
--
--
29De
man
don
syst
emfo
rsup
ply
toc
onsu
mer
s'co
nnec
tion
poin
ts17
618
718
919
419
619
8
30El
ectr
icity
vol
umes
car
ried
(GW
h)31
Electricity
supp
liedfrom
GXP
s1,11
31,13
61,16
01,18
51,20
91,23
532
less
Electricity
exportsto
GXP
s-
--
--
-33
plus
Electricity
supp
liedfrom
distrib
uted
gen
eration
19
22
22
22
22
22
34le
ssNetelectric
itysu
ppliedto(from)o
therEDB
s-
--
--
-35
Elec
tric
itye
nter
ing
syst
emfo
rsup
ply
toIC
Ps1,13
21,15
81,18
21,20
71,23
11,25
736
less
Totalene
rgyde
livered
toIC
Ps1,10
01,12
21,14
41,16
71,19
11,21
437
Loss
es32
36
38
39
41
42
38 39
Load
fact
or73
%
71%
72%
71%
72%
72%
40Lo
ssra
tio2.8%
3.1%
3.2%
3.3%
3.3%
3.4%
Nor
thpo
wer
Ltd
1A
pril
2020
–3
1M
arch
203
0
Num
bero
fcon
nect
ions
Thissche
dulere
quire
safo
recastofn
ewcon
nections(b
yconsum
erty
pe),pe
akdem
andan
den
ergyvolum
esfo
rthe
disc
losureyeara
nda5yearp
lann
ingpe
riod.The
forecastss
houldbe
con
sistentwith
thesupp
ortin
ginform
ationseto
utinth
eAM
Pas
wellasthe
assum
ptionsusedindevelop
ingtheexpe
nditu
refo
recastsinSche
dule11aand
Sched
ule11
ban
dthecapa
cityand
utilisa
tionforecastsinSche
dule12b
.

Section 3
Northpower Limited | Asset Management Plan Update 2020-2030 Page 25
CommerceCom
miss
ionInform
ationDisclosureTem
plate
NPAM
PYB
Disc
losureSched
ules202
0v1.4.xlsx
15S12d
.ReliabilityForecast
Com
pany
Nam
eAM
PPl
anni
ngP
erio
dNet
wor
k/S
ub-n
etw
ork
Nam
e
SCHE
DULE
12d
:REP
ORT
FO
RECA
STIN
TERR
UPT
ION
SAN
DDU
RATI
ON
sch
ref
8Cu
rren
tYea
rCY
CY+1
CY+2
CY+3
CY+4
CY+5
9fory
eare
nded
31M
ar2
031
Mar
21
31M
ar2
231
Mar
23
31M
ar2
431
Mar
25
10SA
IDI
11ClassB
(plann
edinterrup
tionsonthene
twork)
114.0
100.0
100.0
100.0
100.0
100.0
12ClassC
(unp
lann
edinterrup
tionsonthene
twork)
151.0
105.0
105.0
100.0
100.0
100.0
13SA
IFI
14ClassB
(plann
edinterrup
tionsonthene
twork)
0.46
0.50
0.50
0.50
0.50
0.50
15
ClassC
(unp
lann
edinterrup
tionsonthene
twork)
3.15
2.75
2.75
2.75
2.75
2.75
Nor
thpo
wer
Ltd
1A
pril
2020
–3
1M
arch
203
0
Thissche
dulere
quire
safo
recastofSAIFIand
SAIDIfo
rdisc
losureand
a5yearp
lann
ingpe
riod.The
forecastss
houldbe
con
sistentwith
thesupp
ortin
ginform
ationseto
utinth
eAM
Paswellasthe
assum
edim
pactofp
lann
ed
andun
plan
nedSA
IFIand
SAIDIontheexpe
nditu
resforecastp
rovide
dinSched
ule11
aan
dSche
dule11b
.


Section 3
Northpower Limited | Asset Management Plan Update 2020-2030 Page 27
Electricity Distribution Information Disclosure Determination 2012 – (consolidated in 2015)
1. This Schedule requires EDBs to provide explanatory notes to reports prepared in accordance with clause 2.6.6.
2. This Schedule is mandatory—EDBs must provide the explanatory comment specified below, in accordance with clause 2.7.2. This information is not part of the audited disclosure information, and so is not subject to the assurance requirements specified in section 2.8.
Commentary on difference between nominal and constant price capital expenditure forecasts (Schedule 11a)
3. In the box below, comment on the difference between nominal and constant price capital expenditure for the disclosure year and 10 year planning period, as disclosed in Schedule 11a.
Box 1: Commentary on difference between nominal and constant price capital expenditure forecasts The differences between nominal and constant prices is based on the application of an escalation factor using Reserve Bank economic projections.
Commentary on difference between nominal and constant price capital expenditure forecasts (Schedule 11b)
4. In the box below, comment on the difference between nominal and constant price operational expenditure for the disclosure year and 10 year planning period, as disclosed in Schedule 11b.
Box 2: Commentary on difference between nominal and constant price operational expenditure forecasts The differences between nominal and constant prices is based on the application of an escalation factor using Reserve Bank economic projections.
Schedule 14a: Mandatory Explanatory Notes on Forecast Information

Page 26 Northpower Limited | Asset Management Plan Update 2020-2030

Northpower Limited | Asset Management Plan Update 2020-2030 Page 27
Section 4: Director Certification


We, Richard Booth and Mark Trigg, being Directors of Northpower Limited certify that, having made all reasonable enquiry, to the best of our knowledge:
a) The following attached information of Northpower Limited prepared for the purposes of clauses 2.6.1, 2.6.3, 2.6.6 and 2.7.2 of the Electricity Distribution Information Disclosure Determination 2012 in all material respects complies with that determination.
b) The prospective financial or non-financial information included in the attached information has been measured on a basis consistent with regulatory requirements or recognised industry standards.
c) The forecasts in Schedules 11a, 11b, 12a, 12b, 12c and 12d are based on objective and reasonable assumptions, which both align with Northpower Limited’s corporate vision and strategy and are documented in retained records.
Director Director
Date: 25/03/2020 Date: 25/03/2020
Director Certification
Northpower Limited | Asset Management Plan Update 2020-2030 Page 31
Section 4: Director Certification

Head Office:Northpower Ltd28 Mt Pleasant Road,Raumanga, Whangarei 0110,New Zealand
Postal Address:Northpower LtdPrivate Bag 9018,Whangarei Mail Centre 0148,New Zealand
Ph: 09 430 1803Fax: 09 430 1804Email: [email protected]: northpower.com