asthma control and clinical management … control and clinical management in children and adults,...
TRANSCRIPT

ASTHMA CONTROL AND CLINICAL MANAGEMENT
IN CHILDREN AND ADULTS, MICHIGAN, 2008‐2010
Sarah Lyon Callo, Paul Dinh, Chris Fussman, Robert WahlMDCH Bureau of Disease Control, Prevention and
EpidemiologyRev. Date 6/01/2012
www.michigan.gov/brfs www.michigan.gov/asthma
This report was supported by the Cooperative Agreement Number 5U59EH000525‐03 from the Centers for Disease Control and Prevention. Its contents are solely the
responsibility of the authors and do not necessarily represent the official views of the Centers for Disease Control and Prevention

WHAT IS ASTHMA?
• Asthma is a chronic lung disease that inflames and narrows the airways. Asthma causes recurring periods of wheezing, chest tightness, shortness of breath, and coughing. The coughing often occurs at night or early in the morning.
• Asthma has no cure. However, with today's knowledge and treatments, most people who have asthma are able to manage the disease.
Data Notes:Sources: http://www.nhlbi.nih.gov/health/health‐topics/topics/asthma/
2
WHAT IS THE ASTHMA CALL BACK SURVEY (ACBS)?
• The ACBS collects detailed information about asthma symptoms, management, and trigger exposures: – Only source of Michigan specific asthma information
• Michigan has conducted the Asthma Call‐back Survey since 2005– Michigan Behavioral Risk Factor Surveillance System (MiBRFSS)
• Identify respondents who reported that they or a randomly selected child in their household had ever been told by a health care provider that they have asthma.
• These respondents were invited to participate in the ACBS
– Called back within two weeks – Standardized questionnaire– Funded by Air Pollution and Respiratory Health Branch of the National
Center for Environmental Health, Centers for Disease Control and Prevention
3
PURPOSE OF THIS REPORT
• Report Changes in Recent Statistics on Asthma Management and Treatment– Children and Adults– Self Reported data:
• Symptoms, Activity Limitation, Missed School/Work, ED Visits, Hospitalization, Asthma Education, Routine Care, Medication Use
– By Age, Race, Household Income, Respondent Education– 2008‐2010– Graphics and Text
4

THE ASTHMA INITIATIVE OF MICHIGAN
AIM is a collaborative effort involving multiple partners from publicand private sectors across the state and is committed to reducing theburden of asthma documented in this report. For information aboutAIM’s priorities and interventions, please review the strategic plan forthe initiative: Asthma in Michigan: A Blueprint for Action.(http://www.getasthmahelp.org/reports.aspx)
5
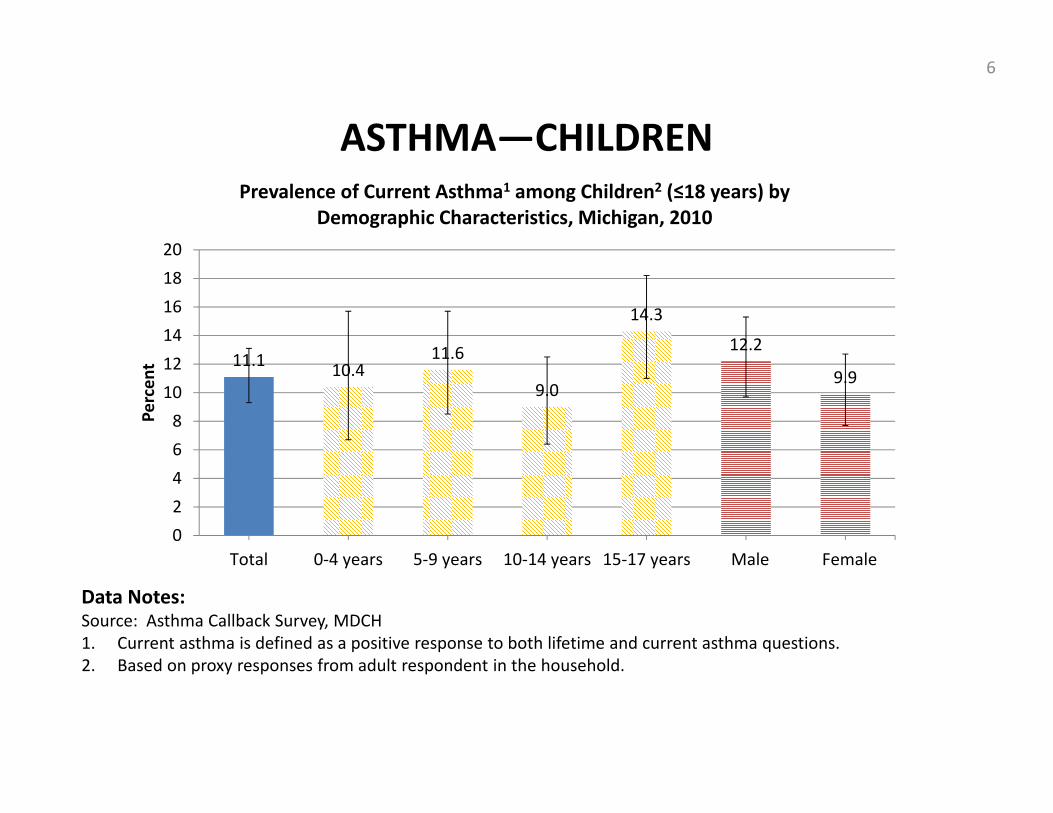
ASTHMA—CHILDREN
Data Notes:Source: Asthma Callback Survey, MDCH1. Current asthma is defined as a positive response to both lifetime and current asthma questions.2. Based on proxy responses from adult respondent in the household.
6
11.1 10.411.6
9.0
14.3
12.2
9.9
02468101214161820
Total 0‐4 years 5‐9 years 10‐14 years 15‐17 years Male Female
Percen
t
Prevalence of Current Asthma1 among Children2 (≤18 years) by Demographic Characteristics, Michigan, 2010

ASTHMA—CHILDREN
Data Notes:Source: Asthma Callback Survey, MDCH1. Current asthma is defined as a positive response to both lifetime and current asthma questions.2. Based on proxy responses from adult respondent in the household.
7
9.9
14.0
4.5
17.2
0
5
10
15
20
25
30
35
White Black Other Non‐hispanic Hispanic
Percen
t
Prevalence of Current Asthma1 among Children2 (≤18 years) by Demographic Characteristics, Michigan, 2010

ASTHMA—CHILDREN
Data Notes:Source: Asthma Callback Survey, MDCH1. Current asthma is defined as a positive response to both lifetime and current asthma questions.2. Based on proxy responses from adult respondent in the household.
8
14.3 16.211.8
7.0 9.1
19.0
10.713.2
8.7
0510152025303540
Percen
t
Prevalence of Current Asthma1 among Children2 (≤18 years) by Socioeconomic Characteristics , Michigan, 2010

ASTHMA—CHILDREN
Data Notes:Source: Asthma Callback Survey, MDCH1. Based on proxy responses from adult respondent in the household.2. Current asthma is defined as a positive response to both lifetime and current asthma questions.* Sample sizes (unweighted) for demographic subpopulations. Cell sample sizes for prevalence estimates will vary
because of missing values.
9
100 (336*)
39.0 (131)
58.9 (198)53.9 (181)
45.8 (154)
69.3 (233)
21.1 (71)
0102030405060708090100
Total 0‐9 years 10‐17 years Male Female White Black
Percen
t
Demographic Characteristics of Children1 (<18 years) with Current Asthma2, Michigan, 2008‐2010

ASTHMA—CHILDREN
Data Notes:Source: Asthma Callback Survey, MDCH1. Based on proxy responses from adult respondent in the household.2. Current asthma is defined as a positive response to both lifetime and current asthma questions.* Sample sizes (unweighted) for demographic subpopulations. Cell sample sizes for prevalence estimates will vary
because of missing values.
10
43.5 (146*)
50.0 (168)
24.4 (82)
34.5 (116)
41.1 (138)
0
10
20
30
40
50
60
< $50,000 ≥ $50,000 ≤ HS Graduate Some College College Grad
Percen
t
Socioeconomic Characteristics of Children1 (<18 years) with Current Asthma2, Michigan, 2008‐2010
Household Income Respondent Education
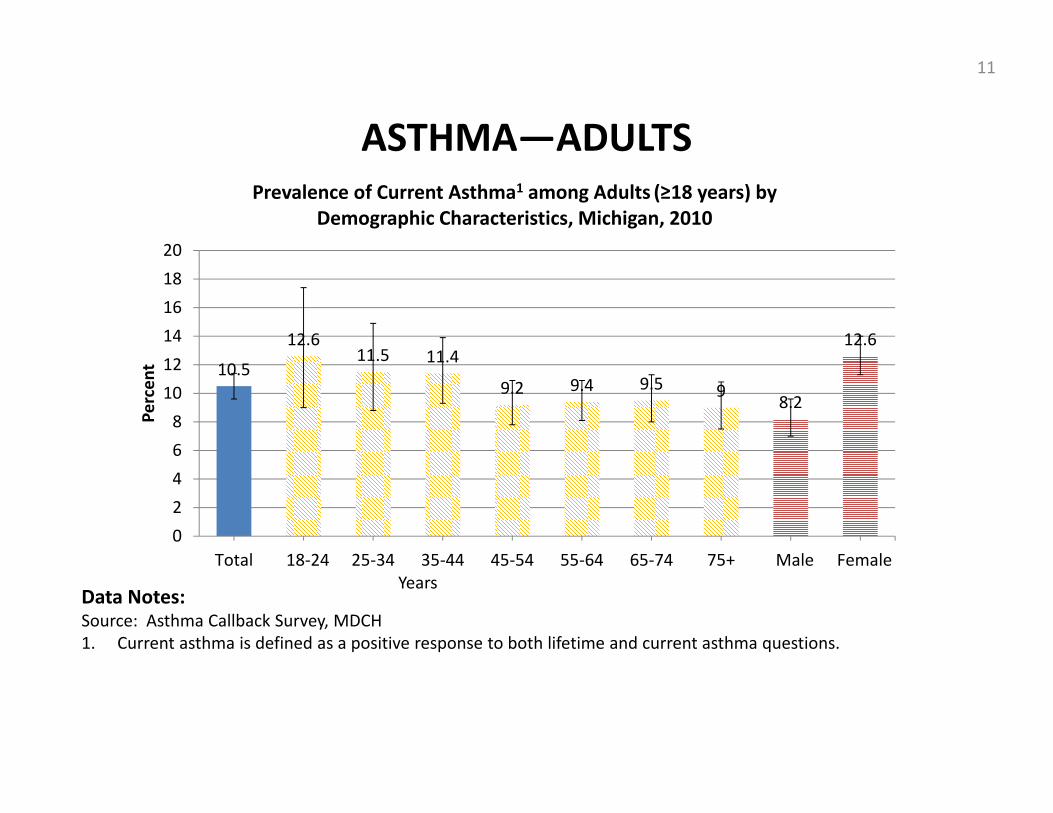
ASTHMA—ADULTS
Data Notes:Source: Asthma Callback Survey, MDCH1. Current asthma is defined as a positive response to both lifetime and current asthma questions.
11
Years
10.5
12.611.5 11.4
9.2 9.4 9.5 9 8.2
12.6
02468101214161820
Total 18‐24 25‐34 35‐44 45‐54 55‐64 65‐74 75+ Male Female
Percen
t
Prevalence of Current Asthma1 among Adults (≥18 years) by Demographic Characteristics, Michigan, 2010

ASTHMA—ADULTS
Data Notes:Source: Asthma Callback Survey, MDCH1. Current asthma is defined as a positive response to both lifetime and current asthma questions.
12
1011.1
14.3
10.8
0
5
10
15
20
25
White Black Other Non‐hispanic Hispanic
Percen
t
Prevalence of Current Asthma1 among Adults (≥18 years) by Demographic Characteristics, Michigan, 2010
ASTHMA—ADULTS
Data Notes:Source: Asthma Callback Survey, MDCH1. Current asthma is defined as a positive response to both lifetime and current asthma questions.* Sample sizes (unweighted) for demographic subpopulations. Cell sample sizes for prevalence estimates will vary
because of missing values.
13
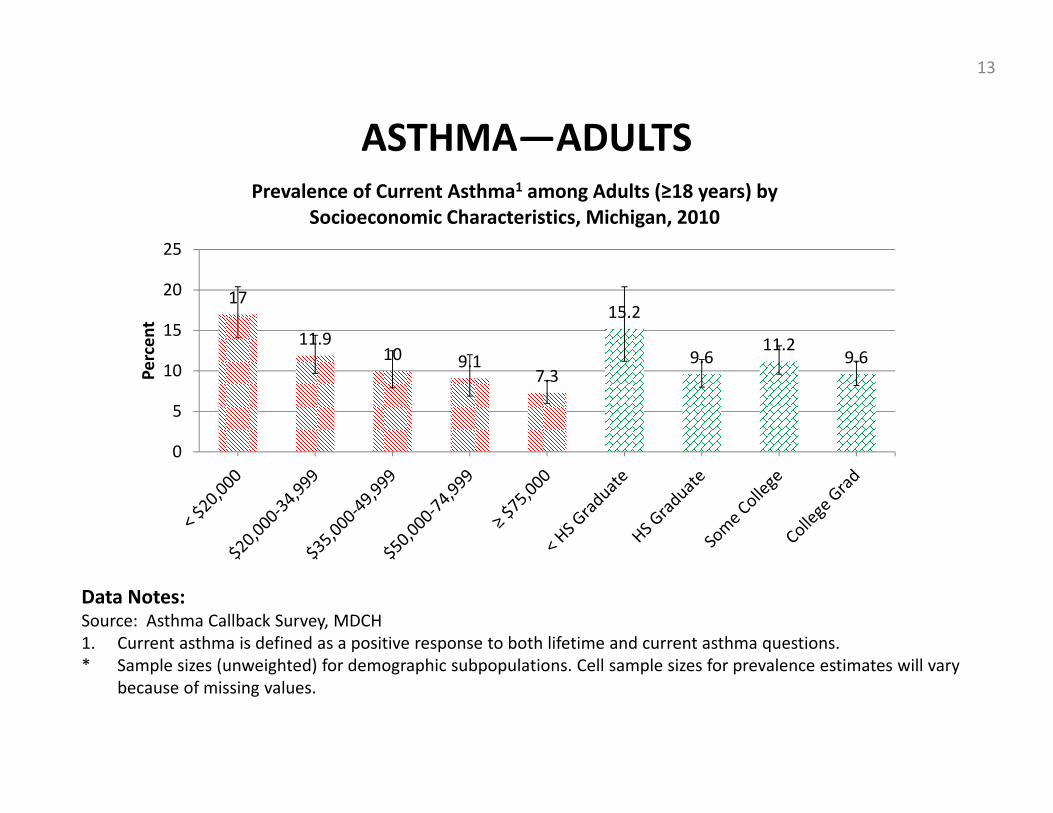
17
11.910 9.1
7.3
15.2
9.611.2
9.6
0
5
10
15
20
25
Percen
t
Prevalence of Current Asthma1 among Adults (≥18 years) by Socioeconomic Characteristics, Michigan, 2010
ASTHMA—ADULTS
Data Notes:Source: Asthma Callback Survey, MDCH1. Current asthma is defined as a positive response to both lifetime and current asthma questions.* Sample sizes (unweighted) for demographic subpopulations. Cell sample sizes for prevalence estimates will vary
because of missing values.
14
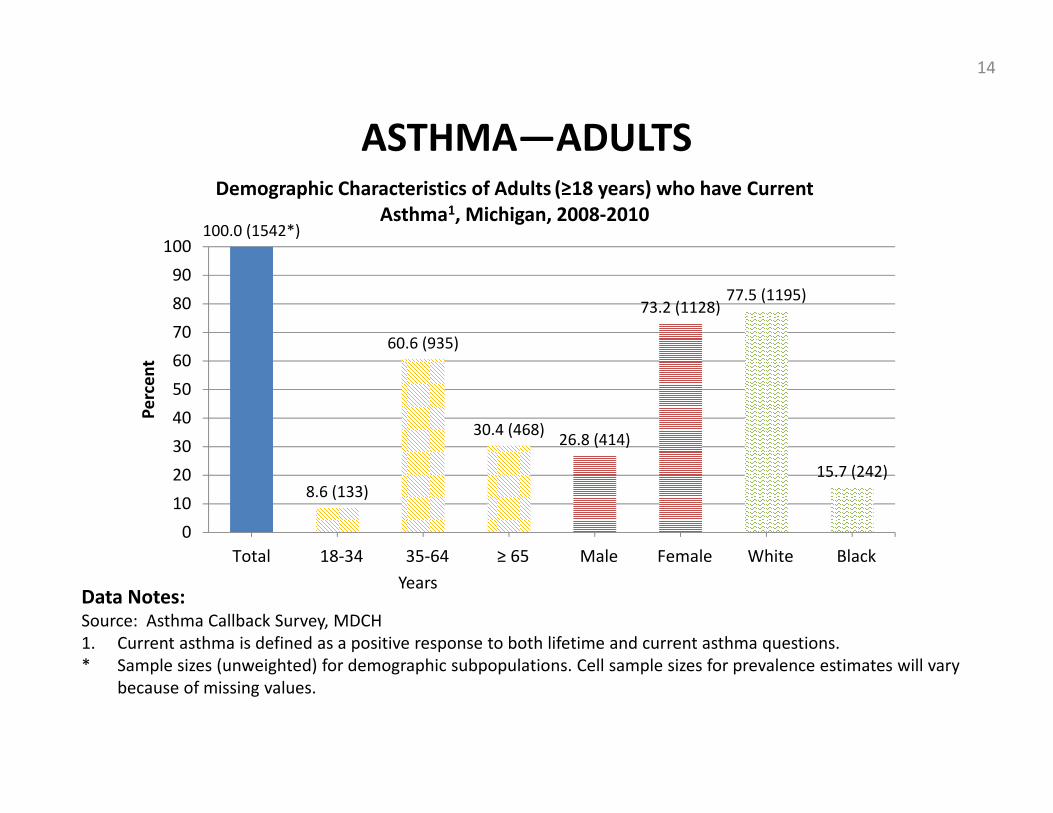
100.0 (1542*)
8.6 (133)
60.6 (935)
30.4 (468) 26.8 (414)
73.2 (1128)77.5 (1195)
15.7 (242)
0102030405060708090100
Total 18‐34 35‐64 ≥ 65 Male Female White Black
Percen
t
Demographic Characteristics of Adults (≥18 years) who have Current Asthma1, Michigan, 2008‐2010
Years

ASTHMA—ADULTS
Data Notes:Source: Asthma Callback Survey, MDCH1. Current asthma is defined as a positive response to both lifetime and current asthma questions.* Sample sizes (unweighted) for demographic subpopulations. Cell sample sizes for prevalence estimates will vary
because of missing values.
15
23.3 (360*)20.4 (315)
12.7 (196) 12.7 (196)
18.7 (289)
8.3 (128)
26.2 (404)
31.7 (489) 33.8 (521)
0510152025303540
Percen
t
Socioeconomic Characteristics of Adults (≥18 years) with Current Asthma1, Michigan, 2008‐2010
Household Income Respondent Education

ASTHMA SYMPTOMS—CHILDREN
16.8 15.418.1
13.9
19.815.0
22.7
051015202530354045
Total 0‐9 years 10‐17 years Male Female White Black
Percen
t
Percent of Children1 (<18 years) with Current Asthma2 who had Asthma Symptoms on ≥9 Days During Past Month3 by Demographic
Characteristics, Michigan, 2008‐2010
Data Notes:Source: Asthma Callback Survey, MDCH1. Based on proxy responses from adult respondent in the household.2. Current asthma is defined as a positive response to both lifetime and current asthma questions.3. Reported ≥9 days to the following question, “During the past 30 days, on how many days did {child’s name} have
symptoms of asthma?” Symptoms on ≥9 days during the past month is consistent with “Not Well Controlled” or “Very Poorly Controlled” asthma according to national treatment guidelines.
16

• According to national treatment guidelines, the overarching goal of therapy is to achieve asthma control, defined, in part, by no or few asthma symptoms.
– 16.8% of children with current asthma had asthma symptoms on 9 or more days during the past month.
– No significant differences within age, sex, or race groups
ASTHMA SYMPTOMS—CHILDREN
17

ASTHMA SYMPTOMS—CHILDREN
Data Notes:Source: Asthma Callback Survey, MDCH1. Based on proxy responses from adult respondent in the household.2. Current asthma is defined as a positive response to both lifetime and current asthma questions.3. Reported ≥9 days to the following question, “During the past 30 days, on how many days did {child’s name} have
symptoms of asthma?” Symptoms on ≥9 days during the past month is consistent with “Not Well Controlled” or “Very Poorly Controlled” asthma according to national treatment guidelines.
15.712.7
16.0
23.6
11.1
0
5
10
15
20
25
30
35
40
< $50,000 ≥ $50,000 ≤ HS Graduate Some College College Grad
Percen
t
Percent of Children1 (<18 years) with Current Asthma2 who had Asthma Symptoms on ≥9 Days During Past Month3 by Socioeconomic
Characteristics, Michigan, 2008‐2010
18
Household Income Respondent Education

• According to national treatment guidelines, the overarching goal of therapy is to achieve asthma control, defined, in part, by no or few asthma symptoms.
– No significant differences in the prevalence of frequent symptoms for children with current asthma within household income or respondent education groups
ASTHMA SYMPTOMS—CHILDREN
19
ASTHMA SYMPTOMS—ADULTS
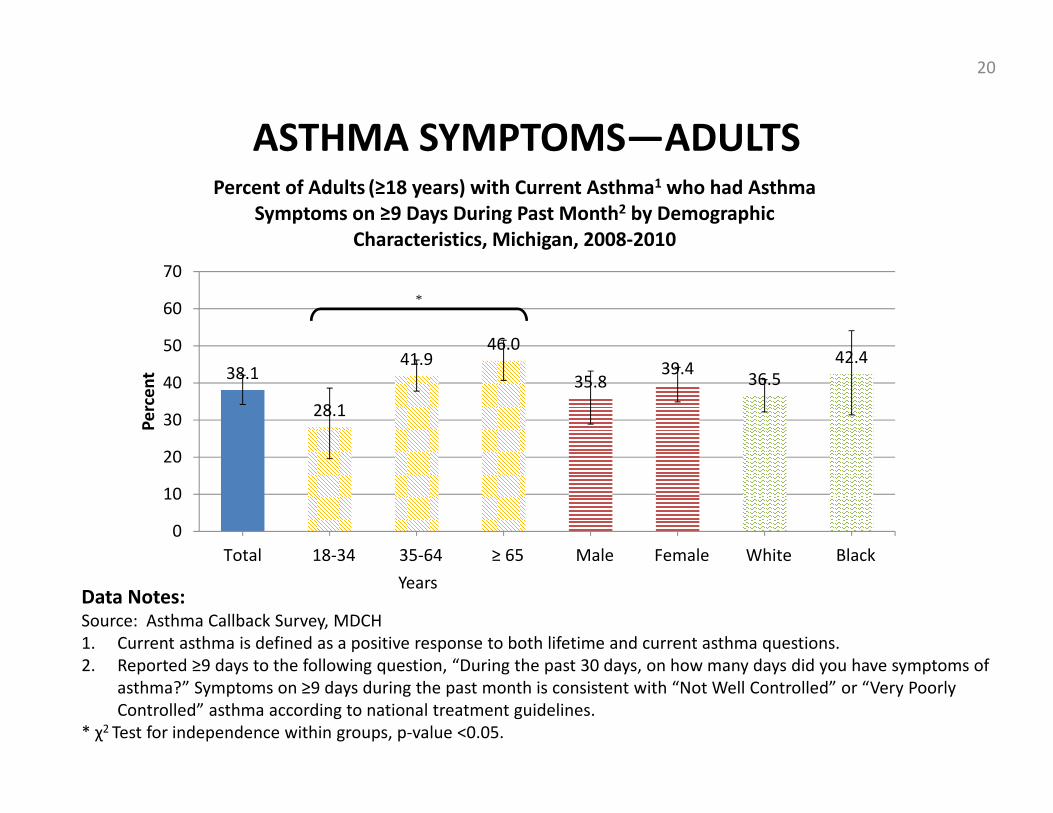
38.1
28.1
41.946.0
35.839.4 36.5
42.4
0
10
20
30
40
50
60
70
Total 18‐34 35‐64 ≥ 65 Male Female White Black
Percen
t
Percent of Adults (≥18 years) with Current Asthma1 who had Asthma Symptoms on ≥9 Days During Past Month2 by Demographic
Characteristics, Michigan, 2008‐2010
Data Notes:Source: Asthma Callback Survey, MDCH1. Current asthma is defined as a positive response to both lifetime and current asthma questions.2. Reported ≥9 days to the following question, “During the past 30 days, on how many days did you have symptoms of
asthma?” Symptoms on ≥9 days during the past month is consistent with “Not Well Controlled” or “Very Poorly Controlled” asthma according to national treatment guidelines.
* χ2 Test for independence within groups, p‐value <0.05.
*
20
Years

• According to national treatment guidelines, the overarching goal of therapy is to achieve asthma control, defined, in part, by no or few asthma symptoms.
– 38.1% of adults with current asthma had asthma symptoms on 9 or more days during the past month.
– The prevalence of frequent symptoms was significantly higher among adults aged 35‐64 and ≥65 than adults aged 18‐34 .
– No significant differences within sex and race groups
ASTHMA SYMPTOMS—ADULTS
21

ASTHMA SYMPTOMS—ADULTS
Data Notes:Source: Asthma Callback Survey, MDCH1. Current asthma is defined as a positive response to both lifetime and current asthma questions.2. Reported ≥9 days to the following question, “During the past 30 days, on how many days did you have symptoms of
asthma?” Symptoms on ≥9 days during the past month is consistent with “Not Well Controlled” or “Very Poorly Controlled” asthma according to national treatment guidelines.
* χ2 Test for independence within groups, p‐value <0.05.
*
22
Household Income Respondent Education
50.8
33.443.0 43.8
26.7
42.5 46.035.2 34.3
010203040506070
Percen
t
Percent of Adults (≥18 years) with Current Asthma1 who had Asthma Symptoms on ≥9 Days During Past Month2 by Socioeconomic
Characteristics, Michigan, 2008‐2010
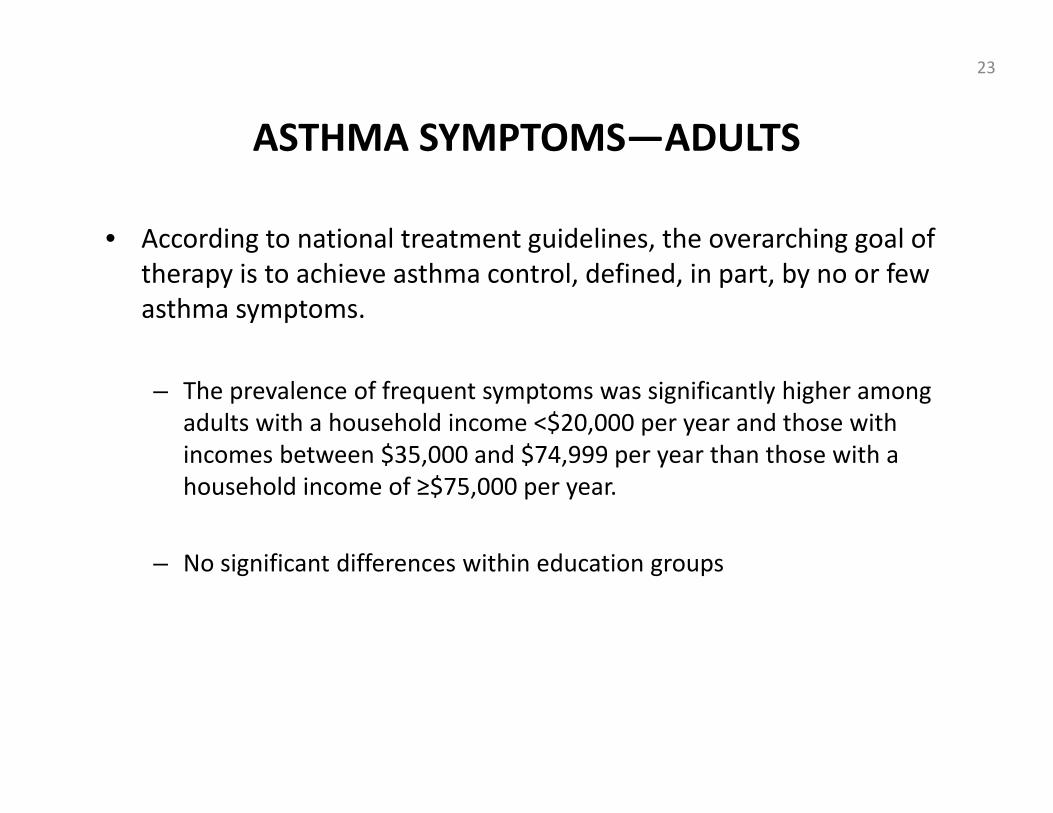
• According to national treatment guidelines, the overarching goal of therapy is to achieve asthma control, defined, in part, by no or few asthma symptoms.
– The prevalence of frequent symptoms was significantly higher among adults with a household income <$20,000 per year and those with incomes between $35,000 and $74,999 per year than those with a household income of ≥$75,000 per year.
– No significant differences within education groups
ASTHMA SYMPTOMS—ADULTS
23

DIFFICULTY SLEEPING DUE TO ASTHMA SYMPTOMS—CHILDREN
Data Notes:Source: Asthma Callback Survey, MDCH1. Based on proxy responses from adult respondent in the household.2. Current asthma is defined as a positive response to both lifetime and current asthma questions.3. Reported ≥2 days to the following question, “During the past 30 days, on how many days did symptoms of asthma
make it difficult for {child’s name} to stay asleep?” Sleep disturbing symptoms on ≥2 days during the past month is consistent with “Not Well Controlled” or “Very Poorly Controlled” asthma according to national treatment guidelines.
20.424.5
16.118.8
22.416.4
33.6
0
10
20
30
40
50
60
Total 0‐9 years 10‐17 years Male Female White Black
Percen
t
Percent of Children1 (<18 years) with Current Asthma2 who had Difficulty Sleeping due to Asthma Symptoms3 by Demographic
Characteristics, Michigan, 2008‐2010
24

• According to national treatment guidelines, the overarching goal of therapy is to achieve asthma control, defined, in part, by no or few sleep disturbing asthma symptoms.
– 20.4% of children with current asthma had difficulty sleeping due to asthma symptoms on 2 or more days during the past month.
– The prevalence was 52.2% higher among children ages 0‐9 than children ages 10‐17.
– No significant differences within sex or race groups
DIFFICULTY SLEEPING DUE TO ASTHMA SYMPTOMS—CHILDREN
25

DIFFICULTY SLEEPING DUE TO ASTHMA SYMPTOMS—CHILDREN
Data Notes:Source: Asthma Callback Survey, MDCH1. Based on proxy responses from adult respondent in the household.2. Current asthma is defined as a positive response to both lifetime and current asthma questions.3. Reported ≥2 days to the following question, “During the past 30 days, on how many days did symptoms of asthma
make it difficult for {child’s name} to stay asleep?” Sleep disturbing symptoms on ≥2 days during the past month is consistent with “Not Well Controlled” or “Very Poorly Controlled” asthma according to national treatment guidelines.
20.8
15.219.4
24.1
17.6
0
5
10
15
20
25
30
35
40
< $50,000 ≥ $50,000 ≤ HS Graduate Some College College Grad
Percen
t
Percent of Children1 (<18 years) with Current Asthma2 who had Difficulty Sleeping due to Asthma Symptoms3 by Socioeconomic
Characteristics, Michigan, 2008‐2010
26
Household Income Respondent Education
• According to national treatment guidelines, the overarching goal of therapy is to achieve asthma control, defined, in part, by no or few sleep disturbing asthma symptoms.
– No significant differences in the prevalence of frequent sleep disturbing symptoms for children with current asthma within household income or respondent education groups
DIFFICULTY SLEEPING DUE TO ASTHMA SYMPTOMS—CHILDREN
27
DIFFICULTY SLEEPING DUE TO ASTHMA SYMPTOMS—ADULTS
Data Notes:Source: Asthma Callback Survey, MDCH1. Current asthma is defined as a positive response to both lifetime and current asthma questions.2. Reported ≥2 days to the following question, “During the past 30 days, on how many days did symptoms of asthma
make it difficult for you to stay asleep?” Sleep disturbing symptoms on ≥2 days during the past month is consistent with “Not Well Controlled” or “Very Poorly Controlled” asthma according to national treatment guidelines.
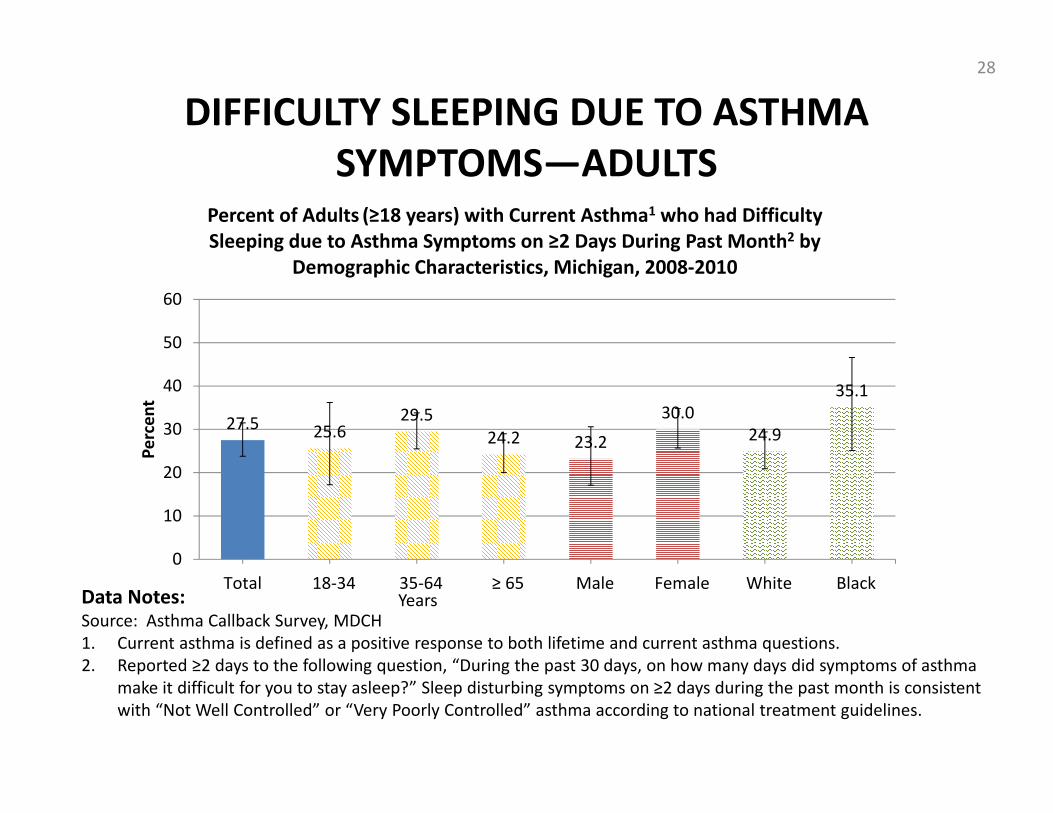
27.5 25.629.5
24.2 23.2
30.024.9
35.1
0
10
20
30
40
50
60
Total 18‐34 35‐64 ≥ 65 Male Female White Black
Percen
t
Percent of Adults (≥18 years) with Current Asthma1 who had Difficulty Sleeping due to Asthma Symptoms on ≥2 Days During Past Month2 by
Demographic Characteristics, Michigan, 2008‐2010
28
Years

• According to national treatment guidelines, the overarching goal of therapy is to achieve asthma control, defined, in part, by no or few sleep disturbing asthma symptoms.
– 27.5% of adults with current asthma had difficulty sleeping due to asthma symptoms on 2 or more days during the past month.
– No significant differences in the prevalence of frequent sleep disturbing symptoms within race, age, or sex groups
DIFFICULTY SLEEPING DUE TO ASTHMA SYMPTOMS—ADULTS
29

DIFFICULTY SLEEPING DUE TO ASTHMA SYMPTOMS—ADULTS
Data Notes:Source: Asthma Callback Survey, MDCH1. Current asthma is defined as a positive response to both lifetime and current asthma questions.2. Reported ≥2 days to the following question, “During the past 30 days, on how many days did symptoms of asthma
make it difficult for you to stay asleep?” Sleep disturbing symptoms on ≥2 days during the past month is consistent with “Not Well Controlled” or “Very Poorly Controlled” asthma according to national treatment guidelines.
* χ2 Test for independence within groups, p‐value <0.05.
*
30
Household Income Respondent Education
45.3
28.1 24.3 27.3
14.0
48.0
34.122.9 22.2
010203040506070
Percen
t
8. Percent of Adults (≥18 years) with Current Asthma1 who had Difficulty Sleeping due to Asthma Symptoms on ≥2 Days During Past Month2 by Socioeconomic Characteristics, Michigan, 2008‐2010
According to national treatment guidelines, the overarching goal of therapy is to achieve asthma control, defined, in part, by no or few sleep disturbing asthma symptoms.
– The prevalence of frequent sleep disturbing symptoms was significantly higher (3.2 times) among adults with a household income <$20,000 per year than those with a household income of ≥$75,000 per year.
– The prevalence was significantly higher among adults with a high school education or less compared to adults with some college or who graduated from college.
DIFFICULTY SLEEPING DUE TO ASTHMA SYMPTOMS—ADULTS
31

ASTHMA SYMPTOM‐FREE DAYS—CHILDREN
Data Notes:Source: Asthma Callback Survey, MDCH1. Response to the following question, “During the past two weeks, on how many days was/were {child’s name/you}
completely symptom free, that is no coughing, wheezing, or other symptoms of asthma?”2. Based on proxy responses from adult respondent in the household.3. Current asthma is defined as a positive response to both lifetime and current asthma questions.
11.2 9.3
21.7
57.9
0
10
20
30
40
50
60
70
None 1‐6 Days 7‐13 Days 14 Days
Percen
t
Distribution of the Number of Symptom‐Free Days During Past 2 Weeks1 Among Children2 (<18 years) with Current Asthma3, Michigan,
2008‐2010
32
– 57.9% of children with current asthma experienced 14 asthma symptom‐free days during the past 2 weeks.
– 11.2% of children with current asthma had asthma symptoms every day of the last 2 weeks.
ASTHMA SYMPTOM‐FREE DAYS—CHILDREN
33

ASTHMA SYMPTOM‐FREE DAYS—ADULT
Data Notes:Source: Asthma Callback Survey, MDCH1. Response to the following question, “During the past two weeks, on how many days was/were {child’s name/you}
completely symptom free, that is no coughing, wheezing, or other symptoms of asthma?”2. Current asthma is defined as a positive response to both lifetime and current asthma questions.
23.8
14.2
27.2
34.8
051015202530354045
None 1‐6 Days 7‐13 Days 14 Days
Percen
t
Distribution of the Number of Symptom‐Free Days During Past 2 Weeks1 Among Adults (≥18 years) with Current Asthma2 , Michigan,
2008‐2010
34

– 34.8% of adults with current asthma experienced 14 asthma symptom‐free days during the past 2 weeks.
– 23.8% of adults with current asthma had asthma symptoms every day of the last 2 weeks.
– The prevalence of having no symptom‐free days was 2.1 times higher for adults with current asthma than children with current asthma.
ASTHMA SYMPTOM‐FREE DAYS—ADULT
35
USUAL ACTIVITIES LIMITED DUE TO ASTHMA—CHILDREN
Data Notes:Source: Asthma Callback Survey, MDCH1. Based on proxy responses from adult respondent in the household.2. Current asthma is defined as a positive response to both lifetime and current asthma questions. 3. Reported “a little”, “a moderate amount”, or “a lot” to the following question, “During the past 12 months, would
you say {child’s name} limited {his/her} usual activities due to asthma not at all, a little, a moderate amount, or a lot?”
55.459.1
51.558.7
50.9 53.7 55.8
0
10
20
30
40
50
60
70
80
Total 0‐9 years 10‐17 years Male Female White Black
Percen
t
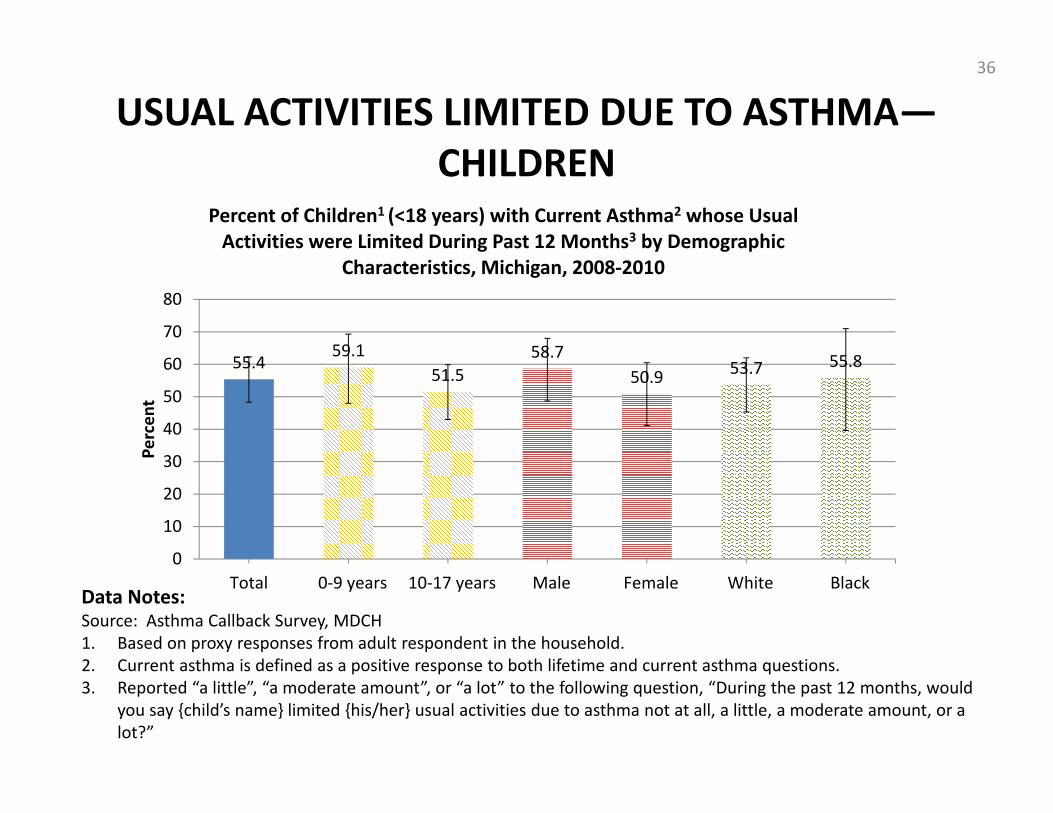
Percent of Children1 (<18 years) with Current Asthma2 whose Usual Activities were Limited During Past 12 Months3 by Demographic
Characteristics, Michigan, 2008‐2010
36
• According to national treatment guidelines, the overarching goal of therapy is to achieve asthma control, defined, in part, by participation in all activities, including exercise.
– 55.4% of children with current asthma experienced limited usual activities due to asthma during the past 12 months.
– No significant differences within age, sex, and race groups
USUAL ACTIVITIES LIMITED DUE TO ASTHMA—CHILDREN
37

USUAL ACTIVITIES LIMITED DUE TO ASTHMA—CHILDREN
Data Notes:Source: Asthma Callback Survey, MDCH1. Based on proxy responses from adult respondent in the household.2. Current asthma is defined as a positive response to both lifetime and current asthma questions. 3. Reported “a little”, “a moderate amount”, or “a lot” to the following question, “During the past 12 months, would
you say {child’s name} limited {his/her} usual activities due to asthma not at all, a little, a moderate amount, or a lot?”
51.755.5 56.3 55.8 54.4
0
10
20
30
40
50
60
70
80
< $50,000 ≥ $50,000 ≤ HS Graduate Some College College Grad
Percen
t
Percent of Children1 (<18 years) with Current Asthma2 whose Usual Activities were Limited During Past 12 Months3 by Socioeconomic
Characteristics, Michigan, 2008‐2010
38
Household Income Respondent Education

• According to national treatment guidelines, the overarching goal of therapy is to achieve asthma control, defined, in part, by participation in all activities, including exercise.
– No significant differences in the prevalence of limited usual activities for children with current asthma within household income or respondent education groups
USUAL ACTIVITIES LIMITED DUE TO ASTHMA—CHILDREN
39

61.352.4
66.860.3
55.3
64.760.5 60.7
0
10
20
30
40
50
60
70
80
Total 18‐34 35‐64 ≥ 65 Male Female White Black
Percen
t
Percent of Adults1 (≥18 years) with Current Asthma1 whose Usual Activities were Limited During Past 12 Months2 by Demographic
Characteristics, Michigan, 2008‐2010
USUAL ACTIVITIES LIMITED DUE TO ASTHMA—ADULTS
Data Notes:Source: Asthma Callback Survey, MDCH1. Current asthma is defined as a positive response to both lifetime and current asthma questions.2. Reported “a little”, “a moderate amount”, or “a lot” to the following question, “During the past 12 months, would
you say you limited your usual activities due to asthma not at all, a little, a moderate amount, or a lot?”* χ2 Test for independence within groups, p‐value <0.05.
* *
40
Years

• According to national treatment guidelines, the overarching goal of therapy is to achieve asthma control, defined, in part, by participation in all activities, including exercise.
– 61.3% of adults with current asthma experienced limited usual activities due to asthma during the past 12 months.
– The prevalence was significantly higher (27.5%) among adults 35‐64 than adults 18‐34.
– The prevalence was significantly higher (17.0%) among females than males.
– No significant differences within race groups
USUAL ACTIVITIES LIMITED DUE TO ASTHMA—ADULTS
41
77.4
59.9 63.1 61.3 55.268.6 68.2
59.7 56.0
0102030405060708090100
Percen
t
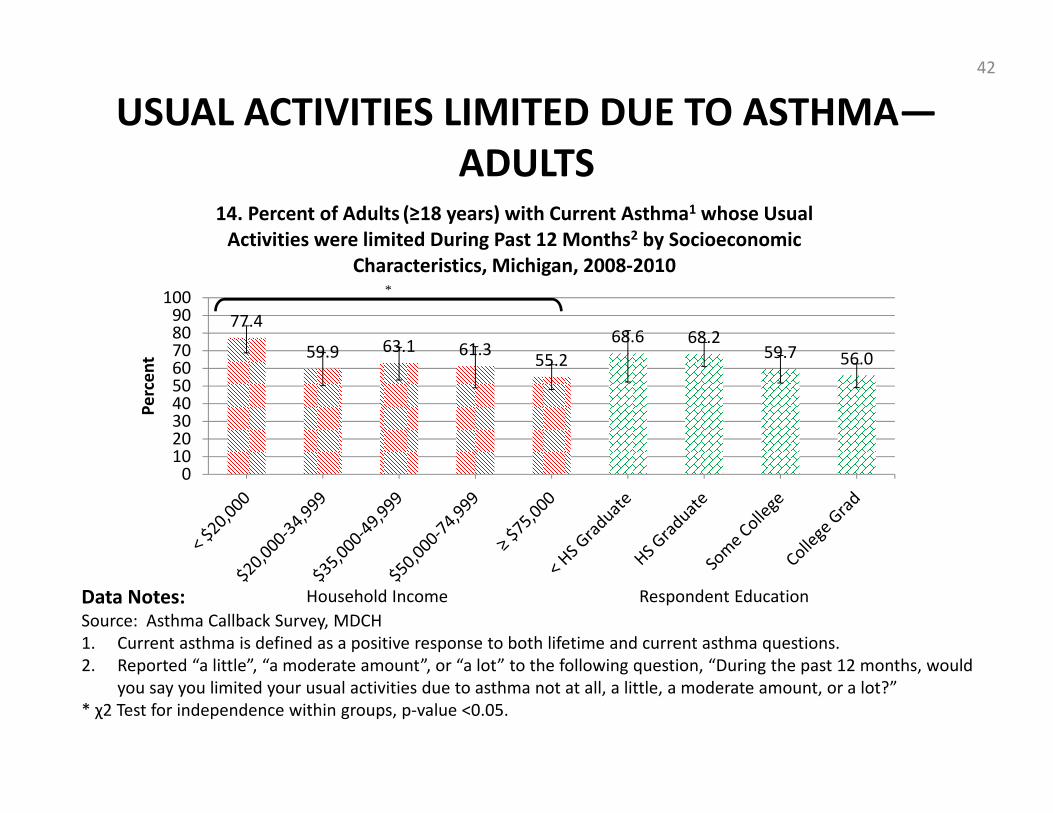
14. Percent of Adults (≥18 years) with Current Asthma1 whose Usual Activities were limited During Past 12 Months2 by Socioeconomic
Characteristics, Michigan, 2008‐2010
USUAL ACTIVITIES LIMITED DUE TO ASTHMA—ADULTS
Data Notes:Source: Asthma Callback Survey, MDCH1. Current asthma is defined as a positive response to both lifetime and current asthma questions.2. Reported “a little”, “a moderate amount”, or “a lot” to the following question, “During the past 12 months, would
you say you limited your usual activities due to asthma not at all, a little, a moderate amount, or a lot?”* χ2 Test for independence within groups, p‐value <0.05.
*
42
Household Income Respondent Education

• According to national treatment guidelines, the overarching goal of therapy is to achieve asthma control, defined, in part, by participation in all activities, including exercise.
– The prevalence of limited usual activities due to asthma was significantly higher among adults with a household income <$20,000 per year than those in other household income groups.
– No significant differences within education groups
USUAL ACTIVITIES LIMITED DUE TO ASTHMA—ADULTS
43
NUMBER OF SCHOOL DAYS MISSED DUE TO ASTHMA
Data Notes:Source: Asthma Callback Survey, MDCH1. Response to the following question, “During the past 12 months, about how many days of school did {child’s name}
miss because of {his/her} asthma?”2. Based on proxy responses from adult respondent in the household.3. Current asthma is defined as a positive response to both lifetime and current asthma questions.
54.5
29.0
16.5
0
10
20
30
40
50
60
70
None 1‐5 Days ≥6 Days
Percen
t
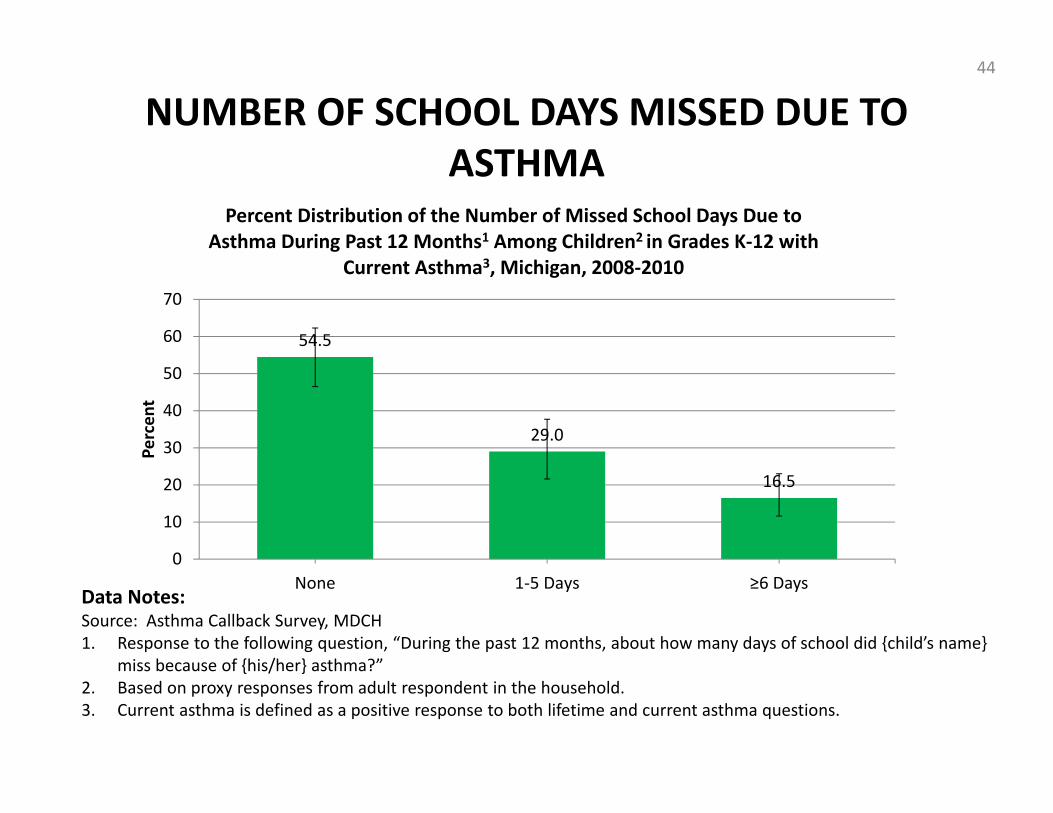
Percent Distribution of the Number of Missed School Days Due to Asthma During Past 12 Months1 Among Children2 in Grades K‐12 with
Current Asthma3, Michigan, 2008‐2010
44

• According to national treatment guidelines, the overarching goal of therapy is to achieve asthma control, defined, in part, by normal attendance at school or work.
– 16.5% of children with current asthma missed 6 or more school days due to asthma in the past 12 months due to asthma.
– 54.5% of children with current asthma missed no school days due to asthma in the past 12 months due to asthma.
NUMBER OF SCHOOL DAYS MISSED DUE TO ASTHMA
45

NUMBER OF WORK DAYS MISSED DUE TO ASTHMA
Data Notes:Source: Asthma Callback Survey, MDCH1. Response to the following question, “During the past 12 months, how many days were you unable to work or carry
out your usual activities because of your asthma?”2. Current asthma is defined as a positive response to both lifetime and current asthma questions.
72.3
14.7 13.1
0
10
20
30
40
50
60
70
80
None 1‐5 Days ≥6 Days
Percen
t
Percent Distribution of the Number of Days of Missed Work or Usual Activities Due to Asthma During Past 12 Months1Among Adults (≥18
years) with Current Asthma2, Michigan, 2008‐2010
46
• According to national treatment guidelines, the overarching goal of therapy is to achieve asthma control, defined, in part, by normal attendance at school or work.
– 13.1% of adults with current asthma missed 6 or more work days or usual activities due to asthma in the past 12 months.
– 72.3% of adults with current asthma missed no work days or usual activities due to asthma in the past 12 months.
NUMBER OF WORK DAYS MISSED DUE TO ASTHMA
47

ASTHMA EMERGENCY DEPARTMENT/URGENT CARE VISITS—CHILDREN
Data Notes:Source: Asthma Callback Survey, MDCH1. Based on proxy responses from adult respondent in the household.2. Current asthma is defined as a positive response to both lifetime and current asthma questions.3. Reported ≥2 times to the following question, “During the past 12 months, how many times did {child’s name} visit
an emergency room or urgent care center because of {his/her} asthma?”
9.211.0
6.7 6.8
11.6
7.6
14.5
0
5
10
15
20
25
30
Total 0‐9 years 10‐17 years Male Female White Black
Percen
t
Percent of Children1 (<18 years) with Current Asthma2 who had ≥2 ED/Urgent Care Visits for Asthma During Past 12 Months3 by
Demographic Characteristics, Michigan, 2008‐2010
48

• It is a goal of asthma therapy that persons with asthma experience minimal or no emergency department visits.
– 9.2% of children with current asthma visited the emergency department or urgent care center for asthma 2 or more times during the past 12 months.
– No significant differences within age, gender or race groups
ASTHMA EMERGENCY DEPARTMENT/URGENT CARE VISITS—CHILDREN
49

ASTHMA EMERGENCY DEPARTMENT/URGENT CARE VISITS—CHILDREN
Data Notes:Source: Asthma Callback Survey, MDCH1. Based on proxy responses from adult respondent in the household.2. Current asthma is defined as a positive response to both lifetime and current asthma questions.3. Reported ≥2 times to the following question, “During the past 12 months, how many times did {child’s name} visit
an emergency room or urgent care center because of {his/her} asthma?”* χ2 Test for independence within groups, p‐value <0.05.
14.6
5.2
9.3
14.8
4.0
0
5
10
15
20
25
30
< $50,000 ≥ $50,000 ≤ HS Graduate Some College College Grad
Percen
t
Percent of Children1 (<18 years) with Current Asthma2 who had ≥2 ED/Urgent Care Visits for Asthma During Past 12 Months3 by
Socioeconomic Characteristics, Michigan, 2008‐2010*
50
Household Income Respondent Education

• It is a goal of asthma therapy that persons with asthma experience minimal or no emergency department visits.
– The prevalence of frequent asthma emergency department or urgent care center visits for children with current asthma was significantly higher (3.7 times) among respondents who attended Some College than respondents who Graduated from College.
– No significant differences within household income groups
ASTHMA EMERGENCY DEPARTMENT/URGENT CARE VISITS—CHILDREN
51
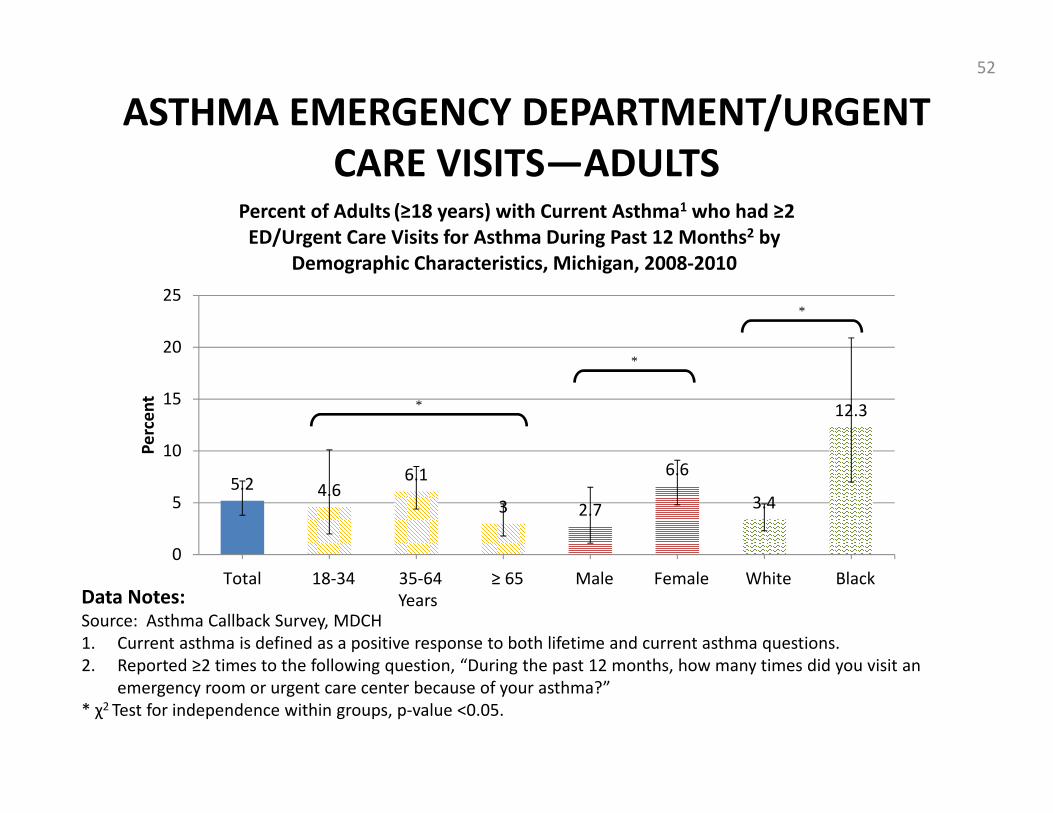
5.2 4.66.1
3 2.7
6.6
3.4
12.3
0
5
10
15
20
25
Total 18‐34 35‐64 ≥ 65 Male Female White Black
Percen
t
Percent of Adults (≥18 years) with Current Asthma1 who had ≥2 ED/Urgent Care Visits for Asthma During Past 12 Months2 by
Demographic Characteristics, Michigan, 2008‐2010
ASTHMA EMERGENCY DEPARTMENT/URGENT CARE VISITS—ADULTS
Data Notes:Source: Asthma Callback Survey, MDCH1. Current asthma is defined as a positive response to both lifetime and current asthma questions.2. Reported ≥2 times to the following question, “During the past 12 months, how many times did you visit an
emergency room or urgent care center because of your asthma?”* χ2 Test for independence within groups, p‐value <0.05.
*
*
*
52
Years

• It is a goal of asthma therapy that persons with asthma experience minimal or no emergency department visits.
– 5.2% of adults with current asthma visited the emergency department or urgent care center for asthma 2 or more times during the past 12 months.
– The prevalence was significantly different within age, sex, and race groups:
• 2.0 times higher among adults 35‐64 than adults ≥65 .• 2.4 times higher among female adults than male adults.• 3.6 times higher among black adults than white adults.
ASTHMA EMERGENCY DEPARTMENT/URGENT CARE VISITS—ADULTS
53

ASTHMA EMERGENCY DEPARTMENT/URGENT CARE VISITS—ADULTS
Data Notes:Source: Asthma Callback Survey, MDCH1. Current asthma is defined as a positive response to both lifetime and current asthma questions.2. Reported ≥2 times to the following question, “During the past 12 months, how many times did you visit an
emergency room or urgent care center because of your asthma?”
9.4 8.23.5 3.7 3
9.3 8.54 3
0
5
10
15
20
25
30
Percen
t
Percent of Adults (≥18 years) with Current Asthma1 who had ≥ 2 ED/Urgent Care Visits for Asthma During Past 12 Months2 by
Socioeconomic Characteristics, Michigan, 2008‐2010
54
Household Income Respondent Education

• It is a goal of asthma therapy that persons with asthma experience minimal or no emergency department visits.
– No significant differences in the prevalence of frequent asthma emergency department or urgent care center visits for adults with current asthma within respondent household income or education groups
ASTHMA EMERGENCY DEPARTMENT/URGENT CARE VISITS—ADULTS
55

ASTHMA HOSPITALIZATIONS—CHILDREN
Data Notes:Source: Asthma Callback Survey, MDCH1. Based on proxy responses from adult respondent in the household.2. Current asthma is defined as a positive response to both lifetime and current asthma questions.3. Responded “yes” to the following question, “During the past 12 months, that is since [1 year ago today], has {child’s
name} had to stay overnight in a hospital because of {his/her} asthma? Do not include an overnight stay in the emergency room.”
4.3
7.6
0.71.9
7.3
5.1 5.0
02468
1012141618
Total 0‐9 years 10‐17 years Male Female White Black
Percen
tPercent of Children1 (<18 years) with Current Asthma2 who had ≥1 Hospitalization for Asthma During Past 12 Months3 by Demographic
Characteristics, Michigan, 2008‐2010
56
• It is a goal of asthma therapy that persons with asthma experience minimal or no hospitalizations.
– 4.2% of children with current asthma had at least 1 hospitalization for asthma the past 12 months.
– No significant differences within age, sex, or race groups
ASTHMA HOSPITALIZATIONS—CHILDREN
57
ASTHMA HOSPITALIZATIONS—CHILDREN
Data Notes:Source: Asthma Callback Survey, MDCH1. Based on proxy responses from adult respondent in the household.2. Current asthma is defined as a positive response to both lifetime and current asthma questions.3. Responded “yes” to the following question, “During the past 12 months, that is since [1 year ago today], has {child’s
name} had to stay overnight in a hospital because of {his/her} asthma? Do not include an overnight stay in the emergency room.”
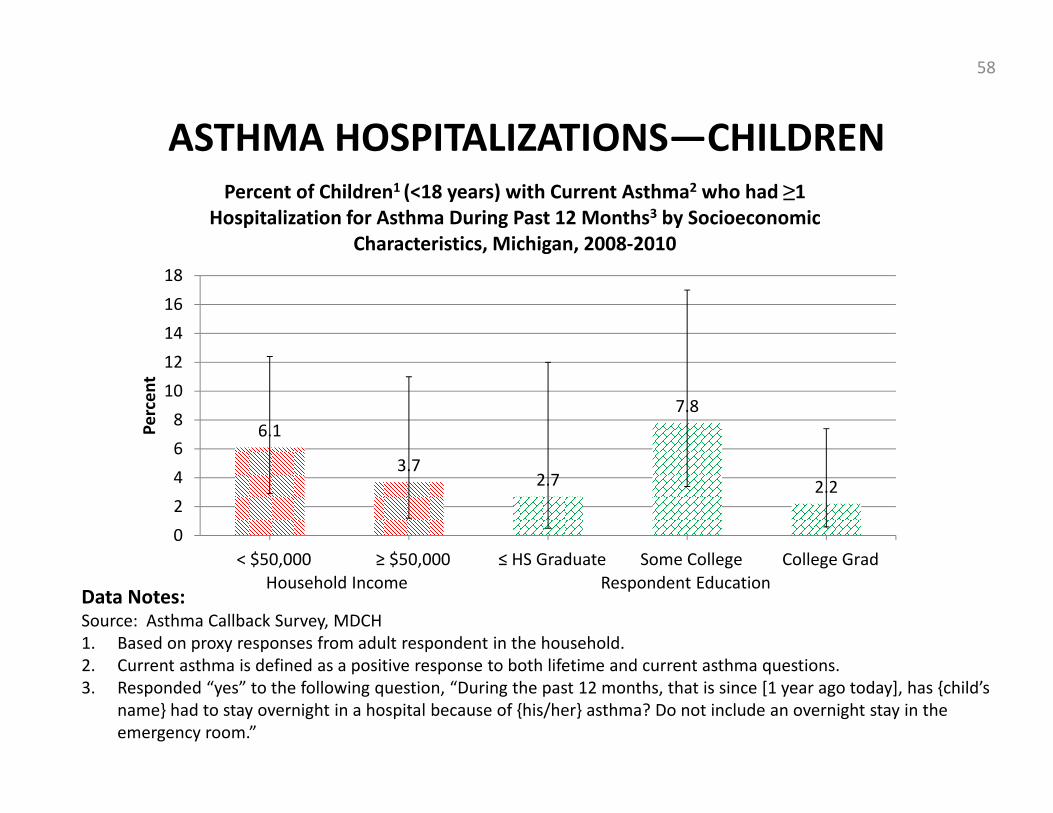
6.1
3.72.7
7.8
2.2
02468
1012141618
< $50,000 ≥ $50,000 ≤ HS Graduate Some College College Grad
Percen
t
Percent of Children1 (<18 years) with Current Asthma2 who had ≥1 Hospitalization for Asthma During Past 12 Months3 by Socioeconomic
Characteristics, Michigan, 2008‐2010
58
Household Income Respondent Education
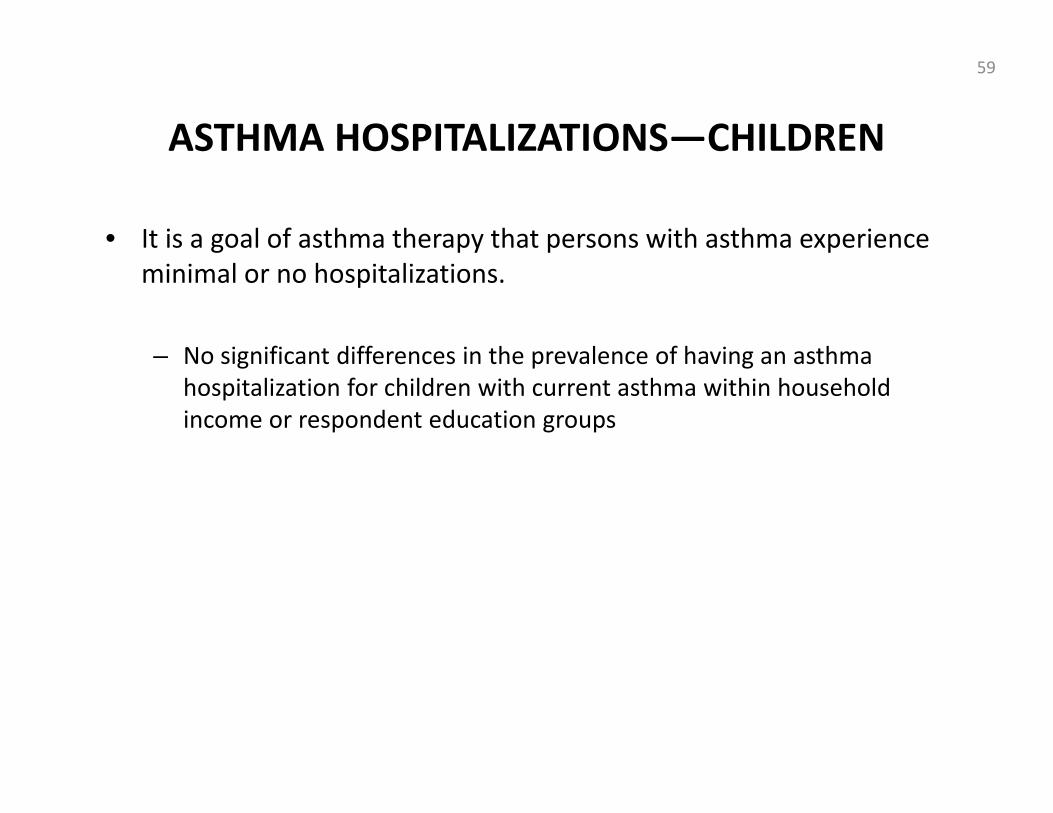
• It is a goal of asthma therapy that persons with asthma experience minimal or no hospitalizations.
– No significant differences in the prevalence of having an asthma hospitalization for children with current asthma within household income or respondent education groups
ASTHMA HOSPITALIZATIONS—CHILDREN
59

ASTHMA HOSPITALIZATIONS—ADULTS
3.6
0.3
4.95.9
2.3
4.43.0
6.9
0
2
4
6
8
10
12
14
Total 18‐34 35‐64 ≥ 65 Male Female White Black
Percen
t
Percent of Adults (≥18 years) with Current Asthma1 who had ≥1 Hospitalization for Asthma During Past 12 Months2 by Demographic
Characteristics, Michigan, 2008‐2010
Data Notes:Source: Asthma Callback Survey, MDCH1. Current asthma is defined as a positive response to both lifetime and current asthma questions.2. Responded at least one time to the question, “During the past 12 months, how many different times did you stay in
any hospital overnight or longer because of your asthma?” * χ2 Test for independence within groups, p‐value <0.05.
*
*
*
60
Years
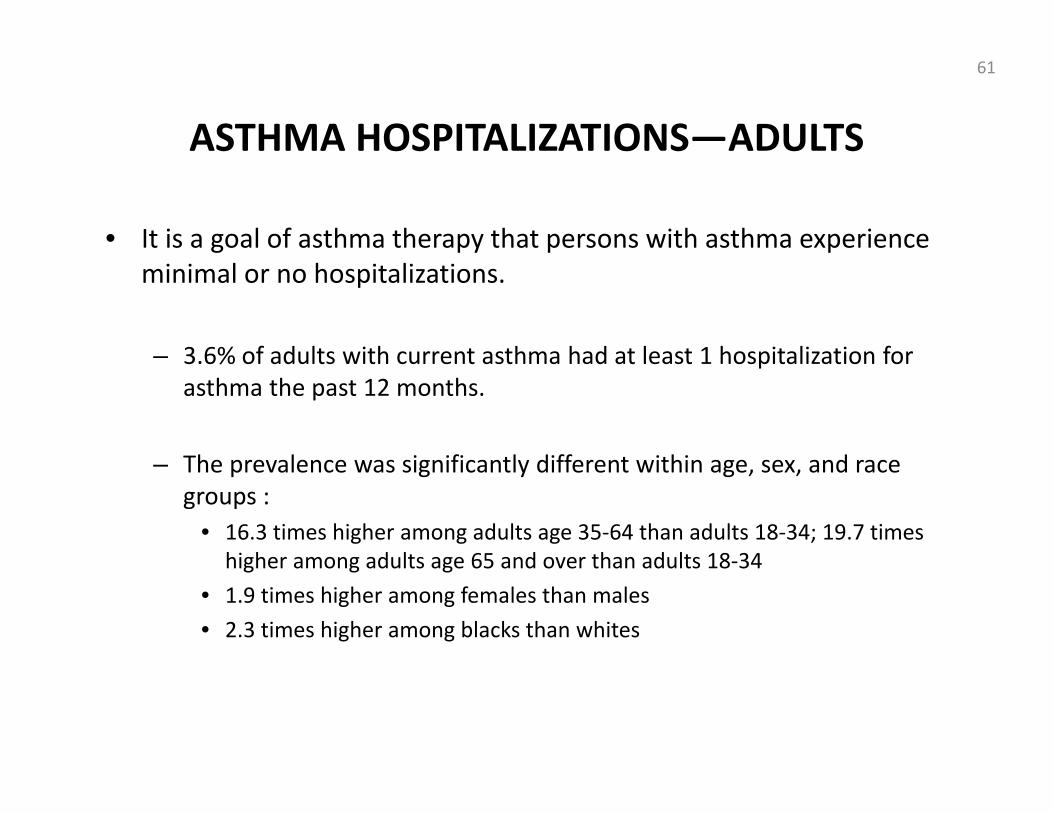
• It is a goal of asthma therapy that persons with asthma experience minimal or no hospitalizations.
– 3.6% of adults with current asthma had at least 1 hospitalization for asthma the past 12 months.
– The prevalence was significantly different within age, sex, and race groups :
• 16.3 times higher among adults age 35‐64 than adults 18‐34; 19.7 times higher among adults age 65 and over than adults 18‐34
• 1.9 times higher among females than males• 2.3 times higher among blacks than whites
ASTHMA HOSPITALIZATIONS—ADULTS
61

ASTHMA HOSPITALIZATIONS—ADULTS
Data Notes:Source: Asthma Callback Survey, MDCH1. Current asthma is defined as a positive response to both lifetime and current asthma questions.2. Responded at least one time to the question, “During the past 12 months, how many different times did you stay in
any hospital overnight or longer because of your asthma?”
7.7
2.1 2.44
2.24.1 4.1 4.4
2.4
02468101214
Percen
t
Percent of Adults (≥18 years) with Current Asthma1 who had ≥1 Hospitalization for Asthma During Past 12 Months2 by Socioeconomic
Characteristics, Michigan, 2008‐2010
62
Household Income Respondent Education

• It is a goal of asthma therapy that persons with asthma experience minimal or no hospitalizations.
– No significant statistical association between the prevalence of having an asthma hospitalization during the past 12 months and household income or education groups
ASTHMA HOSPITALIZATIONS—ADULTS
63

ASTHMA ACTION PLANS—CHILDREN
Data Notes:Source: Asthma Callback Survey, MDCH1. Based on proxy responses from adult respondent in the household.2. Current asthma is defined as a positive response to both lifetime and current asthma questions.3. Responded “yes” to the question, “An asthma action plan, or asthma management plan, is a form with instructions
about when to change the amount or type of medicine, when to call the doctor for advice, and when to go to the emergency room. Has a doctor or other health professional ever given you or {child’s name} an asthma action plan?”
45.7 42.349.7 47.4
43.3 42.9
52.1
0
10
20
30
40
50
60
70
80
Total 0‐9 years 10‐17 years Male Female White Black
Percen
t
Percent of Children1 (<18 years) with Current Asthma2 who Ever Received an Asthma Action Plan3 by Demographic Characteristics,
Michigan, 2008‐2010
64
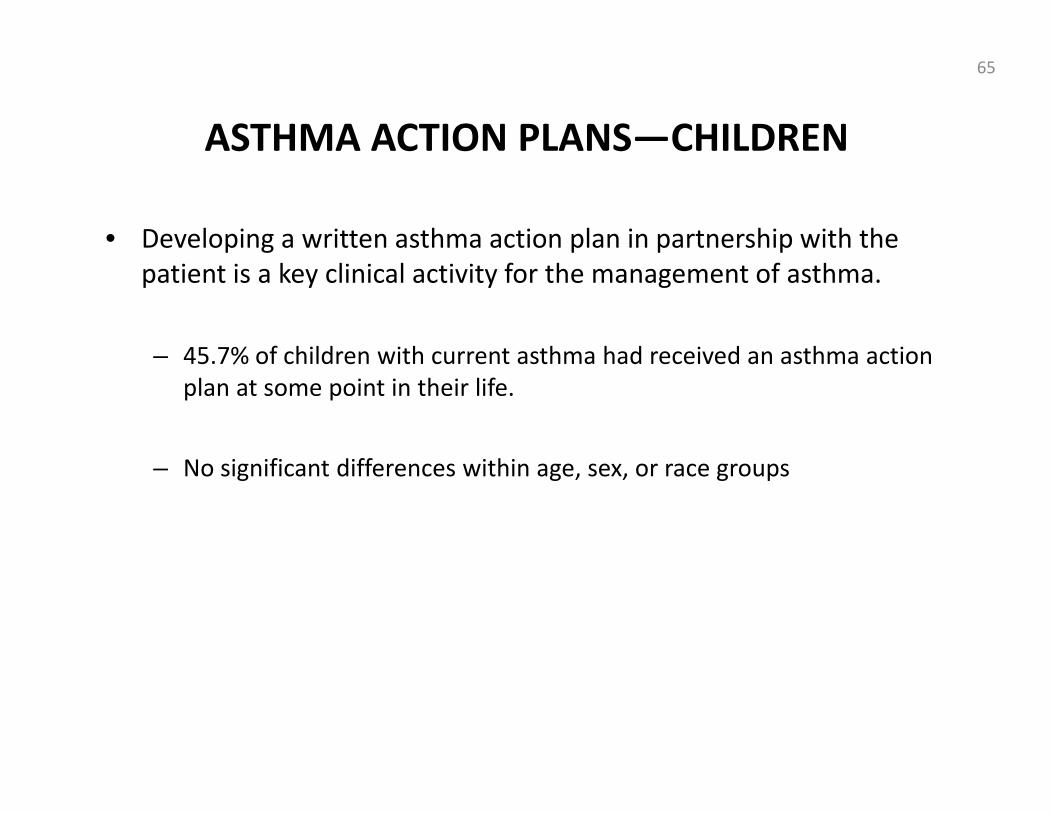
• Developing a written asthma action plan in partnership with the patient is a key clinical activity for the management of asthma.
– 45.7% of children with current asthma had received an asthma action plan at some point in their life.
– No significant differences within age, sex, or race groups
ASTHMA ACTION PLANS—CHILDREN
65
ASTHMA ACTION PLANS—CHILDREN
Data Notes:Source: Asthma Callback Survey, MDCH1. Based on proxy responses from adult respondent in the household.2. Current asthma is defined as a positive response to both lifetime and current asthma questions.3. Responded “yes” to the question, “An asthma action plan, or asthma management plan, is a form with instructions
about when to change the amount or type of medicine, when to call the doctor for advice, and when to go to the emergency room. Has a doctor or other health professional ever given you or {child’s name} an asthma action plan?”
41.945.9 45.3 44.1
47.5
0
10
20
30
40
50
60
70
< $50,000 ≥ $50,000 ≤ HS Graduate Some College College Grad
Percen
t
Percent of Children1 (<18 years) with Current Asthma2 who Ever Received an Asthma Action Plan3 by Socioeconomic Characteristics,
Michigan, 2008‐2010
66
Household Income Respondent Education
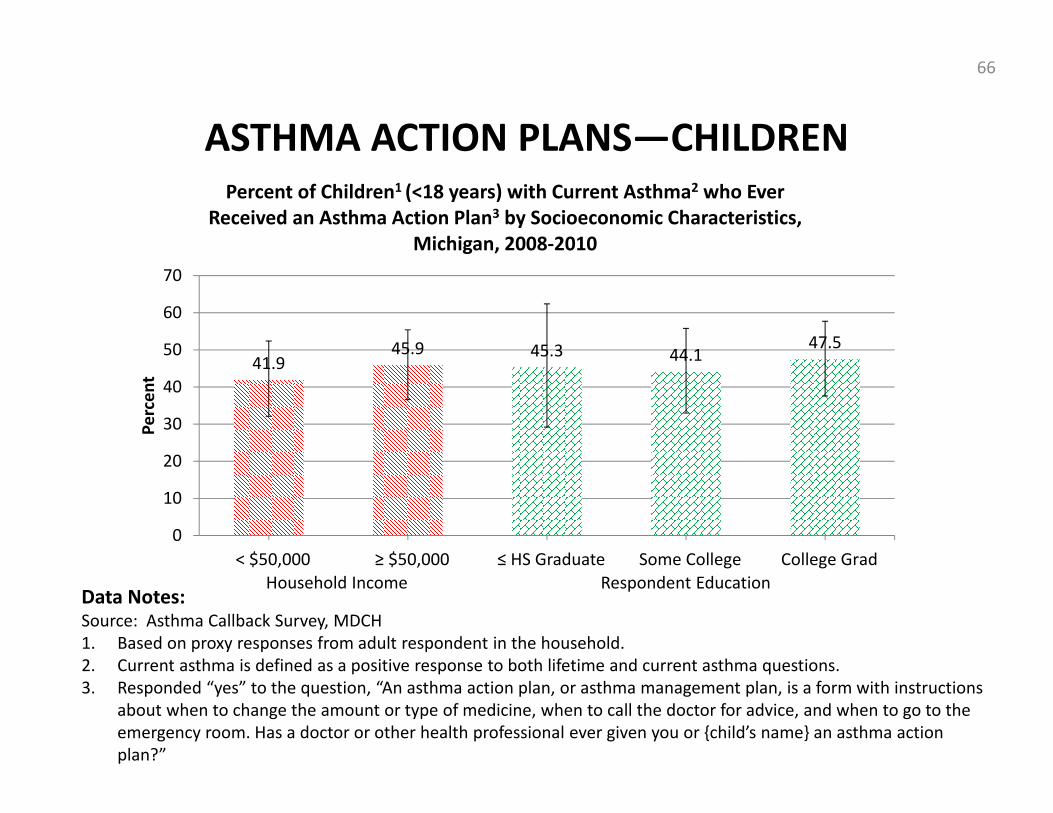
• Developing a written asthma action plan in partnership with the patient is a key clinical activity for the management of asthma.
– No significant differences in the prevalence of having received an asthma action plan for children with current asthma within household income or respondent education groups
ASTHMA ACTION PLANS—CHILDREN
67

23.719.7
28.7
13.6
18.6
26.723.5
25.5
0
5
10
15
20
25
30
35
40
Total 18‐34 35‐64 ≥ 65 Male Female White Black
Percen
t
Percent of Adults (≥18 years) with Current Asthma1 who Ever Received and Asthma Action Plan2 by Demographic Characteristics, Michigan,
2008‐2010
ASTHMA ACTION PLANS—ADULTS
Data Notes:Source: Asthma Callback Survey, MDCH1. Current asthma is defined as a positive response to both lifetime and current asthma questions.2. Responded “yes” to the question, “An asthma action plan, or asthma management plan, is a form with instructions
about when to change the amount or type of medicine, when to call the doctor for advice, and when to go to the emergency room. Has a doctor or other health professional ever given you an asthma action plan?”
* χ2 Test for independence within groups, p‐value <0.05.
* *
68
Years
• Developing a written asthma action plan in partnership with the patient is a key clinical activity for the management of asthma.
– 23.7% of adults with current asthma had received an asthma action plan at some point in their life.
– The prevalence was significantly higher (111.0%) among adults 35‐64 than adults ≥65.
– The prevalence was significantly higher (43.5%) among females than males
– No significant differences within race groups
ASTHMA ACTION PLANS—ADULTS
69

ASTHMA ACTION PLANS—ADULTS
Data Notes:Source: Asthma Callback Survey, MDCH1. Current asthma is defined as a positive response to both lifetime and current asthma questions.2. Responded “yes” to the question, “An asthma action plan, or asthma management plan, is a form with instructions
about when to change the amount or type of medicine, when to call the doctor for advice, and when to go to the emergency room. Has a doctor or other health professional ever given you an asthma action plan?”
19.324.4 24.5
29.926.8
22.718.5
25.0 26.5
051015202530354045
Percen
t
Percent of Adults (≥18 years) with Current Asthma1 who Ever Received and Asthma Action Plan2 by Socioeconomic Characteristics, Michigan,
2008‐2010
70
Household Income Respondent Education

• Developing a written asthma action plan in partnership with the patient is a key clinical activity for the management of asthma.
– No significant differences in the prevalence of having received an asthma action plan for adults with current asthma within household income or respondent education groups
ASTHMA ACTION PLANS—ADULTS
71
ASTHMA MANAGEMENT CLASS—CHILDREN
Data Notes:Source: Asthma Callback Survey, MDCH1. Based on proxy responses from adult respondent in the household.2. Current asthma is defined as a positive response to both lifetime and current asthma questions.3. Responded “yes” to the question, “Have you or {child’s name} ever taken a course or class on how to manage
{his/her} asthma?”
12.710.7
14.6 13.0 11.7 10.7
19.3
0
5
10
15
20
25
30
35
40
Total 0‐9 years 10‐17 years Male Female White Black
Percen
t
Percent of Children1 (<18 years) with Current Asthma2 who Ever Taken an Asthma Management Class3 by Demographic Characteristics,
Michigan, 2008‐2010
72

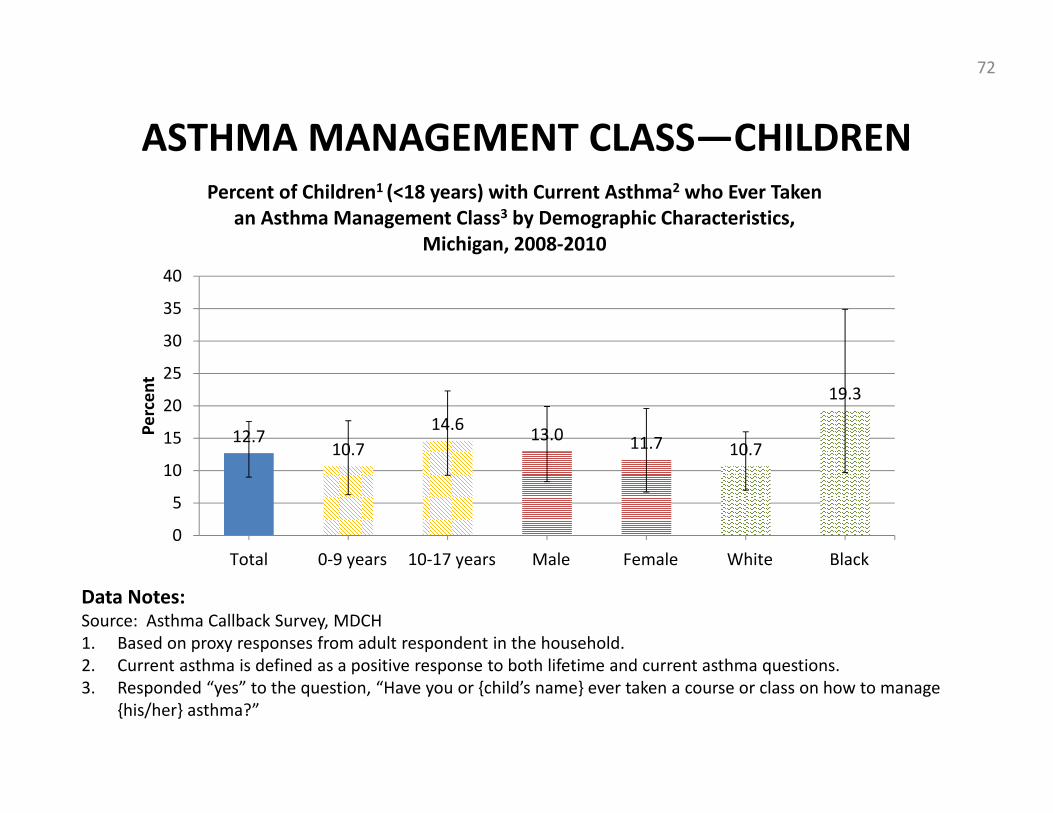
• Providing self‐management education is a key clinical activity for the management of asthma.
– 12.7% of children with current asthma or an adult in their household have taken an asthma management class at some point in their life.
– No significant differences within age, sex, or race groups
ASTHMA MANAGEMENT CLASS—CHILDREN
73

ASTHMA MANAGEMENT CLASS—CHILDREN
Data Notes:Source: Asthma Callback Survey, MDCH1. Based on proxy responses from adult respondent in the household.2. Current asthma is defined as a positive response to both lifetime and current asthma questions.3. Responded “yes” to the question, “Have you or {child’s name} ever taken a course or class on how to manage
{his/her} asthma?”
41.945.9 45.3 44.1
47.5
0
10
20
30
40
50
60
70
< $50,000 ≥ $50,000 ≤ HS Graduate Some College College Grad
Percen
t
Percent of Children1 (<18 years) with Current Asthma2 who Ever Taken an Asthma Management Class3 by Socioeconomic Characteristics,
Michigan, 2008‐2010
74
Household Income Respondent Education

• Providing self‐management education is a key clinical activity for the management of asthma.
– No significant differences in the prevalence of having taken an asthma management class for children with current asthma within respondent household income or education groups
ASTHMA MANAGEMENT CLASS—CHILDREN
75

ASTHMA MANAGEMENT CLASS—ADULTS
Data Notes:Source: Asthma Callback Survey, MDCH1. Current asthma is defined as a positive response to both lifetime and current asthma questions.2. Responded “yes” to the question, “Have you ever taken a course or class on how to manage your asthma?”
6.7
4.9
7.6 7.2 6.8 6.6 6.7 6.6
0
2
4
6
8
10
12
14
Total 18‐34 35‐64 ≥ 65 Male Female White Black
Percen
t
Percent of Adults (≥18 years) with Current Asthma1 who Ever Taken an Asthma Management Class2 by Demographic Characteristics,
Michigan, 2008‐2010
76
Years

• Providing self‐management education is a key clinical activity for the management of asthma.
– No significant differences in the prevalence of having taken an asthma management class for adults with current asthma within age, sex, and race groups
ASTHMA MANAGEMENT CLASS—ADULTS
77

ASTHMA MANAGEMENT CLASS—ADULTS
Data Notes:Source: Asthma Callback Survey, MDCH1. Current asthma is defined as a positive response to both lifetime and current asthma questions.2. Responded “yes” to the question, “Have you ever taken a course or class on how to manage your asthma?”
8.85.6 4.7
7.1 6.6
13.7
4.8 4.88.2
05101520253035
Percen
t
Percent of Adults (≥18 years) with Current Asthma1 who Ever Taken an Asthma Management Class2 by Socioeconomic Characteristics,
Michigan, 2008‐2010
78
Household Income Respondent Education

• Providing self‐management education is a key clinical activity for the management of asthma.
– No significant differences in the prevalence of having taken an asthma management class for adults with current asthma within household income or respondent education groups
ASTHMA MANAGEMENT CLASS—ADULTS
79
ADVISED TO MODIFY ENVIRONMENT TO IMPROVE ASTHMA—CHILDREN
Data Notes:Source: Asthma Callback Survey, MDCH1. Based on proxy responses from adult respondent in the household.2. Current asthma is defined as a positive response to both lifetime and current asthma questions.3. Responded “yes” to the question, “Has a health professional ever advised you to change things in {child’s name}
home, school, or work to improve {his/her} asthma?”
44.638.1
50.744.7 44.1 43.4
37.1
0
10
20
30
40
50
60
70
Total 0‐9 years 10‐17 years Male Female White Black
Percen
t
Percent of Children1 (<18 years) with Current Asthma2 who Ever Advised to Modify their Environment to Improve their Asthma3 by
Demographic Characteristics, Michigan, 2008‐2010
80

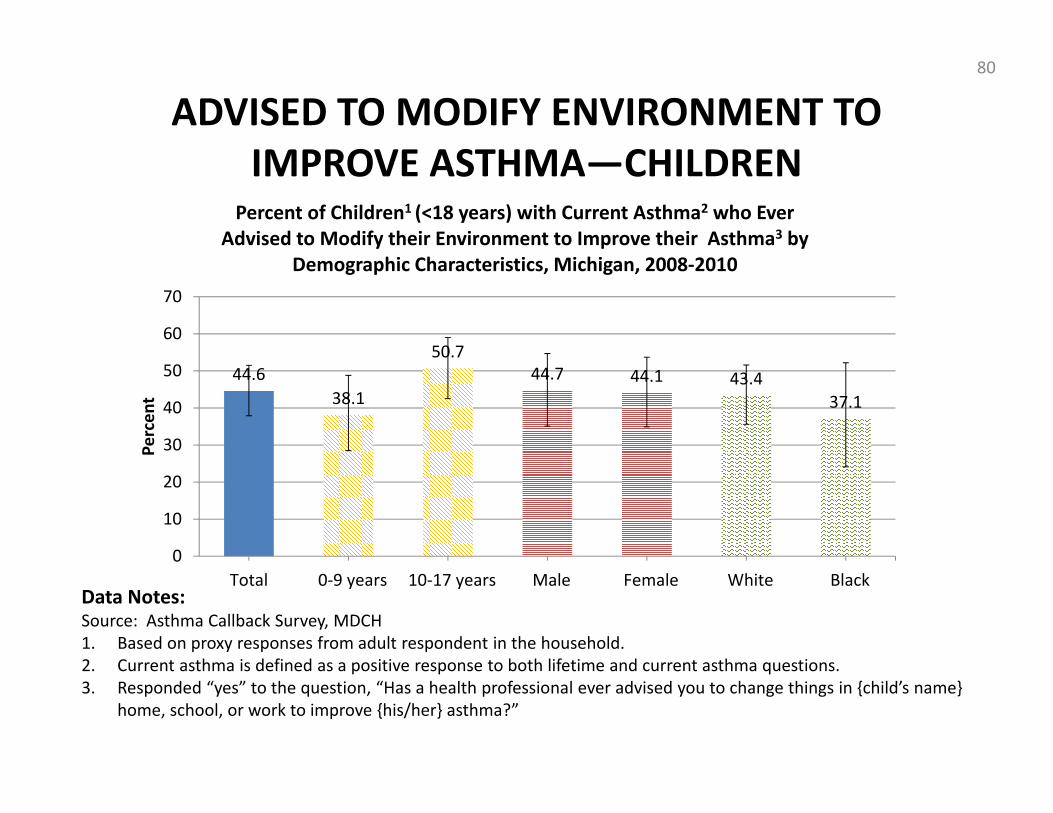
• Recommending measures to control exposure to asthma triggers is a key clinical activity for the management of asthma.
– 44.6% of respondents for children with current asthma or an adult in their household have been advised by a health professional to modify the child’s environment to improve their asthma at some point in their life.
– No significant differences within age, sex, or race groups
ADVISED TO MODIFY ENVIRONMENT TO IMPROVE ASTHMA—CHILDREN
81

ADVISED TO MODIFY ENVIRONMENT TO IMPROVE ASTHMA—CHILDREN
Data Notes:Source: Asthma Callback Survey, MDCH1. Based on proxy responses from adult respondent in the household.2. Current asthma is defined as a positive response to both lifetime and current asthma questions.3. Responded “yes” to the question, “Has a health professional ever advised you to change things in {child’s name}
home, school, or work to improve {his/her} asthma?” * χ2 Test for independence within groups, p‐value <0.05.
46.4 46.4
23.2
55.248.6
0
10
20
30
40
50
60
70
< $50,000 ≥ $50,000 ≤ HS Graduate Some College College Grad
Percen
t
Percent of Children1 (<18 years) with Current Asthma2 who Ever Advised to Modify their Environment to Improve their Asthma3 by
Socioeconomic Characteristics, Michigan, 2008‐2010*
82
Household Income Respondent Education
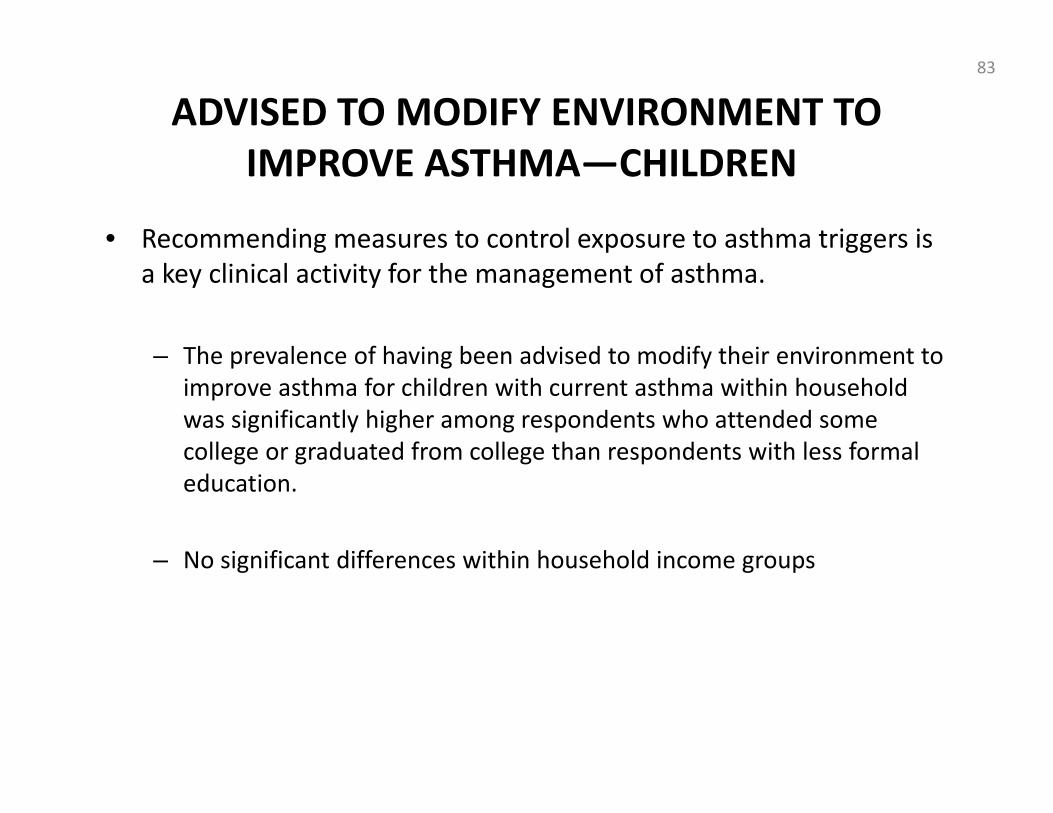
• Recommending measures to control exposure to asthma triggers is a key clinical activity for the management of asthma.
– The prevalence of having been advised to modify their environment to improve asthma for children with current asthma within household was significantly higher among respondents who attended some college or graduated from college than respondents with less formal education.
– No significant differences within household income groups
ADVISED TO MODIFY ENVIRONMENT TO IMPROVE ASTHMA—CHILDREN
83

ADVISED TO MODIFY ENVIRONMENT TO IMPROVE ASTHMA—ADULTS
Data Notes:Source: Asthma Callback Survey, MDCH1. Current asthma is defined as a positive response to both lifetime and current asthma questions.2. Responded “yes” to the question, “Has a health professional ever advised you to change things in your home,
school, or work to improve your asthma?”
45.0 46.248.9
28.0
40.2
47.7 46.241.1
0
10
20
30
40
50
60
Total 18‐34 35‐64 ≥ 65 Male Female White Black
Percen
t
Percent of Adults (≥18 years) with Current Asthma1 who Ever Advised to Modify their Environment to Improve Their Asthma2 by
Demographic Characteristics, Michigan, 2008‐2010
84
Years

• Recommending measures to control exposure to asthma triggers is a key clinical activity for the management of asthma.
– 45.0% of adults with current asthma have been advised by a health professional to modify their environment to improve their asthma at some point in their life.
– The prevalence was significantly higher among adults 18‐34 or 35‐64 than adults ≥65.
– No significant differences within race or sex groups
ADVISED TO MODIFY ENVIRONMENT TO IMPROVE ASTHMA—ADULTS
85

ADVISED TO MODIFY ENVIRONMENT TO IMPROVE ASTHMA—ADULTS
Data Notes:Source: Asthma Callback Survey, MDCH1. Current asthma is defined as a positive response to both lifetime and current asthma questions.2. Responded “yes” to the question, “Has a health professional ever advised you to change things in your home,
school, or work to improve your asthma?”
39.8 38.146.9 42.3
50.441.6 41.5
47.7 45.7
010203040506070
Percen
t
Percent of Adults (≥18 years) with Current Asthma1 who Ever Advised to Modify their Environment to Improve Their Asthma2 by
Socioeconomic Characteristics, Michigan, 2008‐2010
86
Household Income Respondent Education

• Recommending measures to control exposure to asthma triggers is a key clinical activity for the management of asthma.
– No significant differences in the prevalence of having been advised to modify their environment to improve asthma for adults with current asthma within household income or education groups
ADVISED TO MODIFY ENVIRONMENT TO IMPROVE ASTHMA—ADULTS
87

ROUTINE ASTHMA CARE VISITS—CHILDREN
Data Notes:Source: Asthma Callback Survey, MDCH1. Based on proxy responses from adult respondent in the household.2. Current asthma is defined as a positive response to both lifetime and current asthma questions.3. Reported ≥2 times to the following question, “During the past 12 months, how many times did {child’s name} see a
doctor or other health professional for a routine checkup for {his/her} asthma?”
45.451.7
37.8
50.9
38.243.1
58.6
0
10
20
30
40
50
60
70
80
Total 0‐9 years 10‐17 years Male Female White Black
Percen
t
Percent of Children1 (<18 years) with Current Asthma2 who had ≥2 Routine Asthma Care Visits for Asthma During Past 12 Months3 by
Demographic Characteristics, Michigan, 2008‐2010
88

• According to national treatment guidelines, persons with asthma should visit their primary care provider for routine asthma care at least twice a year.
– 45.4% of children with current asthma had 2 or more routine asthma care visits during the past 12 months.
– No significant differences within age, sex, or race groups
ROUTINE ASTHMA CARE VISITS—CHILDREN
89

ROUTINE ASTHMA CARE VISITS—CHILDREN
Data Notes:Source: Asthma Callback Survey, MDCH1. Based on proxy responses from adult respondent in the household.2. Current asthma is defined as a positive response to both lifetime and current asthma questions.3. Reported ≥2 times to the following question, “During the past 12 months, how many times did {child’s name} see a
doctor or other health professional for a routine checkup for {his/her} asthma?”
41.345.7
41.2
49.544.5
0
10
20
30
40
50
60
70
< $50,000 ≥ $50,000 ≤ HS Graduate Some College College Grad
Percen
t
Percent of Children1 (<18 years) with Current Asthma2 who had ≥2 ED/Urgent Care Visits for Asthma During Past 12 Months3 by
Socioeconomic Characteristics, Michigan, 2008‐2010
90
Household Income Respondent Education

• According to national treatment guidelines, persons with asthma should visit their primary care provider for routine asthma care at least twice a year.
– No significant differences in the prevalence of having 2 or more routine asthma care visits during the past 12 months for children with current asthma within household income or respondent education groups
ROUTINE ASTHMA CARE VISITS—CHILDREN
91

28.8
16.2
32.3
43.8
22.6
32.427.7
33.5
0
10
20
30
40
50
60
Total 18‐34 35‐64 ≥ 65 Male Female White Black
Percen
t
Percent of Adults (≥18 years) with Current Asthma1 who had ≥2 Routine Asthma Care Visits for Asthma During Past 12 Months2 by
Demographic Characteristics, Michigan, 2008‐2010
ROUTINE ASTHMA CARE VISITS—ADULTS
Data Notes:Source: Asthma Callback Survey, MDCH1. Current asthma is defined as a positive response to both lifetime and current asthma questions.2. Reported ≥2 times to the following question, “During the past 12 months, how many times did you see a doctor or
other health professional for a routine checkup for your asthma?” * χ2 Test for independence within groups, p‐value <0.05.
* *
92
Years
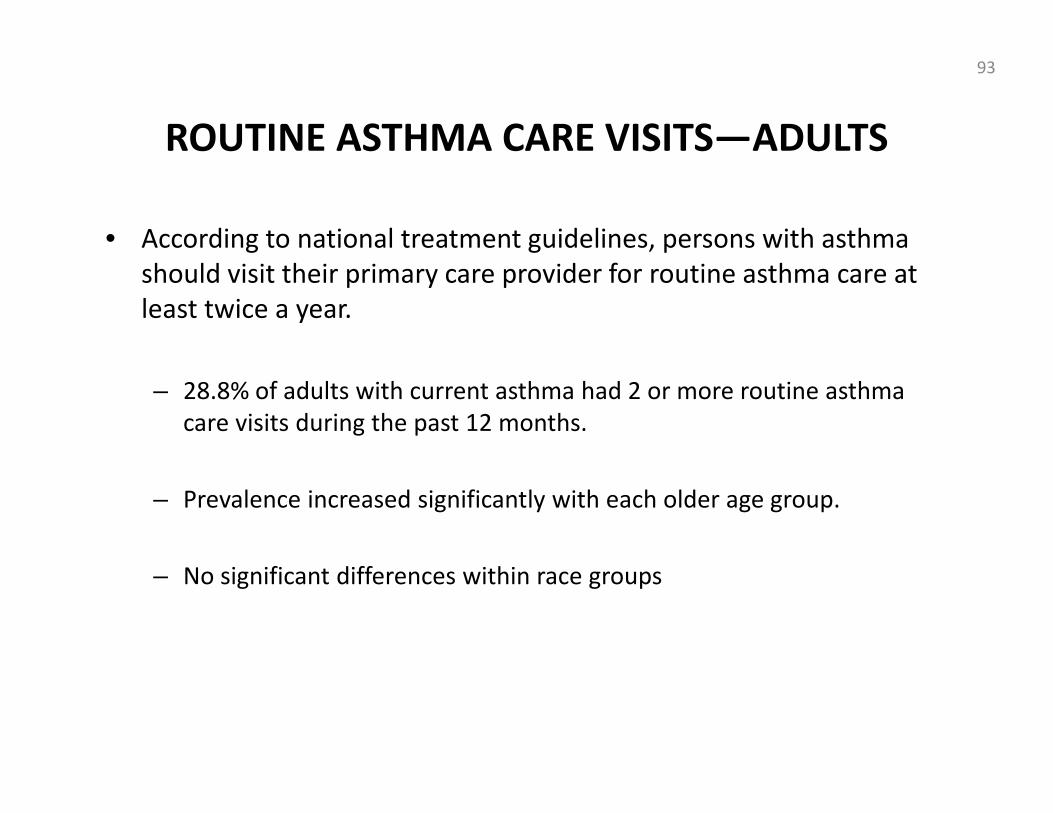
• According to national treatment guidelines, persons with asthma should visit their primary care provider for routine asthma care at least twice a year.
– 28.8% of adults with current asthma had 2 or more routine asthma care visits during the past 12 months.
– Prevalence increased significantly with each older age group.
– No significant differences within race groups
ROUTINE ASTHMA CARE VISITS—ADULTS
93

ROUTINE ASTHMA CARE VISITS—ADULTS
Data Notes:Source: Asthma Callback Survey, MDCH1. Current asthma is defined as a positive response to both lifetime and current asthma questions.2. Reported ≥2 times to the following question, “During the past 12 months, how many times did you see a doctor or
other health professional for a routine checkup for your asthma?”
32.326.8 27.2 29.2 27.5
33.1 33.327.2 26.2
0
10
20
30
40
50
60
Percen
t
Percent of Adults (≥18 years) with Current Asthma1 who had ≥2 Routine Asthma Care Visits for Asthma During Past 12 Months2 by
Socioeconomic Characteristics, Michigan, 2008‐2010
94
Household Income Respondent Education

• According to national treatment guidelines, persons with asthma should visit their primary care provider for routine asthma care at least twice a year.
– No significant differences in the prevalence of having 2 or more routine asthma care visits during the past 12 months for adults with current asthma within household income or education groups
ROUTINE ASTHMA CARE VISITS—ADULTS
95
LONG TERM CONTROL MEDICATION USE—CHILDREN
Data Notes:Source: Asthma Callback Survey, MDCH1. Based on proxy responses from adult respondent in the household.2. Current asthma is defined as a positive response to both lifetime and current asthma questions.3. Reported using a long term control medication in the past 3 months. Long term control medications were identified using the list of
acceptable primary therapies for long term control of asthma by the NCQA HEDIS Technical Specifications for 2007. These includedInhaled Corticosteroids, Mast Cell Stabilizers, Leukotriene Modifiers, Methylxanthines, and certain combination therapies.
49.1 51.846.7
50.946.6
51.1
43.1
0
10
20
30
40
50
60
70
Total 0‐9 years 10‐17 years Male Female White Black
Percen
t
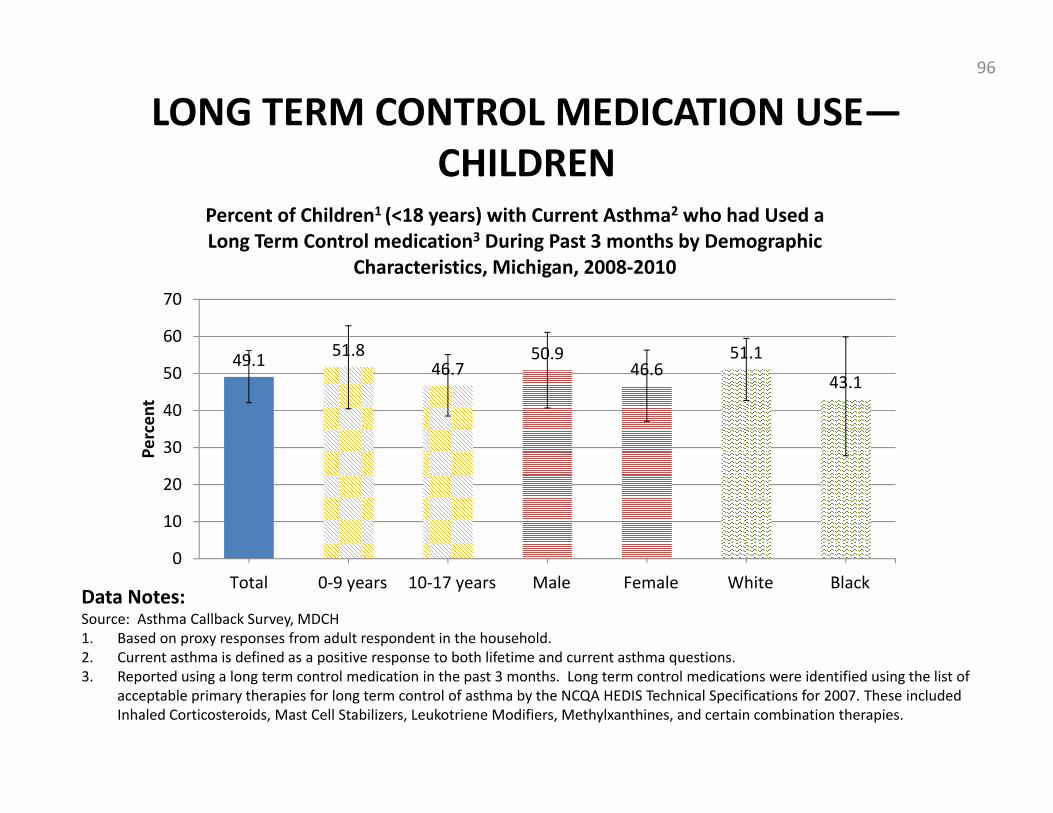
Percent of Children1 (<18 years) with Current Asthma2 who had Used a Long Term Control medication3 During Past 3 months by Demographic
Characteristics, Michigan, 2008‐2010
96

• Long term control medication is recommended for children with persistent asthma.
– 49.1% of children with current asthma had used a long term control medication during the past 3 months.
– No significant differences in the prevalence of using a long term control medication for children with current asthma within age, race, or sex groups
LONG TERM CONTROL MEDICATION USE—CHILDREN
97

LONG TERM CONTROL MEDICATION USE—CHILDREN
45.5
55.8
28.7
57.5 54.7
0.0
10.0
20.0
30.0
40.0
50.0
60.0
70.0
80.0
< $50,000 ≥ $50,000 ≤ HS Graduate Some College College Grad
Percen
t
Percent of Children1 (<18 years) with Current Asthma2 who had Used a Long term Control Medication3 During Past 3 Months by Socioeconomic Characteristics, Michigan, 2008‐2010
Data Notes:Source: Asthma Callback Survey, MDCH1. Based on proxy responses from adult respondent in the household.2. Current asthma is defined as a positive response to both lifetime and current asthma questions.3. Reported using a long term control medication in the past 3 months. Long term control medications were identified using the list of
acceptable primary therapies for long term control of asthma by the NCQA HEDIS Technical Specifications for 2007. These includedInhaled Corticosteroids, Mast Cell Stabilizers, Leukotriene Modifiers, Methylxanthines, and certain combination therapies.
* χ2 Test for independence within groups, p‐value <0.05.
*
98
Household Income Respondent Education

• Long term control medication is recommended for children with persistent asthma.
– The prevalence of using a long term control medication was significantly higher among respondents who attended some college or graduated from college than respondents who did not attend at least some college.
– No significant differences in the prevalence of using a long term control medication for children with current asthma within respondent income groups
LONG TERM CONTROL MEDICATION USE—CHILDREN
99
68.161.0
70.176.0
62.371.4 67.4 70.5
0102030405060708090
Total 18‐34 35‐64 ≥ 65 Male Female White Black
Percen
t
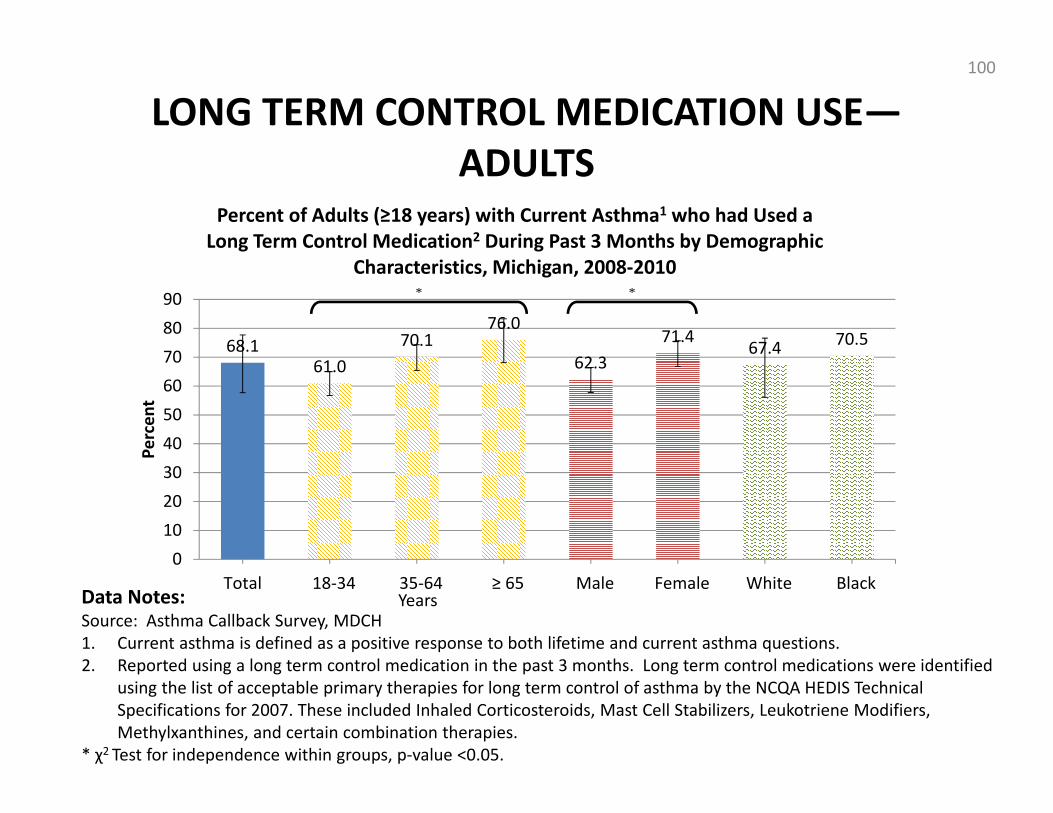
Percent of Adults (≥18 years) with Current Asthma1 who had Used a Long Term Control Medication2 During Past 3 Months by Demographic
Characteristics, Michigan, 2008‐2010
LONG TERM CONTROL MEDICATION USE—ADULTS
Data Notes:Source: Asthma Callback Survey, MDCH1. Current asthma is defined as a positive response to both lifetime and current asthma questions.2. Reported using a long term control medication in the past 3 months. Long term control medications were identified
using the list of acceptable primary therapies for long term control of asthma by the NCQA HEDIS Technical Specifications for 2007. These included Inhaled Corticosteroids, Mast Cell Stabilizers, Leukotriene Modifiers, Methylxanthines, and certain combination therapies.
* χ2 Test for independence within groups, p‐value <0.05.
* *
100
Years

• Long term control medication is recommended for adults with persistent asthma.
– 68.1% of adults with current asthma had used a long term control medication during the past 3 months.
– The prevalence was significantly higher (24.6%) among adults ≥65 than adults 18‐34.
– The prevalence was significantly higher (14.6%) among females than males.
– No significant differences within race groups
LONG TERM CONTROL MEDICATION USE—ADULTS
101

LONG TERM CONTROL MEDICATION USE—ADULTS
Data Notes:Source: Asthma Callback Survey, MDCH1. Current asthma is defined as a positive response to both lifetime and current asthma questions.2. Reported using a long term control medication in the past 3 months. Long term control medications were identified
using the list of acceptable primary therapies for long term control of asthma by the NCQA HEDIS Technical Specifications for 2007. These included Inhaled Corticosteroids, Mast Cell Stabilizers, Leukotriene Modifiers, Methylxanthines, and certain combination therapies.
65.8 64.871.4 68.9 64.6 67.9 67.6 68.3 68.4
0102030405060708090
Percen
t
Percent of Adults (≥18 years) with Current Asthma1 who had Used a Long Term Control Medication2 During Past 3 Months by Socioeconomic Characteristics, Michigan, 2008‐2010
102
Household Income Respondent Education

• Long term control medication is recommended for adults with persistent asthma.
– No significant differences in the prevalence of using a long term control medication for adults with current asthma within household income or respondent education groups
LONG TERM CONTROL MEDICATION USE—ADULTS
103

INFLUENZA VACCINE—CHILDREN
Data Notes:Sources: Asthma Callback Survey and MiBRFSS, MDCH1. Based on proxy responses from adult respondent in the household.2. Current asthma is defined as a positive response to both lifetime and current asthma questions.3. Responded “yes” to either of the following questions, “A flu shot is an influenza vaccine injected in your arm. During
the past 12 months, did {child’s name} have a flu shot?” or “A flu vaccine that is sprayed in the nose is called FluMist. During the past 12 months, did {child’s name} have a flu vaccine that was sprayed in {his/her} nose?”
51.656.8
46.553.2
49.2 49.3 51.5
0
10
20
30
40
50
60
70
80
Total 0‐9 years 10‐17 years Male Female White Black
Percen
t
Percent of Children1 (<18 years) with Current Asthma2 who had an Influenza Vaccine During Past 12 Months3 by Demographic
Characteristics, Michigan, 2008‐2010
104

INFLUENZA VACCINE—CHILDREN
• According to national treatment guidelines, persons with asthma should receive an annual influenza vaccine, regardless of severity.
– 51.6% of children with current asthma had an influenza vaccine during the past 12 months.
– No significant difference in the prevalence of having received an influenza vaccination during the past 12 months for children with current asthma within age, sex, or race groups
105

INFLUENZA VACCINE—CHILDREN
Data Notes:Sources: Asthma Callback Survey and MiBRFSS, MDCH1. Based on proxy responses from adult respondent in the household.2. Current asthma is defined as a positive response to both lifetime and current asthma questions.3. Responded “yes” to either of the following questions, “A flu shot is an influenza vaccine injected in your arm. During
the past 12 months, did {child’s name} have a flu shot?” or “A flu vaccine that is sprayed in the nose is called FluMist. During the past 12 months, did {child’s name} have a flu vaccine that was sprayed in {his/her} nose?”
* χ2 Test for independence within groups, p‐value <0.05.
47.7
56.7
47.742.6
62.5
0
10
20
30
40
50
60
70
80
< $50,000 ≥ $50,000 ≤ HS Graduate Some College College Grad
Percen
t
Percent of Children1 (<18 years) with Current Asthma2 who had an Influenza Vaccine During Past 12 Months3 by Socioeconomic
Characteristics, Michigan, 2008‐2010*
106
Household Income Respondent Education

INFLUENZA VACCINE—CHILDREN
– The prevalence of having received an influenza vaccination during the past 12 months for children with current asthma was significantly greater (46.7%) among respondents who Graduated from College than respondents who attended Some College.
– No significant differences within household income
107

Data Notes:Sources: Asthma Callback Survey and MiBRFSS, MDCH1. Current asthma is defined as a positive response to both lifetime and current asthma questions.2. Responded “yes” to either of the following questions on the MiBRFSS, “A flu shot is an influenza vaccine injected in
your arm. During the past 12 months, did you have a flu shot?” or “A flu vaccine that is sprayed in the nose is called FluMist. During the past 12 months, did you have a flu vaccine that was sprayed in your nose?”
* χ2 Test for independence within groups, p‐value <0.05.
INFLUENZA VACCINE—ADULTS
48.5
34.4
48.2
79.6
49.1 48.1 50.4
39.4
0102030405060708090
Total 18‐34 35‐64 ≥ 65 Male Female White Black
Percen
t
Percent of Adults (≥18 years) with Current Asthma1 who had a Influenza Vaccine During Past 12 Months2 by Demographic
Characteristics, Michigan, 2008‐2010*
108
Years

INFLUENZA VACCINE—ADULTS
• According to national treatment guidelines, persons with asthma should receive an annual influenza vaccine, regardless of severity.
– 48.5% of adults with current asthma had received an influenza vaccination during the past 12 months.
– The prevalence was significantly different within age groups:• 1.7 times higher for adults ≥65 than adults 35‐64 • 2.3 times higher for adults ≥65 than adults 18‐34• 1.4 times higher for adults 35‐64 than adults 18‐34
– No significant difference within sex groups
109

INFLUENZA VACCINE—ADULTS
39.649.3 47.2 44.7
61.653.8
42.7 44.955
01020304050607080
Percen
t
Percent of Adults (≥18 years) with Current Asthma1 who had a Influenza Vaccine During Past 12 Months2 by Socioeconomic
Characteristics, Michigan, 2008‐2010
Data Notes:Sources: Asthma Callback Survey and MiBRFSS, MDCH1. Current asthma is defined as a positive response to both lifetime and current asthma questions.2. Responded “yes” to either of the following questions on the MiBRFSS, “A flu shot is an influenza vaccine injected in
your arm. During the past 12 months, did you have a flu shot?” or “A flu vaccine that is sprayed in the nose is called FluMist. During the past 12 months, did you have a flu vaccine that was sprayed in your nose?”
* χ2 Test for independence within groups, p‐value <0.05.
*
110
Household Income Respondent Education

INFLUENZA VACCINE—ADULTS
• According to national treatment guidelines, persons with asthma should receive an annual influenza vaccine, regardless of severity.
– The prevalence of having received an influenza vaccination during the past 12 months for adults with asthma was significantly higher (55.6%) among those with a household income ≥$75,000 per year per year than those with a household income of <$20,000
111
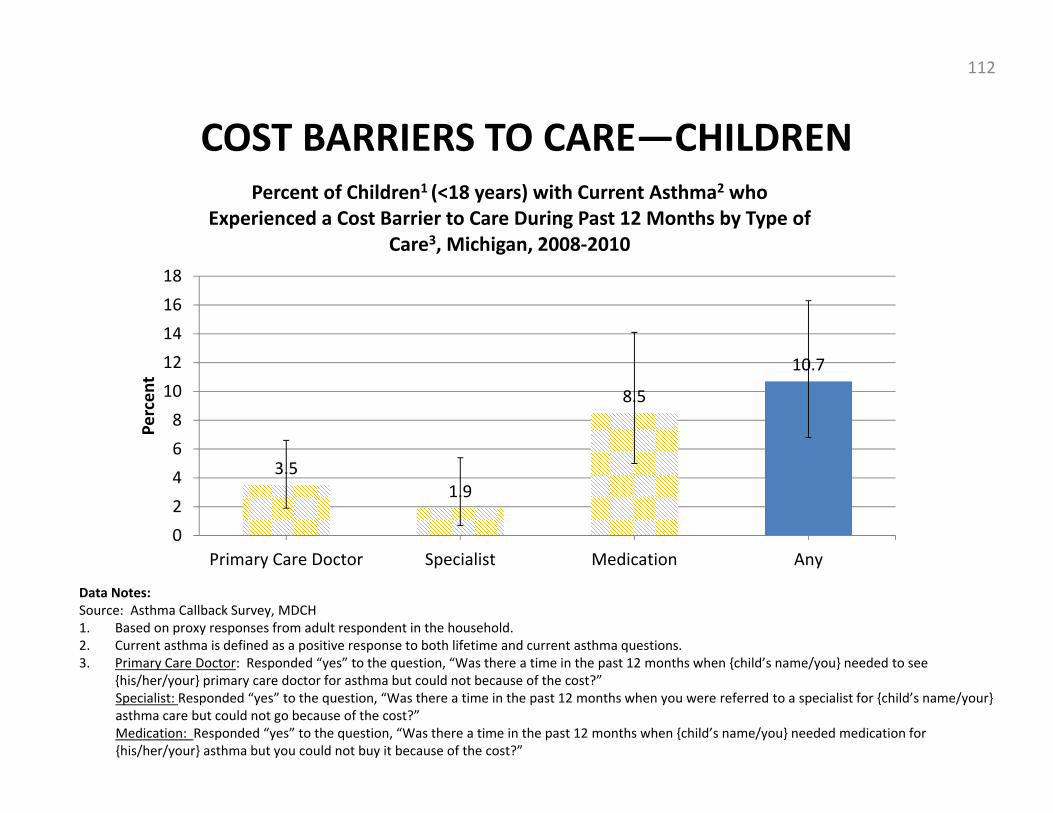
COST BARRIERS TO CARE—CHILDREN
Data Notes:Source: Asthma Callback Survey, MDCH1. Based on proxy responses from adult respondent in the household.2. Current asthma is defined as a positive response to both lifetime and current asthma questions.3. Primary Care Doctor: Responded “yes” to the question, “Was there a time in the past 12 months when {child’s name/you} needed to see
{his/her/your} primary care doctor for asthma but could not because of the cost?” Specialist: Responded “yes” to the question, “Was there a time in the past 12 months when you were referred to a specialist for {child’s name/your} asthma care but could not go because of the cost?” Medication: Responded “yes” to the question, “Was there a time in the past 12 months when {child’s name/you} needed medication for {his/her/your} asthma but you could not buy it because of the cost?”
3.51.9
8.5
10.7
024681012141618
Primary Care Doctor Specialist Medication Any
Percen
t
Percent of Children1 (<18 years) with Current Asthma2 who Experienced a Cost Barrier to Care During Past 12 Months by Type of
Care3, Michigan, 2008‐2010
112

– 10.7% of respondents for children with current asthma reported experiencing a cost barrier to their asthma care during the past 12 months.
– The most frequent type of cost barrier was related to medication; during the past 12 months, 8.5% respondents for children with current asthma reported needing asthma medication for the child but could not buy it because of cost.
COST BARRIERS TO CARE—CHILDREN
113

COST BARRIERS TO CARE—ADULTS
Data Notes:Source: Asthma Callback Survey, MDCH1. Current asthma is defined as a positive response to both lifetime and current asthma questions.2. Primary Care Doctor: Responded “yes” to the question, “Was there a time in the past 12 months when {child’s name/you} needed to see
{his/her/your} primary care doctor for asthma but could not because of the cost?” Specialist: Responded “yes” to the question, “Was there a time in the past 12 months when you were referred to a specialist for {child’s name/your} asthma care but could not go because of the cost?” Medication: Responded “yes” to the question, “Was there a time in the past 12 months when {child’s name/you} needed medication for {his/her/your} asthma but you could not buy it because of the cost?”
21.9
12.0
6.1
17.1
0
5
10
15
20
25
30
Primary Care Doctor Specialist Medication Any
Percen
t
Percent of Adults (≥18 years) with Current Asthma1 who Experienced a Cost Barrier to Care During Past 12 Months by Type of Care2,
Michigan, 2008‐2010
114

– 17.1% of adults with asthma experienced a cost barrier to their asthma care during the past 12 months. This is significantly higher than the prevalence of cost barriers among children with current asthma.
– The most frequent type of cost barrier for adults is that related to Primary Care; during the past 12 months, 21.9% of adults with current asthma could not access Primary Care because of cost
COST BARRIERS TO CARE—ADULTS
115
For More Information on ACBS, MiBRFSS, Asthma Surveillance
• If you would like a .ppt version of this report, please contact [email protected]
• Contact:– MiBRFSS
Chris FussmanChronic Disease Epidemiology Unit 517 335‐[email protected]
– AsthmaRobert WahlEnvironmental EpidemiologistDivision of Environmental Health, Bureau of Epidemiology517‐335‐[email protected]
www.michigan.gov/asthma www.getasthmahelp.com
116

For More Information on Asthma Management
• National Heart Lung & Blood Institute – 2007 NAEPP Expert Panel Report 3: Guidelines for the Diagnosis and Management of Asthma, Full and Summary Reports: www.nhlbi.nih.gov/guidelines/asthma/asthgdln.html
• Guideline Implementation Steps & Tools (GIST) – provider education and practice redesign program for primary care clinicians: www.GetAsthmaHelp.org/GIST
• ASTHMA IQ – a web‐based tool to help track and manage patients with asthma: www.asthmaiq.org/
• Environmental Management of Pediatric Asthma: Guidelines for Health Care Providers – to help integrate environmental management of asthma into pediatric health care. www.neefusa.org/health/asthma/asthmaguidelines.html
117