(astrand's test) as an estimate of maximal oxygen uptake in british
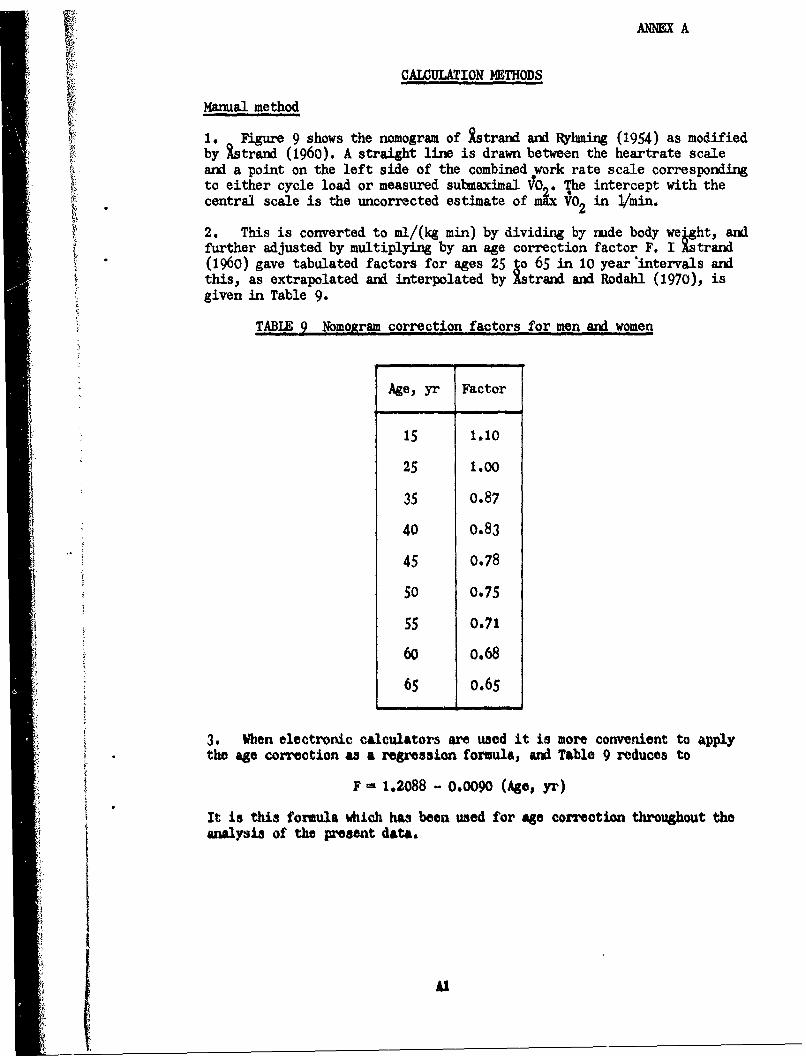
TRANSCRIPT
UNLIMITED
LEVELREPORT APRE No. 25/77
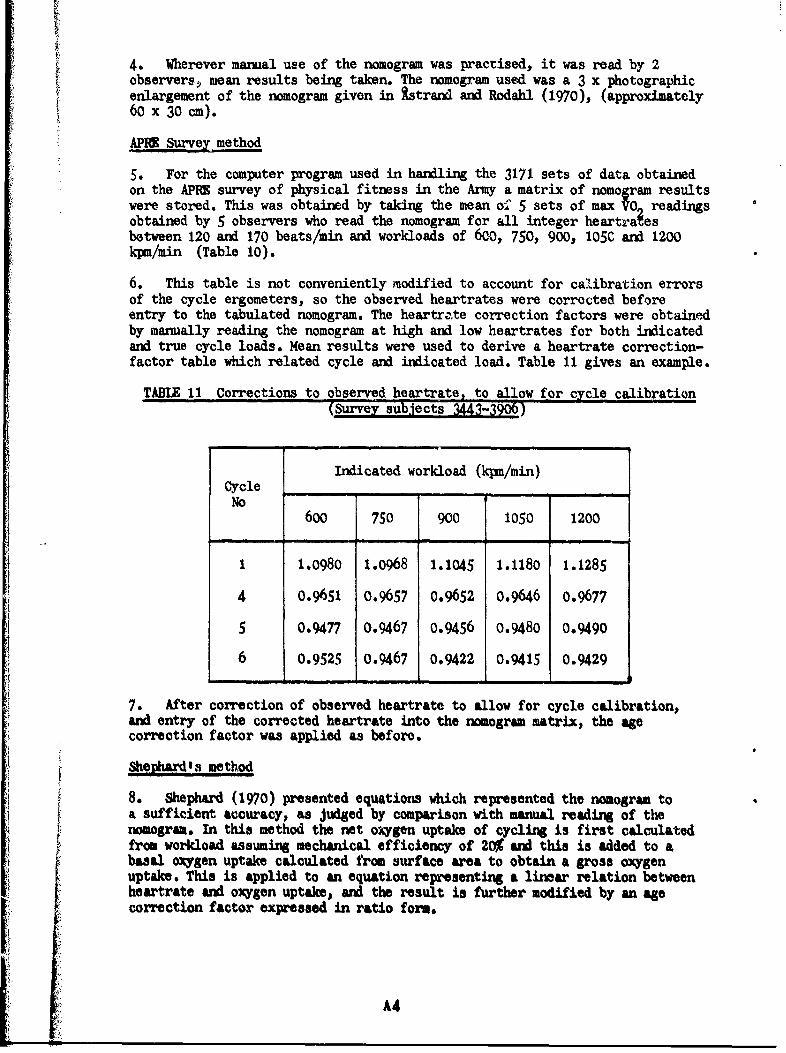
o HEARTRATE RESPONSE TO A
,•,•, ,ISOnc SINGLE SUBMAXIMAL WORKLOAD
"(ASTRAND'S TEST) AS AN ESTIMATE
OF MAXIMAL OXYGEN UPTAKE IN
BRITISH SERVICEMEN
by
A. F, Amor
Col D. E. Worsley
and J. A. Vogel D c
MAY 1978 M3
•, •• o 15UNLIMITED
UNLIMITED
ARMY PERSONNE RESEARCH ESTABLISHRME
REPORT No 25/77
HEARTRATE RESPONSE TO A4 SIW)LE§UBHMAXIMAL ORRKLOAD TRANDISTEST)L~-~ AS ANJýSTIMATE OF-ýiAXIMALQYEVPAf ..........
by
SA. FAmor, M lEjworsleyAm j. Akoge3.
I--r7
M.-- Appro"4 Lj4L
', CPROJECT No: R26APRE FL11 NO: 405/2/05 KS 15 fewNOD FIME No: SA•(A)/.4/41/3
"9103 CJVNLD10 05

UNLIMITED
ARMY PERSONNEL RESEARCH ESTABLISHMENT
REPORT No 25/77
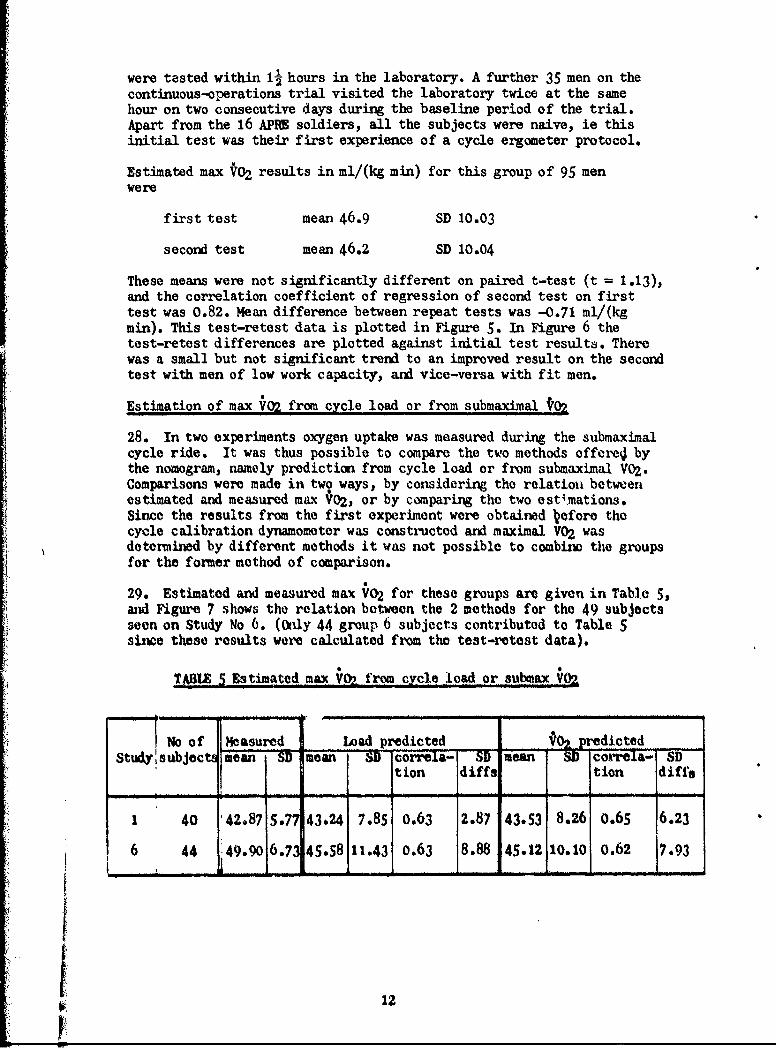
HEARTRATE RESPONSE TO A SISGLE SUBMAXIMAL WORKLOAD (RSTRAND'S TEST)AS AN ESTIMTE OF MAXMA.L OXYGEN UPTAKE
IN BRITISH SERVICEMEN
by
A F Amor, Col D E Worsleyand J A Vogel
EXECUTIVE SUMMARY
Maximal oxygen uptake is a physiological measure which has been foundto be particularly relevant to ability to perform strenuous work forintermediate periods of, say, an hour. This is characteristic of militaryactivity, and, besides being the main assessment of the Army physicalfitness test, has been a major topic in APRE's physical fitness researchprogrpnme.
Direct measurement of maximal oxygen uptake is a laboratory techniquerequiring specialised staff and equipment. For this reason predictivetests have been devised where the heartrate response to a workload ofapproximately half maximal is measured. One such test, devised by Rstrand,has been used in many laboratcries and also in much of APRE's work, includinga cross-sectional physical fitness survey of the Army, where over 3000men were seen.
Little data was available on the accuracy of the test as applied to Britishservicemen, so the opportunity was taken whenever it presented itself,to obtain direct comparison between the predictive test and actuallymeasured maximal oxygen uptake in this particular population. This reportdetails results of this research.
The tr~st, as compared with maximal exercise in uphill treadmill running,was f.iund to correlate well, with a standard error of estimate of 4.8 el/(kg re n), about 10% of the mean for the group. The test overestimatedfitneý.s of fit men and underestimated that of unfit men. The correctionequation was:
y - 34.93 + 0.340 x
where y was measured maximal oxygen uptake, and x was estimated maximaloxygtA uptake. Accuracy of the Ritrand test was judged sufficient for the
Spopul:tion studies, but it could not be recommended for use in individualcases where an absolute measure was required, nor for use on very fitgrourai such as competition skiers. Repeatability of the test was better
UNLIMITED

UNIJMI] TED
-than accuracy, and so the method could be used for comparative studies onthe sa-ne men.
Using the fitness survey data, d1urnal effects were shown to be of littletpractical importance, and 2 computer programs devised to avoid the originalmanual calculations were shown to introduce negligible error.
UNITIMTTED
UNLIKITED
ARMY PERSONNEL RKSKAR(i ESTABLISHMENT
REPORT No 25/77
HEARTRATE RESPONSE TO A SINGLE SUBMAMAL WORKLOAD (fSTRAND'S TEST)AS AN ESTIMATE OF MAXIMAL OXYGEN UPTAKE
IN BRITISH SUVICRIEN
by
A F Amor, Col D E Worsleyand J A Vogel
/
Accuracy of the 6 miin cycle ergometer predictive test, as practised atAPRE, was compared with actual maximal oxygen uptake by uphill treadmillrunning using 165 servicemen subjects. Standard error of estimate of the
regression bo;ween the 2 sets of results was 4.8 ml/(kg min), about ic%of the mean. Similar accuracy was found in comparing the submaximaltest with maximal ergometer cycling. Accuracy was not.mproved by usingsubmaximal rather than. workload data in reading LstrandIs Nomogram.
The subiaximal predictive test was however less accurate for a group ofcompetition skiers. Repeatability of the submaximal test was consideredadequate since it gave smaller standard deviation of differences thandid the comparison of submaximal and maximal tests. Diurnal effects wereshown to be of little practical importance. and 2 computer programswhich avoid manual use of the nimogram were shown to introduce negligibleerror.
The test, with the derived rege-ssion equation, is confirmed as beingof sufficient accuracy for use in population studies of British service-men, but is not recommended for examiation of individual work capacity,or for tests on very fit groups such as competition skiers.
IJNLDITED
CONTENTS
ParagraIph No Page No
EXECUTIVE StIORY
SU)(ARY
INTRODUCTION 1 1
MOD 6 2
The submaximal test 8 2The maximal test 12 3Calculatiop methods 14 4
RESULTS 19 5
Gernral 19 5Description of subjects 21 6Estimated max 102 and direct (cycle)
max o 22 6Estimatel max •G and dirct (treadmill)
max c0 2 - Sercemen 23 6FIGURE 1 7Estimated max 102 and measured
(treadmill) max 10ý - Athletes 25 8Duplicated tests - estimated max 102 26 8FIGURE 2 9FIGURE 3 10FIGURE 4 11Estimation of max VO.rom cycle load
or from subtmaxlmal VO2 28 12PUMr 5 13Fuxsi 6 14FIGURE 7 15"Diurnal Effects 32 16FMIURE 8 17Calculation methods 34 18
DISCUSSION 36 19
Accuracy 37 19Repeatability 40 19Estimation from V02 or load data 41 20General 43 20
CO USIO•S 45 20
[ RCi• AT ! SG 21
Paragrari No Page No
ANNEX A Al
CALCULATION HETHODS Al
Hanal method 1 AlFJU 9 A2AM Survey method 5 PAShepard's method 8 A4
S!

UNLDTITED
ARMY PERSONNEL RESEARCH ESTABLISHENT
REPORT No 25/77
HEARTRATE RESPONS TO A SDLE SUMAXDM WORKLWAD (RSTRAND'S TEST)AS AN ESTIMA OF MAXIMAL OXYGEN UPTAKE
IN BRITISH SERVICEMEN
by
A F Amor, Col D E Worsleyand J A Vogel
INRODUCTION
1. Physical performance can be considered physiologically in threecategories, which are distinguished by the relative importance ofcertain attributes. These are summarised in Table 1.
TABL_ g Categories of physic,!•n pformae
Physiological attributes contributingTime Scale most to performance
Brief intense effort Muscle massHigh energy phosphate storesknaerobic energy production
Strenuous effort for Oxygen transport and utilisationperiods up to 1 hour Muscle mass
Cardio pulmonary eofficiencyMechanical efficiency
Hard work for several Energy substrate supply and* hours availability
Oxygen tramsport
2. It is generally held that the second item in the table bestdescribes military activities. It is to this areat and in particularthe measurement of maxis&] oxygen uptake (max 40 ) that the main partof APFXs physical fitness research progr hJ been directed.
i INUM1TED

3. Direct measurement of max iO2 is a laboratory technique requiringspecialised staff and equipment. There was therefore considerableinterest in methods of predicting max hO2 by tests which were quicker,simpler and safer for the participants.
4. One such test, in which the heartrate response to a workload ofappgoximately half maximal is measured, has been described in detailby Xstrand and Rodahl (1970). Predicted maximal oxygen uptake isobtained by reference to a nomogram constructed by Itstrand and Ryhming(1954), from empirical data. This test was of particular interest asit had been widely used by physiologists. Their findings have beenreviewed by Rstrand and Rodahl (1970). Furthermore test results wereavailable from several military populations, including the APRE cross-sectional survey of the British Army (Amor 1975).
5. During recent laboratory and field experiments it has been possibleto examine the accuracy and repeatability of this test procedure ascarried out at APRE, using British servicemen subjects. This reportpresents an analysis of this data, and examines 2 calculation methodswhich avoid manual use of the nomogram.
MMOhDS
6. Data was collected during 7 studies between 1972 and 1976(Table 2). In 5 of those trials the subjects were British servicemenwithout specialised physical fittwss training. In the other 2, serials3 and 5, subjects were young male competition skiers, the majority ofthe serial 5 subjects being soldiers. Data from these 7 groups comprisedresults from a total of 289 men.
7. in examining calculation methods and diurnal effects, results from2 further groups of 121 and 316 men wore extracted from the 3171 setsof data collected on the APRE 1972-3 survey of physical fitness in theBritish Army.
Tile su!aXimal test
8. Subjects weiv weighed in PT shorts to 0,1kg and fitted with self-adhesive chest electcodae for ecg determination of heartrate. Theyrode for 6 mmn on cycle ergometers which wre .;ot initially to 750kpa/nin (123W), During the first 2 win the load was adjusted so thatheartrate in the 6th minute would be between 120 and 170 beats/minNo further adjustment was allowed after 2 min. Four cycles of similardesign (0 Konark and 3 Bodyguard), using friction braking (von Dobeln,1954) were used for studies 2 to 7, but for study 1, 2 magneticallybraked cycles (Huller 1952) were employed. In all the submaxiad teststhe subjects pedalled at 50 rev/pin, paced by a metroeme, and saddleswere adjusted for full knee extension. Except for study 1, the cycleswere calibrated usit* a dynamometer (Amor and Savill 1973). In theearlier experiment, conducted before the dynamometer had been built,the cycles were standaidised using oxygen uptake ieasureoat on 6subjects.
2

TABLE 2 Validation tests . Estimated max 102, cycle er~ometer
6 min cycle testProcedure
Serial Date Study No for aitualseen max V02 Observed No of
tests
1 Apr 1972 Heat Acclimatis- 40 cycle HR load V0i2 1ation trial*
2 Mar 1974 APRE Field 16 - HR load - 4Trials Section
3 Jul 1974 British Men's 12 treadmill HR load - IDownhill Skiteam
4 Apr 1975 Royal Navy Field 107 treadmill HR load - IGun Teams*
1975-76 British Biathlon 30 treadmill HR load - ITeam
6 Mar 1976 Catterick 49 treadmill HR load V;0 2Garrison sample
7 Hay 1976 Continuous 35 Hi load - 2Operationstrial*
*in serials 1, 4 and 7, only pro-trial data ws used for the present study.
9. During some of the submaximal tests expired air was collected duris4the 6th minute using ain Otis-4cKerrow respiratory valve and Douglas bag.This was subsequently analysed for oxygen and carbon dioxide to allowcalculation of oxygen uptake while cycliog.
10. lleartrate was dete ined as the mean of 2 counts at the beginning andend of the 6th minute. Ctrvud and Ryhmir Is homegram, and f6 trand's agecorrection data were used to predict m from heartrate and eithercalibrated cycle load or measured onuan upttke.
if1. Repeat tests were performed within 11 hours on study 6 ad at the satime of day on consecutive days on study 7. On study 2 four tests wereperformed, at 0900 and 1400 oan 2 days.
The maximal test
12. Determination of maximal oxygen uptake was undertaken on a motor driventreadmill for all cases except trial 1, where the cycle orgcmeter was used.
3

Experiments were performed either in the laboratory or in a laboratorytrailer specially fitted for this work. The .procedure was similar in eithercase. Following an initial estimate of max V0 2 by the cycle ergometer thesubject warmed-up for about 5 min by running at a comfortable pace on thetreadmill, during which time his cycle ergometer test result was calculatedwhile a second subject was tested on the cycle. This warm-up period alsoserved to familiarise the subject with treadmill running, while the experi-menter checked the ecg equipment and talked with him. He then rested whilethe second man warmed-up. The pair of subjects then alternately ran uphillon the treadmill for 3 to 4 min periods at 8 to 15 km/hr. During the final30 to 6 0s, collection of ecg trace total expired air and an inspired airsample was made. The procedure of kstrand and Rodahl (1970) was used toselect initial treadmill load at some 80% of predicted max t02 and loadswere increased by 1½ degrees gradient (about 201 of tO2) per ren. Subjectsusually ran 3 to 5 loads, the final one being plainly maximal as indicatedby exhaustion, pallor or hyper-ventilation.
13. Oxygen and carbon dioxide analysis of the air samples was made byparamagnetic and infra red analysers, which were standardised using cylindergas mixtures which had been made up in the laboratory and analysed by theLloyd-4Haldane procedure. Oxygen uptake was calculated on a desk computerassuming equal volumes of inspired and expired nitrogen. Maximal oxygenuptake was assessed using as criterion a levelling or decrease of oxygeaiconstmption as load increased. Confirmatory criteria were increasedrespiratory quotient, and heartate near ago-predicted maximum. Lt study 6blood samples were taken after each rui from an indwelling vet%,us caticterat the foreanm, an-d maximal exercise was also confirmed by high lactateconcentrations post-oxrcise . These results are to be reparted C eleCuilv.
Calculation Moth I's
14. In these studies maimali= 02 ";A determincd by han! fiw a 3 x onlangedcopy of kstralats revistd (1t) tni X, as given by %serand and lodahl(1970), and modified by an age corroctiott factor (CF) derived from ax'.gre sion of Cr on age. This h4u bet•i cleulartd usixv the factors givenby Astrand (1960) for the age rvnge 15-40 years.
I1. For hxldling large quantities of data, as eollected in Survey wolr anautomatic Method of applying the nomogram is required. The teclutique usedin the APRW physicai fitness survey computer program was to stort a watrixof mean is.ogram reults. These had been obtained by 5 teducicians who rewithe nomogram for all heartrates between 120 aid 170 beats/'min and 5 workloadsbetween 600 and 1200 kpm/min. Mean hoartrate correction factors based oncycle calibration data wer deduced by reading the nameogrm for selectedcombinations of high mid low heartrates aid loads, and these together withthe age correction equation were applied to the nomogram result to deriveant estimated maximal oxygen uptake.
16. An alternative nmcerical method devised by Shephard (1970) for use onthe Olivetti 101 prolramable calculator was also evaluated against theabeov. It used an equatiot intaeded to describe 13trand's empirically derivedn!omoram.
17. To test these 2 numerical methods, retults from a group of 316 soldiersseen on the APM physical fitness survey were selected from the total survey
I,

data. These data were from men who had ridden on one cycle over a periodduring which 4 :,ycle calibration corrections had been applied. Maximal O2was determined from the original readings by 2 observers using the manualmethod and also by the 2 numerical methods,
18. Details of the numerical methods and a copy of Istrandts nomogram aregiven in Annex A for reference purposes.
RESULTS
General
19. A number of aspects of the cycle ergometer/nomogram method for estimatedmax V02 could be investigated from the data. This report has not attemptedto examine theoretical aspects governing the construction of the nomogram,as these are not relevant to the main theme. As Rstrand (1960) pointed out,the method was inter•ed to empirically relate submaximal heartrate and maximal102. The results given here therefore examine the accuracy and repeatabilityof the predicted maximal oxygen uptake as obtained by APRE. Other aspectsof the use of the method which have been examined are diurnal effectsnumerical solution of the nomogram, and the relative accuracy of max V02determination by the 2 alternatives offered by the nomogram, viz: estimationfrom cycle load setting or measured oxygen uptake during cycliig.
20. In Table 2, 7 subject groups are specV,'iod, and these are referred toin Table 3, whiuh sulmarises the calculations carried out in the presentstudy. Serials 8 and 9 refer to the 2 blocks of results extracted from thephysical fit4s-s suarey data.
The auiber of subjects included in the various calculations vwrics duo tomissiag data, for example in serial 1, 40 Nutbaximal hoertrates velvobtained, but only 39 sub-naximal oxygen uptakes, Similarly in Serial 6, 49initial estima-tes ere obtaizwd, but only 44 repoats.
TAP1I 3 Sy axy.ofdata anlvsis
Comparis4o s se ri- al ýNo of(Table 2) %bjec',s
Prediction from vorkload or oxygen uptake 1, 6
Prediction fro workload a max *,at o cycle 40
Prediction from vorkload arid mx test on tieadmill 3, S 424, 6 156
Prediction from wcrkload, initial and secand tests 2, 6, 7 9S
Prediction fro vorkload, .orni.& aid aftamv-,on
tests 2 8 121
Prediction frm workload, maral ad anmricaluethOCm 9 316
L -

Description of subjects
21. Means and SDs of ages, heights and weights of each group of subjects aregiven in Table 4. Serials 6, 8 and 9 were cross-sectional samples of the Army.The other groups were not markedly different from these, except group 3, theAlpine skiers, who were a little younger.
TABLE 4 Physical description of subjects
Age yr Height cm Weight kgSerial No of
subjectsmean SD mean SD mean SD
1 40 22.5 5.03 175.6 6.67 71.0 11.86
2 16 24.7 2.72 175.9 6.99 71.6 io.6o
3 12 17.6 1.27 174.9 6.46 66.0 9.09
4 107 25.5 3.74 177.4 6.46 79.5 7.77
5 30 21.1 4.13 175.5 6.09 67.7 6.62
6 49 23.0 5.09 174.8 8.59 72.1 13.02
7 35 21.1 3.80 175.7 6.76 71.7 6.95
8 121 24.4 5.02 172.6 6.76 69.9 10.09
9 316 24.4 4.66 173.3 6.56 71.4 10.13
Estimated max 402 and direct (cycle) max b02
22. Forty subjects of group 1 had a mean estimated max %2 of 43.,2 ml/(kgmin) with SD of 7.85 ml/(kg mirn). Actually determired maximal oxygen uptakeon the bicycle was 42.9 ml/(kg/min) with SD 5.77 mr/(kg min). leaa and SDof differences between measured and predicted max V02 was 0.29 (SD 2.87)ml/(kg mLm). This was not significant on paired t-test (t 0.386). Theregression line of y = measured max 102 on x - estimated max VO2 was
y - 22.70 + 0.4 66 x r = o.634
This had a standard error of estimate of 4.5 ml/(kg mrin). Figure 1 plotsthe relation between estimated and measured max V02 .
Estimated max '02 and dire.t admill) maxV2 - Serviceen
23. Data frim 156 subjects coatributed to an analysis of the relationbetween max VO2 as predicted from cycle test, and as actually measuredduring treadmill running. These were 107 men of the 3 Royal Navy FieldGuns teams, and 49 men selected from a randomly sampled survey of Catterick
6

Measured and estimatee maximal oxygen uptakecycle Lrgometer
line of edimily
J
S40 0
szo o 10
E M C7

Garrison. Selection was made from results of the Army Physical FitnessAssessment, and it was intended to obtain approximately equal numbers of menthroug-ut the fitness range. In the case of the Field Gun teams, measuredat thu1 oegiruing of the season, a wide range of men were also seen. Somehad had little opportunity to train whereas others, shore based, werealready well trained.
24. Where repeat tests were made (see Table 2) the.initial tests were usedfor this analysis. Mean measured and estimated max V02 , in ml/kg(iin) were
measured mean 52.6 SD 5.95
estimated mean 52.0 SD 10.17
Mean difference was 0.62 ml/(kg miin) and SD of differences was 8.30 ml/(kg irin). Correlation of erxor (defined as estimated max t02 minus measuredmax V02 ) with measured max V02 was 0.0037. The regression line (Figure 2) ofy = measured max V02 and x = estimated max •02 was
y = 34.93 + 0.340 x r = 0.581
This had a standard error of estimate of 4.8 ml/(kg min), Figure 3 showsthe error in estimated max V02, related to measured max V0,
Estimated max VOŽ and measured (treadmill) max V(2 - Athletes
25. Vata was available from 2 groups of skiers competing at internationallevel, 12 young men of the British Mens Downhill Team, and 30 members ofthe British Biathlon Team. The majority of the Biathletes had been testedseveral times in successive seasons. The Alpine skiers were newcomers tothe laboratory, and generally younger, but being well trained they rapidlyadapted to tivadmill running.
In the case of these men the cycle orgometer test underestinated max V0
by a mean of 4.4 ml/(kg mmn), moan values in ml/(kg min) being
measured mean 62.2 SD 6.27
estimated mean 57.8 SD 9.42
3D of differences (viz ectimated minus mosured max V(2) was 9.89 Ma!(kgmrin). The regression of y measured max V02 and x estimated max V02(figure 4) was
y 52.38 + 0.170 x r 0.256
Correlation was quite low, and standsad error of estimate was 6.1 ml/(kg
Duplicated tests - estimated -ax L02
26. In three studies a total of 95 men were tested twice. In two ofthose 44 men at Catterick, and 16 men of the APO Field Trials Section
Li 8

Measured and estimated maximal oxygen uptakeBritish servicemen
70
IS
sob
* 0
pa34.930 0.3040
f a 0.581
-- •no e e
20 0s
jMI.& . "(kg - ni- c" .C atm
ilOOE 2
S • • . • .n, _... w9

L•r I-- Io I
0 •
EE
Aww
II
U"
10
go..- •O .,.. • •gO• i*D * 0 0
* S
* , % * ,
C Sl l)iw •
o 0 1

Measured and estimated maximal oxygen uptakeathletes
60 0
E U
5237 0.70
S 70 1.•
**4
60 0 s To
kIM
' 50si teams
,. • lu 42
S40 ~SE a 6.063 mft'kg mrint
!EUlmated V02 ma ml/(hg minii) cycle ergometer
11
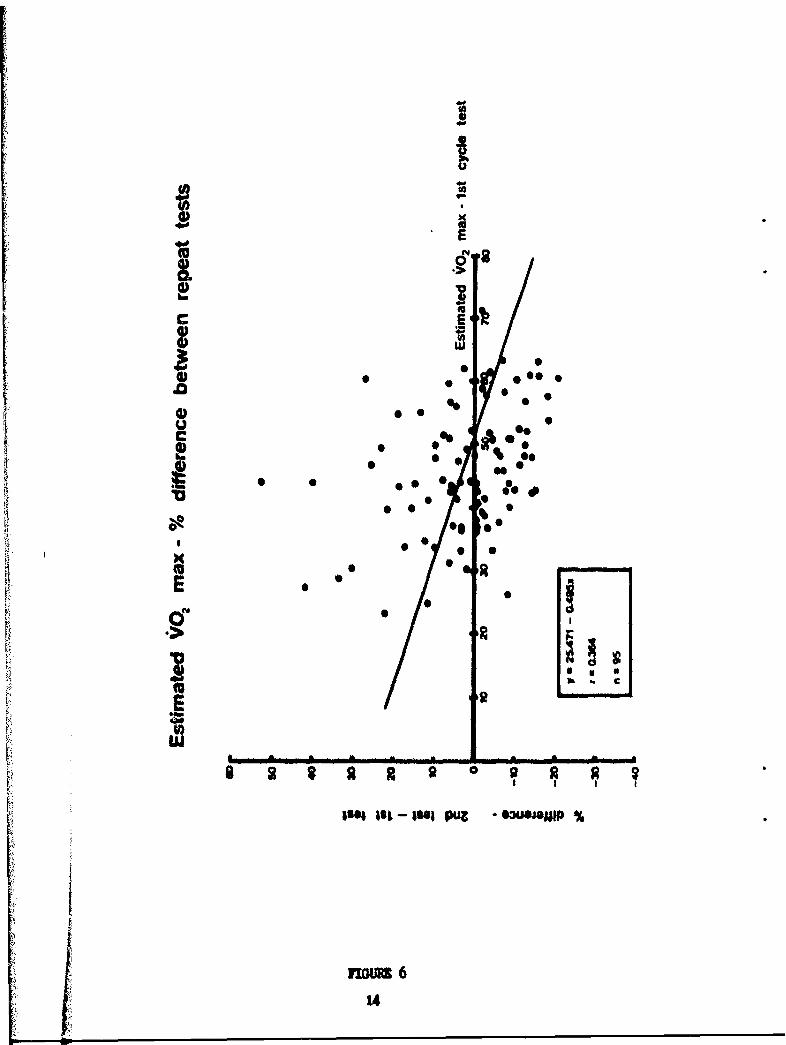
were tested within 1- hours in the laboratory. A further 35 men on thecontinuous-operations trial visited the laboratory twice at the samehour on two consecutive days during the baseline period of the trial.Apart from the 16 APRE soldiers, all the subjects were naive, ie thisinitial test was their first experience of a cycle ergometer protocol.
Estimated max V02 results in ml/(kg min) for this group of 95 men
were
first test mean 46.9 SD 10.03
second test mean 46.2 SD 10.04
These means were not significantly different on paired t-test (t = 1.13),and the correlation coefficient of regression of second test on firsttest was 0.82. Mean difference between repeat tests was -0.71 ml/(kgmin). This test-retest data is plotted in Figure 5. In Figure 6 thetest-retest differences are plotted against initial test results. Therewas a small but not significant trend to an improved result on the secondtest with men of low work capacity, and vice-versa with fit men.
Estimation of max V02 from cycle load or from submaximal t02
28. In two experiments oxygen uptake was measured during the submaximalcycle ride. It was thus possible to compare the two methods offero4 bythe nomogram, namely prediction from cycle load or from submaximal V02.Comparisons were made in two ways, by considering the relatioii betwuenestimated and measured max V02 , or by comparing the two estimations.Since the results from the first experiment were obtained before thecycle calibration dynamometer was constructed and maximal VO2 wasdetermined by different methods it was not possible to combine the groupsfor the former method of comparison.
29. Estimated and measured max V02 for these groups are given in Table 5,and Figure 7 shows the relation between the 2 methods for the 49 subjectsseen on Study No 6. (Only 44 group 6 subjects contributed to Table 5since these results were calculated from the test-retest data).
TABLE 5 Estimated max ,b from cycle load or submax Y02
No of Measured Load predicted *02 predictedstdy subject mean SD mean SOD correla- D mean] SO coxvela .
tion diffe tion diffs
1 40 42.87 5.7 43.24 7.85 0.63 2.87 43.53 8.26 0.65 6.23
6 44 49.90 6.7 45.58 11.43 0.63 8.88 45.12 10.10 0.62 7.93
12

Repeatability of estimated max oxygen uptakeAstrand's nomogram method
lira1 of 6dewlit
70
S 0
300n'j~ 0 /-
0 .0
000
23 0015
300
0 30 40 so .1 To so
.1 1
S7
131
ES*t'
E
'U.
SOQ • 4114
0 ".00 S
0 0~l a~ u - euU
. 0*=0

i
0.3 4
>' .>u \ I
64
i.s
0664.,I. 4
• " " " l t t . . .. . . . . .
*44 .
6 *4 15

Correlation between measured and predicted max 1 O2 was almost the sameby either method, and standard deviation of differences was similar exceptin the case of load-predicted, cycle maximun, where it was smaller thanthe other results.
30. In comparing the two estimation methods directly, the data could becombined to obtain a total of 88 subjects. The correlation between the 2prediction methods was 9.896, somewhat higher than the individual correla-tion with measured max VO and the mean and SD of differences between the 2methods was 0.38 (SD = 4.17) ml/(r min) (Figure 8).
31. Forty four men in study 6 rode twice with oxygen uptake measurement.It was thus possible to examine the repeatability of the two estimationmethods (Table 6).
TAKEL 6 Repeatability of 2 prediction methods
Method No of 1st Ride 2nd Ride Correlation SD diffs teaSubjects mn SD -- coefficient
Load 44 45.58 11.43 46.67 11.75 0.79 7.56 0.96
b2 44 45.12 10.10 46.76 9.49 0.80 6.27 1.73
Although the second test gave a slightly higher estimate of max WO2 byeither method, the differences were about the same mnd were not statis-tically significant on paired t-test. Other measures of repoatability,namely correlation coefficients and stardard deviation of differenceswere also similar, the W method being slightly superior.
Diurnal Effects
32. Diur-nal fluctuation in resting heartrate is a well known pheumenon,and the possibility that a similar effect might be found in predicted maxto was investigated using data ftom groups 2 and 8. In study 2 full datafrGm 16 men was available for the first of the morning and afternoon rides.Although the mean afternoon result was somewhat lower than the montisg,it was found to be not statistically si-nificant, on Analysis of Variance.(Table 7).
TA••E 7 An~alis of Variance of momirm and afternoonpricted max - W R subects
Sum squares df Hean square F ratio Significance
Subjects 1929.9 is 128.7 3.03 5%
Time 136.5 1 136.5 3.21 NS
Residual 637.6 15 42.5
- _ __.

Estimated Vq max - from ergometer load setting
and from measured submaximal V0Q
70 line of idenly
EE S
S40 .
o• •Z 40
VS
*n 0
6io *4# m 0p 1114*Mk
30~ '50 *~efm2 3 0 to s • YO *
Est VO) man• Orod~ed twe, ergomenoer load m~lko min)
1 17U" " gS6s l 8U 0a 9ueit443 ftlh lq
17
Mean and SD of morning and afternoon results, in ml/(kg min) were
morning mean 48.3 SD 10.94
afternoon mean 44.2 SD 6.37
33. This difference, although not significant statistically, was of somepractical importance insofar as it affected the estimation of populationmeans, as determined in the survey of physical fitness. Data from a largergroup of men was therefore selected from the 3171 sets of results recordedduring the survey. These data were from the first 20 men seen each morningand each aftenoon on 3 days where a total of 286 men had been tested. Noknown selection in attendance had been applied. These were seen from 0900to 1000 hours, and from 1400 to 1500 hours, and totalled 121 men. Meanresults, in ml/(kg min) were
morning (n = 61) mean 45.0 SD 8.60
afternoon (n = 60) mean 44.1 SD 7.89
These were not significantly different on t-test (t = 0.584), but a smalltrend to lowýer results was found in the aftprnoon group.
Calculation methods
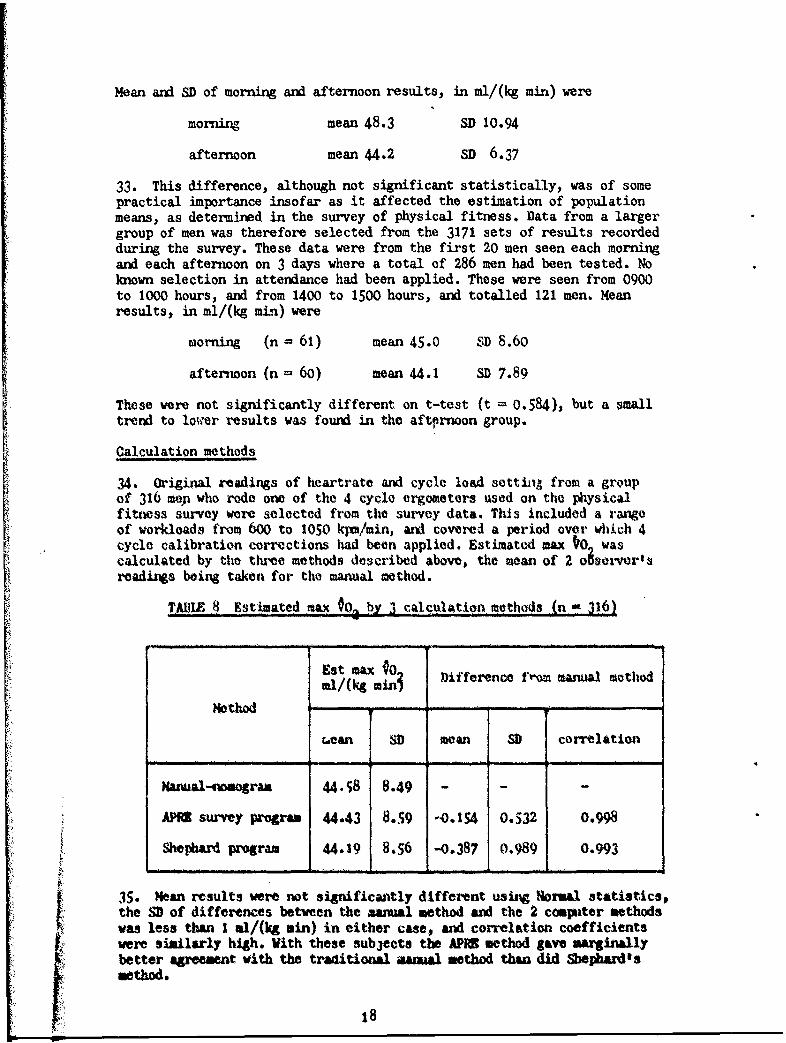
34. Original readings of heart--ate and cycle load settioA from a groupof 316 men who rode one of the 4 cycle ergometers used on the physicalfitness survey were selected from the survey data. This included a rangeof workloads from 600 to 1050 kpm/min, and covered a period over which 4cycle calibration corrections had been applied. Estimated max bO was
calculated by the three methods described above, the moan of 2 oisorver'sreadins being taken, for the manal method.
Est max f0oEs/(t mln ~ ~Difference f"o manual methodml/(kg mn
Method - ,. ...
Lan SD mwan SD correlation
naiwl-tomogra 44.58 8.49
APM survey Program 44.43 8.59 -0.IS4 0.532 0.998
Shephard program 44.19 8.56 -0.387 0.989 0.993
35. Mean results were not significantly different usisig Normal statistics,the SD of differences between the manual method and the 2 computer methodswas less than I mi/(kg min) in either case, and correlation coefficientswere similarly high. With these sub3ects the APIS method gave arginaUlybetter agreement with the traaitiona •aamo method than did Sblphardi'smethod.
18
DISCUSSION
36. The APR! method of conductirg the cycle test differed from thatrecommended by fstrard and Rodahl (1970) in that the load was adjustedduring the early part of the test, and so their recommendation of at Least5 min steady state work was not fully met. Furthermore the subjects used toconstruct the nomogram differed in nationality and age from the somewhatselected population of the British Army. These were the main reasons formaking the measurements reported here.
Accuracy
37. Mean difference between estimated and measured maximal oxygen uptakewas less than 1 ml/(kg mrin) for groups of 40 and 156 servicemen tested byeither the cycle or treadmill maximal methods, but SD of differences waslarger when maximal testing was by treadmill. As the cycles used for themaximal cycle test were not the same model, nor calibrated by the same methodas those used for the treadmill comparison, and different subjects weremeasured, it is not possible to infer that the subnaximal test estimatestreadmill-determined or cycle-determined max to0 equally, and these resultsare not therefore necessarily in disagreement with those of other observerswho have found max 102 to be somewhat higher on treadmill rumnnng, comparedto cycling.
38. Rstrandr aad Rodail (1970) state the nomogram method tends to over-estimate at high max VO aid under-estimate at low values, with an SD ofdifferences of 10 to 1;, of reading. The present results on Britishservicemen confirm these finings an4 the regrcss.4.on of treadmill-determined mZ 1O2 on estimated msx VO,2 from the cycle test enables correc-tion of max VO2 as determinsed by %strawz's nomogram, with a starriar errorof estimate of 4.8 ml/(kg miin), a little over half the error of thewicon-ected cycle result. This rogrossion lioo.cuts- the line of identity at52.9 ml/(k& min). Since the mean mv.asured max VOl of the group of 1%6 menfrom which this equation was detqzined was S2.6bml/(kg ruin) it can beseen that the estimation of max V0) by nomogram is acctrare for this popula-tion if only mea% values are consi•o•rd. In the presmet data the error <Cthe nomwgram method appewaed tq be random in• ature, since there was nocorrelation with measured max VO (r f O.134). Accoadiiglyj percmntageerrors increase as measured ux iO decreases, and therefore it is preferableto exprmss en-or !i units of meas~uhcent, rather than percentage form,unlike Jstrandfs practise.
39. Results obtained from the 2 groups qf skiers produced a lower correla-tion between mti ured A estimated x YO2 .and a larger standard deviationof differemces. thouh the esti•ated max VO, was only 4.4 ml/(k4g min) lowon average, (about 7% of populatJon mean valni), the low correlation sumge3s3this method could not be reliably applied to data from these men. Moreover,in cots idertir data from athletes it is generally individual rather thangroup results which are of interest, and it is in this area that the dataproduced by this estimated aethod is least reliable.
Re.a.tatability.
"L 40. In examining performance data freo naive subjects it is sometimessuggested that a "firfqt-tijwe practice effect exists. The presentrepeatability data does not sUPPOrt this view, the mean difference betuven
19

repeat data being less than 1 ml/(kg mrin). The standard deviation ofdifferences between repeated measures was 6.09 ml/(kg mrin), a little lessthan the SD of differences between measured and estimated values of maxVO2 which was 8.28 ui/(kg mrin).
Estimation from io2 or load data
41. The two methoJs correlated well, ax,.4 mean values were in good agree-ment with each other and with meaz-,red .ax VO,. Moreover repeatabilityof the two methods was .::.bqut the same. One contribution to the accurateestimation of submaximal VO2 from load was individual cycle calibration.The load settings of the cycles used were found to be up to 20% in error(Amor and Savill 1973) and if this had not been corrected before applyingdata to the nomogram, this error would have been reflected in a consistentdifference between the 2 methods.
t:• 42. Provided the cycle load settings have been calibrated there Would thusbe little value in the extra effort of measurement of submaximal VO2 ,except for subjects who are extremes of weight, obesity or fitness, wheremechanical efficiency at ergometer cycling is known to be abnormal.
General
43. Although a trend to lower results in the afternoon was found in asmall group (n = 16), the difference was not significant, and in examiningsurvey data the differences were considerably smaller than the error ofthe method.
44. The 2 -omputeri3ed calculation mcthods were shown to be useful.Neither introduced an appreciable random error, and the constant errorwas negligible in both cases.
CONCLUSIONS
45. Accilracy f the single load cycle ergometer method of estimatingmaximal VO, (. strandts test), as used by APRE with British servicemen-was showi, ;o be similar to that c'aimod by the originators of the method,SD of differences between estimated and measured max #02 being 8.28 ml/(Ig min). A regression line
y = 34.93 4 0.34 x
where y is measured max VO aO d . is estimated max 0 2 enabled correctionfor the under and over-estimate which occurred with men of low and highmax VOIts respectively, and produced a standard error of estimate of4.8 mlý(kg mii).
46. Comparative tests on 2 groups of competition skiers gave poor estima-tien of max VO2 by this method however.
47. Accuracy qf the me'.',od was txic improved sigtificantly by measurementof submaximal V02 . Test-retest differences (repeatability) were loss thaQthe error of the method llifferences between estimated and weasured max VO).
- I• 20

48. Diurnal effects were shown to be of little practical importance.
49. tio computer programs which avoid man.Al use of the nomogram were shownto introduce no appreciable error.
MtCOHMENDATIONS
50. Where a 10 to 15% random error in individual max t0 can be tolerated, asin estimation of population mean values, the single workaoad submaximal: .cycle ergometer test is a cunvenient and useful tool. It cannot however be
recommended as. a substitute for measurement of max t0 where individualresults are required to a higher accuracy, or where tests are to be made onver-- fit men su.zh as competition skiers.
51. Provided the cycle ergometers have been calibrated, measurement of sub-maximal 02 of normal subjects is not recommended.
52. The two computer programs are recommended as convenient and accuratemethods of avoiding, m-nmal use of the nomogram. For use with British soldiersthese programs can be amended to include the correction equation relatingestimated and actual (treadmill) max 102.
21pi

HEFERE1UES
Amor A F (1975) Preliminary data for a survey ofphysical fitness in the Army.Army Personnel Research EstablishmentAvance Report No 60.
Amor A F & Savill M W The calibration of bicycle ergometers.(1973) Army Personnel Research Establishment
Report 45/73.
Istrand I (1960) Aerobic work capacity in men andworaen with special reference to age.Acta Physiologica Scandinavia 49(Supplement 169).
Rstrand P 0 & Rodahl K Text book of work physiology.(1970) Pub. McGraw Hill, New York.
Rstrand P 0 & Rybming I A nomogram for calculation of aerobic(1954) work capacity (physical fitness)
from pulse rate during submaximalwork.Journal of Applied Physiology 7,218-221.
MAller E A (1952) Radmarkt 8, 14-17.
Shephard R j (1970 omputer programs for solution of thetrand nomogram and the calculation
of body surface area.Journal of Sports Medicine andPhysical Fitness 10(4)206-210
Von Dobeln W (1954) A simple bicycle ergometer.Journal of Applied Physiology 7,222.
k.:
-ANNX A
CALCULATION IMTHODS
Manual method
1. Figure 9 shows the nomogram of Rstrand and Rylming (1954) as modifiedby astrand (1960). A straight line is drawn between the heartrate scaleand a point on the left side of the combined work rate scale correspondingto either cycle load or measured submaximal VO . The intercept with thecentral scale is the uncorrected estimate of mix VO2 in I/min.
2. This is converted to ml/(kg min) by dividing by nude body we' ht, andfurther adjusted by multiplying by an age correction factor F. I Xstrand(1960) gave tabulated factors for ages 25 Jo 65 in 10 year intervals andthis, as extrapolated and interpolated by Xstrand and Rodahl (1970), isgiven in Table 9.
TABLE 9 Nomogram correction factors for men and women
Age, yr Factor
"15 1.10
25 1.00
35 0.87
40 0.83
45 0.78
50 0.75
55 0.71
60 o.6865 o.65
Wh3. Wen electronic calculators are used it is more convenient to apply
the age correction as a regression formula, and Table 9 reduces to
F - 1.2088 - o.o090 (Age, yr)
It is this formula which has been used for age correction thro•ghout theanalysis of the present data.
Al
L)
A I 'I

litersStep test work load"33 "40 kpm/mincm "cm " o.
-0.8
kg kg 0.93oo0weight - - -300
-1.0Pulse rate 40-
max. Vs,,170- liters -1.2 -450-
460- - 450166 1.6 5 0 1.
6 -r -1.3-
162 •172 18 -1.4
150 66020'""1 \ 2.2- . 60. 1.50• - -600154- 164 \ -1.6- -• .\\ ..... •.--2.4" - .150- 160 ."" 2,6 -1.7 _ -146-156 2.8 .075
\3060 750142 152 3. 2
138- 148 3.4 80- =2.03.690
134--144 3.8 " 2. 1 904.0900
130 140 4.2 2.24.4
4.6 , \\ 90 2- -2,2 0126 136 20.34,8
122- -132 8-24"5 , 4 - b.6 80-•l~s-- 12 8 5 .8 .. 002.5
--124 2.6\120 2.0
!20 \,'90 , ?
-2.9
100"-3.0
3.1
-3.2
! -3,3
-3.4
-3A,
1.500
FMWUI 9
A2

- 0
TABLE 10 Max 02 I/min - from Astrands Nomogram (MEN)
"•: ~LOAD1LOD600 750 900 1050 1200
kpm/min
HR
120 3.51 4.15 4.81 5.60 -
121 3.44 4.09 4.73 5.50 -
122 3.39 4.02 4.65 5.41 -
123 3.35 3.96 4.58 5.33 -
124 3.29 3.90 4.50 5.26 -
125 3.24 3.83 4.43 5.18 5.93126 3.19 3.78 4.36 5.10 5.84127 3.15 3.71 4.28 5.00 5.76128 3.10 3.66 4.21 4.93 5.64129 3.04 3.59 4.15 4.86 5.56130 2.99 3.55 4.10 4.79 5.46131 2.95 3.49 4.05 4.71 5.40132 2.91 3.44 3.99 4.65 5.34133 2.86 3.40 3.95 4.58 5.27134 2.81 3.35 3.87 4.51 5.20135 2.78 3.30 3.82 4.44 5.11136 2.74 3.25 3.77 4.40 5.03137 2.70 3.20 3.72 4.32 4.98138 2.68 3.18 3.67 4.26 4.91139 2.64 3.13 3.62 4.19 4.84
140 2.62 3.09 3.58 4.15 4.80141 2.59 3.05 3.53 4.10 4.72142 2.57 3.00 3.48 4.06 4.65S143 2.53 2.97 3.43 4.02 4.58
144 2.48 2.93 3.39 3.97 4.54145 2.45 2.89 3.36 3.92 4.49146 2.41 2.85 3.32 3.87 4.43147 2.39 2.81 3.28 3.81 4.38148 2.37 2.78 3.24 3.78 4.31149 2.34 2.76 3.20 3.74 4.26150 2.31 2.73 3.17 3.69 4.20151 2.28 2.70 3.13 3.65 4.17152 2.25 2.68 3.08 3.61 4.13153 2.23 2.65 3.05 3.57 4.09154 2.21 2.62 3.02 3.53 4.05155 2.18 2.60 2.99 3.48 4.01156 2.16 2.58 2.96 3.45 3.98157 2.14 2.55 2.92 3.41 3.92158 2.12 2.51 2.89 3.38 3.87159 2.09 2.49 2.86 3.35 3.83160 2.07 2.46 2.83 3.31 3.79161 2.05 2.43 2.80 3.28 3.76162 2.03 2.41 2.76 3.25 3.72163 2.01 2.38 2.74 3.21 3.69164 1.99 2.36 2.72 3.18 3.65165 1.97 2.33 2.69 3.14 3.61166 1.95 2.30 2.67 3.11 3.59167 1.93 2.28 2.65 3.08 3.55168 1.91 2.26 2.63 3.05 3.51169 1.89 2.24 2.61 3.01 3.46170 1.87 2.21 2.59 2.98 3.42
A3
4. Wherever manual use of the nomogram was practised, it was read by 2observers, mean results being taken. The nomogram used was a 3 x photographicenlargement of the rmaogram given in Rstrand and Rodahl (1970), (approximately60 x 30 cm).
APRE Survey method
5. For the computer program used in handling the 3171 sets of data obtainedon the APRE survey of physical fitness in the Army a matrix of nomogram resultswere stored. This was obtained by taking the mean o0 5 sets of max $O readingsobtained by 5 observers who read the nomogram for all integer heartraiesbetween 120 and 170 beats/min and workloads of 6c-0, 750, 900, 105C and 1200kpm/min (Table 10).
6. This table is not conveniently modified to account for calibration errorsof the cycle ergometers, so the observed heartrates were corrected beforeentry to the tabulated nomogram. The heartrate correction factors were obtainedby manually reading the nomogram at high and low heartrates for both indicatedand true cycle loads. Mean results were used to derive a heartrate correction-factor table which related cycle and indicated load. Table 11 gives an example.
TABLE 11 Corrections to observed heartrate, to allow for cycle calibration(Survey subjects 3443-3906)
Indicated workload (kpm/min):1 Cycle_____ __ ___
NO600 750 900 1050 1200
1 1.098o 1.o968 1.1045 1.1180 1.1285
4 0.9651 0.9657 0.9652 0.9646 0.9677
5 0.9477 0.9467 0.9456 0.9480 0.9490
6 0.9525 0.9467 0.9422 0.9415 0.9429
7. After correction of observed heartrate to allow for cycle calibration,and entry of the corrected heartrate into the nomogram matrix, the agecorrection factor was applied as before.
Shephard's method
8. Shephard (1970) presented equations which represented the nomogram toa sufficient accuracy, as judged by comparison with manual reading of thenomogram. In this method the net oxygen uptake of cycling is first calculatedfrom workload assuming mechanical efficiency of 20% and this is added to abasal oxygen uptake calculated from surface area to obtain a gross oxygenuptake. This is applied to an equation representing a linear relation betweenheartrate and oxygen uptake, and the result is further modified by an agecorrection factor expressed in ratio form.
A4

9. Since surface area was needed in this method, it was calculated by anapproximation to the well known du Bois formula
2Area (in) 0.425 0.725 xo-
An approximation was required since the calculator in use at that timecould not compute reciprocal powers but only square roots. The approxima-tion was
Area = 45.91W 0.5 H 0.75 x 1
where W, body weight is in kg and H, height is in cm in both cases.
10. The final calculation was
_____100 -- x 195-61 x 1/5 g(load x 10.18) + (670 x area.710 +o +/i.37 (age) -33.2_7 P-61
where P is pulse rate. This consisted of 3 terms., the age correction,nomogram and oxygen uptake terms respectively.
11. In the present investigation of this method,, the original du Boisformula was used for surface area, since a more powerful computer wasavailable, and it was the representation of the nomogram rather than the
approximation to du Bois which was under scrutiny.
ASIl
I!
I
AS

DISTRIBUTION LIST
No of Copies
MflfSWR OF D=NEE~
Army Department
CS(A) 1DCS(A) 1AD/SAG(A)3 1SAG(A)3b 2DAT 1IPAT 1DGAMS 1DAMRD/VRA 1
Cent~ral Staffs
MOD Library 2
Navy Department
CGRMHMIB(N) 1
Air Force Department
DHR(RAF) ISec FPRC 1
Procurement Executive
DR/CB IDRIC 2
Armsk Directors Schools ard Establishments
D Infantry 1DOS 1School of Army Health 1RAM College (1 for Professor of Army Health) 2Staff College (TRO) 1RHS 1
School of Inuntry 1j ITDU
S~a• 1
No of Copies
Arms, Directors, Schools and Establishments (contid)
DOAK IRAN (in) 1IAM 1INK 1Royal Naval Physiological Laboratory 1ASPT IA•Man SG (WS) 1
Overseas Liaison
BDLS Ottawa 1BDLS Canberra 1BDLS Washington (including I for DR and DS,
1 for Med Rep and 1 for 4O/BNS) 3
MINSTRY OF AGRICULTURE, FISHERIS AND FOOD
FS & FD, Food Research Institute, Norwich for theCDSO Food Study Group 12
MEDICAL RgCH COUNCIL
Assistant Secretary APRC 8Sec RNPRC 2MRC aPRU 1
STANDARDIZATION AND LISON STAFF IN UK
Canadian Forces Liaison Officer (ACGS(OR)) 4Canadian Forces Defence Research Board Member, London 1Australian Army Liaison Staff 4OCO for India 6Senior Army Liaison Staff Naw Zealand Army 2US Army Standardization Staff 15Mad Rep Defence Attache's Office, US Embassy 1MA Swedish Embassy
gCaSULTANTS TO APIS
Dr Passamore 1Dr Durnin 1
D Ottawa (Major OfHara, Major Allen) 2Anglo-French Defence Research Collaboration in
Human Factors DiWK Biologie 1NATO Headquarters (H H akland)1

No of Copies
NATO Science Affairs Division 1USARIED (Dr Goldman, Dr Vogel) 2Medical Director BMVg (Dr D J Jovy) 1LAIR 1Institute of Mhysiology and Allied Sciences,
Delhi Cantt, Delhi (Surgeon Capt H S Nayar)Arbeidsfysiologisk Institutt Oslo,(Professor Rodahl amd Dr Hermansen) 2
NMRI Bethesda 1Australian Forces Food Science Establishment 1APRE Library 2
4.
I,,
Ik-