atlantic major hurricanes, 1995–2005—characteristics...
TRANSCRIPT

Atlantic Major Hurricanes, 1995–2005—Characteristics Based on Best-Track, Aircraft,and IR Images
RAYMOND M. ZEHR AND JOHN A. KNAFF
NOAA/NESDIS, Fort Collins, Colorado
(Manuscript received 28 August 2006, in final form 1 May 2007)
ABSTRACT
The Atlantic major hurricanes during the period of 1995–2005 are examined using best-track data,aircraft-based observations of central pressure, and infrared (IR) satellite images. There were 45 Atlanticmajor hurricanes (Saffir–Simpson category 3 or higher) during this 11-yr period, which is well above thelong-term average. Descriptive statistics (e.g., average, variability, and range) of various characteristics arepresented, including intensity, intensification rate, major hurricane duration, location, storm motion, size,and landfall observations. IR images are shown along with IR-derived quantities such as the digital Dvoraktechnique intensity and IR-defined cold cloud areas. In addition to the satellite intensity estimates, theassociated component IR temperatures are documented. A pressure–wind relationship is evaluated, and thedeviations of maximum intensity measurements from the pressure–wind relationship are discussed.
The Atlantic major hurricane activity of the 1995–2005 period distinctly exceeds the long-term average;however, the average location where major hurricanes reach maximum intensity has not changed. Themaximum intensity for each 1995–2005 Atlantic major hurricane is given both as the highest maximumsurface wind (Vmax) and the lowest minimum sea level pressure (MSLP). Comparisons are made to otherAtlantic major hurricanes with low MSLP back to 1950. Maximum 24-h intensification rates average21.1 m s�1 day�1 and range up to 48.8 m s�1 day�1 in terms of Vmax. The largest 24-h MSLP decreasesaverage 34.2 hPa and range from 15 to 97 hPa. Major hurricane duration averages 2.7 days with a maximumof 10 days. Hurricane size, as given by the average radius of gale force wind at maximum intensity, averages250.8 km and has an extremely large range from 92.5 to 427.4 km.
1. Introduction
During the 11-yr period of 1995–2005, there were 45major hurricanes in the Atlantic basin. Major hurri-canes are those that attain Saffir–Simpson category 3 orhigher (Simpson 1974). Category 3 is defined by maxi-mum surface wind speed equal to or greater than 51.4m s�1 (100 kt). The Atlantic basin includes the NorthAtlantic Ocean, Caribbean Sea, and Gulf of Mexico. Adistinct upturn in the frequency of Atlantic major hur-ricanes has occurred since 1995, with an annual averageof 4.1 major hurricanes (1995–2005), compared with the1950–2005 average of 2.7. Longer-term climatologygives an annual average of 1.9 Atlantic major hurri-canes (Elsner and Kara 1999). This resurgence of At-lantic major hurricanes was noted by Wilson (1999) anddiscussed in subsequent papers by Elsner et al. (2000a)
and Goldenberg et al. (2001). The North Atlantic Os-cillation (NAO) has been shown to be an influence onAtlantic major hurricane activity (Elsner et al. 2000b).Gray et al. (2005) attribute this upswing in activity tomultidecadal fluctuations in the Atlantic Ocean ther-mohaline circulation.
Previous studies have explored trends in tropical cy-clone records and associated El Niño–Southern Oscil-lation (ENSO) and quasi-biennial oscillation (QBO) in-dicators with regard to the global distribution and fre-quency of tropical cyclones (Gray 1984; Goldenbergand Shapiro 1996; Landsea et al. 1996; Elsner et al.1999; Elsner and Kara 1999; Saunders et al. 2000; Els-ner et al. 2004). Emanuel (2005) and Webster et al.(2005) discuss evidence for warming sea surface tem-peratures associated with anthropogenic climatechange, and resulting increases in tropical cyclone in-tensity and frequency. Our paper does not addressthese important issues but instead is focused on pre-senting a descriptive observational overview of Atlanticmajor hurricane characteristics.
Corresponding author address: Ray Zehr, CIRA/ColoradoState University, W. LaPorte Ave., Fort Collins, CO 80523.E-mail: [email protected]
VOLUME 20 J O U R N A L O F C L I M A T E 15 DECEMBER 2007
DOI: 10.1175/2007JCLI1652.1
© 2007 American Meteorological Society 5865
JCLI4352

FIG. 1. Color enhanced IR images of each 1995–2005 Atlantic major hurricane, near the time of maximum intensity. The blue shadesindicate IR temperatures �50° to �59°C, green �60° to �69°C, red �70° to �79°C, and yellow �80°C and colder. Each image is ahurricane-centered 4-km resolution Mercator remapped 1280 km � 960 km image. They are ordered according to date.
5866 J O U R N A L O F C L I M A T E VOLUME 20
Fig 1 live 4/C
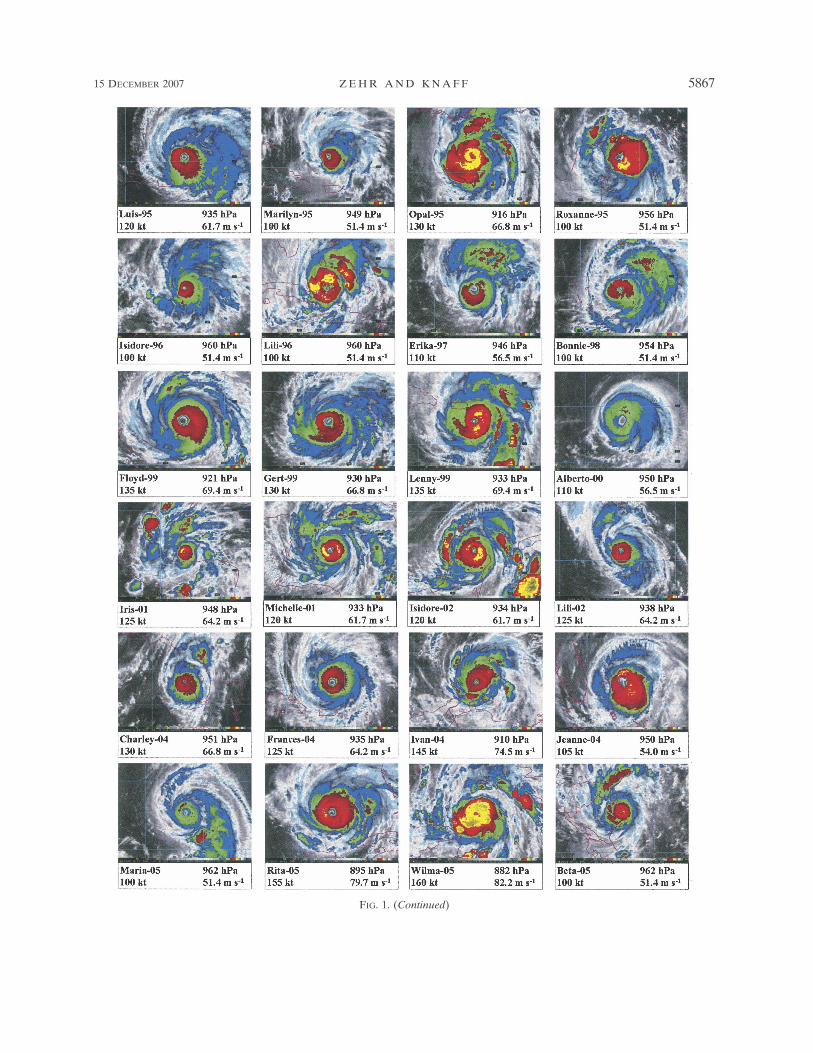
FIG. 1. (Continued)
15 DECEMBER 2007 Z E H R A N D K N A F F 5867
Fig 1 (cont ) live 4/C

The 11-yr 1995–2005 sample is used to document ba-sic characteristics of Atlantic major hurricanes. The1995–2005 period was chosen because of the increasedfrequency of major hurricanes and the availability ofthe IR satellite archive (Zehr 2000; Mueller et al. 2006).Using “best track” data (Jarvinen and Neumann 1979),ordered lists of various parameters associated with eachof the 45 major hurricanes have been compiled. Forexample, the lowest minimum sea level pressure(MSLP) with each hurricane ranges from 882 hPa withWilma (2005) to 968 hPa with Hurricane Erin (2001).Along with the best-track data, minimum sea levelpressure estimates from reconnaissance aircraft, opera-tional wind radii estimates, and landfall data from theTropical Prediction Center are used to quantitativelydescribe the characteristics of the major Atlantic hur-ricanes during this period. The geostationary satelliteinfrared (IR) temperature data provide images andsatellite-derived intensity estimates (Dvorak 1984;Velden et al. 1998).
Figure 1 shows color-enhanced IR images of each ofthe 45 Atlantic major hurricanes from 1995 to 2005.They are shown from left to right from the top, in orderof occurrence as hurricane-centered, 4-km-resolutionremapped Mercator images near the time of maximumintensity. The common format allows a quick evalua-tion of both common features and large differences.For example, Hurricane Iris (2001) has a much smallercloud pattern compared with Hurricane Floyd (1999).All of them have well-defined eyes. They all have as-sociated deep clouds with IR temperatures colder than–60°C. Ninety-three percent have some cloud areacolder than –70°C, and 44% have pixels colder than–80°C.
2. By year
Figure 2 shows the number of Atlantic major hurri-canes by year, beginning with 1950. The period 1995–2005 is comparable to the 1950s and early 1960s in num-ber of major hurricanes, while the years between hadfewer major hurricanes. For the 1995–2005 period (Fig.2b), the 2004–05 seasons combined for 13 major hurri-canes, while 1997 and 2002 were the only years belowthe 1950–2005 average of 2.7. The years 1997 and 2002were El Niño years, usually associated with below-average Atlantic hurricane activity (Gray 1984; Land-sea et al. 1999).
3. Within season distribution
The frequency distribution of the 1995–2005 Atlanticmajor hurricane best-track time periods according to
Julian day shows that 72% occurred between Julian day235 (23 August 23; 22 August in leap year) and Julianday 268 (25 September; 24 September in leap year).This intraseasonal distribution agrees closely with theAtlantic major hurricane climatology given by Landsea(1993) and Elsner and Kara (1999). The overall averageAtlantic tropical cyclone occurrence shows a distinctincrease in early August, a mid-September peak andnearly all activity occurring in June through November(Neumann et al. 1999). The intraseasonal distributionof major hurricanes is more concentrated, during themore active portion of the season in late August to lateSeptember. The 1995–2005 Atlantic major hurricanesalso have this characteristic active period. Early andlate season major hurricanes were observed in 1995–2005, with the earliest being Hurricane Dennis on 7 July2005, and the latest being Hurricane Lenny on 18 No-vember 1999.
4. Location
The map in Fig. 3 shows where each hurricane waslocated at the time of its maximum intensity. Four ofthe category 5 hurricanes were located rather close to-
FIG. 2. Number of Atlantic major hurricanes by year: (a)1950–2005 and (b) 1995–2005.
5868 J O U R N A L O F C L I M A T E VOLUME 20
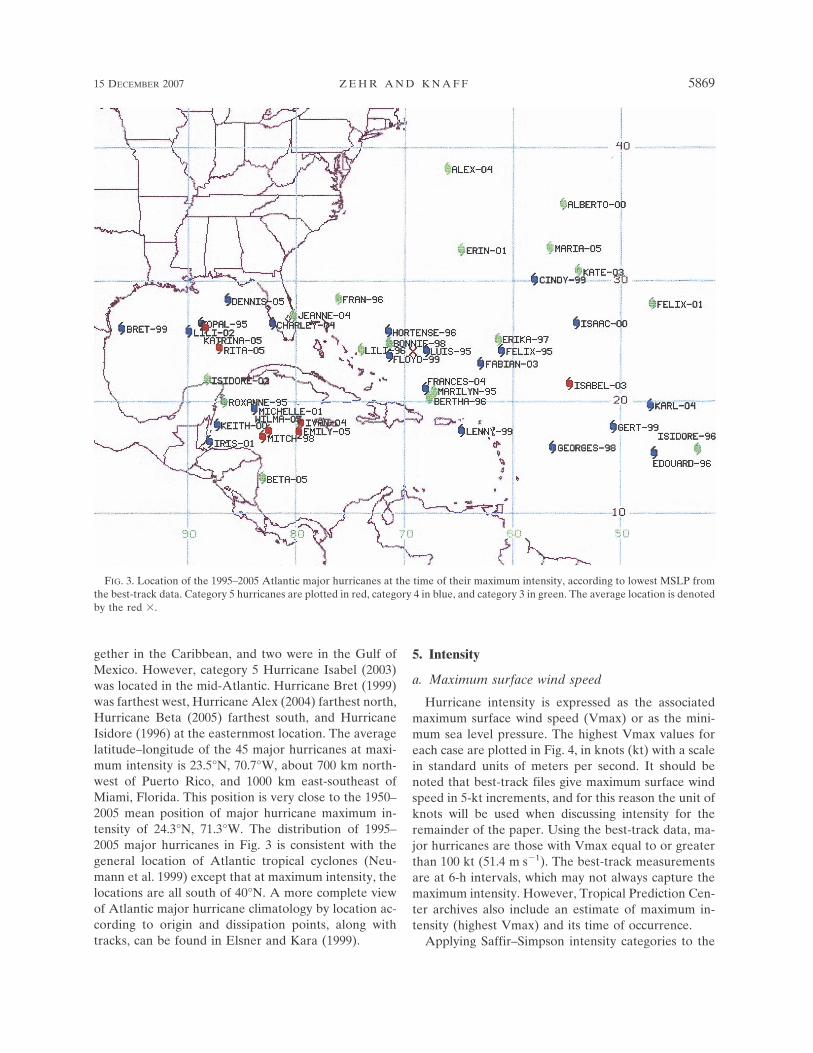
gether in the Caribbean, and two were in the Gulf ofMexico. However, category 5 Hurricane Isabel (2003)was located in the mid-Atlantic. Hurricane Bret (1999)was farthest west, Hurricane Alex (2004) farthest north,Hurricane Beta (2005) farthest south, and HurricaneIsidore (1996) at the easternmost location. The averagelatitude–longitude of the 45 major hurricanes at maxi-mum intensity is 23.5°N, 70.7°W, about 700 km north-west of Puerto Rico, and 1000 km east-southeast ofMiami, Florida. This position is very close to the 1950–2005 mean position of major hurricane maximum in-tensity of 24.3°N, 71.3°W. The distribution of 1995–2005 major hurricanes in Fig. 3 is consistent with thegeneral location of Atlantic tropical cyclones (Neu-mann et al. 1999) except that at maximum intensity, thelocations are all south of 40°N. A more complete viewof Atlantic major hurricane climatology by location ac-cording to origin and dissipation points, along withtracks, can be found in Elsner and Kara (1999).
5. Intensity
a. Maximum surface wind speed
Hurricane intensity is expressed as the associatedmaximum surface wind speed (Vmax) or as the mini-mum sea level pressure. The highest Vmax values foreach case are plotted in Fig. 4, in knots (kt) with a scalein standard units of meters per second. It should benoted that best-track files give maximum surface windspeed in 5-kt increments, and for this reason the unit ofknots will be used when discussing intensity for theremainder of the paper. Using the best-track data, ma-jor hurricanes are those with Vmax equal to or greaterthan 100 kt (51.4 m s�1). The best-track measurementsare at 6-h intervals, which may not always capture themaximum intensity. However, Tropical Prediction Cen-ter archives also include an estimate of maximum in-tensity (highest Vmax) and its time of occurrence.
Applying Saffir–Simpson intensity categories to the
FIG. 3. Location of the 1995–2005 Atlantic major hurricanes at the time of their maximum intensity, according to lowest MSLP fromthe best-track data. Category 5 hurricanes are plotted in red, category 4 in blue, and category 3 in green. The average location is denotedby the red �.
15 DECEMBER 2007 Z E H R A N D K N A F F 5869
Fig 3 live 4/C
1995–2005 Atlantic hurricanes, there are seven (16%)category 5 hurricanes, 21 (47%) category 4, and 17 (38%)category 3 hurricanes. The long-term (1950–2005) av-erage distribution of highest Vmax is as follows: cat-egory 5, 16%; category 4, 37%; and category 3, 47%.
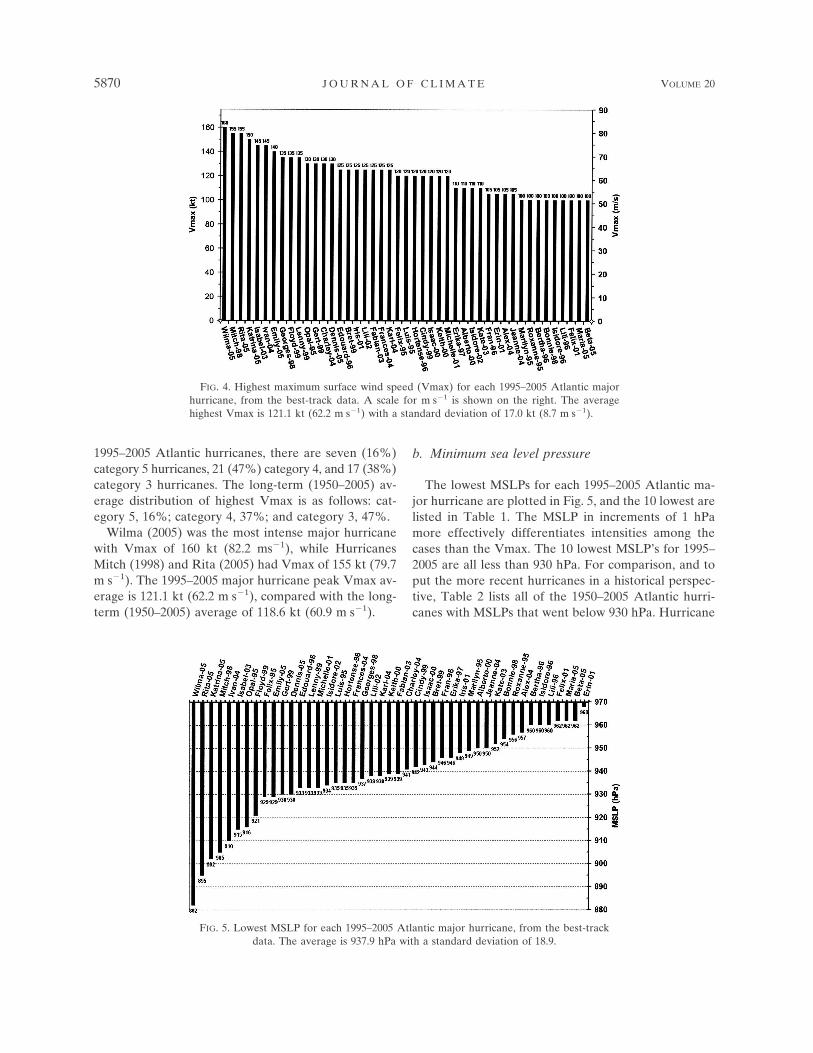
Wilma (2005) was the most intense major hurricanewith Vmax of 160 kt (82.2 ms�1), while HurricanesMitch (1998) and Rita (2005) had Vmax of 155 kt (79.7m s�1). The 1995–2005 major hurricane peak Vmax av-erage is 121.1 kt (62.2 m s�1), compared with the long-term (1950–2005) average of 118.6 kt (60.9 m s�1).
b. Minimum sea level pressure
The lowest MSLPs for each 1995–2005 Atlantic ma-jor hurricane are plotted in Fig. 5, and the 10 lowest arelisted in Table 1. The MSLP in increments of 1 hPamore effectively differentiates intensities among thecases than the Vmax. The 10 lowest MSLP’s for 1995–2005 are all less than 930 hPa. For comparison, and toput the more recent hurricanes in a historical perspec-tive, Table 2 lists all of the 1950–2005 Atlantic hurri-canes with MSLPs that went below 930 hPa. Hurricane
FIG. 4. Highest maximum surface wind speed (Vmax) for each 1995–2005 Atlantic majorhurricane, from the best-track data. A scale for m s�1 is shown on the right. The averagehighest Vmax is 121.1 kt (62.2 m s�1) with a standard deviation of 17.0 kt (8.7 m s�1).
FIG. 5. Lowest MSLP for each 1995–2005 Atlantic major hurricane, from the best-trackdata. The average is 937.9 hPa with a standard deviation of 18.9.
5870 J O U R N A L O F C L I M A T E VOLUME 20

Wilma (2005) had the lowest MSLP of 882 hPa, whichbroke the previous all-time record for Atlantic hurri-canes of 888 hPa with Hurricane Gilbert in 1988 (Wil-loughby et al. 1989). Elsner and Kara (1999) providedocumentation on sea level pressure observed withU.S. landfalling major hurricanes prior to 1950.
c. Pressure–wind relationship
It is important to make note of the source of thebest-track MSLP as to whether it was based on an air-craft measurement or a satellite intensity estimate.With the satellite estimate, a standard pressure–windrelationship (Dvorak 1984) is used to assign the MSLP.The “pressure–wind relationship” quantitatively asso-ciates Vmax and MSLP. With the sample of 45 lowestMSLP, 32 cases were based on aircraft measurements,while 13 were from satellite intensity estimates.
Figure 6 shows the lowest MSLP versus highestVmax for each of the 45 cases, along with a line depict-ing the Dvorak pressure–wind relationship. The pointsthat are aligned near this line include those 13 cases forwhich aircraft observations were not available at thetime maximum intensity. The scatter of the indepen-dently estimated MSLP shows the impact of aircraftdata. As additional illustration of the impact of the air-craft data, the same thing is plotted in Fig. 7 for the1995–2005 eastern Pacific major hurricanes, which arenot routinely observed with aircraft. The single outlierin Fig. 7 was in fact supported by aircraft data withHurricane Juliette in 2001. An aircraft mission wasflown near the time of maximum intensity.
d. Delta-p
The data in Figs. 4–6 show that deviations from thepressure–wind relationship not only influence a hurri-cane’s intensity ranking, but also define a measurablehurricane characteristic according to those deviations.For example, Hurricane Georges (1998) is in the top 10in terms of its Vmax of 135 kt (69.4 m s�1), while rank-
ing 20th in terms of MSLP (937 hPa). In contrast, Hur-ricane Felix (1995) is in the 10 most intense hurricaneswith an MSLP of 929 hPa, while its Vmax is at themedian value of 120 kt (61.7 m s�1).
Figure 8 is a plot of the deviations of observed MSLPfrom the MSLP specified by the Dvorak (1984) pres-sure–wind relationship and the Vmax, using the datafrom Fig. 6. Hurricane Wilma (2005) with an MSLP of882 hPa, has a Vmax of 160 kt (82.2 m s�1) that thepressure–wind relationship associates with 900.8 hPa,giving the –18.8 hPa deviation shown in Fig. 8. Simi-larly, Hurricanes Opal (1995), Felix (1995), and Isidore(2002) have comparable deviations of the same sign andmagnitude. In contrast, Hurricane Erin (2001) has anMSLP of 968 hPa, and the MSLP computed by applyingthe pressure–wind relationship to a Vmax of 105 kt(54.0 m s�1) is 956 hPa, giving a �12 hPa deviation.Hurricanes Georges (1998), Charley (2004), and Iris(2001) have similar deviations in the �8 to �10 hParange.
Comparing the two major hurricanes in 2002, Lili isthe more intense hurricane in terms of Vmax with 125kt (64.2 m s�1) versus Isidore’s 110 kt (56.5 m s�1).However, if MSLP is used to measure intensity, Isidoreis the more intense hurricane with 934 hPa compared toLili’s 938 hPa.
TABLE 1. Ten lowest MSLPs (hPa) with 1995–2005 Atlanticmajor hurricanes.
Hurricane MSLP
1) Wilma (2005) 8822) Rita (2005) 8953) Katrina (2005) 9024) Mitch (1998) 9055) Ivan (2004) 9106) Isabel (2003) 9157) Opal (1995) 9168) Floyd (1999) 9219) Felix (1995) 929
10) Emily (2005) 929
TABLE 2. Lowest MSLPs (hPa) with 1950–2005 Atlantichurricanes, with MSLP less than 930 hPa.
Hurricane MSLP
1) Wilma (2005) 8822) Gilbert (1988) 8883) Rita (2005) 8954) Allen (1980) 8995) Katrina (2005) 9026) Camille (1969) 9057) Mitch (1998) 9058) Ivan (2004) 9109) Janet (1955) 914
10) Isabel (2003) 91511) Opal (1995) 91612) Hugo (1989) 91813) Hattie (1961) 92014) Gloria (1985 92015) Floyd (1999) 92116) Andrew (1992) 92217) Beulah (1967) 92318) David (1979) 92419) Anita (1977) 92620) Esther (1961) 92721) Gabrielle (1989) 92722) Carmen (1974) 92823) Carol (1953) 92924) Inez (1966) 92925) Felix (1995) 92926) Emily (2005) 929
15 DECEMBER 2007 Z E H R A N D K N A F F 5871

The best-track datasets provide a measure of howclosely a hurricane’s Vmax and MSLP fit the pressure–wind relationship provided that aircraft observationsare available. The aircraft data provide independentobservations of Vmax and MSLP. When aircraft orother pertinent data are not available, the satellite in-tensity estimates along with a pressure–wind relation-ship are used to assign Vmax and MSLP, so that inde-pendent Vmax and MSLP are unavailable for the best-track data.
Defining the pressure–wind relationship for Vmax asa function of MSLP or vice versa gives a line of best fitto observations of each parameter. However, the de-gree to which best-track data agree with a pressure–wind relationship is mainly an indicator of whether ornot independent observations of Vmax and MSLP wereavailable. A more refined pressure–wind relationshipwould quantify not only the associated average or mostlikely value, but also the expected variability. Anotherway to refine the pressure–wind relationship is with
FIG. 6. Scatterplot of highest Vmax and lowest MSLP for each 1995–2005 Atlantic majorhurricane from the best-track data. The line is the pressure–wind relationship from Dvorak(1984). Those cases that were measured by aircraft are plotted as circles, and those with noaircraft observations are squares. Some of the points are for multiple cases with identicalvalues.
FIG. 7. Same as in Fig. 6, but for each 1995–2005 eastern Pacific major hurricane.
5872 J O U R N A L O F C L I M A T E VOLUME 20

additional measurements. For example, defining a“delta-p” as environmental pressure (p-env) minusMSLP, allows the pressure–wind relationship to be ex-pressed in terms of Vmax and delta-p, along with anobservation of p-env.
To evaluate the pressure–wind relationship for the 451995–2005 Atlantic major hurricanes near the time oftheir maximum intensity, several steps were taken toobtain an improved dataset.
1) Vmax–MSLP pairs were used that have matchingtimes in the best-track data. Some of the data inFigs. 6 and 8 are for Vmax and MSLP from the samehurricane but at different times.
2) Only Vmax–MSLP pairs are used that are based onaircraft observations.
3) Additional Vmax–MSLP pairs from the best trackhave been added using major hurricanes with mul-tiple intensity maxima, or those that had clearly dif-ferent pressure–wind relationships at differenttimes. This results in a dataset of 52 Vmax–MSLPpairs.
4) An environmental pressure (p-env) was computedfor each Vmax–MSLP pair. The relationship be-tween hurricane wind speed and sea level pressure isdescribed by simple conceptual and empirical mod-els (Holland 1980). The environmental sea levelpressure is used in those models, along with theMSLP, to parameterize the radial pressure gradient.It is likely best measured by averaging the pressureanalysis over a broad ring surrounding the hurri-
cane. For this study, environmental pressure (p-env)is defined as the average sea level pressure in thehurricane centered area with a radius of 800 to 1000km. Reanalysis data (Kalnay et al. 1996) for the timeof each Vmax–MSLP pair are used to compute p-env. Delta-p is defined as p-env minus MSLP.
Figure 9 is a plot of the pressure deviations with the52 Vmax–MSLP pairs and it appears similar to Fig. 8.The average pressure deviation is –3.7 hPa with a stan-dard deviation of 8.7, compared with �3.1 hPa and astandard deviation of 7.1 with the data in Fig. 8. Thereis a bit less agreement with the pressure–wind relation-ship with the Fig. 9 dataset, because Fig. 8 includesthose 13 cases, for which no aircraft data were avail-able.
The environmental pressure ( p-env) with eachVmax–MSLP pair ranges from 1006.8 hPa with Hurri-cane Opal (1995) to 1021.6 hPa with Hurricane Erin(2001), and the average p-env is 1013.2 hPa. With Opalthe low p-env of 1006.8 hPa partly explains its unusuallynegative deviation of MSLP from the pressure–windrelationship. Likewise, Erin’s p-env of 1021.9 explainsmuch of its anomalously high MSLP, given the Vmax.
Figure 10 is the corresponding plot of the 52 Vmax–MSLP pairs using delta-p instead of MSLP. The aver-age pressure deviation of �3.7 hPa is reduced to �0.9hPa by using delta-p. Table 3 lists the averages andstandard deviations of the observed MSLP differencesfrom pressure–wind relationship (Dvorak 1984) withthe three datasets shown in Figs. 8–10.
FIG. 8. Pressure deviations for each 1995–2005 Atlantic major hurricane according to theMSLP-observed minus the MSLP specified by Vmax and the Dvorak (1984) pressure–windrelationship. The lowest MSLP and highest Vmax from the best-track data (Figs. 4–6) areused. The points are plotted left to right in order of decreasing Vmax. The average is –3.1 hPawith a standard deviation of 7.1.
15 DECEMBER 2007 Z E H R A N D K N A F F 5873

The Dvorak (1984) pressure–wind relationship usedhere and plotted in Figs. 6–7 is approximated by
MSLP � 1021.36 � 0.36�Vmax� � �Vmax�20.16�2.
�MSLP in hPa and Vmax in kt�.
This is a least squares fit to the pressure–wind tablein Dvorak (1984). This relationship can be equivalently
quantified as delta-p, using a p-env of 1016 hPa, follow-ing the method developed in Knaff and Zehr (2007):
delta-p � �5.36 � 0.36�Vmax� � �Vmax�20.16�2.
This is used along with observed delta-p to computethe pressure deviations plotted in Fig. 10. The results inFig. 9 indicate that the Dvorak (1984) pressure–windrelationship has a small bias (3.7 hPa) toward lower
FIG. 9. Deviations of MSLP-observed and the MSLP specified by Vmax and the Dvorak(1984) pressure–wind relationship for the pressure–wind dataset of 52 cases. Each point isplotted in date–time order and labeled yy-A-n, where yy is the 2-digit year, A is the first letterof the hurricane name, and n is the number of data points from the same hurricane if thereare more than one. The average pressure deviation is –3.7 hPa with a standard deviationof 8.7.
FIG. 10. Deviations of delta-p-observed and the delta-p specified by Vmax and the Dvorak(1984) pressure–wind relationship for the pressure–wind dataset of 52 cases. The averagepressure deviation is –0.9 hPa with a standard deviation of 7.8.
5874 J O U R N A L O F C L I M A T E VOLUME 20

MSLP, when applied to this sample of major hurri-canes. By using an observed p-env and a pressure–windrelationship expressed as a delta-p, this bias is reducedto 0.9 hPa; however, the scatter of the points is onlyslightly reduced (Table 3). The 2.8-hPa difference be-tween the average pressure deviation in Figs. 9 and 10(see Table 3) matches the difference between theDvorak relationship’s assumed p-env of 1016 hPa andthe average observed p-env of 1013.2.
Erickson (1972) showed that different pressure–windrelationships were needed for the western North Pacificbasin versus the Atlantic basin. Dvorak’s subsequentpublications (Dvorak 1975, 1984) recommended use ofsatellite intensity assignments along with pressure–windrelationships for both the Atlantic and western NorthPacific. Harper (2002) discusses the influence of thelower climatological environmental pressure in thewestern North Pacific on the differences in pressure–wind relationships. Documentation on the operationaluse of pressure–wind relationships can be found inGuard et al. (1992), Harper (2002), and Velden et al.(2006).
e. Other influences on the pressure–windrelationship
Weatherford and Gray (1988) showed that tropicalcyclone size as measured by the radial extent of galeforce winds is highly variable for a given intensity. Thisis also true for Atlantic major hurricanes, as will beshown in section 10. Hurricanes Bret (1999), Iris (2001),and Charley (2004) were small hurricanes. Their cloudshields and extent of circulation were distinctly smallerthan average. In Fig. 10 all of those three small hurri-canes (denoted 99-B, 01-I, and 04-C) have delta-psmaller (MSLP higher) than what is indicated by ap-plying the pressure–wind relationship to their Vmax.This indicates that a different pressure–wind relation-ship is likely warranted for small hurricanes. Thesefindings are similar to Guard and Lander (1996) forwestern North Pacific midget tropical cyclones (TCs)
and Love and Murphy (1985) for the subset of Austra-lian northern region storms, which tend to be smallerthan average.
A much larger data sample is needed to thoroughlyinvestigate pressure–wind relationships and identify theinfluences on Vmax and MSLP. Knaff and Zehr (2007)show that an improved pressure–wind relationship canbe derived using a large sample and some additionalmeasurements. Their results use observations of loca-tion (latitude), environmental pressure, storm transla-tion speed, and size to get improved estimates of MSLPfrom the Vmax and vice versa, over a wide range ofintensity.
6. Major hurricane duration
The best-track data provide a measurement of theduration of 100 kt (51.4 m s�1) or greater intensity inincrements of 0.25 days (6 h), plotted in Fig. 11 for1995–2005 Atlantic major hurricanes. While HurricaneOpal (1995) ranks as seventh most intense in terms ofits MSLP (916 hPa), it is a very modest 31st in rankaccording to major hurricane duration. Hurricane Ivan(2004) had the maximum number of major hurricanedays with 10.0, while the average for the 45 cases is 2.7.
The major hurricane duration is influenced by thestorm track in addition to the favorable conditions forintensification. Obviously, those that become majorhurricanes at lower latitude and in the eastern Atlanticaway from large landmasses are more likely to havetracks that remain longer over warm ocean areas, andtherefore a better chance to persist as a major hurri-cane.
7. Intensification rate
a. Best track: 24-h period
It is important to know the rate at which hurricanescan intensify. The standard best track times of 0000,0600, 1200, and 1800 UTC are used to compute twointensity change quantities, –dMSLP-24, the 24-h de-crease of MSLP, and dVmax-24, the 24-h increase inmaximum wind speed. The greatest intensification ratesfor each hurricane are plotted in Figs. 12 and 13. Theaverage maximum intensification rates for the 1995–2005 Atlantic major hurricanes are 34.2 hPa day�1 and41 kt day�1 (21.1 m s�1 day�1), while the extreme val-ues are 97 hPa day�1 and 95 kt day�1 (48.8 m s�1
day�1) with Hurricane Wilma (2005). A more extensivestudy of Atlantic tropical cyclone intensification ratesby Kaplan and DeMaria (2003) documented that “rapid
TABLE 3. Averages and standard deviations of the pressure de-viations from the pressure–wind relationship (Dvorak 1984), for1995–2005 Atlantic major hurricanes (shown in Figs. 8–10).
DatasetAverage
(hPa)Std dev(hPa)
Lowest MSLP–highest Vmax45 cases (see Fig. 8)
�3.1 7.1
MSLP–Vmax pairs52 cases (see Fig. 9)
�3.7 8.7
Delta-p–Vmax pairs52 cases (see Fig. 10)
�0.9 7.8
15 DECEMBER 2007 Z E H R A N D K N A F F 5875

intensification” defined by the 95th percentile of allobserved intensity changes, is associated with 83% ofmajor hurricanes and all hurricanes of Saffir–Simpsoncategory 4 or 5. The 95th percentile rate for dVmax-24from the Kaplan and DeMaria (2003) study is 31 ktday�1 (16.0 m s�1 day�1). Similar results are found withthe maximum intensification rates of the 1995–2005 ma-jor hurricanes, plotted in Fig. 13. Sixty-nine percenthave dVmax-24 of at least 35 kt day�1 (18.0 ms�1
day�1) and 91% are at least 30 kt day�1 (15.4 m s�1
day�1), which is the Kaplan and DeMaria (2003)
threshold for “rapid intensification.” Of the 28 hurri-canes that are category 4 or higher, all of the maximumintensification rates are at least 25 hPa day�1 and 30 ktday�1 (15.4 m s�1 day�1).
b. Aircraft center fixes: 12-h period
Aircraft reconnaissance center fix sea level pressure(MSLP) observations provide additional insight on in-tensification rates due to the reliability of more directmeasurements and typical observation intervals less
FIG. 11. Major hurricane duration (IH-Days) for each 1995–2005 Atlantic major hurricane,using best-track data. The IH-Days average is 2.7 with a standard deviation of 2.5.
FIG. 12. Highest intensification rate according to 24-h change of MSLP (�dMSLP-24) foreach 1995–2005 Atlantic major hurricane, using best-track data. The average �dMSLP-24 is34.2 hPa with a standard deviation of 14.5.
5876 J O U R N A L O F C L I M A T E VOLUME 20

than 6 h. With the 1995–2005 category 4–5 Atlantichurricanes, 18 had intensification periods that were wellobserved by aircraft. The largest 12-h MSLP decreasesusing linear interpolation with available aircraft obser-vations (�dMSLP-12) are plotted in Fig. 14. The 12-hinterval generally results in faster intensification ratesthan the 24-h computations. The average of the 18 caseswas 63.4 hPa day�1, with a median value of 54 hPaday�1, while Hurricane Wilma (2005) had a remarkable
175 hPa day�1 intensification rate over a 12-h period.Using the 6-h fixed time intervals of the best-track data,Wilma’s maximum 12-h MSLP decrease is 83 hPa (166hPa day�1). The Tropical Prediction Center’s TropicalCyclone Report on Wilma (Pasch et al. 2006) has adiscussion of this record breaking intensification rate,and they note that over a shorter period, an intensifi-cation rate of 9.9 hPa h�1 (237.6 hPa day�1) was re-corded.
FIG. 13. Highest intensification rate according to 24-h change of Vmax (dVmax�24) foreach 1995–2005 Atlantic major hurricane using best-track data. The average dVmax�24 is41.0 kt day�1 (21.1 m s�1 day�1) with a standard deviation of 13.2 (6.8).
FIG. 14. Highest intensification rate according to 12-h change of aircraft observations ofMSLP (�dMSLP-12) for the 1995–2005 Atlantic category 4–5 hurricanes. The average–dMSLP-12 is 63.4 hPa day�1 with a standard deviation of 30.8.
15 DECEMBER 2007 Z E H R A N D K N A F F 5877

8. Storm motion
The velocity of the hurricane center location is re-ferred to as the “storm motion.” The storm motions atthe time of maximum intensity for the 1995–2005 At-lantic major hurricanes were compiled from the Tropi-cal Prediction Center Advisories when available andalternatively from the 6-h best-track positions. Thestorm motion vectors are listed in Table 4. The averagevector is toward 325 degrees at 5.8 m s�1 (11.3 kt), in-dicating that on average major hurricanes attain maxi-mum intensity prior to recurvature. However, the mainfeature of this storm motion dataset is the high vari-ability. The standard deviation of storm motion speed is2.4 m s�1 (4.7 kt). In fact, 11 of the 45 cases have anortheastward component of motion at maximum in-tensity. The speed of motion ranged from zero (i.e.,nearly stationary) with Hurricane Keith (2000) to 11.5m s�1 (22 kt) with Hurricanes Lili (1996) and Alex(2004).
9. IR image measurements
a. Digital Dvorak technique
Dvorak (1984) proposed a method for estimating in-tensity based on IR pixel temperatures. The samemethod has been applied to 30-min interval IR imageswith all forty-five 1995–2005 Atlantic major hurricanes,except that multiple radius measurements of the sur-rounding temperature were employed. For major hur-ricanes, the algorithm is very similar to the ObjectiveDvorak Technique (ODT) described in Velden et al.(1998), and the Advanced Objective Dvorak Technique(Olander and Velden 2004, 2007).
The digital Dvorak intensity estimates are shown inFig. 15 as T-No.-6 (the maximum 6-h running mean ofthe Dvorak intensity) and in Fig. 16a as T-max (themaximum single image Dvorak intensity number). Thedigital Dvorak intensities (T-numbers) are specified tothe nearest 0.1. Table 5 lists the T-number conversionto maximum surface wind speed for the range of valuesin Figs. 15–16. The T-No.-6 values ranged from a highof T7.6 with Hurricane Wilma (2005) to a low of T5.6with Hurricane Felix (2001), averaging T6.6 for all1995–2005 Atlantic major hurricanes.
The IR measurements comprising the objective in-tensity estimates are plotted in Fig. 16 and summarizedin Table 6. Surr-T is the “surrounding temperature”defined as the warmest IR pixel temperature on thecoldest circle, and it ranges from –58.2° to –81.2°C, av-eraging –71.3°C. The Eye-T is the warmest IR pixeltemperature in the eye. Cloud-free eyes have tempera-tures in the 15°–20°C range, a few degrees cooler than
the ocean surface due to water vapor attenuation. Theaverage Eye-T is 1.0°C with a median value of 10.8°C.There is a large eye temperature range from 20.3°Cwith Hurricane Rita (2005) to �65.2°C with HurricaneBeta (2005). Eye temperatures in the 0°–15°C range aretypically observed with low-level clouds within the eye.A few major hurricanes have colder Eye-T values. With
TABLE 4. Storm motion directions and speeds in m s�1 and kt,at the time of maximum intensity. Directions are in degrees ofdirection toward which the hurricane center is moving. The aver-age direction and speed is toward 325 degrees at 5.8 m s�1 (11.3kt), with a standard deviation of 2.4 m s�1 (4.7 kt).
Name (year) Direction Speed (ms�1) Speed (kt)
Felix (1995) 310 5.7 11Luis (1995) 335 8.2 16Marily (1995) 330 5.1 10Opal (1995) 35 8.2 16Roxanne (1995) 275 4.6 9Bertha (1996) 305 8.7 17Edouard (1996) 295 6.2 12Fran (1996) 335 5.7 11Hortense (1996) 10 6.7 13Isidore (1996) 325 5.7 11Lili (1996) 65 11.3 22Erika (1997) 25 6.7 13Bonnie (1998) 325 2.6 5Georges (1998) 280 7.7 15Mitch (1998) 290 3.6 7Bret (1999) 315 4.6 9Cindy (1999) 335 4.1 8Floyd (1999) 275 5.1 10Gert (1999) 275 4.6 9Lenny (1999) 50 4.1 8Alberto (2000) 75 8.2 16Isaac (2000) 315 7.7 15Keith (2000) 0 0 0Erin (2001) 330 5.7 11Felix (2001) 50 6.2 12Iris (2001) 260 8.2 16Michelle (2001) 10 1.5 3Isidore (2002) 255 3.6 7Lili (2002) 315 7.2 14Fabian (2003) 330 4.1 8Isabel (2003) 270 4.1 8Kate (2003) 280 5.1 10Alex (2004) 65 11.3 22Charley (2004) 15 9.8 19Frances (2004) 285 7.7 15Ivan (2004) 285 3.6 7Jeanne (2004) 280 5.7 11Karl (2004) 340 5.1 10Dennis (2005) 340 8.2 16Emily (2005) 295 8.2 16Katrina (2005) 315 5.7 11Maria (2005) 020 3.1 6Rita (2005) 280 4.1 8Wilma (2005) 300 3.1 6Beta (2005) 245 3.6 7
5878 J O U R N A L O F C L I M A T E VOLUME 20

weaker hurricanes, this is commonly observed, withhigh clouds covering the eye. However, with major hur-ricanes it may also be due to a very small eye or poorviewing angle, limiting the capability of the IR sensor to
view directly down to the low levels, as with HurricanesOpal (1995), Charley (2004), and Wilma (2005). WithHurricane Beta, the eye was both very small and partlycloud covered.
FIG. 15. Digital Dvorak technique maximum intensity (T-No.-6) for each 1995–2005 At-lantic major hurricane. The 6-h running mean of T numbers is used. The average T-No.-6 is6.6 with a standard deviation of 0.5.
FIG. 16. Digital Dvorak technique associated measurements. (a) Single image maximum (T-max). (b) Surroundingtemperature (°C) (Surr-T). (c) Eye temperature (°C) (Eye-T). (d) Radius (km) of coldest Surr-T (R-coldest).
15 DECEMBER 2007 Z E H R A N D K N A F F 5879

Here R-coldest is the radius of the circle with thecoldest temperatures, as defined by the “surroundingtemperature.” The R-coldest radii are given in incre-ments of 4 km corresponding to the approximate reso-lution of the IR sensor. The inner radius is assigned asR-coldest when multiple radii have the same surround-ing temperature. R-coldest averaged 62.4 km, with abroad range from 28 km for Hurricane Iris (2001), avery small hurricane, to 100 km for Hurricane Alberto(2000), which had a large eye. Data are shown in sec-tion 10 relating R-coldest and the radius of maximumwind.
The digital Dvorak intensities are compared withbest-track Vmax in Fig. 17, according to the overallmaximum for the entire hurricane period. In Fig. 18, thedigital Dvorak intensity is converted to MSLP accord-ing to the Dvorak (1984) pressure–wind relationshipand plotted against the best-track MSLP interpolatedto the same time as the digtial Dvorak maximum. BothFigs. 17 and 18 include the 13 cases for which intensitywas analyzed without aircraft observations. There is ageneral tendency for the digital Dvorak to give inten-sities that are stronger (lower MSLP) than the besttrack. However, with several notable hurricanes, it in-dicates less intense hurricanes than the best track. Hur-ricane Charley (2004) with respect to Vmax (Fig. 17),and Hurricanes Opal (1995) and Wilma (2005) withMSLP (Fig. 18) have the largest digital Dvorak under-estimates of maximum intensity. The underestimateswith Opal, Charley, and Wilma are likely due to thesmall eyes and resulting colder-than-average eye tem-peratures, as previously discussed.
With Hurricane Opal (1995), the maximum intensityfrom the digital Dvorak technique converted to MSLPis 938 hPa, considerably less intense than the best-trackMSLP of 916 hPa. However, in terms of Vmax, thesatellite intensity estimate is only 2.6 m s�1 (5 kt) lessthan the best track Vmax of 66.8 ms�1 (130 kt). Thisshows that validation of the digital Dvorak techniquewith Vmax versus MSLP can give different results whenlarge deviations from the Dvorak (1984) pressure–windrelationship are observed.
Hurricanes Keith (2000) and Michelle (2001) havedigital Dvorak estimates exceeding the best-track maxi-mum by at least 10.3 m s�1 (20 kt). It is interesting tonote that these were unusually slow-moving hurricanes(Table 4), and that the satellite algorithm does not ac-count for variations of storm motion but assumes asample mean value.
A more thorough validation of the digital Dvoraktechnique and the ODT is given by Velden et al. (1998).The differences between the satellite-derived and best-track intensities shown in Figs. 17–18 suggest a highbias in the digital Dvorak technique’s intensities (lowbias in MSLP estimates). It is more pronounced withcategory 3 hurricanes and becomes less with higher in-tensities. This characteristic merits further investigationto see if it is present in an expanded dataset. A credibleevaluation of the performance and accuracy of the digi-tal Dvorak and the ODT requires a greatly expandeddataset using both MSLP and Vmax, with cases that arewell observed by aircraft.
b. IR cold cloud areas
Along with the digital Dvorak IR temperatures, theimages can be further quantified by computing the per-cent area coverage of pixels colder than a thresholdtemperature, which give a measure of the amount andintensity of deep convection. Figure 19 shows the arealcoverage of IR cloud colder than –60°C within 4 de-grees latitude (444 km) of the center, which averages24.3% and ranges from a maximum of 58.2% for Hur-ricane Wilma (2005) to a 5.7% minimum for HurricaneErin (2001). With a –70°C temperature and a 2-degrees-latitude (222 km) radius (Fig. 20), the percent coverageaverages 29% with a maximum of 87.9% for Wilma.
Even though there is a small tendency for more ma-jor hurricanes to have larger IR cold cloud areas, largedifferences are observed with a few hurricanes of com-parable intensity. Some category 4 hurricanes [Hurri-canes Iris (2001), Bret (1999), and Charley (2004)] havesmall cold cloud areas while weaker hurricanes havelarger cold cloud areas. For example, Hurricane Isidore(2002) with a Vmax of 110 kt (57 m s�1) ranked seventh
TABLE 6. IR measurements with digital Dvorak technique forthe single image maximum (T-max). Average, standard deviation,maximum, minimum for T-max, Surr-T, Eye-T, and R-coldest.
T-maxSurr-T(°C)
Eye-T(°C)
R-coldest(km)
Average 6.8 �71.3 1.0 62.4Standard deviation 0.47 4.6 21.0 18.3Maximum 7.8 �58.2 20.3 100Minimum 6.0 �81.2 �65.2 28
TABLE 5. Conversion of Dvorak T-No. to maximum surfacewind speed.
T-No.Max wind
speed (m s�1)Max windspeed (kt)
5.5 52.4 1026.0 59.1 1156.5 65.3 1277.0 71.9 1407.5 79.7 1558.0 87.4 170
5880 J O U R N A L O F C L I M A T E VOLUME 20

with 36.7% of the 0–444-km area colder than –60°C,while Hurricane Charley at 130 kt (67 m s�1) has only12.6% coverage. Several category 3 hurricanes [Hurri-canes Roxanne (1995), Bertha (1996), Erika (1997),and Bonnie (1998)] have above-average cloud areacolder than –60°C. Much of this IR cloud area variabil-ity is clearly related to hurricane size, which is discussedalong with wind radii measurements next in section 10.
10. Wind radii and size
a. R-34 and R-50
Several different parameters have been used to indi-cate hurricane size. The outer closed isobar of the sealevel pressure analysis, the zero line of cyclonic tangen-tial wind, and various surface wind isotachs all varyaccording to the radial extent of the hurricane’s surface
FIG. 17. Best track minus digital Dvorak technique maximum intensity according to thehighest Vmax in the best track and the hurricane maximum digital Dvorak (Fig. 15). Windspeed differences are plotted left to right in order of intensity given by highest Vmax (Fig. 4).Positive values indicate the digital Dvorak underestimates Vmax compared with the besttrack, and negative values are overestimates.
FIG. 18. Digital Dvorak technique minus best-track maximum intensity, according to MSLPinterpolated to time of maximum intensity using the digital Dvorak. The differences areplotted left to right in order of digital Dvorak intensity (Fig. 15). Positive values indicate thatdigital Dvorak is underestimating intensity (too high MSLP) compared with the best track andnegative values are overestimates (too low MSLP).
15 DECEMBER 2007 Z E H R A N D K N A F F 5881

circulation. Tropical cyclone size is not well related tointensity and the size often continues to increase fol-lowing the time of maximum intensity (Weatherfordand Gray 1988; Maclay 2006). The advisories issued bythe Tropical Prediction Center include estimates of theradial extent of winds greater than 34 (17.5 m s�1) (R-34) and 50 kt (25.7 m s�1) (R-50) in quadrants. Thequadrant values were averaged at the best-track time ofmaximum intensity for the forty-five 1995–2005 Atlan-tic major hurricanes and are plotted in Fig. 21 (R-34)and Fig. 22 (R-50). High variability and large ranges areshown by the wind radii.
The size differences that can occur among major hur-ricanes are shown by comparing the wind radii values oflarge hurricanes [Hurricanes Luis (1995), Cindy (1999),and Erika (1997)] with the small values associatedwith Hurricanes Iris (2001), Bret (1999), Charley(2004), and Beta (2005). R-34 ranges from 427 km withCindy (1999) to 93 km with Beta. R-50 ranges from 278km with Luis to 43 km with Iris. The averages andstandard deviations of R-50 and R-34 at maximum in-tensity are listed in Table 7 along with the radius ofmaximum wind (RMW), which is discussed in the nextsection.
FIG. 19. Percent of IR pixels ��60°C within 444 km of center, for each 1995–2005 Atlanticmajor hurricane, at the time of their maximum intensity, according to lowest MSLP. Theaverage is 24.3% with a standard deviation of 13.0.
FIG. 20. Percent of IR pixels ��70°C within 222 km of center, for each 1995–2005 Atlanticmajor hurricane, at the time of their maximum intensity, according to lowest MSLP. Theaverage is 29.0% with a standard deviation of 20.0.
5882 J O U R N A L O F C L I M A T E VOLUME 20

b. RMW
Estimates of the RMWs based on aircraft radar, air-craft flight level winds, and satellite images are includedin the Tropical Prediction Center Advisory archives.The RMW at the time of best-track maximum intensityare shown in Fig. 23. The average value of 31.7 km hasan associated standard deviation of 14.4 km (Table 7).Large hurricanes have a tendency toward greaterRMW and vice versa; however, RMW and size are not
closely related. For example, category 5 HurricanesMitch (1998) and Isabel (2003) both have near-averageR-34 and R-50 (Figs. 21–22) but have very differentcorresponding RMWs (13 km for Mitch and 56 km forIsabel).
Along with Hurricane Wilma’s (2005) record lowMSLP and record intensification rates, an unusuallysmall eye and associated RMW were observed (Paschet al. 2006). Based on the aircraft center fix observa-tions and the discussion of Pasch et al. (2006), Wilma’s
FIG. 21. Azimuthal average of the radius of 34-kt (17.5 m s�1) wind speed (R-34), for each1995–2005 Atlantic major hurricane, at the time of their maximum intensity, accordingto lowest MSLP. The average is 250.8 km (135.6 n mi) with a standard deviation of 71.1 km(38.5 n mi).
FIG. 22. Azimuthal average of the radius of 50-kt (25.7 m s�1) wind speed (R-50), for each1995–2005 Atlantic major hurricane, at the time of their maximum intensity, accordingto lowest MSLP. The average is 144.3 km (78.0 n mi) with a standard deviation of 56.2 km(30.4 n mi).
15 DECEMBER 2007 Z E H R A N D K N A F F 5883
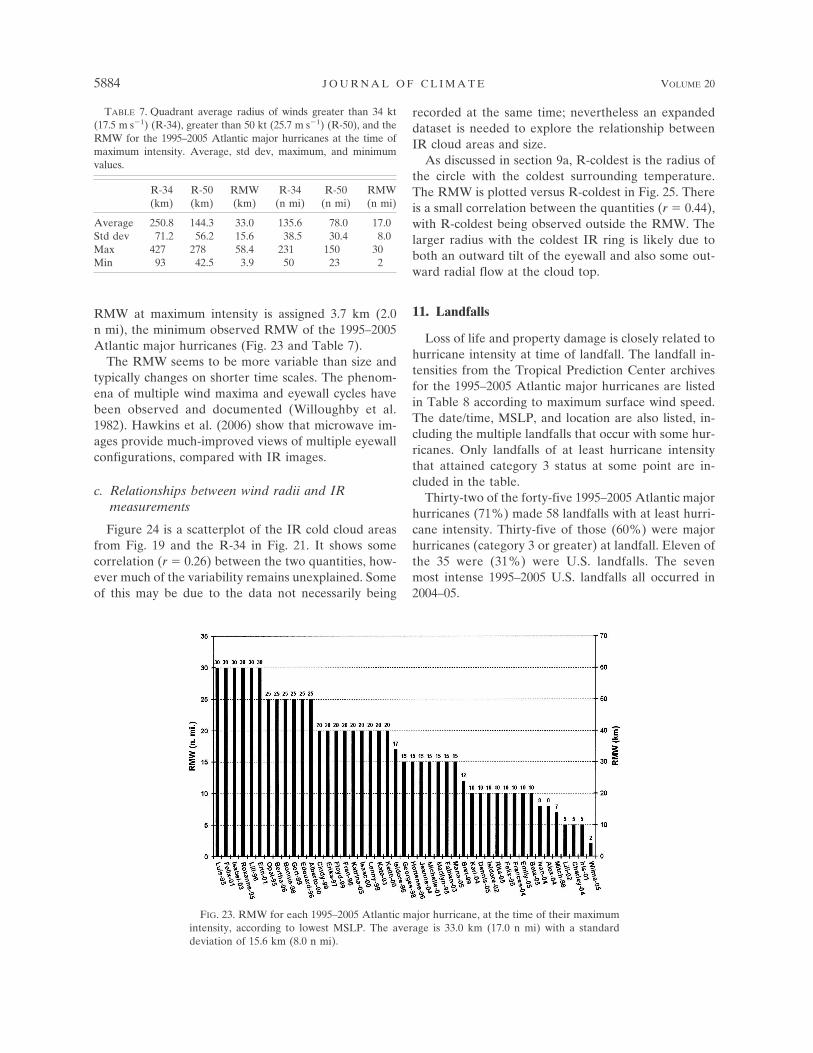
RMW at maximum intensity is assigned 3.7 km (2.0n mi), the minimum observed RMW of the 1995–2005Atlantic major hurricanes (Fig. 23 and Table 7).
The RMW seems to be more variable than size andtypically changes on shorter time scales. The phenom-ena of multiple wind maxima and eyewall cycles havebeen observed and documented (Willoughby et al.1982). Hawkins et al. (2006) show that microwave im-ages provide much-improved views of multiple eyewallconfigurations, compared with IR images.
c. Relationships between wind radii and IRmeasurements
Figure 24 is a scatterplot of the IR cold cloud areasfrom Fig. 19 and the R-34 in Fig. 21. It shows somecorrelation (r � 0.26) between the two quantities, how-ever much of the variability remains unexplained. Someof this may be due to the data not necessarily being
recorded at the same time; nevertheless an expandeddataset is needed to explore the relationship betweenIR cloud areas and size.
As discussed in section 9a, R-coldest is the radius ofthe circle with the coldest surrounding temperature.The RMW is plotted versus R-coldest in Fig. 25. Thereis a small correlation between the quantities (r � 0.44),with R-coldest being observed outside the RMW. Thelarger radius with the coldest IR ring is likely due toboth an outward tilt of the eyewall and also some out-ward radial flow at the cloud top.
11. Landfalls
Loss of life and property damage is closely related tohurricane intensity at time of landfall. The landfall in-tensities from the Tropical Prediction Center archivesfor the 1995–2005 Atlantic major hurricanes are listedin Table 8 according to maximum surface wind speed.The date/time, MSLP, and location are also listed, in-cluding the multiple landfalls that occur with some hur-ricanes. Only landfalls of at least hurricane intensitythat attained category 3 status at some point are in-cluded in the table.
Thirty-two of the forty-five 1995–2005 Atlantic majorhurricanes (71%) made 58 landfalls with at least hurri-cane intensity. Thirty-five of those (60%) were majorhurricanes (category 3 or greater) at landfall. Eleven ofthe 35 were (31%) were U.S. landfalls. The sevenmost intense 1995–2005 U.S. landfalls all occurred in2004–05.
FIG. 23. RMW for each 1995–2005 Atlantic major hurricane, at the time of their maximumintensity, according to lowest MSLP. The average is 33.0 km (17.0 n mi) with a standarddeviation of 15.6 km (8.0 n mi).
TABLE 7. Quadrant average radius of winds greater than 34 kt(17.5 m s�1) (R-34), greater than 50 kt (25.7 m s�1) (R-50), and theRMW for the 1995–2005 Atlantic major hurricanes at the time ofmaximum intensity. Average, std dev, maximum, and minimumvalues.
R-34(km)
R-50(km)
RMW(km)
R-34(n mi)
R-50(n mi)
RMW(n mi)
Average 250.8 144.3 33.0 135.6 78.0 17.0Std dev 71.2 56.2 15.6 38.5 30.4 8.0Max 427 278 58.4 231 150 30Min 93 42.5 3.9 50 23 2
5884 J O U R N A L O F C L I M A T E VOLUME 20

12. The 2005 Atlantic hurricane season
The Atlantic hurricane activity in 2005 was extraor-dinary. In terms of major hurricanes, there were seven(Fig. 2): four category 5, one category 4, and two cat-egory 3 hurricanes. Five of the 12 most intense 1995–2005 hurricanes according to MSLP (Fig. 5) occurred in2005, and three of the five lowest MSLP since 1950(Hurricanes Wilma, Rita, and Katrina) were in 2005.The 24-h MSLP decreases of Rita and Wilma (Fig. 12)exceeded all other 1995–2005 major hurricanes. In fact,
Wilma’s 24-h best-track decrease of MSLP of 97 hPa isremarkably large, compared with the median value forthe 1995–2005 Atlantic major hurricanes of 32 hPa.Thirteen of the 58 landfalls listed in Table 7 were from2005, including the devastating impacts of HurricaneKatrina in Louisiana and Mississippi.
13. Discussion
The best-track, aircraft, and IR satellite datasets pro-vide an overview of the average and extreme measure-
FIG. 24. Scatterplot of the average radius of 34 kt (17.5 m s�1) wind speed (R-34), from Fig.21, vs percent of IR pixels ��60°C within 444 km of center, from Fig. 19. The least squaresbest-fit trend line is shown. Correlation coefficient: r � 0.26.
FIG. 25. Scatterplot of radius of coldest Surr-T (R-coldest) vs R-coldest vs RMW for each1995–2005 Atlantic major hurricane, at the time of their maximum intensity. Correlationcoefficient: r � 0.44.
15 DECEMBER 2007 Z E H R A N D K N A F F 5885

TABLE 8. Landfall intensity for 1995–2005 Atlantic major hurricanes that were at least hurricane intensity at landfall, with date/time(UTC) as mm/dd/hh. Locations are given as Caribbean countries, and U.S./Mexico towns. The number in parentheses is the landfallnumber for hurricanes with multiple landfalls. “Closest approach” intensities are included when the center is within 25 n mi (46 km)of a coastline.
Hurricane Max wind (kt) MSLP (hPa) Date/time Location
1) Ivan (4) 140 916 9/14/0100 Cuba2) Lenny 135 933 11/17/1800 U.S. Virgin Islands3) Ivan (2) 130 924 9/11/0400 Jamaica4) Ivan (3) 130 920 9/12/0400 Grand Cayman Island5) Charley (2) 130 941 8/13/2000 Punta Gorda, FL6) Wilma 130 927 9/22/2145 Cozumel, Mexico7) Iris 125 948 10/9/0200 Belize8) Floyd 120 930 8/14/1900 Bahamas9) Michelle 120 49 11/4/1800 Cuba
10) Dennis 120 941 7/8/1845 Cuba11) Luis 115 945 9/5/1200 Barbuda; St. Martin12) Emily (2) 115 955 7/18/0630 Tulum, Mexico13) Wilma (2) 115 933 9/22/0330 Puerto Morelos, Mexico14) Isidore ’02 110 936 9/22/2100 Yucatan, Mexico15) Lenny (2) 110 966 11/18/1800 St. Martin16) Frances 110 948 9/2/2000 Bahamas17) Ivan 110 952 9/7/2200 Grenada18) Emily (3) 110 944 7/20/1200 San Fernando, Mexico19) Katrina (2) 110 920 8/29/1110 Buras, LA20) Georges 105 962 9/22/1200 Dominican Republic21) Charley 105 966 8/13/0400 Cuba22) Ivan (5) 105 946 9/16/0700 Gulf Shores, AL23) Jeanne (3) 105 950 9/26/0400 Stuart, FL24) Dennis (2) 105 946 7/10/1930 Navarre Beach, FL25) Katrina (3) 105 928 8/29/1445 Waveland, MS26) Wilma (3) 105 950 9/24/1030 Cape Romano, FL27) Opal 100 942 10/4/1200 Pensacola, FL28) Bret 100 951 8/23/0000 Padre Island, TX29) Fabian 100 952 9/5/2000 Bermuda30) Fran 100 954 9/6/0000 Cape Fear, NC31) Roxanne 100 958 10/11/0200 Tolum, Mexico32) Georges (2) 100 966 9/21/0400 Antigua33) Georges (3) 100 968 9/21/2200 Puerto Rico34) Jeanne (2) 100 956 9/25/1400 Bahamas35) Rita 100 937 9/24/0740 Johnson’s Bayou, LA; Sabine Pass, TX36) Bonnie 95 964 8/27/0400 Wilmington, NC37) Floyd (2) 90 956 8/16/0600 Cape Fear, NC38) Isabel 90 957 9/18/1700 Drum Inlet, NC39) Georges (4) 90 964 9/28/1100 Biloxi, MS40) Lili ’02 90 971 10/01/1400 Cuba41) Bertha 90 974 7/12/2000 Wilmington, NC42) Georges (5) 90 981 9/25/1500 Key West, FL43) Frances (2) 90 960 9/5/0500 South Hutchinson Island, FL44) Beta 90 970 10/30/1200 Nicaragua45) Lili ‘96 85 975 10/18/0900 Cuba46) Mitch 85 987 10/29/1200 Honduras47) Michelle (2) 80 973 11/15/1200 Bahamas48) Keith (2) 80 980 10/5/1800 Tampico, Mexico49) Isidore ’02 (2) 75 964 9/20/2100 Cuba50) Emily 75 989 7/14/0700 Grenada51) Marilyn 70 984 9/14/2100 St. Thomas, Virgin Islands52) Hortense 70 989 9/10/0600 Puerto Rico53) Jeanne 70 985 9/16/1100 Dominican Republic54) Charley (3) 70 992 8/14/1400 Cape Romain, SC55) Katrina 70 984 8/25/2330 North Miami Beach, FL56) Keith 65 988 10/2/2300 Belize57) Georges (6) 65 993 9/23/2100 Cuba58) Alex 65 981 8/3/1800 Cape Hatteras, NC
5886 J O U R N A L O F C L I M A T E VOLUME 20

ments that describe Atlantic major hurricanes. The1995–2005 period was chosen for its large sample andthe availability of the IR satellite archive (Zehr 2000;Mueller et al. 2006). Several interesting points andnoteworthy findings are documented by this study.1) The Atlantic major hurricane activity of the 1995–2005 period distinctly exceeds the long-term average,however the locations and intraseasonal distributionsare quite close to the long-term averages. 2) The de-grees to which maximum intensity measurements devi-ate from a pressure–wind relationship are illustrated.3) The exceptional intensification rates of HurricaneWilma (2005) are shown with respect to the more typi-cal major hurricane intensification rates. 4) In additionto the satellite intensity estimates using the digitalDvorak technique, the associated component tempera-tures and cold IR cloud area measurements are docu-mented. 5) Hurricane size as given by the average ra-dius of gale force wind at maximum intensity has anextremely large range from 92.5 to 427.4 km.
This work also illustrates the need for more thoroughinvestigations with expanded datasets on several topics.Specific recommendations are as follows.
1) Deviations of Vmax and MSLP from pressure–windrelationships should be explained according to thehurricane’s structure and environment. To do this,the influence of additional measurements such asenvironmental pressure, size, translation speed, andlatitude need to be quantified (Knaff and Zehr2007). More satellite-based techniques that indepen-dently assign MSLP and Vmax (e.g., Demuth et al.2004, 2006) should be developed for use with bothoperational and best-track data.
2) IR image–derived quantities have been incorpo-rated into statistical intensity forecasts (DeMaria etal. 2005) and rapid intensification forecasts (Kaplanand DeMaria 2003). Refinements to these ap-proaches should be explored as well as additionalsatellite-based nowcast and short-term intensityforecast techniques. The valuable information con-tent of the microwave image data (Hawkins et al.2001) should be combined with the higher spatialand temporal resolution available from the geosta-tionary images.
3) Additional work is needed to perform a thoroughvalidation of the objective Dvorak intensities, in-cluding characteristics such as timing of maximumintensity, the timing of rapid intensification, andbiases as a function of intensity.
4) Improved use of IR satellite image data for windradii assignments, including the radius of maximumwind, should be explored. Recent research studies
(Mueller et al. 2006; Kossin et al. 2007) have dem-onstrated that the IR data are potentially useful foroperational analyses of tropical cyclone structure.
Acknowledgments. This work is supported by NOAAGrants NA90RAH00077 and NA17RJ1228. We thankthe anonymous reviewers for their comments on im-proving the manuscript. The views, opinions, and find-ings in this article are those of the authors and shouldnot be construed as an official NOAA and or U.S. gov-ernment position, policy, or decision.
REFERENCES
DeMaria, M., M. Mainelli, L. K. Shay, J. A. Knaff, and J. Kaplan,2005: Further improvements to the Statistical Hurricane In-tensity Prediction Scheme (SHIPS). Wea. Forecasting, 20,531–543.
Demuth, J. L., M. DeMaria, J. A. Knaff, and T. H. Vonder Haar,2004: Evaluation of Advanced Microwave Sounding Unittropical cyclone intensity and size estimation algorithms. J.Appl. Meteor., 43, 282–296.
——, ——, and ——, 2006: Improvement of Advanced MicrowaveSounding Unit tropical cyclone intensity and size estimationalgorithms. J. Appl. Meteor. Climatol., 45, 1573–1581.
Dvorak, V. F., 1975: Tropical cyclone intensity analysis and fore-casting from satellite imagery. Mon. Wea. Rev., 103, 420–430.
——, 1984: Tropical cyclone intensity analysis using satellite data.NOAA Tech. Rep. NESDIS 11, U.S. Department of Com-merce, Washington, DC, 47 pp.
Elsner, J. B., and A. B. Kara, 1999: Hurricanes of the North At-lantic: Climate and Society. Oxford University Press, 488 pp.
——, ——, and M. A. Owens, 1999: Fluctuations in North Atlan-tic hurricane frequency. J. Climate, 12, 427–437.
——, T. Jagger, and X.-F. Niu, 2000a: Changes in the rates ofNorth Atlantic major hurricane activity during the 20th cen-tury. Geophys. Res. Lett., 27, 1743–1746.
——, K. Liu, and B. Kocher, 2000b: Spatial variations in majorU.S. hurricane activity: Statistics and a physical mechanism.J. Climate, 13, 2293–2305.
——, X. Niu, and T. H. Jagger, 2004: Detecting shifts in hurricanerates using a Markov chain Monte Carlo approach. J. Cli-mate, 17, 2652–2666.
Emanuel, K., 2005: Increasing destructiveness of tropical cyclonesover the past 30 years. Nature, 436, 686–688.
Erickson, C. O., 1972: Evaluation of a technique for the analysisand forecasting of tropical cyclone intensities from satellitepictures. NOAA Tech. Memo. NESS 42, Springfield, VA, 28pp.
Goldenberg, S. B., and L. J. Shapiro, 1996: Physical mechanismsfor the association of El Niño and West African rainfall withAtlantic major hurricane activity. J. Climate, 9, 1169–1187.
——, C. W. Landsea, A. M. Mesta-Nuñez, and W. M. Gray, 2001:The recent increase in Atlantic hurricane activity: Causes andimplications. Science, 293, 474–479.
Gray, W. M., 1984: Atlantic seasonal hurricane frequency. Part I:El Niño and 30 mb quasi-biennial oscillation influences. Mon.Wea. Rev., 112, 1649–1668.
——, P. J. Klotzbach, and W. Thorson, cited 2005: Extendedrange forecast of Atlantic seasonal hurricane activity and
15 DECEMBER 2007 Z E H R A N D K N A F F 5887

U.S. landfall strike probability for 2005. [Available online athttp://hurricane.atmos.colostate.edu.]
Guard, C. P., and M. A. Lander, 1996: A wind-pressure relation-ship for midget TCs in the western North Pacific. 1996 An-nual Tropical Cyclone Rep., Naval Pacific Meteorology andOceanography Center/Joint Typhoon Warning Center, 311pp. [Available online at https://metocph.nmci.navy.mil/jtwc/atcr/1996atcr/pdf/1996.html.]
——, L. E. Carr, F. H. Wells, R. A. Jeffries, N. D. Gural, andD. K. Edson, 1992: Joint Typhoon Warning Center and thechallenges of multibasin tropical cyclone forecasting. Wea.Forecasting, 7, 328–352.
Harper, B. A., 2002: Tropical cyclone parameter estimation andthe Australian region: Wind-pressure relationships and re-lated issues for engineering planning and design—A discus-sion paper. SEA Rep. J0106-PR003E, 83 pp. [Available fromSystems Engineering Australia Pty. Ltd., 7 Mercury Ct.,Bridgeman Downs, QLD 4035, Australia.]
Hawkins, J. D., T. F. Lee, J. Turk, C. Sampson, J. Kent, and K.Richardson, 2001: Real-time Internet distribution of satelliteproducts for tropical cyclone reconnaissance. Bull. Amer.Meteor. Soc., 82, 567–578.
——, M. Helveston, T. F. Lee, F. J. Turk, K. Richardson, C.Sampson, J. Kent, and R. Wade, 2006: Tropical cyclone mul-tiple eyewall configurations. Preprints, 27th Conf. on Hurri-canes and Tropical Meteorology, Monterey, CA, Amer. Me-teor. Soc., 6B.1.
Holland, G. J., 1980: An analytic model of the wind and pressureprofiles in hurricanes. Mon. Wea. Rev., 108, 1212–1218.
Jarvinen, B. R., and C. J. Neumann, 1979: Statistical forecasts oftropical cyclone intensity for the North Atlantic basin.NOAA Tech. Memo. NWS NHC-10, 22 pp.
Kalnay, E., and Coauthors, 1996: The NCEP/NCAR 40-Year Re-analysis Project. Bull. Amer. Meteor. Soc., 77, 437–471.
Kaplan, J., and M. DeMaria, 2003: Large-scale characteristics ofrapidly intensifying tropical cyclones in the North Atlanticbasin. Wea. Forecasting, 18, 1093–1108.
Knaff, J. A., and R. M. Zehr, 2007: Reexamination of tropicalcyclone wind–pressure relationships. Wea. Forecasting, 22,71–88.
Kossin, J. P., J. A. Knaff, H. I. Berger, D. C. Herndon, T. A.Cram, C. S. Velden, R. J. Murnane, and J. D. Hawkins, 2007:Estimating hurricane wind structure in the absence of aircraftreconnaissance. Wea. Forecasting, 22, 89–101.
Landsea, C. W., 1993: A climatology of intense (or major) Atlan-tic hurricanes. Mon. Wea. Rev., 121, 1703–1713.
——, N. Nicholls, W. M. Gray, and L. A. Avila, 1996: Downwardtrends in the frequency of intense Atlantic hurricanes duringthe past five decades. Geophys. Res. Lett., 23, 1697–1700.
——, R. A. Pielke Jr., A. M. Mestas-Nunez, and J. A. Knaff, 1999:Atlantic basin hurricanes: Indices of climatic changes. Cli-matic Change, 42, 89–129.
Love, G., and K. Murphy, 1985: The operational analysis of tropi-cal cyclone wind fields in the Australian northern region.Northern Territory Region Research Papers 1984–1985, Bu-reau of Meteorology, 44–51. [Available from National Me-teorological Library, GPO Box 1289, Melbourne, VIC, 3001,Australia.]
Maclay, K. S., 2006: Tropical cyclone inner core energetics and itsrelation to storm structural changes. Preprints, 27th Conf. on
Hurricanes and Tropical Meteorology, Monterey, CA, Amer.Meteor. Soc., 2B.1. [Available online at http://ams.confex.com/ams/pdfpapers/108304.pdf.]
Mueller, K. J., M. DeMaria, J. Knaff, J. P. Kossin, and T. H.Vonder Haar, 2006: Objective estimation of tropical cyclonewind structure from infrared satellite data. Wea. Forecasting,21, 990–1005.
Neumann, C. J., B. R. Jarvinen, C. J. McAdie, and G. R. Ham-mer, 1999: Tropical Cyclones of the North Atlantic Ocean,1871–1998. NOAA Historical Climatology Series 6-2, Na-tional Oceanic and Atmospheric Administration, 206 pp.[Available from National Climatic Data Center, Asheville,NC 28801-5001.]
Olander, T. L., and C. S. Velden, 2004: The Advanced ObjectiveDvorak Technique (AODT)—Continuing the journey. Pre-prints, 26th Conf. on Hurricanes and Tropical Meteorology,Miami, FL, Amer. Meteor. Soc., 224–225.
——, and ——, 2007: The advanced Dvorak technique: Continueddevelopment of an objective scheme to estimate tropical cy-clone intensity using geostationary infrared satellite imagery.Wea. Forecasting, 22, 287–298.
Pasch, R., E. S. Blake, H. D. Cobb III, and D. P. Roberts, 2006:Tropical cyclone report: Hurricane Wilma, 15–25 October2005. 27 pp. [Available online at http://www.nhc.noaa.gov/2005atlan.shtml.]
Saunders, M. A., R. E. Chandler, C. J. Merchant, and F. P. Rob-erts, 2000: Atlantic hurricanes and NW Pacific typhoons:ENSO spatial impacts on occurrence and landfall. Geophys.Res. Lett., 27, 1147–1150.
Simpson, R. H., 1974: The hurricane disaster potential scale.Weatherwise, 27, 169–186.
Velden, C. S., T. Olander, and R. Zehr, 1998: Development of anobjective scheme to estimate tropical cyclone intensity fromdigital geostationary satellite infrared imagery. Wea. Fore-casting, 13, 172–186.
——, and Coauthors, 2006: The Dvorak tropical cyclone intensityestimation technique: A satellite-based method that has en-dured for over 30 years. Bull. Amer. Meteor. Soc., 87, 1195–1210.
Weatherford, C. L., and W. M. Gray, 1988: Typhoon structure asrevealed by aircraft reconnaissance. Part II: Structural vari-ability. Mon. Wea. Rev., 116, 1044–1056.
Webster, P. J., G. J. Holland, J. A. Curry, and H.-R. Chang, 2005:Changes in tropical cyclone number, duration, and intensityin a warming environment. Science, 309, 1844–1846.
Willoughby, H. E., J. A. Clos, and M. E. Shoreibah, 1982: Con-centric eye walls, secondary wind maxima, and the evolutionof the hurricane vortex. J. Atmos. Sci., 39, 395–411.
——, J. M. Masters, and C. W. Landsea, 1989: A record minimumsea level pressure observed in Hurricane Gilbert. Mon. Wea.Rev., 117, 2824–2828.
Wilson, R. M., 1999: Statistical aspects of major (intense) hurri-canes in the Atlantic basin during the past 49 hurricane sea-sons (1950–1998): Implications for the current season. Geo-phys. Res. Lett., 26, 2957–2960.
Zehr, R. M., 2000: Tropical cyclone research using large infraredimage data sets. Preprints, 24th Conf. on Hurricanes andTropical Meteorology, Fort Lauderdale, FL, Amer. Meteor.Soc., 486–487.
5888 J O U R N A L O F C L I M A T E VOLUME 20