fraport interim report q2/6m 2019 group interim management ...€¦ · 8/6/2019 · revenue...
TRANSCRIPT

Fraport Interim Report Q2/6M 2019
August 7, 2019
Group Interim Management Report Overview of Business Development
> Positive passenger development across the Group, with 33.6 million passengers (+3.0%) at Frankfurt Airport.
> In Frankfurt, revenue growth due to higher revenue from security and ground services, airport and infrastructure charges as well as retail and parking revenue. The discontinuation of revenue from the Group company Energy Air due to the disposal of shares as at January 1, 2019 had an offsetting effect.
> International business, especially with Lima, Fraport USA, and Fraport Greece, made a positive contribution to Group revenue.
> Higher operating expenses resulted from traffic volume at the Frankfurt site as well as at the Group company Lima and Fraport Greece. The disposal of the Group company Energy Air led to a reduction in the cost of materials and other operating expenses.
> Group EBITDA was €511.5 million, an increase of €50.2 million (+10.9%) above the previous year, and the application of IFRS 16 had a positive effect of €22.8 million.
> The improvement in the negative financial result from €77.4 million to €64.3 million (+€13.1 million) was mostly attributable to the significantly higher result from the Group company Antalya, which is accounted for using the equity method, and a slightly improved interest result.
> Noticeable improvement of €24.1 million in the Group result to €164.9 million.
> As predicted, free cash flow dropped by €282.5 million to –€305.7 million because of the higher level of capital expenditure throughout the Group.
Key Figures € million 6M 2019 6M 2018 Change Change in %
Revenue 1,783.0 1,532.2 +250.8 +16.4 Revenue adjusted for IFRIC 12 1,513.9 1,438.5 +75.4 +5.2 EBITDA 511.5 461.3 +50.2 +10.9 EBIT 279.1 268.9 +10.2 +3.8 EBT 214.8 191.5 +23.3 +12.2 Group result 164.9 140.8 +24.1 +17.1 Earnings per share (basic) (€) 1.70 1.46 +0.24 +16.4 Operating cash flow 367.5 325.2 +42.3 +13.0 Free cash flow – 305.71) – 23.2 – 282.5 – Average number of employees 22,389 21,614 +775 +3.6
€ million June 30, 2019 Dec. 31, 2018 Change Change in %
Shareholders’ equity 4,329.2 4,368.0 – 38.8 – 0.9 Group liquidity 1,144.0 1,163.2 – 19.2 – 1.7 Net financial debt 4,103.3 3,545.4 +557.9 +15.7 Gearing ratio (%) 98.4 88.7 +9.7 PP – Total assets 12,259.7 11,449.1 +810.6 +7.1 1) Free cash flow without taking into account the effects of the application of IFRS 16.

Fraport Interim Report Q2/6M 2019 2
Key Figures € million Q2 2019 Q2 2018 Change Change in %
Revenue 979.2 850.5 +128.7 +15.1 Revenue adjusted for IFRIC 12 835.4 794.3 +41.1 +5.2 EBITDA 310.9 286.6 +24.3 +8.5 EBIT 193.0 186.6 +6.4 +3.4 EBT 178.3 165.3 +13.0 +7.9 Group result 136.9 121.2 +15.7 +13.0 Earnings per share (basic) (€) 1.37 1.21 +0.16 +13.2 Operating cash flow 238.5 244.7 – 6.2 – 2.5 Free cash flow – 59.81) 43.7 – 103.5 – Average number of employees 22,629 22,002 +627 +2.8 1) Free cash flow without taking into account the effects of the application of IFRS 16.
Information about Reporting
The scope of consolidation in the first half of 2019 differs from that in the same period in the previous year as follows, in particular:
> Due to the first-time application of IFRS 16 “Leases” since January 1, 2019, the item “Property, plant, and equipment” in the consolidated statement of financial position increased by €318.6 million. The current and non-current other liabilities in-creased by €323.2 million. In addition, the application had a positive effect on the Group EBITDA of €22.8 million and result-ed in additional depreciation and amortization of €21.6 million as well as an increased interest expense of €5.8 million. In the consolidated statement of cash flows, the first-time application of IFRS 16 improved the operating cash flow (+€22.8 million) and increased the cash flow from financing activities (–€22.8 million). The effects from the application of IFRS 16 concern, in particular, the International Activities & Services segment and result primarily from the lease agreements between the Group company Fraport USA (or its subsidiaries) and the franchisors awarding the concessions.
> In this context, the definition for calculating the free cash flow has been adjusted and does not take into account effects from the application of IFRS 16. The free cash flow is calculated as follows: Cash flow from operating activities – effects resulting from the application of IFRS 16 – investments in airport operating projects (excluding payments to acquire Group companies and concessions) – capital expenditure for other intangible assets– capital expenditure in property, plant, and equipment – investments for “Investment property” – capital expenditure in companies accounted for using the equity method + dividends from companies accounted for using the equity method.
An overview of the calculation of key financial indicators and a description of specialist terms are presented on page 244 of the 2018 Annual Report.
Situation of the Group
Changes during the Reporting Period
With a view towards the growing international business as well as the increased need to manage the upcoming capacity expan-sions at the Frankfurt site, on March 14, 2019 the Supervisory Board approved a motion to expand the Executive Board by appointing Dr. Pierre Dominique Prümm effective July 1, 2019 for a term of five years until June 30, 2024. As Executive Director of Aviation and Infrastructure, he will be responsible for the Aviation segment with the Strategic Business Unit “Airside and Ter-minal Management, Corporate Security and Safety” and the Service Unit “Corporate Infrastructure Management”.
During the reporting period, there have been no other significant changes to the situation of the Fraport Group as presented in the 2018 Group Management Report, with respect to business model, structure, competitive position, strategy, and control (see 2018 Group Management Report, chapter “Economic Report”, page 54 et seqq.).

Fraport Interim Report Q2/6M 2019 3
Economic Report
General Statement by the Executive Board
In the first six months of 2019, the airports of the Fraport Group recorded sound passenger development. At approximately 33.6 million, passenger numbers at Frankfurt Airport grew by 3.0%. The Group airports mostly posted positive growth rates as well. Only Bulgaria showed declining passenger numbers.
Group revenue increased by 16.4% in the first six months of 2019 to €1,783.0 million (+€250.8 million). Adjusted for the revenue relating to capacitive capital expenditure based on the application of IFRIC 12, revenue increased by 5.2% to €1,513.9 million (+€75.4 million). Drivers of revenue development in Frankfurt were increased revenue from ground services as well as airport and infrastructure charges due to higher traffic volume, an increase in retail and parking revenue, and increased revenue from security services at Frankfurt Airport as well as at the Stuttgart and Cologne/Bonn Airports. The discontinuation of revenue from the Group company Energy Air due to the disposal of shares as at January 1, 2019 had an offsetting effect on Group revenue. Beyond the Frankfurt site, the Group companies Lima and Fraport USA significantly contributed to adjusted revenue. The disposal of shares in the Group company Energy Air increased other operating income by €12.1 million, which had been positively impacted by the sales of land in the amount of €5.0 million in the previous year.
Higher operating expenses resulted in part from increased expenses due to higher traffic volume in the Aviation and Ground Handling segments. Internationally, the Group company Lima as well as Fraport Greece were the main drivers of the increase in the Group’s personnel expenses, which was also due to higher traffic volume.
Group EBITDA increased by €50.2 million, coming to €511.5 million (+10.9%). The application of IFRS 16 had a positive effect on Group EBITDA in the amount of €22.8 million, while at the same time increasing depreciation and amortization by €21.6 million. Due to the positive impact from the companies accounted for using the equity method, the financial result of –€64.3 million (6M 2018: –€77.4 million) led to a Group result of €164.9 million, which was significantly above the previous year’s level by €24.1 million (+17.1%).
As expected, the free cash flow decreased in the first six months of 2019 due to higher capital expenditure at the Frankfurt site and in international business, dropping significantly to –€305.7 million (6M 2018: –€23.2 million). This resulted in an increase in net financial debt of €557.9 million to €4,103.3 million. The gearing ratio reached a level of 98.4%.
Overall, the Executive Board describes the operating and financial performance in the reporting period as positive.
Macroeconomic, Legal, and Industry-specific Conditions
Development of the macroeconomic conditions The first quarter of 2019 saw a sharp increase in global gross domestic product despite the further slowdown in the global econ-omy, which was mainly reflected in the slowing industrial production in developed economies (data for the first half of 2019 were not available until the editorial deadline). Industry woes have been accompanied by a decline in global trade, where the trade conflict between the US and China was clearly being felt. Japan, too, was suffering from this trade dispute, as its value chains are closely linked to China. The service sectors of the developed economies continued to be dynamic, benefiting from job growth, strong wage growth, and rising consumer spending. Economic growth in emerging markets remained on course. The price of crude oil picked up again in the first quarter of 2019, caused by lower oil production in several OPEC countries and Russia, production cuts in Venezuela, and tougher sanctions by the US on Iran.
The economy in the euro area grew more strongly than expected by 0.4% in the first quarter of 2019 compared to the fourth quarter of 2018. This was due to an increase in consumer spending (+0.5%) and gross fixed capital formation (+1.1%). Exports, on the other hand, fell to 0.6%.

Fraport Interim Report Q2/6M 2019 4
The German economy has cooled noticeably since the beginning of last year. Economic development showed diverging trends: Export-oriented manufacturing was already experiencing a recession. Protectionist economic policies led to rising uncertainty, weaker industrial activity, and the collapse of global trade. At the same time, the service sectors, which are mainly focused on the domestic market, and the construction sector were still experiencing robust growth. In the first quarter of 2019, real gross domestic product grew by 0.4%, with sales of motor vehicles, which had collapsed at the end of 2018 due to the introduction of the WLTP emission standard, recovering more strongly than expected. The labor market remained stable, with an unemployment rate of 4.9% in June 2019, which was at the previous year’s level. Inflation picked up somewhat in the first four months, at 1.7%.
Source: Agentur für Arbeit (Monatsbericht Arbeits- und Ausbildungsmarkt, June 2019), ifo Economic Forecast Summer 2019 from ifo Schnelldienst 12/2019 (June 2019).
Development of the legal environment During the reporting period, there were no changes to the legal environment that had a substantial influence on the business development of the Fraport Group.
Development of industry-specific conditions According to the preliminary figures from Airports Council International (ACI), global passenger traffic grew by 3.6% in the January to May 2019 period. In the same period, air freight volume weakened slightly by 2.7% in comparison to the previous year. Euro-pean airports achieved stronger growth in passenger numbers of 4.1%. In terms of air freight, the performance of the European airports at –3.4% was lower than the overall development. Passenger numbers at German airports grew by 4.1% up to and including May 2019. Cargo tonnage (air freight and air mail) showed development with a minus of 2.4%, but was still slightly above the European and global levels.
Passenger and cargo development by region Changes compared to the previous year in % Passengers January to May 2019 Air freight January to May 2019
Germany 4.1 – 2.4 Europe 4.1 – 3.4 North America 4.1 0.7 Latin America 5.6 – 1.1 Middle East 1.6 – 1.8 Asia-Pacific 2.3 – 5.7 Africa 6.1 1.7 World 3.6 – 2.7 Source: ACI Passenger Flash and Freight Flash (ACI, July 16, 2019), ADV for Germany, with cargo instead of air freight (in and out), (June 27, 2019).
Significant Events
Expansion and modernization program at Fraport Greece proceeding according to plan The expansion and modernization works at the Greek airports in Chania, Zakynthos, and Kavala were completed in the first quarter of 2019. At the beginning of April 2019, the regulated airport charges at these airports were increased in accordance with the concession agreement. By the end of fiscal year 2019, the Aktion, Kefalonia, Mytilene, Rhodes, Samos, and Skiathos Airports will also be completed successively. Once the construction work has been completed, the regulated airport charges will also be adjusted at these airports.
Groundbreaking ceremony for Terminal 3 in Frankfurt Fraport AG laid the cornerstone for Terminal 3 at Frankfurt Airport on April 29, 2019 and will invest up to €4 billion in the Airport Expansion South project over the next few years. By 2021, Pier G will be the first to be built with a capacity of up to 5 million passengers. The pier is being built as a full and modern terminal building and will be integrated into Terminal 3 at a later stage. Completion of the terminal main building with Pier H and Pier J is planned for 2023. The addition of these piers will bring the overall capacity to up to 21 million passengers. It will also be possible to expand Terminal 3 with Pier K at a later date. Once the expansion project is fully completed, capacity will increase to 25 million travelers.

Fraport Interim Report Q2/6M 2019 5
Fraport AG increases its shareholding in Lima Airport Partners Effective May 24, 2019, Fraport AG has purchased additional 10.0% of the shares in Lima Airport Partners S.R.L. from the infra-structure fund of AC Capitales at a price of €40.3 million. This purchase brings the total percentage of ownership in the Group company Lima from 70.01% to 80.01%. Fraport has thus strengthened its position as majority shareholder and operator of Lima Airport, which is currently in the expansion and growth phase. No other events that have had or will have a substantial effect on the business development of the Fraport Group have occurred during the reporting period.
Business Development
Development at the Frankfurt site With over 33.6 million passengers in the first half of 2019, the airport once again set a new record. The number of passengers increased by nearly 1 million or 3.0%.
The volume of European traffic posted slightly above-average growth of 3.2%. The slowdown in the growth in southern European traffic (+2.4%) was caused by a switch in demand from southern Europe to southeastern Europe (+9.0%), mainly due to the resurgence of Turkey as a travel destination. Domestic traffic slowed down over the course of the year and posted a slightly negative figure (–0.3%) at midyear. Growth in intercontinental traffic (+3.7%) was the most dynamic, with traffic to Africa (+10.2%) achieving the highest rate. Continued growth in demand for holiday travel on connections to Egypt and Tunisia was behind the increase. In traffic to the Far East (+2.5%), reductions in offers to and from Japan but also lower demand for destina-tions in China led to below-average growth. The growth of traffic to and from India was not able to compensate for this slump.
Cargo volume reached around 1.05 million metric tons in the first half of 2019, which corresponded to a decline of 2.6%. This traffic development was in line with the leading economic indicators. Significant increases were recorded in the first six months of 2019, particularly in traffic to and from the United States (+5.8%). Traffic to and from Asia, on the other hand, declined significantly, falling by 6.3%. European traffic grew dynamically in the first half of the year at a rate of 4.3%.
In the first half of 2019, more than 252 thousand flights were recorded, a plus of 2.1% in aircraft movements compared to the previous year. This exceeded the peak rate of the first half of 2018 by around 5,300 movements. Maximum take-off weights also increased by 2.1% to 15.6 million metric tons.
Development outside the Frankfurt site Ljubljana Airport welcomed almost 860 thousand passengers in the first half of 2019, an increase of 3.4% compared to the same period last year. This growth has largely been driven by the addition of new routes as well as increased frequencies by the airlines easyJet, LOT, and Transavia. In terms of individual connections, passenger traffic showed a mixed picture. While the majority of the ten most important routes (primarily Istanbul, Frankfurt, and London) developed negatively, passenger numbers on the other routes increased by almost 20% on average.
Brazilian airports Fortaleza and Porto Alegre welcomed 7.4 million passengers (+8.5%) in the first six months of 2019. In Forta-leza, international traffic grew primarily thanks to the creation of an Air France/KLM hub (+94.9%), while the strong domestic traffic also developed positively (+13.5%). In Porto Alegre, domestic traffic was moderately above the previous year’s level (+1.7%), while international traffic increased by 3.4%.
Over 11.3 million passengers used Lima Airport in the first six months of 2019, which corresponds to an increase in passenger numbers of 6.2%. Domestic traffic (+5.0%) as well as international traffic (+7.6%) grew in the reporting period. The increase in domestic traffic is predominantly due to the strong market presence of low-cost airlines. The growth in international traffic is due to Peru’s touristic and economic appeal and the increasing importance of Lima as a transfer airport, especially for the airlines LATAM and Avianca Perù.

Fraport Interim Report Q2/6M 2019 6
With around 10.9 million passengers, Fraport Greece recorded solid growth of 2.7% in the reporting period, despite the ongoing consolidation process in European air traffic. Overall, domestic traffic posted stable development, while international traffic grew by 3.0%.
The Bulgarian Varna and Burgas Airports served approximately 1.4 million passengers in the first six months of 2019, around 12.9% less than in the same period of the previous year. Domestic traffic (–9.0%) was negatively affected, among other things, by the cancellation of WizzAir’s service to Sofia. The decline in international traffic (–13.3%) was mainly due to fewer travelers to and from Russia, Poland, and Germany. Furthermore, the reduction in Ryanair flights and the resurgent tourism in Turkey, Tunisia, and Egypt have had a negative impact on traffic development.
Passenger numbers in the first six months of 2019 at Antalya Airport were around 13.2 million, which corresponds to an increase of 8.1% compared to the same period of the previous year. The number of international passengers increased significantly by 14.5% to around 9.9 million, mainly due to an increase in tourist demand from passengers from Russia and Western Europe, among others Germany, the United Kingdom, and the Netherlands. At the same time, the number of passengers traveling within Turkey fell by 6.9% to 3.4 million. This development was mainly due to the current weakness of the Turkish economy.
At just under 8.8 million travelers in the reporting period, passenger traffic at St. Petersburg Airport saw an increase of 10.3% compared to the same period of the previous year. While international traffic increased by 5.9%, domestic traffic jumped by 13.0%, mainly due to the growth of the Russian low-cost airline Pobeda with connections to regional airports in the country.
Xi'an Airport also continued its positive development in the first six months of 2019 with passenger numbers of about 22.9 million (+6.2%). Not only did high-volume domestic traffic increase by 6.0% to approximately 21.4 million passengers, international traffic also rose by 9.4% to around 1.5 million passengers. The relatively modest increase in domestic traffic is the result of competition with several high-speed train routes from and to Xi'an.
Traffic development at the Group site
Fraport share
in % Passengers 1) Cargo (air freight + air mail in m. t.) Movements
6M 2019 Change in % 2) 6M 2019 Change in % 2) 6M 2019 Change in % 2)
Frankfurt 100 33,643,933 +3.0 1,047,602 – 2.6 252,316 +2.1 Ljubljana 100 859,557 +3.4 5,726 – 5.4 16,679 – 1.6 Fortaleza 100 3,450,261 +17.4 20,111 – 4.5 28,680 +8.8 Porto Alegre 100 3,966,681 +1.8 18,010 – 6.9 37,015 – 7.3 Lima 80.01 11,296,901 +6.2 123,700 – 5.9 96,141 +1.4 Fraport Greece 73.4 10,921,570 +2.7 3,619 – 7.0 93,097 +3.8 Twin Star 60 1,438,731 – 12.9 2,918 – 35.1 11,367 – 15.7 Burgas 60 738,031 – 14.5 2,864 – 35.6 5,803 – 14.8 Varna 60 700,700 – 11.1 54 +11.7 5,564 – 16.6 Antalya 51/503) 13,246,644 +8.1 n.a. n.a. 81,904 +10.7 St. Petersburg 25 8,767,773 +10.3 n.a. n.a. 80,310 +4.7 Xi’an 24.5 22,904,944 +6.2 164,816 +22.2 168,031 +4.8 1) Commercial traffic only, in + out + transit. 2) As a result of late submissions, there may be changes to the figures reported for the previous year. 3) Share of voting rights: 51 %, dividend share: 50 %.

Fraport Interim Report Q2/6M 2019 7
Traffic development at the Group site
Fraport share
in % Passengers 1) Cargo (air freight + air mail in m. t.) Movements
Q2 2019 Change in % 2) Q2 2019 Change in % 2) Q2 2019 Change in % 2) Frankfurt 100 18,845,599 +3.3 528,574 – 3.5 135,735 +1.4 Ljubljana 100 516,921 +3.0 2,815 – 6.7 9,078 – 5.9 Fortaleza 100 1,554,975 +9.5 9,072 – 18.3 13,013 – 1.6 Porto Alegre 100 1,922,238 +0.6 9,158 – 12.0 18,244 – 9.3 Lima 80.01 5,755,780 +8.2 61,170 – 6.8 49,627 +4.5 Fraport Greece 73.4 9,002,086 +1.6 1,887 – 13.6 72,929 +2.3 Twin Star 60 1,235,125 – 14.0 1,557 – 23.4 9,376 – 16.1 Burgas 60 702,066 – 15.0 1,533 – 23.5 5,307 – 15.6 Varna 60 533,059 – 12.6 24 – 21.5 4,069 – 16.7 Antalya 51/503) 10,529,867 +8.8 n.a. n.a. 62,342 +10.7 St. Petersburg 25 5,123,379 +7.3 n.a. n.a. 44,262 +1.5 Xi’an 24.5 11,621,270 +4.5 91,701 +30.4 85,605 +3.8 1) Commercial traffic only, in + out + transit. 2) As a result of late submissions, there may be changes to the figures reported for the previous year. 3) Share of voting rights: 51 %, dividend share: 50 %.
The Group’s Results of Operations
Revenue Group revenue increased by 16.4% in the first six months of 2019 to €1,783.0 million (+€250.8 million). Adjusted for the revenue relating to capacitive capital expenditure based on the application of IFRIC 12, revenue was €1,513.9 million (+€75.4 million). The positive revenue development was mainly caused by increased revenue from ground services (+€7.6 million), airport and infra-structure charges (+€6.3 million and +€5.4 million respectively) due to higher traffic volume as well as increased revenue from security services (+€8.9 million) at Frankfurt Airport as well as at the Stuttgart and Cologne/Bonn Airports. Higher retail revenue (+€9.6 million), also due to advertising revenue (+€4.7 million), and parking revenue (+€2.1 million) also had a positive effect. The discontinuation of revenue from the Group company Energy Air due to the disposal of shares on January 1, 2019 had an offsetting effect on Group revenue (–€12.6 million). Beyond the Frankfurt site, mainly the Group companies Lima (+€19.8 million), driven by passenger growth and Fraport USA (+€13.0 million), influenced primarily by the take-over of operations of the concessions in New York (since April 2018) and Nashville (since February 2019), as well as Fraport Greece (+€10.8 million) contributed to the adjusted revenue growth. The development of the US dollar had a positive effect on Group revenue.
The disposal of shares in the Group company Energy Air increased other operating income (+€12.1 million), which had been positively influenced in the same period of the previous year (+€4.2 million) due to the disposal of a commercial property for €5.0 million.
Expenses Operating expenses (cost of materials, personnel expenses, and other operating expenses) amounting to €1,313.2 million were €206.8 million higher than in the previous year (+18.7%). Adjusted for the expenses relating to capacitive capital expenditure based on the application of IFRIC 12, the increase was €31.5 million (+€3.1%). The change is primarily due to increases in personnel expenses and cost of materials (+€12.5 million and +€8.9 million respectively) in the Aviation segment based on traffic volume. In addition to effects from collective bargaining agreements, the Ground Handling segment posted higher personnel expenses (+€6.6 million) partly as a result of increased need for manpower relating to gains in traffic and market share. Non-staff costs (cost of materials and other operating expenses) declined by €10.6 million, in part due to the disposal of the Group company Energy Air in the Retail & Real Estate segment. In the International Activities & Services segment, personnel expenses (+€12.1 million) rose due to traffic volume, including at the Group company Lima and Fraport Greece.

Fraport Interim Report Q2/6M 2019 8
EBITDA and EBIT Group EBITDA increased by €50.2 million, coming to €511.5 million (+10.9%). Group EBITDA was positively impacted by the development of the US dollar. The application of IFRS 16 increased Group EBITDA by €22.8 million. The International Activities & Services segment contributed a total of €23.7 million to this increase, whereas €20.7 million was attributed to the application of IFRS 16. Higher depreciation and amortization (+€40.0 million), also due to the application of IFRS 16 (+€21.6 million), led to Group EBIT of €279.1 million (+€10.2 million or +3.8%).
Financial result The negative financial result improved to –€64.3 million (6M 2018: –€77.4 million). This was mainly caused by the higher result of companies accounted for using the equity method, in particular due to the strong operating performance of the Group company Antalya (+€11.4 million) and a slightly improved interest result based on higher short-term cash deposits in the Group companies Fortaleza, Porto Alegre, and Lima.
EBT, Group result, and EPS The improved financial result led to EBT of €214.8 million (+€23.3 million). With expenses from taxes on income of €49.9 million (6M 2018: €50.7 million), the Group result was €164.9 million (+€24.1 million). This resulted in basic earnings per share of €1.70 (+€0.24).
Results of Operations for Segments
Aviation € million 6M 2019 6M 2018 Change Change in %
Revenue 494.7 478.3 +16.4 +3.4 Personnel expenses 188.2 175.7 +12.5 +7.1 Cost of materials 34.0 25.1 +8.9 +35.5 EBITDA 121.9 120.7 +1.2 +1.0 Depreciation and amortization 78.5 65.5 +13.0 +19.8 EBIT 43.4 55.2 – 11.8 – 21.4 Average number of employees 6,341 6,124 +217 +3.5
€ million Q2 2019 Q2 2018 Change Change in %
Revenue 269.7 259.0 +10.7 +4.1 Personnel expenses 98.1 90.6 +7.5 +8.3 Cost of materials 16.7 9.4 +7.3 +77.7 EBITDA 83.7 80.9 +2.8 +3.5 Depreciation and amortization 39.7 35.5 +4.2 +11.8 EBIT 44.0 45.4 – 1.4 – 3.1 Average number of employees 6,375 6,172 +203 +3.3
Revenue in the Aviation segment increased in the first half of 2019 by €16.4 million to €494.7 million. This increase of 3.4% was primarily due to higher revenue from security services (+€8.9 million) at Frankfurt Airport as well as at the Stuttgart and Cologne/Bonn Airports. Passenger growth in Frankfurt was reflected in slightly higher revenue from airport charges (+1.6%). This was offset in part by an increase in personnel expenses and cost of materials based on traffic volume (+€12.5 million and +€8.9 million respectively) primarily in Fraport AG and the Group company FraSec. Segment EBT increased slightly from €1.2 mil-lion to €121.9 million (+1.0%). Higher depreciation and amortization (+€13.0 million) led to EBIT of €43.4 million (–€11.8 million).

Fraport Interim Report Q2/6M 2019 9
Retail & Real Estate € million 6M 2019 6M 2018 Change Change in %
Revenue 241.3 241.3 0.0 0.0 Personnel expenses 29.0 27.7 +1.3 +4.7 Cost of materials 59.7 64.1 – 4.4 – 6.9 EBITDA 196.5 182.1 +14.4 +7.9 Depreciation and amortization 44.5 42.7 +1.8 +4.2 EBIT 152.0 139.4 +12.6 +9.0 Average number of employees 647 647 – –
€ million Q2 2019 Q2 2018 Change Change in %
Revenue 125.1 123.9 +1.2 +1.0 Personnel expenses 14.5 14.0 +0.5 +3.6 Cost of materials 29.9 30.1 – 0.2 – 0.7 EBITDA 95.4 93.1 +2.3 +2.5 Depreciation and amortization 22.5 22.1 +0.4 1.8 EBIT 72.9 71.0 +1.9 +2.7 Average number of employees 647 650 – 3 – 0.5
At €241.3 million, revenue in the Retail & Real Estate segment in the reporting period remained at the previous year’s level despite the discontinuation of revenue from the Group company Energy Air due to the disposal of shares on January 1, 2019 (–€12.6 mil-lion). Passenger growth had a positive effect on both retail revenue (+€9.6 million), including advertising revenue amounting to €4.7 million, and parking revenue (+€2.1 million). The net retail revenue per passenger increased by 6.5% to €3.26 compared to the previous year (6M 2018: €3.06). The disposal of shares in the Group company Energy Air (+€12.1 million) increased other operating income (+€6.5 million), which had been positively influenced due to the disposal of a commercial property for €5.0 million compared to the previous year. Slightly higher personnel expenses (+€1.3 million) were offset by a decrease in cost of materials and other operating expenses (–€10.6 million), mainly in connection with the disposal of the Group company Energy Air. The segment EBITDA was €196.5 million (+7.9%). Increased depreciation and amortization (+€1.8 million) led to segment EBIT of €152.0 million (+9.0%).
Ground Handling € million 6M 2019 6M 2018 Change Change in %
Revenue 345.2 325.2 +20.0 +6.2 Personnel expenses 237.3 230.7 +6.6 +2.9 Cost of materials 27.9 26.7 +1.2 +4.5 EBITDA 23.6 12.7 +10.9 +85.8 Depreciation and amortization 23.5 20.7 +2.8 +13.5 EBIT 0.1 – 8.0 +8.1 – Average number of employees 9,284 8,966 +318 +3.5
€ million Q2 2019 Q2 2018 Change Change in %
Revenue 184.4 174.1 +10.3 +5.9 Personnel expenses 122.3 119.4 +2.9 +2.4 Cost of materials 14.3 14.1 +0.2 +1.4 EBITDA 18.3 10.5 +7.8 +74.3 Depreciation and amortization 11.8 10.8 +1.0 +9.3 EBIT 6.5 – 0.3 +6.8 – Average number of employees 9,166 8,921 +245 +2.7
In the first six months of 2019, revenue increased by €20.0 million to €345.2 million (+6.2%). This is mainly due to increased revenue from ground services and infrastructure charges. The reasons for this were market share gains, increased maximum take-off weights, and passenger growth in Frankfurt. In addition to increases due to collective bargaining agreements effective as of March 1, 2018 as well as April 1, 2019, personnel expenses (+€6.6 million) increased in part as a result of increased need for

Fraport Interim Report Q2/6M 2019 10
manpower relating to the traffic and market share gains at the Group companies FraGround and FraCareS. Segment EBITDA improved by €10.9 million to €23.6 million (+85.8%). Despite increased depreciation and amortization, segment EBIT was €0.1 mil-lion, which corresponds to a significant improvement of €8.1 million compared to the previous year.
International Activities & Services € million 6M 2019 6M 2018 Change Change in %
Revenue 701.8 487.4 +214.4 +44.0 Revenue adjusted for IFRIC 12 432.7 393.7 +39.0 +9.9 Personnel expenses 164.0 151.9 +12.1 +8.0 Cost of materials 490.7 316.4 +174.3 +55.1 Cost of materials adjusted for IFRIC 12 221.6 222.7 – 1.1 – 0.5 EBITDA 169.5 145.8 +23.7 +16.3 Depreciation and amortization 85.9 63.5 +22.4 +35.3 EBIT 83.6 82.3 +1.3 +1.6 Average number of employees 6,117 5,877 +240 +4.1
€ million Q2 2019 Q2 2018 Change Change in %
Revenue 400.0 293.5 +106.5 +36.3 Revenue adjusted for IFRIC 12 256.2 237.3 +18.9 +8.0 Personnel expenses 83.5 77.9 +5.6 +7.2 Cost of materials 263.2 177.4 +85.8 +48.4 Cost of materials adjusted for IFRIC 12 119.4 121.2 – 1.8 – 1.5 EBITDA 113.5 102.1 +11.4 +11.2 Depreciation and amortization 43.9 31.6 +12.3 +38.9 EBIT 69.6 70.5 – 0.9 – 1.3 Average number of employees 6,441 6,258 +183 +2.9
In the first six months of 2019, revenue from the International Activities & Services segment rose by €214.4 million to €701.8 million (+44.0%). Adjusted for the revenue relating to capacitive capital expenditure based on the application of IFRIC 12, the increase in revenue was €39.0 million (+9.9%). The adjusted revenue growth can mainly be attributed to the Group companies Lima (+€19.8 million), driven by passenger growth, Fraport USA (+€13.0 million), influenced primarily by the take-over of operations of the concessions in New York (since April 2018) and Nashville (since February 2019), as well as Fraport Greece (+€10.8 million). The Group company Twin Star reported a decline in sales (–€3.3 million) due to traffic volume. The Group companies Fortaleza and Porto Alegre posted virtually constant revenue (–€0.3 million) related to currency exchange effects.
Operating expenses (cost of materials and personnel expenses as well as other operating expenses) increased significantly by €189.0 million to €699.1 million (+37.1%). Adjusted for the expenses relating to capacitive capital expenditure based on the ap-plication of IFRIC 12, operating expenses increased slightly by €13.6 million to €430.0 million (+3.3%). The increase was caused by higher personnel expenses (+€12.1 million), including at the Group company Lima and Fraport Greece. Higher concession fees based on traffic volume at the Group company Lima were offset by the reducing effect on segment expenses amounting to €20.7 million from the initial application of IFRS 16.
EBITDA recorded an increase of €23.7 million to €169.5 million (+16.3%). In addition, the development of the US dollar had a positive effect on the segment EBITDA. Despite higher depreciation and amortization (+€22.4 million), primarily in connection with the Group company Fraport USA (+€19.0 million) due to the application of IFRS 16, the segment EBIT at €83.6 million was €1.3 million above the previous year’s level (+1.6%).

Fraport Interim Report Q2/6M 2019 11
Development of the key Group companies outside of Frankfurt (IFRS values before consolidation): Fully consolidated Group companies € million Share in % Revenue1) EBITDA EBIT Result 6M 2019 6M 2018 Δ % 6M 2019 6M 2018 Δ % 6M 2019 6M 2018 Δ % 6M 2019 6M 2018 Δ % Fraport USA 100 38.6 25.6 +50.8 24.6 2.4 >100 2.7 0.2 >100 –1.7 0.0 – Fraport Slovenija 100 22.6 22.0 +2.7 8.5 8.6 –1.2 3.3 3.6 –8.3 2.6 3.1 –16.1 Fortaleza + Porto Alegre2) 100 162.8 76.4 >100 17.8 18.4 –3.3 11.7 11.7 – 4.9 3.5 +40.0 Lima 80.01 215.4 160.7 +34.0 65.4 59.0 +10.8 58.2 52.0 +11.9 40.5 33.9 +19.5 Fraport Greece3) 73.4 206.2 141.7 +45.5 46.8 41.3 +13.3 23.1 19.2 +20.3 –19.2 –20.7 – Twin Star 60 18.2 21.5 –15.3 7.6 11.3 –32.7 1.6 5.4 –70.4 –0.3 2.8 –
Group companies accounted for using the equity method € million Share in % Revenue1) EBITDA EBIT Result 6M 2019 6M 2018 Δ % 6M 2019 6M 2018 Δ % 6M 2019 6M 2018 Δ % 6M 2019 6M 2018 Δ % Antalya 51/504) 138.0 115.4 +19.6 112.8 90.8 +24.2 57.6 36.2 +59.1 27.2 4.4 >100 Pulkovo/Thalita 25 132.3 125.2 +5.7 75.9 65.9 +15.2 58.5 48.3 +21.1 6.4 –18.5 – Xi'an 24.5 130.7 123.2 +6.1 58.0 58.9 –1.5 34.0 35.5 –4.2 30.4 29.3 +3.8
Fully consolidated Group companies € million Share in % Revenue1) EBITDA EBIT Result Q2 2019 Q2 2018 Δ % Q2 2019 Q2 2018 Δ % Q2 2019 Q2 2018 Δ % Q2 2019 Q2 2018 Δ % Fraport USA 100 21.6 16.3 +32.5 14.0 2.0 >100 2.6 0.9 >100 0.5 0.7 –28.6 Fraport Slovenija 100 12.5 12.2 +2.5 4.9 5.3 –7.5 2.3 2.8 –17.9 1.8 2.4 –25.0 Fortaleza + Porto Alegre2) 100 76.7 45.6 +68.2 8.5 9.2 –7.6 5.5 5.8 –5.2 0.8 2.0 –60.0 Lima 80.01 126.8 84.4 +50.2 33.5 30.3 +10.6 29.9 26.8 +11.6 20.9 17.1 +22.2 Fraport Greece3) 73.4 128.2 97.4 +31.6 46.5 41.8 +11.2 34.4 30.7 +12.1 6.0 4.4 +36.4 Twin Star 60 15.0 18.0 –16.7 8.8 11.9 –26.1 5.8 8.9 –34.8 4.9 7.5 –34.7
Group companies accounted for using the equity method € million Share in % Revenue1) EBITDA EBIT Result Q2 2019 Q2 2018 Δ % Q2 2019 Q2 2018 Δ % Q2 2019 Q2 2018 Δ % Q2 2019 Q2 2018 Δ % Antalya 51/504) 112.5 92.3 +21.9 97.4 82.3 +18.3 70.1 55.1 +27.2 54.2 31.4 +72.6 Pulkovo/Thalita 25 77.6 73.9 +5.0 51.8 41.2 +25.7 43.4 32.1 +35.2 5.1 –4.0 – Xi'an 24.5 67.1 63.7 +5.3 30.0 29.8 +0.7 18.2 18.1 +0.6 17.0 14.7 +15.6 1) Revenue adjusted for IFRIC 12: Lima 6M 2019: €168.7 million (6M 2018: €148.9 million); Q2 2019: €86.9 million (Q2 2018: €77.3 million); Fraport Greece 6M 2019: €103.1 million (6M 2018: €92.3 million); Q2 2019: €80.5 million (Q2 2018: €72.2 million); Fortaleza + Porto Alegre 6M 2019: €43.5 million (6M 2018: €43.8 million); Q2 2019: €20.5 million (Q2 2018: €21.5 million); Antalya 6M 2019: €136.4 million (6M 2018: €109.8 million); Q2 2019: €112.5 million (Q2 2018: €92.3 million). Pulkovo/Thalita: 6M 2019: €131.6 million; Q2 2019: €76,9 million. 2) Sum of the Group companies Fortaleza and Porto Alegre. 3) The Group companies Fraport Regional Airports of Greece A and Fraport Regional Airports of Greece B are collectively referred to as “Fraport Greece”. 4) Share of voting rights: 51%, Dividend share: 50%.
The Group company Fraport USA generated revenue amounting to €38.6 million (+€13.0 million) in the first six months of 2019. The main driver of this increase (+€12.5 million) was the take-over of operations of the concessions in New York and Nashville. The revenue item includes a positive exchange rate effect of €2.6 million. EBITDA increased by +€22.2 million to €24.6 million. The increase was primarily in connection with the drop in expenses due to the application of IFRS 16 (+€19.9 million). Given significantly higher depreciation and amortization due to the initial application of IFRS 16 (+€19.0 million), EBIT amounted to €2.7 million (+€2.5 million). The result was –€1.7 million due to higher interest expenses in connection with the application of IFRS 16.
Passenger growth in the first half of 2019 was reflected in increased revenue at the Group company Fraport Slovenija (+2.7%). The positive effects from the application of IFRS 16 were offset by slightly higher personnel expenses and cost of materials based on traffic volume. This led to EBITDA of €8.5 million (–€0.1 million) and EBIT of €3.3 million (–€0.3 million). The result was €2.6 million (–€0.5 million).
In the reporting period, the Brazilian airports Fortaleza and Porto Alegre reported due to currency exchange rates a slight decline in adjusted revenue in connection with the capacitive capital expenditure based on the application of IFRIC 12. EBITDA and EBIT were also slightly below the previous year’s figures due to the conversion into the Group’s currency, the €. Adjusted for the revenue

Fraport Interim Report Q2/6M 2019 12
relating to capacitive capital expenditure based on the application of IFRIC 12, revenue was €43.5 million (–€0.3 million). The improved interest result led to an increase in the result of €1.4 million to reach €4.9 million.
Thanks to the sharp rise in traffic, the Group company Lima posted an increase in revenue in the first half of 2019 of €54.7 million to €215.4 million (+34.0%). Adjusted for the revenue relating to capacitive capital expenditure based on the application of IFRIC 12, revenue was €168.7 million (+€19.8 million or +13.3%). Higher personnel expenses and increased cost of materials based on traffic volume, in particular due to higher concession fees, resulted in EBITDA of €65.4 million (+€6.4 million), which was positively influenced by the conversion into the Group’s currency, the €. With depreciation and amortization remaining constant and an improved financial result, mainly due to realized currency exchange rate gains, EBIT amounted to €58.2 million (+€6.2 million) and a result of €40.5 million (+€6.6 million).
Fraport Greece generated revenue amounting to €206.2 million (+45.5%) in the first six months of 2019. Adjusted for the revenue relating to capacitive capital expenditure based on the application of IFRIC 12, revenue increased by 11.7% to €103.1 million (+€10.8 million). Adjusted for the expenses relating to capacitive capital expenditure, the cost of materials and personnel expenses increased slightly by €4.5 million based on traffic volume. This led to EBITDA and EBIT of €46.8 million and €23.1 million respec-tively (+€5.5 million and +€3.9 million respectively). The negative financial result led to an overall result of –€19.2 million (+€1.5 million).
The negative traffic development at the Group company Twin Star led to a decline in revenue and earnings figures in the reporting period. In addition, slightly higher personnel expenses due to wage increases had a burdening effect on Group EBITDA. The result was negative at –€0.3 million (–€3.1 million).
Owing to the significantly higher passenger volume in international traffic, the Group company Antalya, which is accounted for using the equity method, recorded a significant increase in financial figures in the first six months of 2019, and these developed positively with significantly double-digit growth rates.
The Group company Pulkovo/Thalita reported sound passenger growth in the reporting period. The revenue adjusted for the revenue relating to capacitive capital expenditure based on the application of IFRIC 12 increased by 5.1% to €131.6 million (+€6.4 million). In addition to an increase in revenue, the rise in EBITDA and EBIT resulted from a decline in operating expenses. The improved financial result led to a result of €6.4 million (6M 2018: –€18.5 million).
The positive traffic development in the Group company Xi’an in the first half of 2019 was also reflected in revenue, which increased by 6.1% to €130.7 million (+€7.5 million). Increased operating expenses led to a slight decline in EBITDA compared to the previous year (–€0.9 million). At €30.4 million, the result rose slightly (+€1.1 million).
Asset and Financial Position
Asset and capital structure At €12,259.7 million, total assets as at June 30, 2019 were €810.6 million above the comparable value as at December 31, 2018 (+7.1%). Non-current assets increased by €833.4 million to €10,939.8 million. This is primarily attributable to the increase in property, plant, and equipment based on the first-time application of IFRS 16 (+€318.6 million) as well as increased capital ex-penditure (+€228.9 million) from the Airport Expansion South project at the Frankfurt site, including an advance payment (+€112.1 million) for Pier G to the general contractor. Higher investments in airport operating projects in connection with Fraport Greece and the Group companies Fortaleza, Porto Alegre, and Lima increased the eponymous balance sheet item (+€309.9 million). Current assets amounting to €1,319.9 million remained almost unchanged compared to the 2018 balance sheet date (–0.4%).
Shareholders’ equity decreased slightly compared to the 2018 balance sheet date to €4,329.2 million (–0.9%). Given the positive Group result, this is primarily due to the pay-out of profit earmarked for distribution for the previous fiscal year. The non-controlling interests decreased due to the purchase of an additional 10.0% of shares in Lima Airport Partners S.R.L. (see also the “Significant Events” chapter beginning on page 4). The shareholders' equity ratio was at 34.0% (December 31, 2018: 34.9%). Non-current liabilities increased significantly by €1,010.5 million to €6,667.4 million (+17.9%) due to new additions of long-term financial liabilities in Fraport AG (+€432 million), the Group companies Fortaleza and Porto Alegre (+€203 million) and Fraport Greece

Fraport Interim Report Q2/6M 2019 13
(+€102 million). The application of IFRS 16 led to an increase in other liabilities. Current liabilities dropped noticeably in the reporting period by €152.3 million to €1,263.1 million (–10.8%). Higher other liabilities, in part as a result of the application of IFRS 16, were offset by repayments of financial liabilities and lower other provisions.
Gross debt was €5,247.3 as at June 30, 2019 (December 31, 2018: €4,708.6 million). Liquidity slightly declined by €19.2 million to €1,144.0 million. As a result of the higher capital expenditure in Frankfurt and the international Group companies, the net financial debt correspondingly rose by €557.9 million to €4,103.3 million (December 31, 2018: €3,545.4 million). The gearing ratio reached a level of 98.4% (December 31, 2018: 88.7%).
Additions to non-current assets In the first six months of fiscal year 2019, additions to non-current assets of the Fraport Group amounted to €1,158.5 million and were thus significantly above the previous year's figure of €342.1 million. Of this amount, €707.0 million was attributed to "property, plant, and equipment" (6M 2018: €196.5 million), of which €340.1 million was due to the application of IFRS 16, €103.9 million to “financial assets” (6M 2018: €45.7 million), €0.7 million to “investment property” (6M 2018: €0.5 million), and €346.9 million to “other intangible assets” and “airport operating projects” (6M 2018: €99.4 million). The capitalization of interest expenses relating to construction work amounted to €25.8 million (6M 2018: €12.4 million).
At €382.9 million, the greater part of additions to property, plant, and equipment were attributed to Fraport AG (6M 2018: €184.6 million). The focus was thereby on capital expenditure to increase capacity in the Airport Expansion South project – mainly relating to Terminal 3 at the Frankfurt site – as well as modernization and maintenance measures for existing infrastructure. Additions to non-current financial assets consisted mainly of securities. The progress in the construction activities at Fraport Greece as well as at the Group companies Fortaleza and Porto Alegre was reflected in the investments in airport operating projects. In the first six months of 2019, measures for the environmental rehabilitation of the expansion areas were initiated at the Group company Lima. These included necessary preparations for the construction of the second runway, and the start of con-struction is now scheduled for the second half of 2019 (see also the 2018 Group Management Report, chapter “Risk and Oppor-tunities Report” beginning on page 117).
Statement of cash flows Cash flow from operating activities (operating cash flow) increased by 13.0% to €367.5 million in the first six months of 2019. The increase of €42.3 million was mainly due to the good operating performance across the Group. The application of IFRS 16 increased the operating cash flow by €22.8 million. Adjusted for the changes to net current assets included in the statement of cash flows, the increase was €41.5 million (+11.3%).
Cash flow used in investing activities excluding investments in cash deposits and securities increased by €309.9 million to €644.2 million (6M 2018: €334.3 million). The main reasons for this were higher investments at the Frankfurt site, among other things due to an advance payment (+€112.1 million) for Pier G to the general contractor as well as increased investments at Fraport Greece and the Group companies Fortaleza, Porto Alegre, and Lima. The dividends from the Group company Antalya, which is accounted for using the equity method, (+€56.0 million) had an offsetting effect on the cash outflow. Excluding the effects from the application of IFRS 16, the free cash flow was –€305.7 million (6M 2018: –€23.2 million).
Taking into account investments in and revenue from securities and promissory note loans as well as repayments of time deposits, the overall cash flow used in investing activities was €646.5 million (6M 2018: cash outflow of €299.1 million).
The significantly higher taking up of non-current financial liabilities in comparison to the previous year to finance the expansion investments both in Frankfurt and in international business led to a cash flow from financing activities in the amount of €250.5 million (6M 2018: cash outflow of €12.7 million). The payment in the amount of €40.3 million to purchase the additional shares in Lima Airport Partners reduced the cash flow from financing activities (see also the “Significant Events” chapter on page 4). Taking into account exchange rate fluctuations and other changes, Fraport reported cash and cash equivalents based on the statement of cash flows of €603.9 million as at June 30, 2019 (June 30, 2018: €499.5 million).

Fraport Interim Report Q2/6M 2019 14
Reconciliation to the cash and cash equivalents as shown in the consolidated statement of financial position € million June 30, 2019 June 30, 2018 December 31, 2018
Cash and cash equivalents in the consolidated statement of cash flows 603.9 499.5 598.2 Time deposits with a remaining term of more than three months 129.4 93.0 108.8 Restricted cash 64.2 32.1 94.3 Cash and cash equivalents in the consolidated statement of financial position 797.5 624.6 801.3
Value Management
The schedule for reporting value management is once a year at the end of the fiscal year. It is not reported quarterly.
Non-financial Performance Indicators
Non-financial performance indicators 6M 2019 6M 2018 Change
Global satisfaction (Frankfurt) (%)1) 88 85 +3 PP Baggage connectivity (Frankfurt) (%) 98.5 98.4 +0.1 PP Employee satisfaction2) – – – Women in management positions (Germany) (%) 27.6 26.5 +1.1 PP Sickness rate (%)3) 7.4 – – CO2 emissions (t)4) 112,052 – – 1) Global satisfaction is surveyed quarterly only at the Frankfurt site. The Group airports report on this on an annual basis. 2) Employee satisfaction is only surveyed on an annual basis. 3) Reporting on a six months basis for the sickness rate was initially implemented in the 2019 fiscal year. 4) The interim Group-wide reporting was initially implemented in the 2019 fiscal year. As a result of subsequent verifications, there may be changes to the figures.
Customer satisfaction and product quality Global satisfaction of passengers The global satisfaction of passengers at the Frankfurt site increased by 3 percentage points to 88% in the first half of 2019 and was higher than the previous year's figure. Both the first and second quarters of 2019 showed this figure (Q1 2018: 85%, Q2 2018: 86%). Passengers’ willingness to recommend increased by 2 percentage points to 83%. Satisfaction with the cleanliness of the terminals as well as with the comfort and equipment of the departure gates developed positively during the reporting period.
Baggage connectivity Baggage connectivity at the Frankfurt site was 98.5% in the first half of 2019, slightly above the previous year’s level (6M 2018: 98.4%). This is mainly due to fewer flight delays because of bad weather compared to the previous year.
Attractive and responsible employer Employee satisfaction The employee satisfaction survey will be launched in the participating Group companies towards the end of the third quarter of 2019.
Women in management positions As at June 30, 2019, the proportion of women in management positions at the first and second levels directly below Fraport’s Executive Board was in Germany 27.6% (6M 2018: 26.5%). The slight increase in the ratio is due to both personnel and organi-zational changes. In particular, this is due to two positions that remain vacant compared to the previous year as well as one position that has now been filled by a female manager. In addition, two other positions were not filled due to organizational

Fraport Interim Report Q2/6M 2019 15
changes, as the tasks were integrated into existing areas. There were no personnel changes in the Group companies in Germany during the reporting period.
Occupational health and safety Sickness rate The Group sickness rate was 7.4%. Since the reporting on a six months basis for the sickness rate was implemented for the first time in fiscal year 2019, it is not possible to make a comparison with the previous year.
Climate protection CO2 emission In the first six months of 2019, the Fraport Group's CO2 emissions totaled 112,052 t. Thereof, 88,039 t (approximately 79%) were attributable to the activities of Fraport AG: its emissions were down 9.4% in comparison with the previous year. The reduction in emissions is due to energy savings resulting from the implementation of efficiency projects, changes in weather conditions and an improvement in emission factors for electricity and district cooling. As interim Group-wide reporting was implemented for the first time in the 2019 fiscal year, it is not possible to compare the Group's CO2 emissions with the previous year.
Employees
Development of the employees Average number of employees 6M 2019 6M 2018 Change Change in %
Fraport Group 22,389 21,614 +775 +3.6
thereof Fraport AG 9,701 9,919 –218 –2.2 thereof Group companies 12,688 11,695 +993 +8.5 thereof in Germany 19,311 18,712 +599 +3.2 thereof abroad 3,078 2,902 +176 +6.1
Q2 2019 Q2 2018 Change Change in %
Fraport Group 22,629 22,002 +627 +2.8
thereof Fraport AG 9,676 9,885 –209 –2.1 thereof Group companies 12,953 12,117 +836 +6.9 thereof in Germany 19,223 18,720 +503 +2.7 thereof abroad 3,406 3,282 +124 +3.8
Compared with the same period of the previous year, the average number of employees in the Fraport Group (excluding appren-tices and employees on leave) increased slightly to 22,389 in the first half of 2019 (6M 2018: 21,614). At Fraport AG, there was a reduction in the number of staff (–218 employees), primarily as a result of the staff restructuring program initiated in the 2016 fiscal year. This was offset by the increased need for manpower at the Group companies FraGround (+298 employees), FraSec (+253 employees), and FraCareS (+194 employees) due to higher traffic volume. Outside of Germany, the need for manpower increased at Fraport Greece (+64 employees) as well as the Group companies Lima (+63 employees), and Fortaleza and Porto Alegre (+62 employees). The lower headcount at the Group company Twin Star (–63 employees) had an offsetting effect.

Fraport Interim Report Q2/6M 2019 16
Development of total employees Development of the employees as at the balance sheet date June 30, 2019 June 30, 2018 Change Change in %
Fraport Group 24,362 23,745 +617 +2.6
thereof Fraport AG 10,454 10,582 –128 –1.2 thereof Group companies 13,908 13,163 +745 +5.7 thereof in Germany 20,458 19,888 +570 +2.9 thereof abroad 3,904 3,857 +47 +1.2
Joint ventures 2,834 2,665 +169 +6.3
Compared with the same date of the previous year, the number of employees in the Fraport Group (employees including temporary employees, apprentices, and employees on leave) increased to 24,362 as at June 30, 2019 (June 30, 2018: 23,745 employees). This increase is mainly due to an increased number of personnel employed by both German and foreign Group companies (+786 employees) due to higher traffic volume.
Research and Development
As stated in the 2018 Group Management Report, as a service-sector group, Fraport does not engage in research and develop-ment in the strict sense, therefore further disclosures in accordance with GAS 20 do not apply (see also the 2018 Group Manage-ment Report, chapter “Research and Development”, page 106). However, Fraport continues to utilize suggestions for improve-ments and innovations from employees, which play a successful role in retaining and expanding its international competitiveness (see also the 2018 Group Management Report, chapter “Opportunities report”, beginning on page 125).
There were no significant changes resulting from ideas and innovations influencing business development in the reporting period.
Share
Share performance The German equity markets performed positively in the first half of 2019. At 12,398 points, Germany’s benchmark index DAX closed 17.4% above the 2018 fiscal year’s closing price. In the same period, the MDAX also increased significantly by 18.7% and closed at 25,619 points as at the end of the first six months of 2019. The DAX and MDAX had already gained 9.2% and 14.5% respectively in the first quarter of 2019. The positive trend on the German stock exchange continued in the second quarter of 2019.
90
100
110
120
130
January 1, 2019 June 30, 2019
Faport AG DAX MDAX Aéroports de Paris Zurich Airport AENAVienna Airport
2019 development of the Fraport share compared to the market and European competitors
in % (index base 100)

Fraport Interim Report Q2/6M 2019 17
Despite weaker global economic growth in the first half of 2019, mainly due to the ongoing trade dispute between the US and China, as well as the further uncertainty over the progress of the UK’s exit from the EU, overall in the first six months of the year financial markets developed positively. This was mainly due to the fact that the key interest rates in the euro area remained at an all-time low and that an increase in the current year is not foreseeable.
In this market environment, the Fraport share also performed positively, with a closing price of €75.60. After a rise in price of 9.3% in the first quarter, the share price gained 10.8% in the second quarter; overall the increase in the reporting period was 21.0%, or, taking into account the dividend payment on May 31, 2019 of €2.00 per share, 24.2%. The growth in traffic volume in Frankfurt and at almost all Group airports, the positive development of net retail revenue per passenger, and the increase in the dividend for fiscal year 2018 increased investor confidence in the first half of 2019, which is why the Fraport share rose in value during the reporting period.
The prices of shares of other stock-exchange listed European airport operators performed as follows in the reporting period: AENA +29.0%, Aéroports de Paris –6.2%, Vienna Airport +14.4%, and Zurich Airport +13.1%.
Development of the Fraport share 6M 2019 6M 2018
Opening price in € 62.46 91.86 Closing price in € 75.60 82.62 Change in €1) +13.14 –9.24 Change in %2) +21.0 –10.1 Highest price in € (daily closing price) 77.00 96.94 Lowest price in € (daily closing price) 61.44 78.26 Average price in € (daily closing prices) 70.64 85.05 Average trading volume per day (number) 143,031 162,529 Market capitalization in € million (quarterly closing price) 6,991 7,640 1) Change including dividends: 6M 2019: +€15.14, Q2 2019: +€9.36 2) Change including dividends: 6M 2019: +24.2 %, Q2 2019: +13.7 %
Development in shareholder structure Fraport was notified of the following changes in shareholder structure in the past reporting period:
Notification of voting rights pursuant to Sections 33 and 34 of the German Securities Trading Act (WpHG) Holders of voting rights Date of change Type of change New share of voting rights
BlackRock, Inc.1) January 3, 2019 Exceeded the 3% threshold 3.11% BlackRock, Inc.1) January 15, 2019 Exceeded the 3% threshold 3.08% BlackRock, Inc.1) January 25, 2019 Fallen below the 3% threshold 2.92% BlackRock, Inc.1) June 5, 2019 Exceeded the 3% threshold 3.01% BlackRock, Inc.1) June 6, 2019 Fallen below the 3% threshold 2.82% 1) All voting rights were allocated pursuant to Section 34 of the WphG.

Fraport Interim Report Q2/6M 2019 18
1) The relative ownership interests were adjusted to the current total number of shares as at June 30, 2019 and therefore may differ from the figures given at the time of reporting or from the respective shareholders’ own disclosure. Shares below 3% are classified under “free float”.
Dividend for the 2018 fiscal year (resolution for the appropriation of profit) For fiscal year 2018, the Annual General Meeting passed a resolution on May 28, 2019 to increase the dividend by 33% to €2.00 per share. Compared to the share closing price in 2018 of €62.46, this corresponded to a dividend yield of 3.2% (previous year: 1.6%). The profit earmarked for distribution of €184.9 million (previous year: €138.7 million) equated to a pay-out ratio of 39.0% based on the profit attributable to shareholders of Fraport AG of the Group result of €473.9 million (previous year: 42.0%).
Events after the Balance Sheet Date
There were no significant events for the Fraport Group after the balance sheet date.
Shareholder structure as at June 30, 2019in %
State of Hesse31.31
Stadtwerke Frankfurt am Main Holding GmbH
20.16
Deutsche Lufthansa AG8.44
Free Float35.07
5.02Lazard Asset Management
LLC
1)

Fraport Interim Report Q2/6M 2019 19
Risk and Opportunities Report
In the first half of 2019, there were no substantial changes to the risks and opportunities as presented in the Risk and Opportunities Report in the 2018 Annual Report starting on page 113.
Report on Forecast Changes
General Statement by the Executive Board
For the second half of 2019, the Executive Board expects the global economy to show continued, albeit less dynamic growth. This will have a positive impact on the development of air traffic in general as well as on the Frankfurt site and the Fraport Group’s airports. Based on the passenger development in the first half of 2019 at Frankfurt Airport, the Executive Board expects continued passenger growth between around 2% and roughly 3% predicted in the Group Management Report for the fiscal year 2019. Internationally, the number of passengers in the first half of 2019 at Varna and Burgas Airports will show a temporarily negative passenger trend of up to 10% for the full year 2019. For the other Group airports, the Executive Board maintains its traffic forecasts.
Following the end of the first half of the year 2019, the Executive Board maintains its forecasts for the Group’s asset, financial, and earnings position for the fiscal year 2019. For the Aviation segment, the Executive Board expects a slight decline in segment EBIT due to higher depreciation and amortization. The forecasts for the Retail & Real Estate, Ground Handling, and International Activities & Services segments remain unchanged (see 2018 Group Management Report, chapter “Business Outlook” page 131 et seqq.).
At the closing of the reporting period, the Executive Board continues to assess that there are no significant risks that might jeop-ardize the Fraport Group as a going concern. There are no substantial acquisitions or disposals of companies and increases and reductions in shares included in the forecast for the current fiscal year. The Executive Board continues to assess the financial situation in the forecast period as stable.
Business Outlook
Forecasted situation of the Group for 2019 The forecasted situation of the Fraport Group for 2019, as presented in the 2018 Group Management Report, remains unchanged with respect to business model, structure, competitive position, strategy, and control (see 2018 Group Management Report, chap-ter “Business Outlook”, page 131 et seqq.).
Forecasted macroeconomic, legal, and industry-specific conditions for 2019 Development of the macroeconomic conditions Financial and economic institutions expect continued dynamic growth in the global economy for 2019 of around 2.7%. According to current forecasts, global trade will rise by 0.6%. Trade restrictions between the US and China, possible additional tariffs and the uncertainly surrounding the UK’s exit from the EU are fueling uncertainty in the industrial sector, dampening trade activity, and reducing willingness to invest. The ifo Institute assumes that oil prices will rise in the long term. Emerging countries are being pulled in two different directions. The macroeconomic dynamics of China and Asian countries closely linked to China will slow. The other emerging economies will grow strongly.
After a dynamic rebound in the economy in the first quarter, the euro area will see subdued development during the rest of the year. In its forecast, the IMF predicts a 1.3% increase in real European gross domestic product (2018: +1.9%). The € will remain relatively weak against the US dollar, which strengthens price competitiveness.

Fraport Interim Report Q2/6M 2019 20
The slower dynamics of the German economy will continue. Since mid-2018, leading indicators such as the ifo Business Climate Index and the Purchasing Managers’ Index for Germany have continued to worsen. Institutions and banks now expect an increase in real German gross domestic product of only 0.4% to 1%.
The following GDP growth rates are expected for the countries with substantial investments: Slovenia +3.4%, Brazil +2.1%, Peru +3.9%, Greece +2.4%, Bulgaria +3.3%, Turkey –2.5%, Russia +1.2%, and China +6.2%.
Sources: IMF (April 2019, July 2019), ifW (2019 Q2), ifo Economic Forecast Summer 2019 from ifo Schnelldienst 12/2019 (June 2019), IMK Report (June 2019), DIW (June 2019), RWI (June 2019), Commerzbank (July 19, 2019), Deutsche Bank (July 2019), Deka Bank (July/August 2019).
Development of the legal conditions No changes to the legal environment that would have a significant influence on the business development of Fraport can currently be discerned.
Development of the industry-specific conditions Based on the expected development of economic conditions, and taking into account the financial situation of the airlines, IATA anticipates global passenger growth of 5.0% in 2019, based on sold revenue passenger kilometers (RPK). Regionally, IATA anticipates the following growth rates (also based on RPK): Europe: +4.9%, North America: +4.3%, Asia-Pacific: +6.3%, Latin America: +6.2%, Middle East: +2.0%, and Africa: +4.3%. Globally, cargo is expected to stagnate (0.0%).
Sources: IATA “Airline Industry Economic Performance” (2019 Mid-year report, June 2, 2019).
Forecasted business development for 2019 Based on the passenger development in the first half of 2019 at Frankfurt Airport, the Executive Board expects continued pas-senger growth between around 2% and roughly 3% predicted in the Group Management Report for the fiscal year 2019.
After the last few weak months, the cargo tonnage handled, on the other hand, is likely to fall slightly in 2019, posting a decline in the low single-digits compared to the previous year (forecast in the 2018 Annual Report: stagnation to a slight increase).
Internationally, based on the number of passengers in the first half of 2019 at Varna and Burgas Airports, the Executive Board expects a temporarily negative passenger trend of up to 10% for the full year 2019 (forecast in the 2018 Annual report: growth rate in the low single-digit percentage range). This is mainly due to the closure of the Ryanair hub at Burgas Airport and the relocation of passenger flows to other tourist destinations such as northern Africa and Turkey.
For the other Group airports, the Executive Board maintains its traffic forecasts (see 2018 Group Management Report, chapter “Business Outlook”, page 131 et seqq.).
Forecasted results of operations for 2019 At the end of the first half of 2019, the Executive Board maintains its forecasts for the Group's asset, financial, and earnings position for the fiscal year 2019 (see 2018 Group Management Report, chapter “Business Outlook”, page 131 et seqq.).
Group EBITDA and EBIT will be within the ranges forecasted in the 2018 Group Management Report (forecast in the 2018 Annual Report: Group EBITDA between around €1,160 million and approximately €1,195 million, and Group EBIT between about €685 million and around €725 million). The Executive Board continues to expect the Group EBT and result to be within the forecasts made in the 2018 Group Management Report (forecast in the 2018 Annual Report: Group EBT between around €570 million and approximately €615 million, and Group result between around €420 million and about €460 million).

Fraport Interim Report Q2/6M 2019 21
Forecasted segment development for 2019 At the end of the first half of 2019, the Executive Board maintains its revenue and earnings outlook for the Retail & Real Estate, Ground Handling, and International Activities & Services segments for the full year 2019 (see 2018 Group Management Report, chapter “Business Outlook”, page 131 et seqq.).
In the Aviation segment, the Executive Board now expects segment EBIT to decline slightly due to higher depreciation and amor-tization (forecast in the 2018 Annual Report: segment EBIT approximately at the previous year’s level). The forecasts for segment revenue as well as segment EBITDA remain unchanged (forecast in the Annual Report: revenue growth of up to 3%, EBITDA approximately at the level or slightly above the previous year’s level).
Forecasted non-financial performance indicators for 2019 The Executive Board also confirms its forecast for the development of the non-financial performance indicators in the 2019 fiscal year (see 2018 Group Management Report, chapter “Business Outlook”, page 131 et seqq.).
Where the statements made in this document relate to the future rather than the past, they are based on a number of assumptions about future events and are subject to a number of uncertainties and other factors, many of which are beyond the control of Fraport AG Frankfurt Airport Services Worldwide and which could have the effect that the actual results will differ materially from these statements. These factors include, but are not limited to, the competitive environment in deregulated markets, regulatory changes, the success of business operations, and a substantial deterioration in basic economic conditions in the markets in which Fraport AG Frankfurt Airport Services Worldwide and its Group companies operate. Readers are cautioned not to rely to an inappropriately large extent on statements made about the future.

Fraport Interim Report Q2/6M 2018 22
Group Interim Financial Statements
Consolidated Income Statement (IFRS)
€ million 6M 2019 6M 2018 Q2 2019 Q2 2018
Revenue 1,783.0 1,532.2 979.2 850.5 Change in work-in-process 0.2 0.1 0.0 0.0 Other internal work capitalized 18.2 16.2 9.4 7.8 Other operating income 23.3 19.1 5.8 7.2 Total revenue 1,824.7 1,567.6 994.4 865.5 Cost of materials –612.3 –432.3 –324.1 –231.0 Personnel expenses –618.5 –586.0 –318.4 –301.9 Other operating expenses –82.4 –88.0 –41.0 –46.0 EBITDA 511.5 461.3 310.9 286.6
Depreciation and amortization –232.4 –192.4 –117.9 –100.0 EBIT/Operating result 279.1 268.9 193.0 186.6 Interest income 20.1 13.6 11.2 7.2 Interest expenses –105.1 –102.3 –55.2 –51.8 Result from companies accounted for using the equity method 16.1 5.0 26.9 18.0 Other financial result 4.6 6.3 2.4 5.3 Financial result –64.3 –77.4 –14.7 –21.3 EBT/Result from ordinary operations 214.8 191.5 178.3 165.3 Taxes on income –49.9 –50.7 –41.4 –44.1 Group result 164.9 140.8 136.9 121.2
thereof profit attributable to non-controlling interests 7.7 6.2 10.2 9.7 thereof profit attributable to shareholders of Fraport AG 157.2 134.6 126.7 111.5
Earnings per €10 share in € basic 1.70 1.46 1.37 1.21 diluted 1.70 1.45 1.37 1.20

Fraport Interim Report Q2/6M 2018 23
Consolidated Statement of Comprehensive Income (IFRS)
€ million 6M 2019 6M 2018 Q2 2019 Q2 2018
Group result 164.9 140.8 136.9 121.2
Remeasurements of defined benefit pension plans –5.2 0.1 –1.7 0.0 (deferred taxes related to those items 1.6 0.0 0.5 0.0) Equity instruments measured at fair value 15.7 –1.6 14.5 –1.6 Other comprehensive income of companies accounted for using the equity method 0.3 0.1 –0.1 0.1 (deferred taxes related to those items 0.0 0.0 0.1 0.0)
Items that will not be reclassified subsequently to profit or loss 12.4 –1.4 13.3 –1.5 Fair value changes of derivatives
Changes recognized directly in equity 4.2 10.9 9.8 11.7 Realized gains (+)/losses (–) 5.7 2.0 9.6 7.6 –1.5 8.9 0.2 4.1
(deferred taxes related to those items –0.2 –2.8 –0.3 –1.4) Debt instruments measured at fair value
Changes recognized directly in equity 4.3 –2.0 1.2 1.9 Realized gains (+)/losses (–) 0.0 0.0 0.0 0.0 4.3 –2.0 1.2 1.9
(deferred taxes related to those items –1.3 0.6 –0.3 0.4) Currency translation of foreign Group companies
Changes recognized directly in equity 7.6 –23.4 –2.2 –9.5
Income and expenses from companies accounted for using the equity method directly recognized in equity
Changes recognized directly in equity 1.2 2.7 –0.5 1.5 Realized gains (+)/losses (–) 0.0 0.0 0.0 0.0 1.2 2.7 –0.5 1.5
(deferred taxes related to those items 0.0 0.0 0.0 0.0) Items that will be reclassified subsequently to profit or loss 10.1 –16.0 –1.9 –3.0 Other result after deferred taxes 22.5 –17.4 11.4 –4.5 Comprehensive income 187.4 123.4 148.3 116.7
thereof attributable to non-controlling interests 6.6 8.3 8.3 13.3 thereof attributable to shareholders of Fraport AG 180.8 115.1 140.0 103.4

Fraport Interim Report Q2/6M 2018 24
Consolidated Statement of Financial Position (IFRS)
Assets € million June 30, 2019 December 31, 2018
Non-current assets Goodwill 19.3 19.3 Investments in airport operating projects 3,154.2 2,844.3 Other intangible assets 136.5 134.5 Property, plant and equipment 6,601.4 6,081.7 Investment property 88.9 88.8 Investments in companies accounted for using the equity method 227.7 260.0 Other financial assets 459.7 426.1 Other receivables and financial assets 194.1 195.0 Deferred tax assets 58.0 56.7 10,939.8 10,106.4
Current assets Inventories 28.1 28.9 Trade accounts receivable 244.0 177.9 Other receivables and financial assets 232.2 304.3 Income tax receivables 18.1 13.1 Cash and cash equivalents 797.5 801.3 1,319.9 1,325.5 Non-current assets held for sale 0.0 17.2
Total 12,259.7 11,449.1
Liabilities and equity € million June 30, 2019 December 31, 2018
Shareholders’ equity Issued capital 923.9 923.9 Capital reserve 598.5 598.5 Revenue reserves 2,645.9 2,657.9 Equity attributable to shareholders of Fraport AG 4,168.3 4,180.3 Non-controlling interests 160.9 187.7 4,329.2 4,368.0 Non-current liabilities Financial liabilities 4,837.4 4,100.3 Trade accounts payable 44.5 45.5 Other liabilities 1,289.5 1,016.7 Deferred tax liabilities 229.0 228.3 Provisions for pensions and similar obligations 37.4 31.7 Provisions for income taxes 75.7 74.2 Other provisions 153.9 160.2 6,667.4 5,656.9 Current liabilities Financial liabilities 409.9 608.3 Trade accounts payable 281.3 286.5 Other liabilities 396.7 275.6 Provisions for income taxes 31.1 43.9 Other provisions 144.1 201.1 1,263.1 1,415.4 Liabilities related to assets held for sale 0.0 8.8 Total 12,259.7 11,449.1

Fraport Interim Report Q2/6M 2018 25
Consolidated Statement of Cash Flows (IFRS)
€ million 6M 2019 6M 2018 Q2 2019 Q2 2018
Profit attributable to shareholders of Fraport AG 157.2 134.6 126.7 111.5 Profit attributable to non-controlling interests 7.7 6.2 10.2 9.7 Adjustments for
Taxes on income 49.9 50.7 41.4 44.1 Depreciation and amortization 232.4 192.4 117.9 100.0 Interest result 85.0 88.7 44.0 44.6 Gains/losses from disposal of non-current assets 0.2 –3.1 0.2 1.7 Others –18.9 –15.1 –3.4 –10.5
Changes in the measurement of companies accounted for using the equity method –16.1 –5.0 –26.9 –18.0 Changes in inventories 0.8 1.6 0.3 –0.1 Changes in receivables and financial assets –40.0 –75.5 –44.2 –28.8 Changes in liabilities 32.3 53.2 47.1 61.2 Changes in provisions –32.9 –19.9 –21.3 –15.3 Operating activities 457.6 408.8 292.0 300.1 Financial activities Interest paid –32.6 –34.5 –27.7 –24.6 Interest received 8.8 5.0 4.6 2.3 Paid taxes on income –66.3 –54.1 –30.4 –33.1 Cash flow from operating activities 367.5 325.2 238.5 244.7 Investments in airport operating projects –378.2 –158.7 –200.0 –87.0 Capital expenditure for other intangible assets –9.1 –3.5 –6.9 –1.5 Capital expenditure for property, plant, and equipment –318.4 –196.5 –96.7 –122.7 Capital expenditure for "Investment property" –0.7 –0.5 –0.6 0.0 Investments in companies accounted for using the equity method –0.6 0.0 –0.6 0.0 Sale of consolidated subsidiaries 4.5 0.0 0.0 0.0 Dividends from companies accounted for using the equity method 56.6 10.8 18.4 10.2 Proceeds from disposal of non-current assets 1.7 14.1 1.2 0.0 Cash flow used in investing activities excluding investments in cash deposits and securities –644.2 –334.3 –285.2 –201.0 Financial investments in securities and promissory note loans –80.5 –53.0 –0.7 –10.0 Proceeds from disposal of securities and promissory note loans 98.8 68.6 55.3 18.0 Increase/decrease of time deposits with a term of more than three months –20.6 19.6 0.2 10.0 Cash flow used in investing activities –646.5 –299.1 –230.4 –183.0 Dividends paid to shareholders of Fraport AG –184.8 –138.6 –184.8 –138.6 Dividends paid to non-controlling interests –1.1 –1.1 –1.1 –1.1 Capital increase 0.0 0.0 0.0 0.0 Transactions with non-controlling interests –40.3 0.0 –40.3 0.0 Cash inflow from long-term financial liabilities 790.8 2.0 201.4 0.0 Repayment of long-term financial liabilities –211.3 –101.3 –89.6 –70.0 Changes in current financial liabilities –102.8 226.3 33.9 141.5 Cash flow from/used in financing activities 250.5 –12.7 –80.5 –68.2 Changes in restricted cash and cash equivalents 30.1 23.7 –5.2 23.7 Change in cash and cash equivalents 1.6 37.1 –77.6 17.2 Cash and cash equivalents as at January 1 and April 1 598.2 461.0 682.8 476.8 Foreign currency translation effects on cash and cash equivalents 4.1 1.4 –1.3 5.5 Cash and cash equivalents as at June 30 603.9 499.5 603.9 499.5

Fraport Interim Report Q2/6M 2018 26
Consolidated Statement of Changes in Equity (IFRS)
€ million Issued capital Capital reserve
As at January 1, 2019 923.9 598.5 Foreign currency translation effects – – Income and expenses from companies accounted for using the equity method directly recognized in equity – – Remeasurements of defined benefit pension plans – – Equity instruments measured at fair value – – Debt instruments measured at fair value – – Fair value changes of derivatives – – Other result – – Distributions – – Group result – – – – Consolidation activities / other changes – – As at June 30, 2019 923.9 598.5
As at January 1, 2018 923.9 598.5 Foreign currency translation effects – – Income and expenses from companies accounted for using the equity method directly recognized in equity – – Remeasurements of defined benefit pension plans – – Equity instruments measured at fair value – – Debt instruments measured at fair value – – Fair value changes of derivatives – – Other result – – Issue of shares for employee investment plan – – Distributions – – Group result – – Consolidation activities / other changes – – As at June 30, 2018 923.9 598.5
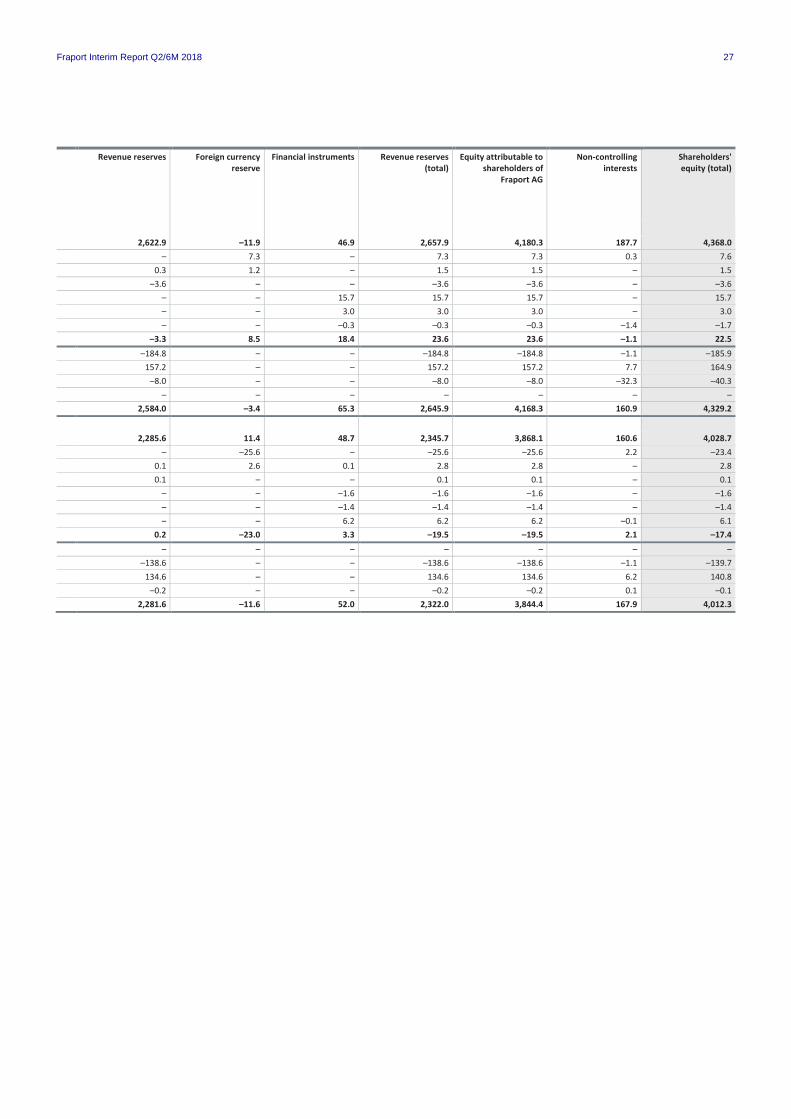
Fraport Interim Report Q2/6M 2018 27
Revenue reserves
Foreign currency reserve
Financial instruments Revenue reserves (total)
Equity attributable to shareholders of
Fraport AG
Non-controlling interests
Shareholders' equity (total)
2,622.9 –11.9 46.9 2,657.9 4,180.3 187.7 4,368.0
– 7.3 – 7.3 7.3 0.3 7.6 0.3 1.2 – 1.5 1.5 – 1.5 –3.6 – – –3.6 –3.6 – –3.6 – – 15.7 15.7 15.7 – 15.7 – – 3.0 3.0 3.0 – 3.0 – – –0.3 –0.3 –0.3 –1.4 –1.7 –3.3 8.5 18.4 23.6 23.6 –1.1 22.5 –184.8 – – –184.8 –184.8 –1.1 –185.9 157.2 – – 157.2 157.2 7.7 164.9 –8.0 – – –8.0 –8.0 –32.3 –40.3 – – – – – – – 2,584.0 –3.4 65.3 2,645.9 4,168.3 160.9 4,329.2
2,285.6 11.4 48.7 2,345.7 3,868.1 160.6 4,028.7
– –25.6 – –25.6 –25.6 2.2 –23.4 0.1 2.6 0.1 2.8 2.8 – 2.8 0.1 – – 0.1 0.1 – 0.1 – – –1.6 –1.6 –1.6 – –1.6 – – –1.4 –1.4 –1.4 – –1.4 – – 6.2 6.2 6.2 –0.1 6.1 0.2 –23.0 3.3 –19.5 –19.5 2.1 –17.4 – – – – – – – –138.6 – – –138.6 –138.6 –1.1 –139.7 134.6 – – 134.6 134.6 6.2 140.8 –0.2 – – –0.2 –0.2 0.1 –0.1 2,281.6 –11.6 52.0 2,322.0 3,844.4 167.9 4,012.3

Fraport Interim Report Q2/6M 2018 28
Segment Reporting (IFRS)
€ million Aviation Retail & Real Estate
Ground Handling International Activities &
Services
Reconciliation Group
Revenue 6M 2019 494.7 241.3 345.2 701.8 – 1,783.0 6M 2018 478.3 241.3 325.2 487.4 – 1,532.2
Other income 6M 2019 14.4 17.9 4.2 5.2 – 41.7 6M 2018 13.7 11.4 4.8 5.5 – 35.4
Income with third parties 6M 2019 509.1 259.2 349.4 707.0 – 1,824.7 6M 2018 492.0 252.7 330.0 492.9 – 1,567.6
Inter-segment income 6M 2019 40.1 103.7 23.5 192.9 –360.2 – 6M 2018 40.7 104.6 22.4 195.4 –363.1 –
Total income 6M 2019 549.2 362.9 372.9 899.9 –360.2 1,824.7 6M 2018 532.7 357.3 352.4 688.3 –363.1 1,567.6
EBITDA 6M 2019 121.9 196.5 23.6 169.5 – 511.5 6M 2018 120.7 182.1 12.7 145.8 – 461.3
Depreciation and amortization of segment assets
6M 2019 78.5 44.5 23.5 85.9 – 232.4 6M 2018 65.5 42.7 20.7 63.5 – 192.4
Segment result EBIT 6M 2019 43.4 152.0 0.1 83.6 – 279.1 6M 2018 55.2 139.4 –8.0 82.3 – 268.9
Carrying amounts of segment as-sets
June 30, 2019 3,963.0 2,381.3 622.6 5,216.6 76.2 12,259.7 December 31, 2018 3,827.0 2,294.1 591.6 4,666.6 69.8 11,449.1

Fraport Interim Report Q2/6M 2018 29
Selected Notes
Accounting and Valuation Methods
The 2018 consolidated financial statements were prepared in compliance with the International Financial Reporting Standards (IFRS) issued by the International Accounting Standards Board (IASB) and the interpretations thereof by the International Finan-cial Reporting Interpretations Committee (IFRS IC) as applicable in the European Union. These abbreviated interim financial statements of the Fraport Group for the period ending June 30, 2019 have been prepared in accordance with IAS 34. As far as they apply to the Fraport Group, all official bulletins of the IASB as at January 1, 2019 have been taken into account. The interim report also meets the requirements of German Accounting Standard No. 16 (GAS 16) on interim financial reporting.
With respect to the accounting and valuation methods applied in Group accounting, please see the 2018 Annual Report (see 2018 Annual Report beginning on page 152).
The interim financial statements were not reviewed or audited by an independent auditor.
Disclosures on Carrying Amounts and Fair Values
The following tables show the carrying amounts and fair values of financial instruments as at June 30, 2019, and December 31, 2018, respectively:
Financial instruments as at June 30, 2019 € million
Carrying Amount Fair Value Measurement categories
pursuant to IFRS 13 Measured at
amortized costs
FVOCI (without
recycling)
FVOCI (with
recycling)
FVTPL Level 1 Quoted
prices
Level 2 Derived
prices
Level 3 Prices that cannot be
derived Financial assets Cash and cash equivalents 797.5 797.5 N/A N/A N/A Trade accounts receivable 244.0 244.0 N/A N/A N/A Other financial receivables and assets 118.6 156.2 101.6 54.6 Current securities 89.2 89.2 79.2 10.0 Other financial assets
Non current Securities 253.8 253.8 253.8 Other investments 110.3 110.3 110.3 Loans to joint ventures 16.6 16.6 16.6 Loans to associated companies 84.8 122.3 122.3 Other loans 3.6 3.6 3.6
Total 1,265.1 110.3 343.0 0.0 1,793.5 333.0 131.8 287.2
Financial liabilities Trade accounts payable 325.8 326.0 326.0 Other financial liabilities 1,476.6 1,847.6 1,847.6 Financial liabilities 5,247.3 5,512.5 1,025.0 4,487.5 Derivative financial liabilities
Hedging derivatives 1) 14.1 14.1 Other derivatives 12.3 12.3 12.3
Share option 42.7 42.7 42.7 Total 7,049.7 0.0 0.0 55.0 7,755.2 1,025.0 6,687.5 42.7 1) Hedge accounting.

Fraport Interim Report Q2/6M 2018 30
Financial instruments as at December 31, 2018 € million
Carrying Amount Fair Value Measurement categories
pursuant to IFRS 13
Measured at amortized
costs
FVOCI (without
recycling)
FVOCI (with
recycling)
FVTPL Level 1 Quoted
prices
Level 2 Derived
prices
Level 3 Prices that cannot be
derived Financial assets Cash and cash equivalents 801.3 801.3 N/A N/A N/A Trade accounts receivable 177.9 177.9 N/A N/A N/A Other financial receivables and assets 126.5 148.4 100.8 47.6 Current securities 113.3 113.3 73.3 40.0 Other financial assets
Non current Securities 235.2 235.2 235.2 Other investments 94.6 94.6 94.6 Loans to joint ventures 17.2 17.2 17.2 Loans to associated companies 84.8 106.7 106.7 Other loans 3.6 3.6 3.6
Total 1,211.3 94.6 348.5 0.0 1,698.2 308.5 161.6 248.9
Financial liabilities Trade accounts payable 332.0 328.8 328.8 Other financial liabilities 1,010.7 1,268.1 1,268.1 Financial liabilities 4,708.6 4,843.0 1,031.7 3,811.3 Derivative financial liabilities
Hedging derivatives1) 12.0 12.0 Other derivatives 14.0 14.0 14.0
Share option 45.6 45.6 45.6 Total 6,051.3 0.0 0.0 59.6 6,511.5 1,031.7 5,434.2 45.6 1) Hedge accounting
Given the short terms, the carrying amounts of cash and cash equivalents, trade accounts receivable, and current other financial receivables and assets as at the reporting date correspond to the fair value.
The fair values of listed securities are identical to the stock market prices on the reporting date. The valuation of unlisted securities was based on market data applicable on the valuation date using reliable and specialized sources and data providers. The values are determined using established valuation models.
The fair values of loans to joint ventures and associated companies, as well as other non-current financial assets, are determined as the present value of future cash flows. Discounting was applied using the current maturity-linked interest rate as at the balance sheet date. The fair value of the loan including interest receivables to NCG is mainly affected by cash flow forecasts and interest rate developments.
The carrying amounts of other loans correspond to the respective fair values. Some of the other loans are subject to a market interest rate, and their carrying amounts therefore represent a reliable valuation for their fair values. Another part of the other loans is reported at present value as at the balance sheet date. The remaining other loans are promissory note loans with a remaining term of less than two years. Due to the lack of an active market, no information is available on the risk premiums of their respective issuers. As the promissory note loans are mainly floating interest rate loans, their carrying amounts were used as the most reliable value for their fair values.
Non-current liabilities are recognized at their present value. To determine fair value, the respective cash outflows are discounted at interest rates with similar terms and with the Fraport credit risk as at the reporting date. The carrying amounts of current liabilities are equal to the fair value. There is a general interest rate risk for fixed-interest loans that are extended at the ends of their terms.
In order to determine the fair value of financial liabilities, the future expected cash flows are determined and discounted based on the yield curve on the reporting date. The market-driven and maturity-linked risk premium of the respective borrower as at the reporting date is added to the cash flows.

Fraport Interim Report Q2/6M 2018 31
The derivative financial instruments relate to interest rate hedging transactions, two of which contain floors. The fair values of these interest swaps are determined on the basis of discounted future expected cash flows, using market interest rates corre-sponding to the terms to maturity. The calculation of the fair market value of the floors is based on a standard option pricing model.
The other investments categorized as Level 3 relate to the shares in Delhi International Airport Private Ltd. Until December 31, 2016, the fair value of the shares in Delhi International Airport Private Ltd. was determined based on a current bid and taking current exchange rates into account, and categorized as Level 2. Since June 30, 2017, the fair value has been determined based on a discounted cash flow valuation. The share option in Level 3 relates to shares in Fraport Greece A and Fraport Greece B. Fraport holds a short position. Another shareholder has the possibility to exercise his option for shareholders' equity shares once in the next five years.
The substantial non-observable input factors, both for the share option and the shares in Delhi International Airport Private Ltd., for determining the fair value, are the forecast cash flows, which are based on the company’s future earnings and planned capital expenditure, as well as the discount factor that is applied. The discount factor used was the WACC (country-specific, weighted average capital cost after taxes).
Fair value hierarchy level 3 reconciliation (values determined using valuation techniques) (June 30, 2019) € million January 1, 2019 Additions Gains/losses in
income statement Transfers
into level 3 Gains/losses
in OCI June 30, 2019
Share option –45.6 – 2.9 – – –42.7 Other investments 94.3 – – – 15.7 110.0
As at December 31, 2018, the following reconciliation of Level 3 fair values resulted:
Fair value hierarchy level 3 reconciliation (values determined using valuation techniques) (December 31, 2018) € million January 1, 2018 Additions Gains/losses in
income statement Transfers
into level 3 Gains/losses
in OCI December 31,
2018
Share option –50.2 – 4.6 – – –45.6 Other investments 105.0 – – – –10.7 94.3
If the assumptions are changed, the following fair values would result:
Sensitivities (June 30, 2019) € million Sensitivities with regard to unobservable input parameters Currency rate sensitivity (INR) Discount rate Growth forcasts +0,5% –0,5% +0,5% –0,5% +0,5% –0,5%
Share option 6.5 % –28.9 –58.4 –45.0 –39.1 N/A N/A Other investments 12.2 % 91.7 130.4 114.5 105.5 109.5 110.6
The sensitivities of the fair values were determined as at December 31, 2018 as follows:
Sensitivities (December 31, 2018) € million Sensitivities with regard to unobservable input parameters Currency rate sensitivity (INR) Discount rate Growth forcasts +0,5% –0,5% +0,5% –0,5% +0,5% –0,5%
Share option 6.7 % –32.3 –60.6 –48.0 –43.3 N/A N/A Other investments 12.6 % 78.5 112.0 98.6 90.1 93.9 94.8

Fraport Interim Report Q2/6M 2018 32
Information on Revenue
Revenue € million 6M 2019 6M 2018
Aviation Airport charges 389.4 383.1 Security services 80.6 71.7 Other revenue 24.7 23.5 494.7 478.3 Retail & Real Estate Real Estate 82.7 93.4 Retail 104.3 94.8 Parking 50.0 47.8 Other revenue 4.3 5.3 241.3 241.3
Ground Handling Ground services 174.4 166.9 Infrastructure charges 157.4 152.1 Other revenue 13.4 6.2 345.2 325.2
International Activities & Services Aviation 228.8 209.7 Non-Aviation 203.9 184.0 Revenue from IFRIC 12 269.1 93.7 701.8 487.4
Total 1,783.0 1,532.2
We refer to the Group interim management report, chapter "Results of operations" for explanations about Group or segment revenue.
Revenue in the International Activities & Services segment is allocated to the Aviation and Non-Aviation sections as well as contract revenue from construction and expansion services related to airport operating projects. The Aviation revenue includes revenue, in particular, from airport charges as well as security services (€228.8 million; previous year: €209.7 million). Revenue in the Non-Aviation section was €122.0 million (previous year: €103.0 million), resulting from retail and real estate activities as well as parking. In addition, €40.6 million (previous year: €38.4 million) was attributable to infrastructure charges and ground handling services. Contract revenue from construction and expansion services related to airport operating projects in the amount of €269.1 million (previous year: €93.7 million) was attributed to Fortaleza and Porto Alegre (€119.3 million; previous year: €32.6 million), Greece (€103.1 million; previous year: €49.3 million), and Lima (€46.7 million; previous year: €11.8 million).
Revenue in the amount of €1,783.0 million (previous year: € 1,532.2 million) resulted from €1,205.9 million from contracts with customers (previous year: 1,149.2 million) in accordance with IFRS 15. Other revenue relates to particular contract revenue from construction and expansion projects in accordance with IFRIC 12 as well as proceeds from rentals and other leases.
Information on Leases
In January 2016, the IASB published the accounting standard IFRS 16 “Leases”, which was incorporated into European law on November 9, 2017. The Standard replaces the existing guidelines on leases, including IAS 17 “Leases”, IFRIC 4 “Determining whether an agreement contains a lease”, SIC-15 “Operating Leases – Incentives”, and SIC-27 “Evaluating the substance of trans-actions involving the legal form of a lease”.
IFRS 16 specifies that, in general, all leases and related contractual rights and obligations must be reflected in the lessee’s balance sheet, unless the maturity is twelve months or less or the lease involves a low-value asset. This eliminates the classification required under IAS 17 into operating or financial leases by the lessee. For leases, the lessee enters a liability for future lease obligations in the balance sheet. Correspondingly, a right of use is capitalized on the leased asset, which at the time of initial
Fraport Interim Report Q2/6M 2018 33
recognition corresponds in principle to the present value of future lease payments plus directly attributable costs and is depreciated over the economic useful life.
Application of IFRS 16 is mandatory for fiscal years starting on or after January 1, 2019. The Fraport Group applied the new IFRS 16 standard for the first time as at January 1, 2019 in accordance with the modified retrospective approach. The comparative figures for the previous year’s periods did not need to be adjusted. The leasing contracts previously classified as operating leases are affected by the initial application. Short-term leasing agreements with a maturity of no more than twelve months and leasing agreements in which the underlying asset is of low value are accounted for in the balance sheet. The option granted under IFRS 16.5 do not apply to the Fraport Group. The Fraport Group also makes no use of the option under IFRS 16.15. The Fraport Group has applied the facilitation requirements of IFRS 16.C3(b) and contractual relationships that were not classified as leases in accordance with IAS 17 “Leases” in conjunction with IFRIC 4 “Determining whether an agreement contains a lease” are not reviewed according to the definition of a lease in IFRS 16 in the context of initial application. Taking into account the principle of materiality (IAS 1 in connection with IFRS 16.BC86), only existing land and building lease agreements in accordance with IFRS 16 will be recognized in the Fraport Group from January 1, 2019. Essentially, this applies to the leases between Fraport USA (or its subsidiaries) and the franchisers awarding the concessions. Additional existing leasing contracts mainly concern operating and business equipment. Due to lack of qualitative and quantitative importance for the Fraport Group and after consideration of cost-benefit aspects based on general materiality considerations, these are not included in the recognition of rights of use and liabilities from finance leases under IFRS 16. Payments are recognized as an expense on a straight-line basis over the term of the lease, in line with the prescribed handling of lease agreements on short-term and low-value assets (IFRS 16.6). Of the other financial obligations from operating leases (€405.9 million) as at December 31, 2018, €392.3 million are from land and building leases and €13.6 million from other leases.
For leases previously classified as operating leases in accordance with IAS 17, at the time of the initial application of IFRS 16 lease liabilities were recognized in the amount of the present values of the outstanding lease payments as at the first application date. Discounting was applied using the incremental borrowing rate at the time of the initial application. The weighted average discount rate as at January 1, 2019 was approximately 3.7%. Corresponding to the recognized leasing liabilities, the capitalization of rights of use in the amount of the recognized lease liabilities was carried out at the time of the initial application. The rights of use are presented under property, plant, and equipment. The depreciation and amortization of the rights of use is applied on a straight-line basis over the term of the contracts. Lease liabilities are updated using the effective interest method and reported under other liabilities.
Based on the initial application, rights of use in the amount of €337.2 million and lease liabilities in the amount of €337.2 million were recorded in the balance sheet. The calculation was based on the operating lease obligations as at December 31, 2018 and already takes into account the agreement from August 2018 to take over retail space management at Nashville Airport, in the United States, as of February 1, 2019. There were no cumulative effects from the transition at the time of the initial application. Depreciation and amortization increased by €21.6 million in the first half of 2019 as a result of the straight-line depreciation of the newly recognized rights of use. Interest expenses increased by €5.8 million in the first half of the year due to the interest effects of the newly recognized leasing liabilities under IFRS 16. EBITDA improved by €22.8 million in the first half of the year as a result of the initial application of IFRS 16.
The reconciliation of off-balance sheet lease obligations as at December 31, 2018 in the lease liabilities recorded in the balance sheet as at January 1, 2019 is as follows:

Fraport Interim Report Q2/6M 2018 34
Reconciliation lease liabilities € million January 1, 2019
Operating lease obligations as at 31 December 2018 (off-balance) 405.9 Relief option (IAS 1) 13.6 Nominal lease liabilities from operating leases 392.3 Discounting 55.1 Present value of lease liabilities as a result of the initial application of IFRS 16 337.2
Present value of finance lease liabilities 5.7 Total lease liabilities 342.9
Companies included in Consolidation Effective January 1, 2019, Fraport AG sold all 100% of its capital shares in Energy Air GmbH for a purchase price of €12.2 million. An operating net income of €12.1 million resulted from the sale.
At the end of May 2019, Fraport AG purchased additional 10% of the shares in Lima Airport Partners S.R.L. from the departing co-shareholder at a price of €40.3 million, thereby increasing its capital share to a total of 80.01%. As the transaction was a transaction with non-controlling interests, the allocation of shareholders’ equity and of the result between the non-controlling in-terests and the shares of the shareholders of Fraport AG in accordance with the new capital shares has changed.
As at June 30, 2019, a total of 73 companies including associates were consolidated in the Fraport Group.
Disclosures on Related Parties There were no material changes arising regarding type and scope as at June 30, 2019. There continue to exist, as reported in the Group Notes to the 2018 Annual Report in Note 47 (see 2018 Annual Report, page 217 et seqq.), many business relationships with related companies and persons, which continue to be maintained unchanged at arm’s length conditions.
Disclosures on the Procedure for Determining Taxes on Income In the interim reporting period, taxes on income are recognized on the basis of the best estimates made for the weighted average annual income tax rate expected for the full year.
Disclosures on the Calculation of Earnings per Share The calculation of earnings per share was based on the following parameters:
Earnings per share 6M 2019 6M 2019 6M 2018 6M 2018 basic diluted basic diluted
Group result attributable to shareholders of Fraport AG in € million 157.2 157.2 134.6 134.6 Weighted number of shares 92,391,339 92,741,339 92,391,339 92,741,339 Earnings per €10 share in € 1.70 1.70 1.46 1.45
Q2 2019 Q2 2019 Q2 2018 Q2 2018 basic diluted basic diluted
Group result attributable to shareholders of Fraport AG in € million 126.7 126.7 111.5 111.5 Weighted number of shares 92,391,339 92,741,339 92,391,339 92,741,339 Earnings per €10 share in € 1.37 1.37 1.21 1.20

Fraport Interim Report Q2/6M 2018 35
Disclosures on the Development of Shareholders’ Equity The breakdown and development of shareholders’ equity from January 1 to June 30, 2019 is presented in the statement of changes in equity in the Group interim financial statements as at June 30, 2019. The statement of changes in equity also shows the development for the previous year.
Disclosures on Contingent Liabilities and Other Financial Obligations Compared to December 31, 2018, order commitments related to capital expenditure on non-current assets increased by €633.8 million from €790.6 million to €1.424.5 million as at June 30, 2019.

Fraport Interim Report Q2/6M 2019 36
Responsibility Statement
To the best of our knowledge, in accordance with the applicable accounting principles for interim financial reporting, the Group interim financial statements give a true and fair view of the asset, financial, and earnings position of the Group. Furthermore, the Group interim management report presents the business development, including the business performance and situation of the Group, in such a way as to give a true and fair view and describes the material opportunities and risks associated with the expected development of the Group for the remaining fiscal year.
Frankfurt/Main, August 7, 2019
Fraport AG Frankfurt Airport Services Worldwide
The Executive Board
Dr. Schulte Giesen Müller Dr. Prümm Dr. Zieschang

Fraport Interim Report Q2/6M 2019 37
Further information on the accounting and valuation methods used can be found in the most recent annual report at https://www.fraport.com/publications.
Financial Calendar 2019/2020 Thursday, November 7, 2019 Friday, May 29, 2020 Interim Release Q3/9M 2019, online publication, Dividend payment press conference, conference call with analysts and investors
Friday, March 13, 2020 Tuesday, August 4, 2020 2019 Annual Report, online publication, Interim Report Q2/6M 2020, online publication, press conference, conference call with analysts and investors conference call with analysts and investors
Wednesday, May 6, 2020 Wednesday, November 4, 2020 Interim Release Q1 2020, online publication, Interim Release Q3/9M 2020, online publication, conference call with analysts and investors press conference, conference call with analysts
and investors
Tuesday, May 26, 2020 Annual General Meeting 2020, Frankfurt/Main, Jahrhunderthalle
Traffic Calendar 2019/2020 (Online publication)
Tuesday, August 13, 2019 Thursday, February 13, 2020 Thursday, August 13, 2020 July 2019 January 2020 July 2020 Friday, September 13, 2019 Thursday, March 12, 2020 Friday, September 11, 2020 August 2019 February 2020 August 2020
Monday, October 14, 2019 Wednesday, April 15, 2020 Tuesday, October 13, 2020 September 2019/9M 2019 March 2020/3M 2020 September 2020/9M 2020
Wednesday, November 13, 2019 Thursday, May 14, 2020 Thursday, November 12, 2020 October 2019 April 2020 October 2020
Friday, December 13, 2019 Monday, June 15, 2020 Friday, December 11, 2020 November 2019 May 2020 November 2020
Wednesday, January 15, 2020 Monday, July 13, 2020 Monday, January 18, 2021 December 2019/FY 2019 June 2020/6M 2020 December 2020/FY 2020
Imprint Publisher Layout Fraport AG Frankfurt Airport Services Worldwide This report was complied with the system SmartNotes. 60547 Frankfurt am Main Germany Editorial Deadline www.fraport.com August 6, 2019
Contact Investor Relations Disclaimer Fraport AG In case of any uncertainties which arise due to errors in Christoph Nanke translation, the German version of the Interim Report is Finance & Investor Relations the binding one. Telefon: + 49 69 690-74840 Telefax: + 49 69 690-74843 Rounding E-Mail: [email protected] The use of rounded amounts and percentages means www.meet-ir.com slight discrepancies may occur due to commercial
rounding.