atlas-based rib-bone detection in chest x-rays · page 2 of 10 accepted manuscript atlas-based...
TRANSCRIPT

Accepted Manuscript
Title: Atlas-based Rib-Bone Detection in Chest X-rays
Author: Sema Candemir Stefan Jaeger Sameer Antani UlasBagci Les R. Folio Ziyue Xu George Thoma
PII: S0895-6111(16)30033-7DOI: http://dx.doi.org/doi:10.1016/j.compmedimag.2016.04.002Reference: CMIG 1435
To appear in: Computerized Medical Imaging and Graphics
Received date: 23-10-2015Revised date: 21-3-2016Accepted date: 12-4-2016
Please cite this article as: Sema Candemir, Stefan Jaeger, Sameer Antani, UlasBagci, Les R. Folio, Ziyue Xu, George Thoma, Atlas-based Rib-Bone Detection inChest X-rays, <![CDATA[Computerized Medical Imaging and Graphics]]> (2016),http://dx.doi.org/10.1016/j.compmedimag.2016.04.002
This is a PDF file of an unedited manuscript that has been accepted for publication.As a service to our customers we are providing this early version of the manuscript.The manuscript will undergo copyediting, typesetting, and review of the resulting proofbefore it is published in its final form. Please note that during the production processerrors may be discovered which could affect the content, and all legal disclaimers thatapply to the journal pertain.

Page 1 of 10
Accep
ted
Man
uscr
ipt
Atlas-based Rib-bone Detection in Chest X-rays
Automated system which detects the rib-bones in patient chest X-rays
In addition to traditional atlas, two alternative atlases usage
Successfully rib-bone localization for patient X-rays
Comparable results with the state-of-the-art algorithm
Good results on challenging X-rays: successfully addressing the rib-shape variance
between patients, and number of visible rib bones due to inhale condition of the patient
*Highlights (for review)

Page 2 of 10
Accep
ted
Man
uscr
ipt
Atlas-based Rib-Bone Detection in Chest X-rays
Sema Candemir1, Stefan Jaeger1, Sameer Antani1, Ulas Bagci3, Les R. Folio, Ziyue Xu2, George Thoma1
1Lister Hill National Center for Biomedical Communications U.S. National Library of Medicine, National Institutes of Health, Bethesda, MD, USA2Radiology and Imaging Sciences, National Institutes of Health, Bethesda, MD, USA
3Center for Research in Computer Vision, University of Central Florida, Orlando, FL, USA
Abstract
This paper investigates using rib-bone atlases for automatic detection of rib-bones in chest X-rays (CXRs). We built a systemthat takes patient X-ray and model atlases as input and automatically computes the posterior rib borders with high accuracy andefficiency. In addition to conventional atlas, we propose two alternative atlases: (i) automatically computed rib bone models usingComputed Tomography (CT) scans, and (ii) dual energy CXRs. We test the proposed approach with each model on 25 CXRs fromthe Japanese Society of Radiological Technology (JSRT) dataset and another 25 CXRs from the National Library of Medicine CXRdataset. We achieve an area under the ROC curve (AUC) of about 95% for Montgomery and 91% for JSRT datasets. Using theoptimal operating point of the ROC curve, we achieve a segmentation accuracy of 88.91 ± 1.8 % for Montgomery and 85.48 ± 3.3% for JSRT datasets. Our method produces comparable results with the state-of-the-art algorithms. The performance of our methodis also excellent on challenging X-rays as it successfully addressed the rib-shape variance between patients and number of visiblerib-bones due to patient respiration.
Keywords: Chest X-rays, Rib bone extraction
1. Introduction
The National Library of Medicine has developed a portablechest X-ray (CXR) screening system to automatically detect thelung abnormalities in countries where health resources are con-strained [1, 2, 3]. The system extracts the texture and shapeproperties of lung regions from CXR images, and identifies theabnormality using image processing and machine learning al-gorithms. On a typical CXR, the bone structures overlap withthe lung tissue due to the 2D projection of the chest. The rib-cage causes a cross-hatching pattern on the lung region, whichmisleads the texture analysis [4, 5, 6, 7]. A straightforward so-lution to this problem would be to extract textures only from theinter-costal regions. This strategy indeed increases the accuracyof normal/abnormal lung classification [5]. Another way to im-prove the texture analysis is to suppress the rib-bone by reduc-ing the intensities for rib regions, and to work on soft-tissue-likeimages [8, 9, 7]. The soft-tissue-like images can be obtained bysubtracting the rib region from the input X-ray. Automatic rib-bone extraction is not only useful for better texture analysis,but also useful for pediatric CXR screening where rib borderscould be used to detect the rib abnormalities, such as ricketsor neurofibromatosis [10]. Rib boundaries also need to be de-tected accurately in stereo radiography in order to reconstructan accurate 3D rib-bone model [11].
Email address:[email protected],[email protected],[email protected], [email protected],[email protected], [email protected],[email protected] (Sema Candemir1, Stefan Jaeger1, SameerAntani1, Ulas Bagci3, Les R. Folio, Ziyue Xu2, George Thoma1)
Rib-bone detection is challenging due to (i) spurious bound-aries caused by overlapping anatomical structures, (ii) multi-plicative noise and sampling artifacts during acquisition, and(iii) deformation of tissues and anatomical shape variationscaused by disease. Rib border contrast is generally poor/lowbecause of the similar intensity values at the rib boundaries andnearby tissues. In addition to these challenges, rib bone appear-ance varies between patients due to differences in bone mineraldensity, respiration, and body movement during X-ray capture.Fig 1 shows a typical rib shape variance across patients, as wellas spurious boundaries.
Figure 1: Example X-ray images of the right lung from different patients. Therib-bone structure (the bone curvature and interval between the bones) is differ-ent for each patient.
It has been shown in numerous studies that prior-information-based segmentation methods are more accuratethan those without prior information [12, 13, 3, 14, 15]. Oneway to incorporate prior knowledge is to use a prototype ‘at-
Preprint submitted to Computerized Medical Imaging and Graphics March 20, 2016
Cover Letter

Page 3 of 10
Accep
ted
Man
uscr
ipt
(a) Patient’s X-ray (b) Flowchart of system (c) Rib-bones probability map (d) Rib-bone boundaries
Figure 2: The flowchart of the proposed method. (a) Patient’s X-ray. (b) The main stages of the system: atlas building, model selection and atlas registration. (c)The computed probability map of rib-bones overlapped on the patient’s X-ray. The probability map is normalized between 0 and 1. The red color indicates the highprobability of being rib-bone. (d) The rib-bone boundaries computed by thresholding the probability maps. The red contour is the computed boundary and the greencontour is the reference boundary.
las’. Herein, we investigated the use of atlases for automatedrib-bone extraction from CXRs. An illustrative flowchart of theproposed approach is shown in Figure 2. An atlas, in the con-text of this work, is defined as a set of model X-ray imagesand their corresponding rib-bone boundaries. The models areconstructed via three methods: i) X-ray image with manuallydelineated rib-bone boundaries (Fig 3.a); ii) simulated X-rayand rib-bone model image generated from Computed Tomog-raphy (CT) scans (Fig 3.b); and iii) CXRs obtained from a dualenergy scanner (Fig 3.c). The atlas is registered to the patientX-ray, yielding a transformation for each pixel, which allowsthe corresponding atlas rib mask to be transformed and treatedas segmentation for the rib-bone of the patient.
We summarized previous studies and our contribution in Sec-tion 2. The datasets used in our study are listed in Section 3.1.The methodology is described in Section 3.2, which includesthe atlas construction, model selection, and atlas registration.We provide the experimental results in Section 4. We discussand conclude the study in Section 5.
2. Literature Review
Atlas-based Segmentation. In recent years, various re-search efforts have been conducted for model-based segmen-tation methods, such as active shape models [16] and activeappearance models [17]. Similarly, the use of atlas priors havebroad applications in medical image segmentation, especially incomputing the complex boundaries of anatomical organs suchas the heart [12] or brain [13, 18, 19]. A single atlas modelcould be used as the segmentation of the target image, but somestudies have reported that a multi-atlas approach yields higheraccuracy than single-atlas segmentation methods [20, 14]. Inthe multi-atlas approach, several atlas models are registered tothe target image. The combination of all registered atlas modelscan be used as the final segmentation [14, 21, 22, 15, 23]. Stud-ies showed that a selection of a specific subset of atlas models
(a)
(b)
(c)
Figure 3: Example members of our atlas containing (a) the model X-ray and itsmanually delineated rib-bone model, (b) simulated X-ray and rib-bone modelcomputed from CT, and (c) X-ray and corresponding enhanced bone imagesobtained from a dual-energy X-ray scanner.
for the target image produces more accurate segmentation re-sults [3, 14, 15]. The registered atlas could be used as a priorfor further segmentation stages [3, 24].
Rib Boundary Detection. Researchers have developed var-ious methods for automated rib detection. The general ap-proach is first extracting the rib pixels using an edge detec-tion algorithm [25]. Then, the candidate rib pixels/lines aregrouped into a complete rib boundary by applying a curve fit-
2
Page 4 of 10
Accep
ted
Man
uscr
ipt
ting technique [26], using a voting approach such as Houghtransform [10, 27], or applying a geometric model such asparabolas [28, 29, 30, 7] or ellipses [31]. Although extract-ing the rib borders with an edge detection algorithm is a well-known approach, these algorithms produce spurious edges atthe apex of the lung due to overlapping bone structures. In ad-dition, low rib contrast in the lower lung can cause problems.Applying geometric models can help infer missing rib bound-aries; however, relying on a rigid model is not suitable for vary-ing rib shapes among multiple patients (cf. Fig 1) and deformedribs (e.g. in scoliosis cases [11]). Some authors use deformablemodels to cope with the shape variability [10, 32]. A recent ef-fort for rib-bone detection is presented in [11], which uses ori-ented filtering and edge following with multiple-path branch-ing. This algorithm addresses the large variability in rib boneshape. However, the method is a semi-automatic approach thatrequires user initialization for each rib in the target X-ray, whichmakes the whole process less efficient. Apart from the edge-based methods, some studies follow classification schemes toclassify rib/non-rib pixels. For example, in [31], lower/uppermargins of rib regions are classified by analyzing edge gradi-ents and their orientations. In [33], pixels are classified usinggray-scale and neighborhood structural information. In [34],rib-bones are extracted from CT images using Random Forestclassifiers.
One of the aims of extracting the rib bones is suppressingthe bones and obtaining soft-tissue-like images for better tex-ture analysis. Although soft-tissue images can be obtained withdual-energy scanners, this imaging technology is newly devel-oped, so a limited number of hospitals have access to this tech-nology. Therefore, researchers proposed automatically simu-lated alternatives to produce soft-tissue images. For examplein [8] the bone regions are computed by training an artificialneural network. In [9] the bone-like structures are extracted byapplying regression filters learned from the training data. In [7],authors first delineate the rib-bone candidates with parabolacurve fitting, and then the delineated ribs are suppressed usingan unsupervised regression model which also takes into accountthe proximal thickness of bone.
Our Contribution. In this study, we used rib-bone atlasesto automatically extract the patient rib-bone on conventionalfrontal CXRs. To the best of our knowledge, no study on atlas-based rib-bone detection has been previously reported. The pro-posed system chooses the most similar models in the atlas setand then registers them to the patient’s X-ray. The average ofall registered models constitutes the rib bone probability mapfor the patient’s X-ray. In addition to manual delineation, wepropose two alternative ways to build the rib-bone atlases: sim-ulated models computed from CT images and bone images ob-tained from a dual energy scanner. The advantages of our detec-tion system are: (i) The system automatically detects rib bonesfrom conventional X-rays without any user interaction. (ii) Therib-bone models incorporate the anatomical knowledge of ribstructures (e.g., spatial relations between rib bones). Therefore,the system takes into account the inter-rib spaces and fills thegaps between ribs using the information in the rib-models. (iii)Contrary to classical techniques, the texture-based registration
can cope with the large variation in rib shapes and curvatures.
3. Methods
3.1. Data
JSRT dataset is a set compiled by the Japanese Society ofRadiological Technology (JSRT) [35]. It contains 247 CXRs, ofwhich 154 X-rays have lung nodules, and 93 X-rays are normalwith no nodules. All CXRs have a size of 2048×2048 pixels anda gray-scale color depth of 12 bits. The X-rays were capturedusing an analogue imaging system by exposing film that waslater scanned into digital format [36]. The JSRT set is publiclyavailable and has reference masks for clavicle bones, lung, andheart [36]. An expert manually labeled the rib-bone masks of25 X-rays for our experiments serving as reference standards.
Montgomery dataset is a set from the Department of Healthand Human Services, Montgomery County, Maryland, USA.The data set consists of 138 CXRs; 80 X-rays are normal and 58X-rays are abnormal with manifestations of tuberculosis. TheX-ray images are stored in 12-bit gray-scale with dimensions of4020×4892. Since the X-rays were acquired using digital scan-ners, the images have much higher contrast; rib-bone edges arestronger and intensity variations are more heterogeneous com-pared to the JSRT dataset. The Montgomery dataset is publiclyavailable for research [1, 3]. For our experiments, participat-ing expert manually labeled the rib-bone masks of 25 X-raysserving as reference standards.
Belarus dataset is a set collected for a drug resistance studyinitiated by the National Institute of Allergy and Infectious Dis-eases, the United Institute of Informatics Problems of the Na-tional Academy of Sciences of Belarus, and the Republican Re-search and Practical Center for Pulmonology and Tuberculosis,Ministry of Health, Republic of Belarus [37]. The set containsboth CXRs and chest CTs of 169 patients. Chest radiographswere taken using the KODAK Point-of-Care 260 system with2248× 2248 pixel resolution. CT scanning was performed by aGE LightSpeed Pro 16 scanner with a slice thickness of 2.5 mmand a number of axial slices varying from 100 to 160 dependingon the region of interest [38]. Reference boundaries of the lungregions are available for each patient. We used the CT imagesof this dataset to build reference rib-bone boundaries.
NIH-Clinical Center-Dual Energy Images. The dual en-ergy (DE) radiography involves taking two radiographs at dif-ferent mean beam energies. The resulting radiographs highlighteither the soft-tissue or bone structures. The DE CXRs used inthis paper are routine CXRs obtained for clinical reasons usinga GE Discovery XR656 digital radiography system (120 and133 kVp).
3.2. Atlases
As rib-bone atlases, we used (i) conventional CXRs andmanually delineated rib boundaries, (ii) simulated X-rays andrib models computed from CT scans, and (iii) X-rays from dualenergy CXRs.
3

Page 5 of 10
Accep
ted
Man
uscr
ipt
3.2.1. Manually delineated rib-bonesWe selected 50 PA CXRs from the JSRT and Montgomery
datasets and delineated the rib boundaries using the web-basedlabeling tool FireFly [39, 40], which offers precise drawingfunctionality and online labeling capabilities. Fig 3.a showsan example X-ray with manually delineated borders. In thisexample, the posterior ribs are marked in green while the ante-rior ribs are shown in blue. The manual boundaries are used asreference standard for quantitative analysis.
3.2.2. Simulated X-rays and corresponding rib-bone modelsManual delineation is a tedious process for rib borders, con-
sidering that most CXRs need at least 12 manual labels (sixvisible rib pairs). We propose an alternative rib-bone atlasescomputed from CT scans. The rib-bone models are constructedusing CT scans, which is a simplified version of the studyin [41]. For this task, we used the Belarus dataset. Accordingto the Hounsfield scale in CT, bone has the highest radiodensitycompared to other elements in tissue, ranging from +700HU to+3000HU (Hounsfield Unit). Based on this information, we as-sumed that the pixels with the maximum intensity at each col-umn in the axial plane correspond to bone tissue. Therefore,we project the maximum intensity of each column in the axialplane to the coronal plane by
MIPIk =< max(Ik[ci]) >, ∀ci ∈ Ik, i = 1, 2, ...C, (1)
where MIPIk is the maximum intensity projection vector of im-age Ik; Ik is the kth axial slice of CT scan; Ik[ci] is the intensityvalue of image Ik at ith column.
We simulate the corresponding X-ray image with the samefashion by projecting the average intensity at each column inthe axial plane to the coronal plane by
AIPIk =< avg(Ik[ci]) >, ∀ci ∈ Ik, i = 1, 2, ...C, (2)
where AIPIk is the average intensity projection vector of imageIk; Ik is the kth slice of CT scan; and Ik[ci] is the intensity valueof image Ik at ith column. We repeat the projection processfor each axial slice, obtaining the simulated X-ray and rib-bonemodel in the coronal plane. In order to reduce the noise, weproject the intensities only inside the thorax region. Fig 4 illus-trates the rib-bone construction process from CT scans.
3.2.3. Dual Energy X-raysAs an alternative atlas model, we used tissue subtracted
(bone) images obtained from dual energy scanner. We appliedhistogram equalization to increase the contrast between boneand non-bone pixels (Figure 3.c).
3.3. Atlas SelectionRegistration is a computationally expensive process. There-
fore, we registered only a subset of our atlas instead of register-ing the full atlas. It is generally difficult to compute an accuratemapping between images with large shape differences. In orderto decrease the shape difference between the patient’s X-rayand the atlas, we used a selection strategy that chooses the rib-models that are most similar to the patient’s X-ray. The shape
similarity between the patient and the model X-rays are mea-sured using the edge information of lung regions. The promi-nent edges in the lung regions are mostly caused by ribs. How-ever, there are usually spurious edges which do not belong torib bones. Therefore, before measuring the edge similarity, weapplied bilateral filtering [42], which decreases the noise in theimage but preserves the prominent edges. After filtering, weapplied the Canny Edge detection algorithm [43] to obtain theedge map of an X-ray. Fig 5 shows the edge detection resultson filtered X-rays. We measure the similarity of the edge mapsof X-ray images using the equation
d(IEp , I
Em) =
1|IE
p |
∑x∈IE
p ,x′∈IEm
min|x − x′| (3)
where IEp is the binary edge image of the patient X-ray, IE
m is thebinary edge image of the model X-ray, x and x′ are coordinatesof edge pixels, and |IE
p | is the number of edge pixels in IEp .
The system computes the distance d between the edge mapof the patient X-ray and the edge map of each X-ray in the at-las, and retrieves the most similar top-n rib-bone atlas models.After creating the subset, we registered the selected x-rays tothe patient’s x-ray to build a patient-specific rib-bone model.
3.4. Registration of Atlases
The aim of the registration stage is to build a rib-bone modelfor the patient X-ray using other patient X-rays with their corre-sponding rib-bone models. We employed a non-rigid registra-tion method [44] that solves the registration process with a flow-based approach. The algorithm computed the correspondingpixels (the transformation mapping) between the models andthe patient X-ray. Then, we aligned the rib-model to the patientX-ray by applying the transformation mapping. The registeredmodel is used as the rib-bone model of the patient’s X-ray. Forthe correspondence computation, the local regions are modeledwith Scale Invariant Feature Transform (SIFT) [45]. The SIFTfeature of a local region is the concatenation of the gradient ori-entation histograms of its sub-regions. To enhance the textureand rib contrast, histogram equalization is applied to chest X-rays before SIFT extraction. Once the SIFT features are com-puted for all atlas X-rays, the algorithm computes the pixel-to-pixel correspondences using the following objective function:
E(w) =∑p∈P
min(||S 1(p) − S 2(p + w(p))||, t)
+∑
p(|u(p)| + |v(p)|)
+∑
(p,q)∈N
min(|u(p) − u(q)|, d) + min(|v(p) − v(q)|, d), (4)
where P is the set of pixels in the X-ray; N is the spatial neigh-borhood set, S 1 and S 2 are the SIFT images in which each pixelis represented by a SIFT descriptor vector; w(p) = (u(p), v(p))are the flow vectors at p; t and d are the truncated thresholds.The minimization algorithm calculates the SIFT-flow w by op-timizing the objective function. The first term of the objective
4

Page 6 of 10
Accep
ted
Man
uscr
ipt
(a) (b) (c)
Figure 4: An illustration of the X-ray and rib-bone model simulation process. (a) An example slice (Image Ik) in the axial plane in a CT scan. (b) Algorithmthresholds the image Ik with +1300 HU (the threshold value is decided empirically) to obtain the approximate torso region image (IT
k ). The maximum and averageintensity at each column of IT
k is projected to the coronal plane. (c) Algorithm computes the Average Intensity Projection (AIP) and Maximum Intensity Projection(MIP) of all axial slices. Each AIP vector represents one image row of the simulated X-ray, and each MIP vector builds one row of the rib-bone model in the coronalplane.
Figure 5: Canny Edge detection results for two filtered X-rays.
function forces the algorithm to match pixels according to theirSIFT descriptors, with warping based on the registration flowvector w(p). The second term constrains the flow vectors to beas small as possible. The third term constrains the flow vectorsof neighboring pixels to be similar. The SIFT-flow algorithmcalculates corresponding matches for each pixel between twoX-rays by solving the flow vectors w(p). The spatial shifts be-tween corresponding matches define the transformation map-ping for all pixels. We applied the transformation mapping byshifting each pixel in the atlas model according to the computedshift distance.
We repeated the registration stage for each of the top-n mostsimilar X-rays in the atlas set. The final rib-bone model for thepatient X-ray was built-up by using the mean of the top-rankedregistered masks. The intensity value of each pixel in the rib-bone model for the patient X-ray is the probability that the pixelbelongs to the rib bones (cf. Fig 6).
4. Experiments
4.1. Evaluation StrategyOne important challenge for medical image segmentation al-
gorithms is to obtain a reference to validate the algorithm per-
formance and compare different methods. Generally, severalexperts are asked to delineate the borders, preferably multi-ple times. Then, the collection of expert markings are com-bined into one reference standard either taking the average ofmarkings or employing a more sophisticated algorithm such asSTAPLE (Simultaneous Truth And Performance Level Estima-tion) [46]. However, expert delineation is a tedious process, es-pecially for rib borders considering that CXRs need at least 12manual labels (for visible ribs). Therefore, currently availablerib-bone detection studies suffer from a lack of standards andsuch algorithms have been tested on limited datasets. For ex-ample, the algorithm in [10] is tested only on 10 CXRs. In [33],researchers manually delineated the rib borders of 30 X-rays,and evaluated their algorithm on this set. Due to the lack of ref-erence boundaries, some studies reported only subjective evalu-ations of an expert or of the authors themselves. For this study,we delineated the rib-bone boundaries of 50 CXRs, and eachCXRs has only one reference standard.
There are 12 pairs of ribs in a normal human rib cage.Although the exact number depends on respiration, typically,six to nine rib pairs are visible in the lung area. The ribbones below the diaphragm are hardly visible in an CXR be-cause of the abdomen shadow. Therefore, we define the lungarea as the search area for ribs. To detect the lung area, weused a lung segmentation algorithm [3]. The resulting bound-aries were compared with manual reference boundaries usingOverlap = |TP|/(|FP| + |TP| + |FN|), Dice = 2|TP|/(2|TP| +|FN|+ |FP|), Accuracy = (|TP|+ |TN|)/(|TP|+ |TN|+ |FP|+ |FN|),Sensitivity = |TP|/(|TP|+ |FN|), Specificity = |TN|/(|TN|+ |FP|)and Precision = |TP|/(|TP| + |FP|) where TP (true positives)represents correctly classified pixels, FP (false positives) rep-resents pixels that are classified as rib but that are in fact back-ground, FN (false negatives) represents pixels that are classifiedas background but that are in fact part of the ribs, and TN (truenegatives) represents correctly classified non-pixels.
5

Page 7 of 10
Accep
ted
Man
uscr
ipt
4.2. Rib-bone Probability Map
In this section, we report the performance of the proposedsystem with quantitative and qualitative evaluations of rib-boneprobability maps. Given a patient X-ray, our system retrievesthe top-n most similar X-rays in the atlas by comparing the edgemaps of X-rays, and it then registers the selected models to thepatient X-ray. The average of the registered models forms therib-bone probability map in which the intensity of each pixelindicates its probability of being part of the rib-bone structure.Fig 6 shows an example computed probability map and its over-lap on the X-ray image.
Figure 6: The probability maps and their overlap on X-rays.
As we described in Section 3.2, we use three types of atlasmodels: (i) conventional X-rays and manually-labeled bound-aries, (ii) simulated X-rays and rib bone models computed fromCT scans, and (iii) conventional X-rays and dual energy bone-tissue images. We tested the system performance with eachmodel. Fig 7 shows computed probabilities with each atlasmodel for the same X-ray images. As can be seen from the over-lapped figures, the algorithm assigns higher probabilities to ribregions than to intercostal areas. The visual results also showthat the algorithm produces relatively less accurate boundariesat the bottom part of the lung. This is due to weak rib-boneedges in this region because of the lack of intensity differencebetween rib-bone and soft tissue.
The intensities of probability maps represent confidence val-ues that we thresholded to obtain different operating points onthe ROC curve. With a high threshold, high intensity valuesare classified as rib, producing high specificity and low sensi-tivity. On the other hand, with a low threshold, lower intensitieswill also be classified as rib. This will reduce the specificity ofthe model but increase its sensitivity. Figure 8 shows the ROCcurves obtained for JSRT and Montgomery datasets, for man-ually delineated, simulated, and dual energy rib-bone models.
As an overall performance, we achieved an area under theROC curve (AUC) of approximately 95% for Montgomerydataset and 91% for JSRT dataset (shown in Figure 8 and listedin Table 1). The curves show that the computed rib probabili-ties for the Montgomery set (blue curves) is better than the ribprobabilities for the JSRT set (red curves). As we reported inSection 3.1, the JSRT set was captured using an analogue imag-ing system by exposing film that was later scanned into digital
Dataset Models AUC opt. TP opt. FPJSRT manually delineated 0.9105 0.7944 0.1270JSRT simulated X-rays 0.8759 0.6783 0.1234JSRT dual energy X-rays 0.7618 0.5823 0.1721
Montgomery manually delineated 0.9519 0.8718 0.0941Montgomery simulated X-rays 0.9086 0.7962 0.1423Montgomery dual energy X-rays 0.7711 0.6067 0.1626
Table 1: Optimal points on ROC curve: Area Under Curve (AUC), optimalTrue Positive (TP) rate, and optimal False Positive (FP) rate.
format [36]. Therefore, the film-based images have a homo-geneous intensity appearance. On the other hand, the X-raysin the Montgomery set were acquired using digital scanners.These images have much higher contrast with stronger rib-boneedges. The intensity variations are more heterogeneous com-pared to the JSRT dataset.
The curves also show that rib segmentation based on manu-ally generated rib models (solid lines) are superior to rib seg-mentation based on models generated from simulated X-rays(dashed lines), and to rib segmentation based on dual energybone images (dotted lines). We believe that the reason for thelower accuracy obtained with simulated X-ray is that the av-erage intensity projection produces a smooth simulated X-raythat does not capture adequate texture information for similar-ity computation during the registration process (cf. Figure 4).Each X-ray of the Belarus dataset, which we used to computethe simulated X-rays, contains 128 axial slices. The simulatedX-ray accuracy could be improved using CT scans with a highernumber of slices. On the other hand, the lower accuracy ob-tained with dual energy X-ray images occurs due to overlap-ping bone structures in bone X-ray images, and weak bone in-tensity in mid-line region (Fig. 3-c). During registration of themodel to the patient X-ray, the anterior rib structures and weakbone intensity deteriorated the posterior rib pixel estimation.We computed the optimal points on the ROC curves (showedas circles on curves in Figure 8) and listed the area under thecurve, optimal TP and FP rates in Table 1.
4.3. Challenging X-raysRib-bone segmentation is challenging due to rib-bone vari-
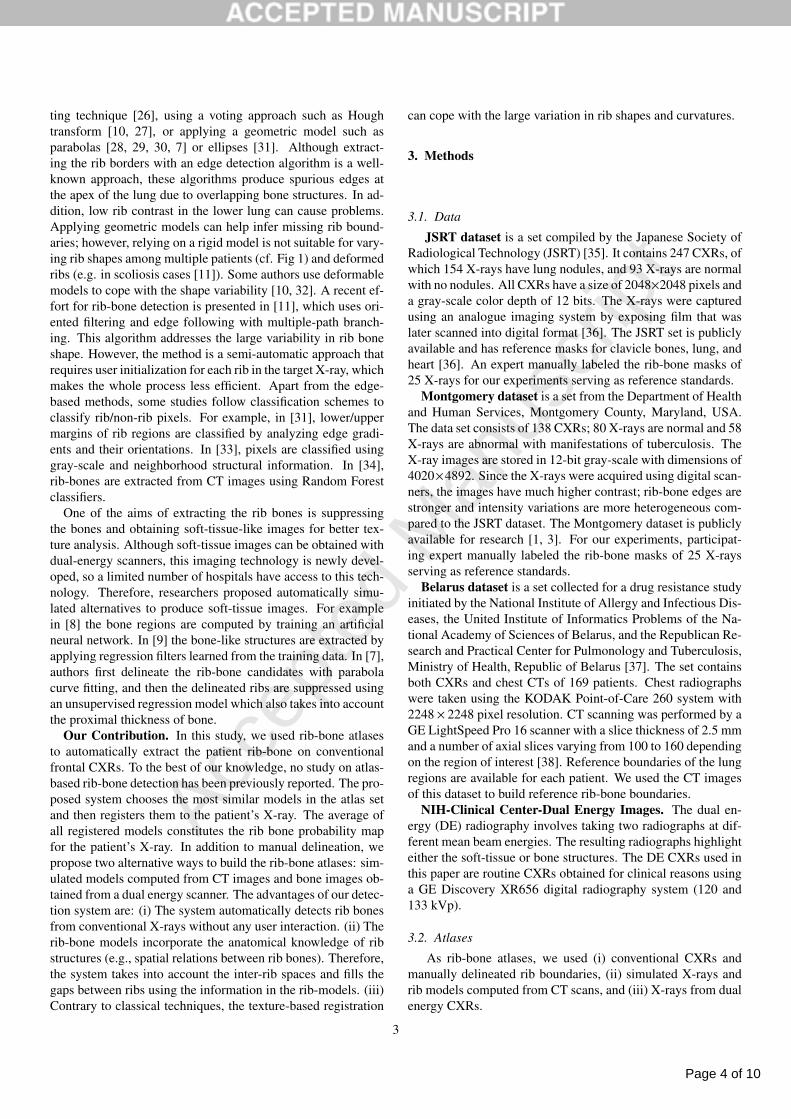
ances across patients. Rib bone mineral density, respiration,body movement during X-ray capture and disease in the lung re-gion affect the rib-bone shape and number of visible ribs. Fig 9shows the performance of our system in these challenging situ-ations.
The system is able to locate the ribs given adequate textureinformation for the rib region. We register the rib models to thepatient X-ray using a non-rigid registration approach. There-fore, our system successfully addresses the rib-shape variancebetween patients. However, it can not detect the ribs when theintensity difference between rib region and intercostal areas arepoor.
4.4. Comparison ResultsMost studies have conducted subjective evaluations for their
rib detection algorithms because of the lack of a reference
6

Page 8 of 10
Accep
ted
Man
uscr
ipt
a)
b)
c)
Figure 7: Example probability maps with a) manual atlas, b) atlas computed from CT scans, c) dual energy bone-tissue X-rays.
Figure 8: ROC curves for JSRT and Montgomery datasets, obtained with man-ually delineated rib-bone models, simulated models, and dual energy X-raymodels.
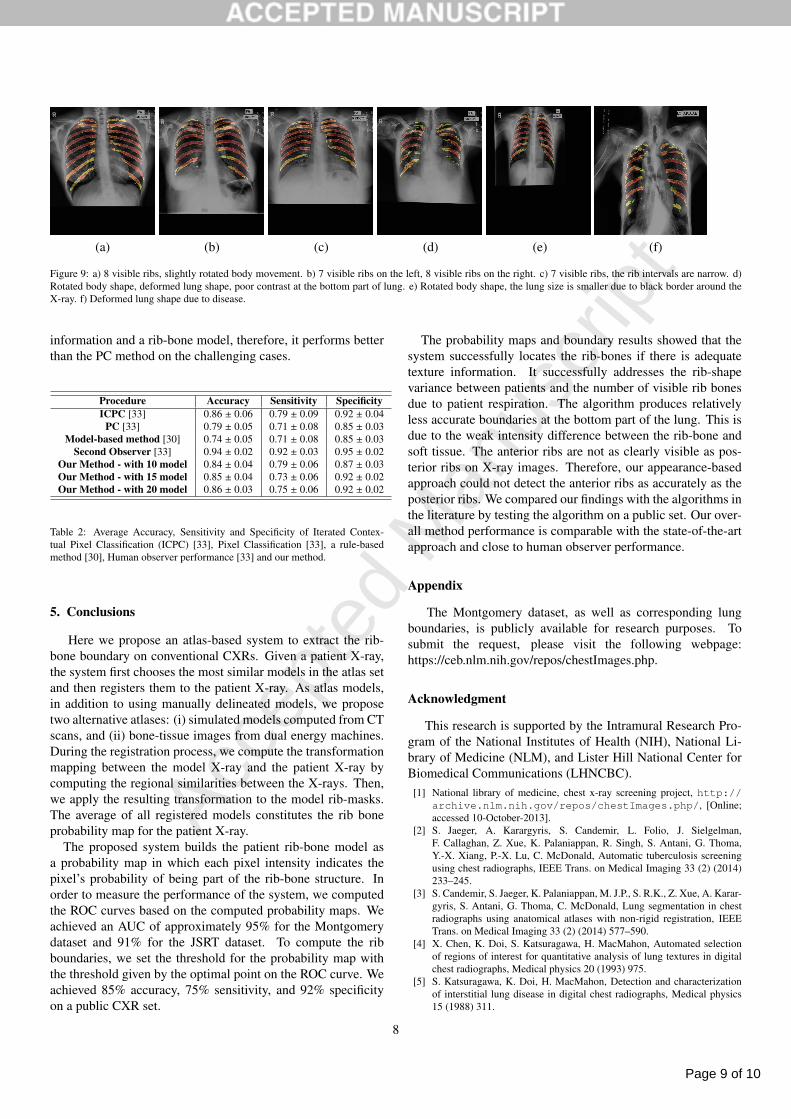
boundary for quantitative evaluation. To the best of our knowl-edge, only [33] have reported quantitative results for rib detec-tion on a public set (JSRT dataset). In order to compare theperformance of our approach with the reported results in litera-ture, we computed the rib boundary from the probability mapsestimated for the JSRT dataset. The values on the probabilitymap of each X-ray are between 0 to 1 (cf. Figure 6). We seta threshold for the map with t = 0.5, which is also the optimalthreshold value in ROC curves. Table 2 lists the overall accu-racy, sensitivity and specificity of algorithms. ICPC (iteratedcontextual pixel classification) uses pixel classification [33] asinitial rib segmentation, and then re-classifies each pixel usingimage features and class labels of pixels in their neighborhoodwhich are assigned in the initial segmentation. Pixel classifica-tion (PC) [33] classifies the ribs based on intensities and usesa supervised classification approach. The same authors pro-posed a model-based approach [30], which fits a global rib-bonemodel directly to the radiograph image. In the rib-bone model,each rib is represented by two parallel parabolas. However, thisapproach does not address the variable number of visible ribsin the lung area. Researchers also measured the human vari-ance by comparing two manual delineations, which is listed assecond observer performance. Our overall method performanceon the JSRT subset is comparable with ICPC and close to thesecond observer performance. (Note that the experimental datasubset is not the same because the authors in [33] did not dis-close the specific subset used). Our approach uses both image
7
Page 9 of 10
Accep
ted
Man
uscr
ipt(a) (b) (c) (d) (e) (f)
Figure 9: a) 8 visible ribs, slightly rotated body movement. b) 7 visible ribs on the left, 8 visible ribs on the right. c) 7 visible ribs, the rib intervals are narrow. d)Rotated body shape, deformed lung shape, poor contrast at the bottom part of lung. e) Rotated body shape, the lung size is smaller due to black border around theX-ray. f) Deformed lung shape due to disease.
information and a rib-bone model, therefore, it performs betterthan the PC method on the challenging cases.
Procedure Accuracy Sensitivity SpecificityICPC [33] 0.86 ± 0.06 0.79 ± 0.09 0.92 ± 0.04
PC [33] 0.79 ± 0.05 0.71 ± 0.08 0.85 ± 0.03Model-based method [30] 0.74 ± 0.05 0.71 ± 0.08 0.85 ± 0.03
Second Observer [33] 0.94 ± 0.02 0.92 ± 0.03 0.95 ± 0.02Our Method - with 10 model 0.84 ± 0.04 0.79 ± 0.06 0.87 ± 0.03Our Method - with 15 model 0.85 ± 0.04 0.73 ± 0.06 0.92 ± 0.02Our Method - with 20 model 0.86 ± 0.03 0.75 ± 0.06 0.92 ± 0.02
Table 2: Average Accuracy, Sensitivity and Specificity of Iterated Contex-tual Pixel Classification (ICPC) [33], Pixel Classification [33], a rule-basedmethod [30], Human observer performance [33] and our method.
5. Conclusions
Here we propose an atlas-based system to extract the rib-bone boundary on conventional CXRs. Given a patient X-ray,the system first chooses the most similar models in the atlas setand then registers them to the patient X-ray. As atlas models,in addition to using manually delineated models, we proposetwo alternative atlases: (i) simulated models computed from CTscans, and (ii) bone-tissue images from dual energy machines.During the registration process, we compute the transformationmapping between the model X-ray and the patient X-ray bycomputing the regional similarities between the X-rays. Then,we apply the resulting transformation to the model rib-masks.The average of all registered models constitutes the rib boneprobability map for the patient X-ray.
The proposed system builds the patient rib-bone model asa probability map in which each pixel intensity indicates thepixel’s probability of being part of the rib-bone structure. Inorder to measure the performance of the system, we computedthe ROC curves based on the computed probability maps. Weachieved an AUC of approximately 95% for the Montgomerydataset and 91% for the JSRT dataset. To compute the ribboundaries, we set the threshold for the probability map withthe threshold given by the optimal point on the ROC curve. Weachieved 85% accuracy, 75% sensitivity, and 92% specificityon a public CXR set.
The probability maps and boundary results showed that thesystem successfully locates the rib-bones if there is adequatetexture information. It successfully addresses the rib-shapevariance between patients and the number of visible rib bonesdue to patient respiration. The algorithm produces relativelyless accurate boundaries at the bottom part of the lung. This isdue to the weak intensity difference between the rib-bone andsoft tissue. The anterior ribs are not as clearly visible as pos-terior ribs on X-ray images. Therefore, our appearance-basedapproach could not detect the anterior ribs as accurately as theposterior ribs. We compared our findings with the algorithms inthe literature by testing the algorithm on a public set. Our over-all method performance is comparable with the state-of-the-artapproach and close to human observer performance.
Appendix
The Montgomery dataset, as well as corresponding lungboundaries, is publicly available for research purposes. Tosubmit the request, please visit the following webpage:https://ceb.nlm.nih.gov/repos/chestImages.php.
Acknowledgment
This research is supported by the Intramural Research Pro-gram of the National Institutes of Health (NIH), National Li-brary of Medicine (NLM), and Lister Hill National Center forBiomedical Communications (LHNCBC).[1] National library of medicine, chest x-ray screening project, http://
archive.nlm.nih.gov/repos/chestImages.php/, [Online;accessed 10-October-2013].
[2] S. Jaeger, A. Karargyris, S. Candemir, L. Folio, J. Sielgelman,F. Callaghan, Z. Xue, K. Palaniappan, R. Singh, S. Antani, G. Thoma,Y.-X. Xiang, P.-X. Lu, C. McDonald, Automatic tuberculosis screeningusing chest radiographs, IEEE Trans. on Medical Imaging 33 (2) (2014)233–245.
[3] S. Candemir, S. Jaeger, K. Palaniappan, M. J.P., S. R.K., Z. Xue, A. Karar-gyris, S. Antani, G. Thoma, C. McDonald, Lung segmentation in chestradiographs using anatomical atlases with non-rigid registration, IEEETrans. on Medical Imaging 33 (2) (2014) 577–590.
[4] X. Chen, K. Doi, S. Katsuragawa, H. MacMahon, Automated selectionof regions of interest for quantitative analysis of lung textures in digitalchest radiographs, Medical physics 20 (1993) 975.
[5] S. Katsuragawa, K. Doi, H. MacMahon, Detection and characterizationof interstitial lung disease in digital chest radiographs, Medical physics15 (1988) 311.
8

Page 10 of 10
Accep
ted
Man
uscr
ipt
[6] S. Katsuragawa, K. Doi, H. MacMahon, Classification of normal and ab-normal lungs with interstitial disease in chest images, Medical physics 16(1989) 38.
[7] H. Ogul, B. Ogul, M. Agildere, T. Bayrak, E. Sumer, Eliminat-ing rib shadows in chest radiographic images providing diagnostic as-sistance, Computer Methods and Programs in Biomedicine (2015) –doi:http://dx.doi.org/10.1016/j.cmpb.2015.12.006.URL http://www.sciencedirect.com/science/article/pii/S0169260715003296
[8] K. Suzuki, H. Abe, F. Li, K. Doi, Suppression of the contrast of ribs inchest radiographs by means of massive training artificial neural network,in: Medical Imaging 2004, International Society for Optics and Photon-ics, 2004, pp. 1109–1119.
[9] M. Loog, B. van Ginneken, A. Schilham, Filter learning: application tosuppression of bony structures from chest radiographs, Medical imageanalysis 10 (6) (2006) 826–840.
[10] Z. Yue, A. Goshtasby, L. Ackerman, Automatic detection of rib borders inchest radiographs, Medical Imaging, IEEE Transactions on 14 (3) (1995)525–536.
[11] F. Plourde, F. Cheriet, J. Dansereau, Semiautomatic detection of scolioticrib borders from posteroanterior chest radiographs, Biomedical Engineer-ing, IEEE Transactions on 59 (4) (2012) 909–919.
[12] A. Frangi, D. Rueckert, J. Schnabel, W. Niessen, Automatic constructionof multiple-object three-dimensional statistical shape models: Applica-tion to cardiac modeling, Medical Imaging, IEEE Transactions on 21 (9)(2002) 1151–1166.
[13] X. Artaechevarria, A. Munoz-Barrutia, C. Ortiz-de Solorzano, Combina-tion strategies in multi-atlas image segmentation: Application to brain mrdata, Medical Imaging, IEEE Transactions on 28 (8) (2009) 1266–1277.
[14] P. Aljabar, R. Heckemann, A. Hammers, J. Hajnal, D. Rueckert, Multi-atlas based segmentation of brain images: atlas selection and its effect onaccuracy, Neuroimage 46 (3) (2009) 726–738.
[15] J. Lotjonen, R. Wolz, J. Koikkalainen, L. Thurfjell, G. Waldemar,H. Soininen, D. Rueckert, Fast and robust multi-atlas segmentation ofbrain magnetic resonance images, NeuroImage 49 (3) (2010) 2352–2365.
[16] T. F. Cootes, C. J. Taylor, D. H. Cooper, J. Graham, Active shape models- their training and application, Comput. Vis. Image Understand. 61 (1)(1995) 38–59.
[17] T. Cootes, G. Edwards, C. Taylor, Active appearance models, IEEE Trans.Pattern Anal. Mach. Intell. 23 (6) (2001) 681–685.
[18] I. Isgum, M. Staring, A. Rutten, M. Prokop, M. Viergever, B. Ginneken,Multi-atlas-based segmentation with local decision fusion: Applicationto cardiac and aortic segmentation in ct scans, Medical Imaging, IEEETransactions on 28 (7) (2009) 1000–1010.
[19] F. Shi, P. Yap, Y. Fan, J. Gilmore, W. Lin, D. Shen, Construction of multi-region-multi-reference atlases for neonatal brain mri segmentation, Neu-roimage 51 (2) (2010) 684–693.
[20] D. Collins, J. Pruessner, Towards accurate, automatic segmentation ofthe hippocampus and amygdala from mri by augmenting animal with atemplate library and label fusion, NeuroImage 52 (4) (2010) 1355–1366.
[21] A. Khan, N. Cherbuin, W. Wen, K. Anstey, P. Sachdev, M. Beg, Opti-mal weights for local multi-atlas fusion using supervised learning and dy-namic information (superdyn): Validation on hippocampus segmentation,NeuroImage 56 (1) (2011) 126–139.
[22] T. Langerak, U. van der Heide, A. Kotte, M. Viergever, M. van Vulpen,J. Pluim, Label fusion in atlas-based segmentation using a selective and it-erative method for performance level estimation (simple), Medical Imag-ing, IEEE Transactions on 29 (12) (2010) 2000–2008.
[23] M. Sabuncu, B. Yeo, K. Van Leemput, B. Fischl, P. Golland, A generativemodel for image segmentation based on label fusion, Medical Imaging,IEEE Transactions on 29 (10) (2010) 1714–1729.
[24] M. Murgasova, L. Dyet, D. Edwards, M. Rutherford, J. Hajnal, D. Rueck-ert, Segmentation of brain mri in young children, Academic radiology14 (11) (2007) 1350–1366.
[25] G. Powell, K. Doi, S. Katsuragawa, Localization of inter-rib spaces forlung texture analysis and computer-aided diagnosis in digital chest im-ages, Medical physics 15 (1988) 581.
[26] P. de Souza, Automatic rib detection in chest radiographs, Computer vi-sion, graphics, and image processing 23 (2) (1983) 129–161.
[27] J. Lee, J. Wang, H. Wu, M. Yuan, A nonparametric-based rib suppressionmethod for chest radiographs, Computers & Mathematics with Applica-
tions 64 (5) (2012) 1390–1399.[28] H. Wechsler, J. Sklansky, Automatic detection of rib contours in chest
radiographs, Ph.D. thesis, Citeseer (1975).[29] S. Sarkar, S. Chaudhuri, Detection of rib shadows in digital chest radio-
graphs, in: Image Analysis and Processing, Springer, 1997, pp. 356–363.[30] B. van Ginneken, B. ter Haar Romeny, Automatic delineation of ribs in
frontal chest radiographs, in: Medical Imaging 2000, International Soci-ety for Optics and Photonics, 2000, pp. 825–836.
[31] S. Sanada, K. Doi, H. MacMahon, Automated detection of pneumothoraxin chest images, Medical physics 19 (1992) 1153.
[32] S. Benameur, M. Mignotte, F. Destrempes, J. De Guise, Three-dimensional biplanar reconstruction of scoliotic rib cage using the estima-tion of a mixture of probabilistic prior models, Biomedical Engineering,IEEE Transactions on 52 (10) (2005) 1713–1728.
[33] M. Loog, B. Ginneken, Segmentation of the posterior ribs in chest radio-graphs using iterated contextual pixel classification., IEEE Trans. MedicalImaging 25 (2006) 602–611.
[34] M. Gargouri, J. Tierny, E. Jolivet, P. Petit, E. Angelini, Accurate and ro-bust shape descriptors for the identification of rib cage structures in ct-images with random forests, in: 2013 IEEE 10th International Sympo-sium on Biomedical Imaging,, 2013, pp. 65–68.
[35] J. Shiraishi, S. Katsuragawa, J. Ikezoe, T. Matsumoto, T. Kobayashi,K. Komatsu, M. Matsui, H. Fujita, Y. Kodera, K. Doi, Development of adigital image database for chest radiographs with and without a lung nod-ule: receiver operating characteristic analysis of radiologists detection ofpulmonary nodules, American Journal of Roentgenology 174 (2000) 71–74.
[36] B. Ginneken, M. Stegmann, M. Loog, Segmentation of anatomical struc-tures in chest radiographs using supervised methods: a comparative studyon a public database, Medical Image Analysis 10 (1) (2006) 19–40.
[37] Belarus tuberculosis portal, http://www.tuberculosis.by/,[Online; accessed 30-October-2014].
[38] V. Kovalev, V. Liauchuk, I. Safonau, A. Astrauko, A. Skrahina,A. Tarasau, Is there any correlation between the drug resistance and struc-tural features of radiological images of lung tuberculosis patients?, Int JComp Assist Radiol Surg 8 (1) (2013) 18–20.
[39] D. Beard, Firefly - web-based interactive tool for the visualization andvalidation of image processing algorithms, Master’s thesis, University ofMissouri (2009).
[40] P. Madala, Interactive web-based track editing and management, Master’sthesis, University of Missouri (2011).
[41] Z. Xu, U. Bagci, C. Jonsson, S. Jain, D. Mollura, Efficient ribcage seg-mentation from ct scans using shape features, in: Engineering in Medicineand Biology Society (EMBC), 2014 36th Annual International Confer-ence of the IEEE, 2014, pp. 2899–2902.
[42] C. Tomasi, R. Manduchi, Bilateral filtering for gray and color images, in:Computer Vision, 1998. Sixth International Conference on, IEEE, 1998,pp. 839–846.
[43] J. Canny, A computational approach to edge detection, Pattern Analysisand Machine Intelligence, IEEE Transactions on (6) (1986) 679–698.
[44] C. Liu, J. Yuen, A. Torralba, SIFT flow: Dense correspondence acrossdifferent scenes and its applications., IEEE Trans. Pattern Anal. Mach.Intell. 33 (5).
[45] D. Lowe, Distinctive image features from scale-invariant keypoints, Int.J. Computer Vision 60 (2) (2004) 91–110.
[46] S. K. Warfield, K. H. Zou, W. M. Wells, Simultaneous truth and perfor-mance level estimation (staple): an algorithm for the validation of im-age segmentation, Medical Imaging, IEEE Transactions on 23 (7) (2004)903–921.
9