atmospheric deposition of organic contaminants in norway
TRANSCRIPT

National moss survey 2015
ENVIRONMENTAL
MONITORING
M-604 | 2016
Atmospheric deposition of
organic contaminants in Norway

1
COLOPHON
Executive institution
NILU – Norwegian Institute for Air Research
P.O. Box 100, 2027 Kjeller
978-82-425-2861-2 (electronic)
Project manager for the contractor Contact person in the Norwegian Environment Agency
Hilde Thelle Uggerud (NILU) Malene Vågen Dimmen
M-no Year Pages Contract number
604 2016 37 16078032
Publisher The project is funded by
NILU - Norwegian Institute for Air Research
OR 30/2016, O-115067 Norwegian Environmental Agency
Author(s)
Martin Schlabach, Eiliv Steinnes (NTNU) and Hilde Thelle Uggerud
Title – Norwegian and English
Atmosfærisk nedfall av organiske miljøgifter over Norge. Landsomfattende moseundersøkelse 2015
Atmospheric deposition of organic contaminants in Norway: National moss survey 2015
Summary – sammendrag
For the second Norwegian Moss survey on organic contaminants 20 samples were collected on the Norwegian mainland
in rural areas presumably little affected by local point sources of pollutants. PeCB, HCB, PCB, HCH, DDT, PBDE,
DBDPE, HBCD, PFAS, and PAH were determined. There is a general trend of decreasing contamination from 2010 to
2015 for the POPs included in the survey. A trend of decreasing contamination with increasing latitude shown in the
2010 moss data is confirmed in the results from 2015. The results for PCB indicate release from local sources in the
Oslo area.
Til den andre norske moseundersøkelsen med tanke på organiske miljøgifter, ble det samlet inn 20 prøver på det
norske fastlandet, fortrinnsvis i området som er lite påvirket av lokale kilder til forurensning. PeCB, HCB, PCB, HCH,
DDT, PBDE, DBDPE, HBCD, PFAS og PAH er bestemt. Den generelle trenden viser en nedgang i kontamineringen fra
2010 til 2015 for de POPene som er inkludert i undersøkelsen. En trend som viser minkende forurensning ved stigende
lengdegrad vist i 2010 mosedata, blir bekreftet i 2015-resultatene.
PCB resultatene indikerer utslipp fra en lokal kilde i Oslo-området.
4 emneord 4 subject words
POP, PAH, mose, atmosfærisk deposisjon POP, PAH, moss, atmospheric deposition
Front page photo
Ingjerd Sunde Krogseth

Atmospheric deposition of organic contaminants in Norway | M-604
2
Content
Summary......................................................................................................... 3
Sammendrag .................................................................................................... 4
1. Introduction ................................................................................................. 5
2. Experimental ................................................................................................ 6
2.1 Sampling and sample transport .................................................................... 6
2.2 Analysis ................................................................................................. 9
2.2.1 Sample storage and sample preparation ................................................. 9
2.2.2 Extraction ...................................................................................... 9
2.2.3 Clean-up ..................................................................................... 10
2.2.4 Instrumental analyses ..................................................................... 10
2.3 Uncertainties ........................................................................................ 11
3. Results and Discussion ................................................................................... 12
3.1 PCB .................................................................................................... 13
3.2 DDE .................................................................................................... 14
3.3 PBDE .................................................................................................. 15
3.4 PAH ................................................................................................... 18
4. Conclusion ................................................................................................. 19
5. References ................................................................................................. 20
Appendix ...................................................................................................... 23
Atmospheric deposition of organic contaminants in Norway | M-604
3
Summary
On behalf of the Norwegian Environment Agency, NILU together with NTNU completed the
second Norwegian Moss survey focused on the deposition of organic contaminants.
In total, 20 samples were collected on the Norwegian mainland. The majority of the sampling
sites are located in rural areas and presumably little affected by local point sources of
pollutants. State-of-the-art analytical methods were used to measure PeCB, HCB, PCB, HCH,
DDT, PBDE, DBDPE, HBCD, PFAS, and PAH.
There is a general trend of decreasing contamination from 2010 to 2015 in the groups of POPs
included in the survey, and the trend of decreasing contamination with increasing latitude
shown in the 2010 moss data, as well as in previous studies using other sampling media, is
confirmed in the results from 2015. The results for PCB indicate emissions from local sources
in the Oslo area.
In general, data from the 2015 moss survey confirm that sampling and analysis of moss, as
described in the 2010 report, is a useful way of detecting levels and assessing temporal trends
of deposition of POPs in the terrestrial environment. It is therefore recommended to continue
this survey in future monitoring.
Atmospheric deposition of organic contaminants in Norway | M-604
4
Sammendrag
På oppdrag av Miljødirektoratet utførte NILU, i samarbeid med NTNU, den andre
undersøkelsen av avsetning av organiske miljøgifter på mose.
Det ble tatt 20 prøver fordelt over hele Norge. De fleste prøver ble tatt i bakgrunnsområder
som antas å være lite påvirket at lokale punktkilder. Moderne og tilpassete analysemetoder
ble brukt for å måle PeCB, HCB, PCB, HCH, DDT, PBDE, DBDPE, HBCD, PFAS og PAH.
For de fleste stoffer viser prøvene tatt i 2015 generelt lavere konsentrasjoner sammenlignet
med moseprøver tatt i 2010. Videre bekreftes den tidligere observerte trenden med
avtakende konsentrasjon med stigende nordlig bredde. PCB-resultater viser vedvarende
utslipp fra lokale kilder i Oslo-området.
Den nye studien viser at overvåkning av atmosfærisk avsetning av organiske miljøgifter ved
hjelp av prøvetaking og analyse av mose, gir verdifull informasjon om romlig fordeling og
utvikling over tid. Det gis derfor en klar anbefaling om å fortsette med denne overvåkningen
også i framtiden.
Atmospheric deposition of organic contaminants in Norway | M-604
5
1. Introduction
Since the 1970s, it has been evident that samples of terrestrial mosses may be used for the
monitoring of atmospheric deposition of pollutants such as heavy metals. Based on experience
from the Nordic countries a network for moss sampling and analysis with respect to key heavy
metals, covering a large part of Europe, has been established where coordinated surveys are
carried out every five years (Harmens et al., 2015b, Harmens et al., 2015a, Harmens et al.,
2010, Harmens et al., 2004). In Norway nationwide atmospheric deposition surveys for trace
metals based on sampling on the terrestrial moss Hylocomium splendens have been conducted
at regular intervals since 1977 (Steinnes et al., 2011), and in recent years these data have
constituted part of the joint European moss survey. Quantitative relations between
concentration in moss and bulk atmospheric deposition in Norway has been well documented
for most heavy metals of key interest (Berg and Steinnes, 1997, Berg et al., 1995).
Within the European network the question has been raised whether moss samples might be
used for mapping of other pollutants such as nitrogen compounds and persistent organic
pollutants (POPs) (Harmens et al., 2011). Along with the contribution from Norway to the
2010 European moss survey it was decided to carry out a pilot study on the feasibility of moss
sampling for assessing geographical differences in deposition of a number of commonly
studied POPs. This idea is far from new: already around 1980 some investigators reported
data for PAH (Thomas and Herrmann, 1980) and chlorinated compounds (Carlberg et al.,
1983, Thomas and Herrmann, 1980) in moss/lichen samples. These early studies have been
followed by other publications on PAH (Dolegowska and Migaszewski, 2011, Foan et al., 2015,
Foan et al., 2010, Gerdol et al., 2002, Liu et al., 2005, Migaszewski et al., 2009, Otvos et al.,
2004, Skert et al., 2010, Thomas et al., 2005, Thomas, 1986, Thomas et al., 1984) PCB and
other chlorinated compounds (Grimalt et al., 2004, Knulst et al., 1995, Larsen et al., 1985,
Lead et al., 1996, Oehme et al., 1985, Thomas et al., 1984, Thomas et al., 1985) , as well as
brominated flame retardants (Mariussen et al., 2008) in mosses. The literature on terrestrial
mosses as biomonitors of atmospheric POPs was recently reviewed by Harmens et al.
(Harmens et al., 2013) with emphasis on PAHs. The main conclusion was that mosses appear
to be suitable organisms to monitor spatial patterns and temporal trends. Furthermore, the
“ICP Vegetation Working Group on Effects of the Convention on Long-range Transboundary Air
Pollution” that more countries determine POPs concentrations in mosses as part of the
European moss survey, in order to establish spatial trends in mosses across Europe (Harmens
et al., 2011).
Atmospheric deposition of organic contaminants in Norway | M-604
6
2. Experimental
2.1 Sampling and sample transport
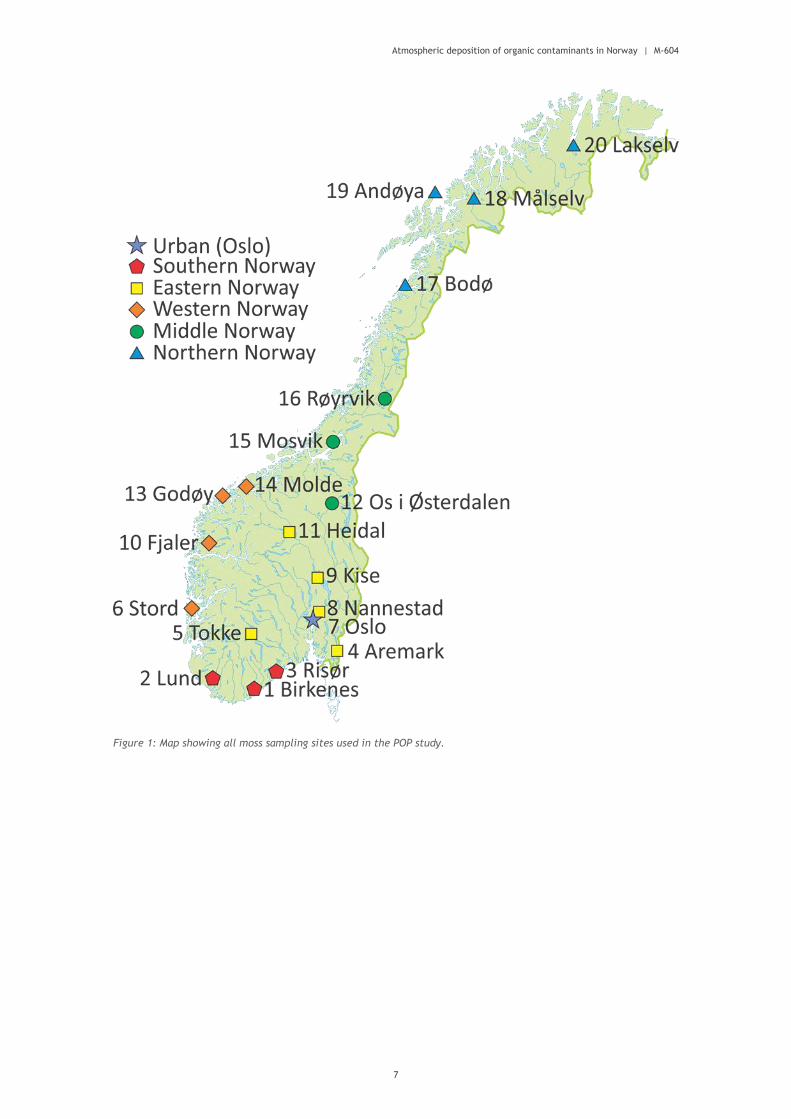
Moss samples were collected during the period May – August 2015 at 20 sites distributed all
over the mainland of Norway. The network was the same as used in previous studies of
brominated flame retardants (Mariussen et al., 2008) and the National Moss Survey 2010
(Steinnes and Schlabach, 2012). Coordinates at each site were recorded by GPS. A map
showing the 2015 sampling locations is presented in Figure 1, and their geographical
coordinates are listed in Table 1.
For selection of the sampling sites, sampling, and sample storage the recommendations given
in the manual of ICP Vegetation (Frontasyeva and Harmens, 2014) were followed. The
majority of the sampling sites are located in rural areas and presumably little affected by
local point sources of pollutants. Site 7 is an exception, as it is located only 5 km from the
centre of the capital Oslo. Sampling sites were located at least 300 m from main roads and
densely populated areas, and at least 100 m from any local road, single house, or agricultural
field. If possible, moss sampling under the crown projection of trees was avoided.
The samples were collected using bare hands, pre-cleaned with wet Sphagnum moss from the
same site. A total of three litres of Hylocomium splendens moss was collected at each site
covering an area of roughly 50 m x 50 m comprising between 5 and 10 sub-samples. The total
living part of each moss plant was collected, most often covering the last 3-5 years´ growth.
The samples were directly put into pre-cleaned glass jars (3 L) which were covered with a
layer of aluminium foil and a screw lid. In field and during transport the samples were stored
in freezing bags together with some ice packs. In the laboratory the jars containing the
samples were stored at -20° C until analysis.
Atmospheric deposition of organic contaminants in Norway | M-604
7
Figure 1: Map showing all moss sampling sites used in the POP study.

Atmospheric deposition of organic contaminants in Norway | M-604
8
Table 1: Moss sampling sites used for the POP study
Site Area Latitude
[° N]
Longitude
[° E]
RPD*
[C 25km]
Mean annual
Temperature [° C]
Mean annual
Precipitation [mm]
1 Birkenes SN 58.3878° 8.2499° 2.8E-04 6.5 1381
2 Lund SN 58.5370° 6.3772° 2.1E-04 5.9 2250
3 Risør SN 58.7597° 9.2101° 2.6E-04 6.9 1166
4 Aremark EN 59.2292° 11.7326° 3.7E-04 5.0 859
5 Tokke EN 59.4897° 7.9523° 1.8E-04 3.8 1035
6 Stord WN 59.8805° 5.3430° 2.7E-04 6.6 1978
7 Oslo/Maridalen urban 59.9790° 10.7517° 9.7E-04 4.9 915
8 Nannestad EN 60.2517° 11.1144° 8.6E-04 3.6 823
9 Kise EN 60.7822° 10.7957° 3.5E-04 3.3 585
10 Fjaler WN 61.2485° 5.4088° 1.4E-04 6.7 3131
11 Heidal EN 61.7799° 9.2448° 1.2E-04 0.5 452
12 Os i Østerdalen MN 62.3654° 11.4799° 9.3E-05 -1.9 487
13 Godøy WN 62.4763° 6.0172° 1.5E-04 6.4 1405
14 Molde WN 62.7333° 7.0170° 1.5E-04 5.8 1590
15 Mosvik MN 63.8019° 10.5931° 2.1E-04 4.5 1856
16 Røyrvik MN 64.8892° 13.9310° 3.1E-05 -0.2 873
17 Bodø NN 67.3908° 14.6523° 5.8E-05 3.1 1565
18 Målselv NN 69.0106° 18.9833° 5.3E-05 0.3 725
19 Andøya NN 69.2887° 16.0421° 3.8E-05 3.8 1007
20 Lakselv NN 69.8295° 25.1698° 1.8E-05 -1.1 434
*: Relative population density (RDP) values were calculated for each sampling site with census
data given in a 1 km x 1 km grid and for a radius of 25 km as described by Schuster et al. 2011
(Schuster et al., 2011). RPD ranges from 1.8E-05 for the most rural site Lakselv to 9.7E-04 at
the most densely populated site in Oslo/Maridalen.
Atmospheric deposition of organic contaminants in Norway | M-604
9
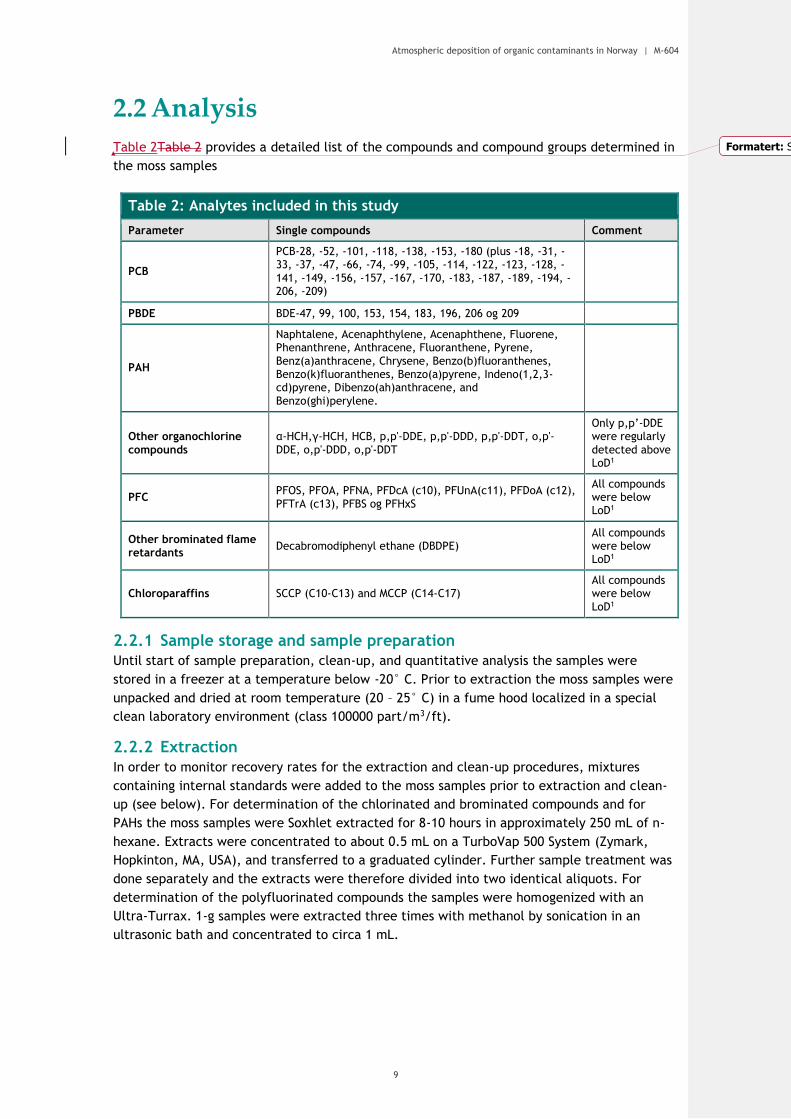
2.2 Analysis
Table 2Table 2 provides a detailed list of the compounds and compound groups determined in
the moss samples
Table 2: Analytes included in this study
Parameter Single compounds Comment
PCB
PCB-28, -52, -101, -118, -138, -153, -180 (plus -18, -31, -33, -37, -47, -66, -74, -99, -105, -114, -122, -123, -128, -
141, -149, -156, -157, -167, -170, -183, -187, -189, -194, -206, -209)
PBDE BDE-47, 99, 100, 153, 154, 183, 196, 206 og 209
PAH
Naphtalene, Acenaphthylene, Acenaphthene, Fluorene, Phenanthrene, Anthracene, Fluoranthene, Pyrene,
Benz(a)anthracene, Chrysene, Benzo(b)fluoranthenes, Benzo(k)fluoranthenes, Benzo(a)pyrene, Indeno(1,2,3-cd)pyrene, Dibenzo(ah)anthracene, and
Benzo(ghi)perylene.
Other organochlorine
compounds
α-HCH,γ-HCH, HCB, p,p'-DDE, p,p'-DDD, p,p'-DDT, o,p'-
DDE, o,p'-DDD, o,p'-DDT
Only p,p’-DDE were regularly
detected above LoD1
PFC PFOS, PFOA, PFNA, PFDcA (c10), PFUnA(c11), PFDoA (c12),
PFTrA (c13), PFBS og PFHxS
All compounds were below LoD1
Other brominated flame
retardants Decabromodiphenyl ethane (DBDPE)
All compounds were below LoD1
Chloroparaffins SCCP (C10-C13) and MCCP (C14-C17) All compounds were below
LoD1
2.2.1 Sample storage and sample preparation
Until start of sample preparation, clean-up, and quantitative analysis the samples were
stored in a freezer at a temperature below -20° C. Prior to extraction the moss samples were
unpacked and dried at room temperature (20 – 25° C) in a fume hood localized in a special
clean laboratory environment (class 100000 part/m3/ft).
2.2.2 Extraction
In order to monitor recovery rates for the extraction and clean-up procedures, mixtures
containing internal standards were added to the moss samples prior to extraction and clean-
up (see below). For determination of the chlorinated and brominated compounds and for
PAHs the moss samples were Soxhlet extracted for 8-10 hours in approximately 250 mL of n-
hexane. Extracts were concentrated to about 0.5 mL on a TurboVap 500 System (Zymark,
Hopkinton, MA, USA), and transferred to a graduated cylinder. Further sample treatment was
done separately and the extracts were therefore divided into two identical aliquots. For
determination of the polyfluorinated compounds the samples were homogenized with an
Ultra-Turrax. 1-g samples were extracted three times with methanol by sonication in an
ultrasonic bath and concentrated to circa 1 mL.
Formatert: Skrift: 10 pkt, Ikke Fet
Atmospheric deposition of organic contaminants in Norway | M-604
10
2.2.3 Clean-up
For determination of PCB, HCH, DDT, HCB, PBDE, DBDPE, SCCP, and MCCP one aliquot of the
hexane extract was transferred to a centrifuge tube, adjusted to 2 mL, and treated with 2 mL
concentrated sulfuric acid for mixing by vigorous whirling on a whirl mixer. During this
treatment the extract color turns to dark yellow. The treatment was repeated until no more
color change was visible (2-3 times). The extract was then transferred to an evaporation unit
and reduced to 0.5 mL for further clean-up by fractionation with a silica column (15 mm in
diameter and 200 mm in length). The column consists of 4 g of activated silica (Silica gel 60
Merck nr. 7734 0.063 – 0.200 mm pretreated 8 h at 550°C) topped with 1 cm anhydrous
sodium sulfate (pretreated 12 h at 600°C). The column was prewashed with 30 mL n- hexane.
The samples were eluted with 30 mL n-hexane/10 % diethyl ether. Extracts were reduced to
0.5 mL by evaporation and solvent exchanged into iso-octane and transferred to a small vial
with a screw-cap.
For determination of PAHs the second aliquot of the hexane extract was solvent exchanged to
cyclohexane. The bulk of the sample matrix was removed using a modified version of a
liquid/liquid partitioning described by Grimmer and Böhnke (Grimmer and Böhnke, 1972)
followed by a clean-up on a silica liquid chromatography column. Finally, the extract was
reduced to 0.5 mL by evaporation and transferred to a small vial with a screw-cap.
For the determination of PFAS the samples were extracted with acetonitrile and treated with
emulsive clean-up prior to analyses with UPLC/MS/MS in ESI(-) mode.
Before the instrumental analyses all extracts were further reduced to approximately 50 µL by
a gentle stream of nitrogen.
2.2.4 Instrumental analyses
In order to monitor recovery rates for the extraction and clean-up procedures, a mixture of
internal standards was added to the samples prior to extraction and clean-up. This standard
mixture consisted of a range of 13C – labeled polychlorinated biphenyls (PCB) congeners (13C
PCB-28, 52, 101, 105, 114, 118, 123, 138, 153, 156, 157, 167, 180, 189, and 209) and
organochlorine pesticides (OCPs) (13C α, β, γ- hexachlorocyclohexane (HCH), 13C-
hexachlorobenzene (HCB), 13C p,p’- dichlorodiphenyldichloroethylene (DDE), 13C p,p’-
dichlorobiphenyldichloroethane (DDT), 13C PBDE-28, 47, 99, 153, 183, and 209). For the
PAHs, a mixture of deuterium labeled polyaromatic hydrocarbons (PAH) congeners (2-
methylnaphtalene- d10, acenaphtene- d10, anthracene- d10, pyrene- d10,
benz(a)anthracene- d12, benz(e)pyrene- d12, benz(ghi)perylene- d12), was added. All
standards were purchased from LGC, formerly Promochem AB (Borås, Sweden). In order to
quantify the recovery of the internal standards, a recovery standard consisting of deuterated
PAHs (biphenyl-d10, fluorantene-d10 and perylene-d12) was added to the PAH extracts, while
1,2,3,4-tetrachloronaphtalene) was added to the acid resistant extracts. The recovery of the
added labelled standards was determined for each sample.
For all samples the recovery rates were accepted. As the concentrations of the analytes were
calculated based on the measured internal standard signals, no adjustment according to
recovery rates was applied.

Atmospheric deposition of organic contaminants in Norway | M-604
11
Determinations of the PCB congeners, α-HCH, β-HCH, γ-HCH, p,p’-DDE, p,p’-DDD, o,p’-DDT
and p,p’-DDT, HCB were performed with GC/HRMS on an Agilent 6890N gas chromatograph
coupled to a Waters AutoSpec mass spectrometer in electron impact (EI) mode.
The different PCB congeners were separated using a HT-8 (50 m×0.22 mm inner diameter
(SGE)) fused silica capillary column. The GC was operating in splitless mode with helium as a
carrier gas. 1 µL of sample extract was injected at an injector temperature on 280°C. In
2015, a blank contamination was found for PCBs. The source of this contamination was found
to be a solvent being used for the extraction of the samples. All samples being extracted in
the specific solvents were found to have elevated levels of the PCBs. As the levels of the
individual congeners in the solvent blanks were consistent, their contribution to the individual
samples could be identified. The contaminated samples were consequently blank adjusted
with the amount found in blanks. After these corrections PCB levels and patterns were similar
to those observed in previous years.
Separation of α-HCH, β-HCH, γ-HCH, p,p’-DDE, p,p’-DDD, o,p’-DDT and p,p’-DDT compounds
was done by use of a HP-1 (25 m×0.2 mm inner diameter (J&W Scientific)) fused silica
column. 1 µL was injected by an autosampler on the split/splitless injection port in splitless
mode with helium as a carrier gas (flow rate 1 mL/min).
Determination of PAHs was carried out by a GC/LRMS on an Agilent 6890N gas chromatograph
coupled to an Agilent 5973 mass spectrometer in an electron impact (EI) mode. 1 µL was
injected by an auto sampler on the split/splitless injection port in splitless mode with helium
as a carrier gas (flow rate ~1 mL/min).
Determination of PFAS were performed by UPLC/MS/MS in ESI(-) mode.
2.3 Uncertainties
All monitoring of contaminants is to some extent subject to measurement uncertainties. All
steps in the process may in theory contribute to the total uncertainty. This includes the study
design, selection of sampling media, sampling sites, sampling frequency, time of sampling,
performance of sampling, transport and storage of samples, chemical analysis, and data
treatment. To quantitatively estimate the contribution of the different steps is an extremely
difficult task. In the following the relevance of the different contributing factors is discussed
in a qualitative way.
Study design
Deposition measurements intended to cover an entire country in a representative way are an
extreme costly and complex task. Moss has therefore been used as a proxy for the rate of
atmospheric deposition for many decades in the case of heavy metals. The use of moss for
deposition measurement of organic contaminants started only recently and it is still an open
question if it is possible to derive a quantitative relationship between moss concentrations
and deposition rates. It has been shown in laboratory experiments that hydrated moss
(Hylocomium splendens) takes up more HCH than completely desiccated moss (Kylin and
Bouwman, 2012). If this is relevant under the humid Norwegian climate is not yet clear.
Atmospheric deposition of organic contaminants in Norway | M-604
12
Moreover, the concentrations of the different analytes in moss samples may vary due to
different local conditions, such as local sources and local differences in precipitation and
deposition processes.
At least for PAHs there are a variety of different small local sources, e.g. forest fires,
campfires, use of forestry machineries, etc., which are not easily identified and may have
contributed to a local increase of the PAH exposure.
Sampling and sample handling
Factors influencing sampling uncertainty may be related to (1) representativeness of the
subsamples, (2) contamination during sampling and storage, (3) loss of analytes due to
evaporation from the sample container or adsorption to the sample containers, and (4)
degradation during transport and storage.
The risk of contamination during sampling seems to be particularly high for compounds such
as BDE-209 (DecaBDE), which may still be in use as flame retardants in articles of daily use
(textiles, electronic equipment, vehicles etc.)
Chemical analysis
Uncertainty in the chemical analysis can be related to (1) loss during extraction and clean-up,
(2) interference from other compounds, (3) trueness of analytical standards, (4) instrumental
parameters, and (5) contamination. In contrast to the other uncertainties it is often possible
to estimate and quantify these analytical factors. The normal approach is participation in a
laboratory inter-calibration. The uncertainty is expected to be larger for compounds which
are analysed infrequently than for compounds commonly analyzed. In total this means that
analytical uncertainties for most of the compounds discussed in this report (PCB, chlorinated
pesticides and PAHs) may be within the range of 20 to 40 %, and even higher for PBDEs and
PFAS.
For all these groups of POPs we consider the analytical uncertainty as fit-for-purpose, that
means adequate for an initial screening study. Use of these results for future time trend
studies, however, may be limited by the considerable uncertainties in analytical data.
3. Results and Discussion
In the following the present results for DDE, and selected congeners of PCB, PBDE, and PAH
are shown and compared with corresponding data from the 2010 survey. The complete results
for determination of all compounds studied in the 20 moss samples are given in Appendix.
PFAS, PeCB, HCB, the HCH-group and some compounds of the DDT-group were found to be
below LoD in most of the samples, and results for these components are not shown. In the
2010 survey the LoD is based on the instrumental detection limit was included in the LoD. We
now apply a more conservative procedure for estimation of LoD.

Atmospheric deposition of organic contaminants in Norway | M-604
13
3.1 PCB
Concentrations of selected PCB congeners are shown in Figure 3 in comparison to
corresponding values from the 2010 survey in Figure 2.
The general levels are around 70% of the 2010 values and the congener distribution is similar
among the sites, confirming the general impression from other studies that long-range
atmospheric transport is the dominant source of PCB to the environment in Norway. One
remarkable difference is evident for the Oslo/Maridalen site where the congener ratio is
different from that seen at the other sites and the sum of congeners is 5-10 times higher than
at the other sites. This indicates a still active source releasing PCB to the air the Oslo area.
The concentration levels measured in 2015 (PCB-4: 580 pg/g dw) also appear slightly higher
compared to 2010 (PCB-4: 460 pg/g dw). However, this difference is not greater than the
estimated measurement uncertainty and thus not showing a significant time trend. As far as
we know the most recent PCB air measurements from Oslo are from 2002 and 2007, which
showed a much higher average air concentration in Oslo, Sofienbergparken 2007 (PCB-7: 31.8
pg/m3) and Sjursøya 2002 (PCB-7: 54 pg/m3) compared to a background site such as Birkenes,
2007 (PCB-7: 4.55 pg/m3) (Schlabach, 2008; Aas et al., 2012).
Figure 2: Distribution of selected PCB congeners from the 2010 study.

Atmospheric deposition of organic contaminants in Norway | M-604
14
Figure 3: Distribution of selected PCB congeners from the 2015 study.
3.2 DDE
The only compound of the DDT-group which could be detected above LoD in all samples is
p,p’-DDE. The distribution of p,p’DDE is shown in Figure 5 in comparison to corresponding
values from the 2010 survey in Figure 4. The result for DDE show that previous contamination
from DDT and its daughter products is still declining. Like in 2010 the DDE level at Kise is
considerably higher than elsewhere. Also other studies showed a higher DDE/DDT
contamination in and around Lake Mjøsa and a waste disposal site about 3 – 4 km east of the
Kise moss sampling site was identified as an important source of DDT leakage to Lake Mjøsa
(Norwegian Environment Agency, 2008). This disposal site was cleaned-up in 2009, but might
still contribute to a locally high DDE air concentration. Another source of DDE might be the
Kise Agricultural Research station.
Figure 4: Distribution of p,p’-DDE from the 2010 study.

Atmospheric deposition of organic contaminants in Norway | M-604
15
Figure 5: Distribution of p,p’-DDE from the 2015 study.
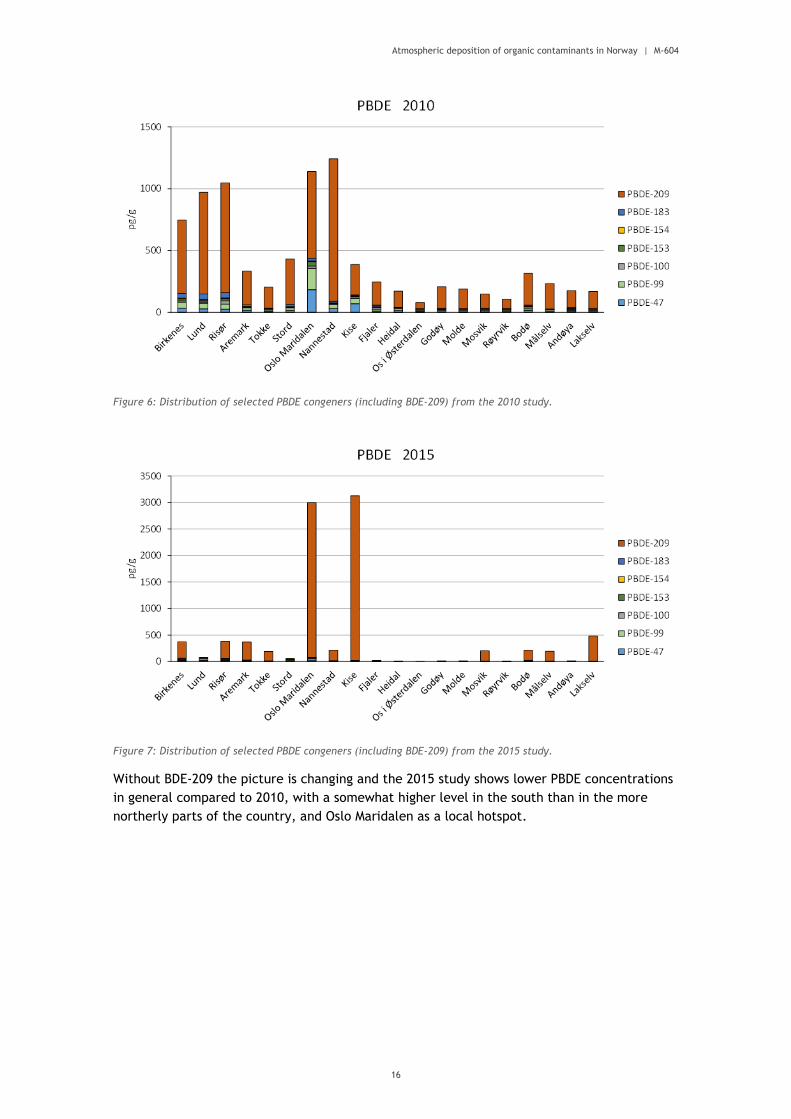
3.3 PBDE
Concentrations of selected PBDE congeners are shown in Figure 7 and Figure 9 (with and
without BDE-209) in comparison to corresponding values from the 2010 survey in Figure 6 and
Figure 8, respectively.
Both in 2010 and 2015 the BDE-209 is the dominating congener. For most sites the total PBDE
value remains stable or lower in 2015 compared to 2010, but Oslo Maridalen and Kise show a
higher total PBDE concentration in 2015. However, as explained in Chapter 2.3 Uncertainties,
the measurement of BDE-209 is exposed to a much higher measurement uncertainty, mainly
related to the risk of contamination, and a conclusion on the time trend remains open until
more results are available.
Atmospheric deposition of organic contaminants in Norway | M-604
16
Figure 6: Distribution of selected PBDE congeners (including BDE-209) from the 2010 study.
Figure 7: Distribution of selected PBDE congeners (including BDE-209) from the 2015 study.
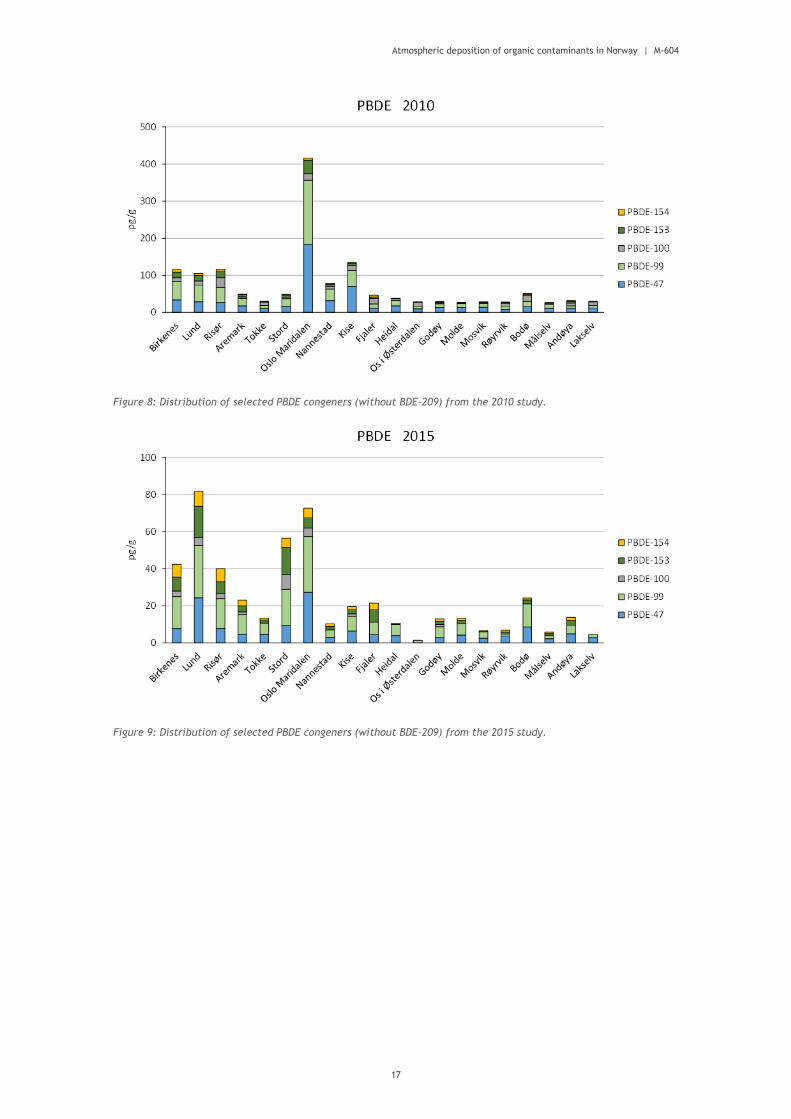
Without BDE-209 the picture is changing and the 2015 study shows lower PBDE concentrations
in general compared to 2010, with a somewhat higher level in the south than in the more
northerly parts of the country, and Oslo Maridalen as a local hotspot.
Atmospheric deposition of organic contaminants in Norway | M-604
17
Figure 8: Distribution of selected PBDE congeners (without BDE-209) from the 2010 study.
Figure 9: Distribution of selected PBDE congeners (without BDE-209) from the 2015 study.

Atmospheric deposition of organic contaminants in Norway | M-604
18
3.4 PAH
The data for PAH also show a generally declining trend, with a somewhat higher level in the
south than in the more northerly parts of the country. In general the PAH monitoring using
moss samples may be sensitive to possible use of open fires in sampling areas. It is suspected
that influence from such events may have contributed to the relatively high values observed
in samples from Lakselv 2010 and correspondingly for Oslo Maridalen and Godøy in 2015. The
results for Birkenes in 2015 are difficult to understand.
Figure 10: Distribution of selected PAH compounds from the 2010 study.
Figure 11: Distribution of selected PAH compounds from the 2015 study.

Atmospheric deposition of organic contaminants in Norway | M-604
19
4. Conclusion
In general, data from the 2015 moss survey confirms that sampling and analysis of moss, as
described in the 2010 report, is a useful way of detecting levels and assessing spatial trends
of deposition of POPs in the terrestrial environment. The most striking trend observed is the
decrease of PCB-concentration with increasing latitude. This trend was shown in the 2010
moss data, as well as in previous studies using other sampling media, and is confirmed in the
results from 2015. In addition, the results for PCB indicate emissions from local sources in the
Oslo area.
It is very likely that moss surveys will also be useful to identify temporal trends, and there
seems to be a general trend of decreasing contamination from 2010 to 2015 in the groups of
POPs included in the survey. However, with only two points on the time scale and with a
measurement uncertainty in the same range or higher than the expected decrease of
contamination level, it is not possible to draw a final conclusion yet.
Only very few studies have directly related the concentrations in mosses with measured
atmospheric concentrations in deposition or deposition fluxes. It was not the goal of this
report to attempt to correlate POP-concentrations in air and moss. However, the results from
this study together with results from other countries where moss and air were sampled at
identical sites, are important pieces of information for a better and probably quantitative
understanding of the deposition mechanisms of POPs from air to moss.
The moss survey provides knowledge about the general temporal and spatial trends of POPs-
contamination in Norway that is difficult to achieve by other means without substantially
increased cost. It is therefore recommended to continue this survey in future monitoring.

Atmospheric deposition of organic contaminants in Norway | M-604
20
5. References
Aas, W., Solberg, S., Manø, S., Yttri, K.E. (2012) Monitoring of long-range transported air
pollutants. Annual report for 2011. Kjeller, NILU (TA-2940/2012) (NILU OR 19/2012).
Berg, T., Royset, O., Steinnes, E. (1995) Moss (Hylocomium splendens) used as a biomonitor of
atmospheric trace-element deposition - estimation of uptake efficiencies. Atmos.
Environ., 29, 353-360. doi:10.1016/1352-2310(94)00259-n
Berg, T., Steinnes, E. (1997) Use of mosses (Hylocomium splendens and Pleurozium schreberi)
as biomonitors of heavy metal deposition: From relative to absolute deposition
values. Environ. Pollut., 98, 61-71. doi:10.1016/s0269-7491(97)00103-6
Carlberg, G.E., Ofstad, E.B., Drangsholt, H., Steinnes, E. (1983) Atmospheric deposition of
organic micropollutants in Norway studied by means of moss and lichen analysis.
Chemosphere, 12, 341-356. doi:10.1016/0045-6535(83)90109-1
Dolegowska, S., Migaszewski, Z.M. (2011) PAH concentrations in the moss species Hylocomium
splendens (Hedw.) B.S.G. and Pleurozium schreberi (Brid.) Mitt. from the Kielce area
(south-central Poland). Ecotoxicol. Environ. Saf., 74, 1636-1644.
doi:10.1016/j.ecoenv.2011.05.011
Foan, L., Domercq, M., Bermejo, R., Santamaria, J.M., Simon, V. (2015) Mosses as an
integrating tool for monitoring PAH atmospheric deposition: Comparison with total
deposition and evaluation of bioconcentration factors. A year-long case-study.
Chemosphere, 119, 452-458. doi:10.1016/j.chemosphere.2014.06.071
Foan, L., Sablayrolles, C., Elustondo, D., Lasheras, E., Gonzalez, L., Ederra, A., Simon, V.,
Santamaria, J.M. (2010) Reconstructing historical trends of polycyclic aromatic
hydrocarbon deposition in a remote area of Spain using herbarium moss material.
Atmos. Environ., 44, 3207-3214. doi:10.1016/j.atmosenv.2010.05.019
Frontasyeva, M., Harmens, H. (2014) Heavy metals, nitrogen and POPs in European mosses:
2015 survey - Monitoring Manual. Bangor, UK, ICP Vegetation.
Gerdol, R., Bragazza, L., Marchesini, R., Medici, A., Pedrini, P., Benedetti, S., Bovolenta, A.,
Coppi, S. (2002) Use of moss (Tortula muralis Hedw.) for monitoring organic and
inorganic air pollution in urban and rural sites in Northern Italy. Atmos. Environ., 36,
Pii s1352-2310(02)00298-4 4069-4075. doi:10.1016/s1352-2310(02)00298-4
Grimalt, J.O., Borghini, F., Sanchez-Hernandez, J.C., Barra, R., Garcia, C.J.T., Focardi, S.
(2004) Temperature dependence of the distribution of organochlorine compounds in
the mosses of the Andean mountains. Environ. Sci. Technol., 38, 5386-5392.
Grimmer, G., Böhnke, H. (1972) Determination of polycyclic aromatic hydrocarbons in
atmospheric dust and automotive-exhaust gas by capillary gas chromatography.
Fresenius Z. Anal. Chem., 261, 310-314.
Harmens, H., Buse, A., Buker, P., Norris, D., Mills, G., Williams, B., Reynolds, B., Ashenden,
T.W., Ruhling, A., Steinnes, E. (2004) Heavy metal concentrations in European
mosses: 2000/2001 survey. J. Atmos. Chem., 49, 425-436. doi:10.1007/s10874-004-
1257-0
Harmens, H., Foan, L., Simon, V., Mills, G. (2013) Terrestrial mosses as biomonitors of
atmospheric POPs pollution: A review. Environ. Pollut., 173, 245-254.
doi:10.1016/j.envpol.2012.10.005
Harmens, H., Mills, G., Hayes, F., Norris, D. (2011) Air Pollution and Vegetation - ICP
Vegetation Annual Report 2010/2011. Bangor, UK, ICP Vegetation.
Harmens, H., Mills, G., Hayes, F., Norris, D.A., Sharps, K. (2015a) Twenty eight years of
Vegetation: An overview of its activities. Ann. Bot.-Italy, 5, 31-43.
doi:10.4462/annbotrm-13064
Harmens, H., Norris, D.A., Sharps, K., Mills, G., Alber, R., Aleksiayenak, Y., Blum, O., Cucu-
Man, S.M., Dam, M., De Temmerman, L., Ene, A., Fernandez, J.A., Martinez-Abaigar,
J., Frontasyeva, M., Godzik, B., Jeran, Z., Lazo, P., Leblond, S., Liiv, S., Magnusson,
S.H., Mankovska, B., Karlsson, G.P., Piispanen, J., Poikolainen, J., Santamaria, J.M.,
Skudnik, M., Spiric, Z., Stafilov, T., Steinnes, E., Stihi, C., Suchara, I., Thoni, L.,
Todoran, R., Yurukova, L., Zechmeister, H.G. (2015b) Heavy metal and nitrogen

Atmospheric deposition of organic contaminants in Norway | M-604
21
concentrations in mosses are declining across Europe whilst some "hotspots" remain in
2010. Environ. Pollut., 200, 93-104. doi:10.1016/j.envpol.2015.01.036
Harmens, H., Norris, D.A., Steinnes, E., Kubin, E., Piispanen, J., Alber, R., Aleksiayenak, Y.,
Blum, O., Coskun, M., Dam, M., De Temmerman, L., Fernandez, J.A., Frolova, M.,
Frontasyeva, M., Gonzalez-Miqueo, L., Grodzinska, K., Jeran, Z., Korzekwa, S.,
Krmar, M., Kvietkusr, K., Leblond, S., Liiv, S., Magnusson, S.H., Mankovska, B., Pesch,
R., Ruehling, A., Santamaria, J.M., Schroder, W., Spiric, Z., Suchara, I., Thoni, L.,
Urumov, V., Yurukova, L., Zechmeister, H.G. (2010) Mosses as biomonitors of
atmospheric heavy metal deposition: Spatial patterns and temporal trends in Europe.
Environ. Pollut., 158, 3144-3156. doi:10.1016/j.envpol.2010.06.039
Knulst, J.C., Westling, H.O., Brorstromlunden, E. (1995) Airborne organic micropollutant
concentrations in mosses and humus as indicators for local versus long-range sources.
Environ. Monit. Assess., 36, 75-91. doi:10.1007/bf00546986
Kylin, H., Bouwman, H. (2012) Hydration state of the moss Hylocomium splendens and the
lichen Cladina stellaris governs uptake and revolatilization of airborne alpha- and
gamma-hexachlorocyclohexane. Environ. Sci. Technol., 46, 10982-10989.
doi:10.1021/es302363g
Larsen, B.R., Lokke, H., Rasmussen, L. (1985) Accumulation of chlorinated hydrocarbons in
moss from artificial rainwater. Oikos, 44, 423-429. doi:10.2307/3565783
Lead, W.A., Steinnes, E., Jones, K.C. (1996) Atmospheric deposition of PCBs to moss
(Hylocomium splendens) in Norway between 1977 and 1990. Environ. Sci. Technol.,
30, 524-530. doi:10.1021/es950275s
Liu, X., Zhang, G., Jones, K.C., Li, X.D., Peng, X.Z., Qi, S.H. (2005) Compositional
fractionation of polycyclic aromatic hydrocarbons (PAHs) in mosses (Hypnum
plumaeformae WILS.) from the northern slope of Nanling Mountains, South China.
Atmos. Environ., 39, 5490-5499. doi:10.1016/j.atmosenv.2005.05.048
Mariussen, E., Steinnes, E., Breivik, K., Nygard, T., Schlabach, M., Kalas, J.A. (2008) Spatial
patterns of polybrominated diphenyl ethers (PBDEs) in mosses, herbivores and a
carnivore from the Norwegian terrestrial biota. Sci. Total Environ., 404, 162-170.
doi:10.1016/j.scitotenv.2008.06.005
Migaszewski, Z.M., Galuszka, A., Crock, J.G., Lamothe, P.J., Dolegowska, S. (2009)
Interspecies and interregional comparisons of the chemistry of PAHs and trace
elements in mosses Hylocomium splendens (Hedw.) BSG and Pleurozium schreberi
(Brid.) Mitt. from Poland and Alaska. Atmos. Environ., 43, 1464-1473.
doi:10.1016/j.atmosenv.2008.11.035
Norwegian Environment Agency (2008) Kilde til DDT-forurensning i Mjøsa funnet. URL:
http://www.miljodirektoratet.no/no/Nyheter/Nyheter/Old-
klif/2008/Juni_2008/Kilde_til_DDT_forurensning_i_Mjosa_funnet_/ [Accessed
23.09.2016].
Oehme, M., Mano, S., Thomas, W. (1985) Quantitative determination of sub-ppb traces of
polychlorinated compounds and pesticides in moss samples. Fresenius Zeitschrift Fur
Analytische Chemie, 321, 655-659. doi:10.1007/bf00489630
Otvos, E., Kozak, I.O., Fekete, J., Sharma, V.K., Tuba, Z. (2004) Atmospheric deposition of
polycyclic aromatic hydrocarbons (PAHs) in mosses (Hypnum cupressiforme) in
Hungary. Sci. Total Environ., 330, 89-99. doi:10.1016/j.scitotenv.2004.02.019
Schlabach, M. (2008) Urban background levels of dioxin and PCB in Oslo. Kjeller, NILU (TA-
2453/2008) (NILU OR 81/2008).
Schuster, J.K., Gioia, R., Moeckel, C., Agarwal, T., Bucheli, T.D., Breivik, K., Steinnes, E.,
Jones, K.C. (2011) Has the burden and distribution of PCBs and PBDEs changed in
European background soils between 1998 and 2008? Implications for sources and
processes. Environ. Sci. Technol., 45, 7291-7297.
Skert, N., Falomo, J., Giorgini, L., Acquavita, A., Capriglia, L., Grahonja, R., Miani, N. (2010)
Biological and artificial matrixes as PAH accumulators: An experimental comparative
study. Water Air Soil Pollut., 206, 95-103. doi:10.1007/s11270-009-0089-6
Steinnes, E., Berg, T., Uggerud, H.T. (2011) Three decades of atmospheric metal deposition
in Norway as evident from analysis of moss samples. Sci. Total Environ., 412, 351-358.
doi:10.1016/j.scitotenv.2011.09.086

Atmospheric deposition of organic contaminants in Norway | M-604
22
Thomas, G.O., Moss, S.E.W., Asplund, L., Hall, A.J. (2005) Absorption of decabromodiphenyl
ether and other organohalogen chemicals by grey seals (Halichoerus grypus). Environ.
Pollut., 133, 581-586.
Thomas, W. (1986) Representativity of mosses as biomonitor organisms for the accumulation
of environmental chemicals in plants and soils. Ecotoxicol. Environ. Saf., 11, 339-346.
doi:10.1016/0147-6513(86)90106-5
Thomas, W., Herrmann, R. (1980) Nachweis von Chlorpestiziden, PCB, PCA und
Schwermetallen mittels epiphytischer Moose als Biofilter entlang eines Profils durch
Mitteleuropa. Staub Reinhalt. Luft, 40, 440-444.
Thomas, W., Rühling, Å., Simon, H. (1984) Accumulation of airborne pollutants (PAH,
chlorinated hydrocarbons, heavy metals) in various plant species and humus. Environ.
Pollut. Ecol. Biol., 36, 295-310. doi:http://dx.doi.org/10.1016/0143-1471(84)90099-0
Thomas, W., Simon, H., Rühling, Å. (1985) Classification of plant species by their organic
(PAH, PCB, BHC) and inorganic (heavy metals) trace pollutant concentrations. Sci.
Total Environ., 46, 83-94. doi:http://dx.doi.org/10.1016/0048-9697(85)90285-2

Atmospheric deposition of organic contaminants in Norway | M-604
23
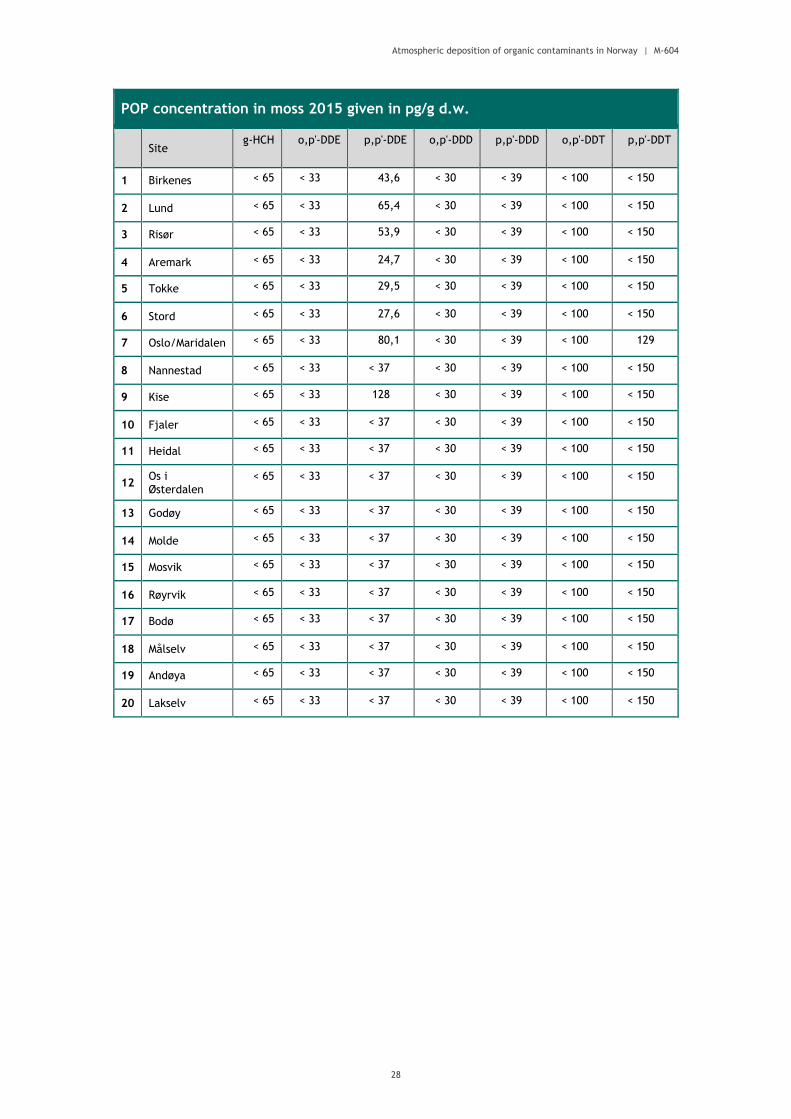
Appendix
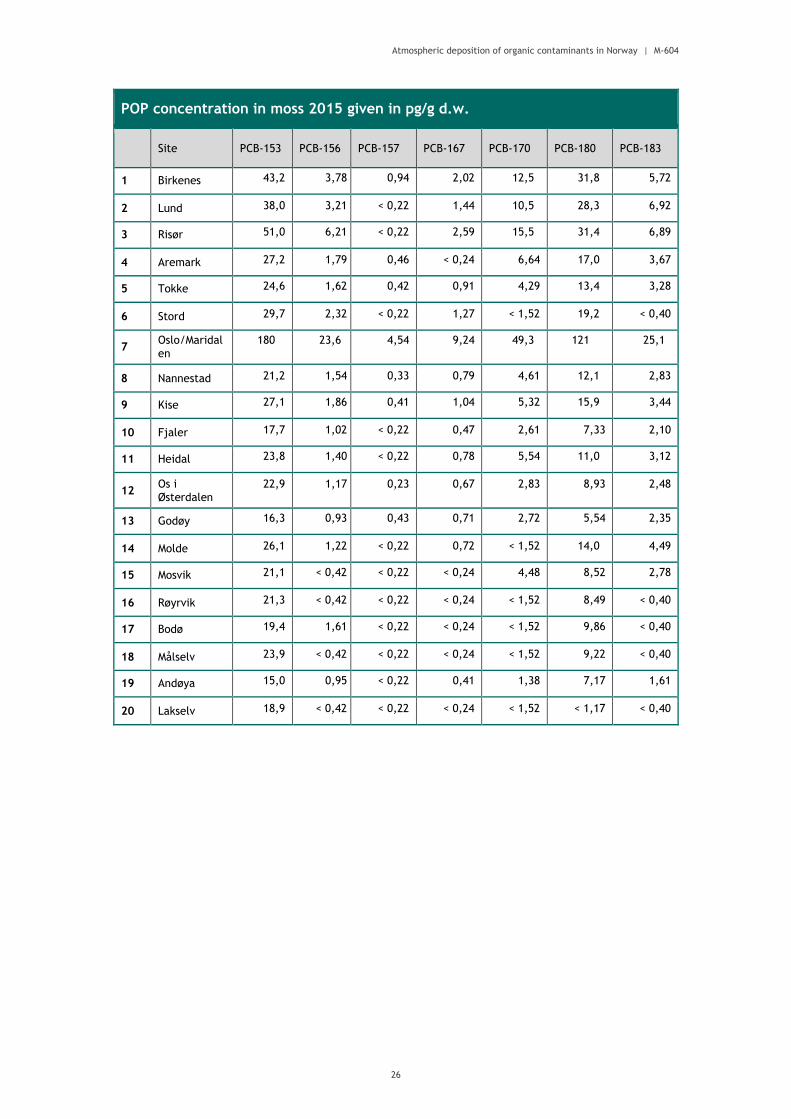
POP concentration in moss 2015 given in pg/g d.w.
Site PeCB HCB PCB-18 PCB-28 PCB-31 PCB-33 PCB-37
1 Birkenes <43 256 <11 < 33 <23 < 18 <17
2 Lund <43 < 179 <11 < 33 <23 < 18 <17
3 Risør <43 188 <11 < 33 <23 < 18 <17
4 Aremark <43 < 179 <11 < 33 <23 < 18 <17
5 Tokke <43 < 179 <11 < 33 <23 < 18 <17
6 Stord <43 < 179 <11 < 33 <23 < 18 <17
7 Oslo/Maridalen <43 < 179 5,78 < 33 12,12 < 18 <17
8 Nannestad <43 < 179 <11 < 33 <23 < 18 <17
9 Kise <43 < 179 <11 < 33 <23 < 18 <17
10 Fjaler <43 < 179 <11 < 33 <23 < 18 <17
11 Heidal <43 < 179 <11 < 33 <23 < 18 <17
12 Os i Østerdalen
<43 < 179 <11 < 33 <23 < 18 <17
13 Godøy <43 < 179 <11 < 33 <23 < 18 <17
14 Molde <43 < 179 <11 < 33 <23 < 18 <17
15 Mosvik <43 < 179 <11 < 33 <23 < 18 <17
16 Røyrvik <43 < 179 <11 < 33 <23 < 18 <17
17 Bodø <43 < 179 <11 < 33 <23 < 18 <17
18 Målselv <43 141 <11 < 33 <23 < 18 <17
19 Andøya <43 < 179 <11 < 33 <23 < 18 <17
20 Lakselv <43 201 <11 < 33 <23 < 18 <17

Atmospheric deposition of organic contaminants in Norway | M-604
24
POP concentration in moss 2015 given in pg/g d.w.
Site PCB-52 PCB-66 PCB-74 PCB-99 PCB-101 PCB-105 PCB-114
1 Birkenes < 15 5,16 < 5,8 19,6 17,9 6,30 < 0,24
2 Lund < 15 4,05 < 5,8 18,5 13,8 5,27 < 0,24
3 Risør 11,4 8,00 3,48 23,9 34,3 11,7 < 0,24
4 Aremark < 15 < 10 < 5,8 13,4 9,3 3,09 < 0,24
5 Tokke < 15 < 10 < 5,8 15,3 10,5 2,70 0,13
6 Stord < 15 4,65 < 5,8 15,8 11,8 3,16 < 0,24
7 Oslo/Maridalen 29,8 26,3 11,8 42,0 109 48,1 2,84
8 Nannestad < 15 < 10 < 5,8 14,5 8,4 1,41 < 0,24
9 Kise < 15 < 10 < 5,8 16,8 14,0 3,79 0,38
10 Fjaler < 15 < 10 < 5,8 11,0 15,7 1,86 < 0,24
11 Heidal < 15 6,81 2,55 12,7 9,6 3,76 < 0,24
12 Os i
Østerdalen < 15 < 10 < 5,8 11,2 10,1 2,54 < 0,24
13 Godøy < 15 < 10 < 5,8 14,3 7,5 1,28 < 0,24
14 Molde < 15 4,83 3,87 18,0 11,2 2,57 < 0,24
15 Mosvik < 15 3,90 < 5,8 27,3 6,6 2,43 < 0,24
16 Røyrvik < 15 < 10 < 5,8 23,1 4,0 < 2,0 < 0,24
17 Bodø < 15 5,65 < 5,8 23,6 8,0 2,89 < 0,24
18 Målselv < 15 < 10 < 5,8 33,0 9,8 4,25 < 0,24
19 Andøya < 15 < 10 < 5,8 14,2 < 9,6 1,33 < 0,24
20 Lakselv < 15 6,17 < 5,8 30,6 6,5 3,70 < 0,24

Atmospheric deposition of organic contaminants in Norway | M-604
25
POP concentration in moss 2015 given in pg/g d.w.
Site PCB-118 PCB-122 PCB-123 PCB-128 PCB-138 PCB-141 PCB-149
1 Birkenes 15,0 < 0,21 0,53 8,36 33,0 6,69 25,8
2 Lund 12,5 < 0,21 < 0,60 6,58 31,0 5,61 25,0
3 Risør 27,6 1,31 < 0,60 10,1 49,8 8,35 32,0
4 Aremark 7,95 < 0,21 1,01 4,84 19,5 3,71 14,4
5 Tokke 7,57 < 0,21 0,44 4,52 16,9 3,21 14,4
6 Stord 7,61 < 0,21 < 0,60 < 0,83 22,0 3,93 17,3
7 Oslo/Maridal
en
106 1,35 7,87 48,3 169 41,5 121
8 Nannestad 6,39 < 0,21 < 0,60 4,74 13,7 2,87 11,6
9 Kise 11,0 < 0,21 < 0,60 5,49 20,2 4,34 17,3
10 Fjaler 6,48 < 0,21 < 0,60 2,71 12,3 2,48 12,6
11 Heidal 7,38 < 0,21 < 0,60 3,85 19,6 4,39 18,3
12 Os i
Østerdalen
7,89 < 0,21 0,62 3,40 15,2 3,59 13,7
13 Godøy 6,03 < 0,21 < 0,60 2,76 11,1 1,83 9,59
14 Molde 9,02 < 0,21 < 0,60 < 0,83 21,2 1,76 15,4
15 Mosvik 7,71 < 0,21 < 0,60 < 0,83 12,4 1,64 9,39
16 Røyrvik 5,42 < 0,21 < 0,60 < 0,83 12,3 < 1,41 3,46
17 Bodø 7,99 < 0,21 < 0,60 3,75 13,8 2,57 8,92
18 Målselv 9,07 < 0,21 < 0,60 < 0,83 14,7 < 1,41 9,96
19 Andøya 4,43 < 0,21 < 0,60 2,55 9,5 < 1,41 6,99
20 Lakselv 10,3 < 0,21 < 0,60 < 0,83 15,0 1,13 9,94
Atmospheric deposition of organic contaminants in Norway | M-604
26
POP concentration in moss 2015 given in pg/g d.w.
Site PCB-153 PCB-156 PCB-157 PCB-167 PCB-170 PCB-180 PCB-183
1 Birkenes 43,2 3,78 0,94 2,02 12,5 31,8 5,72
2 Lund 38,0 3,21 < 0,22 1,44 10,5 28,3 6,92
3 Risør 51,0 6,21 < 0,22 2,59 15,5 31,4 6,89
4 Aremark 27,2 1,79 0,46 < 0,24 6,64 17,0 3,67
5 Tokke 24,6 1,62 0,42 0,91 4,29 13,4 3,28
6 Stord 29,7 2,32 < 0,22 1,27 < 1,52 19,2 < 0,40
7 Oslo/Maridal
en
180 23,6 4,54 9,24 49,3 121 25,1
8 Nannestad 21,2 1,54 0,33 0,79 4,61 12,1 2,83
9 Kise 27,1 1,86 0,41 1,04 5,32 15,9 3,44
10 Fjaler 17,7 1,02 < 0,22 0,47 2,61 7,33 2,10
11 Heidal 23,8 1,40 < 0,22 0,78 5,54 11,0 3,12
12 Os i
Østerdalen
22,9 1,17 0,23 0,67 2,83 8,93 2,48
13 Godøy 16,3 0,93 0,43 0,71 2,72 5,54 2,35
14 Molde 26,1 1,22 < 0,22 0,72 < 1,52 14,0 4,49
15 Mosvik 21,1 < 0,42 < 0,22 < 0,24 4,48 8,52 2,78
16 Røyrvik 21,3 < 0,42 < 0,22 < 0,24 < 1,52 8,49 < 0,40
17 Bodø 19,4 1,61 < 0,22 < 0,24 < 1,52 9,86 < 0,40
18 Målselv 23,9 < 0,42 < 0,22 < 0,24 < 1,52 9,22 < 0,40
19 Andøya 15,0 0,95 < 0,22 0,41 1,38 7,17 1,61
20 Lakselv 18,9 < 0,42 < 0,22 < 0,24 < 1,52 < 1,17 < 0,40
Atmospheric deposition of organic contaminants in Norway | M-604
27
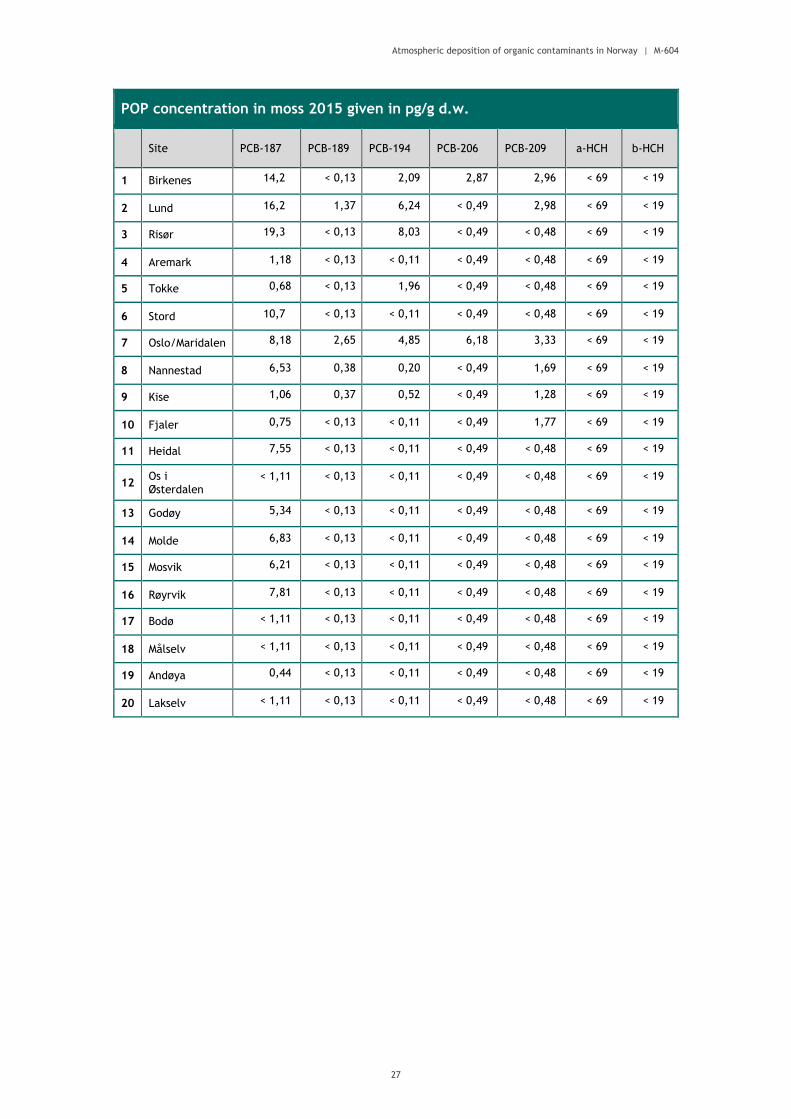
POP concentration in moss 2015 given in pg/g d.w.
Site PCB-187 PCB-189 PCB-194 PCB-206 PCB-209 a-HCH b-HCH
1 Birkenes 14,2 < 0,13 2,09 2,87 2,96 < 69 < 19
2 Lund 16,2 1,37 6,24 < 0,49 2,98 < 69 < 19
3 Risør 19,3 < 0,13 8,03 < 0,49 < 0,48 < 69 < 19
4 Aremark 1,18 < 0,13 < 0,11 < 0,49 < 0,48 < 69 < 19
5 Tokke 0,68 < 0,13 1,96 < 0,49 < 0,48 < 69 < 19
6 Stord 10,7 < 0,13 < 0,11 < 0,49 < 0,48 < 69 < 19
7 Oslo/Maridalen 8,18 2,65 4,85 6,18 3,33 < 69 < 19
8 Nannestad 6,53 0,38 0,20 < 0,49 1,69 < 69 < 19
9 Kise 1,06 0,37 0,52 < 0,49 1,28 < 69 < 19
10 Fjaler 0,75 < 0,13 < 0,11 < 0,49 1,77 < 69 < 19
11 Heidal 7,55 < 0,13 < 0,11 < 0,49 < 0,48 < 69 < 19
12 Os i
Østerdalen
< 1,11 < 0,13 < 0,11 < 0,49 < 0,48 < 69 < 19
13 Godøy 5,34 < 0,13 < 0,11 < 0,49 < 0,48 < 69 < 19
14 Molde 6,83 < 0,13 < 0,11 < 0,49 < 0,48 < 69 < 19
15 Mosvik 6,21 < 0,13 < 0,11 < 0,49 < 0,48 < 69 < 19
16 Røyrvik 7,81 < 0,13 < 0,11 < 0,49 < 0,48 < 69 < 19
17 Bodø < 1,11 < 0,13 < 0,11 < 0,49 < 0,48 < 69 < 19
18 Målselv < 1,11 < 0,13 < 0,11 < 0,49 < 0,48 < 69 < 19
19 Andøya 0,44 < 0,13 < 0,11 < 0,49 < 0,48 < 69 < 19
20 Lakselv < 1,11 < 0,13 < 0,11 < 0,49 < 0,48 < 69 < 19
Atmospheric deposition of organic contaminants in Norway | M-604
28
POP concentration in moss 2015 given in pg/g d.w.
Site g-HCH o,p'-DDE p,p'-DDE o,p'-DDD p,p'-DDD o,p'-DDT p,p'-DDT
1 Birkenes < 65 < 33 43,6 < 30 < 39 < 100 < 150
2 Lund < 65 < 33 65,4 < 30 < 39 < 100 < 150
3 Risør < 65 < 33 53,9 < 30 < 39 < 100 < 150
4 Aremark < 65 < 33 24,7 < 30 < 39 < 100 < 150
5 Tokke < 65 < 33 29,5 < 30 < 39 < 100 < 150
6 Stord < 65 < 33 27,6 < 30 < 39 < 100 < 150
7 Oslo/Maridalen < 65 < 33 80,1 < 30 < 39 < 100 129
8 Nannestad < 65 < 33 < 37 < 30 < 39 < 100 < 150
9 Kise < 65 < 33 128 < 30 < 39 < 100 < 150
10 Fjaler < 65 < 33 < 37 < 30 < 39 < 100 < 150
11 Heidal < 65 < 33 < 37 < 30 < 39 < 100 < 150
12 Os i
Østerdalen
< 65 < 33 < 37 < 30 < 39 < 100 < 150
13 Godøy < 65 < 33 < 37 < 30 < 39 < 100 < 150
14 Molde < 65 < 33 < 37 < 30 < 39 < 100 < 150
15 Mosvik < 65 < 33 < 37 < 30 < 39 < 100 < 150
16 Røyrvik < 65 < 33 < 37 < 30 < 39 < 100 < 150
17 Bodø < 65 < 33 < 37 < 30 < 39 < 100 < 150
18 Målselv < 65 < 33 < 37 < 30 < 39 < 100 < 150
19 Andøya < 65 < 33 < 37 < 30 < 39 < 100 < 150
20 Lakselv < 65 < 33 < 37 < 30 < 39 < 100 < 150
Atmospheric deposition of organic contaminants in Norway | M-604
29
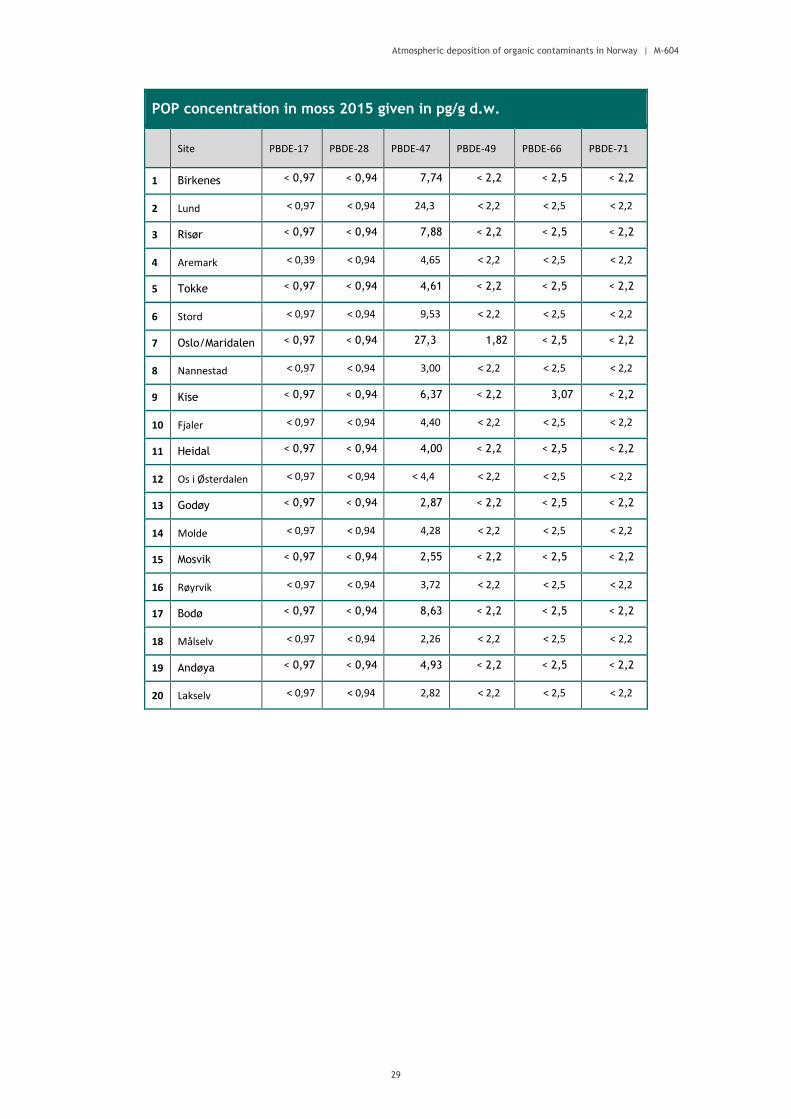
POP concentration in moss 2015 given in pg/g d.w.
Site PBDE-17 PBDE-28 PBDE-47 PBDE-49 PBDE-66 PBDE-71
1 Birkenes < 0,97 < 0,94 7,74 < 2,2 < 2,5 < 2,2
2 Lund < 0,97 < 0,94 24,3 < 2,2 < 2,5 < 2,2
3 Risør < 0,97 < 0,94 7,88 < 2,2 < 2,5 < 2,2
4 Aremark < 0,39 < 0,94 4,65 < 2,2 < 2,5 < 2,2
5 Tokke < 0,97 < 0,94 4,61 < 2,2 < 2,5 < 2,2
6 Stord < 0,97 < 0,94 9,53 < 2,2 < 2,5 < 2,2
7 Oslo/Maridalen < 0,97 < 0,94 27,3 1,82 < 2,5 < 2,2
8 Nannestad < 0,97 < 0,94 3,00 < 2,2 < 2,5 < 2,2
9 Kise < 0,97 < 0,94 6,37 < 2,2 3,07 < 2,2
10 Fjaler < 0,97 < 0,94 4,40 < 2,2 < 2,5 < 2,2
11 Heidal < 0,97 < 0,94 4,00 < 2,2 < 2,5 < 2,2
12 Os i Østerdalen < 0,97 < 0,94 < 4,4 < 2,2 < 2,5 < 2,2
13 Godøy < 0,97 < 0,94 2,87 < 2,2 < 2,5 < 2,2
14 Molde < 0,97 < 0,94 4,28 < 2,2 < 2,5 < 2,2
15 Mosvik < 0,97 < 0,94 2,55 < 2,2 < 2,5 < 2,2
16 Røyrvik < 0,97 < 0,94 3,72 < 2,2 < 2,5 < 2,2
17 Bodø < 0,97 < 0,94 8,63 < 2,2 < 2,5 < 2,2
18 Målselv < 0,97 < 0,94 2,26 < 2,2 < 2,5 < 2,2
19 Andøya < 0,97 < 0,94 4,93 < 2,2 < 2,5 < 2,2
20 Lakselv < 0,97 < 0,94 2,82 < 2,2 < 2,5 < 2,2
Atmospheric deposition of organic contaminants in Norway | M-604
30
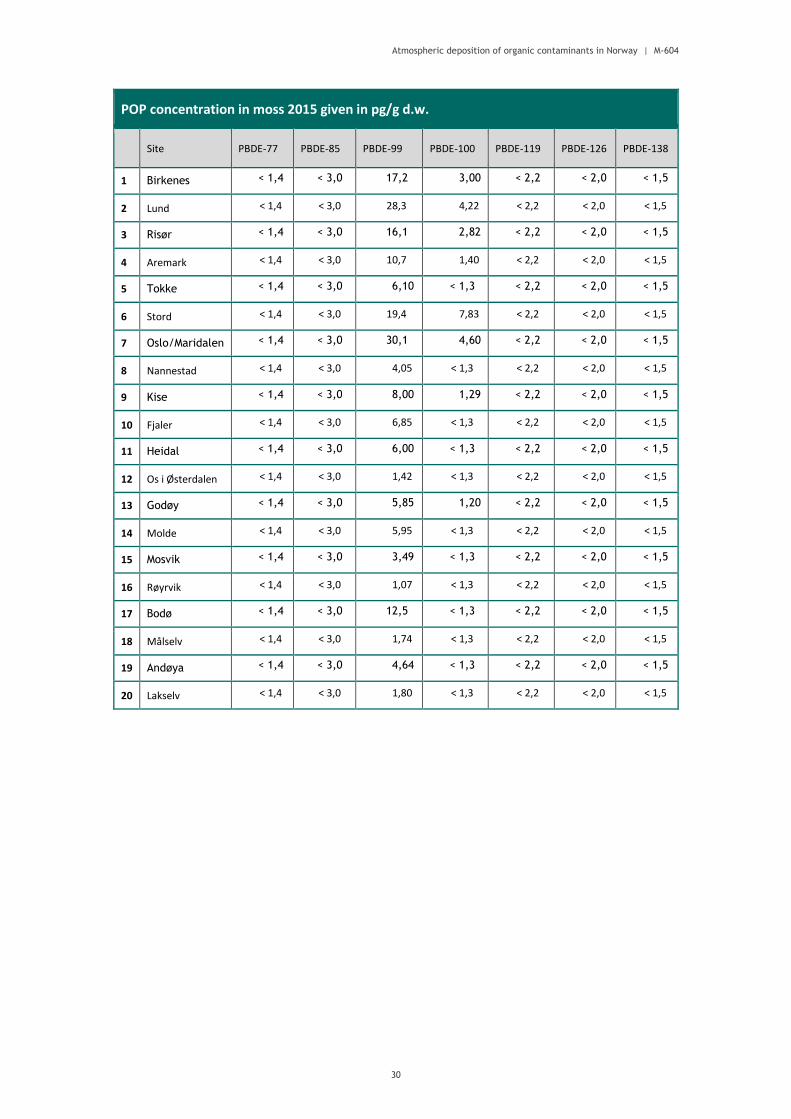
POP concentration in moss 2015 given in pg/g d.w.
Site PBDE-77 PBDE-85 PBDE-99 PBDE-100 PBDE-119 PBDE-126 PBDE-138
1 Birkenes < 1,4 < 3,0 17,2 3,00 < 2,2 < 2,0 < 1,5
2 Lund < 1,4 < 3,0 28,3 4,22 < 2,2 < 2,0 < 1,5
3 Risør < 1,4 < 3,0 16,1 2,82 < 2,2 < 2,0 < 1,5
4 Aremark < 1,4 < 3,0 10,7 1,40 < 2,2 < 2,0 < 1,5
5 Tokke < 1,4 < 3,0 6,10 < 1,3 < 2,2 < 2,0 < 1,5
6 Stord < 1,4 < 3,0 19,4 7,83 < 2,2 < 2,0 < 1,5
7 Oslo/Maridalen < 1,4 < 3,0 30,1 4,60 < 2,2 < 2,0 < 1,5
8 Nannestad < 1,4 < 3,0 4,05 < 1,3 < 2,2 < 2,0 < 1,5
9 Kise < 1,4 < 3,0 8,00 1,29 < 2,2 < 2,0 < 1,5
10 Fjaler < 1,4 < 3,0 6,85 < 1,3 < 2,2 < 2,0 < 1,5
11 Heidal < 1,4 < 3,0 6,00 < 1,3 < 2,2 < 2,0 < 1,5
12 Os i Østerdalen < 1,4 < 3,0 1,42 < 1,3 < 2,2 < 2,0 < 1,5
13 Godøy < 1,4 < 3,0 5,85 1,20 < 2,2 < 2,0 < 1,5
14 Molde < 1,4 < 3,0 5,95 < 1,3 < 2,2 < 2,0 < 1,5
15 Mosvik < 1,4 < 3,0 3,49 < 1,3 < 2,2 < 2,0 < 1,5
16 Røyrvik < 1,4 < 3,0 1,07 < 1,3 < 2,2 < 2,0 < 1,5
17 Bodø < 1,4 < 3,0 12,5 < 1,3 < 2,2 < 2,0 < 1,5
18 Målselv < 1,4 < 3,0 1,74 < 1,3 < 2,2 < 2,0 < 1,5
19 Andøya < 1,4 < 3,0 4,64 < 1,3 < 2,2 < 2,0 < 1,5
20 Lakselv < 1,4 < 3,0 1,80 < 1,3 < 2,2 < 2,0 < 1,5

Atmospheric deposition of organic contaminants in Norway | M-604
31
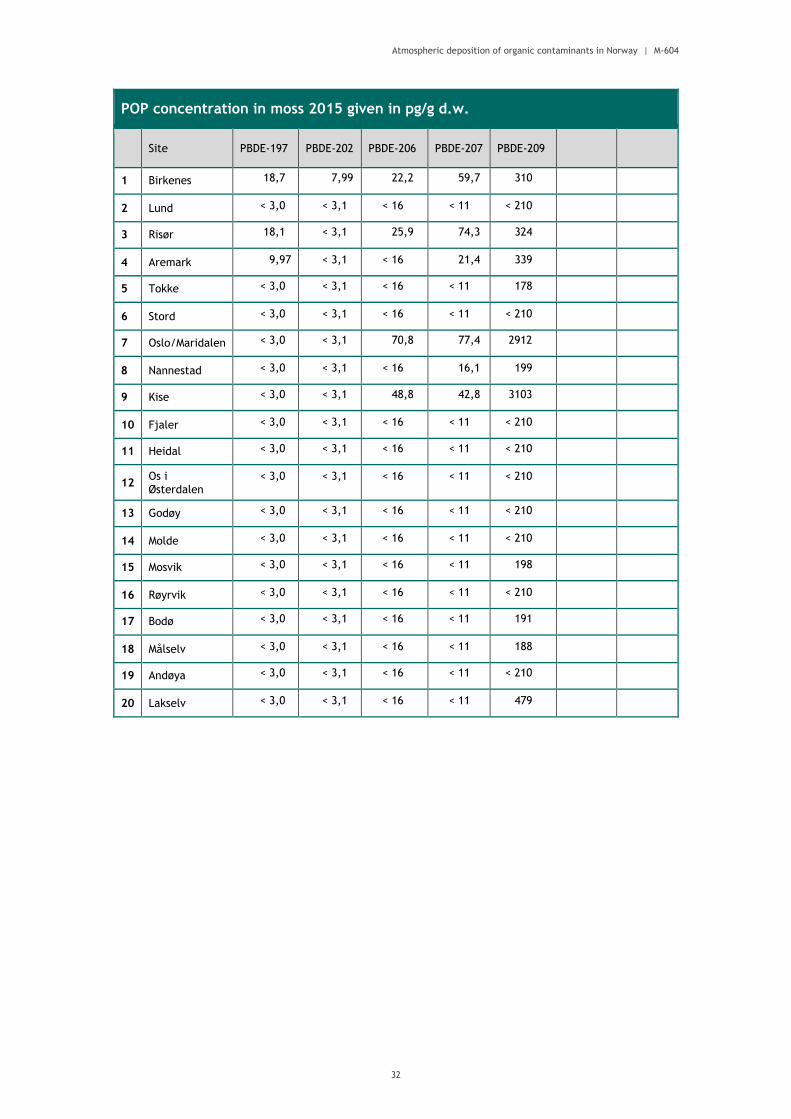
POP concentration in moss 2015 given in pg/g d.w.
Site PBDE-153 PBDE-154 PBDE-156 PBDE-183 PBDE-184 PBDE-
191 PBDE-196
1 Birkenes 7,50 6,85 < 3,1 20,0 3,21 < 2,3 23,2
2 Lund 16,9 8,06 < 3,1 < 1,1 < 0,86 < 2,3 < 4,6
3 Risør 6,25 7,02 < 3,1 21,0 4,06 < 2,3 16,2
4 Aremark 3,26 3,08 < 3,1 7,28 < 0,86 < 2,3 < 4,6
5 Tokke 1,64 1,04 < 3,1 < 1,1 < 0,86 < 2,3 < 4,6
6 Stord 14,7 5,01 < 3,1 < 1,1 < 0,86 < 2,3 < 4,6
7 Oslo/Maridalen 5,43 5,22 < 3,1 11,9 < 0,86 < 2,3 < 4,6
8 Nannestad 1,83 1,42 < 3,1 5,61 < 0,86 < 2,3 < 4,6
9 Kise 2,18 1,69 < 3,1 4,59 < 0,86 < 2,3 < 4,6
10 Fjaler 6,62 3,60 < 3,1 < 1,1 < 0,86 < 2,3 < 4,6
11 Heidal <1,1 0,68 < 3,1 < 1,1 < 0,86 < 2,3 < 4,6
12 Os i
Østerdalen
<1,1 <0,59 < 3,1 < 1,1 < 0,86 < 2,3 < 4,6
13 Godøy 1,72 1,29 < 3,1 < 1,1 < 0,86 < 2,3 < 4,6
14 Molde 1,72 1,31 < 3,1 < 1,1 < 0,86 < 2,3 < 4,6
15 Mosvik <1,1 0,64 < 3,1 < 1,1 < 0,86 < 2,3 < 4,6
16 Røyrvik 1,12 1,12 < 3,1 < 1,1 < 0,86 < 2,3 < 4,6
17 Bodø 2,01 1,06 < 3,1 < 1,1 < 0,86 < 2,3 < 4,6
18 Målselv 1,07 0,86 < 3,1 < 1,1 < 0,86 < 2,3 < 4,6
19 Andøya 2,45 1,74 < 3,1 < 1,1 < 0,86 < 2,3 < 4,6
20 Lakselv <1,1 <0,59 < 3,1 < 1,1 < 0,86 < 2,3 < 4,6
Atmospheric deposition of organic contaminants in Norway | M-604
32
POP concentration in moss 2015 given in pg/g d.w.
Site PBDE-197 PBDE-202 PBDE-206 PBDE-207 PBDE-209
1 Birkenes 18,7 7,99 22,2 59,7 310
2 Lund < 3,0 < 3,1 < 16 < 11 < 210
3 Risør 18,1 < 3,1 25,9 74,3 324
4 Aremark 9,97 < 3,1 < 16 21,4 339
5 Tokke < 3,0 < 3,1 < 16 < 11 178
6 Stord < 3,0 < 3,1 < 16 < 11 < 210
7 Oslo/Maridalen < 3,0 < 3,1 70,8 77,4 2912
8 Nannestad < 3,0 < 3,1 < 16 16,1 199
9 Kise < 3,0 < 3,1 48,8 42,8 3103
10 Fjaler < 3,0 < 3,1 < 16 < 11 < 210
11 Heidal < 3,0 < 3,1 < 16 < 11 < 210
12 Os i
Østerdalen
< 3,0 < 3,1 < 16 < 11 < 210
13 Godøy < 3,0 < 3,1 < 16 < 11 < 210
14 Molde < 3,0 < 3,1 < 16 < 11 < 210
15 Mosvik < 3,0 < 3,1 < 16 < 11 198
16 Røyrvik < 3,0 < 3,1 < 16 < 11 < 210
17 Bodø < 3,0 < 3,1 < 16 < 11 191
18 Målselv < 3,0 < 3,1 < 16 < 11 188
19 Andøya < 3,0 < 3,1 < 16 < 11 < 210
20 Lakselv < 3,0 < 3,1 < 16 < 11 479
Atmospheric deposition of organic contaminants in Norway | M-604
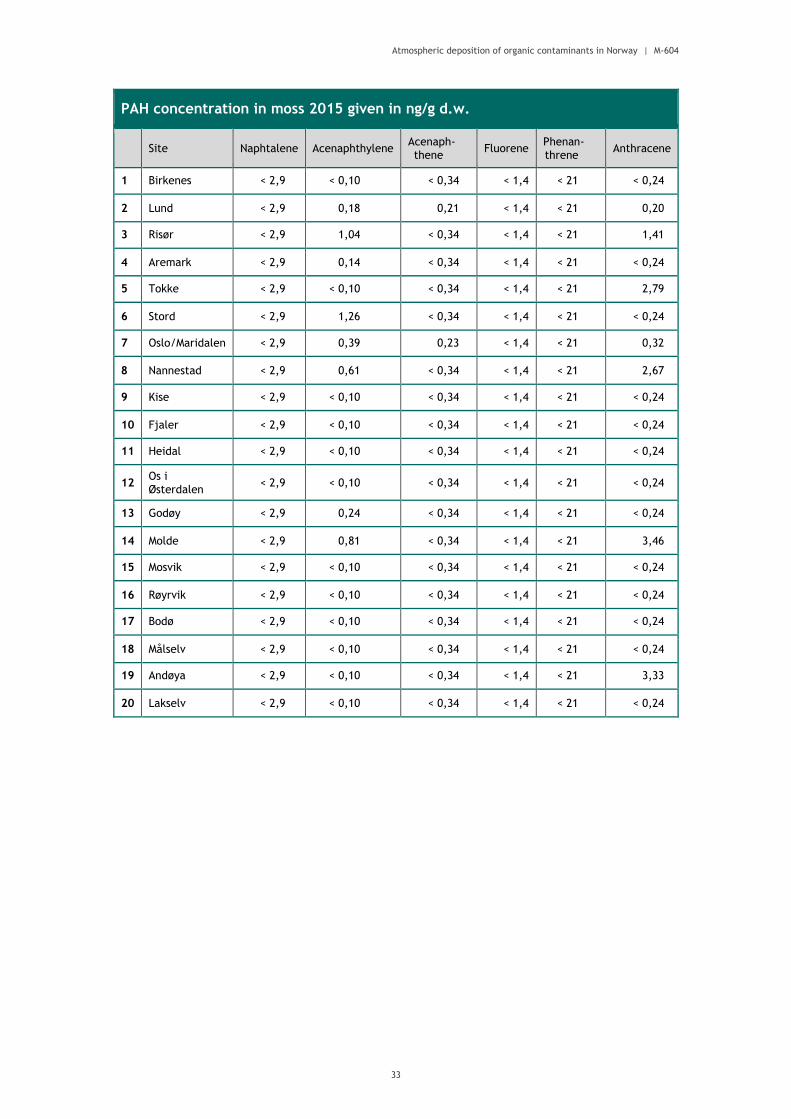
33
PAH concentration in moss 2015 given in ng/g d.w.
Site Naphtalene Acenaphthylene Acenaph-
thene Fluorene
Phenan-
threne Anthracene
1 Birkenes < 2,9 < 0,10 < 0,34 < 1,4 < 21 < 0,24
2 Lund < 2,9 0,18 0,21 < 1,4 < 21 0,20
3 Risør < 2,9 1,04 < 0,34 < 1,4 < 21 1,41
4 Aremark < 2,9 0,14 < 0,34 < 1,4 < 21 < 0,24
5 Tokke < 2,9 < 0,10 < 0,34 < 1,4 < 21 2,79
6 Stord < 2,9 1,26 < 0,34 < 1,4 < 21 < 0,24
7 Oslo/Maridalen < 2,9 0,39 0,23 < 1,4 < 21 0,32
8 Nannestad < 2,9 0,61 < 0,34 < 1,4 < 21 2,67
9 Kise < 2,9 < 0,10 < 0,34 < 1,4 < 21 < 0,24
10 Fjaler < 2,9 < 0,10 < 0,34 < 1,4 < 21 < 0,24
11 Heidal < 2,9 < 0,10 < 0,34 < 1,4 < 21 < 0,24
12 Os i
Østerdalen < 2,9 < 0,10 < 0,34 < 1,4 < 21 < 0,24
13 Godøy < 2,9 0,24 < 0,34 < 1,4 < 21 < 0,24
14 Molde < 2,9 0,81 < 0,34 < 1,4 < 21 3,46
15 Mosvik < 2,9 < 0,10 < 0,34 < 1,4 < 21 < 0,24
16 Røyrvik < 2,9 < 0,10 < 0,34 < 1,4 < 21 < 0,24
17 Bodø < 2,9 < 0,10 < 0,34 < 1,4 < 21 < 0,24
18 Målselv < 2,9 < 0,10 < 0,34 < 1,4 < 21 < 0,24
19 Andøya < 2,9 < 0,10 < 0,34 < 1,4 < 21 3,33
20 Lakselv < 2,9 < 0,10 < 0,34 < 1,4 < 21 < 0,24

Atmospheric deposition of organic contaminants in Norway | M-604
34
PAH concentration in moss 2015 given in ng/g d.w.
Site Naphtalene Acenaphthylene Acenaph-
thene Fluorene
Phenan-
threne Anthracene
1 Birkenes < 2,9 < 0,10 < 0,34 < 1,4 < 21 < 0,24
2 Lund < 2,9 0,18 0,21 < 1,4 < 21 0,20
3 Risør < 2,9 1,04 < 0,34 < 1,4 < 21 1,41
4 Aremark < 2,9 0,14 < 0,34 < 1,4 < 21 < 0,24
5 Tokke < 2,9 < 0,10 < 0,34 < 1,4 < 21 2,79
6 Stord < 2,9 1,26 < 0,34 < 1,4 < 21 < 0,24
7 Oslo/Maridalen < 2,9 0,39 0,23 < 1,4 < 21 0,32
8 Nannestad < 2,9 0,61 < 0,34 < 1,4 < 21 2,67
9 Kise < 2,9 < 0,10 < 0,34 < 1,4 < 21 < 0,24
10 Fjaler < 2,9 < 0,10 < 0,34 < 1,4 < 21 < 0,24
11 Heidal < 2,9 < 0,10 < 0,34 < 1,4 < 21 < 0,24
12 Os i
Østerdalen < 2,9 < 0,10 < 0,34 < 1,4 < 21 < 0,24
13 Godøy < 2,9 0,24 < 0,34 < 1,4 < 21 < 0,24
14 Molde < 2,9 0,81 < 0,34 < 1,4 < 21 3,46
15 Mosvik < 2,9 < 0,10 < 0,34 < 1,4 < 21 < 0,24
16 Røyrvik < 2,9 < 0,10 < 0,34 < 1,4 < 21 < 0,24
17 Bodø < 2,9 < 0,10 < 0,34 < 1,4 < 21 < 0,24
18 Målselv < 2,9 < 0,10 < 0,34 < 1,4 < 21 < 0,24
19 Andøya < 2,9 < 0,10 < 0,34 < 1,4 < 21 3,33
20 Lakselv < 2,9 < 0,10 < 0,34 < 1,4 < 21 < 0,24
Atmospheric deposition of organic contaminants in Norway | M-604
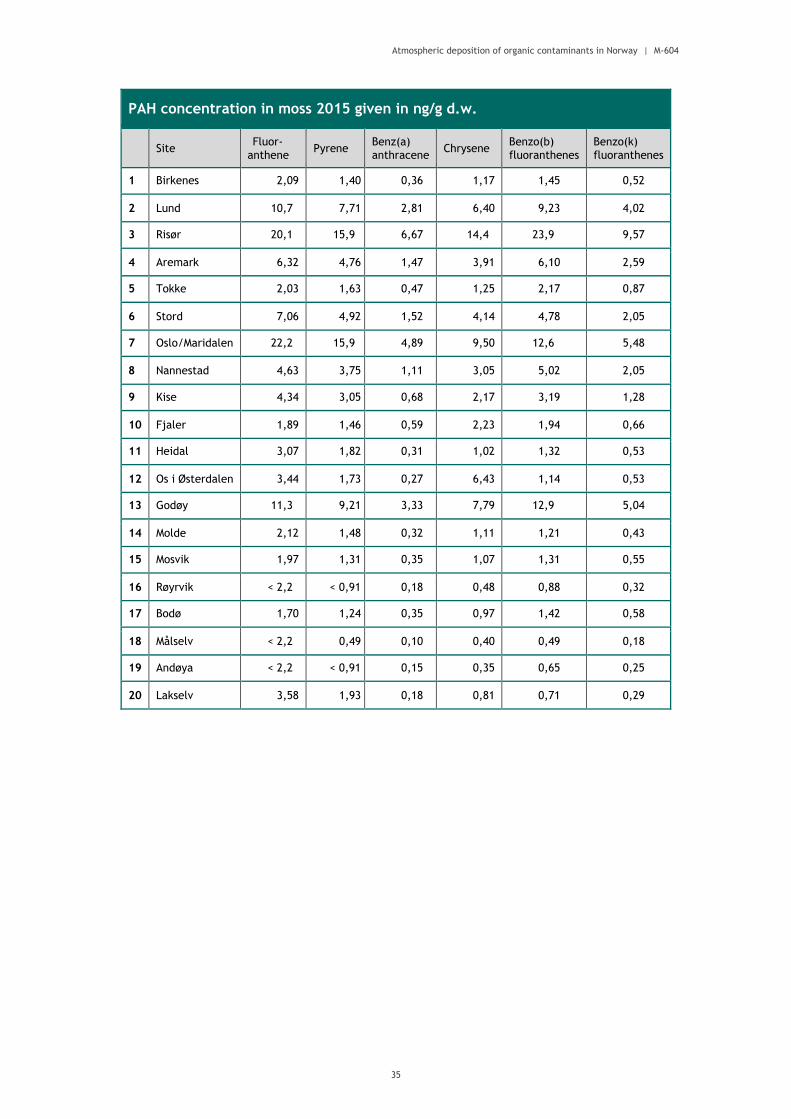
35
PAH concentration in moss 2015 given in ng/g d.w.
Site Fluor-
anthene Pyrene
Benz(a)
anthracene Chrysene
Benzo(b)
fluoranthenes
Benzo(k)
fluoranthenes
1 Birkenes 2,09 1,40 0,36 1,17 1,45 0,52
2 Lund 10,7 7,71 2,81 6,40 9,23 4,02
3 Risør 20,1 15,9 6,67 14,4 23,9 9,57
4 Aremark 6,32 4,76 1,47 3,91 6,10 2,59
5 Tokke 2,03 1,63 0,47 1,25 2,17 0,87
6 Stord 7,06 4,92 1,52 4,14 4,78 2,05
7 Oslo/Maridalen 22,2 15,9 4,89 9,50 12,6 5,48
8 Nannestad 4,63 3,75 1,11 3,05 5,02 2,05
9 Kise 4,34 3,05 0,68 2,17 3,19 1,28
10 Fjaler 1,89 1,46 0,59 2,23 1,94 0,66
11 Heidal 3,07 1,82 0,31 1,02 1,32 0,53
12 Os i Østerdalen 3,44 1,73 0,27 6,43 1,14 0,53
13 Godøy 11,3 9,21 3,33 7,79 12,9 5,04
14 Molde 2,12 1,48 0,32 1,11 1,21 0,43
15 Mosvik 1,97 1,31 0,35 1,07 1,31 0,55
16 Røyrvik < 2,2 < 0,91 0,18 0,48 0,88 0,32
17 Bodø 1,70 1,24 0,35 0,97 1,42 0,58
18 Målselv < 2,2 0,49 0,10 0,40 0,49 0,18
19 Andøya < 2,2 < 0,91 0,15 0,35 0,65 0,25
20 Lakselv 3,58 1,93 0,18 0,81 0,71 0,29

Atmospheric deposition of organic contaminants in Norway | M-604
36
PAH concentration in moss 2015 given in ng/g d.w.
Site Benzo(a)pyrene Indeno(1,2,3-cd)pyrene Dibenzo(ah)anthracene Benzo(ghi)perylene
1 Birkenes 0,68 0,85 0,13 1,12
2 Lund 5,40 6,84 1,18 6,87
3 Risør 10,8 19,9 2,69 18,8
4 Aremark 3,01 4,64 0,59 4,65
5 Tokke 1,11 1,53 0,16 1,70
6 Stord 2,79 3,31 0,58 3,90
7 Oslo/Maridalen 7,02 9,25 1,60 11,3
8 Nannestad 2,35 3,90 0,41 4,28
9 Kise 1,50 2,25 0,25 2,59
10 Fjaler 0,91 1,38 0,25 1,55
11 Heidal 0,72 0,90 0,09 1,41
12 Os i Østerdalen 0,47 0,55 0,05 0,62
13 Godøy 5,78 9,75 1,71 9,89
14 Molde 0,58 0,76 < 0,03 1,30
15 Mosvik 0,72 0,86 0,08 1,08
16 Røyrvik 0,48 0,62 0,07 0,64
17 Bodø 0,75 0,98 0,09 1,29
18 Målselv 0,20 0,30 < 0,03 0,46
19 Andøya 0,30 0,45 0,05 0,58
20 Lakselv 0,40 0,39 0,04 0,48

Atmospheric deposition of organic contaminants in Norway | M-604
37
Limit of Detection (LoD) in moss for compounds not listed above LoD given in pg/g d.w.
PFBS PFHxS PFOS PFOA PFNA PFDcA PFUnA PFDoA PFTrA DBDPE SCCP MCCP
12 12 40 50 50 50 50 50 50 20 60 20
The Norwegian Environment Agency is working for
a clean and diverse environment. Our primary
tasks are to reduce greenhouse gas emissions,
manage Norwegian nature, and prevent pollution.
We are a government agency under the Ministry
of Climate and Environment and have 700
employees at our two offices in Trondheim and
Oslo and at the Norwegian Nature Inspectorate’s
more than sixty local offices.
We implement and give advice on the
development of climate and environmental
policy. We are professionally independent. This
means that we act independently in the individual
cases that we decide and when we communicate
knowledge and information or give advice.
Our principal functions include collating and
communicating environmental information,
exercising regulatory authority, supervising and
guiding regional and local government level,
giving professional and technical advice, and
participating in international environmental
activities.
Norwegian Environment Agency
Telephone: +47 73 58 05 00 | Fax: +47 73 58 05 01
E-mail: [email protected]
Web: www.environmentagency.no
Postal address: Postboks 5672 Sluppen, N-7485 Trondheim
Visiting address Trondheim: Brattørkaia 15, 7010 Trondheim
Visiting address Oslo: Grensesvingen 7, 0661 Oslo