ator - apps.dtic.mil · ator .!\fajual technical ft i ior contract f49620487-c-i period i...
TRANSCRIPT
.!\faJUAL TECHNICAL Ft I IOR CONTRACT F49620487-C-iator Period I Siepterubei 1987 to 31 August 1988
riPu ARCJET TI4PUST CHAMBER FLOW DYNAMICS
Prepared for:
DEPARTMENT OF THE AIR FORCEAIR FORCE OFFICE OF SCIENTIFIC RESEARCHBOLLING AFB, DC 20332-6448
Prepared by:
RDA/WRL Staff
P &D ASSOCIAT[S
301 A SOUTH WEST STREET, ALEXANDRIA, VIRGINIA 22314 * (0)84O3
b~a
4 see ~1~AUWFSU

SEICuRITY U SSIF'CATION OF r! ITACE
i I O~nnApproved
REPORT DOCUMENTOTION'PAGE lom No 0709-,
1 1*. REPORT SECURITY CLASSiFiSATION Ib RESTRICTIVE MARKINGS
unclassified
Ia. SECURITY CLASSIFICATION AUTHORITY 3. DISTRIBUTION/AVAILABILITY OF REPORT
2lb. OECLASSIFICArIO'NIOWNGRAOING SCHEDULE approved for public release,
distribution is unlimited
A. PERFORMING ORGANIZATION REPORT NUMBER(S) S. MONITORING ORGANIZATION REPORT NUMBER(S)
AFO R.TH 8 88- 1 18 3,44. NAME OF PERFORMING ORGANIZATION 6b. OFFICE SYMBOL 7a. NAME OF MONITORING ORGANIZATION1 (f apiabl)R & D Associates, Inc. RDA/WRL AFOSR/NA
k. ADDRESS (Cty, Stat., and ZIPCOd*) 7b. ADDRESS (City, State, W ZIP CodQ)
301A S. West St. Building 410, Bolling AFB, DC
Alexandria, VA 22314 20332-6448
I S1. NAME OF FUNDING /SPONSORING Sb. OFFICE SYMBOL 9. PROCUREMENT INSTRUMENT IDENTIFICATION NUMBERORGANIZATION (if aplicab
-AFOSR/NA F49620-86-C-0117Ide ADDRESS (City, State, and ZIP Code) 10. SOURCE OF FUNDING NUMBERS
Building 410, Bolling AFB, DC PROGRAM PROJECT TASK WORK UNITELEMENT NO. NO. NO 001AB CCESSION NO.
20332-6448 61102F 2308 OPT. I
11. TITLE (Include Securty Clamficafo)
(U) MPD Thrust Chamber Flow Dynamics
12. PERSONAL AUTHOR(S)
13. TYPE OF REPORT 13b. TIME COVERED 30SEP 8 14. DATE OF REPORT (Year, Morh. Day) IS. PAGE COUNT.94Ke_ FROM 1 OCT87 TO 3SP 8 8029-988-09-29' - 29
015. SUPPLEMENTARY NC
17. COSAn CODES iS. SUBJECT TERMS (Contnwe on revee if necemry and idenetf by block number)FIELD GROUP S-GROUP - Electric propulsion, magnetoplasmadynamic, cje
19. ABSTRAW,(C 'ur, on reverse if necefary and ienify by block number)
Magnetoplasmadynamic (MPD) arcjet thrusters inherently involve close coupling of
the electromagnetic discharge structure and the flow field in the thrust chamber. Thedischarge and internal flow field structures are not simply determined by the arcjetgeometry, but depend on the values and partitioning of injected mass flow for each
operating current condition. In order to understand the internal flow dynamics of an
MPD arcjet, experiments are performed in which electromagnetic fields and flowproperties are measured within the thrust chamber. Electric and magnetic field probesare used to obtain-the electromagnetic structure, while spectroscopic techniques areI used to estimate particle velocities and densities. _2
Results from the past year's effort include measurements of Doppler widths in argonand hydrogen as functions of position in the thruster for two arrangements of mass
j injection: 100% at backplate mid-radius and 50-50% at backplate mid-radius and cathode
base. Reduced data suggest that a substantial radial component of flow exists in the
20. DISTRIBUTION I AVAILAILITY OF ABSTRACT 2t. ABSTRACT SECURITY CLASSIFICATIONEO UNCLASSIFIEOUNLI1MITEO (2 SAME AS RPT WTIC USERS Unclassified
22a. N4AME OF RESPONSIBLE INDIVIDUAL 22b. TELEPHQ4F(/n0qdr aee Code) 22C. OFFICE .SYMBOL
1r Mitat Birkan (202) 767-49,i AFOSR/NA
DO Form 1473. JUN 16 Previous editions are obsolete. SECURITY CLASSIFICATION OF THIS PAGEUNCLASSIFIED
I
l RDA-TR-144200-002 SEPTEMBER 1988
III
ANNUAL TECHNICAL REPORT
For period 1 October 1987 to 30 September 1988
I MPD THRUST CHAMBER FLOW DYNAMICS
IPrepared for:
DEPARTMENT OF THE AIR FORCEAIR FORCE OFFICE OF SCIENTIFIC RESEARCHBOLLING AIR FORCE BASE, DC 20332-6448
Prepared by:
RDA/WRL Staff
II DTIC
I . . . .:i H ui I I II II
RDA-TR-144200-002 SEPTEMBER 1988
I TABLE OF CONTENTS
* PAGE
LIST OF ILLUSTRATIONS iiII. SUMMARY 1
II. INTRODUCTION 2
III. PROGRESS 3IIV. CONCLUDING REMARKS 21
I V. REFERENCES 22
IAocession ForNcTIS TGR A&I -I NTIS TAB
Unannounced []3 Justification
ByDi st ribut ion/I Availability Codes
jAvai~l and/orDist jSpecial
IIIII
RDA-TR-144200-002 SEPTEMBER 1988
LIST OF ILLUSTRATIONS
* FIGURE PAGE
1. Schematic of new MPD arcjet for study of MPD thrust 4chamber flow dynamics. Gas injection is through 16choked orifices at mid-radius in boron nitride backplate.I
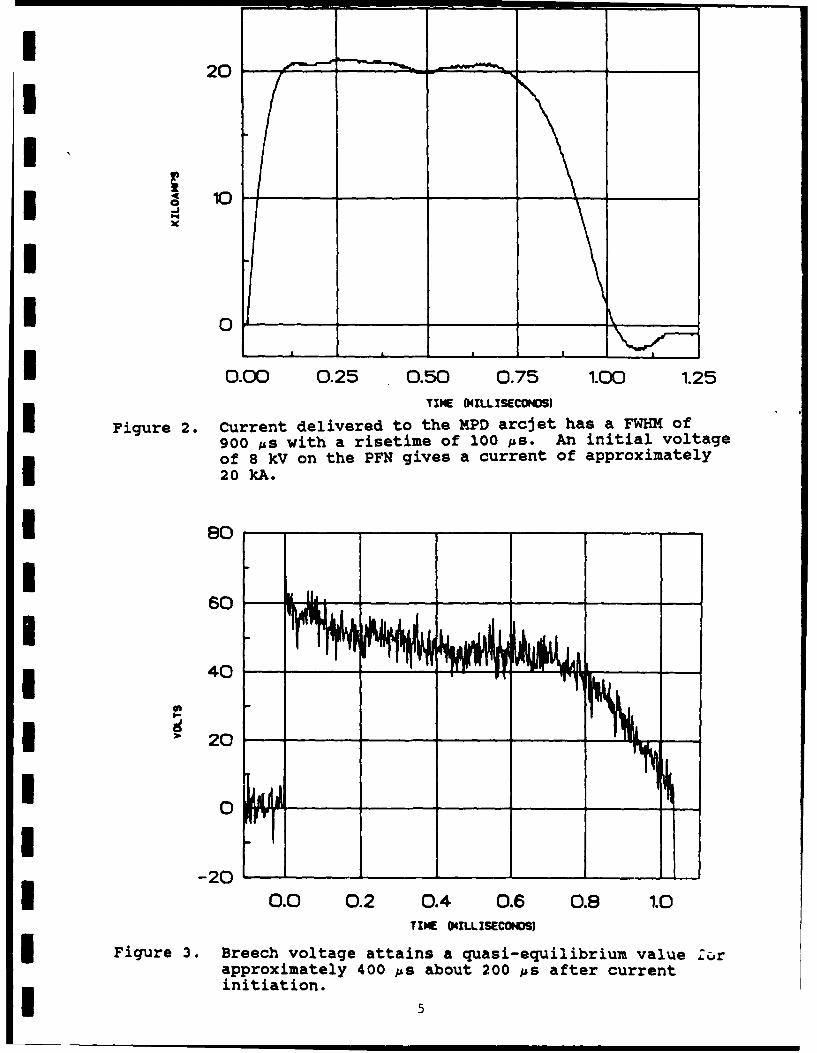
2. Current delivered to the MPD arcjet has a FWHM of 5900 ps with a risetime of 100 ps. An initial voltage of8 kV on the PFN gives a current of approximately 20 kA.
3. Breech voltage attains a quasi-equilibrium value for 5approximately 400 ps about 200 ps after currentinitiation.I
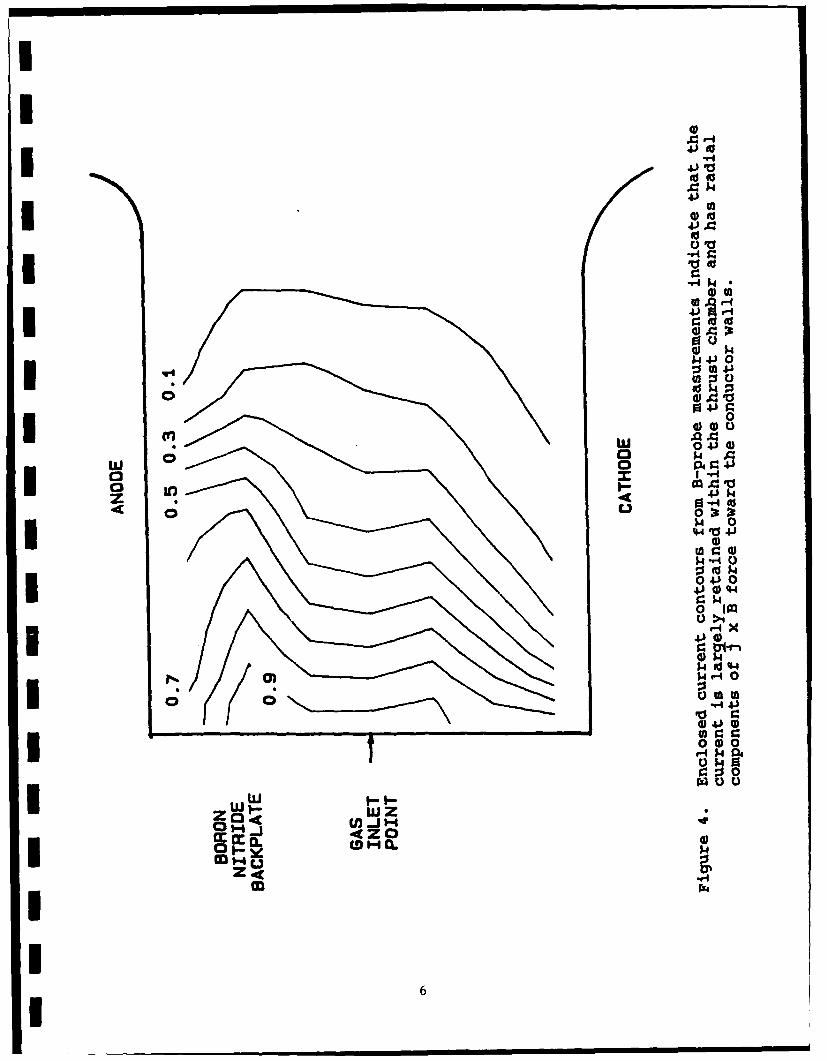
4. Enclosed current contours from B-probe measurements 6indicate that the current is largely retained withinthe thrust chamber and has radial components ofj x B force toward the conductor walls.
I 5. Schematic of MPD arcjet facility showing optical 8layout for the time-and spatially-resolved digitalspectroscopic system.
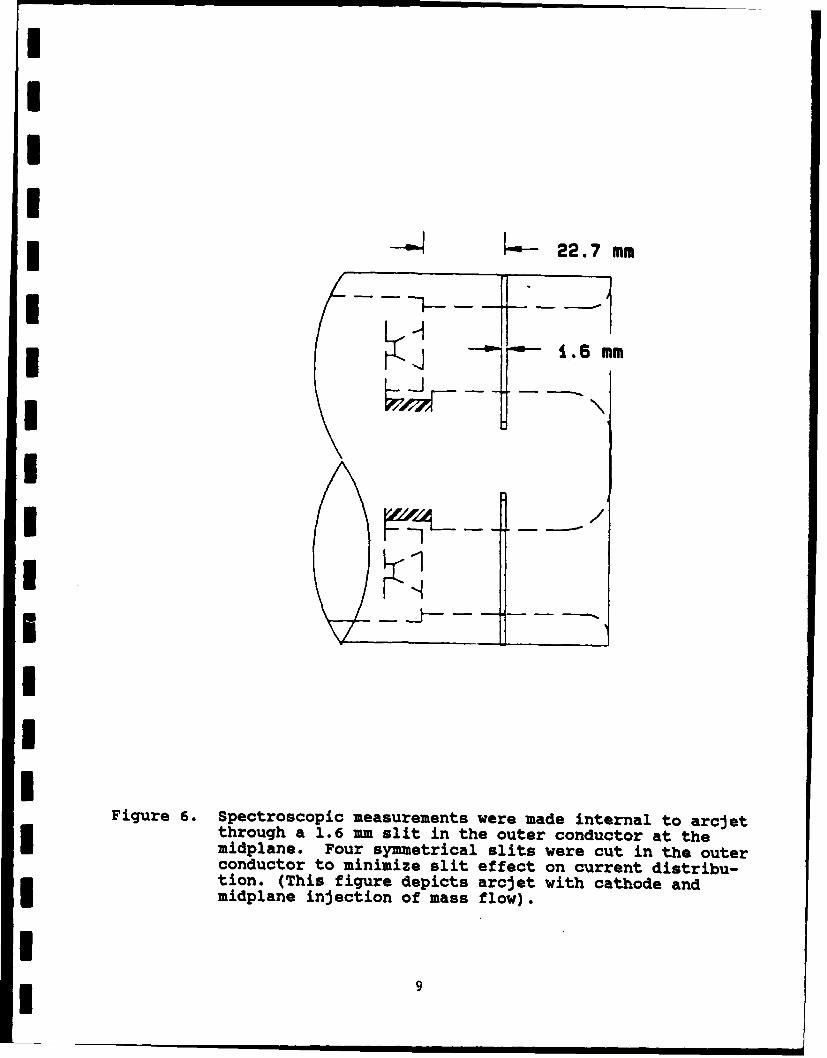
6. Spectroscopic measurements were made internal to 9arcjet through a 1.6 mm slit in the outer conductorat the midplane. Four symmetrical slits were cutin the outer conductor to minimize slit effect oncurrent distribution. (This figure depicts arcjetwith cathode and midplane injection of mass flow).
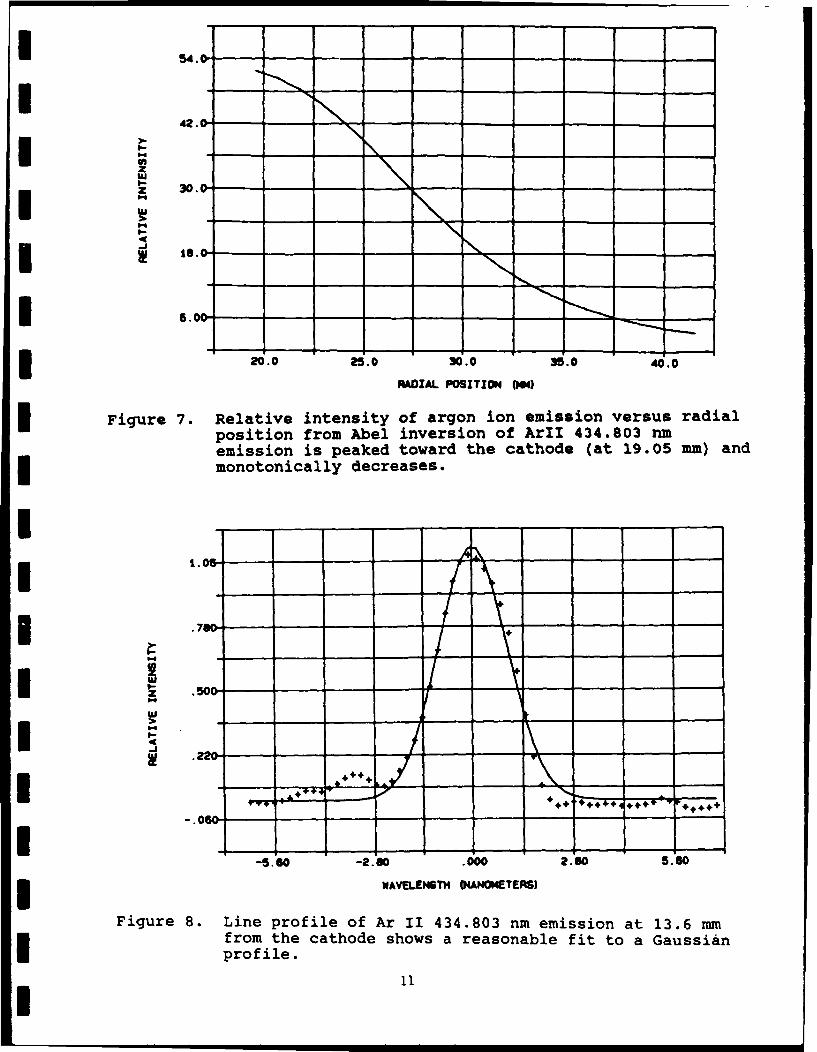
3 7. Relative intensity of argon ion emission versus radial 11position from Abel inversion of ArII 434.803 nm emissionis peaked toward the cathode (at 19.05 mm) andmonotonically decreases.
8. Line profile of ArII 434.803 nm emission at 13.6 mm 11from the cathode shows a reasonable fit to a Gaussianprofile.
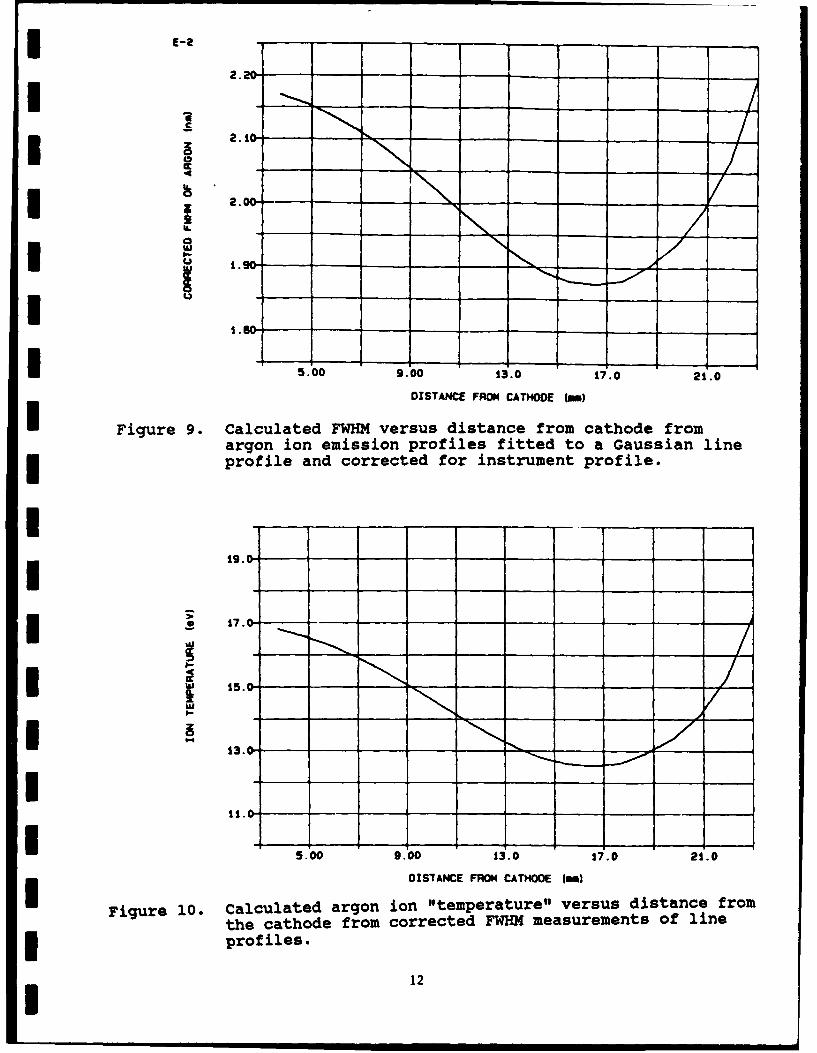
9. Calculated FWHM versus distance from cathode from argon 12ion emission profiles fitted to a Gaussian line profile3 and corrected for instrument profile.
I
RDA-TR-144200-002 SEPTEMBER 1988
10. Calculated argon ion "temperature" versus distance from 12the cathode from corrected FWHM measurements of lineprofiles.
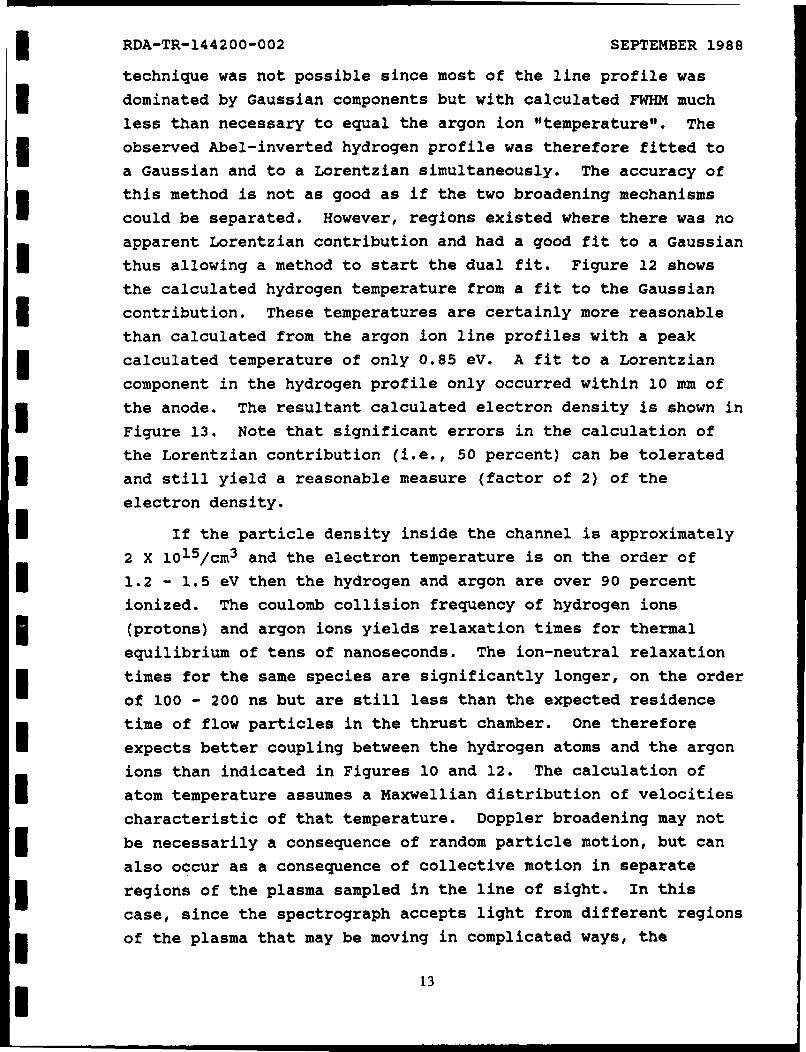
11. Relative intensity of hydrogen emission versus distance 14from the cathode from Abel inversion of H. 696.28 nmemission.I
12. Calculated hydrogen temperature versus distance from 14the cathode from Gaussian component of line profile fitto hydrogen 696.28 nm emission.
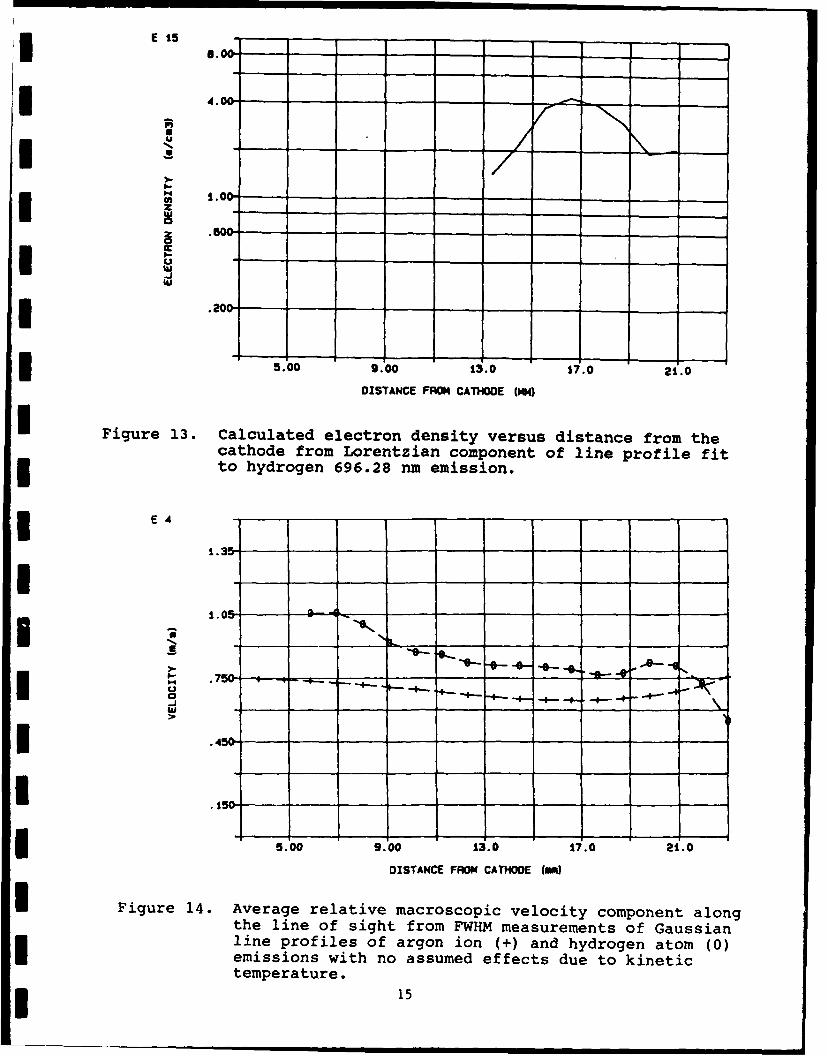
13. Calculated electron density versus distance from the 15cathode from Lorentzian component of line profile fit tohydrogen 696.28 nm emission.
14. Average relative macroscopic velocity component along 15the line of sight from FWHM measurements of Gaussian lineprofiles of argon ion (+) and hydrogen atom (0) emissionswith no assumed effects due to kinetic temperature.
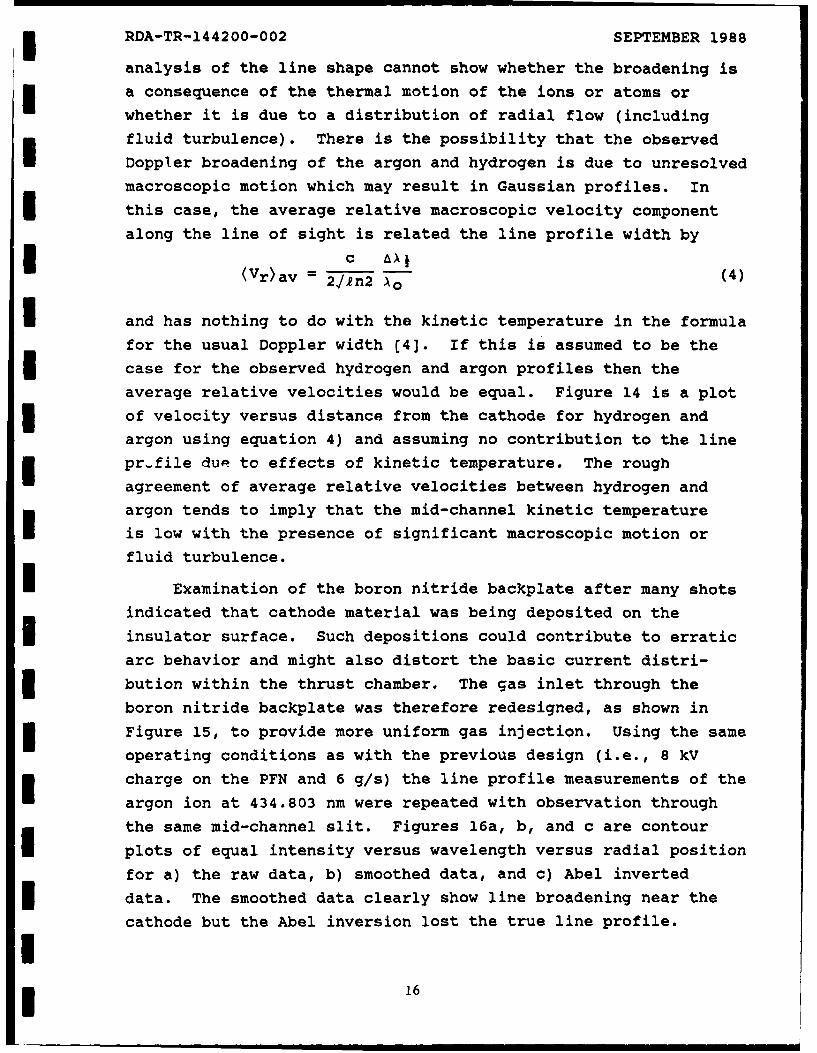
I 15. Redesign of gas feed for MPD arcjet with gas injection 17from 16 nozzles at mid-radius through backplate and equalgas injection from a channel at cathode-insulatorinterface region.
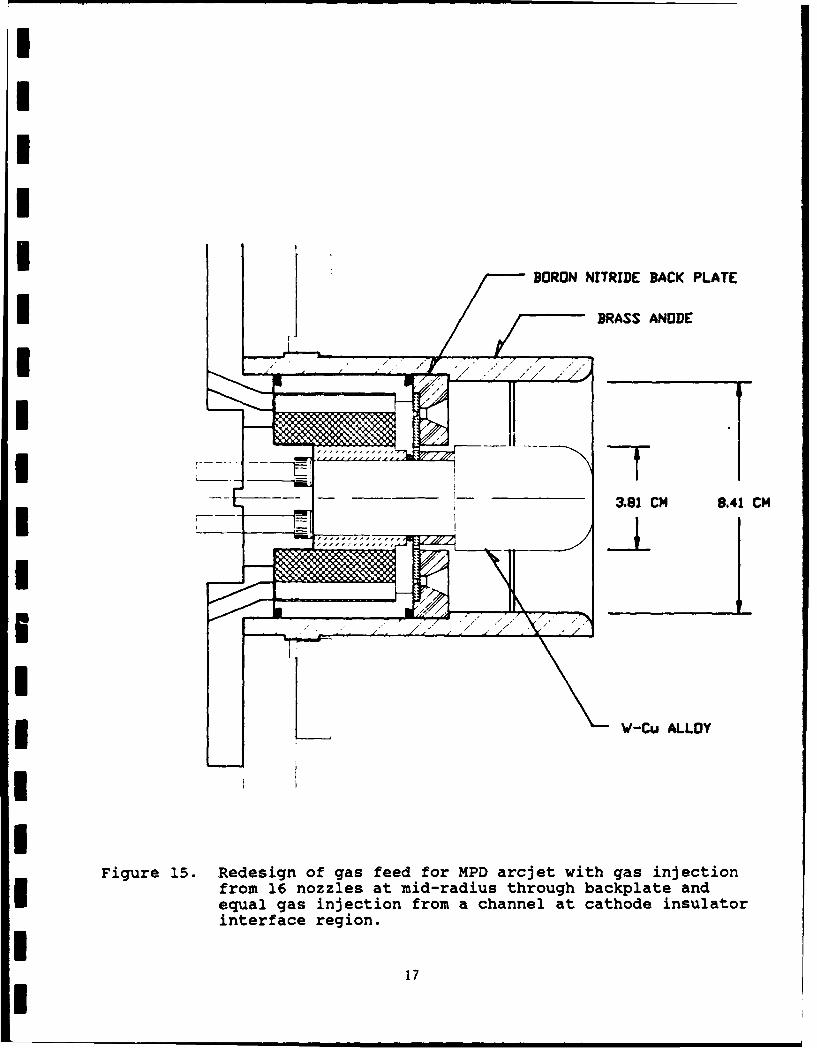
16. Equal intensity contour maps of ArII 434.803 nm emission 18observed through slit in outer conductor. The cathodesurface is on the left, the anode surface on the right,with 2.17 mm/div horizontal and 0.004434 nm/div vertical.Figure a) raw data, b) smoothed data (note that peakintensity is between 10.8 - 15.2 mm from the cathode),
i c) Abel inverted data.
17. Relative intensity versus distance from the cathode from 20Abel inverted ArII 434.803 nm emission with new gas inletgeometry.
I 18. Calculated ion temperature versus distance from cathode 20from Gaussian fit to Abel inverted line profile of ArII434.803 nm emission. The dashed line at 0.3 eV representsminimum detectable temperature.
UII iii
RDA-TR-144200-002 SEPTEMBER 1988
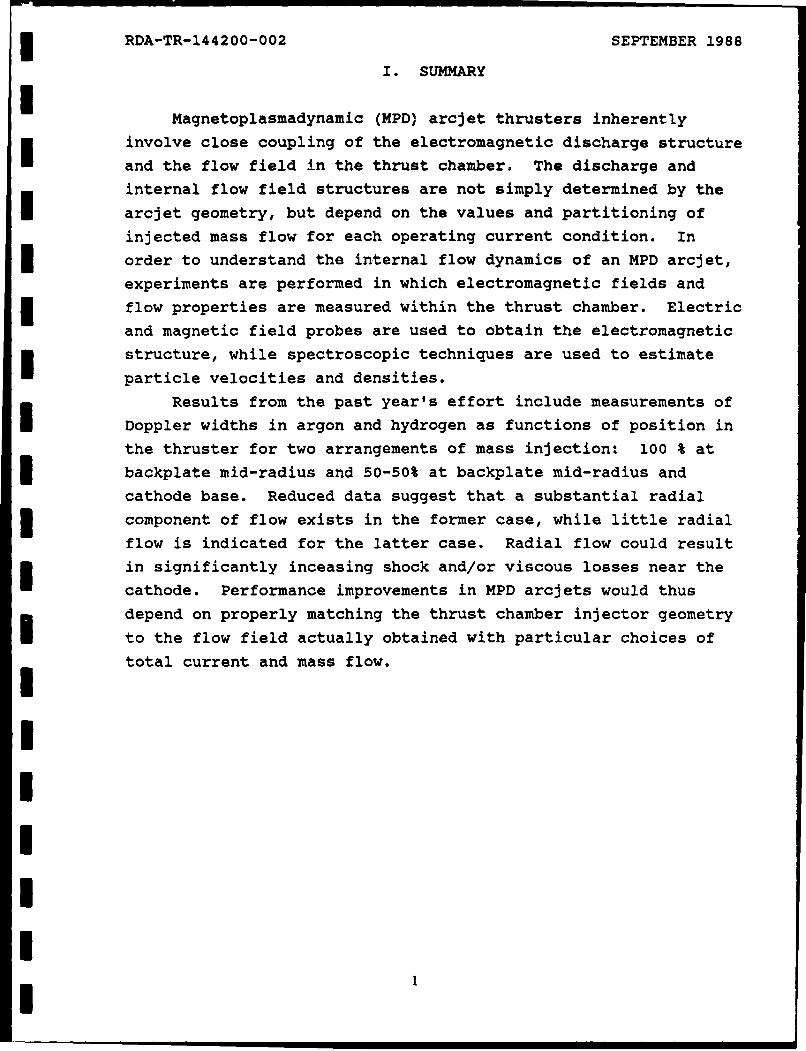
I. SUMMARY
I Magnetoplasmadynamic (MPD) arcjet thrusters inherently
involve close coupling of the electromagnetic discharge structure
and the flow field in the thrust chamber. The discharge and
internal flow field structures are not simply determined by the
arcjet geometry, but depend on the values and partitioning of
injected mass flow for each operating current condition. In
order to understand the internal flow dynamics of an MPD arcjet,
experiments are performed in which electromagnetic fields and
flow properties are measured within the thrust chamber. Electric
and magnetic field probes are used to obtain the electromagnetic
structure, while spectroscopic techniques are used to estimate
particle velocities and densities.
Results from the past year's effort include measurements of
Doppler widths in argon and hydrogen as functions of position in
the thruster for two arrangements of mass injection: 100 % at
backplate mid-radius and 50-50% at backplate mid-radius and
cathode base. Reduced data suggest that a substantial radial
3 component of flow exists in the former case, while little radial
flow is indicated for the latter case. Radial flow could result
in significantly inceasing shock and/or viscous losses near the
cathode. Performance improvements in MPD arcjets would thus
depend on properly matching the thrust chamber injector geometry
to the flow field actually obtained with particular choices of
total current and mass flow.IIIIII
IIII1
RDA-TR-144200-002 SEPTEMBER 1988
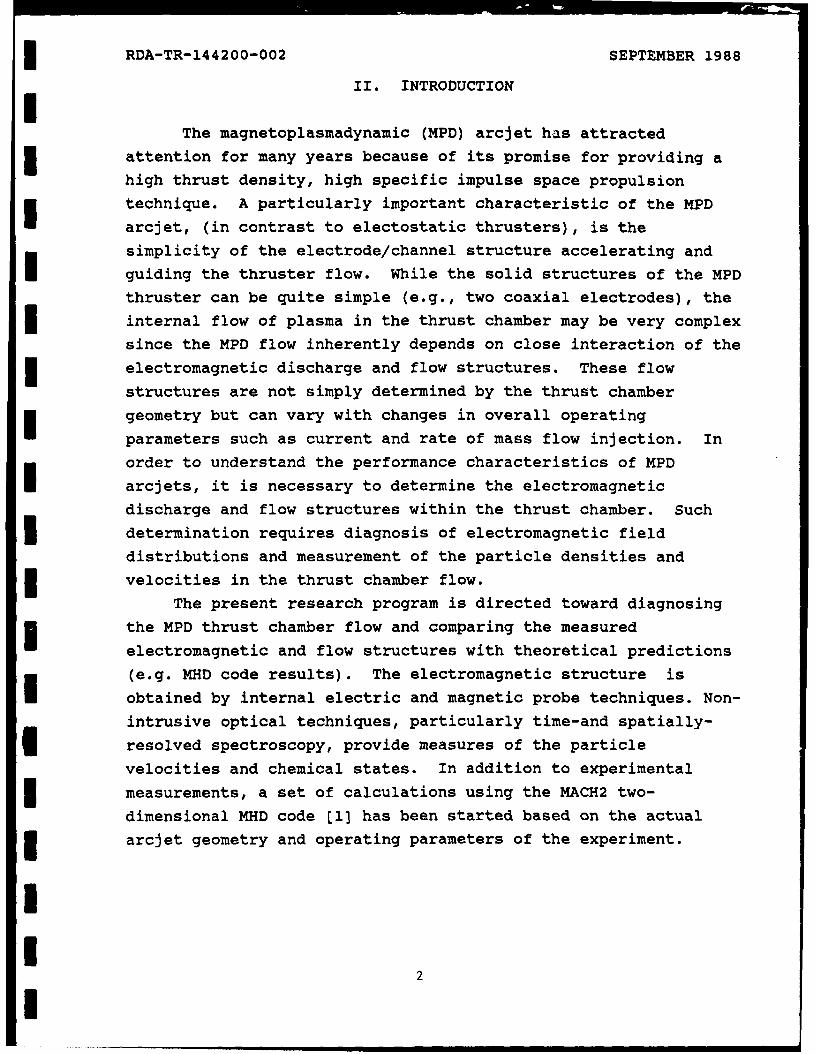
II. INTRODUCTIONIThe magnetoplasmadynamic (MPD) arcjet has attracted
attention for many years because of its promise for providing a
high thrust density, high specific impulse space propulsion
technique. A particularly important characteristic of the MPD
arcjet, (in contrast to electostatic thrusters), is the
simplicity of the electrode/channel structure accelerating and
guiding the thruster flow. While the solid structures of the MPD
thruster can be quite simple (e.g., two coaxial electrodes), the
internal flow of plasma in the thrust chamber may be very complex
since the MPD flow inherently depends on close interaction of the
electromagnetic discharge and flow structures. These flow
structures are not simply determined by the thrust chamber
geometry but can vary with changes in overall operating
parameters such as current and rate of mass flow injection. In
order to understand the performance characteristics of MPD
arcjets, it is necessary to determine the electromagnetic
discharge and flow structures within the thrust chamber. Such
3 determination requires diagnosis of electromagnetic field
distributions and measurement of the particle densities and
* velocities in the thrust chamber flow.
The present research program is directed toward diagnosing
the MPD thrust chamber flow and comparing the measured
electromagnetic and flow structures with theoretical predictions
(e.g. MHD code results). The electromagnetic structure is
obtained by internal electric and magnetic probe techniques. Non-
intrusive optical techniques, particularly time-and spatially-
resolved spectroscopy, provide measures of the particle
velocities and chemical states. In addition to experimental
measurements, a set of calculations using the MACH2 two-
dimensional MHD code [1 has been started based on the actual
arcjet geometry and operating parameters of the experiment.
I
II
RDA-TR-144200-002 SEPTEMBER 1988
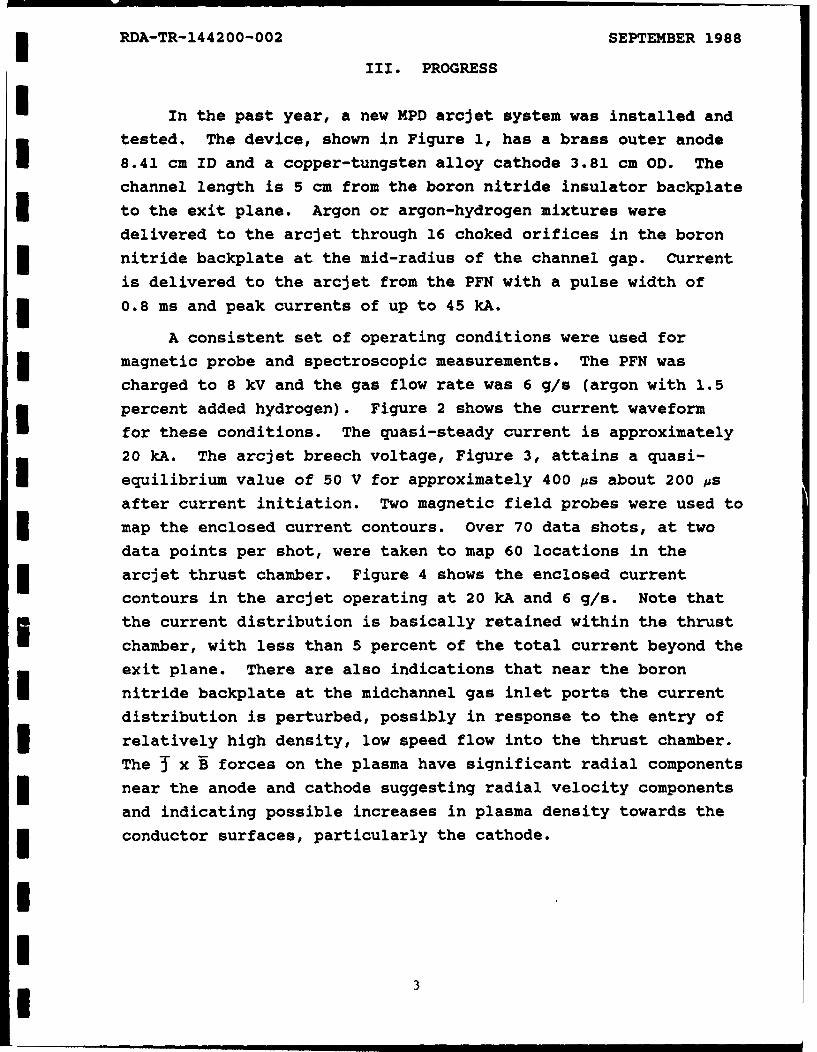
III. PROGRESS
I In the past year, a new MPD arcJet system was installed and
tested. The device, shown in Figure 1, has a brass outer anode
8.41 cm ID and a copper-tungsten alloy cathode 3.81 cm OD. The
channel length is 5 cm from the boron nitride insulator backplate
to the exit plane. Argon or argon-hydrogen mixtures were
delivered to the arcjet through 16 choked orifices in the boron
nitride backplate at the mid-radius of the channel gap. Current
is delivered to the arcjet from the PFN with a pulse width of
0.8 ms and peak currents of up to 45 kA.
A consistent set of operating conditions were used for
magnetic probe and spectroscopic measurements. The PFN was
charged to 8 kV and the gas flow rate was 6 g/s (argon with 1.5
percent added hydrogen). Figure 2 shows the current waveform
for these conditions. The quasi-steady current is approximately
20 kA. The arcjet breech voltage, Figure 3, attains a quasi-
equilibrium value of 50 V for approximately 400 ps about 200 ps
after current initiation. Two magnetic field probes were used to
map the enclosed current contours. Over 70 data shots, at two
data points per shot, were taken to map 60 locations in the
arcjet thrust chamber. Figure 4 shows the enclosed current
contours in the arcjet operating at 20 kA and 6 g/s. Note that
the current distribution is basically retained within the thrust
chamber, with less than 5 percent of the total current beyond the
exit plane. There are also indications that near the boron
nitride backplate at the midchannel gas inlet ports the current
distribution is perturbed, possibly in response to the entry of
relatively high density, low speed flow into the thrust chamber.
The I x B forces on the plasma have significant radial components
near the anode and cathode suggesting radial velocity components
and indicating possible increases in plasma density towards the
conductor surfaces, particularly the cathode.
I!3

IIII
I DON NITRIDE PACM PLATE
i/-- BRASS ANODE
I 3.91 CN &,41 CH
I Figure 1. Schematic of new MPD arcjet for study of MPD thrust
chamber flow dynamics. Gas injection is through 16
choked orifices at mid-radius in boron nitridebackplate.
I4 _i
i~ ~
iI
I __,____it ! 4
20I
II,
IoI 0[II
0.00 0.25 0.50 0.75 1.00 1.25TIME (MILLXSECONDS)
Figure 2. Current delivered to the MPD arcJet has a FWHM of900 As with a risetime of 100 As. An initial voltageof 8 kV on the PFN gives a current of approximately
20 .
I
I ___ _ _,_,_ __ ,__
60I
-20 0.0 0.2 0.4 0.6 0.8 1.0
TI0E IL IECONDS)
Figure 3. Breech voltage attains a quasi-equilibrium value 2orapproximately 400 As about 200 As after currentinitiation.
4-ua
4.)
0g
10 $4
04V
0woo
au 043 0o $.4 .0
In V -
I 0
04)
I0 V 0
0 im
0 4
14r-4 0
9 .- 1
I 000-4
:3 U0
0 0-
ot40 " _ZOJMMCL W.4
6

RDA-TR-144200-002 SEPTEMBER 1988
A computer-controlled, time- and spatially-resolved spectro-
I graphic system, shown schematically in Figure 5, was used for iontemperature and electron density measurements. In order to make
measurements within the arcJet thrust chamber, a slit 1.6 mm wide
was machined in the outer conductor at a position 22.7 mm from
the boron nitride backplate that allowed observation between the
cathode and anode. To minimize the perturbing effects on the
current distribution by the slit a series of 4 identical slits
were made symmetrically in the outer conductor. These slits are
shown schematically in Figure 6. Time integrated line profile
measurements were made of the argon ion 434.803 nm line and the
696.28 nm line of hydrogen (He).
* If the velocity component of a radiating particle parallel
to the direction of observation is vs, then the wavelength
* appears to be shifted due to the Doppler effect by the amount
V6 AD SAO (1)
c
where Ao is the unshifted wavelength [2]. If the particle
velocities of a radiating system have an equilibrium thermal
distribution, then Doppler broadening results in a Gaussian line
shape and the observed intensity distribution is Gaussian shape
given byI ItI (A,) = exp L[AAj ] (2)
where AAD = c o; v = (2kT/p)i is the most probable velocity of
the particles, and It represents the total line intensity. The
full width at the half-maximum intensity point (FWHM) is given by
I A} = 2j-n2 AAD = 1.665 AAD
AAj/AO = 7.713 x 10⁻⁵ T (3)
where T is in eV and p is the reduced mass [2,3].
I The time intrgrated line profile of 434.803 nm argon ion
observed through the slit in the outer conductor was digitally
7I

co w -%0 1
0
*L 44I
0 0
l>
00.0I (4I
£ r40
U UN 0
W- Z .- 9u)
L)4 4I
1.- -4 W04
Ui ij Lai
z > ~44 ri
z 0-4
0
z 4
(:40I 4 -
*w 8
I-22. 7 m
thrug a1. m slt n heouer onucorammh
I /
UiIi
I,
I midplane. Four symmetrical slits were cut in the outerconductor to minimize slit effect on current distribu-tion. (This figure depicts arcjet with cathode and
midplane injection of mass flow).
I ;9
3 RDA-TR-144200-002 SEPTEMBER 1988
recorded with the spectrograph in second order ,jth the entrance
slit at 30 microns. The system resolution was 0.002216 nm/pixel
with a measured instrument profile that was Gaussian with a FWHM
of 0.01262 + 0.00045 nm. The digital data is intensity
integrated over the line of sight versus wavelength and versus
spatial position with spatial resolution of 267 microns. The raw
data was filtered versus wavelength with a low frequency bandpass
filter with frequency cutoff determined by the allowable spectral
frequencies from the instrument profile. The data was then
filtered spatially with a frequency cutoff of 0.35 cycles/mm.
The observed line profile was then Abel-inverted to yield local
radial line profiles. These line profiles were then fitted to a
Gaussian and the FWHM calculated. Figure 7 shows the relative
integrated intensity versus radial position from the Abel
inversion. Figure 8 shows the Gaussian fit at 13.6 mm from the
cathode with a FWHM of 0.02274 nm with an error of + 0.00066 nm.
Correction for instrument profile yields a FWHM of 0.0189 nm
which corresponds to an argon ion temperature of 12.7 eV +0.9 eV.
Figure 9 shows the resultant corrected FWHM versus distance from
* the cathode and Figure 10 indicates the inferred ion temperature
versus distance from the cathode. These inferred ion tempera-
3 tures are very high and are approximately 10 times the electron
temperature.
* Line profile measurements were also made of hydrogen
696.28 nm line. Hydrogen comprised 1.5 percent of the species
injected and at the operating conditions interior to the arcjet
the hydrogen is over 90 percent ionized. Thus, the observed
hydrogen line intensity was very low and required the sum of
30 shots to yield reasonable statistics. The raw data was
filtered and Abel-inverted in the same manner as the argon data.
Figure 11 shows the relative integrated intensity versus radial
position from the Abel inversion. The original objective was to
* use the measured argon ion temperature and assume that the
hydrogen was in thermal equilibrium, then deconvolve the hydrogen
profile using the calculated Doppler contribution. The decon-
volved profile would then be fitted to a Lorentzian profile to
yield electron density from Stark broadening calculations. The
10U
* ~~54.0- _ __-
I ~4 - _0-
0.02. 00 504.poito frmAe nesono M 4483I 16 _ - _
20 .0 25.0 .0.00.
I Figure 7. Relative intensity of argon ion emission versus radialposition from Abel inversion of ArIl 434.803 n
emission is peaked toward the cathode (at 19.05 mm) andmonotonically decreases.
I
1 .06- - -+ +++ -4+ v
-5.0 -2..0 . 2.8 5.0
Figure 8. Line profile of Ar 11 434.803 nm emission at 13.6 mI from the cathode shows a reasonable fit to a Gaussian
profile.
III I- _ I _I
I iE- _-
2.
I 2.10 - -, \ __
U* I, 2."- . ...- _
5.00 9.00 13.0 17.0 21.0
DISTANCE FFM CATHODE (m)
I Figure 9. Calculated FWHM versus distance from cathode fromargon ion emission profiles fitted to a Gaussian lineprofile and corrected for instrument profile.
19.w
S 17.0 -___
I 'U 15. 0
I 1.
11.
5.00 9,0 0 Ii.0 2i.0
i DISTANE FROM CATHODE (m)
Figure 10. Calculated argon ion "temperature" versus distance fromthe cathode from corrected FWHM measurements of lineprofiles.
12
RDA-TR-144200-002 SEPTEMBER 1988
technique was not possible since most of the line profile was
* dominated by Gaussian components but with calculated FWHMmuch
less than necessary to equal the argon ion "temperature". The
observed Abel-inverted hydrogen profile was therefore fitted to
a Gaussian and to a Lorentzian simultaneously. The accuracy of
this method is not as good as if the two broadening mechanisms
could be separated. However, regions existed where there was no
apparent Lorentzian contribution and had a good fit to a Gaussian
thus allowing a method to start the dual fit. Figure 12 shows
the calculated hydrogen temperature from a fit to the Gaussian
contribution. These temperatures are certainly more reasonable
than calculated from the argon ion line profiles with a peak
calculated temperature of only 0.85 eV. A fit to a Lorentzian
component in the hydrogen profile only occurred within 10 mm of
the anode. The resultant calculated electron density is shown in
Figure 13. Note that significant errors in the calculation of
the Lorentzian contribution (i.e., 50 percent) can be tolerated
and still yield a reasonable measure (factor of 2) of the
electron density.
If the particle density inside the channel is approximately
2 X 10¹⁵/cm3 and the electron temperature is on the order of
1.2 - 1.5 eV then the hydrogen and argon are over 90 percent
ionized. The coulomb collision frequency of hydrogen ions
(protons) and argon ions yields relaxation times for thermal
equilibrium of tens of nanoseconds. The ion-neutral relaxation
times for the same species are significantly longer, on the order
of 100 - 200 ns but are still less than the expected residence
time of flow particles in the thrust chamber. One therefore
expects better coupling between the hydrogen atoms and the argon
ions than indicated in Figures 10 and 12. The calculation of
atom temperature assumes a Maxwellian distribution of velocities
characteristic of that temperature. Doppler broadening may not
be necessarily a consequence of random particle motion, but can
also occur as a consequence of collective motion in separate
3 regions of the plasma sampled in the line of sight. In this
case, since the spectrograph accepts light from different regions
of the plasma that may be moving in complicated ways, the
13U
I 18/00'-I 1400
U.z__
i5.00 9.,o0 d3.0 17.0 21.0
i ODISTANCE FROM CATODE |
Figure 11. Relative intensity of hydrogen emission versus distancei from the cathode from Abel inversion of HQ 696.28 nm
emission.
lw
w
I ___ ____ _
i i\Iz
5.00 9.00 13.0 17.0 21.0DISTANCE FRON CATHODE (I)
Figure 12. Calculated hydrogen temperature versus distance from
the cathode from Gausslan component of line profile fit
to hydrogen 696.28 nm emission.
I __ _ _ __ __1
El15I 6.I0 -I I___ - - - -4-
4.00----,I S " ---
I-
I I _ _ oo_ - -3. . - -o
.200 - - -
I5.00 9.00 13.0 17.0 21.0DISTANCE FROM CATHOOE (MM)
I Figure 13. Calculated electron density versus distance from thecathode from Lorentzian component of line profile fitto hydrogen 696.28 nm emission.
I~ £4
I1. 05 __
IU.050
.150
5.00 9.00 13.0 17.0 21.0
DISTANCE FROM CATHOOE (M)
Figure 14. Average relative macroscopic velocity component alongthe line of sight from FWHM measurements of Gaussianline profiles of argon ion (+) and hydrogen atom (0)emissions with no assumed effects due to kinetictemperature.
15
R DA-TR-144200-002 SEPTEMBER 1988
analysis of the line shape cannot show whether the broadening is
a consequence of the thermal motion of the ions or atoms or
whether it is due to a distribution of radial flow (including
fluid turbulence). There is the possibility that the observed
Doppler broadening of the argon and hydrogen is due to unresolved
macroscopic motion which may result in Gaussian profiles. In
I this case, the average relative macroscopic velocity component
along the line of sight is related the line profile width by
Ic x
(4)
(Vr~av = 2_J.n2 Ao (4)
I and has nothing to do with the kinetic temperature in the formula
for the usual Doppler width (4]. If this is assumed to be the
* case for the observed hydrogen and argon profiles then the
average relative velocities would be equal. Figure 14 is a plot
I of velocity versus distance from the cathode for hydrogen and
argon using equation 4) and assuming no contribution to the line
pr.file dup to effects of kinetic temperature. The rough
agreement of average relative velocities between hydrogen and
argon tends to imply that the mid-channel kinetic temperature
is low with the presence of significant macroscopic motion or
fluid turbulence.
I Examination of the boron nitride backplate after many shots
indicated that cathode material was being deposited on the
I insulator surface. Such depositions could contribute to erratic
arc behavior and might also distort the basic current distri-
bution within the thrust chamber. The gas inlet through the
boron nitride backplate was therefore redesigned, as shown in
Figure 15, to provide more uniform gas injection. Using the same
operating conditions as with the previous design (i.e., 8 kV
charge on the PFN and 6 g/s) the line profile measurements of the
argon ion at 434.803 nm were repeated with observation through
the same mid-channel slit. Figures 16a, b, and c are contour
plots of equal intensity versus wavelength versus radial position
for a) the raw data, b) smoothed data, and c) Abel inverted
data. The smoothed data clearly show line broadening near the
cathode but the Abel inversion lost the true line profile.
1* 16l
IIII
I BORON NITRIDE BACK PLATE
IBRASS ANODEI ____ ____
I V.3.91 CM 8.41 CM
,
W-Cu ALLOY
I
IFigure 15. Redesign of gas feed for MPD arcjet with gas injection
from 16 nozzles at mid-radius through backplate andequal gas injection from a channel at cathode insulatorinterface region.
I17I
IAIQ
3 b)II
l !l
i
U>I -
Figure 16. Equal intensity contour maps of ArII 434.803 nm emissionI observed through slit in outer conductor. The cathode surface
is on the left, the anode surface on the right, with 2.17mm/div horizontal and 0.004434 nm/div vertical. Figure a) raw
I data, b) smoothed data (note that peak intensity is between10.8 - 15.2 mm from the cathode), c) Abel inverted data.
18
I aa
RDA-TR-144200-002 SEPTEMBER 1988
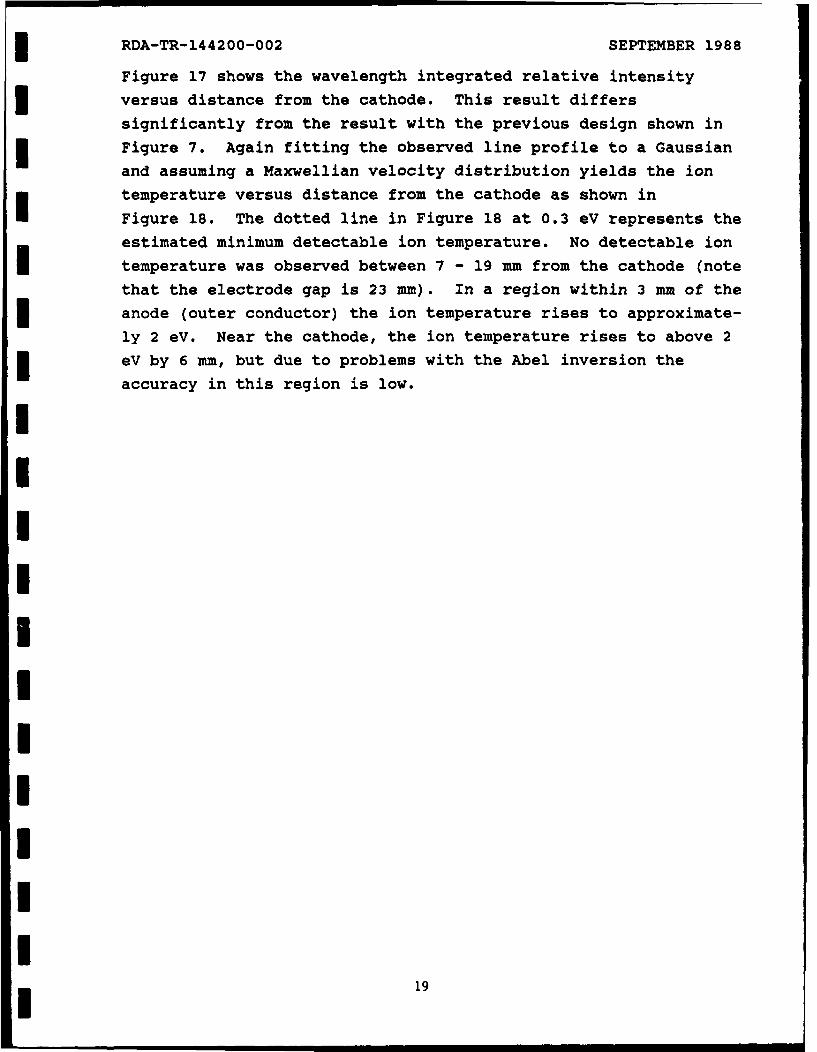
Figure 17 shows the wavelength integrated relative intensity
versus distance from the cathode. This result differs
significantly from the result with the previous design shown in
Figure 7. Again fitting the observed line profile to a Gaussian
and assuming a Maxwellian velocity distribution yields the ion
temperature versus distance from the cathode as shown in
Figure 18. The dotted line in Figure 18 at 0.3 eV represents the
estimated minimum detectable ion temperature. No detectable ion
temperature was observed between 7 - 19 mm from the cathode (note
that the electrode gap is 23 mm). In a region within 3 mm of the
anode (outer conductor) the ion temperature rises to approximate-
ly 2 eV. Near the cathode, the ion temperature rises to above 2
eV by 6 mm, but due to problems with the Abel inversion the
accuracy in this region is low.
IIIIIIIIIII
I I P 19
I -..350.I _ _
I 1~50.----_
3l 5.® _._ - o_,o_
5.00 9.00 13.0 17.0 21.0
DISTANCE FROM CATHODE f14)
Figure 17. Relative intensity versus distance from the cathode fromAbel inverted ArIl 434.803 nm emission with new gas inletgeometry.
I 2.0
2.20_S ,
3 -. 400~ J.+ +..4/ ++ + + + +
5.00 g.0 13.0 17.0 21.0
DISTANCE FFROM CATHODE (u)
Figure 18. Calculated ion temperature versus distance from cathodefrom Gaussian fit to Abel inverted line profile of ArII434.803 nm emission. The dashed line at 0.3 eV representsminimum detectable temperature.
* 20
3 RDA-TR-144200-002 SEPTEMBER 1988
IV. CONCLUDING REMARKS
I The experimental program to date has provided strong
indications that the flow within the MPD arcjet hamber can be
dramatically affected by the choice of inlet geometry. In
particular, it appears that introduction of mass flow near the
cathode base can offset the development of a strong radially-
inward flow. Such flow, as suggested by the linewidth
measurements in argon and hydrogen, would have important
consequences for thrust efficiency since shock and viscous losses
near the cathode surface would be expected. The present
measurements are comparisons at the same total current but with
an abrupt variation of mass flow distributions by changing the
geometry of the mass injection arrangement. It may be expected
that the relative strength of the radial (vs axial) flow can
change significantly as the total current and mass flow values
are varied with fixed injection geometry. Such change in flow
3 direction can substantially affect the MPD thruster performance
for reasons that cannot be inferred from simple scaling relation-
ships based on electromagnetic thrust and total mass flow.
Examination of MPD performance by variation of operating current
and mass flow rate, (i.e. external parameters) with a fixed
device geometry will thus be inaccurate for prediction of
potential limitations. Each set of external parameter choices
3 may require a particular arrangement of mass injection, electrode
geometry and length in order to achieve optimum performance.
3 Internal flow measurements and MACH2 calculations in the next
year should provide considerable insight for determining the best
3 combinations of thruster geometry and operating conditions.
III
! 21
I
3 RDA-TR-144200-002 SEPTEMBER 1988
V. REFERENCES
1 1. J. Buff, et. al., "Simulations of a plasma flowswitch", in IEEE Transactions on Plasma Science,December 1987, pp. 766-771.
2. W. L. Wiese, in Plasma DiaQnostic Techniques, eds.R. H. Huddlestone & S. L. Leonard, Academic Press, NewYork, 1965. Chapter 6, "Line Broadening", pp. 265-317.i3. G. Traving, in Plasma DiaQnostics, ed. W. Lochte-
Holtgreven, North-Holland publishing company.Amsterdam, 1968. Chapter 2, "Interpretaion of linebroadening and line shift", pp. 66-134.
4. H. R. Griem, Plasma Spectroscopy. McGraw-hill, NY,1964, Chapter 4, "Line-broadening calculations", pp.63-103.
IIIIIIIIIII
22I