attachment 2-11 srk consulting. rs33a – reactive...
TRANSCRIPT

Attachment 2-11
SRK Consulting. RS33A – Reactive Residues Progress Report – NorthMet
Project. May 2006.

Appendix D – Delivery Package 1A-2
RS33A – Reactive Residues
Progress Report,
NorthMet Project, Minnesota
Prepared for:
Polymet Mining Inc.#2350 – 1177 West Hastings Street
Vancouver, BCV6E 2K3
Prepared by:
Project Reference Number SRK 1UP005.001
May 2006
Appendix D – Delivery Package 1A-2
RS33A – Reactive Residues. Progress Report,
NorthMet Project, Minnesota
PolyMet Mining Inc.
SRK Consulting (Canada) Inc.
Suite 800, 1066 West Hastings Street Vancouver, B.C. V6E 3X2
Tel: 604.681.4196 Fax: 604.687.5532
E-mail: [email protected] Web site: www.srk.com
SRK Project Number 1UP005.001
May 2006

SRK Consulting Reactive Residues Progress Report Page i
RS33A SJD/sdc 1UP005.001_RS33A.20060511.doc, May. 11, 06, 3:02 PM May 2006
Table of Contents
1 Introduction .................................................................................................................. 1
2 Methods ........................................................................................................................ 2 2.1 Background ......................................................................................................................... 2 2.2 Sample Collection and Compositing ................................................................................... 2 2.3 Mineralogical Characterization............................................................................................ 3 2.4 Chemical Characterization .................................................................................................. 3
2.4.1 Bulk Chemistry ........................................................................................................................3 2.4.2 Leach Procedures ...................................................................................................................3 2.4.3 Dissolution Tests .....................................................................................................................4
3 Results and Discussion............................................................................................... 6 3.1 Introduction ......................................................................................................................... 6 3.2 Leach Residues .................................................................................................................. 6 3.3 Gypsum Residue................................................................................................................. 6 3.4 Raffinate Neutralization Residue......................................................................................... 7 3.5 Iron and Aluminum Residue................................................................................................ 7 3.6 Magnesium Residue ........................................................................................................... 7 3.7 Combined Residues............................................................................................................ 8
3.7.1 All Residues.............................................................................................................................8 3.7.2 Combined without Gypsum Residue.......................................................................................8
4 Implications to Management and Disposal................................................................ 9
5 Conclusions and Recommendations ....................................................................... 10
6 References.................................................................................................................. 11

SRK Consulting Reactive Residues Progress Report Page ii
RS33A SJD/sdc 1UP005.001_RS33A.20060511.doc, May. 11, 06, 3:02 PM May 2006
List of Tables
Table 1: Proportions (by Wet Weight) for Combined Residues ..................................................... 2
List of Appendices
Appendix A: Flotation Tailings and Hydrometallurgical Residue Geochemical Characterization
Plan
Appendix B: Results of Mineralogy, Bulk Chemical and Leach Test Characterization
Appendix C: Dissolution Tests Charts
C.1 Sequential Shake Flasks
C.2 Humidity Cells
C.3 DNR Reactors

SRK Consulting Reactive Residues Progress Report Page 1
RS33A SJD/sdc 1UP005.001_RS33A.20060511.doc, May. 11, 06, 3:02 PM May 2006
1 Introduction
PolyMet Mining Inc. (PolyMet) is proposing to develop the NorthMet Project (Dunka Road Project of US Steel) near Babbitt, Minnesota. As a part of the Minnesota Department of Natural Resources (MDNR) “Permit to Mine” process a complete “mine waste characterization” will be required (Minnesota Rules Chapter 6132.1000).
The processing and recovery of NorthMet Project ore to recover commodity metals will involve conventional flotation to produce a sulfide concentrate followed by hydrometallurgical treatment of the concentrate.
Processing will result in the generation of the following waste products:
• Flotation tailings (low sulfide).
• Leach residue (silicates).
• Gypsum residue (calcium sulfate).
• Raffinate neutralization residue (calcium sulfate).
• Fe/Al residue (oxide).
• Mg residue (oxide).
The characterization plan for these products was developed in consultation with the Minnesota Department of Natural Resources (SRK 2005) (Appendix A). The plan covers characterization of both tailings from the flotation process and the hydrometallurgical residues from recovery of commodities. Characterization of the hydrometallurgical residues was started in February 2006 following generation of the residues between August 29 and October 11, 2005 and agreement on the characterization methodologies with MDNR. This report is the first of two reports describing characterization results. It covers results of mineralogical characterization, analysis of bulk solids, results of regulatory leach procedures (EPA 1311 and 1312) and initial results from kinetic dissolution tests.

SRK Consulting Reactive Residues Progress Report Page 2
RS33A SJD/sdc 1UP005.001_RS33A.20060511.doc, May. 11, 06, 3:02 PM May 2006
2 Methods
2.1 Background
The sampling and testing plan was developed in consultation with MDNR (Appendix A). The following sections summarize the methods used for characterization of the tailings and hydrometallurgical residues. This report describes the hydrometallurgical methods.
2.2 Sample Collection and Compositing
Sulfide concentrates were prepared by a pilot flotation plant in which the copper sulfate was evaluated as a reagent to improve flotation of sulfide minerals. Two concentrates were prepared with and without the use of copper sulfate, and both residues were leached in the hydrometallurgical process. PolyMet has since decided that copper sulfate will be used. Therefore, it was agreed (in consultation with MDNR, SRK 2006) that characterization testwork would be performed on the residues generated by leaching of the concentrate produced with copper sulfate. The exception is the leach residue for which both residue samples are being tested.
Residues generated by SGS Lakefield were collected under supervision of Barr Engineering and shipped to Canadian Environmental and Metallurgical Inc (CEMI) in Burnaby, British Columbia, Canada for testing. SRK Consulting is responsible for supervision of the testwork described in this report.
Testing is proceeding on individual samples of each type of residue and combined residues. Residue combinations are being tested with and without the gypsum residue to allow for the option of recovery of a separate gypsum product. The proportions by wet weight of each residue in the combined samples are provided in Table 1. The combined residue containing all residues was received directly from the pilot plant (SGS Lakefield). The combined residue without gypsum was prepared from the component residues using the same weight proportions less the gypsum amount.
Table 1: Proportions (by Wet Weight) for Combined Residues
Actual Pilot Plant Observation Projected for
Commercial Scale
Residue All Without Gypsum All
Leach Residue 27% 45% 41%
Gypsum Residue 40% 0% 27%
Raffinate Residue 18% 31% 13%
Fe/Al Residue 6% 10% 12%
Mg Residue 8% 14% 7%
Subsequent optimization and modeling (MetSim Version S) of the hydrometallurgical process by Bateman indicates that the proportion of the residues may be somewhat different under full scale production (see Table 1). The implications of this difference are inconsequential and are discussed in Section 4.

SRK Consulting Reactive Residues Progress Report Page 3
RS33A SJD/sdc 1UP005.001_RS33A.20060511.doc, May. 11, 06, 3:02 PM May 2006
2.3 Mineralogical Characterization
Mineralogical characterization of the residues included optical mineralogy on the leach residue and Quantitative X-Ray Diffraction (XRD) on all residues. Optical mineralogy is in progress and results should be available in mid-June. The XRD method detects crystalline phases and calculates the percentage of these phases assuming that the sample is entirely crystalline. Amorphous phases are neither detected nor considered in the proportions of phases. Consideration of the bulk element content provides indicators about the presence and composition of the amorphous components.
Results of the mineralogical characterization are provided in Appendix A.
2.4 Chemical Characterization
2.4.1 Bulk Chemistry
Bulk chemical analysis included acid-base accounting parameters (total and sulfate sulfur, neutralization potential, total inorganic carbon and pH) and metals. In samples containing sulfide minerals, the difference between sulfate sulfur and total sulfur is normally attributed to sulfur occurring as sulfide minerals. Since the concentrates are completely oxidized in the hydrometallurgical process and the resulting residues produced by precipitation processes (i.e. all residues except the leach residue) will not contain any sulfide minerals, the difference between total and sulfate sulfur is due to analytical uncertainties rather than sulfide minerals.
The feasibility of determining the chemical content of individual mineral grains will be evaluated when grain mounts are available in June.
Results of the bulk chemical characterization are provided in Appendix B.
2.4.2 Leach Procedures
Two regulatory leach procedures were used:
• EPA 1311 or Toxicity Characteristic Leaching Procedure (TCLP) uses an acetic acid leachate with a pH of about 5. The solid to leachate ratio is 1:20. The procedure evaluates the leachability of wastes in contact with an organic acid. The procedure provides the basis for regulatory classification of the waste residues.
• EPA 1312 or Synthetic Precipitation Leach Procedure (SPLP) uses a weak sulfuric and nitric acid mixture buffered at about pH 4.2. The solid to leachate ratio is 1:20. This procedure is intended to simulate the effect of acidic rainfall produced by industrial pollution. SPLP is more appropriate than TCLP for evaluation of leaching due to contact with meteoric waters because it uses a mineral acid rather than an inorganic acid.
A third leach procedure was used as the first step of the sequential shake flask leach procedure described in Section 2.3.3. This procedure, developed by Price (1997) for the British Columbia

SRK Consulting Reactive Residues Progress Report Page 4
RS33A SJD/sdc 1UP005.001_RS33A.20060511.doc, May. 11, 06, 3:02 PM May 2006
Ministry of Energy Mines and Petroleum Resources, uses a lower leach ratio (1:3) to improve detection of low levels of metals. The lixiviant is deionized water which typically has a pH between 5 and 6. The leachate pH is not fixed as in the TCLP and SPLP methods.
It was originally planned to also use the Meteoric Water Mobility Procedure (NDEP 1996); however due to sample limitation, the test was not performed. The solid to leachate ratio for this test is 1:1 which bracketed by the Price (1997) method (1:3) and the ASTM humidity cell (1:0.5).
Results of the leachate tests are provided in Appendix A.
2.4.3 Dissolution Tests
Sequential Shake Flask
All residues are being tested using a sequential leach procedure consisting of weekly repetition of the leach procedure developed by Price (1997) in which the solid to liquid ratio is 1:3. The procedure involves weekly leaching of roughly 300 g of solids in a plastic bottle. The leaching step consists of addition of deionized water and agitation for 24 hours. The leachate is then decanted for analysis.
This procedure was requested by the DNR to provide a more aggressive evaluation of residue dissolution than occurs in humidity cells.
Leachates are analyzed using the following schedule:
• Weekly – pH, oxidation-reduction potential, conductivity.
• Bi-weekly – Acidity, alkalinity, inorganic C, hardness, anions (F, Cl, SO4).
• Four weekly (weeks 0, 4, 8, 12, etc) – Low level element scan using ICP-MS.
• Four weekly (weeks 2, 6, 10, 14, etc) – General element scan using ICP-OES.
Humidity Cell
Residues are being tested in ASTM-style humidity cells in the tailings configuration. Details of the procedure are provided in Appendix A. The solid to liquid ratio is 1:0.5 (1 kg of solids leached with 500 mL of deionized water). Leachates are being analysed using the same schedule as the sequential shake flasks.
DNR Reactor
Residues are also being tested in small (75 g) DNR Reactors for which the solid to liquid ratio is 1:2.7 (75 g of solids leached with 200 mL of deionized water). Details are provided in Appendix A. Leachates are being analysed using the same schedule as the sequential shake flasks.

SRK Consulting Reactive Residues Progress Report Page 5
RS33A SJD/sdc 1UP005.001_RS33A.20060511.doc, May. 11, 06, 3:02 PM May 2006
Testwork Progress
The dissolution tests were started in early February 2006. Up to 11 weeks of data have been provided by the laboratory depending on the parameter and the tests are ongoing.
Graphs illustrating concentrations obtained to date from dissolution tests are provided in Appendix C. Data listings and supporting quality assurance data can be provided if requested.
Since different reporting limits are used for different cycles and different parameters, the following rules were used to plot data and allow trends to be apparent:
• If the parameter was not determined, the result is not plotted. This is the case for alkalinity and acidity which are only determined if the pH is above or below (respectively) specified values.
• If the result is undergoing quality control re-check, the result is not plotted (e.g. sulfate for leach residues and gypsum residues for shake flask tests).
• If the parameter is determined by the same method for each analysis, value below the reporting limit values are plotted as 50% of the reporting limit.
• Since the reporting limits for ICP-MS are below the reporting limit for ICP-ES:
• If the result was determined by ICP-MS and was below the reporting limit, the value on the graph is 50% of the reporting limit. If the value is at or above the reporting limit, the value is plotted.
• If the result was determined by ICP-ES and was determined to be below the reporting limit, no value is plotted.
• If the result was determined by ICP-ES and was determined to be above the reporting limit, the value is plotted.
• These rules can result in four cycles between plotted results if the parameter is not detected by ICP-ES (e.g. molybdenum in shake flask leachates).
Occasionally, “sawtooth” trends are apparent in which values alternate between high and low for the ICP-ES and ICP-MS analyses. This results from analytical “noise” around the ICP-ES reporting limit when reported values are slightly above the reporting limit. Aluminum is a particular example that commonly shows reported values above the ICP-ES reporting limit of 0.05 mg/L.
Many graphs are plotted on logarithmic axes to allow data spanning a wide range of concentrations to be compared.
More results are available for immediately determined parameters (for example, pH, conductivity) than for metals.

SRK Consulting Reactive Residues Progress Report Page 6
RS33A SJD/sdc 1UP005.001_RS33A.20060511.doc, May. 11, 06, 3:02 PM May 2006
3 Results and Discussion
3.1 Introduction
Results are described below for each residue in the sequence they are produced in the hydrometallurgical process.
3.2 Leach Residues
The leach residues remain from the concentrate following pressure leaching. It is expected that this product will consist of both secondary minerals and resistant primary minerals (silicates).
Leach residues from processing of concentrates produced by sulfide flotation with and without copper sulfate are being tested. The XRD results implied differences in the residual silicate component of the residues. The concentrate produced without copper sulfate had 26% residual plagioclase compared to 6% for the concentrate produced with copper sulfate. The oxidation products produced by the process are shown as mainly natrojarosite, which was confirmed by the sodium content of the samples.
The two leach residue produced from concentrate without use of copper sulfate showed lower pH than the concentrate produced using copper sulfate and the various leach procedures consistently showed pHs below 3.4. The pH decreased as the water to solid ratio in the tests decreased. Lowest pHs were apparent for the ASTM humidity cell (1.9 and 2.3, respectively). The TCLP extraction showed the pH of the lixiviant as required by the procedure.
The low pHs resulted in high metal solubility. The highest metal concentrations were shown for the humidity cells.
Lime demand to neutralize excess acidity was low as shown by neutralization potentials of -17 and -4 kg CaCO3/t. Acidity leached during the first step of the dissolution procedure was comparable (6 kg CaCO3/t) and subsequent analyses of leachates indicated that acidity is highly soluble and decreases very rapidly along with overall ion content of the solutions (conductivity). Leachate pH also increased. The acidity is probably from rinsing of residual process solutions rather than dissolution of secondary minerals though dissolution of these can be expected to result in long term depression of pH.
3.3 Gypsum Residue
Gypsum residue is the first hydromet precipitation product. It is produced by limestone addition to the leach solution following recovery of platinum group metals and prior to copper recovery.
The elevated calcium and sulfate content of the gypsum residue sample confirmed that it was dominantly hydrated calcium sulfate. XRD showed that it was 99.8% gypsum.

SRK Consulting Reactive Residues Progress Report Page 7
RS33A SJD/sdc 1UP005.001_RS33A.20060511.doc, May. 11, 06, 3:02 PM May 2006
This residue was acidic (pH 2.7 in the humidity cell) and leached metals at comparable levels to the leach residue produced from concentrate generated with copper sulfate. Leachate chemistry was consistent with the dissolution of gypsum. Leachate pH increased then stabilized in dissolution tests, and electrical conductivity remained stable and relatively low due to the solubility limitation of gypsum.
3.4 Raffinate Neutralization Residue
This residue is formed by an intermediate neutralization step between copper removal and precipitation of iron and aluminum.
Raffinate neutralization residue was identified as nearly entirely calcium sulfate (gypsum with minor bassanite) by XRD which was confirmed by the dominance of calcium and sulfate in the sample. This residue had low pH (3.6 in humidity cell), though leachate chemistry showed relatively low soluble metal concentrations compared to other residues.
General leachate chemistry in all three types of dissolution tests stabilized within a few weeks.
3.5 Iron and Aluminum Residue
The iron and aluminum residue is formed by two limestone addition steps prior to cobalt, nickel and zinc hydroxide recovery.
Like the raffinate neutralization residue, the Fe/Al residue was mostly gypsum with some iron and aluminum. Goethite was detected by XRD. This residue was also acidic but the pH was higher than the previous residues (for example, 4.8 in humidity cell leachate) and showed a chemical composition consistent with control by aluminum minerals (e.g. alunite). Concentration of cobalt, nickel and zinc in the process solutions at this stage was apparent by the increased concentrations of these metals in the leachates. The chemistry of the leachates appeared to have stabilized.
Lime demand to neutralize excess acidity was low as shown by neutralization potential of -10 kg CaCO3/t.
3.6 Magnesium Residue
The magnesium residue is formed following recovery of the mixed hydroxide product and is the result of final addition of lime to the process solutions. The magnesium originates from the original concentrate leaching step (dissolution of olivine), and addition of magnesium oxide to precipitate the mixed hydroxide product.
The crystalline component of this residue was dominated by gypsum as shown by the elevated sulfate and calcium. The XRD scan showed that brucite (magnesium hydroxide) was present and this was supported by the magnesium content of the sample. The sample showed a strong fizz reaction to hydrochloric acid and carbonate content equivalent to 4% calcium carbonate (40 kg CaCO3/t). This suggests that the hydroxide was partially converted to carbonate by atmospheric reaction.

SRK Consulting Reactive Residues Progress Report Page 8
RS33A SJD/sdc 1UP005.001_RS33A.20060511.doc, May. 11, 06, 3:02 PM May 2006
Neutralization potential was high at 371 kg CaCO3/t probably reflecting the presence of amorphous magnesium and possibly calcium hydroxide. This residue was alkaline (pH 9.6) and consistent with the hydroxide content. As a result of the high pH, concentrations of leachable metals were very low.
The leaching performance of this residue was variable depending on the test type and different from the other residues. Leachate pH was consistently elevated reflecting the dissolution of magnesium hydroxide, but conductivity was elevated compared to the other residues and trended upwards in the DNR reactor, downward in the shake flask and was stable in the humidity cell. The difference in trends appeared to be related to the sulfate concentration and equilibration with respect to gypsum in the presence of magnesium salt at different solid to liquid ratios. The humidity cell showed the highest sulfate and conductivity, whereas the DNR reactor leachate was equilibrating with respect to gypsum, and therefore sulfate was increasing. The shake flask leachate represented the most aggressive condition for dissolution of gypsum and was showing a decreasing trend in sulfate release.
3.7 Combined Residues
3.7.1 All Residues
The largest component of the combined residue was the gypsum residue, followed by leach residue, raffinate residue, Mg residue and Fe/Al residue. As a result the material was dominantly calcium sulfate from the gypsum residue. The XRD result showed the presence of calcite and siderite.
This residue produced alkaline leachate from SPLP (pH 9.2), 1:3 water leach (pH 8.7) and humidity cell (8.5) and the neutralization potential was 10 kg CaCO3/t indicating excess alkalinity. This value is lower than neutralization potential of 28 kg CaCO3/t obtained by arithmetically combining the residues in the proportion indicated in Table 1. The analytical value is being checked because the analytical and arithmetic values for total sulfur, sulfate sulfur and carbonate values are consistent (16 and 16%S, 15.9 and 15.5%S, and 0.10 and 0.15% CO2, respectively).
The dissolution tests have confirmed that leachate pHs fall initially but remain pH neutral to slightly alkaline. The combined residues also show that the leachable metal concentrations are as low as for the Mg residue.
3.7.2 Combined without Gypsum Residue
Although this combination did not include the gypsum residue, gypsum remained a significant component from the raffinate neutralization, Fe/Al residue and Mg residues.
The leaching characteristics of this material were very similar to the combination of all residues though the lack of the acidic gypsum residue resulted in higher pH and neutralization potential (51 kg CaCO3/t). This value compares well to 47 kg CaCO3/t by arithmetically combining the residues in the proportions indicated in Table 1.

SRK Consulting Reactive Residues Progress Report Page 9
RS33A SJD/sdc 1UP005.001_RS33A.20060511.doc, May. 11, 06, 3:02 PM May 2006
4 Implications to Management and Disposal
The testwork has shown that four of the five residues will be acidic. However, the actual residual leachable acidity appears to be low (amounting to a maximum of 17 kg CaCO3/kg for the leach residue) and leachable metals are most likely contained in trapped process solutions rather than the solids. It can be expected that during operation of the disposal cells, pore water chemistry in the residues will at first be dominated by acidic process solutions. If during full-scale operation the residues are processed to extract process water, then re-pulped for pumping to the disposal cells, the chemistry of this water would reflect interaction of the water used for re-pulping with the residues, rather than the process water.
As the cells are decommissioned, long term leachate would remain acidic due to the lack of acid buffering minerals but leachable metals would decrease and eventually stabilize at the level indicated by the stable pH of the residues. The dominance of gypsum in the residues indicates that major ions in pore water will be calcium and sulfate from dissolution of gypsum.
The effect of combining the residues effectively neutralizes the stored process acidity because the Mg residue has a high neutralization potential (370 kg CaCO3/t) present mainly as magnesium hydroxide. The calculated NP of the combined residues is 28 kg CaCO3/t for the sample received from the pilot plant, and 23 kg CaCO3/t for the expected proportions under commercial operations (Table 1), both of which indicate an excess of neutralization potential for the combined residues. The proportion of Mg residue can fluctuate significantly without affecting the overall pH of the mixed residue. Based on the data currently available, an Mg residue content as low as 0.5% (Pilot Plant proportions) or 0.8% (commercial-scale proportions) would be sufficient to offset the process water acidity and maintain the combined residues in a non-acidic state. This calculation also shows that the variation in the relative proportions of the major acidic residues (Leach and Gypsum) is not an important factor.
These conclusions are subject to confirmation under operational conditions but they indicate the 7 to 8% assumed for the mixed residue is probably much higher than needed to offset the acidity of the acidic residues.

SRK Consulting Reactive Residues Progress Report Page 10
RS33A SJD/sdc 1UP005.001_RS33A.20060511.doc, May. 11, 06, 3:02 PM May 2006
5 Conclusions and Recommendations
Data obtained to date for the reactive residues indicate that:
• All residues except the magnesium residue and the combined residues are expected to have low pH.
• Titratable acidity in the residues is low and probably due to trapped process water rather than leachable acid salts.
• All dissolution tests on acid residues showed an initial rapid release of acidic water with high concentrations of metals, however, within a few leach cycles, acidity and metal concentrations decrease by orders-of-magnitude.
• The Mg residue had high neutralization potential and very low leachable metals due to its high pH.
• The Mg residue was an effective neutralizing agent for the acidic residues. A few percent Mg residue mixed with the acidic residues is sufficient to neutralize the acidity.
The test program currently has a high level of redundancy. The three types of dissolution test are showing very similar results (decreasing concentrations and overall ionic strength), and the concentrations observed are consistent with the differences in solid to liquid ratio. It is also apparent that leachate chemistry is controlled initially by flushing of acidic process water followed by slow leaching of metals at the expected long term moderately acidic pH in the residues. The development of stable conditions has occurred rapidly, and there is no requirement for long term leach testing. The humidity cells provide the best configuration to evaluate longer term leaching conditions for the residues because the liquid to solid ratio is the lowest of the three test types.
The following modifications to the test program are recommended:
• Immediately terminate the sequential shake flask and DNR reactor tests.
• Continue the humidity cell-style tests until stable conditions are demonstrated.
• Once stable conditions are apparent, terminate all individual residue tests but continue the combined residue tests.
Prepared by
Stephen Day, M.Sc. Principal Geochemist

SRK Consulting Reactive Residues Progress Report Page 11
RS33A SJD/sdc 1UP005.001_RS33A.20060511.doc, May. 11, 06, 3:02 PM May 2006
6 References
Price, W. 1997. Draft Guidelines and Recommended Methods for the Prediction of Metal Leaching and Acid Rock Drainage at Minesites in British Columbia. Reclamation Section, British Columbia Ministry of Energy and Mines. April 1997.
Nevada Division of Environmental Protection. 1996. Meteoric Water Mobility Procedure (MWMP) Standardized Column Test Procedure. NDEP publication MWMP.ltr. May 3 1996. 6p.
SRK Consulting, 2005. Flotation Tailings and Hydrometallurgical Residue Geochemical Characterization Plan, NorthMet Project, Minnesota. Prepared for PolyMet Mining Inc. September 2005.
SRK Consulting, 2005. NorthMet Project . Tailings and Hydromet Residue Testwork – Update on Sample Selection from 24 Hour Testwork. Memo prepared for Polymet Mining Inc. January 6, 2006.

Appendix A Flotation Tailings and Hydrometallurgical Residue
Geochemical Characterization Plan

Flotation Tailings and Hydrometallurgical
Residue Geochemical Characterization Plan
NorthMet Project, Minnesota
Prepared for:
Polymet Mining Inc.#2350 – 1177 West Hastings Street
Vancouver, BCV6E 2K3
Prepared by:
Project Reference Number SRK 1UP005.001
May 2006

Flotation Tailings and Hydrometallurgical Residue Geochemical Characterization Plan
NorthMet Project, Minnesota
Polymet Mining Inc
SRK Consulting (Canada) Inc.
Suite 800, 1066 West Hastings Street Vancouver, B.C. V6E 3X2
Tel: 604.681.4196 Fax: 604.687.5532
E-mail: [email protected] Web site: www.srk.com
SRK Project Number 1UP005.001
May 2006
Author
Stephen Day, P.Geo. Principal Geochemist

SRK Consulting Flotation Tailings and Hydrometallurgical Residue Geochemical Characterization Plan Page i
SJD/sdc 1UP005 001_tailings_plan_20060510.SJD.doc, May. 10, 06, 3:01 PM May 2006
Table of Contents
1 Introduction .................................................................................................................. 1 1.1 Background ......................................................................................................................... 1 1.2 Geological Setting ............................................................................................................... 1 1.3 Agency Consultation and Design Process .......................................................................... 1 1.4 Organization of This Document........................................................................................... 2 1.5 Acknowledgements ............................................................................................................. 2 1.6 Laboratory Selection ........................................................................................................... 2
2 Characterization Design .............................................................................................. 3 2.1 Objective of the Program .................................................................................................... 3 2.2 Metallurgical Process Background...................................................................................... 3 2.3 Tailings and Metallurgical Residue Disposal....................................................................... 3 2.4 Metallurgical Testing ........................................................................................................... 4 2.5 Design Basis ....................................................................................................................... 5
2.5.1 Flotation Tailings .....................................................................................................................5 2.5.2 Hydrometallurgical Residues...................................................................................................6
3 Sample Handling and Analysis................................................................................... 7 3.1 Sample Shipping and Storage ............................................................................................ 7 3.2 Solids Characterization ....................................................................................................... 7
3.2.1 Introduction..............................................................................................................................7 3.2.2 Bulk Chemical Characterization ..............................................................................................9 3.2.3 Regulatory Leachate Characterization....................................................................................9 3.2.4 Shake Flask.............................................................................................................................9 3.2.5 Mineralogical Characterization................................................................................................9
3.3 Kinetic Test Methods......................................................................................................... 10 3.3.1 Humidity Cell .........................................................................................................................10 3.3.2 MDNR Reactor ......................................................................................................................10 3.3.3 Sequential Shake Flask Test.................................................................................................10 3.3.4 Leach Columns .....................................................................................................................10 3.3.5 Leachate Analysis .................................................................................................................10
3.4 Analysis of Remaining Sample Following Dissolution Tests ............................................. 12 3.5 Quality Assurance/Quality Control .................................................................................... 13
4 Use of Data for Water Quality Predictions ............................................................... 14 4.1 Introduction ....................................................................................................................... 14 4.2 Operational Water Quality................................................................................................. 14
4.2.1 Flotation Tailings ...................................................................................................................14 4.2.2 Leach Residues.....................................................................................................................14
4.3 Water Quality at Closure and Post Closure ...................................................................... 15 4.3.1 Flotation Tailings ...................................................................................................................15 4.3.2 Leach Residues.....................................................................................................................15
5 References.................................................................................................................. 16

SRK Consulting Flotation Tailings and Hydrometallurgical Residue Geochemical Characterization Plan Page ii
SJD/sdc 1UP005 001_tailings_plan_20060510.SJD.doc, May. 10, 06, 3:01 PM May 2006
List of Tables Table 1: Composition of Four Tailings Samples............................................................................... 5 Table 2: Procedures and Numbers of Samples for Testing ............................................................. 8 Table 3: List of Parameters for Low Level Analysis of Humidity Cell Leachates............................ 12
List of Figures
Figure 1: LTV Steel Mining Company Tailings Basins ..................................................................... 4
List of Appendices
Appendix A: Process Flow Sheets Appendix B: Update on Sample Selection from 24 Hour Testwork Appendix C: Parameter Lists and Detection Limits for Analysis of Solids Appendix D: Options and Variance in ASTM Humidity Cell Procedure Appendix E: Design of MDNR Reactor Appendix F: Design of Column Testing on Interaction Between NorthMet and LTV Tailings

SRK Consulting Flotation Tailings and Hydrometallurgical Residue Geochemical Characterization Plan Page 1
SJD/sdc 1UP005 001_tailings_plan_20060510.SJD.doc, May. 10, 06, 3:01 PM May 2006
1 Introduction
1.1 Background
PolyMet Mining Inc (PolyMet) is proposing to develop the NorthMet Project (Dunka Road Project of US Steel) near Babbitt, Minnesota. As a part of the Minnesota Department of Natural Resources (MDNR) “Permit to Mine” process a complete “mine waste characterization” will be required (Minnesota Rules Chapter 6132.1000). This document describes the plan developed for testing of flotation tailings and hydrometallurgical residue samples for the NorthMet Project.
The issues associated with tailings and residues at the NorthMet are expected to include acid rock drainage (ARD) and leaching of some heavy metals. The latter in particular are expected to include nickel and cobalt both of which do not require acidic conditions to be mobilized at elevated concentrations.
The objective of this program is to predict the reactivity of tailings and residues in their respective disposal areas for input into waste and water management planning, and environmental impact assessment. A separate Environmental Sampling and Analysis Plan describes characterization methods for effluents and emissions as metallurgical testing proceeds.
1.2 Geological Setting
The NorthMet Deposit is located in the intrusive mafic Duluth Complex of northern Minnesota. Disseminated copper-nickel-iron sulfides (chalcopyrite, cubanite, pentlandite and pyrrhotite) with associated platinum group element (PGE) mineralization will be extracted from several igneous stratigraphic horizons.
1.3 Agency Consultation and Design Process
This document was developed in consultation with staff from the Minnesota Department of Natural Resources (MDNR). The consultation included the following steps:
• June 22, 2005. A draft of the plan was prepared for MDNR Review.
• July 21, 2005. MDNR provided initial comments focussed primarily on flotation tailings.
• August 16, 2005. MDNR provided further comments on the characterization of hydrometallurgical wastes.
• September 9, 2005. SRK responded to the July 21, 2005 letter.
• September 14, 2005. A conference call was held to discuss the July 21, August 16 and September 9 letters.

SRK Consulting Flotation Tailings and Hydrometallurgical Residue Geochemical Characterization Plan Page 2
SJD/sdc 1UP005 001_tailings_plan_20060510.SJD.doc, May. 10, 06, 3:01 PM May 2006
This document includes responses to comments provided by MDNR, and has been prepared to conclude the design process and seek MDNR approval of PolyMet’s plans to respond to the tailings/residue characterization component of requirements under Minnesota Rules 6132.1000.
1.4 Organization of This Document
This document describes:
• Section 2. Design basis for the program.
• Section 3. Analytical methods. This section describes methods used to analysis solids and leachates.
• Section 4. Use of the results in the context of water chemistry predictions.
1.5 Acknowledgements
The following individuals cooperated in the preparation of this plan:
• John Borovsky, Barr Engineering Company;
• Stephen Day, SRK Consulting;
• Paul Eger, MDNR;
• Jennifer Engstrom, MDNR;
• Don Hunter, PolyMet;
• Kim Lapakko, MDNR;
• Richard Patelke, PolyMet; and
• Jim Scott, PolyMet.
1.6 Laboratory Selection
The following laboratories will perform the procedures described in this plan (contact names for each laboratory are shown):
• ALS Chemex, North Vancouver, British Columbia – solids analysis listed in Section 4.1.1 (Bill Anslow);
• Optical – PolyMet or a Contractor (Richard Patelke);
• Sub-Optical Lab – McSwiggen and Associates (Peter McSwiggen);
• Canadian Environmental and Metallurgical Inc, North Vancouver, British Columbia – kinetic testing (Rik Vos); and
• Cantest Inc.. Vancouver, British Columbia - Kinetic test leachate analysis (Richard Jornitz).

SRK Consulting Flotation Tailings and Hydrometallurgical Residue Geochemical Characterization Plan Page 3
SJD/sdc 1UP005 001_tailings_plan_20060510.SJD.doc, May. 10, 06, 3:01 PM May 2006
2 Characterization Design
2.1 Objective of the Program
The overall objective of the program is to provide geochemical characterization information that can be used as inputs to design of management plans for the tailings and process residues and inputs into the environmental impact study (EIS) for the project.
2.2 Metallurgical Process Background
The processing and recovery of NorthMet Project ore to recover commodity metals will involve conventional flotation to produce a sulfide concentrate followed by hydrometallurgical treatment of the concentrate. The process flow sheets are provided in Appendix A.
Processing will result in the generation of the following waste products:
• Flotation tailings (low sulfide);
• Leach residue (silicates);
• Gypsum residue (calcium sulfate);
• Raffinate neutralization residue (calcium sulfate);
• Fe/Al residue (oxide); and
• Mg residue (oxide).
2.3 Tailings and Metallurgical Residue Disposal
Tailings and metallurgical residues are proposed for disposal in the existing impoundments at the former LTV Steel Mining Company (LTVSMC) operation (Figure 1). Review of the history of deposition at the LTVSMC tailings area indicates that the tailings are a result of processing ore feed from several iron ore pits and working faces in those pits. The ore was blended by truck delivery to loading pockets and then train delivery to crusher. Once in the plant ore was further blended in the coarse ore bins by a coarse ore tripper which continuously spread coarse ore across seven fine crushing lines and in the fine ore bins by a fine ore tripper which continuously spread fine ore across 34 mill lines. The fine ore was then processed through 34 mill lines in parallel. The tailings are a recombination from the 34 mill lines pumped to the basin and discharged at many spigots at the periphery of the basin. The tailings were deposited over many years as many layers in the basin.
Flotation tailings produced by conventional extraction of commodity-bearing sulfide minerals will be disposed in the existing Cells 1E, 2E and 2W. For the first five years of operation, cell 2W will be lined. Discharge methodology has not been determined but will most likely involve conventional discharge from one or more spigots. Hydrometallurgical residues produced by leaching of the sulfide concentrate will be disposed in lined basins within Cell 2W. The method used to transport the

SRK Consulting Flotation Tailings and Hydrometallurgical Residue Geochemical Characterization Plan Page 4
SJD/sdc 1UP005 001_tailings_plan_20060510.SJD.doc, May. 10, 06, 3:01 PM May 2006
residues to the cells has not been determined. The residues may be combined for disposal, or disposed separately depending on factors such as the possibility of selling some by-products.
The possibility of constructing tailings dams using cycloned tailings is being considered and has been incorporated in this test program.
Figure 1: LTV Steel Mining Company Tailings Basins
2.4 Metallurgical Testing
Three ore composites were prepared under PolyMet’s direction from diamond drill hole core bracketing head grades expected during mining. Pilot-scale metallurgical testwork was begun in July 2005 and continued into September. Flotation tailings testing was completed in August and included assessment of process alternatives. Addition of copper sulfate to improve sulfide concentrate recovery was evaluated for two ore composites.
A separate Environmental Sampling and Analysis Plan has been prepared to describe monitoring of air, water and solid emissions as the testwork proceeds. That document explains the rationale for preparation of the three ore composites representing copper grades of 0.3%, 0.35% and 0.4%. It also contains details of pilot plant monitoring designed to evaluate variations in tailings geochemical characteristics potentially produced by variations in ore characteristics and process performance. For example, the pilot testing program included frequent (every two hours) monitoring of tailings characteristic.

SRK Consulting Flotation Tailings and Hydrometallurgical Residue Geochemical Characterization Plan Page 5
SJD/sdc 1UP005 001_tailings_plan_20060510.SJD.doc, May. 10, 06, 3:01 PM May 2006
2.5 Design Basis
2.5.1 Flotation Tailings
Flotation tailings will consist primarily of silicate minerals with small amounts of residual sulfide minerals not recovered by flotation.
The number of variables expected to control reactivity is relatively small. Ore processing naturally results in a well-blended tailings product because the process requires a uniform feed to maximize recovery of commodities. Therefore, variables such as rock type, sulfide mineral type, silicate mineral type and source of ore within the layers of the Duluth Complex will not be significant. Preparation of the ore composite, which has been documented by PolyMet mimics mining at several faces and will result in composites each containing similar distributions of the main silicate and sulfide minerals. Variations will occur reflecting the distribution of commodity-containing minerals. Further, the requirement for grinding to optimize beneficiation of the commodity minerals limits the importance of variables such as mineral particle size and degree of liberation. The remaining variables are therefore expected to be:
• Sulfur content;
• Metal content; and
• Particle size (where separations occur at the deposition site as a result of hydraulic factors) resulting in differences in chemical and mineralogical composition.
The testing of tailings from the three ore composites will allow these variables to be evaluated. It is expected that recovery of sulfide minerals from ore will vary during testwork resulting in tailings containing variable concentrations of sulfur and metals. Results of two-hourly testing were provided in a memorandum to DNR dated January 6, 2006 (Appendix B). The composition of the four tailings samples initiated concurrently with preparation of this plan are shown in Table 1 along with the range of sulfur concentrations indicated by the two-hourly testing.
Table 1: Composition of Four Tailings Samples
Ore Composite Total Sulphur Content of Ore
Copper Sulfate Used in Flotation
Range of Total Sulphur Concentrations in
Tailings
Total Sulphur Content of Tailings
Under Test
1 0.86 NO 0.19% to 0.28% 0.23%
YES 0.09% to 0.13% 0.10%
2 0.90 NO 0.05% to 0.25% 0.20%
3 0.86 YES 0.09% to 0.25% 0.15%

SRK Consulting Flotation Tailings and Hydrometallurgical Residue Geochemical Characterization Plan Page 6
SJD/sdc 1UP005 001_tailings_plan_20060510.SJD.doc, May. 10, 06, 3:01 PM May 2006
2.5.2 Hydrometallurgical Residues
The residues are mainly chemical products in which the original concentrate components are oxidized to sulfates and hydroxides, and dissolved.
• Sulfur from the sulfide minerals is oxidized to sulfate and precipitated as calcium sulfate through the neutralization process;
• Iron released from sulfide and silicate minerals is precipitated as hydroxide; and
• Magnesium and aluminum released from silicate minerals are precipitated as hydroxides.
Copper is recovered in the process by electro-winning to produce copper anodes. Nickel, cobalt and zinc are recovered as a mixed hydroxide product.
Incomplete dissolution of the silicate and sulfide minerals results in generation of a fourth mineralogical leach residue.
Since these products represent near-complete dissolution, oxidation and neutralization of the concentrate, the chemistry of contact waters is expected to be controlled mainly by the simple dissolution of the compounds. Oxidation of residual sulfide minerals may occur from the leach residue but this effect is expected to minor.
Overall, the process of dissolution of neutralization products is unrelated to the composition of the ore and is not expected to vary in the long term except by depletion.
Pilot scale hydrometallurgical testing will be completed on two composite concentrate samples produced from processing of the three ore samples prepared with and without the use of copper sulfate in the flotation process.

SRK Consulting Flotation Tailings and Hydrometallurgical Residue Geochemical Characterization Plan Page 7
SJD/sdc 1UP005 001_tailings_plan_20060510.SJD.doc, May. 10, 06, 3:01 PM May 2006
3 Sample Handling and Analysis
3.1 Sample Shipping and Storage
SGS/Lakefield in Lakefield, Ontario, Canada is performing the metallurgical testing. Products will be shipped to Canadian Environmental and Metallurgical Inc. (Vancouver, British Columbia, Canada). Samples will be shipped and stored prior to testing as follows:
• Ore Feed Samples – Refrigerated;
• Sulfide Concentrate – Refrigerated;
• Flotation Tailings – Slurry in sealed pails with sufficient (6 cm) supernatant to ensure the samples are covered by water;
• Leach Residue – Cake, refrigerated; and
• Hydrometallurgical Residues – Cake, refrigerated.
Residual materials remaining after testing will be stored in the same condition as shipped.
3.2 Solids Characterization
3.2.1 Introduction
Table 1 summarizes the types of materials generated by testwork and the chemical testing procedures for each one. Physical testing of these products (including particle size determinations) is described in Environmental Sampling and Analysis Plan for the pilot plant test program. The DNR made several requests for multiple tests on some material types. In reality, the quantity of materials generated by metallurgical testing was limited and restricted the number of tests that could be performed. The 2-hourly testing showed that the sulfur content of the tailings did not vary widely and that the bulk samples under test will characterize the range of sulfur content of tailings.
Details of the test procedures are provided in the following sections.

SRK Consulting Flotation Tailings and Hydrometallurgical Residue Geochemical Characterization Plan Page 8
SJD/sdc 1UP005 001_tailings_plan_20060510.SJD.doc, May. 10, 06, 3:01 PM May 2006
Table 2: Procedures and Numbers of Samples for Testing
Material Sulfur Forms
Neutralization Potential Carbonate Metals TCLP SPLP
Shake Flask
Optical Mineralogy
XRD Sub-
Optical HCT
Sequential Shake Flask
Column DNR Reactor
Test
Layered Column
Ore feed 1/Ore 1/Ore 1/Ore 1/Ore 1/Ore 1/Ore 1/Ore 1/Ore 1/Ore
Sulfide Concentrate 1/Ore 1/Ore 1/Ore 1/Ore 1/Ore 1/Ore 1/Ore
Bulk Flotation Tailings – Without CuSO4
1 1/Ore
1/Ore 1/Ore 1/Ore 1/Ore
1/Ore 1/Ore 1/Ore 1/Ore
1/Ore
Bulk Flotation Tailings – With CuSO4
1
1/Ore
1/Ore 1/Ore 1/Ore 1/Ore
1/Ore 1/Ore 1/Ore 1/Ore
1/ore Multiple
Cyclone Sands 1/Ore 1/Ore 1/Ore 1/Ore 1/Ore 1/Ore 1/Ore 1/Ore 1/Ore 1/ore
Tailings Slimes 1/Ore 1/Ore 1/Ore 1/Ore 1/Ore 1/Ore 1/Ore 1/Ore 1/Ore 2 1/ore
Tailings Beaches 1/Ore 1/Ore 1/Ore 1/Ore 1/Ore 1/Ore 1/Ore 1/Ore 1/Ore 2 1/ore
Leach Residue 1 1 1 1 1 1 1 1 1 1 1 1 1
Gypsum Residue 1 1 1 1 1 1 1 1 1 1 1 1
Raffinate Neutralization Residue 1 1 1 1 1 1 1 1 1 1 1 1
Fe/Al Residue 1 1 1 1 1 1 1 1 1 1 1 1
Mg Residue 1 1 1 1 1 1 1 1 1 1 1 1
Reactive Residues2 1 1 1 1 1 1 1 1 1 1 1 1
Reactive Residue without Gypsum
3
1 1
1 1 1 1 1
1 1
1
Notes:
1. Flotation tailings samples were produced with and without the use of copper sulfate in the process to enhance recovery of sulfide minerals to the sulfide concentrate.
2. Combination of leach, gypsum, raffinate, Fe/Al and Mg residues.
3. Combination of leach, raffinate, Fe/Al and Mg residues.

SRK Consulting Flotation Tailings and Hydrometallurgical Residue Geochemical Characterization Plan Page 9
SJD/sdc 1UP005 001_tailings_plan_20060510.SJD.doc, May. 10, 06, 3:01 PM May 2006
3.2.2 Bulk Chemical Characterization
A split of each sample will be submitted for an extensive suite of analyses, as follows:
• Sulfur forms (total S, S as sulfate).
• Paste pH.
• Neutralization potential and carbonate.
• 50 elements (mostly metals by ICP scan following aqua regia (nitric and hydrochloric acids) digestion.
• Whole rock oxides. This is provides total concentrations of major elements.
Method detection limits are provided in Appendix C.
3.2.3 Regulatory Leachate Characterization
All samples will be submitted for regulatory leach tests (EPA 1311; EPA 1312) to provide data for waste classification purposes should this be needed. Testing of the ore samples will provide a baseline for comparison to effects from processing.
3.2.4 Shake Flask
A third leach leachate procedure was used as the first step of the sequential shake flask leach procedure described in Section 3.3.3 for hydrometallurgical residues. This procedure, developed by Price (1997) for the British Columbia Ministry of Energy Mines and Petroleum Resources, uses a lower leach ratio (1:3) to improve detection of low levels of metals. The lixiviant is deionized water which typically has a pH between 5 and 6. The leachate is not fixed as in the TCLP and SPLP methods. The extraction is performed by shaking in a glass or plastic container for 24 hours, after which the leachate is extracted and analyzed.
3.2.5 Mineralogical Characterization
Mineralogical characterization will include:
• Optical Analysis on feed, product and mineral wastes (Flotation Tailings, Leach Residue). Other residues will not be examined optically since they are precipitates;
• X-Ray Diffraction on all samples to determine crystalline compounds; and
• Sub-Optical Analysis on ore feed, mineral wastes, and if practical residues to determine the distribution of trace elements in individual minerals prior to and following processing.

SRK Consulting Flotation Tailings and Hydrometallurgical Residue Geochemical Characterization Plan Page 10
SJD/sdc 1UP005 001_tailings_plan_20060510.SJD.doc, May. 10, 06, 3:01 PM May 2006
3.3 Kinetic Test Methods
3.3.1 Humidity Cell
Humidity cell testing will be performed on ore feed (to characterize three types of ore stockpiles), flotation tailings and leach residues using ASTM Procedure D 5744 – 96 (Reapproved 2001). This procedure was selected for the following reasons:
• Similar procedures have been in use under different names since the late 1980s (e.g. MEND 1991). The results can therefore be evaluated in the context of more than a decade of experience using the procedure.
• It is a standard procedure approved by the ASTM and is therefore defensible as a method.
The ASTM procedure provides some options for varying the test procedure. Appendix D provides a detailed listing of the requirements of the ASTM procedure, options chosen and any variances from the ASTM procedure.
3.3.2 MDNR Reactor
To allow comparison with previous MDNR studies, bulk tailings samples will be tested using a procedure referred to as the “MDNR Reactor” experiment. An apparatus specifically designed by MDNR (Appendix E) contains 75 g of solids.
3.3.3 Sequential Shake Flask Test
All residues are being tested using a sequential leach procedure consisting of weekly repetition of the leach procedure developed by Price (1997) in which the solid to liquid ratio is 1:3 (Section 3.2.4). The procedure involves weekly leaching of roughly 300 g of solids in a plastic bottle. The leaching step consists of addition of deionized water and agitation for 24 hours. The leachate is then decanted for analysis. Between leach steps, the bottle remains open to the atmosphere.
This procedure was requested by the DNR to provide a more aggressive evaluation of hydrometallurgical residue dissolution than occurs in humidity cells.
3.3.4 Leach Columns
A procedure to evaluate the interaction between leachate from NorthMet tailings and LTV tailings was designed and presented to the DNR (Appendix F). The procedure provides for two subaerial columns to generate leachate from the NorthMet tailings.
3.3.5 Leachate Analysis
Leachates from kinetic tests will be analyzed for the parameters indicated in Table 2, which also shows reporting limits. These limits are higher than the detection limits for the analytical instruments. Reporting limits represent the level at which the analytical laboratory (CANTEST) is

SRK Consulting Flotation Tailings and Hydrometallurgical Residue Geochemical Characterization Plan Page 11
SJD/sdc 1UP005 001_tailings_plan_20060510.SJD.doc, May. 10, 06, 3:01 PM May 2006
confident that the concentrations are quantifiable to an acceptable level. The instrument is able to detect much lower levels but these concentrations carry a very high degree of uncertainty which includes “undetectable”.
Low level leachate analyses for dissolved elements as shown in Table 2 are performed every four weeks (weeks 0, 4, 8 etc). On the intervening even numbered weeks (2, 6, 10 etc.), an ICP scan is performed using a higher detection limit primarily to determine the trend in major ions. pH and conductivity are determined every week. Acidity, alkalinity, inorganic carbon, sulphate, fluoride and chloride are determined every other week.
It is expected that testing of flotation tailings will result in very dilute leachates containing low concentrations of the metals of interest. Back-calculation of metal concentrations from other testwork performed by DNR indicates that cobalt and nickel concentrations could be in the tens of nanograms per litre (ng/L) for nickel and near nanograms per litre for cobalt. Quantification of these low metal concentrations is needed to provide reasonably constrained estimates of metals concentrations in the tailings storage facility.
A number of different approaches are available to quantify low levels of nickel and cobalt:
• The routine leachate analysis will achieve a reporting level of 0.0001 mg/L (100 ng/L). Should concentrations be undetected, detection limits of 50 ng/L can be obtained with additional processing effort using the same routine method.
• Specialist methods can achieve lower detection limits. These are non-routine (for example, evaporation to increase concentrations) and will need to be developed as the need arises.
• Existing testwork demonstrates that good correlations exist between cobalt and nickel concentrations in leachates. Detectable nickel concentrations can be used to estimate cobalt concentrations if this relationship can be demonstrated.
• In the event of undetectable low levels, a scale-up methodology will be agreed upon with MDNR to translate non-detectable concentrations to tailings concentrations. Detection limit values will be used in modeling calculations.

SRK Consulting Flotation Tailings and Hydrometallurgical Residue Geochemical Characterization Plan Page 12
SJD/sdc 1UP005 001_tailings_plan_20060510.SJD.doc, May. 10, 06, 3:01 PM May 2006
Table 3: List of Parameters for Low Level Analysis of Humidity Cell Leachates
Parameter Reporting Limit Parameter Reporting Limit
pH (standard units) - Acidity 1
Conductivity (µS/cm) 1 Alkalinity 1
Chloride 0.2 Sulfate 0.5
Fluoride 0.05 Total Inorganic Carbon 1
ORP (mV) -
Dissolved Elements (mg/L)
Aluminum 0.001 Mercury 0.000052
Antimony 0.0001 Molybdenum 0.00005
Arsenic 0.0001 Nickel 0.0001 (0.00005)1
Barium 0.0001 Potassium 0.02
Beryllium 0.0002 Selenium 0.0002
Bismuth 0.0002 Silicon 0.05
Boron 0.005 Silver 0.00005
Cadmium 0.00004 Sodium 0.01
Calcium 0.01 Strontium 0.0001
Chromium 0.0002 Tellurium 0.0002
Cobalt 0.0001 (0.00005)1 Thallium 0.00002
Copper 0.0001 Thorium 0.0001
Iron 0.01 Tin 0.0001
Lead 0.00005 Titanium 0.0002
Lithium 0.0002 Uranium 0.00005
Magnesium 0.005 Vanadium 0.0002
Manganese 0.00005 Zinc 0.001
Notes: 1. Low detection limits are available for cobalt and nickel as shown.
2. Lower level mercury analyses will be performed on selected samples.
3.4 Analysis of Remaining Sample Following Dissolution Tests
Analyses of the remaining sample following dissolution tests will be considered depending on the results obtained from the tests. Generally, these analyses can be of value if the test has undergone a major chemical change during the procedure (e.g. change from alkaline to acidic leachate) or if calculations indicate that a large quantity of one or more minerals or elements has been depleted. These is little value in post-test analysis if the depletion quantity is less than the uncertainty that can be expected from sampling of the test residue analysis. Experience also indicates that mineralogical analyses are also of little value unless weathering processes have had a detectable effect on the sample.

SRK Consulting Flotation Tailings and Hydrometallurgical Residue Geochemical Characterization Plan Page 13
SJD/sdc 1UP005 001_tailings_plan_20060510.SJD.doc, May. 10, 06, 3:01 PM May 2006
Therefore, residue analyses will be performed if:
• A large drop in pH has occurred (for example, from above 7 to below 5).
• Depletion calculations indicate that more than 10% of an important component was removed during the procedure.
Residue analyses will consist of the same procedures performed prior to the test.
3.5 Quality Assurance/Quality Control
A Quality Assurance Project Plan (QAPP) is being prepared for this project. To summarize, QA/QC includes the following components:
• Roughly 10% of all solids analyses will be performed in duplicate as sample availability permits.
• Roughly 10% of all cell and reactor tests will be run as duplicates if sufficient test material is available.
• A blank cell and reactor containing no sample will be operated to check for contamination of leachates by construction materials.
• Individual leachate results will be reviewed.
• Ion balances on leachate results will be reviewed. In general, imbalances of ±10% are considered acceptable. Re-analysis if requested depending on the nature of the imbalance.
• Data trends in kinetic test leachates will be analysed to check for anomalies.

SRK Consulting Flotation Tailings and Hydrometallurgical Residue Geochemical Characterization Plan Page 14
SJD/sdc 1UP005 001_tailings_plan_20060510.SJD.doc, May. 10, 06, 3:01 PM May 2006
4 Use of Data for Water Quality Predictions
4.1 Introduction
The data obtained from these programs will be used to estimate water quality during operation and closure. The following sections describe the application of the data to making water chemistry predictions.
4.2 Operational Water Quality
4.2.1 Flotation Tailings
Operational water quality in flotation tailings impoundments tends to be dominated by process water since this is the largest volume of water moving into and out of the impoundment by discharge and reclaim. Processes resulting from oxidation are not usually significant because continual placement of fresh tailings covers up older tailings before extensive weathering is initiated. The tailings pond water and trapped pore waters therefore reflect re-circulating process water. Seepage from the impoundments typically has a process water signature modified by anoxic conditions in the saturated tailings and interaction with LTVSMC taconite tailings.
Seepage chemistry will also be influenced by dam construction, particularly whether drains will be needed for stability. If drains are needed, water will be drained horizontally away from the dams, rather than the normal vertical seepage thru the coarse fraction of tailings near the dam.
The method used to estimate tailings pond water during operations is typically a coupled water and load balance that evaluates the effect of build-up of solutes in the tailings pond water due to interactions (e.g. mineral dissolution), reagent addition in the process, unintended additions in the process (e.g. Mo from lubricants), dilution due to rain and snowfall, dilution by run-in, and solute load loss due to encapsulation. If kinetic testing shows a short term leaching effect from beaches and dam faces, these loads are included.
The effect of interaction of saturated tailings with LTVSMC tailings will be evaluated directly by column tests (Appendix F). These tests will indicate whether any significant losses or additions occur as process water moves through the taconite tailings.
4.2.2 Leach Residues
Rinsed leach residues are expected to be relatively soluble and water chemistry associated with the residues will be dominated by equilibration of rinse. Water quality may be affected by the method of disposal (pumped slurry vs truck hauled solids). Since the residues will be continually accumulated, the operational water chemistry will be a result of mixing of rinsate water with precipitation and run-in. The chemistry of contact water during operation will be estimated directly from dissolution test results. Pore water chemistry indicated by testwork will be evaluated using MINTEQA2 or similar thermodynamic equilibrium models.
The effect of small amounts of sulfide minerals in the leach residues will be evaluated.

SRK Consulting Flotation Tailings and Hydrometallurgical Residue Geochemical Characterization Plan Page 15
SJD/sdc 1UP005 001_tailings_plan_20060510.SJD.doc, May. 10, 06, 3:01 PM May 2006
4.3 Water Quality at Closure and Post Closure
4.3.1 Flotation Tailings
At closure, the main effect is removal of inflows of process water and on-set of oxidation of tailings resulting in metal and possibly acidity loadings. The water and load balance developed for operational conditions is typically modified to evaluate these effects.
The long term closure modeling will need to consider evolution of the tailings profile in response to oxidation. This type of modelling uses humidity cell weathering rates, tailings physical characteristics, and moisture profiles predicted by modelling (HELP and HYDRUS-2D) as inputs. The propagation of the oxidation front and acidity front through the tailings is predicted and used to model the movement of solutes. The migration of the fronts can be used to estimate changes in solute loading in the future due to arrival of chemical fronts at the base of tailings. This type of modeling can be coupled with groundwater models to predict the chemistry of groundwater leaving the site.
4.3.2 Leach Residues
Water associated with the leach residues is expected to evolve as rinsate is displaced by dilute water from rainfall and snowmelt. Humidity cells will show whether this results in changing water quality. Concentrations indicated from humidity cells may be suitable for direct prediction of water chemistry or may be adjusted using MINTEQA2 or similar thermodynamic equilibrium models.

SRK Consulting Flotation Tailings and Hydrometallurgical Residue Geochemical Characterization Plan Page 16
SJD/sdc 1UP005 001_tailings_plan_20060510.SJD.doc, May. 10, 06, 3:01 PM May 2006
5 References
MEND, 1991. Acid Rock Drainage Prediction Manual. Mine Environment Neutral Drainage Program. Report 1.16.1b.
Nevada Division of Environmental Protection, 1996. Meteoric Water Mobility Procedure (MWMP) Standardized Column Test Procedure. NDEP publication MWMP.ltr. May 3 1996. 6p.
Price, W. 1997. Draft Guidelines and Recommended Methods for the Prediction of Metal Leaching and Acid Rock Drainage at Minesites in British Columbia. Reclamation Section, British Columbia Ministry of Energy and Mines. April 1997.
Sobek A A, Schuller W A, Freeman J R, and Smith R M., 1978. Field and Laboratory Methods Applicable to Overburden and Minesoils. USEPA Report No. 600/2-78-054, 203 pp.

Appendix A
Process Flow Sheets

FIGURE 1POLYMET FEASIBILITY STUDYCOMMINUTION AND FLOTATIONSCHEMATIC FLOW DIAGRAM
METALSBATEMAN
PROCESSWATERTANK
(1)FLOAT TAILINGS
FLOTATION TAILSTHICKENER
(2)
CONCENTRATETHICKENER
(1)
ROUGHERCONDITIONING
TANK(2)
PAX
FLOCCULANT
FLOCCULANT
APRONFEEDER
(4)
COARSE CRUSHERDUMP POCKET
ORECAR TIPPER
PRIMARYCRUSHER
(1)
PRIMARY CRUSHERPRODUCT POCKET
SECONDARYCRUSHER
(4)
COARSEORE BIN FINE ORE
BIN
FEEDER(132)
ROD MILL(12)
BALL MILL(12)
PRIMARYCYCLONE
(36)
RODS
BALLS
REGRINDMILL(3)
CLEANER 1CONDITIONING
TANK(1)
PAX
WW1572
ROUGHERFLOTATION
(4)
SCAVENGERFLOTATION
(12)
AIR MIBC AIR MIBC
PAX
REGRINDCYCLONE
(9)
AIRMIBC
PAXREGRINDHOPPER
(2)
AIR MIBC
WW1572
CLEANER 1FLOTATION
(8)
CLEANER 2FLOTATION
(4)
CONVEYOR
CONVEYOR
CONVEYOR
CONVEYOR
BELT FEEDER(6)
RETRACTABLECONVEYOR
(3)TERTIARYCRUSHER
(3)
VIBRATINGSCREEN FEEDER
(6)
FEED CHUTE(18)
QUARTERNARYCRUSHER
(6)
VIBRATINGSCREEN
(6)
CONCENTRATEGRINDING
TO AUTOCLAVEFEED TANKS
FINALCONCENTRATESURGE TANK
(2)
PAX
CLEANER 3CONDITIONING
TANK(1)
CLEANER 3FLOTATION
(4) (2)
(2)
BAB403-P-DX-003

FIGURE 2POLYMET FEASIBILITY STUDYHYDROMET PROCESS PLANTOPTION 1 - MIXED Ni/CoHYDROXIDE PRECIPITATIONSCHEMATIC FLOW DIAGRAM
METALSBATEMAN
OXYGEN
FINALGAS
SCRUBBER
AUTOCLAVEFLASH VESSEL
(3)AUTOCLAVE(3)
LEACHRESIDUE
THICKENER(1)THICKENER
(1)
COPPERELECTROWINNING
(160)
PRODUCTCOPPER
CATHODES
COPPERSTRIPPING
(2)
WASH(1)
HMPROCESS
WATERSERVICEWATER
LEACHRESIDUEFILTER
(3)
OXYGEN
RELEACHVESSEL
(2)
SERVICEWATER
HCl
AUTOCLAVEFEED TANK
(3)
PGMFILTER
(1)
LIMESTONE
H SO2 4
COPPEREXTRACTION
(3)
PRENEUTRALISATION
THICKENER(1)
HMPROCESS
WATER
GYPSUMFILTER
(1)
HMPROCESS
WATER
Fe/AlRESIDUE
TOREACTIVERESIDUES
Fe REMOVALTANK
(4)
LIMESTONE
AIR
STEAM
CuPRECIPITATION
TANK(3)
SERVICEWATER
CuSTHICKENER
(1)
NaHS
STEAM
MIXEDHYDROXIDEPRODUCT
1ST STAGEHYDROXIDE
PRECIPITATIONTANK
(3)
MgO
LIME
MgREMOVAL
TANK(4)
TOREACTIVERESIDUES
TO HM PROCESSWATER TANK
H SO42
CoSO4
GYPSUMRESIDUE
TO REACTIVERESIDUES
PRENEUTRALISATION
TANK(4)
GUARGUM
FLOCCULANT
FLOCCULANT
FLOCCULANT
FLOCCULANT
FLOCCULANT
COOLING TOWER
SERVICE WATER
FROM FINALCONCENTRATESURGE TANKS
HMPROCESS WATER
TANK
REACTIVE RESIDUES
BLOWDOWN TOFLOTATIONTAILINGS
HM PROCESS WATER
AIR
N2
SERVICEWATER
ORGANICMAKE-UP
LOADEDORGANIC
TANK
SERVICE WATER
EW MISTSCRUBBER
SERVICE WATER
TOATMOSPHERE
Fe REMOVALTHICKENER
(1)
Al REMOVALTANK
(2)
LIMESTONE
FLOCCULANT
AlREMOVAL
THICKENER(1)
HYDROXIDEFILTER
(1)
1ST STAGEHYDROXIDETHICKENER
(1)
MgREMOVAL
THICKENER(1)
PGMCONCENTRATE
FILTER(1)
VENTSFROM
ALL TANKS
BLEED
SERVICEWATER
LIME
FLOCCULANT
TO AUTOCLAVELET DOWN TANK
2ND STAGEHYDROXIDE
PRECIPITATIONTANK
(3) 2ND STAGEHYDROXIDETHICKENER
(1)
HEATEXCHANGER
AUTOCLAVEGAS SCRUBBER
(3)
SERVICE WATER
DISCHARGE TOSOLVENT EXTRACTION
Fe/AlREMOVAL
THICKENERFILTER
SOLIDS TOREACTIVE RESIDUESLIQUID TOLOADED ORGANIC TANK
CRUDREMOVAL
FLOCCULANT
RAFFINATENEUTRALISATION
THICKENER(1)
RAFFINATENEUTRALISATION
(3)
LIMESTONE
HM PROCESS WATER
RAFFINATENEUTRALISATION
FILTER(1)
GYPSUM RESIDUE
NaHS
PGMPRECIPITATION
(3)
TOATMOSPHERE
PRODUCTPGM
CONCENTRATE
BAB403-P-DX-004

Appendix B
Update on Sample Selection from 24 Hour Testwork

SRK Consulting (Canada) Inc.
Suite 800 – 1066 West Hastings Street
Vancouver, B.C. V6E 3X2
Canada
www.srk.com
Tel: 604.681.4196
Fax: 604.687.5532
Authors Initials/typist initials 1UP005.001_Tailings_HydroMet_Plan.doc, 1:46 PM, Dec. 21, 05
Memo To: Jennifer Engstrom, MDNR Date: January 6, 2006
cc: John Borovsky, Barr Jim Scott, PolyMet Don Hunter, PolyMet
From: Stephen Day
Subject: NorthMet Project Tailings and Hydromet Residue Testwork – Update on Sample Selection from 24 Hour Testwork
Project #: 1UP005.001
Jennifer We have now received the 2-hourly tailings total sulfur analyses from the pilot plant testwork. These results allow final recommendations to be made for the selection of samples for tailings and hydrometallurgical testwork.
1 Results and Implications of 2-Hourly Sulfur Analyses
Results of the 2-hourly sulfur analyses are shown by the coloured solid lines in Figure 1. The broken horizontal lines are the concentration of sulfur in the composite tailings samples currently being tested in humidity cells. The sulfur content of the ore composites was very uniform (Parcel 1, 2 and 3, 0.86%, 0.9% and 0.86%, respectively) as shown by the solid black lines in Figure 1. The trend in sulfur results in tailings is explained by the chronology of the testwork and evaluation of addition of copper sulfate as a reagent:
• Flotation testwork began on July 17 with Parcel 2 without the use of copper sulfate. Parcel 2 was processed entirely without using copper sulfate. As shown, sulfur concentrations varied from 0.05% to 0.25% reflecting adjustment of the process conditions early in the testwork. The average was 0.19%. The composite tailings sample has a sulfur content of 0.2% closely representing the average.
• Testwork continued with Parcel 1 without using copper sulphate. Processing was continuous so one point is shared between Parcel 2 and Parcel 1. The range of sulfur concentrations was 0.19% to 0.28% with an average of 0.24%. The composite sample was 0.23% and is close to the average.
• Pilot plant testwork was suspended on July 19 to allow for further bench scale testing on recovery of metals.
• The pilot plant resumed on August 8 using Parcel 1. Addition of copper sulfate was evaluated. This reagent causes activation of the sulfide mineral surfaces and improves bulk sulfide flotation. The effect of copper sulfate on tailings characteristics was immediately apparent for Parcel 1.

SRK Consulting Page 2 of 4
Authors Initials/typist initials 1UP005.001_Tailings_HydroMet_Plan.doc, 1:46 PM, Dec. 21, 05
Total sulfur concentrations decreased to a range of 0.09% to 0.13% (average 0.1%) and the resulting tailings composite was 0.1%.
• Processing continued with Parcel 3 using the copper sulfate additive. Sulfur content of the tailings varied over a wider range (0.09% to 0.25%, average 0.18%) though the range was comparable to the total range indicated by processing of other ore packages. The resulting composite had a total sulfur content of 0.15%.
CuS
O4 N
ot
Use
d
Sta
rt C
uS
O4
Use
0
0.1
0.2
0.3
0.4
0.5
0.6
0.7
0.8
0.9
1
12:00 0:00 12:00 0:00 12:00 0:00 12:00 0:00 12:00
Time
To
tal S
, % Parcel 2
Parcel 1
Parcel 3
July 17th to 19th, 2005 August 8th to 10th, 2005
Figure 1. Results of 2-Hourly Total Sulfur Analyses. Solid lines and points connect 2-hourly results. Broken solid lines are sulfur concentrations in composite tailings samples representing each stage of testwork. Solid horizontal lines are the respective ore composite sulfur contents.
Based on the process testwork, Polymet has the made decision to advance the project with the use of copper sulfate to optimize overall sulfide mineral flotation. This decision is beneficial for the tailings since it is expected to lower the overall sulfide content. The process testwork showed that sulfur concentrations in the tailings can be expected to vary in response to changes in process conditions including the use of copper sulfate. Parcel 3 showed that the use of copper sulfate may not always result in low sulfur content in tailings, and therefore there is need to capture sulfur concentrations approaching 0.25% in the kinetic testwork. The samples generated without copper sulfate provide the required range and can be tested to represent the potential for higher sulfur concentrations in the tailings. The lack of copper sulfate for the Parcel 2 and 1 samples is not expected to have significantly affected the reactivity of the residual sulfide minerals in the tailings: It is therefore concluded that:
• Kinetic testing of all four tailings samples should be continued. • No additional samples are needed to represent the range of sulfur content expected in tailings.

SRK Consulting Page 3 of 4
Authors Initials/typist initials 1UP005.001_Tailings_HydroMet_Plan.doc, 1:46 PM, Dec. 21, 05
2 Testing of HydroMet Residues
2.1 Source of Sulfide Concentrate for Hydromet Process Evaluation
Evaluation of the hydromet process was performed using two bulk sulfide concentrates produced by processing of ore parcels 2 and 1 (without copper sulfate) and ore parcels 1 and 3 (with copper sulfate). The sulfide concentrates contained the following total sulfur concentrations:
• No Copper Sulfate o Parcel 2 – 23.6% o Parcel 1 – 21.3%
• With Copper Sulfate o Parcel 1 – 22.1% o Parcel 3 – 21.6%
It is apparent that the sulfur content of the concentrates does not vary significantly though the effect of copper sulfate on concentrate sulfur content for Parcel 1 is apparent and corresponds with the matching decrease in sulfur content of the tailings. Since the decision has been made to proceed with the use of copper sulfate, only the residues produced from sulfide concentrate generated using copper sulfide should be tested.
2.2 HydroMet Residues
All the expected HydroMet Residues were produced by processing of the sulfide concentrate generated using copper sulfate. A difference exists between the way that the residues were recovered in the pilot test compared to actual operating conditions. To summarize, the first step in the process is the leaching of the sulfide concentrate to produce a low pH pregnant solution containing all the commodity metals. Subsequent recovery of the metals involves a series of pH adjustments to the leach solution that results in precipitation of products and residues. The products are then refined to recover the contained metals (copper, nickel, cobalt, PGM, zinc). The residues contain entrained leach solutions that have to be recovered to optimize recovery of commodity metals. Under full-scale operating conditions, recovery of the leach solutions from the residues will occur by rinsing the residue cakes with pH-adjusted re-cycled final process water to displace the leach solutions. The pH adjustment is required to ensure that metals in the leach solution are not lost to the solids. However, under pilot plant conditions, the recycled process water was not available because the processing of the leach solutions occurred in a stepwise rather than continuous fashion. Each metal recovery step was performed and completed before proceeding to the next. The final process solution that will be used for rinsing at full-scale was only generated at the end of the pilot plant and was therefore not available for the residue rinsing steps. The difference between full-scale and pilot plant conditions represents a practicality of metallurgical testing in that operation the pilot plant continuously is not an option with the available quantity feed concentrate. Residues generated by the pilot plant were rinsed with locally obtained river water. No additional rinsing of the residues is proposed for the dissolution testwork. Rinsing with river water was less aggressive in displacing metal-laden leach solutions than can be expected with pH-adjusted process water. The residues can therefore be expected to contain higher metal content than under operating conditions and indicate greater leachable metals in dissolution tests. The testwork will tend to over-estimate rather than under-estimate water quality for water management planning and impact assessment.

SRK Consulting Page 4 of 4
Authors Initials/typist initials 1UP005.001_Tailings_HydroMet_Plan.doc, 1:46 PM, Dec. 21, 05
3 Conclusions
The following actions are proposed:
• Kinetic testing of all four existing tailings samples in dissolution tests will continue. • Testing of residues produced by hydromet testing of sulfide concentrate (with copper sulfate)
will be started as described in the “Flotation Tailings and Hydrometallurgical Residue Geochemical Characterization Plan”

Appendix C
Parameter Lists and Detection Limits for Analysis of Solids

ALS/CHEMEX METHOD CODE ITEM UINTS CHEMEX DETECTION LIMIT
ME-ICP61 (four acid) CU% % 0.001
ME-ICP61 (four acid) NI% % 0.001
S-IR08 (LECO SULFUR) S%TOT % 0.01
ME-ICP61 (four acid) S%ICP % 0.01
PGM-ICP23 (30 GRAM) PT_PPB PPB 5
PGM-ICP23 (30 GRAM) PD_PPB PPB 1
PGM-ICP23 (30 GRAM) AU_PPB PPB 1
ME-ICP61 (four acid) CO_PPM PPM 1
ME-ICP61 (four acid) AG_PPM PPM 0.5
ME-ICP61 (four acid) ZN_PPM PPM 2
ME-ICP61 (four acid) CD_PPM PPM 0.5
ME-ICP61 (four acid) MO_PPM PPM 1
ME-ICP61 (four acid) PB_PPM PPM 2
ME-ICP61 (four acid) AS_PPM PPM 5
ME-ICP61 (four acid) CR_PPM PPM 1
ME-ICP61 (four acid) V_PPM PPM 1
ME-ICP61 (four acid) TI% % 0.01
ME-ICP61 (four acid) AL% % 0.01
ME-ICP61 (four acid) CA% % 0.01
ME-ICP61 (four acid) FE% % 0.01
ME-ICP61 (four acid) K% % 0.01
ME-ICP61 (four acid) NA% % 0.01
ME-ICP61 (four acid) MG% % 0.01
ME-ICP61 (four acid) MN_PPM PPM 5
ME-ICP61 (four acid) P_PPM PPM 10
ME-ICP61 (four acid) BA_PPM PPM 10
ME-ICP61 (four acid) BE_PPM PPM 0.5
ME-ICP61 (four acid) BI_PPM PPM 2
ME-ICP61 (four acid) SB_PPM PPM 5
ME-ICP61 (four acid) SR_PPM PPM 1
ME-ICP61 (four acid) W_PPM PPM 10

ALS/CHEMEX METHOD CODE ITEM UINTS CHEMEX DETECTION LIMIT
ME-ICP41 (Aqua regia digestion) CU% % 0.001
ME-ICP41 (Aqua regia digestion) NI% % 0.001
ME-ICP41 (Aqua regia digestion) S%ICP % 0.01
ME-ICP41 (Aqua regia digestion) CO_PPM PPM 1
ME-ICP41 (Aqua regia digestion) AG_PPM PPM 0.2
ME-ICP41 (Aqua regia digestion) ZN_PPM PPM 2
ME-ICP41 (Aqua regia digestion) CD_PPM PPM 0.5
ME-ICP41 (Aqua regia digestion) MO_PPM PPM 1
ME-ICP41 (Aqua regia digestion) PB_PPM PPM 2
ME-ICP41 (Aqua regia digestion) AS_PPM PPM 2
ME-ICP41 (Aqua regia digestion) CR_PPM PPM 1
ME-ICP41 (Aqua regia digestion) V_PPM PPM 1
ME-ICP41 (Aqua regia digestion) TI% % 0.01
ME-ICP41 (Aqua regia digestion) AL% % 0.01
ME-ICP41 (Aqua regia digestion) CA% % 0.01
ME-ICP41 (Aqua regia digestion) FE% % 0.01
ME-ICP41 (Aqua regia digestion) K% % 0.01
ME-ICP41 (Aqua regia digestion) NA% % 0.01
ME-ICP41 (Aqua regia digestion) MG% % 0.01
ME-ICP41 (Aqua regia digestion) MN_PPM PPM 5
ME-ICP41 (Aqua regia digestion) P_PPM PPM 10
ME-ICP41 (Aqua regia digestion) B_PPM PPM 10
ME-ICP41 (Aqua regia digestion) BA_PPM PPM 10
ME-ICP41 (Aqua regia digestion) BE_PPM PPM 0.5
ME-ICP41 (Aqua regia digestion) BI_PPM PPM 2
ME-ICP41 (Aqua regia digestion) GA_PPM PPM 10
ME-ICP41 (Aqua regia digestion) HG_PPM PPM 1
ME-ICP41 (Aqua regia digestion) LA_PPM PPM 10
ME-ICP41 (Aqua regia digestion) SB_PPM PPM 2
ME-ICP41 (Aqua regia digestion) SC_PPM PPM 1
ME-ICP41 (Aqua regia digestion) SR_PPM PPM 1
ME-ICP41 (Aqua regia digestion) W_PPM PPM 10
ME-ICP41 (Aqua regia digestion) TL_PPM PPM 10
ME-ICP41 (Aqua regia digestion) U_PPM PPM 10

ALS/CHEMEX METHOD CODE ITEM UINTS CHEMEX DETECTION LIMIT
ME-ICP06--whole rock geochemisrty by ICP-AES SIO2 % 0.01
ME-ICP06--whole rock geochemisrty by ICP-AES AL203 % 0.01
ME-ICP06--whole rock geochemisrty by ICP-AES TIO2 % 0.01
ME-ICP06--whole rock geochemisrty by ICP-AES FE2O3 % 0.01
ME-ICP06--whole rock geochemisrty by ICP-AES CAO % 0.01
ME-ICP06--whole rock geochemisrty by ICP-AES MGO % 0.01
ME-ICP06--whole rock geochemisrty by ICP-AES MNO % 0.01
ME-ICP06--whole rock geochemisrty by ICP-AES NA2O % 0.01
ME-ICP06--whole rock geochemisrty by ICP-AES K2O % 0.01
ME-ICP06--whole rock geochemisrty by ICP-AES P2O5 % 0.01
ME-ICP06--whole rock geochemisrty by ICP-AES BAO % 0.01
ME-ICP06--whole rock geochemisrty by ICP-AES SRO % 0.01
ME-ICP06--whole rock geochemisrty by ICP-AES LOI % 0.01

Appendix D
Options and Variance in ASTM Humidity Cell Procedure

NorthMet Project Description of ASTM D 5744 – 96 (Reapproved 2001) and Modifications Page 1 Standard Test Method for Accelerated Weathering of Solid Materials Using a Modified Humidity Cell September 23, 2005
SRK Consulting
9. Sample Preparation
Section ASTM Procedure Description Description of CEMI Procedure
NA – Not applicable to this Project ASTM – ASTM Procedure Followed
CEMI Variance from ASTM
9.1 Air dry as-received bulk samples of solid material to prevent the additional oxidation of reactive minerals or compounds. If air drying is not practicable, oven dry the solid material at a maximum temperature of 50 ± 2°C for 24 h, or until a constant weight is reached.
Samples were air-dried at room temperature (~ 20 °C).
9.1.1 If exploration-generated or run-of-mine solid material samples are not readily available, archived dried and crushed samples from geological exploratory or development drilling programs may be used for preliminary evaluations of ore and waste rock from new operations; this is provided that the available solid material samples are not significantly finer than 95 % passing a No. 12 (1.7-mm) sieve. Document the sample drying and preparation procedures used during the drill sampling program in order to interpret the results properly. Evaluate the effects of drying temperature on metals volatilization (for example, mercury in cinnabar vaporizes at temperatures exceeding 80 to 90°C) and mineral morphology and chemistry modifications (for example, on heating at temperatures exceeding 100°C, chalcocite changes crystal form and is oxidized subsequently from Cu2S to CuO, CuSO4, and SO2). Especially ensure that the effects of particle size distribution changes resulting from the more finely crushed sample are considered in the interpretation (this is, the potential for increased liberation of acid-producing and acid-consuming minerals with an attendant increase in mineral surface area).
NA
9.1.2 In mining waste evaluations, the particle size for mill tailings will be significantly finer (commonly less than 150 µm/100 mesh) than the particle size distributions from ore and waste rock. Pilot plant tailings should be used if mill tailings are not available.
NA
9.2 Screen the air-dried bulk samples through a 6.3-mm (¼-in.) screen in accordance with Test Method E 276. Crush any oversize material so that 100 % passes the screen.
NA

NorthMet Project Description of ASTM D 5744 – 96 (Reapproved 2001) and Modifications Page 2 Standard Test Method for Accelerated Weathering of Solid Materials Using a Modified Humidity Cell September 23, 2005
SRK Consulting
Section ASTM Procedure Description Description of CEMI Procedure NA – Not applicable to this Project ASTM – ASTM Procedure Followed
CEMI Variance from ASTM
Note 7 Caution: Recent accelerated weathering studies of run-of mine waste rock from metal mines demonstrate that crushing a bulk sample so it passes a 6.3-mm (¼-in.) screen may change the character of the sample by artificially increasing liberation and consequent surface areas of acid-producing and acid-consuming minerals contained in the + 6.3-mm (¼-in.) material. A suggestion for avoiding this problem is to segregate the - 6.3-mm (¼-in.) fraction by screening rather than crushing, and to test that fraction according to the protocol and equipment described in this text. The + 6.3-mm (¼-in.) material can be tested separately (for example, Brodie, et al (10) describe a large-scale humidity cell test that would accommodate – 75-mm material). Samples from the drill core and cuttings also present material sizing problems, which must be considered when interpreting drill core and cuttings accelerated data. The drill core must be crushed to -6.3-mm (¼-in.) to fit the cell described in this test method. The resulting size distribution from crushing will differ from that of run-of-mine due to differences in fracture patterns inherent to blasting practices that produce run-of-mine material. By contrast, drill cuttings size fractions are commonly less than 6.3-mm (¼-in.) due to the rotary-percussive nature of obtaining the sample.
NA
9.3 Mix and divide the bulk sample to obtain a representative test unit with a weight in the range of 8 to 10 kg, using a riffle splitter with 1-in. (2.54-cm) chutes. Divide the test unit into eight nominal 1-kg specimens. Seal each test specimen in a moisture-barrier bag.
NA
Note 8 The dried sample should be mixed through the riffle splitter at least once before making any splits; recombine the splits resulting from the sample mixing exercise by pouring individual splits either over each other or through the splitter again. Once the actual split is made, it is wise to re-mix it (according to the above procedure) prior to making the next split.
Samples were mixed through the riffle splitter once.
9.4 Select one test specimen at random, and determine the moisture content by weighing and drying to constant weight at 80 ±5°C.
Determined at 20 °C
9.4.1 Crush the dried test specimen so that at least 95 % passes a 1.7-mm (10-mesh) screen, in accordance with Test Method E 276.
NA

NorthMet Project Description of ASTM D 5744 – 96 (Reapproved 2001) and Modifications Page 3 Standard Test Method for Accelerated Weathering of Solid Materials Using a Modified Humidity Cell September 23, 2005
SRK Consulting
Section ASTM Procedure Description Description of CEMI Procedure NA – Not applicable to this Project ASTM – ASTM Procedure Followed
CEMI Variance from ASTM
9.4.2 Divide the crushed test specimen in half twice, using a riffle splitter with 6.35-mm (¼-in.) chutes, and select a ¼ subsample at random.
NA
9.4.3 Transfer the selected subsample to a ring and puck grinding mill and grind to a nominal of 95 % passing a 150-µm (100-mesh) screen, in accordance with Test Method E 276. Use the subsample for chemical and mineralogical characterization of the test unit.
NA
9.5 Select one test specimen at random, and determine the particle size distribution in accordance with Test Method E 276.
ASTM
9.6 Select one test specimen at random for use in the accelerated test method. Divide the test specimen into four nominal 250-g subsamples using the riffle splitter with 25.4-mm (1-in.) chutes, and label and store in vapor-barrier bags until it is time to load the humidity cells.
NA
9.7 Reserve the remaining test specimens for replicated testing or to resolve disputed results.
NA

NorthMet Project Description of ASTM D 5744 – 96 (Reapproved 2001) and Modifications Page 4 Standard Test Method for Accelerated Weathering of Solid Materials Using a Modified Humidity Cell September 23, 2005
SRK Consulting
10. Apparatus Assembly
Section ASTM Procedure Description Description of CEMI Procedure
NA – Not applicable to this Project ASTM – ASTM Procedure Followed
CEMI Variance from ASTM
10.1 The humidity cells are table-mounted at a height sufficient to accommodate the placement of both the humidifier and one Erlenmeyer flask for effluent collection from the bottom of each cell. During the water-saturated and dry-air portions of each weekly cycle, feed air is metered to the bottom of each cell at the selected rate (1 to 10L/min). Feed air for the three-day dry–air portion is routed first through a desiccant column and then to each of the cells through a dry-air manifold. Feed air for the water-saturated air portion is routed through a water-filled humidifier by means of aeration stones or gas dispersion fritted cylinders/disks, and then to each humidity cell lid air exit port to prevent the short circuiting of air through cells containing more permeable solid material samples. A separatory funnel rack is mounted on the table that holds the cells if the weekly water leach is applied dropwise (drip trickle). Multiple separatory funnels (one for each cell) are held in the rack during the drip trickle leach that is performed on the seventh day of each weekly cycle. The separatory funnel can be used to meter the required water volume slowly down the sides of the cell wall until the sample is flooded if the weekly leach is to be a flooded leach.
Humidity cells are constructed of acrylic tubing with an inside diameter of four inches and an overall height of twelve inches, with an acrylic base plate. The base plate is glued to the tube and threaded with a nylon hose adapter to which a length of tubing is attached to allow for leachate drainage into a collection container. A perforated PVC support plate is positioned inside the cell, one inch above the base plate and covered with six layers of nylon mesh. A nylon adapter is threaded into the side of the cell between the support plate and the base plate and a length of tubing was connected from the side adapter to the humidifier to facilitate the inflow of humid air to the cell. A dry air line is also connected to each cell. Each cell is covered with a removable acrylic lid.
Approximately 16 cells per humidifier Flood leaching: peristaltic pump using a peristaltic pump Temperature: 20 ± 2°C. Feed air rate to be determined.

NorthMet Project Description of ASTM D 5744 – 96 (Reapproved 2001) and Modifications Page 5 Standard Test Method for Accelerated Weathering of Solid Materials Using a Modified Humidity Cell September 23, 2005
SRK Consulting
11. Procedure
Section ASTM Procedure Description Description of CEMI Procedure
NA – Not applicable to this Project ASTM – ASTM Procedure Followed
CEMI Variance from ASTM
11.1 Cell Loading: 11.1.1 If more than one humidity cell is used at one time, label each with a
sequential number, and use the same number for the matching collection vessel (Erlenmeyer flask).
ASTM
11.1.2 Weigh each humidity cell (without its lid) and each collection vessel; record the tare weights of each to the nearest 0.1 g.
ASTM
11.1.3 Cut the filter media (such as 12-oz/yd2 polypropylene described in 6.11) to the humidity cell’s inside diameter dimensions so that it fits snugly yet lies flat on the perforated support.
Shark Skin filter paper (320mm)
11.1.4 Re-weigh the humidity cell, and record the resulting tare to the nearest 0.1 g; the original cell tare (11.1.2) minus the new cell tare is the weight of the filter media.
ASTM
11.1.5 Transfer the contents from each of the four bags containing the 250-g samples (9.6) into the humidity cell. Prior to the transfer, mix the contents of each bag by gentle rolling to eliminate possible stratification that may have occurred during sample storage.
ASTM
11.1.6 Re-weigh the loaded cell, and record the weight to the nearest 0.1 g; the loaded cell weight minus the combined cell and filter-media tare weight is the weight of the sample charge.
ASTM
11.2 First Leach:

NorthMet Project Description of ASTM D 5744 – 96 (Reapproved 2001) and Modifications Page 6 Standard Test Method for Accelerated Weathering of Solid Materials Using a Modified Humidity Cell September 23, 2005
SRK Consulting
Section ASTM Procedure Description Description of CEMI Procedure NA – Not applicable to this Project ASTM – ASTM Procedure Followed
CEMI Variance from ASTM
11.2.1 The first leach (whether drip trickle or flooded), designated as the Week 0 leach, initiates the 20-week long humidity cell test and establishes the starting or initial characteristics of the leachate. Either a 500-mL or 1-L volume of water may be used for the weekly leachates, depending on the weekly pore volume desired or the quantity of solution required for analytical purposes; however, once a weekly volume has been selected, that weekly volume must remain constant throughout the 20-week testing period. A centrifuged cell culture of Thiobacillus ferrooxidans may be used in the first leach in order to ensure that optimum conditions for accelerates weathering are present at the beginning of the test.
500 mL Flood Leach
Note 9 In the testing of mining wastes, cation (including metals and trace metals) and anion loadings are commonly high in the Week 0 leachate due to the dissolution of pre-existing soluble oxidation salts present in the sample prior to sample collection. The average number of weekly accelerated weathering cycles required to flush these pre-existing salts ranges from 3 to 5 weeks. Oxidation products observed during these 3 to 5 weeks are principally from the pre-existing salts, while those products observed after this period are considered to be solely a function of the accelerated weathering procedure. A method for estimating the amount of pre-existing oxidation salts present in a solid material sample is described by Sobek, et al (6). A comparison of estimated salt storage data obtained using this method with the first thee weeks of humidity cell effluent loadings from three different samples is describes by White and Jeffers (7).
NA
11.2.2 Fill a separatory funnel with for each cell with de-ionized water using a volumetric flask. If the leach is to be performed using the drip trickle method, set each separatory funnel above its corresponding cell, and adjust the drip rate (approximately 3 to 4 L/min) so that the solid material sample is wetted thoroughly but not flooded.
NA
11.2.3 A minimum of 2 to 3 h is commonly required to complete the drip trickle leach.
NA

NorthMet Project Description of ASTM D 5744 – 96 (Reapproved 2001) and Modifications Page 7 Standard Test Method for Accelerated Weathering of Solid Materials Using a Modified Humidity Cell September 23, 2005
SRK Consulting
Section ASTM Procedure Description Description of CEMI Procedure NA – Not applicable to this Project ASTM – ASTM Procedure Followed
CEMI Variance from ASTM
11.2.4 If the leach is to be performed by flooding, the separatory funnel can be used to meter the selected water volume slowly down the sides of the cell wall until the sample is flooded. This application method reduces hydraulic agitation of the sample surface commonly caused by pouring liquid from an open-mouthed vessel. Alternatively, flooding may be accomplished by any application apparatus (for example, a peristaltic pump) that supplies the selected volume of leachant at a reasonable rate without causing agitation and suspension of the finer fractions contained in the sample charge.
ASTM
11.2.4.1 Allow the flooded cell to sit for a period of 1 h before draining the leachate into the Erlenmeyer collection flask. The 1-h leach time commences after all of the leachant has been placed in the cell. The solid material sample should be saturated and covered with leachant to a depth sufficient to maintain sample saturation. In testing mining wastes, the observed depth of leachant cover from a 500-mL flooded leach performed in 10.2-cm (4.0-in.) ID cells is approximately 2.5 cm (1.0 in.).
ASTM
11.2.5 The following is performed once the leaching process has been completed: to reduce the effects of evaporation, and to prevent the contamination of each cell by airborne contaminants, place the lids on their corresponding cells and let the cells complete the leachate draining process for the remainder of the leaching day and overnight.
ASTM
11.2.6 Disconnect the cells on the day following the leach, and weigh and record the weight of each cell and Erlenmeyer collection flask. Set each filled collection flask aside for leachate analyses. (Measurements of pH and Eh and sample preservation procedures must be performed as soon as possible after leachate collection.) Return each cell, replace the filled collection flasks with clean, tared Erlenmeyer flasks, hook up all connections, and begin the dry-air cycle.
ASTM
11.3 Dry-Air Cycle:

NorthMet Project Description of ASTM D 5744 – 96 (Reapproved 2001) and Modifications Page 8 Standard Test Method for Accelerated Weathering of Solid Materials Using a Modified Humidity Cell September 23, 2005
SRK Consulting
Section ASTM Procedure Description Description of CEMI Procedure NA – Not applicable to this Project ASTM – ASTM Procedure Followed
CEMI Variance from ASTM
11.3.1 The commencement of the three-day dry-air period marks the beginning of each new weekly cycle of the accelerated weathering humidity cell test; the first full-week cycle after the first leaching is designated Week 1; subsequent weeks (commencing with the second dry-air period) are designated as Week 2, Week 3 … . Week n, etc.
ASTM
11.3.2 To perform the dry-air cycle, feed air is metered to the humidity cell array with a flowmeter (see 6.3) set at a target rate in the range of 1 to 10 L/min per cell, depending on the objectives of the testing. The air flow rate must be checked daily and adjusted to the target value ± 0.5 L/min.
ASTM
11.3.3 Feed air from the flowmeter is routed first through a desiccant column and then to each of the sells through a dry-air manifold. Air exiting the desiccant column should have a relative humidity of less than 10 % as measured with a hygrometer (see 6.23).
ASTM
11.3.4 To maintain similar positive air pressure through the cells, attach a water-bubbling vessel to each humidity cell air exit port coming out of the humidity cell lid; a 50-mL Erlenmeyer flask with a rubber stopper containing a vent and air inlet tube serves as a simple and efficient bubbler.
ASTM
11.3.5 The dry air is passed through each humidity cell for three days. Air flow rates from each of the cells should be checked each day, recorded, and adjusted, if necessary. See also Note 10.
ASTM
11.4 Wet-Air Cycle: 11.4.1 The three-day wet-air period commences on the fourth day of each
weekly cycle. ASTM
11.4.2 To perform the wet-air cycle of the method, feed air is routed through a water-filled humidifier via aeration stones or gas dispersion fritted cylinders/disks and then to each humidity cell.
ASTM
11.4.3 The water temperature in the humidifier is maintained at 30 ± 2°C to ensure that the sparged air maintains a relative humidity of approximately 95 % as measured with a hygrometer (see 6.23) from one of the humidifier exit lines. Air flow rates to each of the cells should be checked each day, recorded, and adjusted, if necessary.
ASTM

NorthMet Project Description of ASTM D 5744 – 96 (Reapproved 2001) and Modifications Page 9 Standard Test Method for Accelerated Weathering of Solid Materials Using a Modified Humidity Cell September 23, 2005
SRK Consulting
Section ASTM Procedure Description Description of CEMI Procedure NA – Not applicable to this Project ASTM – ASTM Procedure Followed
CEMI Variance from ASTM
Note 10 It is good practice to measure the air flow rates and relative humidity of the air exiting each humidity cell during each day of the three-day dry- and wet-air periods; the measurements should be taken at the same time each day from the humidity cell air exit port; these measurements can be accomplished by installing a quick-disconnect fitting in the tubing that connects the air exit port to the bubbler.
NA
Note 11 Coals spoils in eastern states are commonly saturated; Caruccio (10) has suggested the following geographic control alternative to the dry-air versus saturated-air scheduling: (1) Eastern States Samples – Six days of saturated air (versus three days dry/three days wet); and (2) Western States Samples – Three days dry/three days wet.
NA
11.5 Subsequent Weekly Leaches: 11.5.1 A second leach with water is performed on the day following the end
of the three-day wet-air period (that is, day seven of the first weekly cycle). This leach marks the end of the first weekly cycle and is designated as the Week 1 leach.
ASTM
11.5.2 Subsequent leaches are designates as Week2, Week 3 … Week n, and they mark the end of the weekly cycle for that numbered week. Perform each weekly leach as described in 11.2.2 – 11.2.5. Weekly weighing of the test cells is optional.
ASTM No weekly weighing of the cells.
11.6 It is recommended that the weekly accelerated weathering cycles described in 11.2, 11.3, 11.4 and 11.5 be performed for a minimum of 20 weeks.
ASTM
Note 12 Additional weeks of accelerated weathering may be required to demonstrate the nature of the material, depending on the chemical composition of the solid material. For some metal mining wastes, researchers have shown that as much as 60 to 120 weeks of accelerated weathering data may be required to demonstrate the complete weathering characteristics of a particular sample (7, 12). The criteria for ending the testing may be site specific and should be agreed before initiating the testing.
ASTM
11.7 Leachate Analyses:

NorthMet Project Description of ASTM D 5744 – 96 (Reapproved 2001) and Modifications Page 10 Standard Test Method for Accelerated Weathering of Solid Materials Using a Modified Humidity Cell September 23, 2005
SRK Consulting
Section ASTM Procedure Description Description of CEMI Procedure NA – Not applicable to this Project ASTM – ASTM Procedure Followed
CEMI Variance from ASTM
11.7.1 Analyze the leachates for specific constituents or properties, or use them for biological testing procedures as desired, using (1) appropriate ASTM test methods or (2) methods accepted for the site where disposal will occur. Where no appropriate ASTM test method exists, other test methods may be used and recorded in the report, provided that they are sufficiently sensitive to assess potential water quality impacts at the proposed disposal site. Suggested minimum weekly analyses should include pH, Eh, conductivity, and selected metals could be analyzed less frequently (for example, at Weeks 0, 1, 2, 4, 8, 12, 16, and 20), especially if changes in leachate chemistry are slow. Whether visible phase separation during storage of the leachates occurs or not, appropriate mixing should be used to ensure the homogeneity of the leachates prior to their use in such analyses.
At the end of weekly cycle the volume of leachate collected is recorded. The leachate is filtered through a Gelman magnetic filter funnel fitted with a membrane filter with pore size of 0.45 microns and analyzed for the parameters listed in Table 2 of the RFP. Filtered leachate samples will be submitted to ALS Environmental/Cantest Ltd. for dissolved metals analysis as requested in Table 4 of the Waste Rock and Lean Ore Geochemical Characterization Plan. Conductivity, Eh, and pH are measured in the CEMI laboratory using standard procedures. An aliquot of filtered leachate is titrated with standardized sulphuric acid to pH 4.5 to calculate total alkalinity. Standardized sodium hydroxide is used to titrate an aliquot of leachate to pH 4.5 and to pH 8.3 to calculate total acidity. Analysis frequency: pH, cond, Eh every cycle; SO4, Cl, F, alkalinity, TIC, acidity cycle 0, 2, 4, 6 etc.; ICP-MS including Hg and Si cycle 0, 4, 8, 12, etc., ICP-ES including Si cycle 2, 6, 10, 14, etc.
11.7.2 Table 1 is an example of a spreadsheet format used for recording 20 weeks of leachate analytical data.
ASTM
11.7.3 Fig. 5 is an example of a method used to plot the temporal variation (by week) of leachate pH, sulfate load, and cumulative sulfate load from 21 weeks of accelerated load and release rates).
ASTM
11.8 Weathered Solid Material Analyses:

NorthMet Project Description of ASTM D 5744 – 96 (Reapproved 2001) and Modifications Page 11 Standard Test Method for Accelerated Weathering of Solid Materials Using a Modified Humidity Cell September 23, 2005
SRK Consulting
Section ASTM Procedure Description Description of CEMI Procedure NA – Not applicable to this Project ASTM – ASTM Procedure Followed
CEMI Variance from ASTM
11.8.1 Weigh the humidity cell after collection of the final effluent and completion of a three-day dry-air period.
ASTM
11.8.2 Transfer the weathered residue and filter media to a clean drying pan, and dry to constant weight at 50 ± 5°C. Record the final weight.
ASTM
Note 13 Perform any gross sample examination (for example, sample texture and weathering product mineralogic characterization) desired for the weathered residues prior to pulverization. To facilitate such an examination, empty the humidity cell contains into a clean drying pan carefully by pushing gently on the bottom of the perforated plate with a wooden dowel until the sample exits the cell mouth. The perforate plate is accessed through the humidity cell drain port.
NA
11.8.3 Identify and mark the top versus bottom portions of the sample for gross sampling purposes. Formations of cemented lumps of sample termed “ferricrete” that result from the accelerated weathering process arte common in iron-sulfide-mineral rich samples. Depending on the sample mineralogy, the degree of “ferricrete” cementation may vary vertically within the sample, and the investigator may wish to segregate the sample into upper, middle, and lower thirds to document and characterize such changes.
Procedure to be determined
11.8.4 After drying to constant weight and prior to splitting, use an instrument such as a rolling pin to break up cemented lumps in the sample (if the cemented lumps cannot be sufficiently reduced to pass through the chutes of a riffle splitter, remove, record, and weigh separately):
ASTM
11.8.4.1 Split the sample into halves using a riffle splitter with 2.54-cm (1-in.) chutes, and reserve one half to determine the particle size distribution in accordance with Test Method E 276.
Repeat same screen assay method as for pre-test characterization (s.9.5)
11.8.4.2 Split the remaining half sample into two quarters using a riffle splitter with 2.54-cm (1-in.) chutes, and submit one quarter for mineralogical characterization; pulverize the other quarter in either a ring-and-puck or disk-pulverizing machine to 95 % passing a 150-µm (100-mesh) screen in accordance with Test Method E 276.
Procedure to be determined
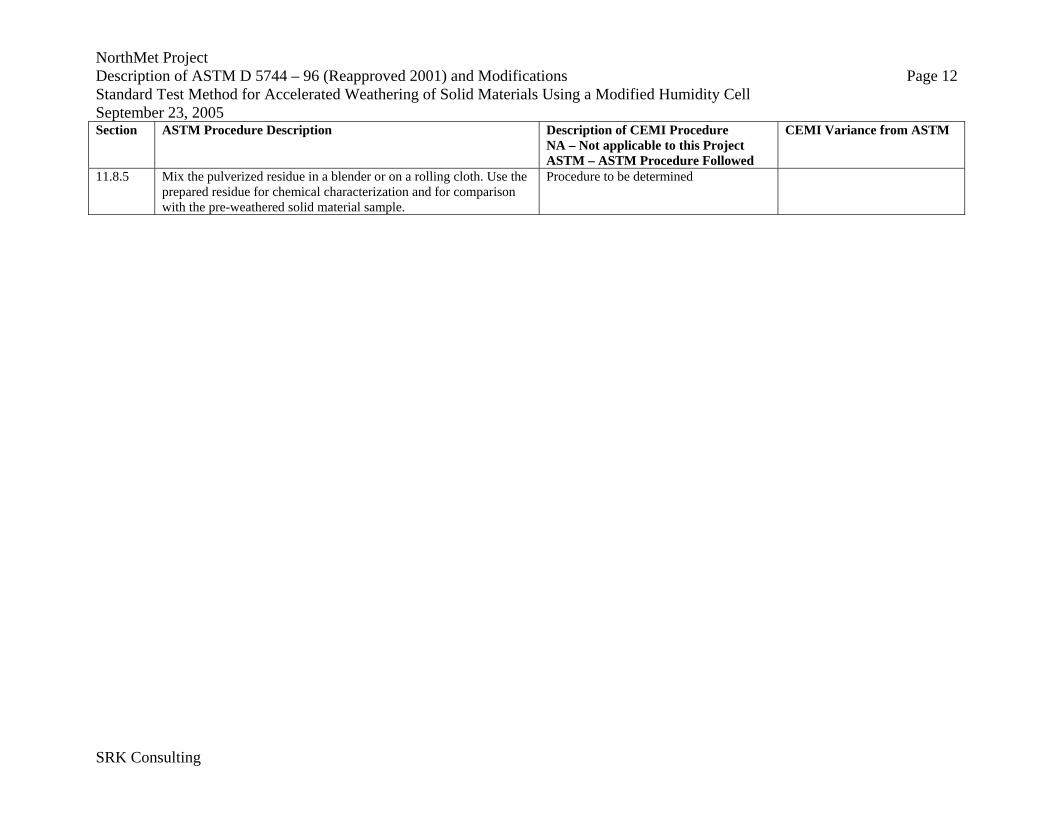
NorthMet Project Description of ASTM D 5744 – 96 (Reapproved 2001) and Modifications Page 12 Standard Test Method for Accelerated Weathering of Solid Materials Using a Modified Humidity Cell September 23, 2005
SRK Consulting
Section ASTM Procedure Description Description of CEMI Procedure NA – Not applicable to this Project ASTM – ASTM Procedure Followed
CEMI Variance from ASTM
11.8.5 Mix the pulverized residue in a blender or on a rolling cloth. Use the prepared residue for chemical characterization and for comparison with the pre-weathered solid material sample.
Procedure to be determined

Appendix E
Design of MDNR Reactor

1
Day, Stephen
From: Kim Lapakko [[email protected]]Sent: Tuesday, May 17, 2005 9:55 AMTo: Stephen DayCc: Dave Antonson; Jennifer Engstrom; Paul EgerSubject: RE: Small reactor
Attachments: MN DNR psize methods 050517.doc
MN DNR psize methods 050517.do..
Steve,
Attached is a description of the reactors, masses, and rinse volumes used for various sizefractions of Duluth Complex rock in our particle size experiment. As indicated in the attachment, I won't have access to the trace metal data from that experiment until tomorrow. I will need to examine this to help evaluate the expected metal concentrations in drainage relative to detection limits. I'm not sure it will give us as much as hoped because the sulfur contents of the samples typically were on the order of 0.9% to 1.3%. This may make extrapolation by more than an order of magnitude tenuous. It will be another pertinent piece of information.
Kim
>>> "Stephen Day" <[email protected]> 5/17/2005 11:18:50 AM >>>Dave
A design drawing should be fine along with description of the procedure.
The main question is what do you do to scale-up the sample mass as the particle size increases? I want to copy your procedure exactly.
ThanksSteve.
-----Original Message-----From: Kim Lapakko [mailto:[email protected]]Sent: Tuesday, May 17, 2005 8:38 AMTo: Stephen DayCc: Dave AntonsonSubject: Small reactor
Steve,
Dave Antonson will email a figure depicting our small reactor, along with some design details (perforated plate, adehesive, filter). He could also send a reactor. Please contact him directly, with an address to send it, if you think that would be helpful.
Kim

17 May 2005 Steve, In our particle size tests we used a small reactor and 75-g mass for particle sizes of –270, +270/-100, and +100/-35 mesh. We used the ASTM cell and 1000-g mass for +35/-10, +10/-0.25 inch, and +0.25/-0.75 inch particle sizes. For rinse volumes, we used 200 mL for the 75-g samples and 300 mL for the 1000-g samples. The 300-mL rinse volume was determined as the quantity of water, rounded up to the nearest 100 mL, required to submerge the solids. I won’t have access to the metal release data for the particle size experiment until tomorrow. As mentioned on the phone, sulfate release rates appear to vary linearly with surface area. It seems likely that nickel release rates will vary similarly, and I’ll look into this further tomorrow. Hopefully this information will shed some light on the maximum particle size question.

1
Day, Stephen
From: Dave Antonson [[email protected]]Sent: Tuesday, May 17, 2005 11:53 AMTo: Kim LapakkoSubject: reactor
Attachments: small reactor.doc
small reactor.doc (271 KB)
see if this makes any sense. you can edit it if you want. if it seems adequate you can forward it to steve. maybe he doesn't need a sample of the base.


The reactors were purchased from Millipore Corporation (1-800-645-5476). They are 47 mm Sterifil aseptic systems. You will need the 250 ml receiver flask, 250 ml funnel (top), silicone o-rings, and the filter holder base and support screen. The perforated acrylic plastic base was purchased as flat stock and fabricated to fit the top funnel. The plates are 1/8” thick, 2 1/4” in diameter and tapered to fit into the reactor top. Approximately sixteen 1/16” holes were drilled in the plate. The plate was glued into the reactor using acrylic solvent cement purchased from United States Plastics (1-800-537-9724). Catalog # 44629 for 5 oz. tube. The acrylic flat stock was also purchased from United States Plastics. After the plate is glued into the top of the reactor there should be approximatly a 3/8” gap between the bottom of the perforated plate and the top of the support screen of the filter unit. The filter that rests on the perforated plate is a 55 mm Whatman GF/A glass microfibre filter (catalog # 1820 055). Note: Before adding the solids to the filter you should wet the filter slightly with distilled water so no solids escape around the filter.

Appendix F
Design of Column Testing on Interaction between NorthMet and LTV Tailings

SRK Consulting (Canada) Inc.
Suite 800 – 1066 West Hastings Street
Vancouver, B.C. V6E 3X2
Canada
www.srk.com
Tel: 604.681.4196
Fax: 604.687.5532
Authors Initials/typist initials 1UP005.001_LTV_Tailigs.sd.20051208.doc, 1:44 PM, May. 2, 06
Memo To: Jennifer Engstrom, MDNR Date: December 8, 2005
cc: Kim Lapakko, MDNR Paul Eger, MDNR
From: Stephen Day
Subject: Design of Column Testing on Interaction Between NorthMet and LTV Tailings
Project #: 1UP005.001
Jennifer During our conference call on Oct 25, 2005, I agreed to provide design details for column testing to evaluate the effect of contact of leach waters from the NorthMet Tailings with LTV tailings when we received characterization data for the samples obtained from the LTV impoundment in September. Complete results have now been received. This memorandum describes: • Characteristics of LTV tailings. • Characteristics of available tailings sample material. • Proposed testwork. The original proposed program was described in a memorandum dated September 23, 2005. SRK is seeking comments from MDNR on this proposal. It is acknowledged, as we discussed during conference call that this column testwork may represent a preliminary assessment. Additional testing may be required as the design for the tailings basin progresses.
1 Characteristics of LTV Tailings
1.1 Sample Analysis
Seven holes were drilled in the tailings to a depth exceeding 60 feet using a geoprobe. Samples have been analyzed from five holes with tailings having the following textural characteristics: • GP-1 – Mainly coarse sand. • GP-2 – Interlayered fine sand and slimes. • GP-3 – Coarse sand grading into fine sand and slimes. • GP-4 – Interlayered coarse and fine sands. • GP-5 – Interlayered fine sand and slimes. Samples were obtained as core and shipped whole to Canadian Environmental and Metallurgical Inc. At the laboratory, all discrete textural layers were tested for rate of HCl reaction (ie a “fizz” test) and qualitative magnetism as an indicator of magnetite content. Samples were selected from each hole to to represent the surface material (ie potentially weathered) and two samples of each textural type from each hole. These samples were submitted for relative density, moisture content and particle size determinations, quantitative mineralogy by x-ray diffraction and chemical analysis.

SRK Consulting Page 2 of 6
Authors Initials/typist initials 1UP005.001_LTV_Tailigs.sd.20051208.doc, 1:44 PM, May. 2, 06
1.2 Results
Table 1 shows selected data sorted by the main textural groups (coarse sand, fine sand and slimes). The dominant mineral in all samples was quartz which varied from 58 to 79% (by weight) but was not different in the three textural groups. Hematite and magnetite were present as expected. Magnetite was lower in the slimes samples likely resulting from density segregation as the tailings were deposited. Carbonates were a significant mineralogical component varying from 5 to 14%. Total carbonate content was greater in the slimes fraction compared to the coarse sands. Ankerite and siderite dominated and occurred in about equal amounts. The calcite content was lower than either ankerite or siderite. Pyrite was detected in most samples but at very low levels. The sulphur content of the samples varied from 0.02 to 0.04% equivalent to pyrite content of 0.04 to 0.08%. Silicates occurring in all samples were hydrobioitite, kaolinite, amphibole (cummingtonite ± grunerite), diopside, ferripyrophyllite (possibly minnesotaite) and albite. Other minerals occurring in a few samples were pyrophyllite, muscovite and hydroxylapatite. There was no evidence that the mineral distribution was related to particle size. Distribution of metals was also unrelated to particle size with the possible exception of manganese which appeared to be elevated in the slimes. This is consistent with the higher carbonate content and indicates that manganese is associated with the carbonates.
2 Characteristics of PolyMet Tailings
Four tailings samples have been tested. These samples originated from processing of three ore composites nominally containing 0.35%, 0.4% and 0.45% copper (Parcels 1, 2 and 3, respectively). Flotation testing also considered addition of copper sulphate as an activator of pyrite. For Parcel 1 and 3, copper sulphate was evaluated. Also for Parcel 1, and Parcel 2 processing without the addition of copper sulphate was evaluated. The addition of copper sulphate does not materially affect the copper and sulphur content of the tailings directly but changes the mineralogical composition due to the selective recovery of pyrite to the bulk sulfide concentrate. The characteristics of the four samples are shown in Table 2. Very little difference between the tailings was apparent. As expected, addition of copper sulphate in the process resulted in lower sulphur content in the tailings (0.1% and 0.15%, Parcels 1 and 3, respectively) compared to 0.23% and 0.2% (Parcels 1 and 2, respectively) without copper sulphate. Copper showed the widest variation in concentration (223 to 527 mg/kg). Variations of cobalt, nickel and zinc were small.

SRK Consulting Page 3 of 6
Authors Initials/typist initials 1UP005.001_LTV_Tailigs.sd.20051208.doc, 1:44 PM, May. 2, 06
Table 1. Characteristics of LTV Tailings Samples
Sampled Material Q Py Cal Ank Sid Hem Mag Bio Kao
Fe-Pyr
Albite low As Cd Co Cr Cu Fe Mn Ni P Pb S Zn
Core
Start ft
Finish ft % % % % % % % % % % % ppm ppm ppm ppm ppm % ppm ppm ppm ppm % ppm
Coarse Sand
GP-1 8 12 Coarse Sand 72 0.2 0.3 3 3 3 4 1 1 2 2 31 -0.5 12 100 14 15.85 5970 5 240 7 0.02 14
GP-1 20 40 Coarse Sand 71 0.2 0.2 5 8 2 2 2 1 2 2 36 -0.5 14 90 25 15.5 7110 8 250 5 0.04 13
GP-3 8 12 Coarse Sand 58 0 0.4 6 6 2 3 5 1 6 4 16 -0.5 7 42 7 13.7 3420 3 250 4 0.02 9
GP-4 4 16 Coarse Sand 59 0.1 0.7 2 4 2 3 10 2 2 3 19 -0.5 7 57 9 15.45 3890 1 240 7 0.02 9
GP-4 20 24 Coarse Sand 79 0 0.1 3 2 2 3 3 1 2 1 21 -0.5 10 45 8 12.85 4010 3 250 5 0.02 34
n 5 5 5 5 5 5 5 5 5 5 5 5 5 5 5 5 5 5 5 5 5 5 5
Min 58 0 0.1 2 2 2 2 1 1 2 1 16 -0.5 7 42 7 12.85 3420 1 240 4 0.02 9
Median 71 0.1 0.3 3 4 2 3 3 1 2 2 21 -0.5 10 57 9 15.45 4010 3 250 5 0.02 13
Max 79 0.2 0.7 6 8 3 4 10 2 6 4 36 -0.5 14 100 25 15.85 7110 8 250 7 0.04 34
Fine Sand
GP-1 60 72 Fine Sand 72 0.1 0.7 3 2 1 1 2 2 2 4 22 -0.5 11 77 20 12.05 7010 3 330 3 0.04 14
GP-2 0 1 Fine Sand 60 0 0.2 6 7 2 2 11 4 3 0 15 -0.5 9 27 7 14.4 4270 -1 490 -2 0.02 10
GP-2 24 28 Fine Sand 62 0.4 1 6 3 1 2 5 2 3 3 22 -0.5 11 61 13 14.55 5340 3 550 7 0.02 14
GP-3 44 60 Fine Sand 68 0.2 0.5 4 3 3 2 4 1 3 1 15 -0.5 12 45 17 13.4 8510 4 400 7 0.03 12
GP-4 18 20 Fine Sand 73 0 0.2 7 3 2 2 4 2 2 1 43 -0.5 10 41 12 13.3 4020 2 290 8 0.02 13
GP-5 8 20 Fine Sand 78 0.1 0.1 4 2 3 3 3 1 2 1 14 -0.5 7 42 7 13.45 3630 2 270 2 0.02 7
GP-5 36 48 Fine Sand 73 0.4 0.4 4 2 2 3 2 1 3 2 14 -0.5 9 53 14 13.55 5820 2 290 4 0.02 8
n 7 7 7 7 7 7 7 7 7 7 7 7 7 7 7 7 7 7 7 7 7 7 7
Min 60 0 0.1 3 2 1 1 2 1 2 0 14 -0.5 7 27 7 12.05 3630 -1 270 -2 0.02 7
Median 72 0.1 0.4 4 3 2 2 4 2 3 1 15 -0.5 10 45 13 13.45 5340 2 330 4 0.02 12
Max 78 0.4 1 7 7 3 3 11 4 3 4 43 -0.5 12 77 20 14.55 8510 4 550 8 0.04 14
Slimes
GP-2 28 32 Slimes 62 0 1 4 4 2 1 5 2 3 5 18 -0.5 14 31 10 14.2 7390 3 530 4 0.02 13
GP-3 60 72 Slimes 62 0 0.7 8 5 3 1 7 2 2 1 15 -0.5 14 33 20 12 10050 4 590 2 0.04 14
GP-5 20 24 Slimes 70 0.1 0.3 6 4 3 2 6 2 3 1 25 -0.5 9 38 7 13.75 4830 1 460 4 0.02 8
GP-5 48 52 Slimes 72 0 0.6 4 6 2 1 4 1 2 1 16 -0.5 16 40 19 13.1 12400 3 550 4 0.03 11
n 4 4 4 4 4 4 4 4 4 4 4 4 4 4 4 4 4 4 4 4 4 4 4
Min 62 0 0.3 4 4 2 1 4 1 2 1 15 -0.5 9 31 7 12 4830 1 460 2 0.02 8
Median 66 0 0.65 5 4.5 2.5 1 5.5 2 2.5 1 17 -0.5 14 35.5 14.5 13.425 8720 3 540 4 0.025 12
Max 72 0.1 1 8 6 3 2 7 2 3 5 25 -0.5 16 40 20 14.2 12400 4 590 4 0.04 14
Notes
Minerals Q = Quartz, Ank = Ankerite, Hem = Hematite, Mag = Magnetite, Sid = siderite, Bio = hydrobiotite, kao = kaolinite, Fe-Pyr = Ferriprophyllite, Cal = Calcite, py =pyrite

SRK Consulting Page 4 of 6
Authors Initials/typist initials 1UP005.001_LTV_Tailigs.sd.20051208.doc, 1:44 PM, May. 2, 06
Table 2. Characteristics of NorthMet Tailings Samples Sample Number Source and Process Total S As Cd Co Cr Cu Mn Ni P Zn
% ppm ppm ppm ppm ppm ppm ppm ppm ppm
PIS-ACS TO DSC COMP Parcel 1, CuSO4 Added 0.10 <5 <0.5 59 186 223 1130 319 790 95 PISA TO D COMP Parcel 1, CuSO4 Not Added 0.23 <5 <0.5 62 188 248 1140 329 800 97 P2SA TO D COMP Parcel 2, CuSO4 Not Added 0.20 <5 <0.5 61 199 527 1125 385 750 93 P3S-A TO D COMP Parcel 3, CuSO4 Added 0.15 <5 <0.5 60 175 418 1110 372 770 92
3 Proposed Column Testwork
3.1 Design Basis
Based on the characteristics of the NorthMet and LTV tailings, the following chemical processes can be expected to occur within the layered tailings basins: • In NorthMet Tailings
o Near surface oxidation of residual sulfide minerals resulting in release acidity, iron, sulphate and trace elements (copper and nickel).
o Development and migration of an oxidation front due to consumption of oxygen near the surface.
o Attenuation of metals as a result of interaction between pore fluids and mineral grains.
• LTV Tailings
o Enhanced dissolution of ankerite and siderite under saturated conditions resulting in release of calcium, magnesium, ferrous iron, reduced manganese and bicarbonate alkalinity.
o Localized re-precipitation of ferric hydroxides and manganese oxides due to variations in pH and oxidation-reduction potential.
• Interaction Between NorthMet Tailings Pore Water and LTV Tailings
o Possible sorption of metals by ferric hydroxides and manganese oxides, particularly in the immediate contact zone where LTV tailing are probably partially oxidized.
o Precipitation of metal carbonates due to alkaline conditions.
Testing of the LTV tailings indicates little significant variation in mineralogical and chemical content. The primary variable expected to influence the degree to metal attenuation occurs, if at all, is particle size which will control the availability of adsorption sites, oxidation-reduction conditions and contact time.
3.2 Proposed Testwork
The proposed leach column design includes the following main features (Figure 1): • In series leach columns designed to generate NorthMet tailings pore water as feed into LTV
tailings.

SRK Consulting Page 5 of 6
Authors Initials/typist initials 1UP005.001_LTV_Tailigs.sd.20051208.doc, 1:44 PM, May. 2, 06
• First column containing 10 kg of unsaturated NorthMet Tailings and second receiving column containing 5 kg of LTV tailings. The larger volume of NorthMet tailings is intended to optimize development of near equilibrium pore water chemistry below an oxidation zone in the NorthMet tailings. The smaller volume of LTV tailings may allow breakthrough of NorthMet tailings water chemistry to be observed.
• NorthMet tailings open to atmosphere.
• Connecting pipe between columns and sampling “T” operated to exclude oxygen.
• Side sampling port in LTV tailings column to enable sampling of pore water just below the entry point.
• Sampling of final effluent.
• Application of 2 L of deionized water every week to allow withdrawal of up to 250 mL of water from each of the two intermediate location and 1.5 L of the final effluent. This application rate represents approximately one pore volume every 4 weeks.
• Analysis of intermediate sampling points for pH and Eh every week and composite sample for anions and cations every other week (including sulfur).
• Analysis of final effluent for same parameters, sulphate, alkalinity and anion scan. Approximately 11 kg of each of the tailings samples shown in Table 2 are available for additional testing. The following matrix summarises six proposed tests (Table 3). It is preferred to test slimes and coarse sands as two extreme characteristics of LTV tailings. From experience, it is unlikely that the slimes will transmit sufficient water for the experiment. Therefore, a fine sand composite would be used instead. Each “X” in Table 3 represents an in-series column pair. The two control experiments will operate without NortMet tailings in the first column to evaluate leachate chemistry from LTV tailings. This will allow comparison with seepage chemistry in the existing basin.
Table 3. Matrix of Proposed Tests NorthMet Tailings Samples Control
No NorthMet Tailings
Lower S Composite (Parcels
1 and 3, CuSO4
Added)
Higher S Composite
(Parcels 1 and 2, CuSO4 added)
Fine sand or Slimes Composite
X X X LTV Samples
Sand Composite X X X

SRK Consulting Page 6 of 6
Authors Initials/typist initials 1UP005.001_LTV_Tailigs.sd.20051208.doc, 1:44 PM, May. 2, 06
Figure 1. Schematic of In-Series Column Design
NorthMet Tailings Pore
Water
Pore water 5 cm from
contact5 kg of LTV
tailings (15
cm thick)
10 kg of
NorthMet
tailings (30
cm thick)
De-ionized water inflow
2 L per week
Effluent,
approximately 1
pore volume every
6 weeks
15 cm diameter
clear plastic
column.
Sealed O2 excluded
connectionNorthMet Tailings Pore
Water
Pore water 5 cm from
contact5 kg of LTV
tailings (15
cm thick)
10 kg of
NorthMet
tailings (30
cm thick)
De-ionized water inflow
2 L per week
Effluent,
approximately 1
pore volume every
6 weeks
15 cm diameter
clear plastic
column.
Sealed O2 excluded
connection

Appendix B Results of Mineralogy, Bulk Chemical and
Leach Test Characterization

Appendix B
Results of Mineralogy, Bulk Chemical and Leach Test Characterization
Page 1 of 5
Procedure Parameter Unit
Leach, no
CuSO4
Leach,
with
CuSO4
GypsumRaffinate
NeutralizationFe/Al Mg Combined
Combined no
Gypsum
Quartz % 2.1 3 0.2 0.3 0.3 0.2 2.2 3.4
Plagioclase % 25.6 5.8 2.2
Gypsum % 8.1 6.9 99.8 96.3 98.9 76.8 73.4 53.3
Calcite % 2.9
Bassanite % 3.4
Siderite % 1.2
Actinolite % 1.3
Talc % 4.3 3.9 3.2 3.2
Natrojarosite % 34 63 9.6 29.3
Hematite % 24.6 17.4 6 8.6
Goethite % 0.8
Butlerite % 1.5
Brucite % 22.2
Halite % 0.8
Fizz Rating - 1 1 1 1 1 3 1 2
Paste pH - 2.6 3.3 3.8 5.4 4.6 9.6 - 9.4
Total S % 6.24 9.8 19.55 18.95 17.9 14.4 16.5 13.65
S as SO4 % 6.1 9.3 18.35 18.55 17.35 13.65 15.9 13.5
S as Non-SO4 % 0.18 0.17 0.59 0.55 0.57 0.29 0.43 0.18
C % <0.05 <0.05 <0.05 <0.05 <0.05 0.48 <0.05 0.08
CO2 % <0.2 <0.2 <0.2 <0.2 <0.2 1.8 <0.2 0.3
AP kg CaCO3/t 195 306.3 610.9 592.2 559.4 450 515.6 426.6
NNP kg CaCO3/t -212 -310 -611 -592 -569 -79 -506 -376
NP kg CaCO3/t -17 -4 0 0 -10 371 10 51
NP/AP - -0.09 -0.01 0 0 -0.02 0.82 0.02 0.12
Residues
XR
D M
ine
ralo
gy
Re
su
lts
Ac
id-B
as
e A
cc
ou
nti
ng
Notes
1. #N/A - result checking in progress
2. Negative value indicates result is below reporting limit
B.Solids_Characteristics.xls
SRK ConsultingMay 2006

Appendix B
Results of Mineralogy, Bulk Chemical and Leach Test Characterization
Page 2 of 5
Procedure Parameter Unit
Leach, no
CuSO4
Leach,
with
CuSO4
GypsumRaffinate
NeutralizationFe/Al Mg Combined
Combined no
Gypsum
Residues
Ag ppm 11.05 23.8 0.23 0.9 0.33 0.12 4.93 11.05
Al % 2.82 1.97 0.02 0.02 0.46 0.03 0.54 1.01
As ppm 35.4 56.3 3 6 15 5 110 34
B ppm <10 <10 <10 <10 <10 <10 <10 <10
Ba ppm 40 30 <10 <10 <10 <10 10 20
Be ppm 0.05 <0.05 <0.05 <0.05 0.28 <0.05 <0.05 <0.05
Bi ppm 4.89 6.84 0.5 0.8 0.81 0.04 1.94 3.53
Ca % 1.88 1.41 14.5 17.1 18.8 15.1 16.35 11.3
Cd ppm 0.66 0.19 0.22 0.73 0.48 0.44 0.29 0.23
Ce ppm 8.21 5.45 1.71 0.6 0.85 1.6 2.35 2.93
Co ppm 133.5 17.9 5.1 9.3 105.5 13.6 6.9 23.6
Cr ppm 112 154 8 11 457 5 59 116
Cs ppm 0.1 <0.05 <0.05 <0.05 0.09 <0.05 <0.05 <0.05
Cu ppm 7380 1280 184.5 22.5 2960 26.9 519 945
Fe % 17.3 26.9 0.05 0.08 1.88 0.05 5.21 11.75
Ga ppm 6.47 5.06 2.54 0.07 0.57 0.09 1.22 2.43
Ge ppm 0.41 0.47 <0.05 <0.05 0.08 <0.05 0.11 0.22
Hf ppm 0.12 0.06 <0.02 <0.02 0.12 <0.02 0.04 0.04
Hg ppm 0.04 0.02 0.12 0.35 0.07 0.05 0.11 0.03
In ppm 0.3 0.355 23.3 0.011 1.01 0.083 0.164 0.28
K % 0.11 0.1 <0.01 <0.01 0.01 0.01 0.02 0.05
La ppm 3.6 2.5 0.7 0.5 0.5 2.3 1.1 1.6
Li ppm 1 0.6 0.1 0.1 0.5 0.5 0.2 0.2
Mg % 0.28 0.25 0.01 0.01 0.14 9.44 0.39 1.47
Mn ppm 35 <5 <5 5 23 83 <5 <5
Mo ppm 21.8 28.4 0.47 0.85 42.3 0.38 9.35 18.9
Na % 1.28 3 0.02 0.04 0.13 1.04 0.58 1.62
Nb ppm 0.18 0.21 <0.05 0.06 0.46 0.06 0.11 0.17
Ni ppm 3270 410 99.9 192.5 2710 1230 260 674
P ppm 290 110 <10 20 160 40 70 90
Pb ppm 48.5 56.1 8.3 86.1 20.4 12.5 133.5 32
Rb ppm 1.7 1 0.2 0.3 0.5 0.3 0.4 0.7
Re ppm 0.012 0.002 0.015 0.022 0.013 <0.001 0.009 0.009
S % 5.47 9.22 >10.0 >10.0 >10.0 >10.0 >10.0 >10.0
Sb ppm 1.22 1.81 0.18 1.25 1.47 0.4 3.99 1.14
Sc ppm 1.3 0.8 0.4 0.4 4.4 0.5 0.8 1.1
Se ppm 49.8 73.4 0.3 0.4 0.6 0.5 20.4 39.2
Sn ppm 4.8 6.1 0.2 0.5 1.6 <0.2 2 3.2
Sr ppm 73.1 63.9 60.6 106 83.7 86.5 77.3 85.2
Ta ppm <0.01 <0.01 <0.01 <0.01 <0.01 <0.01 <0.01 <0.01
Te ppm 2.01 2.91 0.01 0.07 0.09 <0.01 0.83 1.48
Th ppm 1.1 0.9 <0.2 <0.2 0.3 <0.2 0.3 0.4
Ti % 0.066 0.042 <0.005 <0.005 0.007 <0.005 0.012 0.019
Tl ppm 0.1 0.34 0.03 0.03 0.24 0.02 0.06 0.19
U ppm 0.06 <0.05 <0.05 <0.05 0.55 0.1 0.06 0.09
V ppm 39 41 1 1 16 1 11 21
W ppm 0.57 0.49 0.09 0.18 1.12 <0.05 0.26 0.45
Y ppm 3.88 3.29 1.28 1.14 1.06 7.64 2 2.86
Zn ppm 171 15 30 98 164 23 32 36
Zr ppm <0.5 0.7 1.5 4.2 1.2 <0.5 9.8 1.9
Me
tals
Notes
1. #N/A - result checking in progress
2. Negative value indicates result is below reporting limit
B.Solids_Characteristics.xls
SRK ConsultingMay 2006

Appendix B
Results of Mineralogy, Bulk Chemical and Leach Test Characterization
Page 3 of 5
Procedure Parameter Unit
Leach, no
CuSO4
Leach,
with
CuSO4
GypsumRaffinate
NeutralizationFe/Al Mg Combined
Combined no
Gypsum
Residues
pH - 2.79 3.38 4.12 4.91 5.03 9.72 9.18 9.42
Hardness mgCaCO3/L 1520 1480 1360 1290 1460 1880 1480 1650
Al mg/L 9.24 0.27 0.27 0.3 0.21 <0.005 <0.005 <0.005
Sb mg/L <0.001 <0.001 <0.001 <0.001 <0.001 <0.001 <0.001 <0.001
As mg/L <0.001 <0.001 0.001 <0.001 <0.001 <0.001 <0.001 <0.001
Ba mg/L <0.001 <0.001 <0.001 0.009 <0.001 0.003 <0.001 <0.001
Be mg/L <0.001 <0.001 <0.001 <0.001 <0.001 <0.001 <0.001 <0.001
Bi mg/L <0.001 <0.001 <0.001 <0.001 <0.001 <0.001 <0.001 <0.001
B mg/L <0.05 <0.05 <0.05 <0.05 <0.05 <0.05 <0.05 <0.05
Cd mg/L 0.022 0.0058 <0.0002 0.0017 0.012 <0.0002 <0.0002 <0.0002
Ca mg/L 487 492 541 511 500 476 519 499
Cr mg/L 0.1 0.006 0.005 0.003 <0.001 <0.001 0.002 <0.001
Co mg/L 4.19 0.21 0.14 0.33 3.75 <0.001 <0.001 <0.001
Cu mg/L 241 6.67 5.38 0.5 13.9 0.006 0.009 0.005
Fe mg/L 59.6 0.26 0.5 0.69 <0.05 <0.05 <0.05 <0.05
Pb mg/L 0.004 0.002 0.009 0.093 0.001 <0.001 <0.001 <0.001
Li mg/L 0.023 <0.001 <0.001 <0.001 0.015 0.008 <0.001 <0.001
Mg mg/L 74.1 61.1 1.8 2.85 50.7 168 44.7 97
Mn mg/L 1.29 0.055 0.026 0.046 0.82 <0.001 <0.001 <0.001
Hg ug/L 0.13 <0.02 <0.02 <0.02 <0.02 <0.02 <0.02 <0.02
Mo mg/L <0.0005 <0.0005 0.0005 <0.0005 0.0014 <0.0005 0.0074 0.013
Ni mg/L 103 3.95 3.09 6.84 79 0.004 0.015 0.008
PO4 mg P/L <0.15 <0.15 <0.15 <0.15 <0.15 <0.15 <0.15 <0.15
K mg/L <0.1 1.4 <0.1 <0.1 0.3 2.6 0.4 0.7
Se mg/L 0.005 0.003 0.002 <0.001 0.002 0.003 0.01 0.024
Si mg SiO2/L 0.8 0.8 <0.25 0.5 1.4 <0.25 15.8 10.5
Ag mg/L 0.0064 0.0077 <0.00025 <0.00025 0.0012 <0.00025 <0.00025 <0.00025
Na mg/L 47.2 147 2.8 4.63 41.9 238 51.4 97.6
Sr mg/L 0.26 0.32 0.16 0.3 0.19 0.24 0.18 0.26
Te mg/L <0.001 <0.001 <0.001 <0.001 <0.001 <0.001 <0.001 <0.001
Tl mg/L 0.0006 <0.0001 0.0002 0.0001 0.0012 <0.0001 <0.0001 <0.0001
Th mg/L 0.033 0.01 <0.0005 <0.0005 <0.0005 <0.0005 <0.0005 <0.0005
Sn mg/L <0.001 <0.001 <0.001 <0.001 <0.001 <0.001 <0.001 <0.001
Ti mg/L 0.044 <0.001 <0.001 <0.001 <0.001 <0.001 <0.001 <0.001
U mg/L 0.0017 <0.0005 <0.0005 <0.0005 <0.0005 <0.0005 <0.0005 <0.0005
V mg/L <0.001 <0.001 <0.001 <0.001 <0.001 <0.001 <0.001 <0.001
Zn mg/L 5.85 0.17 0.095 0.24 4.4 <0.005 <0.005 <0.005
Zr mg/L <0.01 <0.01 <0.01 <0.01 <0.01 <0.01 <0.01 <0.01
SP
LP
Le
ac
ha
te E
xtr
ac
tio
n R
es
ult
s
Notes
1. #N/A - result checking in progress
2. Negative value indicates result is below reporting limit
B.Solids_Characteristics.xls
SRK ConsultingMay 2006

Appendix B
Results of Mineralogy, Bulk Chemical and Leach Test Characterization
Page 4 of 5
Procedure Parameter Unit
Leach, no
CuSO4
Leach,
with
CuSO4
GypsumRaffinate
NeutralizationFe/Al Mg Combined
Combined no
Gypsum
Residues
pH - 4.74 4.94 4.95 4.96 4.98 9.8 5.23 8.98
Hardness mgCaCO3/L 1500 1260 1490 1900 1610 3270 2400 3710
Al mg/L 2.6 0.008 0.22 0.28 1.51 <0.005 0.088 <0.005
Sb mg/L <0.001 <0.001 <0.001 <0.001 <0.001 <0.001 <0.001 <0.001
As mg/L <0.001 <0.001 0.001 0.001 <0.001 <0.001 <0.001 <0.001
Ba mg/L <0.001 0.001 0.001 0.014 0.001 0.004 0.007 0.003
Be mg/L <0.001 <0.001 <0.001 <0.001 <0.001 <0.001 <0.001 <0.001
Bi mg/L <0.001 <0.001 <0.001 <0.001 <0.001 <0.001 <0.001 <0.001
B mg/L <0.05 <0.05 <0.05 <0.05 <0.05 <0.05 <0.05 <0.05
Cd mg/L 0.021 0.0055 <0.0002 0.0018 0.011 <0.0002 0.0025 <0.0002
Ca mg/L 451 402 594 754 562 586 733 718
Cr mg/L 0.031 0.002 0.006 0.007 0.13 0.002 0.022 0.004
Co mg/L 4.48 0.21 0.14 0.32 3.37 0.001 0.096 0.001
Cu mg/L 244 5.75 5.28 0.46 46.8 0.018 2.41 0.005
Fe mg/L 3.9 <0.05 0.42 0.55 0.06 <0.05 0.14 <0.05
Pb mg/L 0.001 <0.001 0.012 0.34 <0.001 <0.001 0.004 <0.001
Li mg/L 0.025 0.002 0.001 0.002 0.014 0.008 <0.001 0.002
Mg mg/L 91 62 2 2.74 50 438 137 464
Mn mg/L 1.39 0.057 0.029 0.046 0.76 <0.001 0.11 <0.001
Hg ug/L <0.02 <0.02 <0.02 <0.02 <0.02 <0.02 <0.02 <0.02
Mo mg/L <0.0005 <0.0005 0.0007 0.0006 0.0017 <0.0005 0.0006 0.027
Ni mg/L 107 4 3.15 6.35 73.4 0.018 3.02 0.093
P mg PO4/L <0.15 <0.15 <0.15 1 <0.15 <0.15 <0.15 <0.15
K mg/L 0.6 2.2 0.5 0.6 0.7 3 1.2 1.7
Se mg/L 0.004 0.003 0.002 0.002 0.002 0.002 0.002 0.033
Si mg SIO2/L 3.5 4 1.1 1.5 2.7 0.8 14.9 14.1
Ag mg/L 0.0074 0.0093 <0.00025 <0.00025 0.0015 <0.00025 <0.00025 <0.00025
Na mg/L 1730 1680 1560 1600 1540 1710 1590 1710
Sr mg/L 0.29 0.35 0.22 0.46 0.29 0.41 0.34 0.47
Te mg/L <0.001 <0.001 <0.001 <0.001 <0.001 <0.001 <0.001 <0.001
Tl mg/L 0.0009 <0.0001 0.0002 0.0003 0.0016 <0.0001 0.0003 0.0001
Th mg/L 0.002 0.0013 <0.0005 <0.0005 <0.0005 <0.0005 <0.0005 <0.0005
Sn mg/L <0.001 <0.001 <0.001 <0.001 <0.001 <0.001 0.001 <0.001
Ti mg/L 0.009 <0.001 <0.001 <0.001 <0.001 <0.001 0.001 <0.001
U mg/L 0.0016 <0.0005 <0.0005 <0.0005 0.0069 <0.0005 0.0008 <0.0005
V mg/L 0.003 0.003 0.003 0.003 0.001 0.003 0.002 0.003
Zn mg/L 5.49 0.18 0.12 0.25 4.12 <0.005 0.22 <0.005
Zr mg/L <0.01 <0.01 <0.01 <0.01 <0.01 <0.01 <0.01 <0.01
TC
LP
Le
ac
ha
te E
xtr
ac
tio
n R
es
ult
s
Notes
1. #N/A - result checking in progress
2. Negative value indicates result is below reporting limit
B.Solids_Characteristics.xls
SRK ConsultingMay 2006

Appendix B
Results of Mineralogy, Bulk Chemical and Leach Test Characterization
Page 5 of 5
Procedure Parameter Unit
Leach, no
CuSO4
Leach,
with
CuSO4
GypsumRaffinate
NeutralizationFe/Al Mg Combined
Combined no
Gypsum
Residues
pH - 2.12 2.64 3.30 4.22 5.06 9.33 8.65 8.95
ORP mV 625 601 568 530 490 277 390 262
Cond. µS/cm 12500 9720 13 2490 6290 14530 4480 7690
Acidity to pH 4.5 mg CaCO3/L 1807.5 252.0 38.0 2.25 #N/A #N/A #N/A #N/A
Total Acidity mg CaCO3/L 4362.5 365.0 119.0 58.5 400.0 #N/A #N/A #N/A
Alkalinity mg CaCO3/L #N/A #N/A #N/A #N/A 5.0 52.0 39.5 46.0
Inorganic C mg CaCO3/L <1 <1 <1 <1 <1 7 9 8
Hardness mg CaCO3/L 2640 2810 1360 1300 3000 6020 2000 3730
F mg/L <1 <0.5 <0.25 3.6 1.6 <1 <5 <0.5
Cl mg/L 717 717 21.7 23.5 473 1950 392 635
SO4 mg/L 9485 4507 1600 1670 4490 7940 2430 4280
Al mg/L 47.9 1.34 1.35 1.69 1.06 <0.005 <0.005 <0.005
Sb mg/L <0.001 <0.001 <0.001 <0.001 <0.001 <0.001 <0.001 <0.001
As mg/L 0.012 <0.001 0.004 0.003 0.002 <0.001 <0.001 <0.001
Ba mg/L <0.001 <0.001 0.006 0.012 0.002 0.005 0.001 0.002
Be mg/L 0.003 <0.001 <0.001 <0.001 <0.001 <0.001 <0.001 <0.001
Bi mg/L <0.001 <0.001 <0.001 <0.001 <0.001 <0.001 <0.001 <0.001
B mg/L 0.07 <0.05 <0.05 <0.05 0.11 <0.05 <0.05 <0.05
Cd mg/L 0.102 0.031 0.0035 0.0082 0.064 <0.0002 <0.0002 <0.0002
Ca mg/L 322 434 522 494 463 458 450 453
Cr mg/L 0.54 0.03 0.02 0.013 0.001 0.001 0.006 0.002
Co mg/L 30.2 0.99 0.79 1.8 29.1 0.001 <0.001 <0.001
Cu mg/L 1300 51.1 31.4 2.81 52 0.025 0.002 0.006
Fe mg/L 511 12.6 2.72 3.94 0.12 <0.05 <0.05 <0.05
Pb mg/L 0.009 0.006 0.018 0.3 0.002 <0.001 <0.001 <0.001
Li mg/L 0.14 0.005 0.003 0.005 0.096 0.048 <0.001 0.001
Mg mg/L 446 419 10.1 15.9 446 955 213 630
Mn mg/L 6.69 0.28 0.13 0.28 4.83 <0.001 <0.001 <0.001
Hg mg/L 1.18 <0.02 <0.02 <0.02 <0.02 <0.02 <0.02 <0.02
Mo mg/L <0.0005 <0.0005 0.0013 <0.0005 0.0023 <0.0005 0.027 0.03
Ni mg/L 616 19 15.7 37.9 616 0.034 0.028 0.054
P mg/L 0.7 <0.15 <0.15 <0.15 <0.15 <0.15 <0.15 <0.15
K mg/L 0.4 7.6 0.1 0.5 2.2 20.3 1.8 3.9
Se mg/L 0.01 0.003 <0.001 0.001 0.003 <0.001 0.011 0.021
Si mg/L 3.3 3.2 1.2 2.7 4.5 <0.25 14.8 5.7
Ag mg/L 0.022 0.025 0.0003 <0.00025 0.013 <0.00025 <0.00025 <0.00025
Na mg/L 290 616 16 20.9 284 2020 255 717
Sr mg/L 0.17 0.38 0.2 0.46 0.22 0.3 0.2 0.27
Te mg/L <0.001 <0.001 0.001 <0.001 <0.001 <0.001 <0.001 <0.001
Tl mg/L 0.0029 0.0005 0.0006 0.0005 0.0049 0.0004 <0.0001 0.0001
Th mg/L 0.145 0.109 0.0007 <0.0005 <0.0005 <0.0005 <0.0005 <0.0005
Sn mg/L <0.001 <0.001 <0.001 <0.001 <0.001 <0.001 <0.001 <0.001
Ti mg/L 0.42 0.005 0.002 0.001 0.001 <0.001 <0.001 <0.001
U mg/L 0.0081 <0.0005 <0.0005 0.0009 0.001 <0.0005 <0.0005 <0.0005
V mg/L 0.12 <0.001 <0.001 <0.001 <0.001 <0.001 <0.001 <0.001
Zn mg/L 48.6 0.92 0.15 1.34 34.7 <0.005 <0.005 <0.005
Zr mg/L <0.01 <0.01 <0.01 <0.01 <0.01 <0.01 <0.01 <0.01
3:1
Wa
ter
Le
ac
h (
Fir
st
We
ek
)
Notes
1. #N/A - result checking in progress
2. Negative value indicates result is below reporting limit
B.Solids_Characteristics.xls
SRK ConsultingMay 2006

Appendix C Dissolution Tests Charts

Appendix C.1 Sequential Shake Flasks

Appendix C.1
Dissolution Tests Charts - Shake Flasks
Graph C.1.1
ShakeFlask_20060427.xls
SRK ConsultingMay 2006
Shake Flasks - Concentrations
NorthMet Project
0
2.5
5
7.5
10
12.5
0 2 4 6 8 10 12
Cycles [weeks]
pH
Leach (CuSO4not used)
Leach
Gypsum
RaffinateNeutralization
Fe/Al
Mg
Combined
Combined, noGypsum

Appendix C.1
Dissolution Tests Charts - Shake Flasks
Graph C.1.2
ShakeFlask_20060427.xls
SRK ConsultingMay 2006
Shake Flasks - Concentrations
NorthMet Project
0
2000
4000
6000
8000
10000
12000
14000
0 2 4 6 8 10 12
Cycles [weeks]
Co
nd
ucti
vit
y [
um
ho
s/c
m]
Leach (CuSO4not used)
Leach
Gypsum
RaffinateNeutralization
Fe/Al
Mg
Combined
Combined, noGypsum

Appendix C.1
Dissolution Tests Charts - Shake Flasks
Graph C.1.3
ShakeFlask_20060427.xls
SRK ConsultingMay 2006
Shake Flasks - Concentrations
NorthMet Project
1
10
100
1000
10000
0 2 4 6 8 10 12
Cycles [weeks]
Acid
ity (
pH
=4.5
) [m
gC
aC
O3/L
]
Leach (CuSO4not used)
Leach
Gypsum
RaffinateNeutralization
Fe/Al
Mg
Combined
Combined, noGypsum

Appendix C.1
Dissolution Tests Charts - Shake Flasks
Graph C.1.4
ShakeFlask_20060427.xls
SRK ConsultingMay 2006
Shake Flasks - Concentrations
NorthMet Project
1
10
100
1000
10000
0 2 4 6 8 10 12
Cycles [weeks]
Acid
ity (
pH
=8.3
) [m
gC
aC
O3/L
]
Leach (CuSO4not used)
Leach
Gypsum
RaffinateNeutralization
Fe/Al
Mg
Combined
Combined, noGypsum

Appendix C.1
Dissolution Tests Charts - Shake Flasks
Graph C.1.5
ShakeFlask_20060427.xls
SRK ConsultingMay 2006
Shake Flasks - Concentrations
NorthMet Project
0
10
20
30
40
50
60
70
0 2 4 6 8 10 12
Cycles [weeks]
Alk
ali
nit
y [
mg
Ca
CO
3/L
]
Leach (CuSO4not used)
Leach
Gypsum
RaffinateNeutralization
Fe/Al
Mg
Combined
Combined, noGypsum

Appendix C.1
Dissolution Tests Charts - Shake Flasks
Graph C.1.6
ShakeFlask_20060427.xls
SRK ConsultingMay 2006
Shake Flasks - Concentrations
NorthMet Project
0
2
4
6
8
10
12
0 2 4 6 8 10 12
Cycles [weeks]
Ino
rgan
ic C
[m
g/L
]
Leach (CuSO4not used)
Leach
Gypsum
RaffinateNeutralization
Fe/Al
Mg
Combined
Combined, noGypsum

Appendix C.1
Dissolution Tests Charts - Shake Flasks
Graph C.1.7
ShakeFlask_20060427.xls
SRK ConsultingMay 2006
Shake Flasks - Concentrations
NorthMet Project
0
1000
2000
3000
4000
5000
6000
7000
0 2 4 6 8 10 12
Cycles [weeks]
Hard
ness [
CaC
O3 m
g/L
]
Leach (CuSO4not used)
Leach
Gypsum
RaffinateNeutralization
Fe/Al
Mg
Combined
Combined, noGypsum

Appendix C.1
Dissolution Tests Charts - Shake Flasks
Graph C.1.8
ShakeFlask_20060427.xls
SRK ConsultingMay 2006
Shake Flasks - Concentrations
NorthMet Project
0.01
0.1
1
10
0 2 4 6 8 10 12
Cycles [weeks]
F [
mg
/L]
Leach (CuSO4not used)
Leach
Gypsum
RaffinateNeutralization
Fe/Al
Mg
Combined
Combined, noGypsum
ICP-MSdetection limit
Values below
Detection Limit
are shown as half
the limit.

Appendix C.1
Dissolution Tests Charts - Shake Flasks
Graph C.1.9
ShakeFlask_20060427.xls
SRK ConsultingMay 2006
Shake Flasks - Concentrations
NorthMet Project
0.1
1
10
100
1000
10000
0 2 4 6 8 10 12
Cycles [weeks]
Cl
[mg
/L]
Leach (CuSO4 notused)Leach
Gypsum
RaffinateNeutralizationFe/Al
Mg
Combined
Combined, noGypsumICP-MS detectionlimit
Values below
Detection Limit
are shown as half
the limit.

Appendix C.1
Dissolution Tests Charts - Shake Flasks
Graph C.1.10
ShakeFlask_20060427.xls
SRK ConsultingMay 2006
Shake Flasks - Concentrations
NorthMet Project
0
1000
2000
3000
4000
5000
6000
7000
8000
9000
10000
0 2 4 6 8 10 12
Cycles [weeks]
SO
4 [
mg
/L]
Leach (CuSO4 notused)Leach
Gypsum
RaffinateNeutralizationFe/Al
Mg
Combined
Combined, noGypsumDetection limit - 0.5mg/L
Values below
Detection Limit
are shown as half
the limit.

Appendix C.1
Dissolution Tests Charts - Shake Flasks
Graph C.1.11
ShakeFlask_20060427.xls
SRK ConsultingMay 2006
Shake Flasks - Concentrations
NorthMet Project
0.0001
0.001
0.01
0.1
1
10
100
0 2 4 6 8 10 12
Cycles [weeks]
Al [
mg
/L]
Leach (CuSO4 notused)Leach
Gypsum
RaffinateNeutralizationFe/Al
Mg
Combined
Combined, noGypsumICP-MS detectionlimit
Values below ICP-
MS Detection
Limit are shown
as half the limit.

Appendix C.1
Dissolution Tests Charts - Shake Flasks
Graph C.1.12
ShakeFlask_20060427.xls
SRK ConsultingMay 2006
Shake Flasks - Concentrations
NorthMet Project
0.00001
0.0001
0.001
0.01
0.1
1
0 2 4 6 8 10 12
Cycles [weeks]
Sb
[m
g/L
]
Leach (CuSO4not used)Leach
Gypsum
RaffinateNeutralizationFe/Al
Mg
Combined
Combined, noGypsumICP-MS detectionlimit
Values below ICP-
MS Detection
Limit are shown
as half the limit.
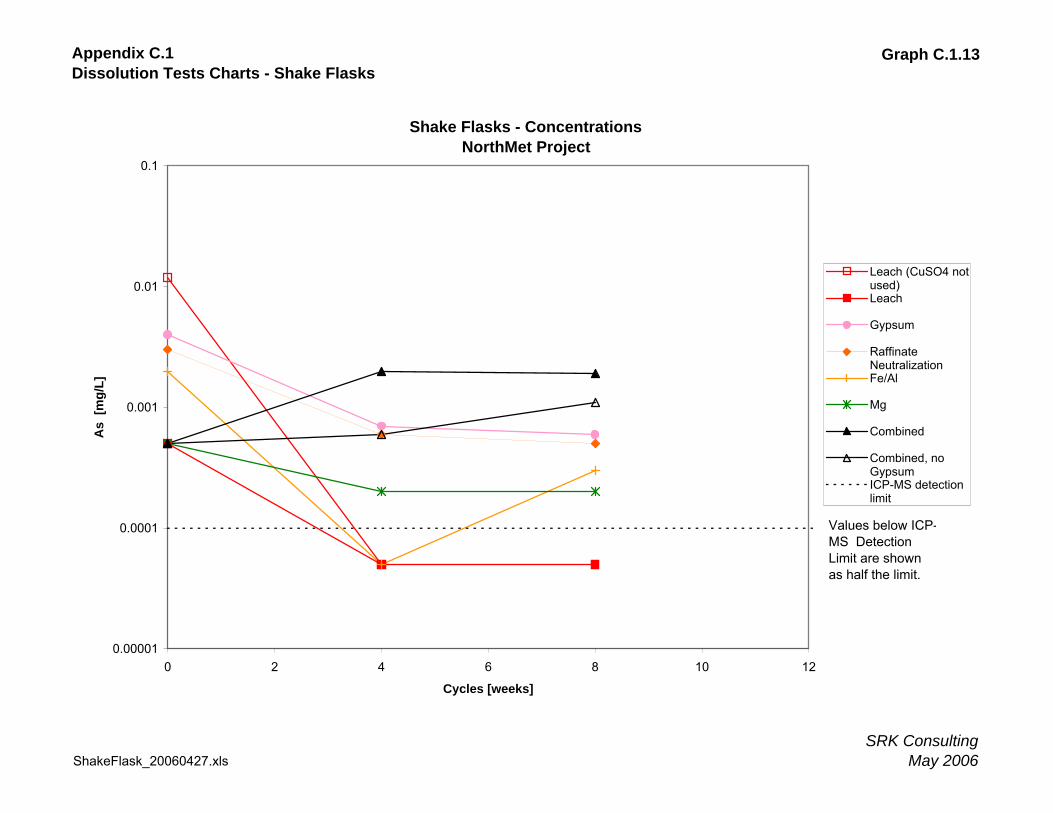
Appendix C.1
Dissolution Tests Charts - Shake Flasks
Graph C.1.13
ShakeFlask_20060427.xls
SRK ConsultingMay 2006
Shake Flasks - Concentrations
NorthMet Project
0.00001
0.0001
0.001
0.01
0.1
0 2 4 6 8 10 12
Cycles [weeks]
As
[mg
/L]
Leach (CuSO4 notused)Leach
Gypsum
RaffinateNeutralizationFe/Al
Mg
Combined
Combined, noGypsumICP-MS detectionlimit
Values below ICP-
MS Detection
Limit are shown
as half the limit.

Appendix C.1
Dissolution Tests Charts - Shake Flasks
Graph C.1.14
ShakeFlask_20060427.xls
SRK ConsultingMay 2006
Shake Flasks - Concentrations
NorthMet Project
0.00001
0.0001
0.001
0.01
0.1
0 2 4 6 8 10 12
Cycles [weeks]
Ba
[mg
/L]
Leach (CuSO4not used)Leach
Gypsum
RaffinateNeutralizationFe/Al
Mg
Combined
Combined, noGypsumICP-MS detectionlimit
Values below ICP-
MS Detection
Limit are shown
as half the limit.

Appendix C.1
Dissolution Tests Charts - Shake Flasks
Graph C.1.15
ShakeFlask_20060427.xls
SRK ConsultingMay 2006
Shake Flasks - Concentrations
NorthMet Project
0.00001
0.0001
0.001
0.01
0 2 4 6 8 10 12
Cycles [weeks]
Be
[mg
/L]
Leach (CuSO4not used)Leach
Gypsum
RaffinateNeutralizationFe/Al
Mg
Combined
Combined, noGypsumICP-MS detectionlimit
Values below ICP-
MS Detection
Limit are shown
as half the limit.

Appendix C.1
Dissolution Tests Charts - Shake Flasks
Graph C.1.16
ShakeFlask_20060427.xls
SRK ConsultingMay 2006
Shake Flasks - Concentrations
NorthMet Project
0
0.0002
0.0004
0.0006
0.0008
0.001
0.0012
0 2 4 6 8 10 12
Cycles [weeks]
Bi [
mg
/L]
Leach (CuSO4 notused)Leach
Gypsum
RaffinateNeutralizationFe/Al
Mg
Combined
Combined, noGypsumICP-MS detectionlimit
Values below ICP-
MS Detection
Limit are shown
as half the limit.

Appendix C.1
Dissolution Tests Charts - Shake Flasks
Graph C.1.17
ShakeFlask_20060427.xls
SRK ConsultingMay 2006
Shake Flasks - Concentrations
NorthMet Project
0.0001
0.001
0.01
0.1
1
0 2 4 6 8 10 12
Cycles [weeks]
B [m
g/L
]
Leach (CuSO4not used)
Leach
Gypsum
RaffinateNeutralization
Fe/Al
Mg
Combined
Combined, noGypsum
ICP-MS detectionlimit
Values below ICP-
MS Detection
Limit are shown
as half the limit.

Appendix C.1
Dissolution Tests Charts - Shake Flasks
Graph C.1.18
ShakeFlask_20060427.xls
SRK ConsultingMay 2006
Shake Flasks - Concentrations
NorthMet Project
0.00001
0.0001
0.001
0.01
0.1
1
0 2 4 6 8 10 12
Cycles [weeks]
Cd
[m
g/L
]
Leach (CuSO4not used)Leach
Gypsum
RaffinateNeutralizationFe/Al
Mg
Combined
Combined, noGypsumICP-MS detectionlimit
Values below ICP-
MS Detection
Limit are shown
as half the limit.

Appendix C.1
Dissolution Tests Charts - Shake Flasks
Graph C.1.19
ShakeFlask_20060427.xls
SRK ConsultingMay 2006
Shake Flasks - Concentrations
NorthMet Project
0
100
200
300
400
500
600
700
800
0 2 4 6 8 10 12
Cycles [weeks]
Ca [
mg
/L]
Leach (CuSO4not used)Leach
Gypsum
RaffinateNeutralizationFe/Al
Mg
Combined
Combined, noGypsumICP-MS detectionlimit - 0.01 mg/L
Values below ICP-
MS Detection
Limit are shown
as half the limit.

Appendix C.1
Dissolution Tests Charts - Shake Flasks
Graph C.1.20
ShakeFlask_20060427.xls
SRK ConsultingMay 2006
Shake Flasks - Concentrations
NorthMet Project
0.00001
0.0001
0.001
0.01
0.1
1
0 2 4 6 8 10 12
Cycles [weeks]
Cr
[m
g/L
]
Leach (CuSO4not used)Leach
Gypsum
RaffinateNeutralizationFe/Al
Mg
Combined
Combined, noGypsumICP-MS detectionlimit
Values below ICP-
MS Detection
Limit are shown
as half the limit.

Appendix C.1
Dissolution Tests Charts - Shake Flasks
Graph C.1.21
ShakeFlask_20060427.xls
SRK ConsultingMay 2006
Shake Flasks - Concentrations
NorthMet Project
0.00001
0.0001
0.001
0.01
0.1
1
10
100
0 2 4 6 8 10 12
Cycles [weeks]
Co
[m
g/L
]
Leach (CuSO4not used)Leach
Gypsum
RaffinateNeutralizationFe/Al
Mg
Combined
Combined, noGypsumICP-MS detectionlimit
Values below ICP-
MS Detection
Limit are shown
as half the limit.

Appendix C.1
Dissolution Tests Charts - Shake Flasks
Graph C.1.22
ShakeFlask_20060427.xls
SRK ConsultingMay 2006
Shake Flasks - Concentrations
NorthMet Project
0.00001
0.0001
0.001
0.01
0.1
1
10
100
1000
10000
0 2 4 6 8 10 12
Cycles [weeks]
Cu
[m
g/L
]
Leach (CuSO4not used)Leach
Gypsum
RaffinateNeutralizationFe/Al
Mg
Combined
Combined, noGypsumICP-MSdetection limit
Values below ICP-
MS Detection
Limit are shown
as half the limit.

Appendix C.1
Dissolution Tests Charts - Shake Flasks
Graph C.1.23
ShakeFlask_20060427.xls
SRK ConsultingMay 2006
Shake Flasks - Concentrations
NorthMet Project
0.001
0.01
0.1
1
10
100
1000
10000
0 2 4 6 8 10 12
Cycles [weeks]
Fe
[mg
/L]
Leach (CuSO4not used)Leach
Gypsum
RaffinateNeutralizationFe/Al
Mg
Combined
Combined, noGypsumICP-MSdetection limit
Values below ICP-
MS Detection
Limit are shown
as half the limit.

Appendix C.1
Dissolution Tests Charts - Shake Flasks
Graph C.1.24
ShakeFlask_20060427.xls
SRK ConsultingMay 2006
Shake Flasks - Concentrations
NorthMet Project
0.00001
0.0001
0.001
0.01
0.1
1
0 2 4 6 8 10 12
Cycles [weeks]
Pb
[m
g/L
]
Leach (CuSO4not used)Leach
Gypsum
RaffinateNeutralizationFe/Al
Mg
Combined
Combined, noGypsumICP-MS detectionlimit
Values below ICP-
MS Detection
Limit are shown
as half the limit.

Appendix C.1
Dissolution Tests Charts - Shake Flasks
Graph C.1.25
ShakeFlask_20060427.xls
SRK ConsultingMay 2006
Shake Flasks - Concentrations
NorthMet Project
0.00001
0.0001
0.001
0.01
0.1
1
0 2 4 6 8 10 12
Cycles [weeks]
Li [
mg
/L]
Leach (CuSO4 notused)Leach
Gypsum
RaffinateNeutralizationFe/Al
Mg
Combined
Combined, noGypsumICP-MS detectionlimit
Values below ICP-
MS Detection
Limit are shown
as half the limit.

Appendix C.1
Dissolution Tests Charts - Shake Flasks
Graph C.1.26
ShakeFlask_20060427.xls
SRK ConsultingMay 2006
Shake Flasks - Concentrations
NorthMet Project
0.001
0.01
0.1
1
10
100
1000
0 2 4 6 8 10 12
Cycles [weeks]
Mg
[m
g/L
]
Leach (CuSO4not used)Leach
Gypsum
RaffinateNeutralizationFe/Al
Mg
Combined
Combined, noGypsumICP-MSdetection limit
Values below ICP-
MS Detection
Limit are shown
as half the limit.

Appendix C.1
Dissolution Tests Charts - Shake Flasks
Graph C.1.27
ShakeFlask_20060427.xls
SRK ConsultingMay 2006
Shake Flasks - Concentrations
NorthMet Project
0.00001
0.0001
0.001
0.01
0.1
1
10
0 2 4 6 8 10 12
Cycles [weeks]
Mn
[m
g/L
]
Leach (CuSO4not used)Leach
Gypsum
RaffinateNeutralizationFe/Al
Mg
Combined
Combined, noGypsumICP-MSdetection limit
Values below ICP-
MS Detection
Limit are shown
as half the limit.

Appendix C.1
Dissolution Tests Charts - Shake Flasks
Graph C.1.28
ShakeFlask_20060427.xls
SRK ConsultingMay 2006
Shake Flasks - Concentrations
NorthMet Project
0.001
0.01
0.1
1
10
0 1 2 3 4 5 6 7
Cycles [weeks]
Hg
[u
g/L
]
Leach (CuSO4not used)Leach
Gypsum
RaffinateNeutralizationFe/Al
Mg
Combined
Combined, noGypsumICP-MSdetection limit
Values below ICP-
MS Detection
Limit are shown
as half the limit.

Appendix C.1
Dissolution Tests Charts - Shake Flasks
Graph C.1.29
ShakeFlask_20060427.xls
SRK ConsultingMay 2006
Shake Flasks - Concentrations
NorthMet Project
0.00001
0.0001
0.001
0.01
0.1
1
0 2 4 6 8 10 12
Cycles [weeks]
Mo
[m
g/L
]
Leach (CuSO4not used)Leach
Gypsum
RaffinateNeutralizationFe/Al
Mg
Combined
Combined, noGypsumICP-MS detectionlimit
Values below ICP-
MS Detection
Limit are shown
as half the limit.

Appendix C.1
Dissolution Tests Charts - Shake Flasks
Graph C.1.30
ShakeFlask_20060427.xls
SRK ConsultingMay 2006
Shake Flasks - Concentrations
NorthMet Project
0.00001
0.0001
0.001
0.01
0.1
1
10
100
1000
0 2 4 6 8 10 12
Cycles [weeks]
Ni
[mg
/L]
Leach (CuSO4not used)Leach
Gypsum
RaffinateNeutralizationFe/Al
Mg
Combined
Combined, noGypsumICP-MS detectionlimit
Values below ICP-
MS Detection
Limit are shown
as half the limit.

Appendix C.1
Dissolution Tests Charts - Shake Flasks
Graph C.1.31
ShakeFlask_20060427.xls
SRK ConsultingMay 2006
Shake Flasks - Concentrations
NorthMet Project
0.01
0.1
1
10
0 2 4 6 8 10 12
Cycles [weeks]
PO
4
[mg
/L]
Leach (CuSO4 notused)Leach
Gypsum
RaffinateNeutralizationFe/Al
Mg
Combined
Combined, noGypsumICP-MS detectionlimit
Values below ICP-
MS Detection
Limit are shown
as half the limit.

Appendix C.1
Dissolution Tests Charts - Shake Flasks
Graph C.1.32
ShakeFlask_20060427.xls
SRK ConsultingMay 2006
Shake Flasks - Concentrations
NorthMet Project
0.01
0.1
1
10
100
0 2 4 6 8 10 12
Cycles [weeks]
K [
mg
/L]
Leach (CuSO4not used)Leach
Gypsum
RaffinateNeutralizationFe/Al
Mg
Combined
Combined, noGypsumICP-MSdetection limit
Values below ICP-
MS Detection
Limit are shown
as half the limit.

Appendix C.1
Dissolution Tests Charts - Shake Flasks
Graph C.1.33
ShakeFlask_20060427.xls
SRK ConsultingMay 2006
Shake Flasks - Concentrations
NorthMet Project
0.0001
0.001
0.01
0.1
0 2 4 6 8 10 12
Cycles [weeks]
Se
[mg
/L]
Leach (CuSO4not used)Leach
Gypsum
RaffinateNeutralizationFe/Al
Mg
Combined
Combined, noGypsumICP-MS detectionlimit
Values below ICP-
MS Detection
Limit are shown
as half the limit.

Appendix C.1
Dissolution Tests Charts - Shake Flasks
Graph C.1.34
ShakeFlask_20060427.xls
SRK ConsultingMay 2006
Shake Flasks - Concentrations
NorthMet Project
0.01
0.1
1
10
100
0 2 4 6 8 10 12
Cycles [weeks]
SiO
2 [
mg
/L]
Leach (CuSO4not used)Leach
Gypsum
RaffinateNeutralizationFe/Al
Mg
Combined
Combined, noGypsumICP-MSdetection limit
Values below ICP-
MS Detection
Limit are shown
as half the limit.

Appendix C.1
Dissolution Tests Charts - Shake Flasks
Graph C.1.35
ShakeFlask_20060427.xls
SRK ConsultingMay 2006
Shake Flasks - Concentrations
NorthMet Project
0.00001
0.0001
0.001
0.01
0.1
1
0 2 4 6 8 10 12
Cycles [weeks]
Ag
[m
g/L
]
Leach (CuSO4not used)Leach
Gypsum
RaffinateNeutralizationFe/Al
Mg
Combined
Combined, noGypsumICP-MSdetection limit
Values below ICP-
MS Detection
Limit are shown
as half the limit.

Appendix C.1
Dissolution Tests Charts - Shake Flasks
Graph C.1.36
ShakeFlask_20060427.xls
SRK ConsultingMay 2006
Shake Flasks - Concentrations
NorthMet Project
0.001
0.01
0.1
1
10
100
1000
10000
0 2 4 6 8 10 12
Cycles [weeks]
Na [
mg
/L]
Leach (CuSO4not used)Leach
Gypsum
RaffinateNeutralizationFe/Al
Mg
Combined
Combined, noGypsumICP-MSdetection limit
Values below ICP-
MS Detection
Limit are shown
as half the limit.
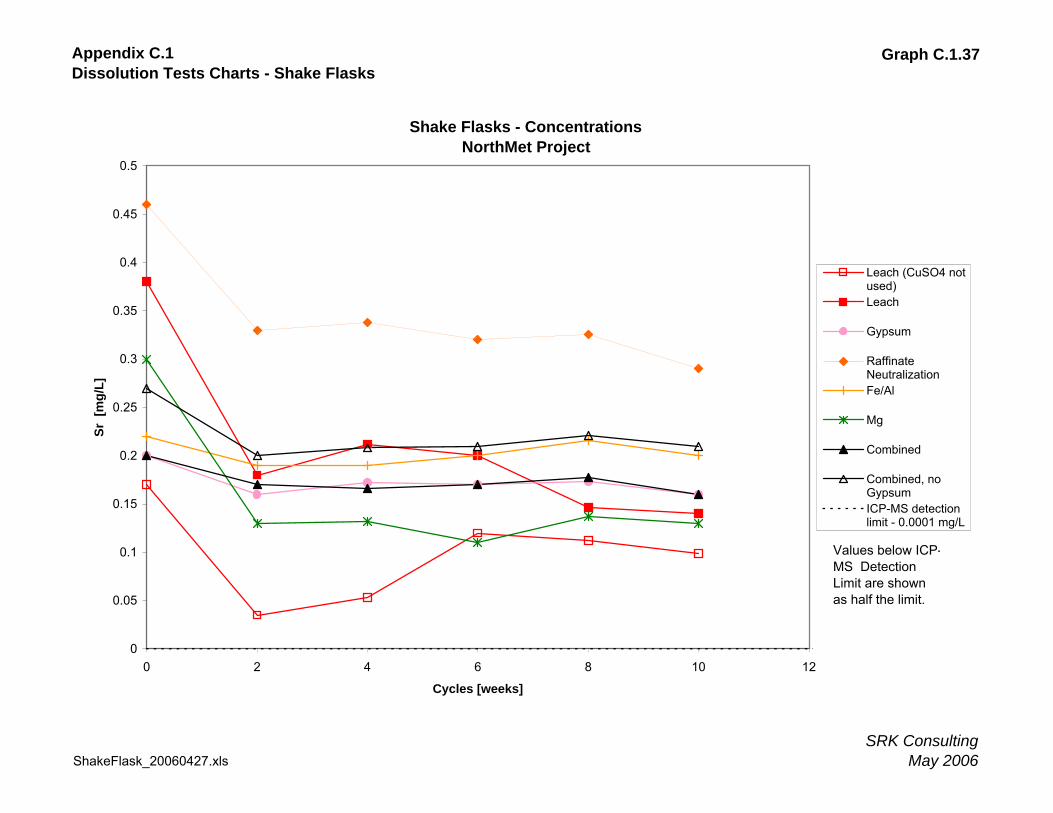
Appendix C.1
Dissolution Tests Charts - Shake Flasks
Graph C.1.37
ShakeFlask_20060427.xls
SRK ConsultingMay 2006
Shake Flasks - Concentrations
NorthMet Project
0
0.05
0.1
0.15
0.2
0.25
0.3
0.35
0.4
0.45
0.5
0 2 4 6 8 10 12
Cycles [weeks]
Sr
[m
g/L
]
Leach (CuSO4 notused)
Leach
Gypsum
RaffinateNeutralization
Fe/Al
Mg
Combined
Combined, noGypsum
ICP-MS detectionlimit - 0.0001 mg/L
Values below ICP-
MS Detection
Limit are shown
as half the limit.

Appendix C.1
Dissolution Tests Charts - Shake Flasks
Graph C.1.38
ShakeFlask_20060427.xls
SRK ConsultingMay 2006
Shake Flasks - Concentrations
NorthMet Project
0
0.0002
0.0004
0.0006
0.0008
0.001
0.0012
0 2 4 6 8 10 12
Cycles [weeks]
Te
[mg
/L]
Leach (CuSO4not used)Leach
Gypsum
RaffinateNeutralizationFe/Al
Mg
Combined
Combined, noGypsumICP-MSdetection limit
Values below ICP-
MS Detection
Limit are shown
as half the limit.

Appendix C.1
Dissolution Tests Charts - Shake Flasks
Graph C.1.39
ShakeFlask_20060427.xls
SRK ConsultingMay 2006
Shake Flasks - Concentrations
NorthMet Project
0.00001
0.0001
0.001
0.01
0 2 4 6 8 10 12
Cycles [weeks]
Tl
[m
g/L
]
Leach (CuSO4not used)Leach
Gypsum
RaffinateNeutralizationFe/Al
Mg
Combined
Combined, noGypsumICP-MSdetection limit
Values below ICP-
MS Detection
Limit are shown
as half the limit.

Appendix C.1
Dissolution Tests Charts - Shake Flasks
Graph C.1.40
ShakeFlask_20060427.xls
SRK ConsultingMay 2006
Shake Flasks - Concentrations
NorthMet Project
0.00001
0.0001
0.001
0.01
0.1
1
0 2 4 6 8 10 12
Cycles [weeks]
Th
[m
g/L
]
Leach (CuSO4not used)Leach
Gypsum
RaffinateNeutralizationFe/Al
Mg
Combined
Combined, noGypsumICP-MSdetection limit
Values below ICP-
MS Detection
Limit are shown
as half the limit.

Appendix C.1
Dissolution Tests Charts - Shake Flasks
Graph C.1.41
ShakeFlask_20060427.xls
SRK ConsultingMay 2006
Shake Flasks - Concentrations
NorthMet Project
0.00001
0.0001
0.001
0.01
0.1
1
0 2 4 6 8 10 12
Cycles [weeks]
Sn
[m
g/L
]
Leach (CuSO4not used)Leach
Gypsum
RaffinateNeutralizationFe/Al
Mg
Combined
Combined, noGypsumICP-MSdetection limit
Values below ICP-
MS Detection
Limit are shown
as half the limit.

Appendix C.1
Dissolution Tests Charts - Shake Flasks
Graph C.1.42
ShakeFlask_20060427.xls
SRK ConsultingMay 2006
Shake Flasks - Concentrations
NorthMet Project
0.00001
0.0001
0.001
0.01
0.1
1
0 2 4 6 8 10 12
Cycles [weeks]
Ti
[m
g/L
]
Leach (CuSO4not used)Leach
Gypsum
RaffinateNeutralizationFe/Al
Mg
Combined
Combined, noGypsumICP-MSdetection limit
Values below ICP-
MS Detection
Limit are shown
as half the limit.

Appendix C.1
Dissolution Tests Charts - Shake Flasks
Graph C.1.43
ShakeFlask_20060427.xls
SRK ConsultingMay 2006
Shake Flasks - Concentrations
NorthMet Project
0.00001
0.0001
0.001
0.01
0.1
0 2 4 6 8 10 12
Cycles [weeks]
U
[mg
/L]
Leach (CuSO4not used)Leach
Gypsum
RaffinateNeutralizationFe/Al
Mg
Combined
Combined, noGypsumICP-MSdetection limit
Values below ICP-
MS Detection
Limit are shown
as half the limit.

Appendix C.1
Dissolution Tests Charts - Shake Flasks
Graph C.1.44
ShakeFlask_20060427.xls
SRK ConsultingMay 2006
Shake Flasks - Concentrations
NorthMet Project
0.00001
0.0001
0.001
0.01
0.1
1
0 2 4 6 8 10 12
Cycles [weeks]
V
[mg
/L]
Leach (CuSO4not used)Leach
Gypsum
RaffinateNeutralizationFe/Al
Mg
Combined
Combined, noGypsumICP-MSdetection limit
Values below ICP-
MS Detection
Limit are shown
as half the limit.

Appendix C.1
Dissolution Tests Charts - Shake Flasks
Graph C.1.45
ShakeFlask_20060427.xls
SRK ConsultingMay 2006
Shake Flasks - Concentrations
NorthMet Project
0.0001
0.001
0.01
0.1
1
10
100
0 2 4 6 8 10 12
Cycles [weeks]
Zn
[m
g/L
]
Leach (CuSO4not used)Leach
Gypsum
RaffinateNeutralizationFe/Al
Mg
Combined
Combined, noGypsumICP-MSdetection limit
Values below ICP-
MS Detection
Limit are shown
as half the limit.

Appendix C.1
Dissolution Tests Charts - Shake Flasks
Graph C.1.46
ShakeFlask_20060427.xls
SRK ConsultingMay 2006
Shake Flasks - Concentrations
NorthMet Project
0.0001
0.001
0.01
0.1
0 2 4 6 8 10 12
Cycles [weeks]
Zr
[m
g/L
]
Leach (CuSO4not used)Leach
Gypsum
RaffinateNeutralizationFe/Al
Mg
Combined
Combined, noGypsumICP-MS detectionlimit
Values below ICP-
MS Detection
Limit are shown
as half the limit.

Appendix C.2 Humidity Cells

Appendix C.2
Dissolution Tests Charts - Humidity Cells
Graph C.2.1
Humidity Cel_20060427.xls
SRK ConsultingMay 2006
Humidity Cell- Concentrations
NorthMet Project
0
2
4
6
8
10
12
0 1 2 3 4 5 6 7 8 9 10
Cycles [weeks]
pH
Leach (CuSO4 notused)Leach
Gypsum
Raffinate Neutralization
Fe/Al
Mg
Combined
Combined, no Gypsum

Appendix C.2
Dissolution Tests Charts - Humidity Cells
Graph C.2.2
Humidity Cel_20060427.xls
SRK ConsultingMay 2006
Humidity Cell - Concentrations
NorthMet Project
0
5000
10000
15000
20000
25000
30000
35000
40000
0 1 2 3 4 5 6 7 8 9 10
Cycles [weeks]
Co
nd
ucti
vit
y [
um
ho
s/c
m]
Leach (CuSO4 notused)Leach
Gypsum
Raffinate Neutralization
Fe/Al
Mg
Combined
Combined, no Gypsum

Appendix C.2
Dissolution Tests Charts - Humidity Cells
Graph C.2.3
Humidity Cel_20060427.xls
SRK ConsultingMay 2006
Humidity Cell - Concentrations
NorthMet Project
1
10
100
1000
10000
0 1 2 3 4 5 6 7 8 9 10
Cycles [weeks]
Acid
ity (
pH
=4.5
) [m
gC
aC
O3/L
] Leach (CuSO4 notused)Leach
Gypsum
Raffinate Neutralization
Fe/Al
Mg
Combined
Combined, no Gypsum

Appendix C.2
Dissolution Tests Charts - Humidity Cells
Graph C.2.4
Humidity Cel_20060427.xls
SRK ConsultingMay 2006
Humidity Cell - Concentrations
NorthMet Project
1
10
100
1000
10000
100000
0 1 2 3 4 5 6 7 8 9 10
Cycles [weeks]
Acid
ity (
pH
=4.5
) [m
gC
aC
O3/L
] Leach (CuSO4 notused)Leach
Gypsum
Raffinate Neutralization
Fe/Al
Mg
Combined
Combined, no Gypsum

Appendix C.2
Dissolution Tests Charts - Humidity Cells
Graph C.2.5
Humidity Cel_20060427.xls
SRK ConsultingMay 2006
Humidity Cell - Concentrations
NorthMet Project
0
5
10
15
20
25
30
35
40
45
50
0 1 2 3 4 5 6 7 8 9 10
Cycles [weeks]
Alk
alin
ity [
mg
CaC
O3/L
]
Leach (CuSO4 notused)Leach
Gypsum
Raffinate Neutralization
Fe/Al
Mg
Combined
Combined, no Gypsum

Appendix C.2
Dissolution Tests Charts - Humidity Cells
Graph C.2.6
Humidity Cel_20060427.xls
SRK ConsultingMay 2006
Humidity Cell - Concentrations
NorthMet Project
0
1
2
3
4
5
6
7
8
9
10
0 1 2 3 4 5 6 7 8 9 10
Cycles [weeks]
Ino
rgan
ic C
[m
g/L
]
Leach (CuSO4 notused)Leach
Gypsum
Raffinate Neutralization
Fe/Al
Mg
Combined
Combined, no Gypsum

Appendix C.2
Dissolution Tests Charts - Humidity Cells
Graph C.2.7
Humidity Cel_20060427.xls
SRK ConsultingMay 2006
Humidity Cell - Concentrations
NorthMet Project
0
1000
2000
3000
4000
5000
6000
7000
8000
9000
10000
0 1 2 3 4 5 6 7 8 9 10
Cycles [weeks]
Hard
ness [
Ca C
O3 m
g/L
]
Leach (CuSO4 notused)Leach
Gypsum
Raffinate Neutralization
Fe/Al
Mg
Combined
Combined, no Gypsum
Values below
Detection Limit
are shown as half
the limit.

Appendix C.2
Dissolution Tests Charts - Humidity Cells
Graph C.2.8
Humidity Cel_20060427.xls
SRK ConsultingMay 2006
Humidity Cell - Concentrations
NorthMet Project
1
10
100
0 1 2 3 4 5 6 7 8 9 10
Cycles [weeks]
F [
mg
/L]
Leach (CuSO4 notused)Leach
Gypsum
RaffinateNeutralizationFe/Al
Mg
Combined
Combined, noGypsumDetection limit
Values below
Detection Limit
are shown as half
the limit.

Appendix C.2
Dissolution Tests Charts - Humidity Cells
Graph C.2.9
Humidity Cel_20060427.xls
SRK ConsultingMay 2006
Humidity Cell - Concentrations
NorthMet Project
0.1
1
10
100
1000
10000
0 1 2 3 4 5 6 7 8 9 10
Cycles [weeks]
Cl [m
g/L
]
Leach (CuSO4 notused)Leach
Gypsum
RaffinateNeutralizationFe/Al
Mg
Combined
Combined, noGypsumDetection limit
Values below
Detection Limit
are shown as half
the limit.

Appendix C.2
Dissolution Tests Charts - Humidity Cells
Graph C.2.10
Humidity Cel_20060427.xls
SRK ConsultingMay 2006
Humidity Cell - Concentrations
NorthMet Project
0
5000
10000
15000
20000
25000
0 1 2 3 4 5 6 7 8 9 10
Cycles [weeks]
SO
4 [
mg
/L]
Leach (CuSO4 notused)Leach
Gypsum
RaffinateNeutralizationFe/Al
Mg
Combined
Combined, noGypsumDetection limit - 0.5mg/L
Values below
Detection Limit
are shown as half
the limit.

Appendix C.2
Dissolution Tests Charts - Humidity Cells
Graph C.2.11
Humidity Cel_20060427.xls
SRK ConsultingMay 2006
Humidity Cell - Concentrations
NorthMet Project
0.0001
0.001
0.01
0.1
1
10
100
1000
0 1 2 3 4 5 6 7 8 9 10
Cycles [weeks]
Al
[mg
/L]
Leach (CuSO4 notused)
Leach
Gypsum
RaffinateNeutralization
Fe/Al
Mg
Combined
Combined, noGypsum
ICP-MS detection limit
Values below ICP-
MS Detection
Limit are shown
as half the limit.

Appendix C.2
Dissolution Tests Charts - Humidity Cells
Graph C.2.12
Humidity Cel_20060427.xls
SRK ConsultingMay 2006
Humidity Cell - Concentrations
NorthMet Project
0.00001
0.0001
0.001
0.01
0.1
1
0 1 2 3 4 5 6 7 8 9 10
Cycles [weeks]
Sb
[m
g/L
]
Leach (CuSO4 notused)Leach
Gypsum
RaffinateNeutralizationFe/Al
Mg
Combined
Combined, noGypsumICP-MS detection limit
Values below ICP-
MS Detection
Limit are shown
as half the limit.

Appendix C.2
Dissolution Tests Charts - Humidity Cells
Graph C.2.13
Humidity Cel_20060427.xls
SRK ConsultingMay 2006
Humidity Cell - Concentrations
NorthMet Project
0.00001
0.0001
0.001
0.01
0.1
1
0 1 2 3 4 5 6 7 8 9 10
Cycles [weeks]
As [
mg
/L]
Leach (CuSO4 notused)Leach
Gypsum
RaffinateNeutralizationFe/Al
Mg
Combined
Combined, noGypsumICP-MS detection limit
Values below ICP-
MS Detection
Limit are shown
as half the limit.

Appendix C.2
Dissolution Tests Charts - Humidity Cells
Graph C.2.14
Humidity Cel_20060427.xls
SRK ConsultingMay 2006
Humidity Cell - Concentrations
NorthMet Project
0.00001
0.0001
0.001
0.01
0.1
1
0 1 2 3 4 5 6 7 8 9 10
Cycles [weeks]
Ba [
mg
/L]
Leach (CuSO4 notused)Leach
Gypsum
RaffinateNeutralizationFe/Al
Mg
Combined
Combined, noGypsumICP-MS detection limit
Values below ICP-
MS Detection
Limit are shown
as half the limit.

Appendix C.2
Dissolution Tests Charts - Humidity Cells
Graph C.2.15
Humidity Cel_20060427.xls
SRK ConsultingMay 2006
Humidity Cell - Concentrations
NorthMet Project
0.00001
0.0001
0.001
0.01
0.1
0 1 2 3 4 5 6 7 8 9 10
Cycles [weeks]
Be [
mg
/L]
Leach (CuSO4 notused)Leach
Gypsum
RaffinateNeutralizationFe/Al
Mg
Combined
Combined, noGypsumICP-MS detection limit
Values below ICP-
MS Detection
Limit are shown
as half the limit.

Appendix C.2
Dissolution Tests Charts - Humidity Cells
Graph C.2.16
Humidity Cel_20060427.xls
SRK ConsultingMay 2006
Humidity Cell - Concentrations
NorthMet Project
0.00001
0.0001
0.001
0.01
0.1
0 1 2 3 4 5 6 7 8 9 10
Cycles [weeks]
Bi
[mg
/L]
Leach (CuSO4 notused)Leach
Gypsum
RaffinateNeutralizationFe/Al
Mg
Combined
Combined, noGypsumICP-MS detection limit
Values below ICP-
MS Detection
Limit are shown
as half the limit.

Appendix C.2
Dissolution Tests Charts - Humidity Cells
Graph C.2.17
Humidity Cel_20060427.xls
SRK ConsultingMay 2006
Humidity Cell - Concentrations
NorthMet Project
0.001
0.01
0.1
1
0 1 2 3 4 5 6 7 8 9 10
Cycles [weeks]
B [
mg
/L]
Leach (CuSO4 notused)Leach
Gypsum
RaffinateNeutralizationFe/Al
Mg
Combined
Combined, noGypsumICP-MS detection limit- 0.001 mg/L
Values below ICP-
MS Detection
Limit are shown
as half the limit.

Appendix C.2
Dissolution Tests Charts - Humidity Cells
Graph C.2.18
Humidity Cel_20060427.xls
SRK ConsultingMay 2006
Humidity Cell - Concentrations
NorthMet Project
0.00001
0.0001
0.001
0.01
0.1
1
0 1 2 3 4 5 6 7 8 9 10
Cycles [weeks]
Cd
[m
g/L
]
Leach (CuSO4 notused)Leach
Gypsum
RaffinateNeutralizationFe/Al
Mg
Combined
Combined, noGypsumICP-MS detection limit
Values below ICP-
MS Detection
Limit are shown
as half the limit.

Appendix C.2
Dissolution Tests Charts - Humidity Cells
Graph C.2.19
Humidity Cel_20060427.xls
SRK ConsultingMay 2006
Humidity Cell - Concentrations
NorthMet Project
0
100
200
300
400
500
600
700
0 1 2 3 4 5 6 7 8 9 10
Cycles [weeks]
Ca [
mg
/L]
Leach (CuSO4 notused)
Leach
Gypsum
RaffinateNeutralization
Fe/Al
Mg
Combined
Combined, noGypsum
ICP-MS detection limit- 0.01 mg/L
Values below ICP-
MS Detection
Limit are shown
as half the limit.

Appendix C.2
Dissolution Tests Charts - Humidity Cells
Graph C.2.20
Humidity Cel_20060427.xls
SRK ConsultingMay 2006
Humidity Cell - Concentrations
NorthMet Project
0.0001
0.001
0.01
0.1
1
10
0 1 2 3 4 5 6 7 8 9 10
Cycles [weeks]
Cr
[mg
/L]
Leach (CuSO4 notused)
Leach
Gypsum
RaffinateNeutralization
Fe/Al
Mg
Combined
Combined, noGypsum
ICP-MS detection limit
Values below ICP-
MS Detection
Limit are shown
as half the limit.

Appendix C.2
Dissolution Tests Charts - Humidity Cells
Graph C.2.21
Humidity Cel_20060427.xls
SRK ConsultingMay 2006
Humidity Cell - Concentrations
NorthMet Project
0.00001
0.0001
0.001
0.01
0.1
1
10
100
1000
0 1 2 3 4 5 6 7 8 9 10
Cycles [weeks]
Co
[m
g/L
]
Leach (CuSO4 notused)Leach
Gypsum
RaffinateNeutralizationFe/Al
Mg
Combined
Combined, noGypsumICP-MS detection limit
Values below ICP-
MS Detection
Limit are shown
as half the limit.

Appendix C.2
Dissolution Tests Charts - Humidity Cells
Graph C.2.22
Humidity Cel_20060427.xls
SRK ConsultingMay 2006
Humidity Cell - Concentrations
NorthMet Project
0.00001
0.0001
0.001
0.01
0.1
1
10
100
1000
10000
0 1 2 3 4 5 6 7 8 9 10
Cycles [weeks]
Cu
[m
g/L
]
Leach (CuSO4 notused)Leach
Gypsum
RaffinateNeutralizationFe/Al
Mg
Combined
Combined, noGypsumICP-MS detection limit
Values below ICP-
MS Detection
Limit are shown
as half the limit.

Appendix C.2
Dissolution Tests Charts - Humidity Cells
Graph C.2.23
Humidity Cel_20060427.xls
SRK ConsultingMay 2006
Humidity Cell - Concentrations
NorthMet Project
0.001
0.01
0.1
1
10
100
1000
10000
0 1 2 3 4 5 6 7 8 9 10
Cycles [weeks]
Fe [
mg
/L]
Leach (CuSO4 notused)
Leach
Gypsum
RaffinateNeutralization
Fe/Al
Mg
Combined
Combined, noGypsum
ICP-MS detection limit
Values below ICP-
MS Detection
Limit are shown
as half the limit.

Appendix C.2
Dissolution Tests Charts - Humidity Cells
Graph C.2.24
Humidity Cel_20060427.xls
SRK ConsultingMay 2006
Humidity Cell - Concentrations
NorthMet Project
0.00001
0.0001
0.001
0.01
0.1
1
10
0 1 2 3 4 5 6 7 8 9 10
Cycles [weeks]
Pb
[m
g/L
]
Leach (CuSO4 notused)Leach
Gypsum
RaffinateNeutralizationFe/Al
Mg
Combined
Combined, noGypsumICP-MS detection limit
Values below ICP-
MS Detection
Limit are shown
as half the limit.

Appendix C.2
Dissolution Tests Charts - Humidity Cells
Graph C.2.25
Humidity Cel_20060427.xls
SRK ConsultingMay 2006
Humidity Cell - Concentrations
NorthMet Project
0.00001
0.0001
0.001
0.01
0.1
1
0 1 2 3 4 5 6 7 8 9 10
Cycles [weeks]
Li
[mg
/L]
Leach (CuSO4 notused)Leach
Gypsum
RaffinateNeutralizationFe/Al
Mg
Combined
Combined, noGypsumICP-MS detection limit
Values below ICP-
MS Detection
Limit are shown
as half the limit.

Appendix C.2
Dissolution Tests Charts - Humidity Cells
Graph C.2.26
Humidity Cel_20060427.xls
SRK ConsultingMay 2006
Humidity Cell - Concentrations
NorthMet Project
0.001
0.01
0.1
1
10
100
1000
10000
0 1 2 3 4 5 6 7 8 9 10
Cycles [weeks]
Mg
[m
g/L
]
Leach (CuSO4 notused)
Leach
Gypsum
RaffinateNeutralization
Fe/Al
Mg
Combined
Combined, noGypsum
ICP-MS detection limit
Values below ICP-
MS Detection
Limit are shown
as half the limit.

Appendix C.2
Dissolution Tests Charts - Humidity Cells
Graph C.2.27
Humidity Cel_20060427.xls
SRK ConsultingMay 2006
Humidity Cell - Concentrations
NorthMet Project
0.00001
0.0001
0.001
0.01
0.1
1
10
100
0 1 2 3 4 5 6 7 8 9 10
Cycles [weeks]
Mn
[m
g/L
]
Leach (CuSO4 notused)Leach
Gypsum
RaffinateNeutralizationFe/Al
Mg
Combined
Combined, noGypsumICP-MS detection limit
Values below ICP-
MS Detection
Limit are shown
as half the limit.

Appendix C.2
Dissolution Tests Charts - Humidity Cells
Graph C.2.28
Humidity Cel_20060427.xls
SRK ConsultingMay 2006
Humidity Cell - Concentrations
NorthMet Project
0.001
0.01
0.1
1
10
0 1 2 3 4 5 6 7 8 9 10
Cycles [weeks]
Hg
[u
g/L
]
Leach (CuSO4 notused)Leach
Gypsum
RaffinateNeutralizationFe/Al
Mg
Combined
Combined, noGypsumICP-MS detection limit
Values below ICP-
MS Detection
Limit are shown
as half the limit.

Appendix C.2
Dissolution Tests Charts - Humidity Cells
Graph C.2.29
Humidity Cel_20060427.xls
SRK ConsultingMay 2006
Humidity Cell - Concentrations
NorthMet Project
0.00001
0.0001
0.001
0.01
0.1
1
0 1 2 3 4 5 6 7 8 9 10
Cycles [weeks]
Mo
[m
g/L
]
Leach (CuSO4 notused)
Leach
Gypsum
RaffinateNeutralization
Fe/Al
Mg
Combined
Combined, noGypsum
ICP-MS detection limit
Values below ICP-
MS Detection
Limit are shown
as half the limit.

Appendix C.2
Dissolution Tests Charts - Humidity Cells
Graph C.2.30
Humidity Cel_20060427.xls
SRK ConsultingMay 2006
Humidity Cell - Concentrations
NorthMet Project
0.00001
0.0001
0.001
0.01
0.1
1
10
100
1000
10000
0 1 2 3 4 5 6 7 8 9 10
Cycles [weeks]
Ni
[mg
/L]
Leach (CuSO4 notused)Leach
Gypsum
RaffinateNeutralizationFe/Al
Mg
Combined
Combined, noGypsumICP-MS detection limit
Values below ICP-
MS Detection
Limit are shown
as half the limit.

Appendix C.2
Dissolution Tests Charts - Humidity Cells
Graph C.2.31
Humidity Cel_20060427.xls
SRK ConsultingMay 2006
Humidity Cell - Concentrations
NorthMet Project
0.01
0.1
1
10
100
0 1 2 3 4 5 6 7 8 9 10
Cycles [weeks]
PO
4 [
mg
/L]
Leach (CuSO4 notused)Leach
Gypsum
RaffinateNeutralizationFe/Al
Mg
Combined
Combined, noGypsumICP-MS detection limit
Values below ICP-
MS Detection
Limit are shown
as half the limit.

Appendix C.2
Dissolution Tests Charts - Humidity Cells
Graph C.2.32
Humidity Cel_20060427.xls
SRK ConsultingMay 2006
Humidity Cell - Concentrations
NorthMet Project
0.01
0.1
1
10
100
0 1 2 3 4 5 6 7 8 9 10
Cycles [weeks]
K [
mg
/L]
Leach (CuSO4 notused)Leach
Gypsum
RaffinateNeutralizationFe/Al
Mg
Combined
Combined, noGypsumICP-MS detection limit
Values below ICP-
MS Detection
Limit are shown
as half the limit.

Appendix C.2
Dissolution Tests Charts - Humidity Cells
Graph C.2.33
Humidity Cel_20060427.xls
SRK ConsultingMay 2006
Humidity Cell - Concentrations
NorthMet Project
0.0001
0.001
0.01
0.1
0 1 2 3 4 5 6 7 8 9 10
Cycles [weeks]
Se [
mg
/L]
Leach (CuSO4 notused)Leach
Gypsum
RaffinateNeutralizationFe/Al
Mg
Combined
Combined, noGypsumICP-MS detection limit
Values below ICP-
MS Detection
Limit are shown
as half the limit.

Appendix C.2
Dissolution Tests Charts - Humidity Cells
Graph C.2.34
Humidity Cel_20060427.xls
SRK ConsultingMay 2006
Humidity Cell - Concentrations
NorthMet Project
0.01
0.1
1
10
100
0 1 2 3 4 5 6 7 8 9 10
Cycles [weeks]
SiO
2 [
mg
/L]
Leach (CuSO4 notused)Leach
Gypsum
RaffinateNeutralizationFe/Al
Mg
Combined
Combined, noGypsumICP-MS detection limit
Values below ICP-
MS Detection
Limit are shown
as half the limit.

Appendix C.2
Dissolution Tests Charts - Humidity Cells
Graph C.2.35
Humidity Cel_20060427.xls
SRK ConsultingMay 2006
Humidity Cell - Concentrations
NorthMet Project
0.00001
0.0001
0.001
0.01
0.1
1
0 1 2 3 4 5 6 7 8 9 10
Cycles [weeks]
Ag
[m
g/L
]
Leach (CuSO4 notused)Leach
Gypsum
RaffinateNeutralizationFe/Al
Mg
Combined
Combined, noGypsumICP-MS detection limit
Values below ICP-
MS Detection
Limit are shown
as half the limit.

Appendix C.2
Dissolution Tests Charts - Humidity Cells
Graph C.2.36
Humidity Cel_20060427.xls
SRK ConsultingMay 2006
Humidity Cell - Concentrations
NorthMet Project
0.001
0.01
0.1
1
10
100
1000
10000
0 1 2 3 4 5 6 7 8 9 10
Cycles [weeks]
Na [
mg
/L]
Leach (CuSO4 notused)Leach
Gypsum
RaffinateNeutralizationFe/Al
Mg
Combined
Combined, noGypsumICP-MS detection limit
Values below ICP-
MS Detection
Limit are shown
as half the limit.

Appendix C.2
Dissolution Tests Charts - Humidity Cells
Graph C.2.37
Humidity Cel_20060427.xls
SRK ConsultingMay 2006
Humidity Cell - Concentrations
NorthMet Project
0
0.2
0.4
0.6
0.8
1
1.2
0 1 2 3 4 5 6 7 8 9 10
Cycles [weeks]
Sr
[mg
/L]
Leach (CuSO4 notused)
Leach
Gypsum
RaffinateNeutralization
Fe/Al
Mg
Combined
Combined, noGypsum
ICP-MS detection limit- 0.0001 mg/L
Values below ICP-
MS Detection
Limit are shown
as half the limit.

Appendix C.2
Dissolution Tests Charts - Humidity Cells
Graph C.2.38
Humidity Cel_20060427.xls
SRK ConsultingMay 2006
Humidity Cell - Concentrations
NorthMet Project
0
0.0005
0.001
0.0015
0.002
0.0025
0 1 2 3 4 5 6 7 8 9 10
Cycles [weeks]
Te [
mg
/L]
Leach (CuSO4 notused)Leach
Gypsum
RaffinateNeutralizationFe/Al
Mg
Combined
Combined, noGypsumICP-MS detection limit
Values below ICP-
MS Detection
Limit are shown
as half the limit.

Appendix C.2
Dissolution Tests Charts - Humidity Cells
Graph C.2.39
Humidity Cel_20060427.xls
SRK ConsultingMay 2006
Humidity Cell - Concentrations
NorthMet Project
0.00001
0.0001
0.001
0.01
0.1
0 1 2 3 4 5 6 7 8 9 10
Cycles [weeks]
Tl [m
g/L
]
Leach (CuSO4 notused)Leach
Gypsum
RaffinateNeutralizationFe/Al
Mg
Combined
Combined, noGypsumICP-MS detection limit
Values below ICP-
MS Detection
Limit are shown
as half the limit.

Appendix C.2
Dissolution Tests Charts - Humidity Cells
Graph C.2.40
Humidity Cel_20060427.xls
SRK ConsultingMay 2006
Humidity Cell - Concentrations
NorthMet Project
0.00001
0.0001
0.001
0.01
0.1
1
0 1 2 3 4 5 6 7 8 9 10
Cycles [weeks]
Tl
[mg
/L]
Leach (CuSO4 notused)Leach
Gypsum
RaffinateNeutralizationFe/Al
Mg
Combined
Combined, noGypsumICP-MS detection limit
Values below ICP-
MS Detection
Limit are shown
as half the limit.

Appendix C.2
Dissolution Tests Charts - Humidity Cells
Graph C.2.41
Humidity Cel_20060427.xls
SRK ConsultingMay 2006
Humidity Cell - Concentrations
NorthMet Project
0.00001
0.0001
0.001
0.01
0 1 2 3 4 5 6 7 8 9 10
Cycles [weeks]
Sn
[m
g/L
]
Leach (CuSO4 notused)Leach
Gypsum
RaffinateNeutralizationFe/Al
Mg
Combined
Combined, noGypsumICP-MS detection limit
Values below ICP-
MS Detection
Limit are shown
as half the limit.

Appendix C.2
Dissolution Tests Charts - Humidity Cells
Graph C.2.42
Humidity Cel_20060427.xls
SRK ConsultingMay 2006
Humidity Cell - Concentrations
NorthMet Project
0.0001
0.001
0.01
0.1
1
10
0 1 2 3 4 5 6 7 8 9 10
Cycles [weeks]
Ti
[mg
/L]
Leach (CuSO4 notused)
Leach
Gypsum
RaffinateNeutralization
Fe/Al
Mg
Combined
Combined, noGypsum
ICP-MS detection limit
Values below ICP-
MS Detection
Limit are shown
as half the limit.

Appendix C.2
Dissolution Tests Charts - Humidity Cells
Graph C.2.43
Humidity Cel_20060427.xls
SRK ConsultingMay 2006
Humidity Cell - Concentrations
NorthMet Project
0.00001
0.0001
0.001
0.01
0.1
0 1 2 3 4 5 6 7 8 9 10
Cycles [weeks]
U [
mg
/L]
Leach (CuSO4 notused)
Leach
Gypsum
RaffinateNeutralization
Fe/Al
Mg
Combined
Combined, noGypsum
ICP-MS detection limit
Values below ICP-
MS Detection
Limit are shown
as half the limit.

Appendix C.2
Dissolution Tests Charts - Humidity Cells
Graph C.2.44
Humidity Cel_20060427.xls
SRK ConsultingMay 2006
Humidity Cell - Concentrations
NorthMet Project
0.00001
0.0001
0.001
0.01
0.1
1
0 1 2 3 4 5 6 7 8 9 10
Cycles [weeks]
V [
mg
/L]
Leach (CuSO4 notused)Leach
Gypsum
RaffinateNeutralizationFe/Al
Mg
Combined
Combined, noGypsumICP-MS detection limit
Values below ICP-
MS Detection
Limit are shown
as half the limit.

Appendix C.2
Dissolution Tests Charts - Humidity Cells
Graph C.2.45
Humidity Cel_20060427.xls
SRK ConsultingMay 2006
Humidity Cell - Concentrations
NorthMet Project
0.0001
0.001
0.01
0.1
1
10
100
1000
0 1 2 3 4 5 6 7 8 9 10
Cycles [weeks]
Zn
[m
g/L
]
Leach (CuSO4 notused)Leach
Gypsum
RaffinateNeutralizationFe/Al
Mg
Combined
Combined, noGypsumICP-MS detection limit
Values below ICP-
MS Detection
Limit are shown
as half the limit.

Appendix C.2
Dissolution Tests Charts - Humidity Cells
Graph C.2.46
Humidity Cel_20060427.xls
SRK ConsultingMay 2006
Humidity Cell - Concentrations
NorthMet Project
0
0.005
0.01
0.015
0.02
0.025
0 1 2 3 4 5 6 7 8 9 10
Cycles [weeks]
Zr
[mg
/L]
Leach (CuSO4 notused)Leach
Gypsum
RaffinateNeutralizationFe/Al
Mg
Combined
Combined, noGypsumICP-MS detection limit
Values below ICP-
MS Detection
Limit are shown
as half the limit.

Appendix C.3 DNR Reactors

Appendix C.3
Dissolution Tests Charts - DNR Reactors
Graph C.3.1
DNR Reactor_20060426.xls
SRK ConsultingMay 2006
DNR Reactor - Concentrations
NorthMet Project
0
2
4
6
8
10
12
0 2 4 6 8 10 12
Cycles [weeks]
pH
Leach (CuSO4 notused)Leach
Gypsum
Raffinate Neutralization
Fe/Al
Mg
Combined
Combined, no Gypsum

Appendix C.3
Dissolution Tests Charts - DNR Reactors
Graph C.3.2
DNR Reactor_20060426.xls
SRK ConsultingMay 2006
DNR Reactor - Concentrations
NorthMet Project
0
1000
2000
3000
4000
5000
6000
7000
8000
9000
0 2 4 6 8 10 12
Cycles [weeks]
Co
nd
ucti
vit
y [
um
ho
s/c
m]
Leach (CuSO4 notused)Leach
Gypsum
Raffinate Neutralization
Fe/Al
Mg
Combined
Combined, no Gypsum

Appendix C.3
Dissolution Tests Charts - DNR Reactors
Graph C.3.3
DNR Reactor_20060426.xls
SRK ConsultingMay 2006
DNR Reactor - Concentrations
NorthMet Project
1
10
100
1000
0 2 4 6 8 10 12
Cycles [weeks]
Acid
ity (
pH
=4.5
) [m
gC
aC
O3/L
]
Leach (CuSO4 notused)Leach
Gypsum
Raffinate Neutralization
Fe/Al
Mg
Combined
Combined, no Gypsum
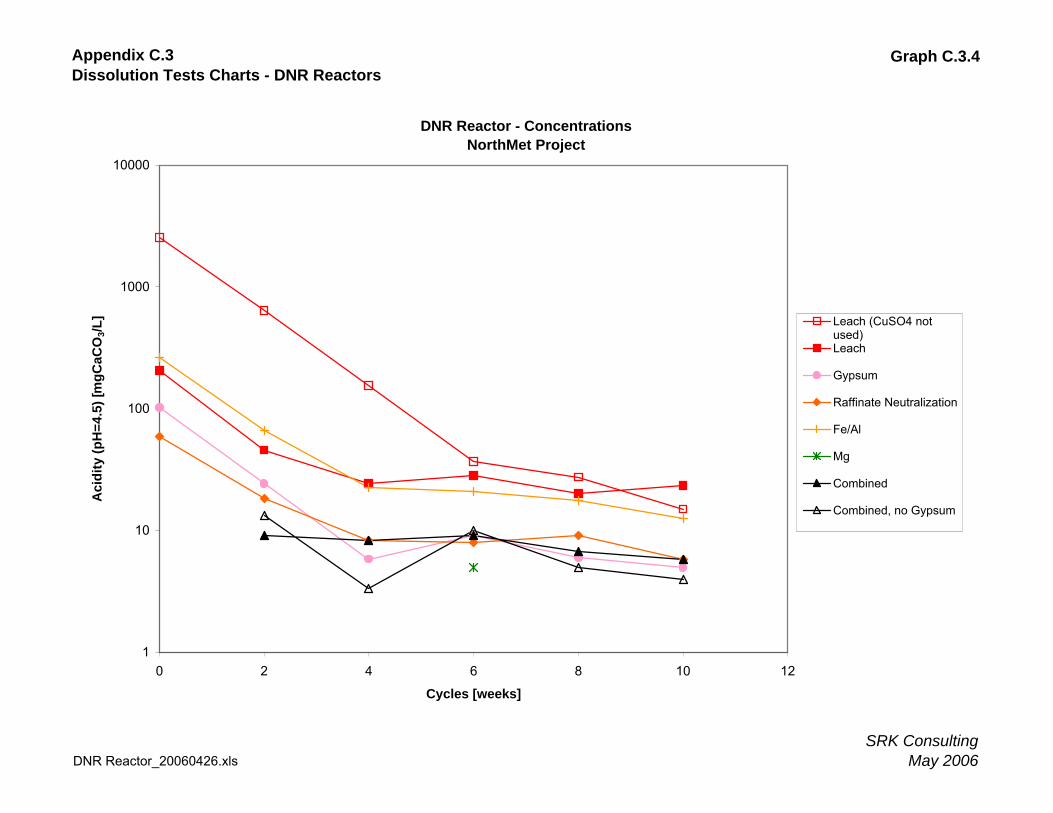
Appendix C.3
Dissolution Tests Charts - DNR Reactors
Graph C.3.4
DNR Reactor_20060426.xls
SRK ConsultingMay 2006
DNR Reactor - Concentrations
NorthMet Project
1
10
100
1000
10000
0 2 4 6 8 10 12
Cycles [weeks]
Acid
ity (
pH
=4.5
) [m
gC
aC
O3/L
] Leach (CuSO4 notused)Leach
Gypsum
Raffinate Neutralization
Fe/Al
Mg
Combined
Combined, no Gypsum

Appendix C.3
Dissolution Tests Charts - DNR Reactors
Graph C.3.5
DNR Reactor_20060426.xls
SRK ConsultingMay 2006
DNR Reactor - Concentrations
NorthMet Project
0
10
20
30
40
50
60
70
0 2 4 6 8 10 12
Cycles [weeks]
Alk
alin
ity [
mg
CaC
O3/L
]
Leach (CuSO4 notused)Leach
Gypsum
Raffinate Neutralization
Fe/Al
Mg
Combined
Combined, no Gypsum

Appendix C.3
Dissolution Tests Charts - DNR Reactors
Graph C.3.6
DNR Reactor_20060426.xls
SRK ConsultingMay 2006
DNR Reactor - Concentrations
NorthMet Project
0
2
4
6
8
10
12
0 2 4 6 8 10 12
Cycles [weeks]
Ino
rgan
ic C
[m
g/L
]
Leach (CuSO4 notused)Leach
Gypsum
Raffinate Neutralization
Fe/Al
Mg
Combined
Combined, no Gypsum

Appendix C.3
Dissolution Tests Charts - DNR Reactors
Graph C.3.7
DNR Reactor_20060426.xls
SRK ConsultingMay 2006
DNR Reactor - Concentrations
NorthMet Project
0
500
1000
1500
2000
2500
3000
3500
4000
0 2 4 6 8 10 12
Cycles [weeks]
Hard
ness [
Ca C
O3 m
g/L
]
Leach (CuSO4 notused)Leach
Gypsum
Raffinate Neutralization
Fe/Al
Mg
Combined
Combined, no Gypsum

Appendix C.3
Dissolution Tests Charts - DNR Reactors
Graph C.3.8
DNR Reactor_20060426.xls
SRK ConsultingMay 2006
DNR Reactor - Concentrations
NorthMet Project
0
0.2
0.4
0.6
0.8
1
1.2
0 2 4 6 8 10 12
Cycles [weeks]
F [
mg
/L]
Leach (CuSO4 notused)Leach
Gypsum
RaffinateNeutralizationFe/Al
Mg
Combined
Combined, noGypsumDetection limit
Values below
Detection Limit
are shown as half
the limit.

Appendix C.3
Dissolution Tests Charts - DNR Reactors
Graph C.3.9
DNR Reactor_20060426.xls
SRK ConsultingMay 2006
DNR Reactor - Concentrations
NorthMet Project
0.1
1
10
100
1000
0 1 2 3 4 5 6 7 8 9 10 11 12
Cycles [weeks]
Cl [m
g/L
]
Leach (CuSO4 notused)Leach
Gypsum
RaffinateNeutralizationFe/Al
Mg
Combined
Combined, noGypsumDetection limit
Values below
Detection Limit
are shown as half
the limit.

Appendix C.3
Dissolution Tests Charts - DNR Reactors
Graph C.3.10
DNR Reactor_20060426.xls
SRK ConsultingMay 2006
DNR Reactor - Concentrations
NorthMet Project
0
500
1000
1500
2000
2500
3000
3500
4000
4500
5000
0 2 4 6 8 10 12
Cycles [weeks]
SO
4 [
mg
/L]
Leach (CuSO4 notused)Leach
Gypsum
RaffinateNeutralizationFe/Al
Mg
Combined
Combined, noGypsumDetection limit - 0.5mg/L
Values below
Detection Limit
are shown as half
the limit.

Appendix C.3
Dissolution Tests Charts - DNR Reactors
Graph C.3.11
DNR Reactor_20060426.xls
SRK ConsultingMay 2006
DNR Reactor - Concentrations
NorthMet Project
0.0001
0.001
0.01
0.1
1
10
100
0 2 4 6 8 10 12
Cycles [weeks]
Al [m
g/L
]
Leach (CuSO4 notused)Leach
Gypsum
RaffinateNeutralizationFe/Al
Mg
Combined
Combined, noGypsumICP-MS detection limit
Values below ICP
MS Detection
Limit are shown
as half the limit.

Appendix C.3
Dissolution Tests Charts - DNR Reactors
Graph C.3.12
DNR Reactor_20060426.xls
SRK ConsultingMay 2006
DNR Reactor - Concentrations
NorthMet Project
0
0.0001
0.0002
0.0003
0.0004
0.0005
0.0006
0.0007
0.0008
0.0009
0.001
0 2 4 6 8 10 12
Cycles [weeks]
Sb
[m
g/L
]
Leach (CuSO4 notused)Leach
Gypsum
RaffinateNeutralizationFe/Al
Mg
Combined
Combined, noGypsumICP-MS detection limit
Values below ICP
MS Detection
Limit are shown
as half the limit.

Appendix C.3
Dissolution Tests Charts - DNR Reactors
Graph C.3.13
DNR Reactor_20060426.xls
SRK ConsultingMay 2006
DNR Reactor - Concentrations
NorthMet Project
0.00001
0.0001
0.001
0.01
0.1
1
0 2 4 6 8 10 12
Cycles [weeks]
As [
mg
/L]
Leach (CuSO4 notused)Leach
Gypsum
RaffinateNeutralizationFe/Al
Mg
Combined
Combined, noGypsumICP-MS detection limit
Values below ICP
MS Detection
Limit are shown
as half the limit.

Appendix C.3
Dissolution Tests Charts - DNR Reactors
Graph C.3.14
DNR Reactor_20060426.xls
SRK ConsultingMay 2006
DNR Reactor - Concentrations
NorthMet Project
0.00001
0.0001
0.001
0.01
0.1
1
0 2 4 6 8 10 12
Cycles [weeks]
Ba [
mg
/L]
Leach (CuSO4 notused)Leach
Gypsum
RaffinateNeutralizationFe/Al
Mg
Combined
Combined, noGypsumICP-MS detection limit
Values below ICP
MS Detection
Limit are shown
as half the limit.

Appendix C.3
Dissolution Tests Charts - DNR Reactors
Graph C.3.15
DNR Reactor_20060426.xls
SRK ConsultingMay 2006
DNR Reactor - Concentrations
NorthMet Project
0
0.0002
0.0004
0.0006
0.0008
0.001
0.0012
0 2 4 6 8 10 12
Cycles [weeks]
Be [
mg
/L]
Leach (CuSO4 notused)Leach
Gypsum
RaffinateNeutralizationFe/Al
Mg
Combined
Combined, noGypsumICP-MS detection limit
Values below ICP
MS Detection
Limit are shown
as half the limit.

Appendix C.3
Dissolution Tests Charts - DNR Reactors
Graph C.3.16
DNR Reactor_20060426.xls
SRK ConsultingMay 2006
DNR Reactor - Concentrations
NorthMet Project
0
0.00005
0.0001
0.00015
0.0002
0.00025
0 2 4 6 8 10 12
Cycles [weeks]
Bi
[mg
/L]
Leach (CuSO4 notused)Leach
Gypsum
RaffinateNeutralizationFe/Al
Mg
Combined
Combined, noGypsumICP-MS detection limit
Values below ICP
MS Detection
Limit are shown
as half the limit.

Appendix C.3
Dissolution Tests Charts - DNR Reactors
Graph C.3.17
DNR Reactor_20060426.xls
SRK ConsultingMay 2006
DNR Reactor - Concentrations
NorthMet Project
0.0001
0.001
0.01
0.1
1
0 2 4 6 8 10 12
Cycles [weeks]
B [
mg
/L]
Leach (CuSO4 notused)Leach
Gypsum
RaffinateNeutralizationFe/Al
Mg
Combined
Combined, noGypsumICP-MS detection limit
Values below ICP
MS Detection
Limit are shown
as half the limit.

Appendix C.3
Dissolution Tests Charts - DNR Reactors
Graph C.3.18
DNR Reactor_20060426.xls
SRK ConsultingMay 2006
DNR Reactor - Concentrations
NorthMet Project
0
0.000005
0.00001
0.000015
0.00002
0.000025
0.00003
0.000035
0.00004
0.000045
0 2 4 6 8 10 12
Cycles [weeks]
Cd
[m
g/L
]
Leach (CuSO4 notused)Leach
RaffinateNeutralizationGypsum
Fe/Al
Mg
Combined
Combined, noGypsumICP-MS detection limit
Values below ICP
MS Detection
Limit are shown
as half the limit.

Appendix C.3
Dissolution Tests Charts - DNR Reactors
Graph C.3.19
DNR Reactor_20060426.xls
SRK ConsultingMay 2006
DNR Reactor - Concentrations
NorthMet Project
0
100
200
300
400
500
600
700
0 2 4 6 8 10 12
Cycles [weeks]
Ca [
mg
/L]
Leach (CuSO4 notused)Leach
Gypsum
RaffinateNeutralizationFe/Al
Mg
Combined
Combined, noGypsumICP-MS detection limit- 0.01 mg/L
Values below ICP
MS Detection
Limit are shown
as half the limit.

Appendix C.3
Dissolution Tests Charts - DNR Reactors
Graph C.3.20
DNR Reactor_20060426.xls
SRK ConsultingMay 2006
DNR Reactor - Concentrations
NorthMet Project
0.0001
0.001
0.01
0.1
1
0 2 4 6 8 10 12
Cycles [weeks]
Cr
[mg
/L]
Leach (CuSO4 notused)Leach
Gypsum
RaffinateNeutralizationFe/Al
Mg
Combined
Combined, noGypsumICP-MS detection limit
Values below ICP
MS Detection
Limit are shown
as half the limit.

Appendix C.3
Dissolution Tests Charts - DNR Reactors
Graph C.3.21
DNR Reactor_20060426.xls
SRK ConsultingMay 2006
DNR Reactor - Concentrations
NorthMet Project
0.00001
0.0001
0.001
0.01
0.1
1
10
0 2 4 6 8 10 12
Cycles [weeks]
Co
[m
g/L
]
Leach (CuSO4 notused)Leach
Gypsum
RaffinateNeutralizationFe/Al
Mg
Combined
Combined, noGypsumICP-MS detection limit
Values below ICP
MS Detection
Limit are shown
as half the limit.

Appendix C.3
Dissolution Tests Charts - DNR Reactors
Graph C.3.22
DNR Reactor_20060426.xls
SRK ConsultingMay 2006
DNR Reactor - Concentrations
NorthMet Project
0.00001
0.0001
0.001
0.01
0.1
1
10
100
1000
0 2 4 6 8 10 12
Cycles [weeks]
Cu
[m
g/L
]
Leach (CuSO4 notused)Leach
Gypsum
RaffinateNeutralizationFe/Al
Mg
Combined
Combined, noGypsumICP-MS detection limit
Values below ICP
MS Detection
Limit are shown
as half the limit.

Appendix C.3
Dissolution Tests Charts - DNR Reactors
Graph C.3.23
DNR Reactor_20060426.xls
SRK ConsultingMay 2006
DNR Reactor - Concentrations
NorthMet Project
0.001
0.01
0.1
1
10
100
1000
0 2 4 6 8 10 12
Cycles [weeks]
Fe [
mg
/L]
Leach (CuSO4 notused)Leach
Gypsum
RaffinateNeutralizationFe/Al
Mg
Combined
Combined, noGypsumICP-MS detection limit
Values below ICP
MS Detection
Limit are shown
as half the limit.

Appendix C.3
Dissolution Tests Charts - DNR Reactors
Graph C.3.24
DNR Reactor_20060426.xls
SRK ConsultingMay 2006
DNR Reactor - Concentrations
NorthMet Project
0.00001
0.0001
0.001
0.01
0.1
1
0 2 4 6 8 10 12
Cycles [weeks]
Pb
[m
g/L
]
Leach (CuSO4 notused)Leach
Gypsum
RaffinateNeutralizationFe/Al
Mg
Combined
Combined, noGypsumICP-MS detection limit
Values below ICP
MS Detection
Limit are shown
as half the limit.

Appendix C.3
Dissolution Tests Charts - DNR Reactors
Graph C.3.25
DNR Reactor_20060426.xls
SRK ConsultingMay 2006
DNR Reactor - Concentrations
NorthMet Project
0.00001
0.0001
0.001
0.01
0.1
1
0 2 4 6 8 10 12
Cycles [weeks]
Li
[mg
/L]
Leach (CuSO4 notused)Leach
Gypsum
RaffinateNeutralizationFe/Al
Mg
Combined
Combined, noGypsumICP-MS detection limit
Values below ICP
MS Detection
Limit are shown
as half the limit.

Appendix C.3
Dissolution Tests Charts - DNR Reactors
Graph C.3.26
DNR Reactor_20060426.xls
SRK ConsultingMay 2006
DNR Reactor - Concentrations
NorthMet Project
0.0001
0.001
0.01
0.1
1
10
100
1000
10000
0 2 4 6 8 10 12
Cycles [weeks]
Mg
[m
g/L
]
Leach (CuSO4 notused)Leach
Gypsum
RaffinateNeutralizationFe/Al
Mg
Combined
Combined, noGypsumICP-MS detection limit
Values below ICP
MS Detection
Limit are shown
as half the limit.

Appendix C.3
Dissolution Tests Charts - DNR Reactors
Graph C.3.27
DNR Reactor_20060426.xls
SRK ConsultingMay 2006
DNR Reactor- Concentrations
NorthMet Project
0.00001
0.0001
0.001
0.01
0.1
1
10
0 2 4 6 8 10 12
Cycles [weeks]
Mn
[m
g/L
]
Leach (CuSO4 notused)Leach
Gypsum
RaffinateNeutralizationFe/Al
Mg
Combined
Combined, noGypsumICP-MS detection limit
Values below ICP
MS Detection
Limit are shown
as half the limit.

Appendix C.3
Dissolution Tests Charts - DNR Reactors
Graph C.3.28
DNR Reactor_20060426.xls
SRK ConsultingMay 2006
DNR Reactor - Concentrations
NorthMet Project
0
0.05
0.1
0.15
0.2
0.25
0 2 4 6 8 10 12
Cycles [weeks]
Hg
[u
g/L
]
Leach (CuSO4 notused)Leach
Gypsum
RaffinateNeutralizationFe/Al
Mg
Combined
Combined, noGypsumICP-MS detection limit
Values below ICP
MS Detection
Limit are shown
as half the limit.

Appendix C.3
Dissolution Tests Charts - DNR Reactors
Graph C.3.29
DNR Reactor_20060426.xls
SRK ConsultingMay 2006
DNR Reactor - Concentrations
NorthMet Project
0.00001
0.0001
0.001
0.01
0.1
1
0 2 4 6 8 10 12
Cycles [weeks]
Mo
[m
g/L
]
Leach (CuSO4 notused)Leach
Gypsum
RaffinateNeutralizationFe/Al
Mg
Combined
Combined, noGypsumICP-MS detection limit
Values below ICP
MS Detection
Limit are shown
as half the limit.

Appendix C.3
Dissolution Tests Charts - DNR Reactors
Graph C.3.30
DNR Reactor_20060426.xls
SRK ConsultingMay 2006
DNR Reactor - Concentrations
NorthMet Project
0.00001
0.0001
0.001
0.01
0.1
1
10
100
1000
0 2 4 6 8 10 12
Cycles [weeks]
Ni
[mg
/L]
Leach (CuSO4 notused)
Leach
Gypsum
RaffinateNeutralization
Fe/Al
Mg
Combined
Combined, noGypsum
ICP-MS detection limit
Values below ICP
MS Detection
Limit are shown
as half the limit.

Appendix C.3
Dissolution Tests Charts - DNR Reactors
Graph C.3.31
DNR Reactor_20060426.xls
SRK ConsultingMay 2006
DNR Reactor - Concentrations
NorthMet Project
0.01
0.1
1
10
0 2 4 6 8 10 12
Cycles [weeks]
PO
4 [
mg
/L]
Leach (CuSO4 notused)Leach
Gypsum
RaffinateNeutralizationFe/Al
Mg
Combined
Combined, noGypsumICP-MS detection limit
Values below ICP
MS Detection
Limit are shown
as half the limit.

Appendix C.3
Dissolution Tests Charts - DNR Reactors
Graph C.3.32
DNR Reactor_20060426.xls
SRK ConsultingMay 2006
DNR Reactor - Concentrations
NorthMet Project
0.001
0.01
0.1
1
10
0 2 4 6 8 10 12
Cycles [weeks]
K [
mg
/L]
Leach (CuSO4 notused)Leach
Gypsum
RaffinateNeutralizationFe/Al
Mg
Combined
Combined, noGypsumICP-MS detection limit
Values below ICP
MS Detection
Limit are shown
as half the limit.

Appendix C.3
Dissolution Tests Charts - DNR Reactors
Graph C.3.33
DNR Reactor_20060426.xls
SRK ConsultingMay 2006
DNR Reactor - Concentrations
NorthMet Project
0.0001
0.001
0.01
0.1
0 2 4 6 8 10 12
Cycles [weeks]
Se
[m
g/L
]
Leach (CuSO4 notused)Leach
Gypsum
RaffinateNeutralizationFe/Al
Mg
Combined
Combined, noGypsumICP-MS detection limit
Values below ICP
MS Detection
Limit are shown
as half the limit.

Appendix C.3
Dissolution Tests Charts - DNR Reactors
Graph C.3.34
DNR Reactor_20060426.xls
SRK ConsultingMay 2006
DNR Reactor - Concentrations
NorthMet Project
0.01
0.1
1
10
100
0 2 4 6 8 10 12
Cycles [weeks]
SiO
2 [
mg
/L]
Leach (CuSO4 notused)Leach
Gypsum
RaffinateNeutralizationFe/Al
Mg
Combined
Combined, noGypsumICP-MS detection limit
Values below ICP
MS Detection
Limit are shown
as half the limit.

Appendix C.3
Dissolution Tests Charts - DNR Reactors
Graph C.3.35
DNR Reactor_20060426.xls
SRK ConsultingMay 2006
DNR Reactor - Concentrations
NorthMet Project
0.00001
0.0001
0.001
0.01
0.1
1
0 2 4 6 8 10 12
Cycles [weeks]
Ag
[m
g/L
]
Leach (CuSO4 notused)Leach
Gypsum
RaffinateNeutralizationFe/Al
Mg
Combined
Combined, noGypsumICP-MS detection limit
Values below ICP
MS Detection
Limit are shown
as half the limit.

Appendix C.3
Dissolution Tests Charts - DNR Reactors
Graph C.3.36
DNR Reactor_20060426.xls
SRK ConsultingMay 2006
DNR Reactor - Concentrations
NorthMet Project
0.001
0.01
0.1
1
10
100
1000
0 2 4 6 8 10 12
Cycles [weeks]
Na [
mg
/L]
Leach (CuSO4 notused)Leach
Gypsum
RaffinateNeutralizationFe/Al
Mg
Combined
Combined, noGypsumICP-MS detection limit
Values below ICP
MS Detection
Limit are shown
as half the limit.

Appendix C.3
Dissolution Tests Charts - DNR Reactors
Graph C.3.37
DNR Reactor_20060426.xls
SRK ConsultingMay 2006
DNR Reactor - Concentrations
NorthMet Project
0
0.05
0.1
0.15
0.2
0.25
0.3
0.35
0 2 4 6 8 10 12
Cycles [weeks]
Sr
[mg
/L]
Leach (CuSO4 notused)Leach
Gypsum
RaffinateNeutralizationFe/Al
Mg
Combined
Combined, noGypsumICP-MS detection limit- 0.0001 mg/L
Values below ICP
MS Detection
Limit are shown
as half the limit.

Appendix C.3
Dissolution Tests Charts - DNR Reactors
Graph C.3.38
DNR Reactor_20060426.xls
SRK ConsultingMay 2006
DNR Reactor- Concentrations
NorthMet Project
0
0.00005
0.0001
0.00015
0.0002
0.00025
0 2 4 6 8 10 12
Cycles [weeks]
Te [
mg
/L]
Leach (CuSO4 notused)Leach
Gypsum
RaffinateNeutralizationFe/Al
Mg
Combined
Combined, noGypsumICP-MS detection limit
Values below ICP
MS Detection
Limit are shown
as half the limit.

Appendix C.3
Dissolution Tests Charts - DNR Reactors
Graph C.3.39
DNR Reactor_20060426.xls
SRK ConsultingMay 2006
DNR Reactor - Concentrations
NorthMet Project
0.000001
0.00001
0.0001
0.001
0.01
0 2 4 6 8 10 12
Cycles [weeks]
Tl [m
g/L
]
Leach (CuSO4 notused)Leach
Gypsum
RaffinateNeutralizationFe/Al
Mg
Combined
Combined, noGypsumICP-MS detection limit
Values below ICP
MS Detection
Limit are shown
as half the limit.

Appendix C.3
Dissolution Tests Charts - DNR Reactors
Graph C.3.40
DNR Reactor_20060426.xls
SRK ConsultingMay 2006
DNR Reactor - Concentrations
NorthMet Project
0.00001
0.0001
0.001
0.01
0.1
1
0 2 4 6 8 10 12
Cycles [weeks]
Th
[m
g/L
]
Leach (CuSO4 notused)Leach
Gypsum
RaffinateNeutralizationFe/Al
Mg
Combined
Combined, noGypsumICP-MS detection limit
Values below ICP
MS Detection
Limit are shown
as half the limit.
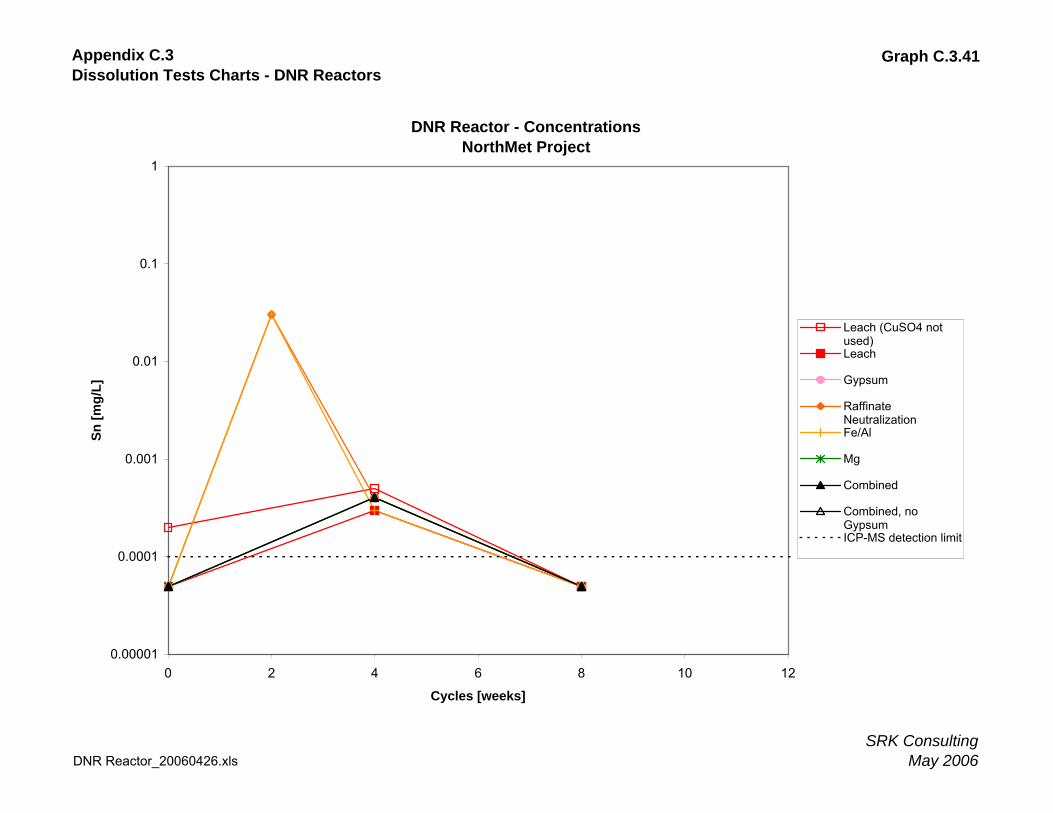
Appendix C.3
Dissolution Tests Charts - DNR Reactors
Graph C.3.41
DNR Reactor_20060426.xls
SRK ConsultingMay 2006
DNR Reactor - Concentrations
NorthMet Project
0.00001
0.0001
0.001
0.01
0.1
1
0 2 4 6 8 10 12
Cycles [weeks]
Sn
[m
g/L
]
Leach (CuSO4 notused)Leach
Gypsum
RaffinateNeutralizationFe/Al
Mg
Combined
Combined, noGypsumICP-MS detection limit

Appendix C.3
Dissolution Tests Charts - DNR Reactors
Graph C.3.42
DNR Reactor_20060426.xls
SRK ConsultingMay 2006
DNR Reactor - Concentrations
NorthMet Project
0.00001
0.0001
0.001
0.01
0.1
1
0 2 4 6 8 10 12
Cycles [weeks]
Ti
[mg
/L]
Leach (CuSO4 notused)Leach
Gypsum
RaffinateNeutralizationFe/Al
Mg
Combined
Combined, noGypsumICP-MS detection limit
Values below ICP
MS Detection
Limit are shown
as half the limit.

Appendix C.3
Dissolution Tests Charts - DNR Reactors
Graph C.3.43
DNR Reactor_20060426.xls
SRK ConsultingMay 2006
DNR Reactor - Concentrations
NorthMet Project
0.00001
0.0001
0.001
0.01
0 2 4 6 8 10 12
Cycles [weeks]
U [
mg
/L]
Leach (CuSO4 notused)Leach
Gypsum
RaffinateNeutralizationFe/Al
Mg
Combined
Combined, noGypsumICP-MS detection limit
`
Values below ICP
MS Detection
Limit are shown
as half the limit.

Appendix C.3
Dissolution Tests Charts - DNR Reactors
Graph C.3.44
DNR Reactor_20060426.xls
SRK ConsultingMay 2006
DNR Reactor - Concentrations
NorthMet Project
0.00001
0.0001
0.001
0.01
0.1
1
0 2 4 6 8 10 12
Cycles [weeks]
V [
mg
/L]
Leach (CuSO4 notused)Leach
Gypsum
RaffinateNeutralizationFe/Al
Mg
Combined
Combined, noGypsumICP-MS detection limit
Values below ICP
MS Detection
Limit are shown
as half the limit.

Appendix C.3
Dissolution Tests Charts - DNR Reactors
Graph C.3.45
DNR Reactor_20060426.xls
SRK ConsultingMay 2006
DNR Reactor- Concentrations
NorthMet Project
0.0001
0.001
0.01
0.1
1
10
100
0 2 4 6 8 10 12
Cycles [weeks]
Zn
[m
g/L
]
Leach (CuSO4 notused)Leach
Gypsum
RaffinateNeutralizationFe/Al
Mg
Combined
Combined, noGypsumICP-MS detection limit
Values below ICP-
MS Detection
Limit are shown
as half the limit.

Appendix C.3
Dissolution Tests Charts - DNR Reactors
Graph C.3.46
DNR Reactor_20060426.xls
SRK ConsultingMay 2006
DNR Reactor - Concentrations
NorthMet Project
0
0.0005
0.001
0.0015
0.002
0.0025
0 2 4 6 8 10 12Cycles [weeks]
Zr
[mg
/L]
Leach (CuSO4 notused)Leach
Gypsum
RaffinateNeutralizationFe/Al
Mg
Combined
Combined, noGypsumICP-MS detectionlimit
Values below ICP-
MS Detection
Limit are shown
as half the limit.