attracting and retaining talent in manufacturing · · 2015-06-25attracting and retaining talent...
TRANSCRIPT

Attracting and Retaining Talent in Manufacturing
June 28, 2015
SHRM Annual Conference & Exposition

Welcome
Mike Aitken, Vice President, Government Affairs, SHRM, VA.;
Anne Weisberg, SVP of Strategy , Families and Work Institute, NY.

• When Work Works (WWW) is a national initiative, led by the partnership of the Families and Work Institute (FWI) and the Society for Human Resource Management (SHRM)
• The goal is to help businesses of all sizes and types become more successful by transforming the way they view and adopt effective and flexible workplaces.
• The initiative administers the annual When Work Works Award, which recognizes exemplary employers for creating effective and flexible workplaces to increase business and employee success.
• Check out our new free resources: Workflex Assessment, Guide to Bold New Ideas, and Workflex and Manufacturing Guide
When Work Works
3

• Applicants receive:
- free customized benchmarking report comparing your worksite to competitors locally and across U.S.
• Winners receive:
- local and national media attention for the things you’re doing to create an effective and flexible workplace;
- kudos at public awards events; and
- inclusion in When Work Works, Families and Work Institute, and the Society of Human Resource Management websites as top employers to help you attract the best employees.
• SAVE THESE DATES: WWW Award opens on August 17 and ends on November 6, 2015. There is no fee to apply!
• For details go to: WhenWorkWorks.org/about-the-award
Why Apply for the When Work Works Award?
4

Overview of Trends and Challenges Facing the
Manufacturing Industry
Dr. Deb Cohen, SVP, Knowledge Development, SHRM, VA., and
Dr. Kenneth Matos, Senior Director of Research, Families and Work Institute, NY.

Deb Cohen, Ph.D., SHRM-SCP
SVP, Knowledge Development
Society for Human Resource Management
Speaker
6

Introduction
• Manufacturing has seen steady growth in recent years
• According to SHRM data – employment expectations are up in manufacturing and the recruiting environment is more difficult
• According to a study by Accenture and the Manufacturing Institute:
- 50% of companies report plans to increase (US-based) production by at least 5% in the next 5 years
- 75% report moderate to severe shortage of skilled resources
7

“The skills gap in manufacturing is getting larger in part because of external forces, or megatrends, that are creating a greater need for skilled labor. Advancements in technology not only require new employee skills they shorten the shelf life of those skills and increase the need for continuous training.”
Megatrend Effect on Growing Skills Gap
Source: PwC 2014, Talent Management in Manufacturing: The Need for a Fresh Approach
8

• Quality
• Overtime cost
• Production down time
• Production cycle time
• Scrap
• Customer satisfaction—lead time, delivery and quality
The Cost of Unfilled Skilled Manufacturing Jobs
Source: Accenture 2014 Manufacturing Skills and Training Study
9
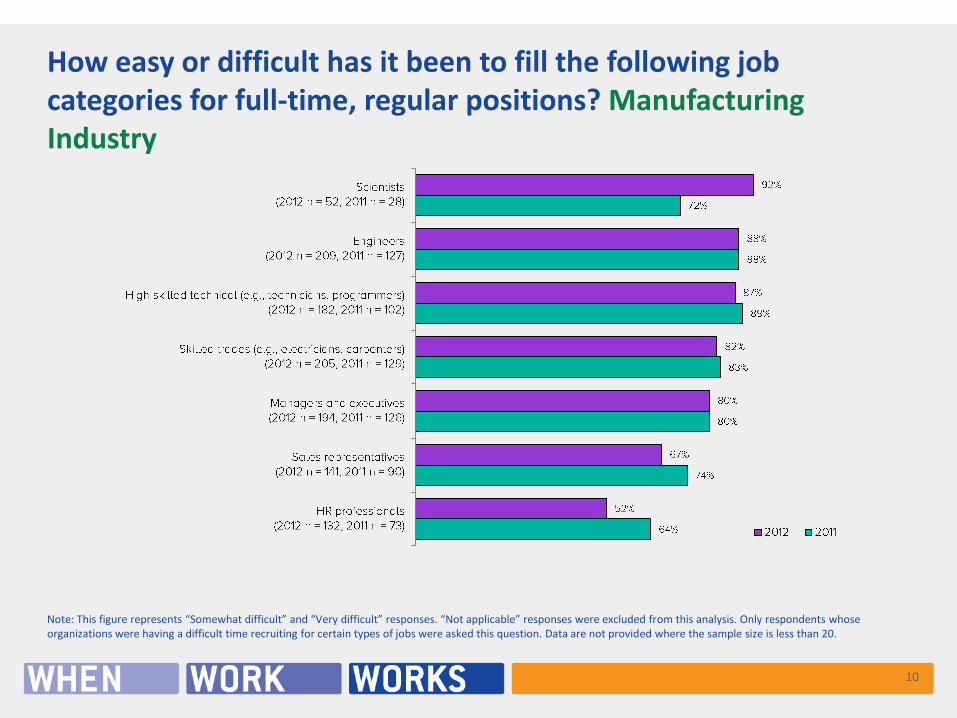
How easy or difficult has it been to fill the following job categories for full-time, regular positions? Manufacturing Industry
Note: This figure represents “Somewhat difficult” and “Very difficult” responses. “Not applicable” responses were excluded from this analysis. Only respondents whose organizations were having a difficult time recruiting for certain types of jobs were asked this question. Data are not provided where the sample size is less than 20.
10

How easy or difficult has it been to fill the following job categories for full-time, regular positions? (continued) Manufacturing Industry
Note: This figure represents “Somewhat difficult” and “Very difficult” responses. “Not applicable” responses were excluded from this analysis. Only respondents whose organizations were having a difficult time recruiting for certain types of jobs were asked this question. Data are not provided where the sample size is less than 20.
11

• The LINE survey has tracked manufacturing-sector hiring trends since 2004 and service-sector trends since 2005.
• Report examines:- Employers’ hiring expectations- New-hire compensation levels- Difficulty in recruiting top-level talent- Job vacancies employers are actively trying
to fill• The LINE report has increasingly been relied on
as a job market indicator by highly respected media outlets in the United States such as The Wall Street Journal, USA Today, The New York Times, Los Angeles Times, the Associated Press, The Washington Post, Chicago Tribune, TIME, Forbes, BusinessWeek, CNN.com, MSNBC.com and ABCNews.com.
SHRM Leading Indicators of National Employment®(LINE®)
http://www.shrm.org/research/monthlyemploymentindices/line
12

-6000
-5000
-4000
-3000
-2000
-1000
0
1000
2000
0.0
20.0
40.0
60.0
80.0
100.0
120.0
Jan Feb Mar Apr May Jun Jul Aug Sep Oct Nov Dec Jan Feb Mar Apr May Jun Jul Aug Sep Oct Nov Dec
2013 2014
BLS
Em
plo
ymen
t C
han
ge
LIN
E In
dex
Val
ue
BLS Employment Change compared with LINE Employment Expectations Index released one month earlier
LINE Manufacturing Index LINE Service Index BLS Emlpoyment Change
SHRM LINE report anticipates BLS Employment Situation Report findings – one month ahead
13

-40.0
-30.0
-20.0
-10.0
0.0
10.0
20.0
30.0
40.0
50.0
60.0
70.0
Mar
-04
Ap
r-04
May
-04
Jul-
04A
ug-
04Se
p-0
4N
ov-
04D
ec-0
4Ja
n-0
5M
ar-0
5A
pr-
05M
ay-0
5Ju
l-05
Au
g-05
Sep
-05
No
v-05
Dec
-05
Jan
-06
Mar
-06
Ap
r-06
May
-06
Jul-
06A
ug-
06Se
p-0
6N
ov-
06D
ec-0
6Ja
n-0
7M
ar-0
7A
pr-
07Ju
n-0
7Ju
l-07
Au
g-07
Oct
-07
No
v-07
Dec
-07
Feb
-08
Mar
-08
Ap
r-08
Jun
-08
Jul-
08A
ug-
08O
ct-0
8N
ov-
08D
ec-0
8Fe
b-0
9M
ar-0
9A
pr-
09Ju
n-0
9Ju
l-09
Au
g-09
Oct
-09
No
v-09
Jan
-10
Feb
-10
Mar
-10
May
-10
Jun
-10
Jul-
10Se
p-1
0O
ct-1
0N
ov-
10Ja
n-1
1Fe
b-1
1M
ar-1
1M
ay-1
1Ju
n-1
1Ju
l-11
Sep
-11
Oct
-11
No
v-11
Jan
-12
Feb
-12
Mar
-12
May
-12
Jun
-12
Au
g-12
Sep
-12
Oct
-12
Dec
-12
Jan
-13
Feb
-13
Ap
r-13
May
-13
Jun
-13
Au
g-13
Sep
-13
Oct
-13
Dec
-13
Jan
-14
Feb
-14
Ap
r-14
May
-14
Jun
-14
Au
g-14
Sep
-14
Oct
-14
Dec
-14
Jan
-15
Mar
-15
Ap
r-15
Manufacturing Employment Expectations(March 2004-May 2015)
Source: SHRM Leading Indicators of National Employment® (LINE®) Historical Data
Employment expectations are now similar to where they were in the pre-recession years
Manufacturing data:Low point – February 2009
14

-30.0
-20.0
-10.0
0.0
10.0
20.0
30.0
40.0
Mar
-04
Ap
r-0
4M
ay-0
4Ju
l-0
4A
ug-
04
Sep
-04
No
v-0
4D
ec-0
4Ja
n-0
5M
ar-0
5A
pr-
05
May
-05
Jul-
05
Au
g-0
5Se
p-0
5N
ov-
05
Dec
-05
Jan
-06
Mar
-06
Ap
r-0
6M
ay-0
6Ju
l-0
6A
ug-
06
Sep
-06
No
v-0
6D
ec-0
6Ja
n-0
7M
ar-0
7A
pr-
07
Jun
-07
Jul-
07
Au
g-0
7O
ct-0
7N
ov-
07
Dec
-07
Feb
-08
Mar
-08
Ap
r-0
8Ju
n-0
8Ju
l-0
8A
ug-
08
Oct
-08
No
v-0
8D
ec-0
8Fe
b-0
9M
ar-0
9A
pr-
09
Jun
-09
Jul-
09
Au
g-0
9O
ct-0
9N
ov-
09
Jan
-10
Feb
-10
Mar
-10
May
-10
Jun
-10
Jul-
10
Sep
-10
Oct
-10
No
v-1
0Ja
n-1
1Fe
b-1
1M
ar-1
1M
ay-1
1Ju
n-1
1Ju
l-1
1Se
p-1
1O
ct-1
1N
ov-
11
Jan
-12
Feb
-12
Mar
-12
May
-12
Jun
-12
Au
g-1
2Se
p-1
2O
ct-1
2D
ec-1
2Ja
n-1
3Fe
b-1
3A
pr-
13
May
-13
Jun
-13
Au
g-1
3Se
p-1
3O
ct-1
3D
ec-1
3Ja
n-1
4Fe
b-1
4A
pr-
14
May
-14
Jun
-14
Au
g-1
4Se
p-1
4O
ct-1
4D
ec-1
4Ja
n-1
5M
ar-1
5A
pr-
15
Manufacturing recruiting difficulty
Manufacturing Recruiting Difficulty(March 2004-May 2015)
Source: SHRM Leading Indicators of National Employment® (LINE®) Historical Data
LINE recruiting difficulty index for manufacturing shows recruiting difficulty has climbed back up after experiencing historic lows at height of recession.
15

-30.0
-20.0
-10.0
0.0
10.0
20.0
30.0
40.0
50.0
Mar
-04
Ap
r-0
4M
ay-0
4Ju
l-0
4A
ug-
04
Sep
-04
No
v-0
4D
ec-0
4Ja
n-0
5M
ar-0
5A
pr-
05
May
-05
Jul-
05
Au
g-0
5Se
p-0
5N
ov-
05
Dec
-05
Jan
-06
Mar
-06
Ap
r-0
6M
ay-0
6Ju
l-0
6A
ug-
06
Sep
-06
No
v-0
6D
ec-0
6Ja
n-0
7M
ar-0
7A
pr-
07
Jun
-07
Jul-
07
Au
g-0
7O
ct-0
7N
ov-
07
Dec
-07
Feb
-08
Mar
-08
Ap
r-0
8Ju
n-0
8Ju
l-0
8A
ug-
08
Oct
-08
No
v-0
8D
ec-0
8Fe
b-0
9M
ar-0
9A
pr-
09
Jun
-09
Jul-
09
Au
g-0
9O
ct-0
9N
ov-
09
Jan
-10
Feb
-10
Mar
-10
May
-10
Jun
-10
Jul-
10
Sep
-10
Oct
-10
No
v-1
0Ja
n-1
1Fe
b-1
1M
ar-1
1M
ay-1
1Ju
n-1
1Ju
l-1
1Se
p-1
1O
ct-1
1N
ov-
11
Jan
-12
Feb
-12
Mar
-12
May
-12
Jun
-12
Au
g-1
2Se
p-1
2O
ct-1
2D
ec-1
2Ja
n-1
3Fe
b-1
3A
pr-
13
May
-13
Jun
-13
Au
g-1
3Se
p-1
3O
ct-1
3D
ec-1
3Ja
n-1
4Fe
b-1
4A
pr-
14
May
-14
Jun
-14
Au
g-1
4Se
p-1
4O
ct-1
4D
ec-1
4Ja
n-1
5M
ar-1
5A
pr-
15
Manufacturing exempt vacancies Manufacturing nonexempt vacancies
Nonexempt positions dippedlower than exempt in Feb 2009and have come back stronger than exempt vacancies.
Manufacturing Exempt and Nonexempt Vacancies(March 2004-May 2015)
Source: SHRM Leading Indicators of National Employment® (LINE®) Historical Data
16
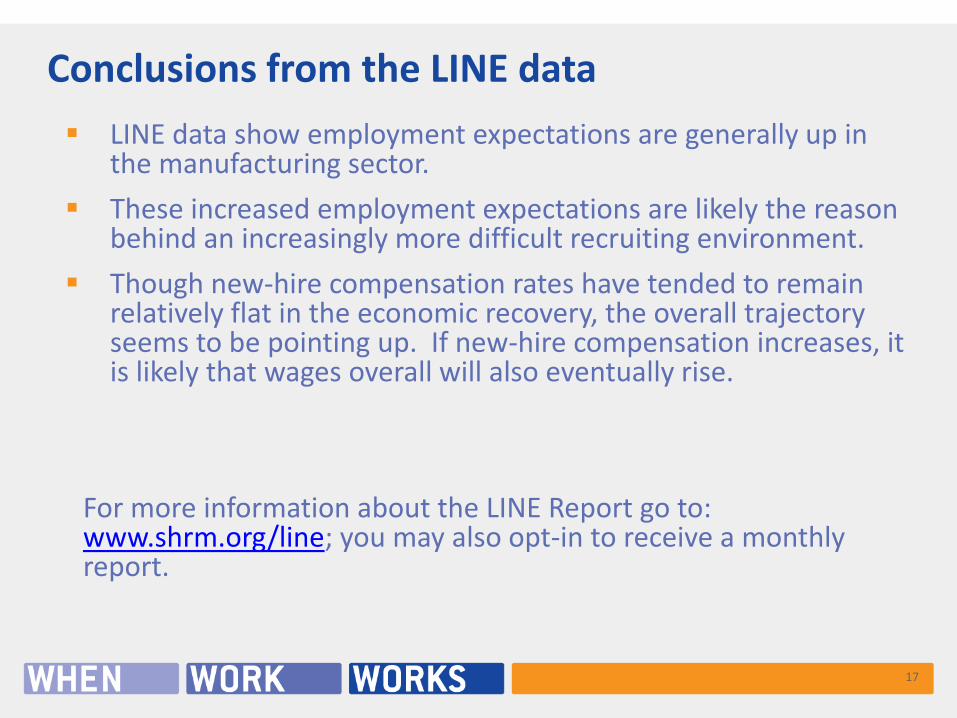
LINE data show employment expectations are generally up in the manufacturing sector.
These increased employment expectations are likely the reason behind an increasingly more difficult recruiting environment.
Though new-hire compensation rates have tended to remain relatively flat in the economic recovery, the overall trajectory seems to be pointing up. If new-hire compensation increases, it is likely that wages overall will also eventually rise.
For more information about the LINE Report go to: www.shrm.org/line; you may also opt-in to receive a monthly report.
Conclusions from the LINE data
17

• 45% of CEOs surveyed say that headcount will increase
• 35% of CEOs surveys say headcount will stay the same
• 18% of CEOs surveys say headcount will decrease
• Yet only 32% say they have implemented policies to attract or retain needed talent
How will talent needs change?
Source: PwC 2014, Talent Management in Manufacturing: The Need for a Fresh Approach
18

• Technological advances (81%)
• Shifts in global economic power (60%)
• Resource security and climate change (60%)
Global Trends that will transform Industrial Manufacturing the Most in the Next 5 Years
Source: PwC 17th Annual Global CEO Survey
19

• Expand your talent search
• Offer ongoing training and development programs
- Be innovative-consider digital learning experiences
• Re-evaluate your employee value proposition
• Upgrade your talent function
• Implement the latest workforce analytics
- Correlate training, recruiting, and staffing levels for things like: production cycle time, downtime, ability to scale for greater demand, turnover, etc.
Strategies for Closing Skills Gap
Adapted from: PwC 2014, Talent Management in Manufacturing: The Need for a Fresh Approach
20

Appendix
21

-5.0
0.0
5.0
10.0
15.0
20.0
Mar
-04
Ap
r-0
4M
ay-0
4Ju
l-0
4A
ug-
04
Sep
-04
No
v-0
4D
ec-0
4Ja
n-0
5M
ar-0
5A
pr-
05
May
-05
Jul-
05
Au
g-0
5Se
p-0
5N
ov-
05
Dec
-05
Jan
-06
Mar
-06
Ap
r-0
6M
ay-0
6Ju
l-0
6A
ug-
06
Sep
-06
No
v-0
6D
ec-0
6Ja
n-0
7M
ar-0
7A
pr-
07
Jun
-07
Jul-
07
Au
g-0
7O
ct-0
7N
ov-
07
Dec
-07
Feb
-08
Mar
-08
Ap
r-0
8Ju
n-0
8Ju
l-0
8A
ug-
08
Oct
-08
No
v-0
8D
ec-0
8Fe
b-0
9M
ar-0
9A
pr-
09
Jun
-09
Jul-
09
Au
g-0
9O
ct-0
9N
ov-
09
Jan
-10
Feb
-10
Mar
-10
May
-10
Jun
-10
Jul-
10
Sep
-10
Oct
-10
No
v-1
0Ja
n-1
1Fe
b-1
1M
ar-1
1M
ay-1
1Ju
n-1
1Ju
l-1
1Se
p-1
1O
ct-1
1N
ov-
11
Jan
-12
Feb
-12
Mar
-12
May
-12
Jun
-12
Au
g-1
2Se
p-1
2O
ct-1
2D
ec-1
2Ja
n-1
3Fe
b-1
3A
pr-
13
May
-13
Jun
-13
Au
g-1
3Se
p-1
3O
ct-1
3D
ec-1
3Ja
n-1
4Fe
b-1
4A
pr-
14
May
-14
Jun
-14
Au
g-1
4Se
p-1
4O
ct-1
4D
ec-1
4Ja
n-1
5M
ar-1
5A
pr-
15
Manufacturing new-hire compensation
Manufacturing New-Hire Compensations (March 2004-May 2015)
Source: SHRM Leading Indicators of National Employment® (LINE®) Historical Data
LINE Survey Question: On average, have your new hires in [current month] received a compensation package (wage plus benefits) that is higher, the same or lower than that received by individuals your firm hired into similar positions during [previous month]?
22

Note: Percentages do not total 100% due to multiple response options. Only respondents whose organizations were having a difficult time recruiting for certain types of jobs were asked this question.
In general, what basic skills/knowledge gaps do job applicants have in your industry? Manufacturing Industry
23
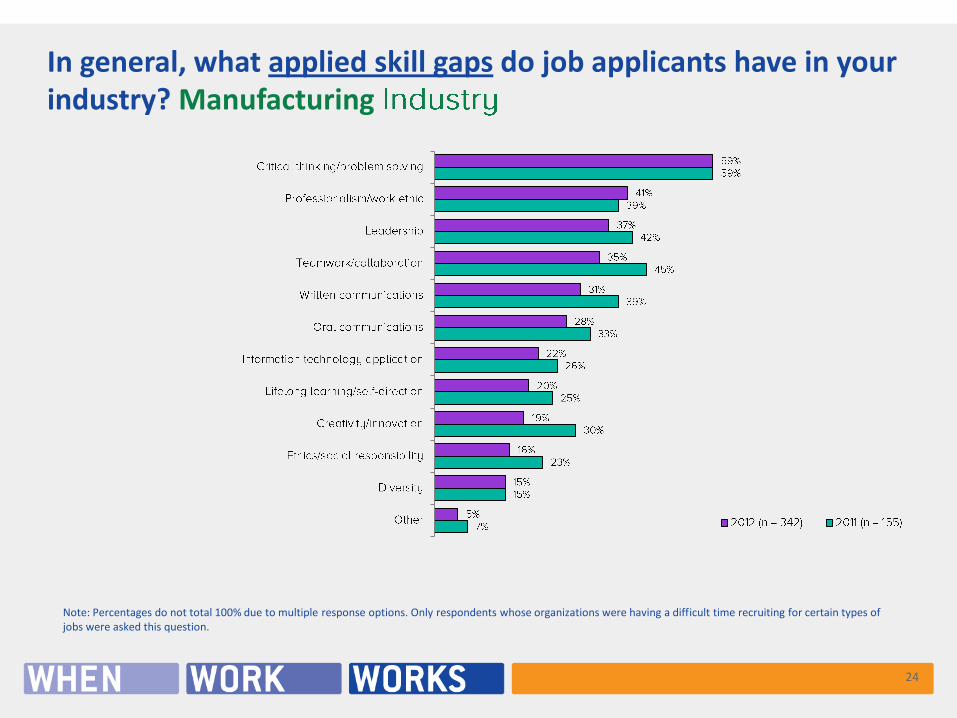
In general, what applied skill gaps do job applicants have in your industry? Manufacturing
Note: Percentages do not total 100% due to multiple response options. Only respondents whose organizations were having a difficult time recruiting for certain types of jobs were asked this question.
24

What are the main reason(s) that your organization experiences difficulty in hiring qualified candidates for full-time, regular positions? Manufacturing Industry
For the new full-time, regular positions being created by your organization that require new and different skill sets, how easy or difficult do you think it will be or has been thus far to find qualified individuals for those positions?Manufacturing Industry
Note: Percentages may not total 100% due to rounding. Only respondents whose organizations were hiring full-time staff for positions with “new duties added to jobs lost” or “completely new positions” that required either “a mixture of new skills and the same types of skills” or “completely new and different skills” were asked this question.
Note: n = 268. Percentages do not total 100% due to multiple response options. Respondents who answered “don’t know” were excluded from this analysis. Only respondents whose organizations were having a difficult time recruiting for certain types of jobs were asked this question.
Source: The Ongoing Impact of the Recession—Manufacturing Industry ©SHRM 2013
Ease of hiring and reasons for difficulty
25

n = 253
n = 346
In general, in the current labor market, is your organization having a difficult time recruiting for specific jobs that are open in your organization? Manufacturing Industry
n = 148
n = 240
Do you believe that your organization is facing global competition (i.e., competition from other countries) for talent for hard-to-fill jobs? Manufacturing Industry
Source: The Ongoing Impact of the Recession—Manufacturing Industry ©SHRM 2013
Note: Respondents who answered “don’t know” were excluded from this analysis. Only respondents whose organizations were currently hiring full-time staff were asked this question.
Note: Respondents who answered “don’t know” were excluded from this analysis. Only respondents whose organizations were having a difficult time recruiting for certain types of jobs were asked this question.
Recruiting difficulty and global competition for talent
26

What strategies is your organization using to deal with recruiting challenges for full-time, regular positions? (continued)Manufacturing Industry
What strategies is your organization using to deal with recruiting challenges for full-time, regular positions?Manufacturing Industry
Source: The Ongoing Impact of the Recession—Manufacturing Industry ©SHRM 2013
Note: n = 268. Percentages do not total 100% due to multiple response options. Only respondents whose organizations were having a difficult time recruiting for certain types of jobs were asked this question.
Note: n = 268. Percentages do not total 100% due to multiple response options. Only respondents whose organizations were having a difficult time recruiting for certain types of jobs were asked this question.
Strategies to deal with recruiting challenging
27

Has your organization hired any workers from outside the United States in an attempt to staff key jobs that have been difficult to fill? Manufacturing Industry
Has your organization hired any U.S. veterans in an attempt to staff key jobs that have been difficult to fill? Manufacturing Industry
Source: The Ongoing Impact of the Recession—Manufacturing Industry ©SHRM 2013
Note: Percentages may not equal 100% due to rounding. Respondents who answered “don’t know” were excluded from this analysis. Only respondents whose organizations were having a difficult time recruiting for certain types of jobs were asked this question.
Note: Respondents who answered “don’t know” were excluded from this analysis. Only respondents whose organizations were having a difficult time recruiting for certain types of jobs were asked this question.
Targeted hiring?
28

Kenneth Matos
Senior Director of Research
Families and Work Institute
Speaker
29

2014 National Study of Employers
Notes: p<.000
Difficulty Recruiting for Highly Skilled Positions
30
15%22%
26%
35%
43%
85%78%
74%
65%
57%
0%
10%
20%
30%
40%
50%
60%
70%
80%
90%
GoodsProducing
Wholesaleand Retail
Trade
OtherServices
ProfessionalServices
Finance,Insurance,Real Estate
Easy
Difficult

95%
83%
83%
77%
45%
42%
47%
40%
21%
84%
77%
74%
68%
38%
35%
22%
22%
10%
0% 20% 40% 60% 80% 100%
Control when they take breaks***
Take time off during the work day without losing pay*
Change start/quitting times within some range of hours*
Return to work gradually after childbirth or adoption**
Compress their workweek*
Change starting and quitting times on a daily basis*
Have choices about and control over shifts they work***
Move between full/part-time work in same position***
To share jobs***
At least some employees allowed to…
Goods Producing Other Industries
Manufacturing Offers Less Workplace Flexibility than Other Industries
31
2014 National Study of Employers
Notes: * p<.05, ** p<.01, *** p<.001

14%
82%
4%
Increased
Maintained
Reduced
Status of Flexible Workplace Arrangements over the Past 12 Months
32
Bond, J.T. (2011). Workplace Flexibility in Manufacturing Companies
• Even though 85% of employees in manufacturing organizations reporthaving the flexibility they need to manage work and personal or family life would be “extremely” or “very” important if they were looking for a new job, most manufacturers (82%) have maintained their flexible workplace arrangements in the past 12 months.

44%
50%
6%
Production Employees
Low
Moderate
High
Overall Workplace Flexibility by Occupation within Manufacturing
25%
53%
22%
Other Occupations
Low
Moderate
High
33
Bond, J.T. (2011). Workplace Flexibility in Manufacturing Companies

17%
5%
16%
46%44%
18%
30%
64%56%
32%
48%
76%
0%
10%
20%
30%
40%
50%
60%
70%
80%
High jobsatisfaction***
High jobengagement***
Excellent physicalhealth***
High likelihood toremain another
year***
Low
Mid
High
Effect of Increasing Levels of Flexibility among Employees in Manufacturing Organizations
Bond, J.T. (2011). Workplace Flexibility in Manufacturing Companies
Notes: p<.000
34

A View from the Top: TURCKEmployee Retention through
Engagement
Dave Lagerstrom
28 June 2015

Dave Lagerstrom
President & CEO
TURCK Inc.
Speaker
36

TURCK Inc.
TURCK Inc. founded in 1975, develops, designs, and manufactures technology products
• Approximately 500 employees
• Two main locations near Minneapolis MN
• Warehouses in Texas and Michigan
• National sales force
• Over 30 different languages spoken
• Extremely stable workforce
• 1 – 4 % turnover since 2010
• Compared to industry averages 11 – 13%
• TURCK offers:
• Well-Being benefits, leadership and organizational support, holistic, integrated
programming
• Onsite Well-being Coaching
• Onsite primary care clinic including labs and limited Rx
37

TURCK Well-Being Evolution
38
2003Introduced 10,000 Steps
, gave out pedometers 2005
• Introduced CDHP option
• Health consumer education
2004 Cross-functional Benefits Committee
formed to discuss trend in rising health
care cost
2003 2004 2005 2006 2007 2008 2009
2009
• Well-being goal
achievements shared to
inspire
• Biometrics & HA
coaching session with
Advanced Care Provider
Education:
• Heart Health
• Stress Mgt.
• Weight Mgt.
2008
• Lunch n’ learn topics:
• Heart Health
• Allergies
• Weight Mgt.
• Skin Cancer
• Oral Health
• Open Enrollment; Well-Being introduced “Invest
in Yourself” theme with expanded offerings,
rewards (PTO)
2007
• Well@Work Clinic Opens
• Diabetes Screens
• Optional Seminars:
• Breast Health
• Prostate Health
• Cancer Awareness
2006
• Mindful Living & Eating series
• Health Fair w/ screening option
• Weight Watchers option

TURCK Well-Being Evolution
39
2010 •Expanded well-being coaching
•Back Health
•Weight Mgt.
•Onsite smoking cessation
•Company-wide workplace flexibility
•Well-being added to Strategic Plan
2012 •US Healthiest HealthLead Accreditation
• Subsidized Organic CSAs Delivered Onsite
• Subsidized Onsite Massage Therapy
• Leadership and Well-being Development: Lead by Example:
360, JI, Coaching + Resiliency Training
2010 2011 2012 2013 2014
2011 •Expanded rewards for well-being
•On-site Rx covered 100%
•Tobacco free credit
•Work/life pursuit benefit enhanced with PTO
match to volunteer and company match for
charitable giving
2013
• Prevention and Cancer Screenings focus
• Direct contract for Specialty services
• Financial Well-being Education Enhanced
• Expanded clinic hours + Additional Provider
• Well-being benefits expanded to family/spouses
2014
• Integration of Health, Well-being + Safety
• Expansion of Leadership & Well-being
Development with focus on Engagement
• Financial Well-being; Social/Mobile/App
Community Well-being Challenge
• Expanded clinic hours, Tele-health
2015
2015
Work/Life Pursuit
Work/life Flexibility – put family first
Communication
Recognition

Employee Voted Branded Well-being Benefit
40
Grounded in Research of 5 Inter-related Elements of Well-being
Designed to foster thriving @ TURCK
• Career/Learning & Growth- like what you do, discover and
engage your strengths in work and in life
• Social Well-being – enjoy who you’re with; flexibility for family
• Physical Well-being - attain energy to live your fullest life
• Financial Well-being– create security and plan for your future
• Community Well-being – enhance quality of life for others
Rath & Harter, (2010). Well Being: The Five Essential Elements. Gallup Press.

Career Well-being is Key to Overall Well-being
41
Financial Social Career Physcial Community
Well-Being
Career Well-being - discover and engage your strengths in work and life, aligns with our core values to engage your passion, like what you do, learn & grow personally, professionally, innovate, create, continuously improve

Climate of Well-being Survey Highlights:
High Engagement High Impact
42
Out of the 75% (330) employees who participated:
•93% agree/strongly agree (report): I give my best efforts each day.
•91% report: I put in extra time and effort as needed to do my work effectively.
•89% report: I intend and would like to stay at TURCK for a year or longer.
•88% report: I strive to exceed expectations for those I impact each day.
•87% report: I am committed to TURCK’s core purpose and values.

Social Well-being
43
Financial Social Career Physical Community
Well-Being
Social Well-being – enjoy who you’re with and gain the flexibility to meet your work and life needs (Makes Life Work!)

Physical Well-being Bottom line cost impact
44
Financial Social Career Physical Community
Well-Being
Physical Well-being – attain energy to live your fullest life

Onsite Clinic Use v. Health Plan Office Visits
45
TURCK’s use of onsite services continues to increase
Health plan office visits have leveled (even with growing population covered on the health plan)
2014 TURCK’s onsite clinic added video visits to allow for greater access to homes

Health Plan Reporting
46
Members per 1000
Diseases -Members per 1000
TURCK 36 Mo Ending Nov 12
TURCK 36 Mo Ending April 15
Back Pain 169.5 142.4
Hyperlipidemia 149.8 123.4
Hypertension 123.8 106.0
Neck Pain 96.0 64.9
Diabetes 62.8 64.1
Headache 53.8 27.7
Asthma 45.7 39.6
Major Depression 40.4 26.1
Cancer 30.5 29.3
Osteoarthritis 29.6 29.3
Comparing 36 month periods:• Enrollment increased• Turnover <2%
TURCK offers programs for:• Back and Neck Pain• Heart Related Conditions • Diabetes • Behavioral Health
By providing appropriate care and well-being support onsite • Better health management• Fewer health plan claims • Reduced risk of catastrophic
claims• Avoided insurance cost

TURCK Well@Work Pharmacy
47
Reducing care gaps through onsite medication management • Better Access• Zero Patient Cost • More Provider Awareness/Control
Prescriptions are dispensed for chronic, acute, and seasonal/other conditions
For 2014, an average of 181 prescriptions are dispensed per month by the Turck Well@Work Clinic for a total of 2,172 prescriptions.
Acute , 21%
Chronic, 63%
Seasonal , 16%

TURCK’s Well@Work Clinic Cost Savings
48
$52,0
28
$97,2
17
$179,7
18
$187,2
99
$221,2
76
$263,2
00
$259,6
28
$347,2
36
$73,1
50
$136,6
86
$252,6
81
$263,3
40
$327,7
12
$389,9
94
$467,7
42
$516,2
30
$42,6
77
$120,2
36
$314,5
81
$328,0
02
$380,7
88
$472,4
36
$483,7
19
$580,3
41
$0
$100,000
$200,000
$300,000
$400,000
$500,000
$600,000
$700,000
2007 2008 2009 2010 2011 2012 2013 2014
Onsite Clinic and Well-being Impact
Productivity Savings FFS Direct Medical Savings Net Savings

Cost Avoidance/Return on Value
49
HealthPartners has been ranked as the top health plan in the nation by eValu8, been named as Minnesota’s top health plan as well as given an “Excellent” rating by NCQA
HealthPartners annualized YOY trend developed by applying actual published annual trend beginning 2008 through 2014 (average of 6.7% over the period)
When comparing TURCK’s net PMPM cost increase YOY at 1.5% annually over the period to trend or the effect of unmanaged (Gross) cost the delta is a cost avoidance of $6,750,000
$266
$291
$395
$200
$220
$240
$260
$280
$300
$320
$340
$360
$380
$400
2008 2009 2010 2011 2012 2013 2014
TURCK Per Member Per Month Claims Trend v. Market Trend
TURCK Net Claims ((Actual Claims + Clinic/Rx/Lab)-(Direct Replacement +Productivity Gains))Health Plan Trended
Linear (TURCK Net Claims ((Actual Claims + Clinic/Rx/Lab)-(Direct Replacement +Productivity Gains)))

Financial Well-being
50
Well-Being
Financial Well-being– create security and plan for your future (TURCK supports through generous 401k match + profit sharing for retirement)
Financial Social Career Physical Community

Participation in 401K savings plan has increased by nearly almost 20% (YoY)
Since Creating Safe Harbor (Automatic Enrollment) Plan and Increasing Match 1.5%
Additionally Offering Financial Well-being Education:
• Saving for Retirement
• Overview of Funds
• Financial Budget Planning
• 1:1 Financial Counseling
Financial Well-being Indicators:
51

Community Well-being
52
Well-Being
Community Well-being – enhance quality of life for others
Financial Social Career Physical Community

1. Since Creating Work/Life Pursuit Benefit:
• Employee Volunteerism ↑
• Employee Donating to a Personally Meaningful Cause ↑• Employees “very satisfied” with overall benefits up 13% since introducing “well-being
benefits”
2. TURCK Supports Community Well-being (Work/Life Pursuit) by:
• Matching up to 2 days of PTO/yr. to volunteer
• Matching up to $100/employee for charitable giving
Community Well-being Indicators:
53

1. Gain senior and mid-level leadership support to
focus on long-term organizational sustainability
2. Align and integrate health and well-being initiative
with organization’s purpose and values
3. Be mindful of people’s intrinsic needs to create a
climate of well-being through all leaders
4. Remove barriers, add convenient, aligned
options to support personally meaningful goals
5. Integrate with culture, thoughtful of inclusion
TURCK’s Lessons Learned
54

Vision for an Integrated Approach to
Organizational Sustainability
55
Continuous Improvement
Climate of Well-being
Environmental, Health + Safety
Sustainable Health, Growth

Best Practices in Attracting and Retaining Talent for Manufacturing
Kenneth Matos, Senior Director of Research, Families and Work Institute, NY;
Kyle Adamonis, Senior Vice President, Taco, Inc., RI.;
Nooshin Nathan, AVP Human Resources, JM Eagle, CA.; and
Gayle Troy, HR Manager, Globe Manufacturing Company, LLC , NH.

Kenneth Matos
Senior Director of Research
Families and Work Institute
Moderator
57

1: May 2015 SHRM LINE: Leading Indicators of National Employment
2: Robbins, J. (2013) Solving US Manufacturing's New Talent
Recruitment Landscape has Changed
1. In April 2015, a net of 35 percent of manufacturing organizations report more difficulty with recruiting than the previous year, an increase of 12.5 points. This continues a 14 month trend of greater difficulty in hiring than the prior year. 1
2. According to a 2013 Accenture survey of U.S. manufacturing senior executives from the automotive, industrial products, consumer goods, and electronics and high tech industry,
1. 64% ranked skilled trade talent as their No. 1 or No. 2 most-needed worker
2. 48% ranked supervisors as the No. 1 or No. 2 need.2
58

1: Robbins, J. (2013) Solving US Manufacturing's New Talent Challenge
2: Current Issues in HR Closing the Manufacturing Skills Gap
3: Employed persons by detailed industry and age, 2013 annual averages
Recruitment Landscape has Changed (cont.)
3. Recruiting talent away from competitors is common:
a) 89% of manufacturers hire supervisors from competitors
b) 81% recruit their skilled trade labor from the competition1
4. Trading talent is a losing strategy in the face of the coming boomer retirement wave:
a) The median age of the manufacturing workforce rose from 40.5 years in 2000 to 44.9 years by 2013. 2, 3
b) The average age of a high-skilled employee with worker technical training and industry certification, or an associate’s or bachelor’s degree in a manufacturing-related field is 56.3
59
Kyle Adamonis
Senior Vice President
Taco, Inc.
Speaker
60


WHO WE ARE
• Established in 1920
• 3rd Generation Family Owned Business
• Combines Family Values & Professional Management
• Annual Sales in Excess of $200 MM
• 650 Employees – Non-Union
• Leader in Residential/Commercial Hydronic HVAC Components & Systems
• American Manufacturing Excellence
• ISO–9001 Registered

WHO WE ARE• Average Age of Employees: 51
• Range in age: 21 to 77
• 65% male/35% female
63%
23%
10%4% ETHNICITY
CAUCASIAN
ASIAN
HISPANIC
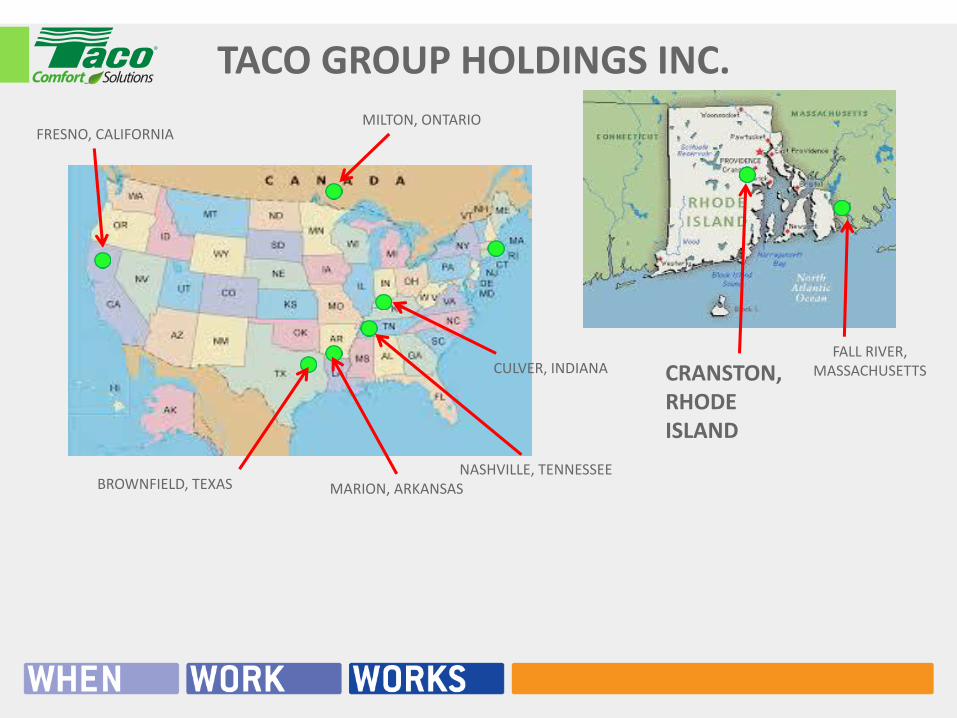
TACO GROUP HOLDINGS INC.
MARION, ARKANSASNASHVILLE, TENNESSEE
CULVER, INDIANA CRANSTON, RHODE ISLAND
FALL RIVER, MASSACHUSETTS
MILTON, ONTARIOFRESNO, CALIFORNIA
BROWNFIELD, TEXAS

TACO GROUP HOLDINGS INC.
CTU TRADING COMPANY, LIMITED
HONG KONG & SUZHOU
DUBAI
CHOD

Build Your Manufacturing Employment Brand
• Define the Internal and External Goals
• Have a Unique Value Proposition
• Provide a Consistent and Attractive Image of Your Brand
• Exploit the Power of Social Media
• Sell Career Opportunities
66

• Workplace Flexibility encompasses much more than flexible schedules and work locations
- Predictable Schedules
- On-site Educational Opportunities and Degree Programs
- Children’s Programs
- Well Days
- Cross-Training
- Work Share – An alternative to Layoffs
Workplace Flexibility
67

• Form a team of co-conspirators
• Network
• Use HR & Manufacturing Data (SHRM, Families and Work Institute, National Association of Manufacturing)
• Engage children and young adults through mentoring, educational opportunities, tours, internships, co-ops, and innovative projects
• Never think you are too small to be effective – Never Give Up!
Tips & Advice
68

Nooshin Nathan
AVP Human Resources
JM Eagle
Speaker
69

JM Eagle is the leading manufacturer of PVC and PE plastic pipe.With 22 manufacturing plants throughout North America, JMEagle manufactures the widest array of high-grade, high-performance polyvinyl chloride and high-density polyethylenepipe across a variety of industries and applications includingutility, solvent weld, electrical conduit, natural gas, irrigation,potable water and sewage.
Who We Are?
70

JM Eagle: Where We Are
71

A Case Study of our Tulsa, Oklahoma Plant
• Culture - System of shared values, assumptions, beliefs, and the norms that unite members of an organization. Organizational Culture effects the outcome of safety, quality, productivity, reputation and employee retention.
• Initially, Tulsa’s culture was not conducive to a positive, productive environment. They experienced poor safety record, employee complaints, low moral, quality complaints, low production rates, equipment malfunctions and high overhead costs.
• Turnover at 47%.
72

Targets and Goals
• Conducted SWOT Analysis to determine needed changes
• Adjust the hiring process to reduce turnover
• Improve processes and eliminate non value added steps.
• Improve communications/Be Transparent
• Improve compensation and review system - develop objective criteria for ratings
• Environmental Changes
• Improve Safety - CPR/FIRST AID –OSHA 10, HAZCOM.
• Employee Engagement - foster a team oriented environment
• Utilize State resources - Oklahoma Manufacturers Alliance
– Tulsa Technology Center – connected training and MONEY! CI Solutions –Champions of Lean training and Process Improvements.
– Tulsa Community College – connecting with Certified Production Technician graduates and training for our current employees (Safety, Quality, Basic machining knowledge)
• Leadership as change agents through Training - communication skills, conflict resolutions skills built strong relationships among the management team.
73

Recruiting and Onboarding
Challenge:
• Candidates from agencies were not being properly screened or informed of the type of manufacturing and processes. The right “fit” for the Tulsa plant was not properly identified. This resulted in buyer’s remorse.
• Supervisors were unsure of how to systematically develop their new employees
Solution:
• Plant overview video was created to show potential candidates
• Training videos were created for pre-employment orientations
• Training map was created to show employees how they will progress
• Work Instructions and Standard Operating Procedures were updated
74

New Training Method
75

Sample JIB – Job Instruction Breakdown
76

Current State Recruiting and Onboarding Map
Agency Orienation
Welcome and
Overview videos
10 minutes
Agency Orienation
Safety
Commitment to Safety
Overhead Crane
10 minutes
Agency Orientation
Quality
How to use Mic, Pi
Tape, and Caliphers
3 minutes
JM Eagle Orientation
Quality
Wall Monitoring Devices
Hands on Mic, Pi Tape and
Test
Print Line Verification
Packaging
Sample Frequency
Unsafe Acts
Work Order/Specifications
Appearance
2 hours
JM Eagle Orientation
Safety
Plant Tour
Emergency Action
Plan
THM/ISO
Coiling Video
Forklift
Webnet Training
2 hours
Agency Orientation
Production
Extrusion Video
Banding Video
10 minutes
Schedule Orienation
at JM Eagle
(at least 1 day after
Agency Orientation
Schedule Contractor
to Begin on Shift
Begin OJT
Day 1
Banding
Day 2
Banding and Stacking
Day 3
Banding, Stacking,
Packaging
Evaluate After Day 3
Is contractor ready to move
on to next phase?
Attendance?
Week 2 – 30 days
Instruction on QA
checks and Line
checks.
Paperwork
Shadow a tenured
Operator
Evaluate
Is contractor ready to move
on to next phase?
31- 60 days
Stick Line
Large Coil
Conduit
50% Operator
Shadowing
Evaluate
Is contractor ready to move
on to next phase?
91 days – 12 Months
QA Cross Training
Line adjustments
Start Up
Shut Down
Change Over
Evaluate
Is contractor ready to move
on to next phase?
Convert
Contractor to JM
Eagle Permanent
Employee
61-90 days
QA Checks
Line Checks
Paperwork
Packaging
25% Shadowing
Evaluate
Is contractor ready to move on
to next phase? ability to Train
and Run Lines?
Schedule
Agency
Orientation
Skilled
Operator
6/20/201412 Month MapFuture State
Map
JM Eagle
Yes
No
EXIT
Yes
Yes Yes
Yes
Is contractor
interested in
working at JM
Eagle?
Yes
No
EXIT
No
No No
JM EAGLE Orientation
Production
Coiling & Banding
2 Hours
NAME:
DOH:
77

Seal Room
Before
After
78

War Room/Information Highway
Allows for all employees to be updated on the current state of the plant and also communicate issues and suggestions for plant and process improvements.
79

Tips, Advice & Lessons Learned• Culture - Employees care about corporate culture and want to work in a
positive and organized environment. Foster an environment where employees are invested and have the same goals.
• Onboarding - Review your process and convey clear roadmap and understanding of role. Don’t oversell to avoid buyer’s remorse.
• Training – Involve all employees from leadership down. Use JIB and onboarding map so new talent receives clear direction of their role. Involve every employee as a member of a “Lean Team” event or training session.
• Communication – Create a space for communication. War Room which is an information super highway for plant production employees and a place to conduct daily tool box chats and training sessions.
• Incentivized and reward – Benchmark for competitive compensation. Incentives such as safety rewards (lunches, gift cards, suggestion competitions, production competitions, event tickets, T-shirts and other items to celebrate goals achieved)
• Employee Engagement – Transparency , and improved work environment• Use State Resources in Manufacturing for funding and other assistance.
80

Gayle Troy
HR Manager
Globe Manufacturing Company, LLC
Speaker
81

• World’s Largest Producer of Protective Clothing for Firefighters (and related occupations)
• Family Owned and Operated
- Fourth Generation Business
- Founded in 1887
• Headquarters and main Manufacturing Facility in Pittsfield, NH (330 employees)
- Manufacturing in Ada, OK (45 employees)
- Manufacturing in Auburn, ME (60 employees)
- Customer Support Facility in Springfield, VA (10 employees)
Globe Manufacturing Company, LLC
82

• All Facilities Non-Union
• 72% Female
• One Shift Operation
• Average Length of Service
• HQ = 15 years
• Remote = 7 years (oldest facility is 11 years)
• All Garments are Customized
• Average order size 4 pieces (2 coats, 2 pants)
• Many Different Tasks
• Frequently only 1-2 Employees per Operation
Globe Manufacturing Company, LLC
83

• Don’t try to fit someone else’s program into Your Workplace!
• Analyze your Company
- What needs to change?
- Why?
- Who will be effected?
- What are the costs? (Dollars, Time, Disruption)
Tips, Suggestions and Comments from Globe
• Think of the Unintended Consequences:
- Involve other major departments (especially Operations)
- Ask “what happens if…?”
- Check with Admins, who know the nitty-gritty of how things really work
- Challenge your own Assumptions
84

• Ensure that Solutions Reward the Right People (don’t cater to the “bad” employees)
• Thoroughly Explain the new Program or Procedure
- In Writing
- In Meetings
- Encourage Questions
- Create Shortcuts and Forms
Tips, Suggestions and Comments from Globe - 2
• Don’t be Afraid to make Changes or Tweak Things (if it doesn’t work perfectly at first)
• Welcome Good Ideas from Everyone
• Consider what Exceptions might be Requested or Needed – how will they be handled?
• Delegate Authority to the Right People
85

• Keep Managers and Supervisors on Your Side by Including Them in Decisions and Implementation
• Consider whether some Areas will need Different Rules or Guidelines
• Don’t Rush to Implement a Policy or Program which isn’t fully Developed
• But, don’t Procrastinate and wait for it to be “Perfect” either
Tips, Suggestions and Comments from Globe - 3
• Create a Coalition of Like-Minded Peers to Brainstorm Ideas and Evaluate Suggestions
• Use Outside Resources when Necessary – find Partners who are inexpensive when you can (educational institutions, industry groups, etc.)
• Be Creative!
86

Panel Discussion
87
Q1. Please tell us a about some of the unique opportunities and challenges you
have faced regarding attracting and retaining talent?
88

Q2. What are some innovative or creative strategies that you have used to attract
talent to your organization?
89

Q3. What were some of the challenges you faced implementing these mechanisms and
what are some of the opportunities now open to you as a result of these
mechanisms?
90

Manufacturing is seen by some as a non-desirable nor coveted industry for
employment.
Q4. How has your organization addressed this perception in its recruiting and branding
processes?
91

Q5. What tracking mechanisms do you have to understand the effectiveness of your
recruitment and retention polices?
92

Q6. How have you used flexible work arrangements and other work-life fit
strategies (e.g., assisting with working while pursuing a degree or caregiving) to help
attract and retain talent?
93

Q7. What strategies have you employed to grow your own internal talent pipeline?
94

Questions from the Audience
95

BREAK
96
Can Flexibility Work in Manufacturing? Reports from the Frontline
Dr. Kenneth Matos, Senior Director of Research, FWI, NY;Michele “Shelly” Green SVP, HR Operations, Building Systems and
L&W Supply and Senior Director, HR for USG Corporation, IL.; Craig Porter, President/Owner, PlastiCert, MN.; and
Bernadette T. Scarola, HR Business Partner, American Sensor Technologies, Inc. a TE Connectivity company, NJ

Kenneth Matos
Senior Director of Research
Families and Work Institute
Moderator
98

Is Workflex Possible in Manufacturing?
Workflex is a dynamic partnership between employers and employees that defines how, when and where work gets
done in ways that work for all.
At its core, workflex is a process for solving problems and increasing effectiveness and efficiency on and off the job.
99

• When Work Works, a project of Families and Work Institute and the Society for Human Resource Management, is a nationwide initiative to bring research on workplace effectiveness and flexibility into community and business practice.
• Workflex and Manufacturing Guide is the first in a series of guides exploring best practices in workflex by industry and practice.
When Work Works Partnership and Guides
100

Michele “Shelly” Green
SVP, HR Operations, Building Systems and L&W Supply and Senior Director, HR
USG Corporation
Speaker
101

• Founded in 1902
• Manufacturer and Distributor of Building Products
- United States Gypsum Company
- USG Interiors, Inc.
- L&W Supply Corporation
• Brand names such as SHEETROCK®, DUROCK®, and DONN®
• 52 manufacturing plants (U.S., Canada and Mexico)
• 146 Distribution Branches (U.S.)
• Cyclical business
USG Corporation
102

• 5,900 hourly employees / 3,100 salaried employees
• Quarries, mines, manufacturing plants and distribution branches
• Non-union manufacturing
• Values-Based Culture (Safety and Integrity)
• Industry leading innovator
• Urban and remote locations
• Continuous operations
• Fixed and rotating shifts
• 40% of hourly employees over the age of 50
USG Corporation
103

• Be willing to look at policies and processes differently
• Understand your workforce and what is important to your employees
• Get your employees engaged
- Opinion Surveys
- Feedback
Advice
104

Craig Porter
President/Owner
Plasticert
Speaker
105

• 34 years in business
• founded in PA, 2002 expanded to MN thru asset acquisition,
since 2009 solely MN location, both sites non-union
• Service provider only
• Work with a number of multi-national OEMs
• Remainder are small to mid-sized OEMs
• Small Plastic injection Molder,
• design and build molds,
• injection mold parts
• Value add secondary work
PlastiCert Biography
106

• Current workforce of 25
Workforce background
• Staff demographics
107
Half Millennials, a third eyeing retirement

1. A 100% service provider of manufacturing technology to other companies, both components and assemblies.
2. Only two of the 45 customers served last year provide a forecast, remainder order on demand and expect delivery in 3 weeks or less.
3. We made 770 shipments last year, totaling over 1.5million parts, yet
• That was 200+ different parts numbers/molds
• Virtually all work orders span 1 – 2 days maximum duration,
• Average work order size was approx. 3,000 parts
• As such, the production schedule is constantly changing.
4. Utilize 11 injection molding presses, 25 – 440 ton, many ancillary machines, ultrasonic welder, heat stake, pad printers, stator winder, test equipment and customer trimming and sorting.
Operations description for implementing Flex
108
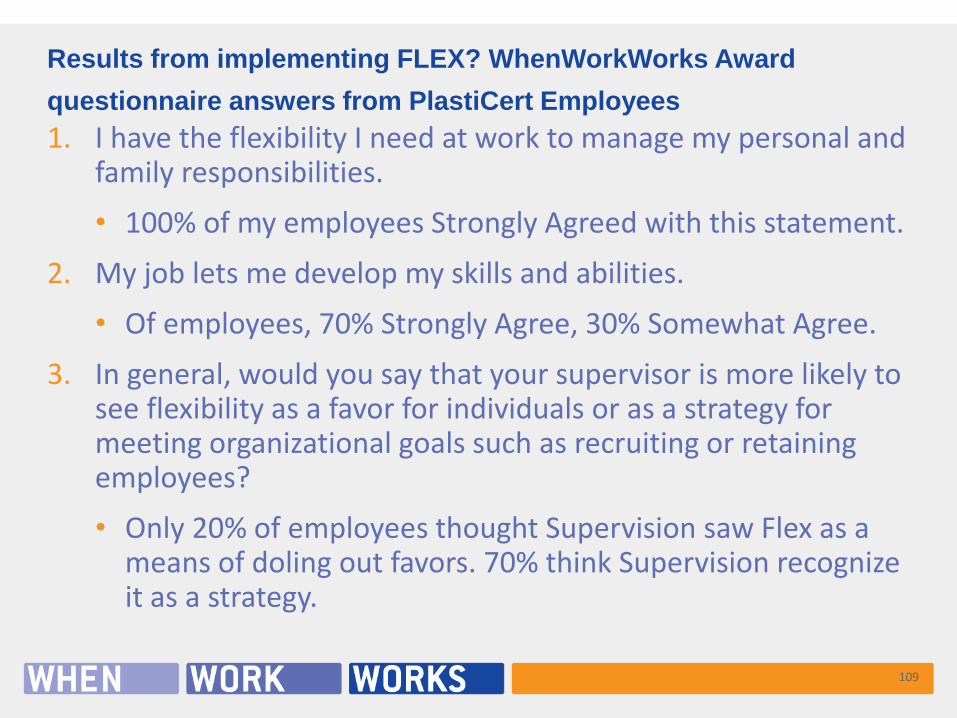
1. I have the flexibility I need at work to manage my personal and family responsibilities.
• 100% of my employees Strongly Agreed with this statement.
2. My job lets me develop my skills and abilities.
• Of employees, 70% Strongly Agree, 30% Somewhat Agree.
3. In general, would you say that your supervisor is more likely to see flexibility as a favor for individuals or as a strategy for meeting organizational goals such as recruiting or retaining employees?
• Only 20% of employees thought Supervision saw Flex as a means of doling out favors. 70% think Supervision recognize it as a strategy.
Results from implementing FLEX? WhenWorkWorks Award
questionnaire answers from PlastiCert Employees
109

1. Reinvigorated the staff – almost an ESOP type of buy-in
• Comments from staff include
• better work life balance – being able to meet both work and personal commitments………. increased sense of control leading to an increased sense of well-being………
• ……greater job satisfaction making us all happier people.
• remain in the workforce longer because of the greater flexibility of our jobs
• …….the fact that everyday changes up a bit with where we work makes the job more exciting.
• Every day is different. Today I am in packing, tomorrow maybe I’ll be working on one of the machines. It keeps every day interesting and enjoyable.
Workflex ROI – What has it meant to PlastiCert?
110

1. From a recent benchmarking survey we did:
• Compared to companies 6X our size:
• We had nearly the same number of molds in service (235 vs 265) and half the number of average presses (11 vs 22)
– Our Quality PPM at our customer was 3PPM vs avg of 42ppm
– Our On time delivery was 98% vs avg of 95.8%
• In spite of 20% of workforce being interns/college students and temporaries, our turnover was still 10% less than the larger companies average.
Workflex ROI (cont)
111

Bernadette T. Scarola
HR Business Partner
American Sensor Technologies, Inc.
Speaker
112

American Sensor Technologies, Inc. a TE Connectivity Company
About American Sensor Technologies, Inc. (AST)American Sensor Technologies, Inc. manufactures pressure sensors and related products in its Mount Olive, New Jersey USA facility, supporting customers with quick turnaround and quality instruments.
Products can be offered from our standard catalog or modified into a semi-custom or custom package for Industrial OEM applications. With a wide selection of third party approvals and certifications, products are widely trusted and used in hazardous location environments. www.astsensors.comwww.te.com
113

American Sensor Technologies, Inc. a TE Connectivity Company
Related Companies
TE Connectivity - Schaffhausen, Switzerland
TE Connectivity (NYSE: TEL) is a technology leader that designs and manufactures the electronic connectors, components and systems inside the products that are changing the world - making them smarter, safer, greener and more connected. In September, 2014, TE Connectivity acquired American Sensor Technologies. The acquisition further expands TE’s growing portfolio of sensors and sensor systems.
Hong Kong Sensor Technologies (HKST) - Hong Kong, China
In 2001, AST opened a facility in Hong Kong to support pressure sensor market in Asia. Today, HKST has grown its manufacturing capability and sales network to fully support the manufacture and distribution pressure sensors in Asia's growing sensor market. HKST currently distributes AST hazardous location approved products in oil and gas applications throughout China, Singapore, and Indonesia.
Macro Sensors - Pennsauken, NJ
In June 2005, AST acquired Macro Sensors, in order to complement its pressure products with a full line of linear position sensors. Macro Sensors manufactures LVDT and RVDT position sensors in its Pennsauken, NJ facility. Markets supported include power generation, oil and gas, automation, industrial equipment, aerospace, UHV and more.
Awards and Recognition
AST is continually recognized within the sensor industry and the financial sector for its success and growth as a privately held
company. Products and editorials are regularly featured in publications such as Machine Design, Fluid Power Journal, Design Fax,
Off Highway Engineering, and Hydraulics and Pneumatics. AST has also been the recipient of awards for outstanding growth.
Deloitte has ranked AST as one of the fastest growing private companies is the U.S.; Ernst & Young recognized the founders in 2007
as "Entrepreneurs of the Year" for Technology Innovation. Recently, AST was awarded the 2013 Alfred P. Sloan Award
for its commitment to workplace flexibility.
114

The 2009 economic downturn forced labor cost reduction initiatives at AST. Instead of layoffs and the negative economical impact of such on the employees, AST used more effective approach of a rolling furlough. This resulted in 100% retention, stronger workforce, all inclusive diverse team.
Workflex in Manufacturing
115

Pay Period Pay Period
Week 1 Week 2 Week 3 Week 4
Team 1 Work Work Off Work
Team 2 Work Off Work Work
Team 3 Off Work Work Off
Rolling Furlough
• Program’s accomplishments:
- NJ unemployment covered furlough weeks
- Uninterrupted benefits
- Cross trained workforce
- 100% retention after and during furlough
- Improved productivity
116
The furlough was flexed based on production needs (2 weeks on, 1 week off or 4 weeks on, one week off)

• Cross-train each department to cover all critical positions
• Integrate cultural groups
• Form quality circles
Cross-train the Workforce
117
Shipping
ReceivingStockroom
Cross-train

• Various starting times
• 4-day work week
• Split shifts
• Job sharing
• Comp time
Flexible Work Environment
118
Balance

Increased Productivity
Productivity: Hours per Unit at the facility level
119

Workflex in Manufacturing
• Cross-training
• Rolling Furlough
• Flexible work environment
• Increased Productivity
• Harmonious multi-cultural work environment
• Work-Life balance
• Employee Retention
120

Panel Discussion
121
Q1. Please tell us a about some of the unique opportunities and challenges you
have faced when building support for workflex in your organization from leaders
and managers?
122

Q2. What are some innovative and creative strategies that you have used to integrate
workflex into your organization?
123

Q3. What were some of the challenges you faced implementing these strategies and what are some of the opportunities now open to you as a result of your efforts?
124

Manufacturing is seen by some as an inflexible industry with little concern for life
outside of work.
Q4. How has your organization addressed this perception in its recruiting and branding
processes?
125

Q5. What tracking mechanisms do you have to understand the effectiveness of your
workflex initiatives?
126

Q6. What benefits, including attracting and retaining talent and productivity
improvements, have you reaped from workflex and other work-life fit strategies?
127

Q7. What do you see as the future of workflex at your organization and in the
manufacturing industry in general?
128

Questions from the Audience
129

• Want to know how work-life friendly your workplace is?
• Upon completion of this free, 15 minute tool you will have
- your workflex score and
- a benchmark of how you compare to others across the U.S. in your industry.
• Go to: http://www.whenworkworks.org/workflex-assessment
Workflex Assessment
130

Build Your Own Talent Pipeline
Stephen Tucker
June 28, 2015

Stephen Tucker, MBA
Director of Industry Partnerships
Partners For a Competitive Workforce
Speaker
132

• Executives surveyed agree there is a talent shortage in U. S. manufacturing.
• SIX out of TEN open skilled production positions gounfilled due to a talent shortage.
Talent Shortage in U.S. Manufacturing
133

Supply side of the manufacturing equation can’t keep up with demand…
• 2.7M job openings due to retirement
+ 700K manufacturing jobs created by growth
• 3.4M manufacturing job openings by 2025
- 1.4M manufacturing jobs filled by supply
2 Million unfilled jobs due to the skills gap
…And its Going to Get Worse
134

PCW IS OUR REGION’S EFFORT TO CLOSE THE SKILLS GAP
Managed by the United Way with financial and technical support provided by the NFWS
We are 150+ organizations joining efforts…> employers
> workforce boards
> chambers and economic development
> education and training institutions
> community organizations
135

OUR MISSION IS TO MEET EMPLOYER DEMAND BY GROWING THE SKILLS OF THE WORKFORCE
1
2
3
Align education with industry needs
Build career pathways in Healthcare, Manufacturing, Construction, IT, and Transportation/Distribution/Logistics
Provide businesses with a qualified workforce and utilize industry intelligence to develop short and long term strategies to build the talent pipeline
136

U.S. Chamber of Commerce FoundationTalent Pipeline Management Overview
137
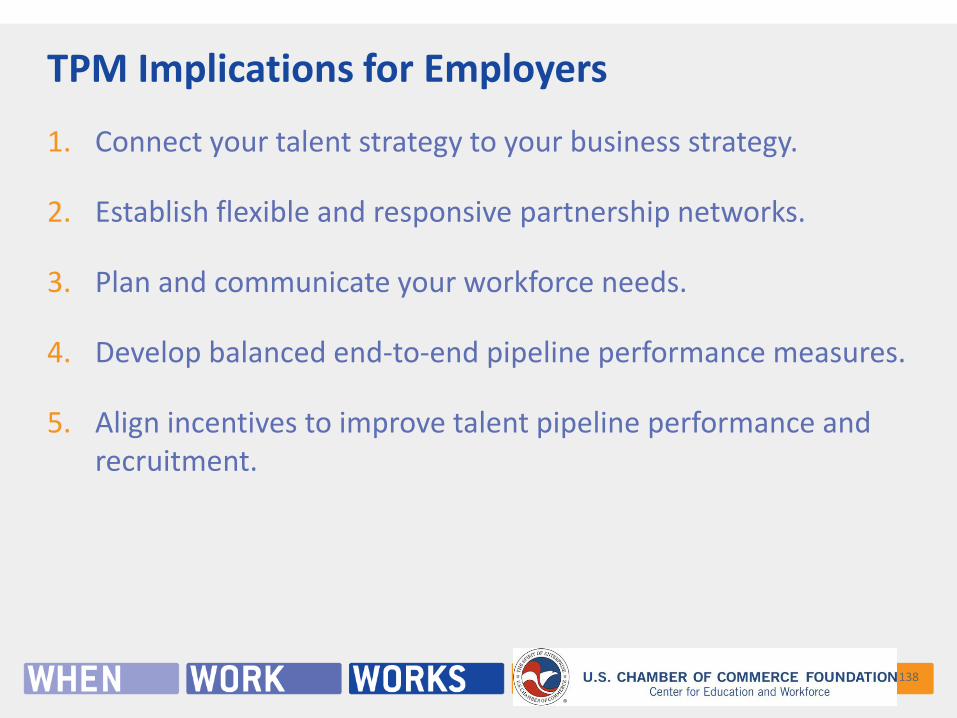
1. Connect your talent strategy to your business strategy.
2. Establish flexible and responsive partnership networks.
3. Plan and communicate your workforce needs.
4. Develop balanced end-to-end pipeline performance measures.
5. Align incentives to improve talent pipeline performance and recruitment.
TPM Implications for Employers
138

Talent Pipeline Management Strategies
2. Demand Planning
“What positions drive our competitiveness and how many workers do we need
to fill them?”
3. Competencies and Credentials
“What do workers need to know and do? What
evidence do we require to prove it?”
4. Talent Flow Analysis
“Where do we get our best talent today and who are
the most promising providers?”
5. Employer Measures
“How do we measure success and improve
performance?”
6. Public and Private Incentives
“How do we recognize and reward performance and
improve over time?”1.Employer
Collaborative“What is our
focus and who leads?”
139

The Question: What is our focus and who leads?
Steps:
1. Establish the need for a collaborative and identify a focus area.
2. Identify a lead organization to serve as a pilot collaborative.
3. Prioritize and coordinate activities and practices for employer end-
customers.
Organize and Launch Employer Collaboratives
140

Organize and Launch Employer Collaboratives
Options for organizing an employer collaborative
Employer Collaborative Focus Examples
By Industry SectorManufacturingEnergyHealthcare
By Business CapabilitiesEngineeringProductionTherapeutic Services
By Supply Chain Supplier – Manufacturer –Distributor –Retailer
141

The Question: What positions drive our competitiveness and how many
workers do we need to fill them?
Steps:
1. Segment your workforce and target capabilities that drive competitiveness.
2. Survey employers about their short-term job opening forecasts and
aggregate.
3. Communicate survey results with collaborative member businesses and
partners.
Engage in Demand Planning
142
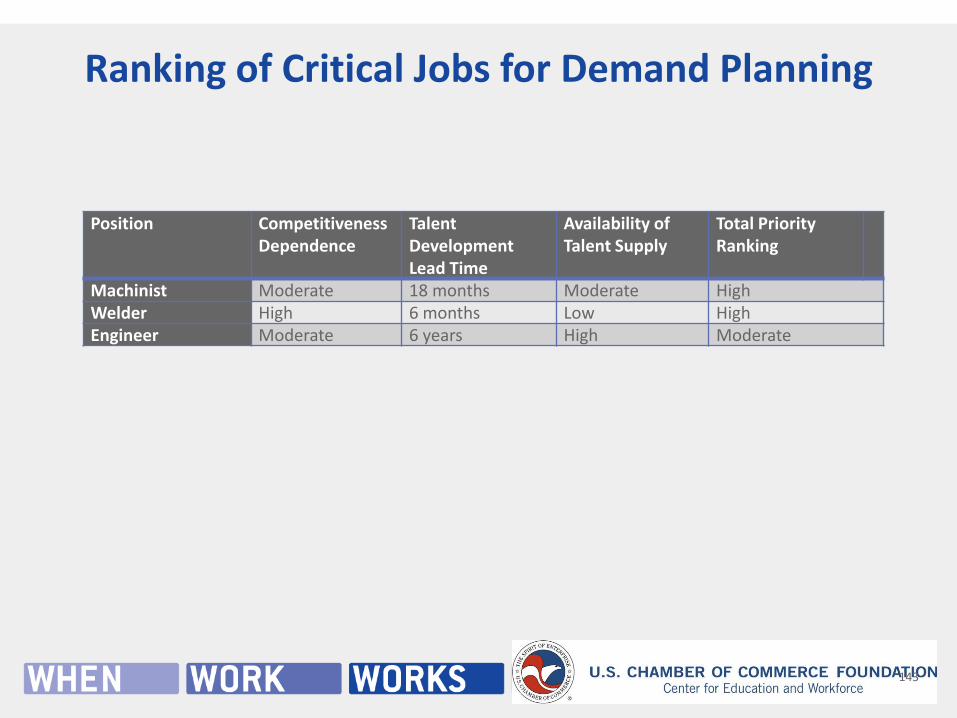
Ranking of Critical Jobs for Demand Planning
Position Competitiveness Dependence
Talent Development Lead Time
Availability of Talent Supply
Total Priority Ranking
Machinist Moderate 18 months Moderate HighWelder High 6 months Low HighEngineer Moderate 6 years High Moderate
143

The Question: What do workers need to know and do? What evidence do we
require to prove it?
Steps:
1. Inventory competency and credential requirements for target positions.
2. Share and validate the inventory with collaborative members.
3. Communicate competency and credential requirements with stakeholders.
Communicate Competency and Credentialing Requirements
144

The Question: Where do we get our best talent today and who are the most
promising providers?
Steps:
1. Back-map where employers get their best talent today for target positions.
2. Describe the current state of talent flows using visualization tools.
3. Improve performance of existing providers and access new supplier
networks.
Perform Talent Flow Analysis
145

The Question: How do we measure success and improve performance?
Steps:
1. Select and prioritize key performance measures across the talent pipeline.
2. Develop shared and internal performance management tools (e.g.
dashboards).
3. Support continuous improvement through leading and lagging measures.
Develop Employer Measures
146

The Question: How do we recognize and reward performance and improve over
time?
Steps:
1. Employers align their internal incentives to support sourcing strategies.
2. Employers designate and reward preferred provider networks.
3. Inventory public-sector recognition systems and funding streams and align
with employer incentives.
Aligning Public and Private Incentives
147

Challenge:
• More than 80% of employers in Northern Kentucky are not confident that they are able to quickly find workers to meet their skill and growth needs
• Lack of understanding about most regional manufacturing jobs prevent individuals from considering manufacturing careers
Project Objectives:
• Recruit four manufacturing employers to establish an initial employer collaborative
• Validate critical and difficult to fill position, focusing on technical occupations
• Conduct demand planning with collaborative members and establish a common set of competency and credential requirements across these manufacturers
• Develop a pilot training program for one of the critical technical occupations to develop pipeline to meet manufacturers needs
• Based on learnings from pilot collaborative, expand to other critical positions and manufacturers
Impact Northern Kentucky – Talent Pipeline Initiative
148

What does this all mean for you?
YOU as an employer can take action to solve for your talent needs
Poaching talent from competitors is not a sustainable, effective strategy for finding the skilled workforce you need
Think about other companies who may have similar needs as you (your supply chain, your competitors); identify a group that could act as an intermediary for your collaborative (Chamber, Economic Development organization, etc.)
Initiate conversations to start building out talent pipelines to supply the workforce you need to grow and stay competitive
149

Learn More about TPM and Get Help
To learn more about Talent Pipeline Management and learn about organizations in your area implementing TPM strategies, visit the U.S. Chamber of Commerce Center for Education and Workforce website
Download the Talent Pipeline Employer Checklist to help get started (http://www.uschamberfoundation.org/sites/default/files/media-uploads/checklists_FINAL.pdf)
Look out for the TPM Toolkit being published fall 2015 for a guide on how to get started
Contact Stephen to learn more about Impact Northern Kentucky’s progress
https://www.youtube.com/watch?v=ZMR85Q7oqq0&feature=em-share_video_user
150

Thank you!Questions or comments please contact
• Cassidy SolisWorkplace Flexibility Program SpecialistSociety for Human Resource [email protected] 703.535.6086
• Connect with When Work WorksFor application status and join email list: [email protected]/about-the-awardTwitter: @WhenWorkWorks @FWINews and @SHRMPressLinkedin.com/company/families-and-work-instituteFacebook.com/FWINews
151
• SAVE THESE DATES: WWW Award opens on August 17 and ends on November 6, 2015. There is no feeto apply!
• For details go to: WhenWorkWorks.org/about-the-award
Apply for the When Work Works Award!
152