august 14, 2003 blackout final report 14, 2003 blackout final report ... 765 kv 500 kv 345 kv ......
TRANSCRIPT

August 14, 2003 BlackoutFinal Report
U.S.-Canada Power System Outage Task Force
Final Report Summary

2
Overview
The blackout and the investigationFindings – how the blackout happenedWhy the blackout happenedReport recommendations
3
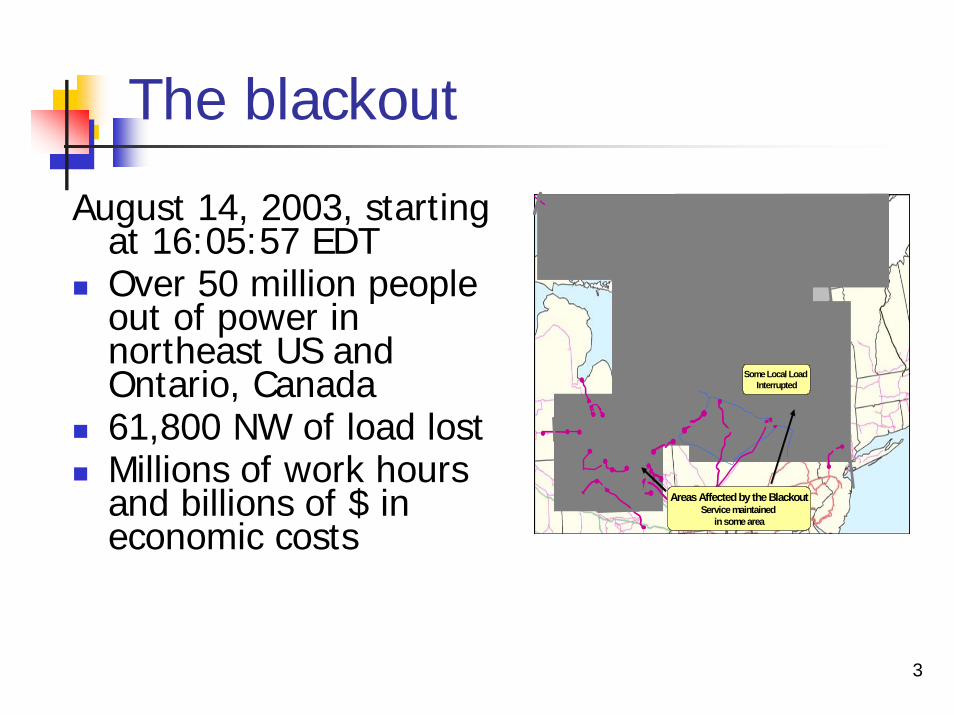
The blackout
August 14, 2003, starting at 16:05:57 EDT Over 50 million people out of power in northeast US and Ontario, Canada61,800 NW of load lostMillions of work hours and billions of $ in economic costs
Areas Affected by the BlackoutService maintained
in some area
Some Local Load Interrupted

4
The investigationDirected by President Bush and Prime Minister Chrétien on 8/15/03Task Force headed by US Secretary of Energy and Canadian Minister of Natural Resources, with US and Canadian officialsThree work groups – Electric System Outage, Nuclear and SecurityInvestigators from both nations, public and private sectorElectric system investigation team composed of NERC, industry experts across US and Canada, US and Canada federal staff

5
Computer problemsAt 12:15 EDT, MISO began having problems with its state estimator; it didn’t return to full functionality until 16:04 EDT.Sometime after 14:14 EDT, FirstEnergy began losing its energy management system (EMS) alarms but didn’t know it.At 14:20 EDT, parts of FE’s EMS began to fail –first remote sites, then core servers – but FE system operators didn’t know and FE IT support didn’t tell them.Without a functioning EMS, FE operators didn’t know their system was losing lines and voltage until perhaps 15:45 EDT.

6
Reactive power problemsAt 13:31 EDT, FirstEnergy lost the Eastlake 5 plant, a critical source of real and reactive power for the Cleveland-Akron area.FE did not perform contingency analysis after this trip. FE did not have sufficient understanding of the Cleveland-Akron area to know their system was seriously deficient in reactive power for voltage support.

7
Cleveland area voltage began falling
Hourly North-South 345kV Actual (Measured) Voltages on August 14th
320
325
330
335
340
345
350
355
360
365
St. Clair
(ITC)
Brownstow
n (ITC
)
Allen Junction(FE)
Lemoyne (FE)
Avon Lake (FE-C
AA)
Harding (FE-C
AA)
Juniper (FE-C
AA)
Cham
berlin (FE-C
AA)
Star (FE-C
AA)
South Canton
(AEP)
Samm
is-East(FE)
Bus
kV
13:00 EDT14:00 EDT15:00 EDT16:00 EDT
100%
95%
FE - Cleveland/Akron area
Transmission Lines
765 kV500 kV345 kV230 kV
Transmission Lines
765 kV500 kV345 kV230 kV
North to South 345kV Voltage Profile Locations
AllenJunction
Lemoyne
AvonLake
Star
HardingJuniper
Chamberlin
Brownstown
St. Clair
SouthCanton
Sammis
Hourly West-East 345kV Actual (Measured) Voltages on August 14th
320
325
330
335
340
345
350
355
360
365
Allen Junction(FE)
Lemoyne (FE)
Beaver (FE-C
AA)
Avon Lake (FE-C
AA)
Star (FE-C
AA)
Harding (FE-C
AA)
Juniper (FE-C
AA)
Hanna (FE-C
AA)
Highland
(FE)
Shenango (FE)
Erie-West
(PJM)
Wayne
(FE)
Hom
er City-
North (PJM
)
Bus
kV
13:00 EDT14:00 EDT15:00 EDT16:00 EDT
100%
95%
FE - Cleveland/Akron area

8
Line outages
Between 15:05 and 15:41 EDT, FE lost 3 345 kV lines in the Cleveland-Akron area under normal loading due to contact with too-tall trees –but didn’t know it without EMS.Line loading shifted and reactive power demands increased with each line loss.Between 15:39 and 16:08 EDT, FE lost 16 138kV lines in the Cleveland-Akron area due to overloads and ground faults.

9
The Ohio tipping pointAt 15:57:05 EDT, FE lost the Sammis-Star 345 kV line due to overload. This shut down a major path for power imports into the Cleveland-Akron area and was the starting point for the full cascade.
Remaining Paths
5A

10
The cascade
A cascade is a dynamic phenomenon in an electric system that can’t be stopped by human intervention once it startsPower swings, voltage fluctuations and frequency fluctuations cause sequential trips of numerous transmission lines and generators, and automatic load-shedding in a widening geographic area.System oscillations grow so large the system can’t rebalance and stabilize.

11
16:05:57 16:05:58 16:09:25
16:10:37 16:10:39 16:10:40 16:10:41
16:10:44 16:10:45 16:13:00
1. 2. 3.
7.6.5.4.
10.9.8.

12
265 power plants lost

13
Why did Ohio start happen?
The Ohio phase began because:1. FirstEnergy and ECAR failed to study and
understand the inadequacies of the FE system and FE didn’t operate the system with appropriate voltage criteria.
2. FE had inadequate situational awareness and didn’t recognize its system deteriorating.

14
Why did Ohio start happen?
3. FE failed to trim trees in its rights of way, so each early 345 kV line faulted on a tree that was too tall.
4. MISO and neighboring PJM didn’t provide effective real-time diagnostic support to FE.
5. FE didn’t act to restore its system to a secure condition (due to the other causes).

15
Why the cascade happened1. Sammis-Star and the Cleveland-Akron line
trips shifted load burden onto limited paths2. After Sammis-Star, Zone 3 (and 2) relays in
Ohio and Michigan caused 13 line trips between 15:57:05 and 16:10:38.350 EDT that would not have happened so quickly without those relays.
ONTARIO
13
910
12
14 11
12
34
5
7
8 6
16:09:05OhioAcademia – Howard (138 kV)Philo – Howard (138 kV)
6
16:10:37.550MichiganArgenta – Verona (138 kV)11
16:10:37.870MichiganDelhi – Island Road (138 kV)12
16:10:38.350MichiganArgenta – Morrow (138 kV)14
16:10:37.900MichiganVerona – Batavia (138 kV)13
16:10:36.310MichiganArgenta – Tompkins (345 kV)Battle Ck – Oneida
10
16:10:36.230MichiganArgenta – Battle Ck (345 kV)9
16:09:06.311OhioE. Lima – Fostoria (345 kV)8
16:09:06OhioTangy – Kirby (138 kV)Tangy – Crissinger (138 kV)
7
16:09:00OhioRichland – Wauseon – Midway (138 kV)5
16:08:59.158OhioGalion – Ohio CTL – Muskingum (345 kV) @ Muskingum
4
16:08:58OhioOhio CTL – Wooster (138 kV)3
16:06:01OhioStar (138/69 kV) Transformer # 6Star – Dale (69kV)
2
16:05:57.504OhioSammis – Star (345 kV)1
Trip TimeStateZone 3 Tripped Lines

16
The cascade (2)
3. Relay settings on lines, generators and load-shedding across the northeast were not coordinated and integrated to reduce the likelihood of a cascade, so the grid’s elements and regions couldn’t rebalance.
4. Physics – once the frequency, voltage and power swings started, the grid couldn’t recover

17
Report recommendations for better reliability
Institutional issues (14 recommendations), including:Make reliability standards mandatory and enforceableDevelop an independent funding mechanism for NERCStrengthen reliability institutions, including NERC and regional councils, and define minimum requirements and cleaner footprints for control areas and reliability authoritiesReliability investments should be recoverable in transmission rates

18
Reliability recommendationsStrengthen and support NERC’s actions of
February 14, 2004 (17), including:Correct the direct causes of the blackoutStrengthen NERC compliance programSupport NERC’s Reliability Readiness AuditsImprove operator training and certification Use better system protection measuresUse better real-time tools for grid monitoring and operationAccelerate and improve reliability standards

19
Reliability recommendationsPhysical and cyber-security (13):
Implement NERC IT standardsDevelop IT management proceduresImprove IT forensic and diagnostic capabilitiesEstablish authority for physical and cyber securityControl access to critical equipment
Canadian nuclear power (2)

20
Will More Blackouts Occur?
System is man-made, and subject to mechanical failure and human error.NERC’s readiness audits are a key preventive measure.The U.S – Canada Task Force has been extended for a year to provide oversight for implementation of recommendations.