automap1.2 – extract, analyze, represent, and compare
TRANSCRIPT

AutoMap1.2 – Extract, analyze, represent, and compare mental models from texts*
CASOS Technical Report Jana Diesner, Kathleen M. Carley
January 2004 CMU-ISRI-04-100
Carnegie Mellon University School of Computer Science
ISRI - Institute for Software Research International CASOS - Center for Computational Analysis of Social and Organizational Systems
Abstract
AutoMap1.2 is a network text analysis tool that extracts, analyzes, represents, and compares mental models from texts. Network text analysis is a specific text analysis method that encodes links between words in a text and builds a network of the linked words.
Computational analysis of networks pulled out of textual data is a growing area of research for the following reasons:
- The large and still growing number of electronically available texts requires the investigation of appropriate methods and tools to analyze large scale collections of texts effectively and efficiently.
- Today’s communication theories are oriented towards complex, large-scale systems, and therefore require methods that provide multi-level access to the meaning of textual data.
AutoMap helps users to analyze textual data according to the current requirements.
* This work was supported in part by the National Science Foundation under grants: No. ITR/IM IIS-0081219, NSF 0201706 doctoral dissertation award, and NSF IGERT 9972762 in CASOS. Additional support was provided by CASOS and ISRI at Carnegie Mellon University. The views and conclusions contained in this document are those of the authors and should not be interpreted as representing the official policies, either expressed or implied, of the National Science Foundation, or the U.S. government.

CMU SCS ISRI CASOS Report -ii-
Keywords: text analysis, network text analysis, computer-supported text analysis, machine coding, content analysis, maps

CMU SCS ISRI CASOS Report -iii-
Table of contents
I. Index of Tables ...................................................................................................................... iv II. Index of Figures ..................................................................................................................... iv 1. Motivation............................................................................................................................... 1 2. Method and model .................................................................................................................. 1 3. Input ........................................................................................................................................ 2 4. How AutoMap codes texts as maps ........................................................................................ 2
4.1 Text pre-processing......................................................................................................... 5 4.2 Impact of text pre-processing on the data ....................................................................... 7 4.3 Statement formation........................................................................................................ 8 4.4 Impact of statement formation on analysis results........................................................ 12
5. Outputs.................................................................................................................................. 13 6. Types of analysis................................................................................................................... 17 7. Compare mental models ....................................................................................................... 21 8. Performance aspects.............................................................................................................. 22 9. Future development .............................................................................................................. 23 10. Hardware and software requirements ............................................................................... 23 References..................................................................................................................................... 24 Appendix....................................................................................................................................... 26

CMU SCS ISRI CASOS Report -iv-
I. Index of Tables Table 1: Delete list application ....................................................................................................... 5 Table 2: Generalization................................................................................................................... 7 Table 3: Resulting statements after using various values for text unit, window size, and
directionality for statement formation .................................................................................... 9 Table 4: Statement formation: Adjacency applied to the delete list ............................................. 10 Table 5: Statement formation: Adjacency applied to the thesaurus ............................................. 11 Table 6: Coding choices in AutoMap ........................................................................................... 11 Table 7: Term distribution lists and matrices ............................................................................... 15 Table 8: Term distribution matrix of concepts by concepts ......................................................... 16 Table 9: Map analysis results........................................................................................................ 17 Table 10: Meta-matrix analysis results ......................................................................................... 20 Table 11: Sub-matrix analysis results ........................................................................................... 21 Table 12: Map comparison results................................................................................................ 22 Table 13: Analysis duration (in seconds)...................................................................................... 22
II. Index of Figures Figure 1: Concept list...................................................................................................................... 3 Figure 2: Union concept list............................................................................................................ 4 Figure 3: Entering a generalization thesaurus into AutoMap ......................................................... 6 Figure 4: Impact of statement formation choices on AutoMap results......................................... 12 Figure 5: Stat file .......................................................................................................................... 13 Figure 6: AutoMap GUI................................................................................................................ 14 Figure 7: Meta-matrix thesaurus................................................................................................... 19
CMU SCS ISRI CASOS Report -1-
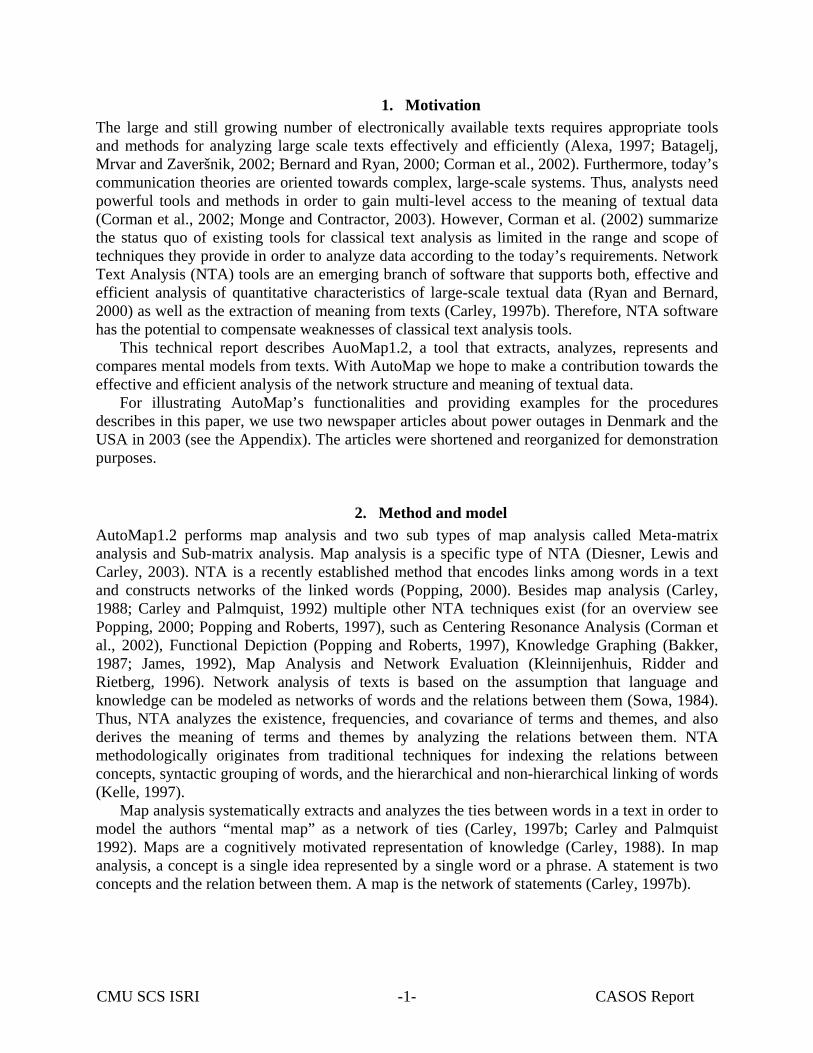
1. Motivation The large and still growing number of electronically available texts requires appropriate tools and methods for analyzing large scale texts effectively and efficiently (Alexa, 1997; Batagelj, Mrvar and Zaveršnik, 2002; Bernard and Ryan, 2000; Corman et al., 2002). Furthermore, today’s communication theories are oriented towards complex, large-scale systems. Thus, analysts need powerful tools and methods in order to gain multi-level access to the meaning of textual data (Corman et al., 2002; Monge and Contractor, 2003). However, Corman et al. (2002) summarize the status quo of existing tools for classical text analysis as limited in the range and scope of techniques they provide in order to analyze data according to the today’s requirements. Network Text Analysis (NTA) tools are an emerging branch of software that supports both, effective and efficient analysis of quantitative characteristics of large-scale textual data (Ryan and Bernard, 2000) as well as the extraction of meaning from texts (Carley, 1997b). Therefore, NTA software has the potential to compensate weaknesses of classical text analysis tools.
This technical report describes AuoMap1.2, a tool that extracts, analyzes, represents and compares mental models from texts. With AutoMap we hope to make a contribution towards the effective and efficient analysis of the network structure and meaning of textual data.
For illustrating AutoMap’s functionalities and providing examples for the procedures describes in this paper, we use two newspaper articles about power outages in Denmark and the USA in 2003 (see the Appendix). The articles were shortened and reorganized for demonstration purposes.
2. Method and model AutoMap1.2 performs map analysis and two sub types of map analysis called Meta-matrix analysis and Sub-matrix analysis. Map analysis is a specific type of NTA (Diesner, Lewis and Carley, 2003). NTA is a recently established method that encodes links among words in a text and constructs networks of the linked words (Popping, 2000). Besides map analysis (Carley, 1988; Carley and Palmquist, 1992) multiple other NTA techniques exist (for an overview see Popping, 2000; Popping and Roberts, 1997), such as Centering Resonance Analysis (Corman et al., 2002), Functional Depiction (Popping and Roberts, 1997), Knowledge Graphing (Bakker, 1987; James, 1992), Map Analysis and Network Evaluation (Kleinnijenhuis, Ridder and Rietberg, 1996). Network analysis of texts is based on the assumption that language and knowledge can be modeled as networks of words and the relations between them (Sowa, 1984). Thus, NTA analyzes the existence, frequencies, and covariance of terms and themes, and also derives the meaning of terms and themes by analyzing the relations between them. NTA methodologically originates from traditional techniques for indexing the relations between concepts, syntactic grouping of words, and the hierarchical and non-hierarchical linking of words (Kelle, 1997).
Map analysis systematically extracts and analyzes the ties between words in a text in order to model the authors “mental map” as a network of ties (Carley, 1997b; Carley and Palmquist 1992). Maps are a cognitively motivated representation of knowledge (Carley, 1988). In map analysis, a concept is a single idea represented by a single word or a phrase. A statement is two concepts and the relation between them. A map is the network of statements (Carley, 1997b).

CMU SCS ISRI CASOS Report -2-
3. Input AutoMap takes raw, free flowing, and unmarked texts as input. This makes AutoMap very flexible with respect to the type of texts it can analyze: input texts can be, for example, news paper articles, e-mails, texts from individuals like award recommendations, or organizations like mission statements or annual reports.
When the input texts are loaded into AutoMap, the program automatically creates a concept list. A concept list is a two columned table that contains all concepts per text and the related frequencies. The user needs a concept list to get a first, quantitative overview of the concepts appearing in the texts and to make further data processing decisions (Section 4.1). When the user performs text processing operations that affect the text level concepts the concept list is automatically updated. The user can also request a union concept list that denotes all concepts appearing across all input texts and the related, cumulative frequencies. The union concept list can be refreshed after each step of text processing in order to visualize the impact of processing operations on the union of concepts. The concept list and the union concept list can be sorted alphabetically or by frequency. Both lists can be saved.
Figure 1 (page 3) and 2 (page 4) show parts of AutoMap’s graphical user interface. These parts provide an example for the displayed part of a concept list and a union concept list, ordered by concept’s frequency. The text corpus used for this example consists of two sub sample text from the sample texts (see the Appendix). Sub sample text one (from Denmark.txt) and two (from USA.txt) are displayed on the “1. Input Text” panel on the “Text Pre-processing” panel in Figure 1 and 2, respectively.
4. How AutoMap codes texts as maps AutoMap encodes the links between concepts in a text and builds a network of the linked concepts. Coding in AutoMap is computer-assisted. Computer-assisted coding means that the machine applies a set of coding rules that were defined by a human in order to index the input texts and code them as networks (Ryan and Bernard, 2000, p.786; Kelle, 1997 p. 6; Klein, 1997, p. 256). The coding rules that the user needs to specify in AutoMap are about text pre-processing and statement formation (Carley, 1993; Alexa, 1997):
- Text pre-processing condenses the data to the concepts that capture the features of the
texts that are relevant to the user. Therefore, pre-processing simplifies the task of making meaningful interpretations and comparisons across texts (Ryan and Bernard, 2000).
- Statement formation rules determine how to link concepts into statements. The procedure of statement formation is specific to NTA.
The pre-processing (section 4.1) rules and the statement formation rules together form the
coding scheme. In the following, we describe the coding choices offered in AutoMap in detail, and their impact on the analysis results (for a more detailed description of the impact of coding choices on map analysis results see Diesner, Lewis and Carley, 2003).

CMU SCS ISRI CASOS Report -3-
Figure 1: Concept list

CMU SCS ISRI CASOS Report -4-
Figure 2: Union concept list
CMU SCS ISRI CASOS Report -5-
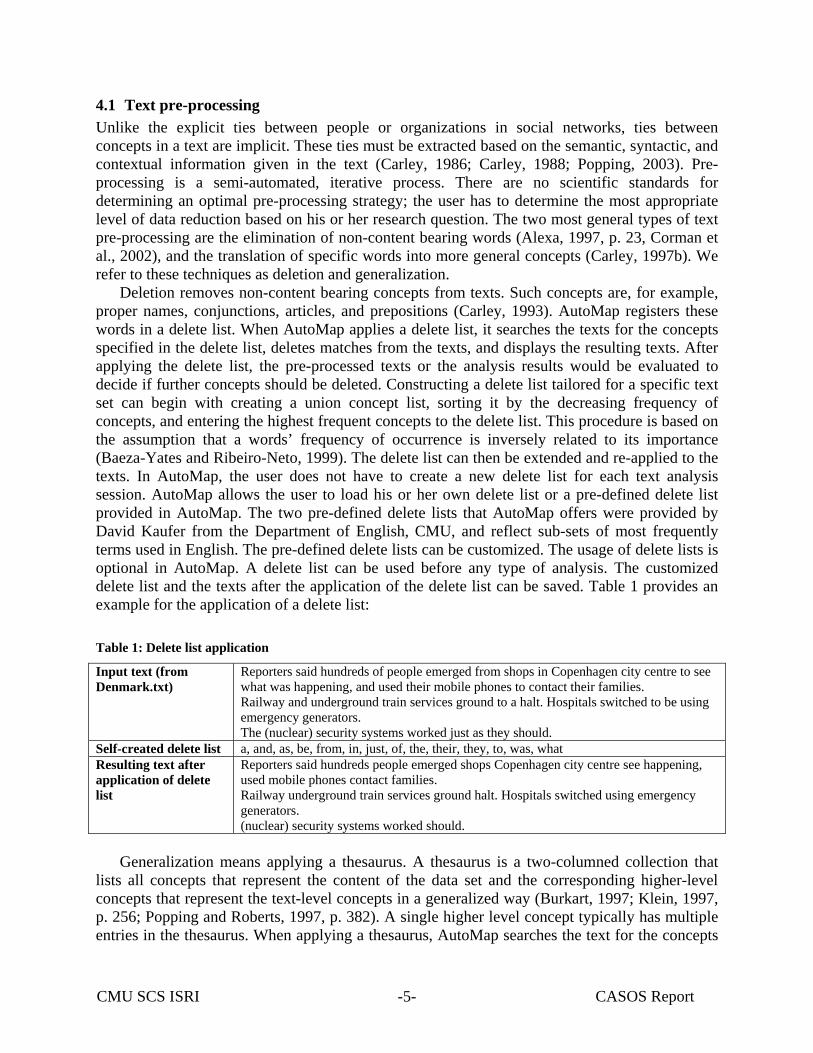
4.1 Text pre-processing Unlike the explicit ties between people or organizations in social networks, ties between concepts in a text are implicit. These ties must be extracted based on the semantic, syntactic, and contextual information given in the text (Carley, 1986; Carley, 1988; Popping, 2003). Pre-processing is a semi-automated, iterative process. There are no scientific standards for determining an optimal pre-processing strategy; the user has to determine the most appropriate level of data reduction based on his or her research question. The two most general types of text pre-processing are the elimination of non-content bearing words (Alexa, 1997, p. 23, Corman et al., 2002), and the translation of specific words into more general concepts (Carley, 1997b). We refer to these techniques as deletion and generalization.
Deletion removes non-content bearing concepts from texts. Such concepts are, for example, proper names, conjunctions, articles, and prepositions (Carley, 1993). AutoMap registers these words in a delete list. When AutoMap applies a delete list, it searches the texts for the concepts specified in the delete list, deletes matches from the texts, and displays the resulting texts. After applying the delete list, the pre-processed texts or the analysis results would be evaluated to decide if further concepts should be deleted. Constructing a delete list tailored for a specific text set can begin with creating a union concept list, sorting it by the decreasing frequency of concepts, and entering the highest frequent concepts to the delete list. This procedure is based on the assumption that a words’ frequency of occurrence is inversely related to its importance (Baeza-Yates and Ribeiro-Neto, 1999). The delete list can then be extended and re-applied to the texts. In AutoMap, the user does not have to create a new delete list for each text analysis session. AutoMap allows the user to load his or her own delete list or a pre-defined delete list provided in AutoMap. The two pre-defined delete lists that AutoMap offers were provided by David Kaufer from the Department of English, CMU, and reflect sub-sets of most frequently terms used in English. The pre-defined delete lists can be customized. The usage of delete lists is optional in AutoMap. A delete list can be used before any type of analysis. The customized delete list and the texts after the application of the delete list can be saved. Table 1 provides an example for the application of a delete list:
Table 1: Delete list application
Input text (from Denmark.txt)
Reporters said hundreds of people emerged from shops in Copenhagen city centre to see what was happening, and used their mobile phones to contact their families. Railway and underground train services ground to a halt. Hospitals switched to be using emergency generators. The (nuclear) security systems worked just as they should.
Self-created delete list a, and, as, be, from, in, just, of, the, their, they, to, was, what Resulting text after application of delete list
Reporters said hundreds people emerged shops Copenhagen city centre see happening, used mobile phones contact families. Railway underground train services ground halt. Hospitals switched using emergency generators. (nuclear) security systems worked should.
Generalization means applying a thesaurus. A thesaurus is a two-columned collection that
lists all concepts that represent the content of the data set and the corresponding higher-level concepts that represent the text-level concepts in a generalized way (Burkart, 1997; Klein, 1997, p. 256; Popping and Roberts, 1997, p. 382). A single higher level concept typically has multiple entries in the thesaurus. When applying a thesaurus, AutoMap searches the text for the concepts

CMU SCS ISRI CASOS Report -6-
specified in the thesaurus, translates matches into the associated higher level concepts, and displays the modified texts. The terminology of a thesaurus depends on the content and the subject of the data set (Burkart, 1997, p.163; Zuell and Alexa, 2001, p.313). In AutoMap the user needs to provide a manually created thesaurus. The thesaurus can be created within AutoMap or with an external text editor. A thesaurus is created by reading a set of texts and/ or using pre-defined material and/ or deriving concepts and higher-level concepts from theory (Burkart, 1997; Kelle, 1997, p.5; Klein, 1997, p.356; Kuckartz, 1997, p. 364; Zuell and Alexa, 2001, p.13). AutoMap supports the user in building a thesaurus by displaying the union of concepts and the concepts per text. This helps the user to decide what concepts to enter in the thesaurus as text level concepts. Analogous to the delete list, an optimal thesaurus is created through an iterative process of testing and modifying.
When applying a thesaurus in AutoMap, the user must decide if he wants to: - Maintain only the higher level concepts that match the text level concepts specified in
the thesaurus while dropping the rest of the original input text. This option is called “thesaurus content only”; or
- Generate pre-processed texts that maintain concepts not matching entries in the thesaurus while translating matching concepts into related high-level concepts.
Figure 3 shows how a generalization thesaurus is entered into AutoMap:
Figure 3: Entering a generalization thesaurus into AutoMap

CMU SCS ISRI CASOS Report -7-
Table 2 shows the resulting texts after applying the thesaurus shown above with and without the “thesaurus content only” to a text. A delete list was not used prior to applying the thesaurus. Table 2: Generalization
Input text, pre-processed with delete list (see Table 1)
Setting Resulting text
Thesaurus content only
agents communication agents location location perception action, communication communication organization.
Reporters said hundreds of people emerged from shops in Copenhagen city centre to see what was happening, and used their mobile phones to contact their families.
Not Thesaurus content only (default)
agents communication hundreds of agents emerged from shops in location location to perception what was action, and used their communication to communication their organization.
In AutoMap the usage of a thesaurus is optional. A generalization thesaurus can be used
before any type of analysis. The customized thesaurus and the texts after the application of the thesaurus can be saved.
4.2 Impact of text pre-processing on the data In a previous study, we investigated the impact of various pre-processing strategies available in AutoMap on map analysis results (Diesner, Lewis and Carley, 2003). The data set that we analyzed contained 172 texts. Each original input text on average had 372 total concepts; half of them were unique concepts. The number of unique concepts considers each concept only once, whereas the number of total concepts also considers repetitions of concepts. From our study we learned the following:
- Using a customized delete list removes 26 percent of the total concepts and 8 percent of
unique concepts. - Data reduction achieved by applying a thesaurus, but not using the “thesaurus content
only” option is only a side-effect of this procedure. The main purpose of the usage of a thesaurus is the qualitative effect of translating text-level concepts into higher-level concepts. Data reduction after thesaurus application only occurs when N-grams are translated into shorter higher level concept (e.g. top market position into leading). In our study, the data reduction rates after applying a thesaurus were 2.4 percent for total concepts and 4.3 percent for unique concepts.
- The application can result in a significant quantitative data reduction if the “thesaurus content only” option is chosen. In our study, this strategy removed over 90% of the unique and total concepts. The remaining less than 10 percent of concepts form a highly stylized and reduced representation of the input texts. Furthermore, our results showed very similar reduction rates for unique and total concepts for this strategy. This indicates that with this pre-processing technique redundancy is strongly filtered out of the texts.

CMU SCS ISRI CASOS Report -8-
4.3 Statement formation A second set of coding choices are statement formation options. In AutoMap, statement formation choices are implemented as various operationalizations of the distance between concepts (Carley, 1993). These operationalizations reflect different approaches of the windowing method (Danowski, 1993). Windowing defines the size of a window as the length of a string of adjacent concepts that get linked into statements if they match the statement formation criteria. When performing statement formation, AutoMap slides a fictitious window over the text and links concepts within that window according to the coding rules. The statement formation choices in AutoMap are:
1. Text Unit: The user specifies the text portion in which statements can be formed. These
text units are either sentences, paragraphs or the entire text. 2. Window Size: By specifying the window size the user defines how distant concepts can
be from each other and still have a relationship. The window size is then applied to the specified text unit. For example, with a window size of three and sentence as text unit, every pair of concepts that is separated by one concept and that is not divided by a period is linked into a statement.
3. Directionality: Directionality can be either unidirectional or bidirectional. If unidirectionality is chosen, texts are searched for statements from the beginning to the end. If bidirectional is selected, statements can be formed from the left to the right and reverse.
4. Adjacency: When forming statements, classic text analysis tools treat all concepts in a pre-processed text as directly adjacent to each other. This strategy ignores concepts that intervened the maintained concepts in the original input text, but were removed during pre-processing. AutoMap also supports this approach and calls it “direct adjacency.” In addition to that we introduced a novel statement formation approach in AutoMap1.1, which serves as a logical complement to the direct adjacency. This new approach takes the original distance of concepts as they appear in the original input text into consideration. In AutoMap this approach is called “rhetorical adjacency”. Adjacency is only applicable if a delete list or a thesaurus with the “thesaurus content only” option are applied. Using rhetorical adjacency for pre-processing text level concepts matching entries of the delete list or not matching entries of the thesaurus will be replaced by imaginary placeholders. These placeholders ensure that only concepts, which occurred within a window before pre-processing, can form statements. In contrast, with the direct adjacency, concepts that do not appear within a window size in the original text can though form statements when concepts specified in the delete list and concepts not included in the thesaurus are deleted from the text. As a result, concepts, that were located far away from each other in the original text, are brought closer together.
Table 3 shows the impact of the selection of the various text units, two different window
sizes, and both directionality options on statement formation. For each cell in Table 3 one varied statement formation option was used in combination with AutoMap’s default statement formation settings, which are:
- Text Unit: text - Window Size: 2 - Directionality: uni-directional

CMU SCS ISRI CASOS Report -9-
Input text, pre-processed with delete list (see Table one): Railway underground train services ground halt. Hospitals switched using emergency generators. (nuclear) security systems worked should.
Note: This text sample contains two paragraphs.
Table 3: Resulting statements after using various values for text unit, window size, and directionality for statement formation
Text Unit Sentence Paragraph Text 1 emergency, generators 1 ground, halt 1 hospitals, switched 1 nuclear, security 1 railway, underground 1 security, systems 1 services, ground 1 switched, using 1 systems, worked 1 train, services 1 underground, train 1 using, emergency 1 worked, should
1 emergency, generators 1 ground, halt 1 halt, hospitals 1 hospitals , switched 1 nuclear, security 1 railway, underground 1 security, systems 1 services, ground 1 switched, using 1 systems, worked 1 train, services 1 underground, train 1 using, emergency 1 worked, should
1 emergency, generators 1 generators, nuclear 1 ground, halt 1 halt, hospitals 1 hospitals , switched 1 nuclear, security 1 railway, underground 1 security, systems 1 services, ground 1 switched, using 1 systems, worked 1 train, services 1 underground, train 1 using, emergency 1 worked, should
(same map as generated window-size 2 and uni-directionality)
Window Size 2 3 1 emergency, generators 1 generators, nuclear 1 ground, halt 1 halt, hospitals 1 hospitals , switched 1 nuclear, security 1 railway, underground 1 security, systems 1 services, ground 1 switched, using 1 systems, worked 1 train, services 1 underground, train 1 using, emergency 1 worked, should
(same map as generated with text unit and uni-directionality)
1 emergency, generators 1 emergency, nuclear 1 generators, nuclear 1 generators, security 1 ground, halt 1 ground, hospitals 1 halt, hospitals 1 halt, switched 1 hospitals , switched 1 hospitals, using 1 nuclear, security 1 nuclear, systems 1 railway, train 1 railway, underground 1 security, systems 1 security, worked 1 services, ground 1 services, halt 1 switched , emergency 1 switched , using 1 systems, should 1 systems, worked 1 train, ground 1 train, services 1 underground, services

CMU SCS ISRI CASOS Report -10-
1 underground, train 1 using, emergency 1 using, generators 1 worked, should
Directionality Uni-directional Bi-directional 1 emergency, generators 1 generators, nuclear 1 ground, halt 1 halt, hospitals 1 hospitals , switched 1 nuclear, security 1 railway, underground 1 security, systems 1 services, ground 1 switched, using 1 systems, worked 1 train, services 1 underground, train 1 using, emergency 1 worked, should
(same map as generated with text unit and window-size 2)
1 emergency, generators 1 emergency, using 1 generators ,emergency 1 generators, nuclear 1 ground, halt 1 ground, services 1 halt, ground 1 halt, hospitals 1 hospitals, halt 1 hospitals , switched 1 nuclear, generators 1 nuclear, security 1 railway, underground 1 security, nuclear 1 security, systems 1 services, ground 1 services, train 1 should, worked 1 switched , hospitals 1 switched , using 1 systems, security 1 systems, worked 1 train, services 1 train, underground 1 underground, railway 1 underground, train 1 using, emergency 1 using, switched 1 worked, should 1 worked, systems
Table 4 and 5 illustrate the impact of the direct and rhetorical adjacency applied to a delete
list and thesaurus:
Input text: Reporters said hundreds of people emerged from shops in Copenhagen city centre to see what was happening, and used their mobile phones to contact their families.
Table 4: Statement formation: Adjacency applied to the delete list
Delete list (self-designed)
Adjacency option
Resulting text Resulting statements
and from in of their to
Direct (default)
reporters said hundreds people emerged shops copenhagen city centre see happening , used mobile phones contact families .
1 centre, see 1 city, centre 1 contact, families 1 copenhagen, city 1 emerged , hops 1 happening, used

CMU SCS ISRI CASOS Report -11-
1 hundreds, people 1 mobile, phones 1 people, emerged 1 phones, contact 1 reporters, said 1 said, hundreds 1 see, happening 1 shops, copenhagen 1 used, mobile
was what
Rhetorical reporters said hundreds xxx people emerged xxx shops xxx copenhagen city centre xxx see xxx xxx happening , xxx used xxx mobile phones xxx contact xxx families
1 city, centre 1 copenhagen, city 1 mobile, phones 1 people, emerged 1 reporters, said 1 said, hundreds
Table 5: Statement formation: Adjacency applied to the thesaurus
Thesaurus Setting Resulting text Resulting statements
Thesaurus content only, direct adjacency (default if Thesaurus content only is chosen)
agents communication agents location location perception action, communication communication organization.
1 action, communication 1 agents, communication 1 agents, location 1 communication, agents 1 communication, communication 1 communication, organization 1 location, location 1 location, perception 1 perception, action
reporters/ agents said/ communication people/ agents Copenhagen/ location city centre/ location see/ perception happening/ action mobile phones/ communication contact/ communication families/ organization
Thesaurus content only, rhetorical adjacency
agents communication xxx xxx agents xxx xxx xxx xxx location location xxx perception xxx xxx action, xxx xxx xxx communication xxx communication xxx organization.
1 agents, communication 1 location, location
Table 6 summarizes the coding choices offered in AutoMap:
Table 6: Coding choices in AutoMap
Coding Choices Explanation Pre-processing Delete irrelevant (non-content bearing) concepts from original input text Deletion Delete highly frequent, but not content bearing concepts Generalization Translate concepts into higher level concepts Statement formation
Define distance of concepts that can form statements
Text unit Consider end of sentences, paragraphs or texts as border for statement formation Window size Define number of adjacent words that can link into statements Directionality Treat statements as being directed from left to right or non directed Adjacency Decide whether to consider (rhetorical adjacency) or neglect (direct adjacency) original
distance of concepts as they occur in original input text. Applicable when applying delete list and/or thesaurus.

CMU SCS ISRI CASOS Report -12-
4.4 Impact of statement formation on analysis results The tables presented in the previous section indicate that different statement formations choices result in statements that differ in number and content. In a previous study (Diesner, Lewis and Carley, 2003) we tested the impact of various text units, window sizes, and adjacency options on map analysis results. Figure 4 shows the number of statements in dependence of the statement formation settings. Figure 4: Impact of statement formation choices on AutoMap results
Impact of statement formation settings on number of unique statements
0
25
50
75
100
125
150
175
200
225
0 10 20 30 40 50 60 70
Window size
Num
ber o
f uni
que
stat
emen
ts
Rhetorical SentenceRhetorical ParagraphRhetorical TextDirect SentenceDirect ParagraphDirect Text
We learned the following: - With direct adjacency, more statements and denser networks are found than with
rhetorical adjacency. This trend declines and finally disappears with increasing window sizes: in coding settings, where only the adjacency is varied, the graphs that represent the size and density of the networks identified with rhetorical adjacency converge, and finally intersect the graphs produced with direct adjacency. The smaller the text unit is, the lower is the window size at which the graphs for rhetorical adjacency intersect the graph for direct adjacency. This means graphs showing the number of statements found with rhetorical and direct adjacency will first intersect on sentence level, then on paragraph level and then on text level. Furthermore, we learned that the window size at which the graphs will merge is bigger than the average size of the involved text unit.
- In a whole text, more statements and denser networks are found than in paragraphs, and in paragraphs more statements and denser networks are found than in sentences. This trend also decreases with increasing window sizes: The number of statements and the network’s densities stabilize from a certain window size on. For both adjacency options, this stabilization first occurs on sentence level, then on paragraph level, and then on text

CMU SCS ISRI CASOS Report -13-
level. For settings including rhetorical adjacency the window sizes at which results stabilize are bigger than those for direct adjacency.
This section has described the coding choices provided in AutoMap. Furthermore, we
showed that the user’s coding choices are critical, because they influence the analysis results (Carley, 1997a; Diesner, Lewis and Carley, 2003). Therefore, Carley (1997a) strongly recommends returning to the data several times and analyzing them with different coding schemes.
5. Outputs
AutoMap generates maps as representations of the author’s mental model that he or she had in mind when producing the text. AutoMap represents the extracted mental models as a map file and a stat file per text. A map file contains one coded statement per line (Figure 6, page 14, upper right panel). Depending on the user’s choice the map is binary or count. A stat file contains various measures that quantify the size and density of the network of each text (Figure 6, lower right panel). If multiple texts were analyzed the user can browse through the results on the AutoMap graphical user interface (GUI, Figure 6, browsing bar below the menu bar). For both, single and multiple analyses, the user can concurrently see the results, the related (pre-processed) input texts, and the pre-processing tools applied to the data (Figure 6).
Figure 5 briefly explains the entries in the stat file:
Figure 5: Stat file
Stat entry Stat Entry Explanation File: Name of the analyzed text file.
unique: # of concepts total:
The number of unique concepts considers each concept only once, whereas the number of total statements also considers repetitions of concepts.
unique: # of statements: total:
The number of unique statements considers each concept only once, whereas the number of total statements also considers repetitions of statements.
unique: density (based on statements)
total: Unique density is the density of the resulting network based on unique statements, total density respectively is the density of the resulting network based on the total number of statements.
Punctuation: The punctuation option chosen by the user (text, paragraph, or sentence). Window Size: The window size chosen by the user (2 to 100).
Analysis Settings
Directionality: The directionality option chosen by the user (uni-directional or bi-directional).
In addition to the map and stat files, the user can request various term distribution lists and matrices in comma separated value (csv) format from AutoMap. According to the user’s choice, these lists and matrices are binary or count. Table 7 (page 15) provides an overview of the types and contents of the term distribution lists and matrices.

CMU SCS ISRI CASOS Report -14-
Figure 6: AutoMap GUI
CMU SCS ISRI CASOS Report -15-
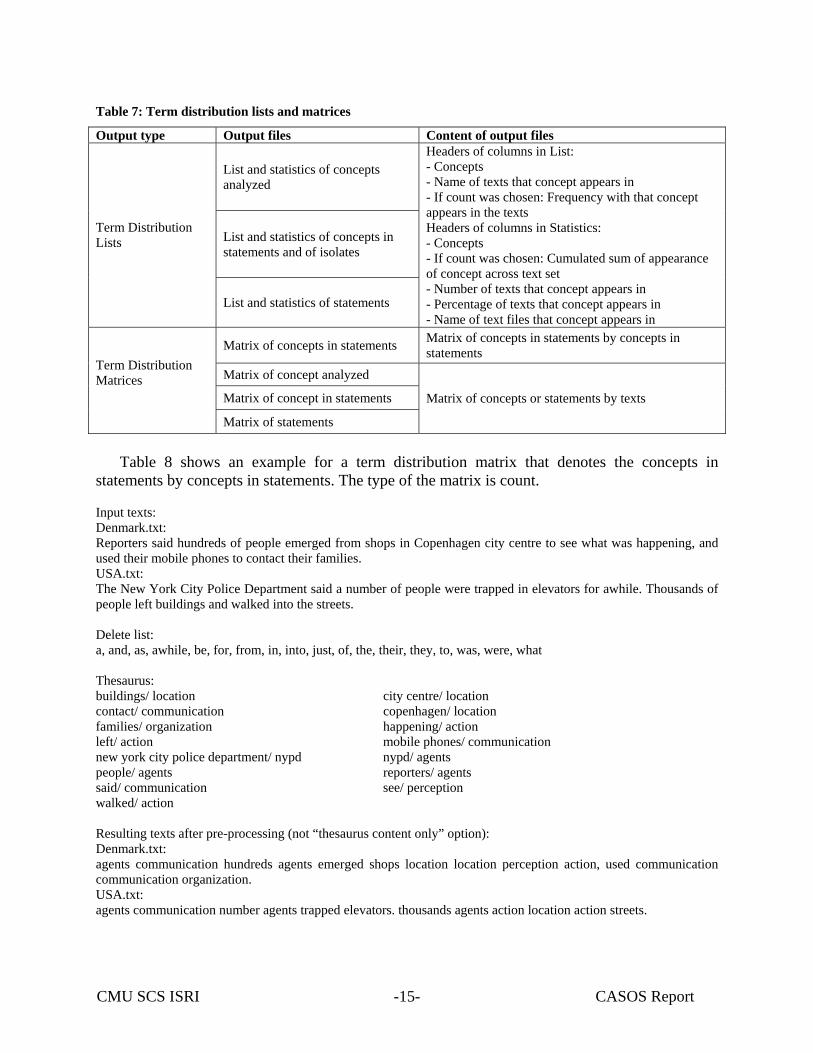
Table 7: Term distribution lists and matrices
Output type Output files Content of output files
List and statistics of concepts analyzed
List and statistics of concepts in statements and of isolates
Term Distribution Lists
List and statistics of statements
Headers of columns in List: - Concepts - Name of texts that concept appears in - If count was chosen: Frequency with that concept appears in the texts Headers of columns in Statistics: - Concepts - If count was chosen: Cumulated sum of appearance of concept across text set - Number of texts that concept appears in - Percentage of texts that concept appears in - Name of text files that concept appears in
Matrix of concepts in statements Matrix of concepts in statements by concepts in statements
Matrix of concept analyzed
Matrix of concept in statements
Term Distribution Matrices
Matrix of statements
Matrix of concepts or statements by texts
Table 8 shows an example for a term distribution matrix that denotes the concepts in
statements by concepts in statements. The type of the matrix is count. Input texts: Denmark.txt: Reporters said hundreds of people emerged from shops in Copenhagen city centre to see what was happening, and used their mobile phones to contact their families. USA.txt: The New York City Police Department said a number of people were trapped in elevators for awhile. Thousands of people left buildings and walked into the streets. Delete list: a, and, as, awhile, be, for, from, in, into, just, of, the, their, they, to, was, were, what Thesaurus: buildings/ location city centre/ location contact/ communication copenhagen/ location families/ organization happening/ action left/ action mobile phones/ communication new york city police department/ nypd nypd/ agents people/ agents reporters/ agents said/ communication see/ perception walked/ action Resulting texts after pre-processing (not “thesaurus content only” option): Denmark.txt: agents communication hundreds agents emerged shops location location perception action, used communication communication organization. USA.txt: agents communication number agents trapped elevators. thousands agents action location action streets.

CMU SCS ISRI CASOS Report -16-
Table 8: Term distribution matrix of concepts by concepts
perc
eptio
n
actio
n
elev
ator
s
agen
ts
thou
sand
s
com
mun
icat
ion
emer
ged
loca
tion
stre
ets
trapp
ed
shop
s
used
num
ber
hund
reds
location 1 1 0 0 0 0 0 1 0 0 0 0 0 0 trapped 0 0 1 0 0 0 0 0 0 0 0 0 0 0 hundreds 0 0 0 1 0 0 0 0 0 0 0 0 0 0 elevators 0 0 0 0 1 0 0 0 0 0 0 0 0 0 perception 0 1 0 0 0 0 0 0 0 0 0 0 0 0 communication 0 0 0 0 0 1 0 0 0 0 0 0 1 1 agents 0 1 0 0 0 2 1 0 0 1 0 0 0 0 thousands 0 0 0 1 0 0 0 0 0 0 0 0 0 0 action 0 0 0 0 0 0 0 1 1 0 0 1 0 0 number 0 0 0 1 0 0 0 0 0 0 0 0 0 0 emerged 0 0 0 0 0 0 0 0 0 0 1 0 0 0 used 0 0 0 0 0 1 0 0 0 0 0 0 0 0 shops 0 0 0 0 0 0 0 1 0 0 0 0 0 0
All maps and term distribution matrices can additionally be stored in the DL format for UCINET. This enables the user to import AutoMap outputs into UCINET in order to:
1. Perform UCINET analysis on AutoMap results. 2. Visualize AutoMap results with the visualizations tools launched through UCINET. What do the various outputs of AutoMap tell the user? AutoMap outputs represent mental
models and therefore can help to answer the following questions: - What words do people use? - How do people link the words they use? - What words to people use in order to refer to more abstract themes? - What themes do people evoke? - How do people link the themes they evoke? The outputs that AutoMap generates reflect the complexity of the semantic and syntactical
structure of the original input texts and the author’s mental maps. Therefore, map analysis as performed in AutoMap allows the user to stay close to the data and the research question, and to represent data in a rich network structure.

CMU SCS ISRI CASOS Report -17-
6. Types of analysis AutoMap offers three different types of analysis:
1. Map Analysis 2. Meta-Matrix Analysis 3. Sub-Matrix Analysis Each type of analysis generates the same types of outputs, as described in section 5, but takes
texts after different stages of data pre-processing as an input. Map analysis can be run on original input texts, or after deletion and/or generalization. The
statements shown in the previous tables are results from map analysis. Table 9 shows an example for map analysis results. The analysis was run on texts that were pre-processed with the same delete list and generalization thesaurus as used for the example shown in Table 8. Table 9: Map analysis results
Denmark.txt USA.txt Maps 1 action, used 1 agents, communication 1 agents, emerged 1 communication, communication 1 communication, hundreds 1 communication, organization 1 emerged, shops 1 hundreds, agents 1 location, location 1 location, perception 1 perception, action 1 shops, location 1 used, communication
1 action, location 1 action, streets 1 agents, action 1 agents, communication 1 agents, trapped 1 communication, number 1 elevators, thousands 1 location, action 1 number, agents 1 thousands, agents 1 trapped, elevators
Stats File: C:\Denmark.txt # of concepts: unique: 10 total: 14 # of statements: unique: 13 total: 13 Density (based on Statements): unique: 1.3 total: 1.3 Analysis-Settings: Punctuation: ignore punctuation Window Size: 2 directionality: unidirectional
File: C:\USA.txt # of concepts: unique: 9 total: 12 # of statements: unique: 11 total: 11 Density (based on Statements): unique: 1.22 total: 1.22 Analysis-Settings: Punctuation: ignore punctuation Window Size: 2 directionality: unidirectional

CMU SCS ISRI CASOS Report -18-
The meta-matrix approach (Carley, 2003; Carley and Ren, 2001; Krackhardt and Carley, 1998) provides a representational framework and a set of methods for analyzing multi-dimensional data. The idea of the meta-matrix originates from the combination of knowledge management, operations research, and social network analytic techniques and measures. This model enables the classification of nodes in a network as one of the categories: agents, knowledge, resources, tasks, and organizations. In AutoMap meta-matrix analysis can be run on texts that were pre-processed with a meta-matrix thesaurus. A meta-matrix thesaurus associates concepts with meta-matrix categories. In AutoMap the meta-matrix thesaurus automatically loads the union of concepts after the highest level of pre-processing applied in its most left column. The right columns denote the meta-matrix categories, which are:
- Agent - Knowledge - Resource - Task-event - Organization - Any user-defined categories
When applying a meta-matrix thesaurus, AutoMap searches the texts for the entries specified in the meta-matrix thesaurus and translates matches into the corresponding meta-matrix categories. A concept can be translated into one, multiple or none meta-matrix categories. A delete list and/or a generalization thesaurus can be applied before the meta-matrix thesaurus is applied. The meta-matrix thesaurus can be built within AutoMap or with an external text editor. Pre-defined meta-matrix thesauri can be imported into AutoMap, even if they match only partially the concepts in the left most column of the meta-matrix thesaurus. The meta-matrix thesaurus and the texts after the application of the meta-matrix thesaurus can be saved. Figure 7 (page 19) shows an example for the application of a meta-matrix thesaurus. Location was defined as a new category. Input texts: Denmark.txt: Reporters said hundreds of people emerged from shops in Copenhagen city centre to see what was happening, and used their mobile phones to contact their families. USA.txt: The New York City Police Department said a number of people were trapped in elevators for awhile. Thousands of people left buildings and walked into the streets. Delete list: a, and, as, awhile, be, for, from, in, into, just, of, the, their, they, to, was, were, what Thesaurus: new york city police department/ nypd

CMU SCS ISRI CASOS Report -19-
Figure 7: Meta-matrix thesaurus
Applying the meta-matrix thesaurus to the data with the “thesaurus content only” option and rhetorical adjacency results in the following output texts:
Denmark.txt: < agent> < knowledge> xxx < agent> < task-event> < resource location> < location> < location> < location> < task-event> xxx xxx xxx < resource> < knowledge task-event> < organization>
USA.txt: < organization> < knowledge> xxx < agent> xxx < resource> . xxx < agent> < task-event> < resource location> < task-event> < location> .
When AutoMap performs a meta-matrix analysis, it links the concepts in the pre-processed texts according to statement formation settings specified by the user. Table 10 (page 20) shows the results of a meta-matrix analysis run on the texts, which were pre-processed as shown in Figure 7 and with AutoMap’s default statement formation settings.
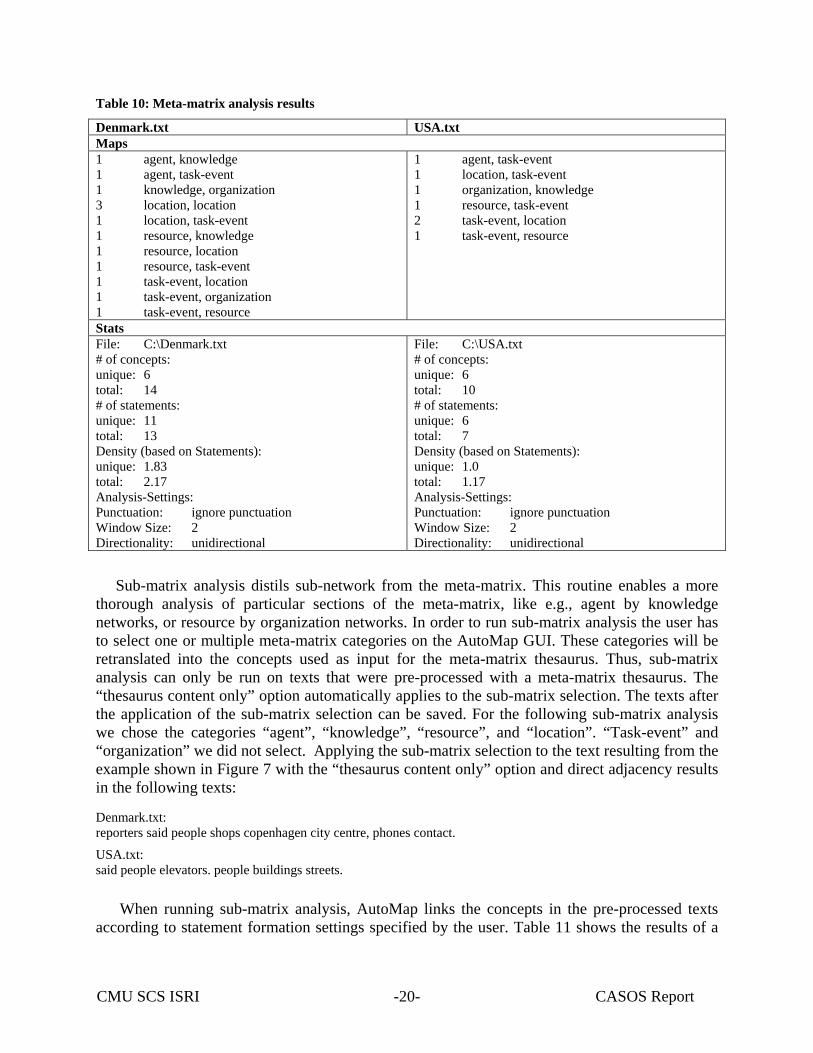
CMU SCS ISRI CASOS Report -20-
Table 10: Meta-matrix analysis results
Denmark.txt USA.txt Maps 1 agent, knowledge 1 agent, task-event 1 knowledge, organization 3 location, location 1 location, task-event 1 resource, knowledge 1 resource, location 1 resource, task-event 1 task-event, location 1 task-event, organization 1 task-event, resource
1 agent, task-event 1 location, task-event 1 organization, knowledge 1 resource, task-event 2 task-event, location 1 task-event, resource
Stats File: C:\Denmark.txt # of concepts: unique: 6 total: 14 # of statements: unique: 11 total: 13 Density (based on Statements): unique: 1.83 total: 2.17 Analysis-Settings: Punctuation: ignore punctuation Window Size: 2 Directionality: unidirectional
File: C:\USA.txt # of concepts: unique: 6 total: 10 # of statements: unique: 6 total: 7 Density (based on Statements): unique: 1.0 total: 1.17 Analysis-Settings: Punctuation: ignore punctuation Window Size: 2 Directionality: unidirectional
Sub-matrix analysis distils sub-network from the meta-matrix. This routine enables a more thorough analysis of particular sections of the meta-matrix, like e.g., agent by knowledge networks, or resource by organization networks. In order to run sub-matrix analysis the user has to select one or multiple meta-matrix categories on the AutoMap GUI. These categories will be retranslated into the concepts used as input for the meta-matrix thesaurus. Thus, sub-matrix analysis can only be run on texts that were pre-processed with a meta-matrix thesaurus. The “thesaurus content only” option automatically applies to the sub-matrix selection. The texts after the application of the sub-matrix selection can be saved. For the following sub-matrix analysis we chose the categories “agent”, “knowledge”, “resource”, and “location”. “Task-event” and “organization” we did not select. Applying the sub-matrix selection to the text resulting from the example shown in Figure 7 with the “thesaurus content only” option and direct adjacency results in the following texts:
Denmark.txt: reporters said people shops copenhagen city centre, phones contact.
USA.txt: said people elevators. people buildings streets.
When running sub-matrix analysis, AutoMap links the concepts in the pre-processed texts according to statement formation settings specified by the user. Table 11 shows the results of a

CMU SCS ISRI CASOS Report -21-
sub-matrix analysis run on the texts pre-processed as shown above with AutoMap’s default statement formation settings.
Table 11: Sub-matrix analysis results
Denmark.txt USA.txt Maps 1 centre, phones 1 city, centre 1 copenhagen, city 1 people, shops 1 phones, contact 1 reporters, said 1 said, people 1 shops, copenhagen
1 buildings, streets 1 elevators, people 1 people, buildings 1 people, elevators 1 said, people
Stats File: C:\Denmark.txt # of concepts: unique: 9 total: 9 # of statements: unique: 8 total: 8 Density (based on Statements): unique: 0.89 total: 0.89 Analysis-Settings: Punctuation: ignore punctuation Window Size: 2 Directionality: unidirectional
File: C:\USA.txt # of concepts: unique: 5 total: 6 # of statements: unique: 5 total: 5 Density (based on Statements): unique: 1.0 total: 1.0 Analysis-Settings: Punctuation: ignore punctuation Window Size: 2 Directionality: unidirectional
7. Compare mental models If any type of multiple analyses was run, the user might want to know:
- Do different people use the same words and themes in the same way? - Do different people link concepts and themes in the same way? - Do different people share the same knowledge? - How similar or different are the analyzed texts?
AutoMap helps the user to answer these questions by providing:
1. Various term distribution lists and matrices as described in section 4. 2. CompareMap, a map comparison tool launched through AutoMap.
CompareMap can load maps generated with after any type of pre-processing. The outputs from the map comparison are verbal sets and stat files. The verbal sets can be binary or count and denote:
- The union of compared statements. - The consensus between maps, which is represented by the intersection of
statements. - The dissension between maps, which is represented as the difference.

CMU SCS ISRI CASOS Report -22-
Table 12 compares the maps generated after meta-matrix analysis (Table 10). Table 12: Map comparison results
Verbal sets Union of statements Consensus Dissension 1 agent, knowledge 2 agent, task-event 1 knowledge, organization 3 location, location 2 location, task-event 1 organization, knowledge 1 resource, knowledge 1 resource, location 2 resource, task-event 3 task-event, location 1 task-event, organization 2 task-event, resource
1 agent, task-event 1 location, task-event 1 resource, task-event 2 task-event, location 1 task-event, resource
agent, knowledge knowledge, organization location, location organization, knowledge resource, knowledge resource, location task-event, organization
Stats for verbal sets # of statements in union: unique: 12 total: 20 # of statements in consensus: unique: 5 total: 6 # of statements in dissension: unique: 7
8. Performance aspects Table 13 shows the time that AutoMap’s needs to perform map analysis on different numbers of texts and texts of different length. The tests were run on a 2 GHz, Pentium 4 processor, under Windows XP. Table 13: Analysis duration (in seconds)
Number of texts Number of words per text 10 100 500 1000 10 1 1 2 2.5 100 3 2 4.5 6.5 500 6.5 8 12 29 1000 12 15 34 59

CMU SCS ISRI CASOS Report -23-
9. Future development In the near future, we plan to implement natural language processing techniques and social network analytic measures into AutoMap. The natural language processing features are sentence boundary detection and stemming. Sentence boundary detection should enhance the accuracy of text unit detection. Stemming enables the reduction of inflected concepts to morphemes. This makes the generation of the delete list and the thesaurus easier, because only the morpheme of a concepts needs to be entered in order to catch all inflected version of this word appearing in the texts. In a map, concepts form the nodes of the network of statements. For each concept social network analytic measures such as centrality, distance and betweenness can be calculated in order to determine the importance of a concept in a network.
10. Hardware and software requirements AutoMap1.2 has been implemented in Java 1.4. The system has been validated for Windows. The installer for AutoMap1.2 for Windows and a help file that includes examples of all AutoMap1.2 functionalities are available online under http://www.casos.cs.cmu.edu/projects/ automap/software.html at no charge. More information about AutoMap, such as publications, sponsors, and contact information is provided under http://www.casos.cs.cmu.edu/projects/ automap/index.html. For information on all CASOS projects, including AutoMap, please use the general CASOS web site http://www.casos.cs.cmu.edu.

CMU SCS ISRI CASOS Report -24-
References
Alexa, Melina. “Computer-assisted text analysis methodology in the social sciences.” ZUMA-Arbeitsbericht, 07-1997.
Baeza-Yates, Ricardo A., and Berthier A. Ribeiro-Neto. Modern Information Retrieval. New York: ACM Press, Addison-Wesley, 1999.
Bakker, R.R. Knowledge Graphs: Representation and Structuring of Scientific Knowledge. Diss. University Twente, 1987.
Batagelj, Vladimir, Andrej Mrvary, and Matja Zaveršnik. “Network Analysis of Texts.” Proceedings of the 5th International Multi-Conference Information Society - Language Technologies. Ljubljana, October 2002. Jezikovne tehnologije / Language Technologies, Eds. Tomaž Erjavec, and Jerneja Gros. Ljubljana, 2002. 143-148.
Burkart, Magarete. “Thesaurus.” Grundlagen der praktischen Information und Dokumentation: ein Handbuch zur Einführung in die fachliche Informationsarbeit, Eds. Marianne Buder, Werner Rehfeld, Thomas Seeger, and Dietmar Strauch, 4th edition. München: Saur, 1997. 160 – 179.
Carley, Kathleen M.. “An Approach for Relating Social Structure to Cognitive Structure.'' Journal of Mathematical Sociology 12 (1986): 137-189.
Carley, Kathleen M. “Formalizing the Social Expert's Knowledge.” Sociological Methods and Research 17.2 (1988): 165-232.
Carley, Kathleen M. “Coding Choices for Textual Analysis: A Comparison of Content Analysis and Map Analysis.” Sociological Methodology 23, Eds. Peter V. Marsden. Cambridge, MA: Blackwell Publishers. 1993. 75-126.
Carley, Kathleen M. “Network Text Analysis: the network position of concepts.” Text analysis for the social sciences, Ed. Carl W. Roberts. Mahwah, NJ: Lawrence Erlbaum Associates, Inc. 1997a. 79-102.
Carley, Kathleen M. “Extracting team mental models through textual analysis.” Journal of Organizational Behavior 18 (1997b): 533-558.
Carley, Kathleen M., and Michael Palmquist. “Extracting, Representing, and Analyzing Mental Models.” Social Forces 70.3 (1992): 601-636.
Carley, Kathleen M., “Dynamic Network Analysis.” Dynamic Social Network Modeling and Analysis: Workshop Summary and Papers, Eds. Ronald Breiger, Kathleen Carley, and Philippa Pattison, Committee on Human Factors, National Research Council, National Research Council. 2003. 133-145 Carley, Kathleen M., and David Krackhardt. “A PCANS Model of Structure in Organization.” Proceedings of the 1998 International Symposium on Command and Control Research and Technology. Monterray, CA. Evidence Based Research, Vienna, VA. 1998. 113-119. Carley, Kathleen M., and Yuqing Ren. “Tradeoffs Between Performance and Adaptability for C3I Architectures.” Proceedings of the 2001 Command and Control Research and Technology Symposium. Annapolis, Maryland. Evidence Based Research, Vienna. 2001.
Corman, Steven R., Timothy Kuhn, Robert D. Mcphee, and Kevin J. Dooley. “Studying complex discursive systems: centering resonance analysis of Communication.” Human Communication 28. 20 (2002): 157-206. Danowski, James A. “Network analysis of message content.” Progress in Communication sciences, 12, Eds. W.D. Richards and G.A. Barnett. Norwood, NJ: Ablex. 1993. 197-221. Diesner, Jana, Eleanor T. Lewis, and Kathleen M. Carley. “How You Code Matters: How Coding Techniques and Choices Influence Results from Automated Text Analysis”, CASOS working paper. 2003.
James, P. “Knowledge graphs.” Linguistic Instruments in Knowledge Engineering, Eds. R.P. van der Riet and R.A. Meersman. Amsterdam: Elsevier. 1992. 97-117.

CMU SCS ISRI CASOS Report -25-
Kelle, Udo. “Theory Building in Qualitative Research and Computer Programs for the Management of Textual Data.” Sociological Research Online, 2.2. (1997). URL: http://www.socresonline.org.uk/socresonline/2/2/contents.html 1997, Retrieved: 04-06-2003.
Klein, Harald. “Classification of Text Analysis Software.” Classification and knowledge organization: Proceedings of the 20th annual conference of the Gesellschaft für Klassifikation e.V. University of Freiburg, 1996, Eds. Rüdiger Klar and Otto Opitz. Berlin, New York: Springer. 1997. 255-261.
Kleinnijenhuis, J., J.A. de Ridder, and E.M. Rietberg. “Reasoning in Economic Discourse: An application of the Network Approach in Economic Discourse.” Text analysis for the social sciences, Ed. Carl W. Roberts. Mahwah, NJ: Lawrence Erlbaum Associates, Inc. 1996. 191-208.
Kuckartz, U. “Computer Aided Text Analysis and Typology Construction.” Classification and knowledge organization: Proceedings of the 20th annual conference of the Gesellschaft für Klassifikation e.V. University of Freiburg, 1996, Eds. Rüdiger Klar and Otto Opitz. Berlin, New York: Springer. 1996. 363-370. Monge, Peter, and Noshir Contractor. Theories of Communication Networks. Oxford University Press. 2003.
Popping, Roel, and Carl W. Roberts. “Network approaches in text analysis.” Classification and knowledge organization: Proceedings of the 20th annual conference of the Gesellschaft für Klassifikation e.V. University of Freiburg, 1996, Eds. Rüdiger Klar and Otto Opitz. Berlin, New York: Springer. 1996. 381-389.
Popping, Roel. Computer-assisted text analysis. London, Thousand Oaks: Sage Publications. 2000.
Popping, Roel. “Knowledge graphs and NTA.” Social Science Information 42.1 (2003): 91-106.
Ryan, Gery W., and H. Russell Bernard. “Data Management and Analysis Methods”. Handbook of Qualitative Research, 2nd ed., Eds. Norman Denzin, and Yvonna Lincoln. Thousand Oaks, CA: Sage Publications. 2002. 769-802.
Sowa, John F. Conceptual Structures: Information Processing in Mind and Machine. Reading, MA: Addison-Wesley. 1984.
Zuell, Cornelia, and Melina Alexa. Automatisches Codieren von Textdaten. Ein Ueberblick ueber neue Entwicklungen. Inhaltsanalyse – Perspektiven, Probleme, Potenziale, Eds. Werner Wirth, and Edmund Lauf. Herbert von Halem: Koeln. 2001. 303-317.

CMU SCS ISRI CASOS Report -26-
Appendix
Sample text files:
Article 1 (Denmark.txt), Story from BBC NEWS, Published: 2003/09/23 © BBC MMIII , Title: Danish capital loses power:
The Danish capital, Copenhagen, and parts of Sweden have been hit by massive power cuts. Around four million homes and businesses lost supplies. Engineers restored most power by late afternoon, but the exact cause of the cuts remained unclear. Electricity officials said the power cuts started when a main transmission line connecting Sweden and Denmark was affected. Reports said a storm which swept through the area, bringing down trees, may have been a factor, but electricity officials said it was impossible to confirm whether the timing was a coincidence. The blackout follows similar incidents in London earlier this month, and in a huge swathe of North America in August. Sabotage was not suspected, police said, but some residents said their first thoughts were of a possible terrorist connection. At least two Swedish nuclear plants - Oskarshamn and Ringhals - appear to have then developed problems and had to shut down production units. Copenhagen airport and the Oeresund bridge and tunnel, linking the capital to Sweden, were closed, with scenes of traffic chaos in Copenhagen centre. Railway and underground train services ground to a halt. Officials said passengers on at least two new driverless underground trains were evacuated without incident. Reporters said hundreds of people emerged from shops in Copenhagen city centre to see what was happening, and used their mobile phones to contact their families. Hospitals switched to be using emergency generators. The (nuclear) security systems worked just as they should. Nuclear power officials insisted that there was no safety threat from the shutdowns, which happened if there were big imbalances in the network and pressure suddenly fell.
Article 2 (USA.txt), Story from CNN, Thursday, August 14, 2003, Title: Major power outage hits New York, other large cities: The outage occurred quickly and rippled across a large area. Cities affected included New York, Cleveland, Ohio, Detroit, Michigan, and Toronto and Ottawa, Canada. 21 plants went off line because when the grid is down there is no place for the power output to go. By 6 p.m. the power was being restored in parts of the affected area. It was unclear what caused the outage, although state and federal officials agreed that it was not terrorism. One possibility was a lightning strike in the Niagara region on the U.S. side of the border, according to the Canadian Department of National Defense. Canadian Defense Minister John McCallum blamed an outage at a nuclear power plant in Pennsylvania, but the state's Emergency Management Agency said there had been no problems at any of the state's five nuclear plants and that all were operating normally. The outage stopped trains, elevators and the normal flow of traffic and life. Airports across the affected region experienced delays and some shut down temporarily. The New York City Police Department said a number of people were trapped in elevators for awhile. Thousands of people left buildings and walked into the streets. The outage did slow the Internet. The New York Stock Exchange announced plans to open on schedule Friday, using emergency power if necessary. Bloomberg mobilized 40,000 police officers and the entire fire department overnight to maintain order. President Bush said communication between local, state and federal officials was "quick and thorough. “We're better organized today than we were two and a half years ago to deal with an emergency and the system responded well," he said.