avery dennison corporation 2010 annual report: full report
TRANSCRIPT

At Avery Dennison, our businesses are unified by the shared vision of making brands more inspiring and the world more intelligent. In countries throughout the world, we focus on making products more engaging, brands more compelling, inventories more productive, information
more valuable and our surroundings more understandable. From apparel tags to food and beverage packaging to building graphics, we’re a powerful part of everyday life.
Inspired Brands. Intelligent World.™
Avery Dennison Corporation 2010 Annual Report

S
M
L
We encourage you to visit www.averydennison.com/2010review and experience the Avery Dennison 2010 Year in Review to read more about how our solutions make brands more inspiring and the world more intelligent.
Table of Contents
Financial Results 1
Letter to Shareholders 2
Businesses at a Glance 8
Directors and Officers 10
Financial Information 11

Avery Dennison Corporation 2010 Annual Report
1 Financial Results
Financial ResultsSAleS by Segment
A.
56% Pressure-sensitive materials
b.
23% Retail Information Services
C.
13% Office and Consumer Products
D.
8% Other specialty converting businesses
2010
56%
23%
13%
8%
A
b
C
D
06
5.6
08
6.7
10
6.5
07
6.3
09
6.0
$6.5
378.9
10
468.2
375.4
249.5
347.2
09
08
07
06
$378.9SAleS In emeRgIng mARketS In bIllIOnS
Before intergeographic eliminations. Emerging markets are defined as the Asia, eastern Europe and Latin America regions.
FRee CASh FlOw In mIllIOnS
Strong free cash flow of approxi-mately $379 million helped the company reduce debt and increase cash returned to shareholders.
Free cash flow is a non-GAAP measure that refers to cash flow from operations, less net payments for property, plant and equipment, software and other deferred charges, plus net proceeds from sale (purchase) of investments.
net SAleS In bIllIOnS
Net sales of $6.5 billion increased 9% from $6.0 billion in 2009.
$316.9net InCOme In mIllIOnS
2010 net income was $316.9 million, or $2.97 per share.
$0.80DIvIDenDS PeR COmmOn ShARe
2010 dividends per common share were $0.80. In January 2011, the board of directors increased the quarterly dividend by 5 cents per share, or 25%.
$2.4
10
2.4
09
2.008
2.2
07
1.8
06
1.4

2
Dear Shareholders:Avery Dennison made solid financial and strategic progress in 2010. We improved our financial results, strengthened our balance sheet and ended the year positioned to return more cash to you. At the same time, we continued to invest in long-term growth and transform Avery Dennison into a trusted partner that makes every brand more inspiring and the world more intelligent.
Here are the financial highlights for 2010:
net sales grew nine percent, with double-digit growth in our two largest segments, Pressure-sensitive materials and Retail Information Services (RIS)*, which more than offset a decline at Office and Consumer Products.
Sales in emerging markets comprised more than 35 percent of consolidated net sales.
We expanded operating margin despite the second-half pressures of inflation and competition.
We generated approximately $379 million of free cash flow through continued operating rigor and financial management.
We completed a restructuring program begun in late 2008 that generated a total of $180 million of annualized savings, more than originally projected.
letter to Shareholders

Avery Dennison Corporation 2010 Annual Report
3 letter to Shareholders
We achieved our most important priorities—strengthening our balance sheet and
returning more cash to investors. We reduced debt by nearly $300 million and achieved
our targeted leverage ratio, enabling our board of directors to increase the quarterly
dividend 25 percent in January, 2011 and authorize the repurchase of up to five million
additional shares of our common stock. We also repurchased three million shares
during the fourth quarter of 2010, largely offsetting dilution.
Activating Our vision
Avery Dennison has significant competitive advantages. Our businesses are clear
market leaders with economies of scale. We have a global footprint touching key points
in our customers’ supply chains with a strong presence in high-growth emerging
markets. We have decades of expertise in materials science and technology. And we
generate strong free cash flow for reinvestment and return to shareholders.
Our vision—to make every brand more inspiring and the world more intelligent—
focuses our strengths on customers’ needs. Our products play a key role in making
brands more compelling and in displaying information vital to moving goods efficiently
through the global supply chain and helping consumers purchase and use them.
To fully activate our vision, we are strengthening our relationships with the consumer
product companies, retailers and brand owners that use our materials to label,
package and brand their products. We are partnering not only with the commercial
printers who produce their labels, but also with brand managers and package
designers, who are demanding not just new materials but new ideas for differentiating
their brands.
In 2010, we invested in marketing by hiring professionals with deep experience in
the industries we serve. We increased the frequency and depth of our interaction with
customers. From these engagements, we acquired numerous insights into their branding
and information needs and built a robust pipeline of new business with the potential for
hundreds of millions of dollars in sales.
Here are some of the ways our businesses lived our new vision in 2010:
In the Pressure-sensitive materials segment, label and Packaging materials
(lPm)* has development projects under way with customers in key segments such as
food, beverages and personal care products. These projects involve prototyping new
designs and applications with our materials that will help products stand out on the
store shelf—and convert brand owners to use our pressure-sensitive label materials.
One of our early successes is the redesigned packaging and labeling for a new line of
fruit juice beverages that has increased consumer appeal and lifted the line’s sales.
We also converted Carlsberg’s Baltika beer, Europe’s largest-selling beer by volume,
to a clear label, and increased our business with personal care product giants Unilever
and Gillette. graphics and Reflective Solutions*, our other pressure-sensitive
*As of March 18, 2011, we updated the names of our businesses to reflect our increased external focus. For a more complete listing, visit www.averydennison/2010review/businessnames
new names (formerly as):
Retail Branding and Information Solutions Retail Information Services
label and Packaging materials Roll Materials
graphics and Reflective Solutions Graphics and Reflective Products
Automotive Solutions Automotive Products
medical Solutions Medical Products
4
business, is marketing to vehicle fleet owners, architectural firms and retailers to
accelerate sales of Avery Dennison Supercast™ digital films for fleet and architectural
promotional graphics.
Retail Information Services (RIS)* learned from its deeper engagements with
retailers and brand owners that we can best serve them with multi-product solutions
that enhance brands and accelerate the performance of their complex global supply
chains. In using heat transfer technology to brand athletic wear without compromising
the stretch and breathability of high-performance fabrics, we entered a significant new
market segment in which we can create new forms of high-impact, digitally printed
branding on the exterior of numerous kinds of apparel. For information solutions, RIS is
placing our proprietary ticket, tag and label printers in apparel manufacturers’ plants,
retailers’ distribution centers and even in stores to supply price tags just in time for
shipment and give retailers the flexibility to make last-minute price adjustments. We
also had notable success with our RFID (radio frequency identification) technology,
which was selected by major retailers for their “item-level marking” programs, which
help them improve inventory accuracy, keep shelves stocked more efficiently, and
satisfy shoppers.
Office and Consumer Products focused on executing a disciplined defense of its
labels business in 2010 and was successful in protecting its leading position at major
superstores. At the same time, we invested selectively in innovation, launching two
well-received new products, Avery® NoteTabs™ and Avery® Label Pads, and developing
a roster of new organization and identification products that we plan to launch later this
year. The Avery® brand continues to be the consumer’s brand of choice for office and
home labeling needs.
Other specialty converting businesses is a diverse group of smaller businesses
that had a number of successes. We launched Avery Dennison Flexis™ steam valve
technology, which is being used on microwave meal packaging to control steam release
and enhance flavor. We also formed Avery Dennison Automotive Solutions*, a team that
won new business with auto makers including Ford, GM and Chrysler Group LLC in
the U.S. and Geely and Chery in China, by offering them a single point of contact for
products and solutions from five separate Avery Dennison businesses.
What’s Possible
Avery Dennison was founded on an innovation—the self-adhesive label—that
created a global industry. Over the past 75 years, we have developed a remarkable
body of expertise in materials technology and process capability that continues to
serve as a strong foundation for growth.
letter to Shareholders

Avery Dennison Corporation 2010 Annual Report
5
Today we define “innovation” as meeting customer needs with unique solutions,
and just as we invest in marketing we are also investing to develop new innovations—
both incremental improvements and potential breakthroughs—from our closer customer
relationships. The idea to apply Avery Dennison Flexis™ to microwave cooking, for
example, was sparked during a conversation with a customer.
We have a number of promising new ideas in various stages of commercialization:
• Label and Packaging Materials has announced the Avery Dennison Curve Appeal™
system for labeling complex curves, which allows package designers to decorate
a whole new range of container shapes. RIS is adding loss prevention capabilities
to its RFID-based inventory management systems and is also exploring flexible
pricing systems that would allow retailers to change prices more frequently and with
lower labor costs.
• Our RFID business is partnering with GE to commercialize sensor-equipped RFID
inlays that could greatly expand the number of possible RFID applications.
• Medical Solutions* is using our expertise in adhesives and layered materials to
make wound dressings and ostomy bags both more effective and more comfortable.
Sustainability is a critical element of brands today, and greener products and
solutions are high on the “must have” list of every customer we serve. We view sustainable
design as an opportunity to advance our market leadership as well as a responsibility to
our communities. Each of our largest businesses introduced more sustainable products
last year, including the industry’s thinnest label liner and our Avery Dennison™ Greenprint,
a unique analytical tool for measuring and communicating the impact of products on
the environment. We are embedding sustainable design into our innovation and product
development processes.
Accelerating Performance
I’m proud to say we improved service in every business for the third straight year.
By year-end, RIS plants were achieving reliability scores in the high 90s, and Office and
Consumer Products’ Tijuana, Mexico plant was named one of the top ten plants in
North America for 2010 by Industry Week magazine. A key contributor to that success
was Enterprise Lean Sigma (ELS).
ELS makes the customer the source of value and the employee the source of
improvement. “Value” is defined as what’s important to the customer; anything in
a process that impedes the creation of that value is waste. Employees team up to
identify wasteful methods and actions, design improvements, and execute them.
letter to Shareholders

6
Not only has ELS helped us improve service, it is stimulating innovation. Employees
at an RIS plant in India used ELS to reorganize the process of heat transfer printing,
which reduced the cost and enabled us to make heat transfer labeling affordable for
Indian retailers and brand owners. Sales are booming in India, and, best of all, our
employees are sharing their process with other RIS operations around the world.
Our New Director
Brad Alford, Chairman and CEO of Nestlé USA, a key division of one of the world’s
premier packaged foods companies, joined the Avery Dennison board of directors
in April, 2010, and we are benefiting from his deep experience in consumer branding
and packaging.
2011 and Beyond
On June 2, 2010, a group of Avery Dennison leaders and I visited the New York
Stock Exchange and rang the closing bell to mark the company’s 75th anniversary and
honor the innovative spirit of our founder, R. Stanton Avery. Although I was moved by
the thought of how far the company had come, I was looking forward. We were ringing
the opening bell of Avery Dennison’s next 75 years.
I am proud to lead the Avery Dennison team of more than 30,000 women and men.
With this team and our new vision, competitive advantages, and global partnerships
with customers, we have the elements in place to drive long-term growth and value
creation. We appreciate your confidence in Avery Dennison and we are focused on
making further progress for you in 2011.
Dean A. ScarboroughChairman, President and Chief Executive OfficerMARCH 17, 2011
Letter to Shareholders

Avery Dennison Corporation 2010 Annual Report
7 letter to Shareholders

8
Businesses at a glance
SegmenT SegmenT
Pressure-sensitive materials Retail Information Services
BuSIneSSeS BuSIneSSeS
• Roll materials• graphics and Reflective Products
• Information and Brand management
• Printer Systems• Fastener
SAleS In mIllIOnS PeRCenT OF TOTAl SAleS SAleS In mIllIOnS PeRCenT OF TOTAl SAleS
$3,640 56% $1,522 23%glOBAl BRAnDS glOBAl BRAnDS
Fasson®, Avery graphics™, Avery Dennison® Avery Dennison®, monarch®
PRODuCTS PRODuCTS
Pressure-sensitive roll materials, flexible packaging, roll-fed sleeve, water- and solvent-based performance polymer adhesives and engineered films, graphic imaging media, reflective materials
Graphic tags and labels, variable data tags and labels, woven and printed fabric labels, patches and specialty trim, packaging, radio frequency identification (RFID) tags, designer trim collections, printer systems, solution-enabling products such as fastening and application devices
mARkeT SegmenTS mARkeT SegmenTS
Food, beverage, spirits, household products, pharmaceuticals, health and beauty, durables, fleet, vehicle/automotive, architectural/retail, promotional/ advertising, traffic, safety, transportation original equipment manufacturing
Retail apparel, manufacturing apparel, mass market retailers, retail hard goods and supply chains, food service and supply chains, logistics, pharmaceuticals, automotive
CuSTOmeRS CuSTOmeRS
Global label converters, consumer product brands, package designers, packaging engineers and manufacturers, industrial manufacturers, printers, distributors, designers, advertising agencies, government agencies, sign manufacturers, graphic vendors
Apparel brands and retailers, apparel manufacturers, consumer goods manufacturers, restaurant and food service chains, grocery and drug store chains, automotive manufacturers
leADeRS leADeRS
Donald A. nolan, Group Vice President, Roll MaterialsTimothy S. Clyde, Group Vice President, Specialty Materials and Converting
R. Shawn neville, Group Vice President
S
Businesses at a glance

Avery Dennison Corporation 2010 Annual Report
9
SegmenT
Office and Consumer Products Other specialty converting businesses
BuSIneSSeS BuSIneSSeS
• Office Products • Specialty Tape• Radio Frequency Identification (RFID)
• Industrial and Automotive Products
• Performance Films• Business media• Security Printing• medical Products
SAleS In mIllIOnS PeRCenT OF TOTAl SAleS SAleS In mIllIOnS PeRCenT OF TOTAl SAleS
$815 13% $536 8%glOBAl BRAnDS glOBAl BRAnDS
Avery® Avery Dennison®
PRODuCTS PRODuCTS
Self-adhesive labels, binders, sheet protectors, dividers, online templates and printing, writing instruments, T-shirt transfers, do-it-yourself card products
Specialty tapes, skin-contact medical adhesives, surgical, wound care and ostomy products, industrial adhesives, automotive paint protection and exterior films, heat seal, security and information labels, functional packaging labels, architectural and engineered films, point-of-purchase and display tags, metallized pigments, self-adhesive postage stamps, RFID inlays and durable tags
mARkeT SegmenTS mARkeT SegmenTS
Professional, personal and on-the-go organization and identification, education
Automotive, consumer, medical and healthcare, retail apparel, electronics, durable goods, architectural, graphic arts, general industrial, building and construction, logistics, retail point-of-purchase, security printing
CuSTOmeRS CuSTOmeRS
Office products superstores, major retailers, distributors, wholesalers, office professionals, school administrators, small business owners, consumers
Industrial and original equipment manufacturers, medical products and device manufacturers, clinicians and nurses, converters, packagers, consumer products companies
leADeRS leADeRS
Timothy g. Bond, Group Vice President Timothy S. Clyde, Group Vice President
Businesses at a glance

10
BOARD OF DIReCTORS
Dean A. Scarborough Chairman, President and Chief Executive Officer, Avery Dennison Corporation
Bradley A. Alford 1
Chairman and Chief Executive Officer, Nestlé USA, a food and beverage company
Peter k. Barker 2, 3
Chairman of California, JP Morgan Chase & Co., a global financial services firm
Rolf Börjesson 3, 4
Retired Chairman, Rexam PLC, a consumer packaging company
John T. Cardis 2, 3
Retired National Managing Partner, Deloitte & Touche USA LLP, an audit, tax, consulting and financial advisory services firm
ken C. hicks 2, 4
Chairman, President and Chief Executive Officer, Foot Locker, Inc., a specialty athletic retailer
Peter W. mullin 3
Chairman Emeritus, MullinTBG, an executive compensation, benefit planning and corporate insurance consulting firm
David e. I. Pyott LD, 1, 4
Chairman and Chief Executive Officer, Allergan, Inc., a global healthcare company
Debra l. Reed 1, 2
Executive Vice President, Sempra Energy, an energy services holding company
Patrick T. Siewert 2, 3
Managing Director, The Carlyle Group, a private global alternative investment firm
Julia A. Stewart 1, 4
Chairman and Chief Executive Officer, DineEquity, Inc., a full-service restaurant company
directors emeriti (NON VOTING)
Charles D. millerRetired Chairman and Chief Executive Officer, Avery Dennison Corporation
h. Russell SmithRetired Chairman of the Executive Committee, Avery Dennison Corporation
LD Lead Independent Director
1 Member of Compensation and Executive Personnel Committee
2 Member of Audit Committee
3 Member of Finance Committee
4 Member of Governance and Social Responsibility Committee
COmPAnY leADeRShIP
Dean A. ScarboroughChairman, President and Chief Executive Officer
mitchell R. ButierSenior Vice President and Chief Financial Officer
Timothy g. BondGroup Vice President, Office Products
lori J. BondarVice President, Controller and Chief Accounting Officer
Timothy S. ClydeGroup Vice President, Specialty Materials and Converting
Diane B. DixonSenior Vice President, Communications and Corporate Affairs
David n. edwardsVice President and Chief Technology Officer
Anne hillSenior Vice President and Chief Human Resources Officer
Richard W. hoffmanSenior Vice President and Chief Information Officer
Robert m. malchioneSenior Vice President, Corporate Strategy and Technology
Susan C. millerSenior Vice President, General Counsel and Secretary
R. Shawn nevilleGroup Vice President, Retail Information Services
Donald A. nolanGroup Vice President, Roll Materials
karyn e. RodriguezVice President and Treasurer
John n. SallaySenior Vice President, New Growth Platforms
gregory e. TempleVice President, Global Operations and Enterprise Lean Sigma
Directors and officers
Directors and Officers

Avery Dennison Corporation 2010 Annual Report
11
Five-year Summary 13
Management’s Discussion and Analysis 15
Consolidated Financial Statements 29
Notes to Consolidated Financial Statements 33
Corporate Information 64
2010 Financial Information

The matters discussed in this Annual Report contain “forward-looking statements” within the meaning of the Private Securities Litigation Reform Act of1995. These statements, which are not statements of historical fact, may contain estimates, assumptions, projections and/or expectations regardingfuture events, which may or may not occur. Words such as “aim,” “anticipate,” “assume,” “believe,” “continue,” “could,” “estimate,” “expect,” “guidance,”“intend,” “may,” “might,” “objective,” “plan,” “potential,” “project,” “seek,” “shall,” “should,” “target,” “will,” “would,” or variations thereof and otherexpressions, which refer to future events and trends, identify forward-looking statements. These forward-looking statements, and financial or otherbusiness targets, are subject to certain risks and uncertainties, which could cause actual results to differ materially from expected results, performance orachievements of the Company expressed or implied by such forward-looking statements.
Certain risks and uncertainties are discussed in more detail in Part I, Item 1A, “Risk Factors,” of the Company’s Annual Report on Form 10-K for theyear ended January 1, 2011, and include, but are not limited to, risks and uncertainties relating to: investment in development activities and new productionfacilities; fluctuations in cost and availability of raw materials; ability of the Company to achieve and sustain targeted cost reductions; ability of the Companyto generate sustained productivity improvement; successful integration of acquisitions; successful implementation of new manufacturing technologies andinstallation of manufacturing equipment; disruptions in information technology systems; successful installation of new or upgraded information technologysystems; the financial condition and inventory strategies of customers; customer and supplier concentrations; changes in customer order patterns; loss ofsignificant contract(s) or customer(s); timely development and market acceptance of new products; fluctuations in demand affecting sales to customers;collection of receivables from customers; impact of competitive products and pricing; selling prices; business mix shift; volatility of capital and creditmarkets; impairment of capitalized assets, including goodwill and other intangibles; credit risks; ability of the Company to obtain adequate financingarrangements and to maintain access to capital; fluctuations in interest and tax rates; fluctuations in pension, insurance and employee benefit costs;impact of legal proceedings; changes in tax laws and regulations; changes in governmental regulations; changes in political conditions; fluctuations inforeign currency exchange rates and other risks associated with foreign operations; worldwide and local economic conditions; impact of epidemiologicalevents on the economy and the Company’s customers, suppliers and employees; acts of war, terrorism, and natural disasters; and other factors.
The Company believes that the most significant risk factors that could affect its financial performance in the near-term include: (1) the degree to whichhigher costs can be offset with productivity measures and/or passed on to customers through selling price increases, without a significant loss of volume;(2) the impact of competitors’ actions, including pricing, expansion in key market segments, and product offerings; (3) the impact of economic conditionson underlying demand for the Company’s products; and (4) the impact of changes in tax laws and regulations throughout the world.
The Company’s forward-looking statements represent judgment only on the dates such statements were made. By making these forward-lookingstatements, the Company assumes no duty to update them to reflect new, changed or unanticipated events or circumstances, other than as may berequired by law.
12Safe Harbor Statement

(Dollars in millions, except %and per share amounts)
5-Year CompoundGrowth Rate Dollars % Dollars % Dollars % Dollars % Dollars %
2010 2009(1) 2008 2007 2006
For the YearNet sales 3.5% $ 6,512.7 100.0 $ 5,952.7 100.0 $ 6,710.4 100.0 $ 6,307.8 100.0 $ 5,575.9 100.0Gross profit 4.3 1,826.0 28.0 1,586.5 26.7 1,727.0 25.7 1,722.4 27.3 1,538.0 27.6Marketing, general and administrative
expense 6.8 1,370.4 21.0 1,268.8 21.3 1,304.3 19.4 1,182.5 18.7 1,011.1 18.1Goodwill and indefinite-lived intangible
asset impairment charges N/A – – 832.0 14.0 – – – – – –Interest expense 5.8 76.6 1.2 85.3 1.4 115.9 1.7 105.2 1.7 55.5 1.0Other expense, net(2) (15.3) 27.7 .4 191.3 3.2 36.2 .5 59.4 .9 36.2 .6Income (loss) from continuing operations
before taxes (.9) 351.3 5.4 (790.9) (13.3) 270.6 4.0 375.3 5.9 435.2 7.8Provision for (benefit from) income taxes (14.5) 34.4 .5 (44.2) (.7) 4.5 .1 71.8 1.1 76.7 1.4Income (loss) from continuing operations 1.6 316.9 4.9 (746.7) (12.5) 266.1 4.0 303.5 4.8 358.5 6.4Income from discontinued operations,
net of tax(3) N/A – N/A – N/A – N/A – N/A 14.7 N/ANet income (loss) 6.9 316.9 4.9 (746.7) (12.5) 266.1 4.0 303.5 4.8 373.2 6.7
2010 2009 2008 2007 2006
Per Share InformationIncome (loss) per common share from
continuing operations .5% $ 3.00 $ (7.21) $ 2.70 $ 3.09 $ 3.59Income (loss) per common share from
continuing operations, assuming dilution .4 2.97 (7.21) 2.70 3.07 3.57Net income (loss) per common share 5.7 3.00 (7.21) 2.70 3.09 3.74Net income (loss) per common share,
assuming dilution 5.6 2.97 (7.21) 2.70 3.07 3.72Dividends per common share (12.2) .80 1.22 1.64 1.61 1.57Weighted-average common shares
outstanding (in millions) 1.1 105.8 103.6 98.4 98.1 99.8Weighted-average common shares
outstanding, assuming dilution (inmillions) 1.2 106.8 103.6 98.7 98.9 100.4
Book value per share at fiscal year end .5 $ 15.61 $ 12.94 $ 17.78 $ 20.22 $ 17.26Market price per share at fiscal year end (5.2) 42.34 36.49 31.53 53.41 67.93Market price per share range 30.79 to 17.26 to 25.02 to 49.69 to 55.09 to
42.49 40.02 53.14 69.67 69.11
At End of YearWorking capital (deficit) $ 120.1 $ (134.5) $ (127.6) $ (419.3) $ (12.1)Property, plant and equipment, net 1,262.9 1,354.7 1,493.0 1,591.4 1,309.4Total assets 5,099.4 5,002.8 6,035.7 6,244.8 4,324.9Long-term debt 956.2 1,088.7 1,544.8 1,145.0 501.6Total debt 1,337.2 1,624.3 2,209.8 2,255.8 968.0Shareholders’ equity 1,645.7 1,362.6 1,750.0 1,989.4 1,696.2Number of employees 32,100 31,300 35,700 37,300 22,700
Other InformationDepreciation expense(4) $ 172.9 $ 187.6 $ 204.6 $ 184.1 $ 153.8Research and development expense(4) 95.6 90.7 94.0 95.5 87.9
Effective tax rate(4) 9.8% 5.6% 1.7% 19.1% 17.6%Return on average shareholders’ equity 21.6 (55.7) 13.1 16.5 22.7Return on average total capital 12.8 (20.6) 8.8 10.6 15.7
(1) Results for 2009 reflected a 53-week period.
(2) Included pretax charges for restructuring costs, asset impairment charges, lease cancellation costs, and other items.
(3) Results for 2006 included a tax benefit of $14.9 due to capital losses arising from the sale of discontinued operations and a pretax gain on the sale of discontinued operations of $1.3.
(4) 2006 amounts are related to continuing operations.
13 Avery Dennison Corporation2010 Annual Report
Five-year Summary

Stockholder Return PerformanceThe following graph compares the Company’s cumulative stockholder return on its common stock, including the reinvestment of dividends, with the returnon the Standard & Poor’s 500 Stock Index (the “S&P 500 Index”) and the average return, weighted by market capitalization, of the peer group set forthbelow (“Peer Group”) for the five-year period ending December 31, 2010. The Company has also included the median return of the Peer Group in the graphas an additional comparison.
The Peer Group consists of 50 publicly-traded U.S. companies selected on the basis of market diversity, international focus and investment, marketvolatility, and product line mix. The selection of the Peer Group was based on the recommendation of Mercer, an independent executive compensationconsultant.
The Peer Group is comprised of Air Products & Chemicals Inc., ArvinMeritor Inc., Baker-Hughes Incorporated, Ball Corporation, Bemis Company,Inc., Briggs & Stratton, Cabot Corporation, Cooper Tire & Rubber Co., Crane Company, Crown Holdings Inc., Cummins Inc., Dana Holding Corporation,Danaher Corporation, Dover Corporation, Eaton Corporation, Ecolab Incorporated, Ferro Corporation, FMC Corporation, Fuller (H. B.) Company,Goodrich Corporation, Grace (W R) & Company, Harley-Davidson Inc., Harris Corporation, Harsco Corporation, Illinois Tool Works Incorporated, Ingersoll-Rand Company, MASCO Corporation, MeadWestvaco Corporation, NACCO Industries, Newell Rubbermaid Incorporated, Olin Corporation, Owens-Illinois, Inc., PACCAR Inc., Parker-Hannifin Corporation, Pentair Inc., Pitney Bowes Incorporated, PolyOne Corporation, Potlatch Corporation, P.P.G.Industries Incorporated, The Sherwin-Williams Company, Smurfit-Stone Container Corporation, Snap-On Incorporated, Sonoco Products Company,Stanley Works, Tecumseh Products Company, Temple-Inland Inc., Thermo Fisher Scientific Inc., Thomas & Betts Corporation, Timken Company andTrinity Industries.
Comparison of Five-Year Cumulative Total ReturnAs of December 31, 2010
$90
$112
$180
$144
$75
$100
$125
$150
$225
$200
$175
Avery Dennison Corporation
S&P 500 Index
Peer Group (Weighted Average)
Peer Group (Median)
$50
12/31/2005 12/31/2006 12/31/2007 12/31/2008 12/31/2009 12/31/2010
Total Return Analysis(1)
12/31/2005 12/31/2006 12/31/2007 12/31/2008 12/31/2009 12/31/2010
Avery Dennison Corporation $100.00 $126.08 $101.28 $64.83 $ 75.67 $ 89.82S&P 500 Index $100.00 $115.78 $122.14 $76.96 $ 97.33 $112.01Peer Group (Weighted Average)(2) $100.00 $121.42 $149.60 $89.70 $125.47 $180.25Peer Group (Median) $100.00 $114.44 $118.18 $78.01 $116.41 $143.64
(1) Assumes $100 invested on December 31, 2005, and the reinvestment of dividends; chart reflects performance on a calendar year basis.
(2) Weighted average is weighted by market capitalization.
Stock price performance reflected in the above graph is not necessarily indicative of future price performance.
14Five-year Summary
ORGANIZATION OF INFORMATION
Management’s Discussion and Analysis of Results of Operations andFinancial Condition narratively expresses our view of our financialperformance and condition and should be read in conjunction with theaccompanying financial statements. It includes the following sections:
Non-GAAP Financial Measures. . . . . . . . . . . . . . . . . . . . . . . . . .15
Forward-looking Statements. . . . . . . . . . . . . . . . . . . . . . . . . . .15
Overview and Outlook. . . . . . . . . . . . . . . . . . . . . . . . . . . . . . . .15
Analysis of Results of Operations. . . . . . . . . . . . . . . . . . . . . . . .17
Results of Operations by Segment. . . . . . . . . . . . . . . . . . . . . . .18
Financial Condition. . . . . . . . . . . . . . . . . . . . . . . . . . . . . . . . . .20
Critical Accounting Policies and Estimates. . . . . . . . . . . . . . . . . .25
Recent Accounting Requirements. . . . . . . . . . . . . . . . . . . . . . . .28
Market-Sensitive Instruments and Risk Management. . . . . . . . . . .28
NON-GAAP FINANCIAL MEASURES
Our consolidated financial statements are prepared in conformity withaccounting principles generally accepted in the United States of America,or GAAP. Our discussion of financial results includes several non-GAAPfinancial measures to provide additional information concerning our oper-ating performance and liquidity measures. These non-GAAP financialmeasures are not in accordance with, nor are they a substitute for, thecomparable GAAP financial measures. These non-GAAP financial mea-sures are intended to supplement our presentation of our financial resultsthat are prepared in accordance with GAAP. Based upon feedback fromour investors and financial analysis, we believe that supplemental non-GAAP financial measures provide information that is useful to the assess-ment of our performance and operating trends, as well as liquidity.
Non-GAAP financial measures exclude the impact of certain events,activities or strategic decisions. The accounting effects of these events,activities or decisions, which are included in the GAAP financial measures,may make it difficult to assess our underlying performance in a singleperiod. By excluding certain accounting effects, both positive and neg-ative, from certain of our GAAP financial measures, we believe that we areproviding meaningful supplemental information to facilitate an understand-ing of our core or underlying operating results and liquidity measures.These non-GAAP financial measures are used internally to evaluate trendsin our underlying business, as well as to facilitate comparison to the resultsof competitors for a single period. While some of the items we excludefrom GAAP financial measures recur, these items tend to be disparate inamount and timing.
We use the following non-GAAP financial measures:• Organic sales growth (decline) refers to the change in sales excluding
the estimated impact of currency translation, acquisitions and dives-titures and the extra week in fiscal year 2009.
• Free cash flow refers to cash flow from operations, less net paymentsfor property, plant, equipment, software and other deferred charges,plus net proceeds from sale (purchase) of investments. Free cashflow excludes mandatory debt service requirements and other usesof cash that do not directly or immediately support the underlyingbusiness (such as discretionary debt reductions, dividends, sharerepurchases, acquisitions, etc.).
• Operational working capital refers to trade accounts receivable andinventories, net of accounts payable. This non-GAAP financial mea-sure excludes cash and cash equivalents, short-term debt, deferredtaxes, other current assets and other current liabilities, as well ascurrent assets and current liabilities of held-for-sale businesses.
• Net debt to EBITDA ratio refers to total debt less cash and cashequivalents, divided by earnings before interest, taxes, depreciationand amortization (“EBITDA”).
FORWARD-LOOKING STATEMENTS
Certain statements contained in this discussion are “forward-lookingstatements” and are subject to certain risks and uncertainties. Refer toour “Safe Harbor Statement” at the beginning of this report.
OVERVIEW AND OUTLOOK
OverviewFiscal YearNormally, each fiscal year consists of 52 weeks, but every fifth or sixth yearconsists of 53 weeks. Our 2009 fiscal year consisted of a 53-week period,with the extra week reflected in the first quarter.
SalesOur sales from operations increased 9% in 2010 compared to a decline of11% in 2009. The increase in 2010 resulted from increased globaldemand, reflecting improvement from the weak market conditions expe-rienced in 2009.
Estimated change in sales due to: 2010 2009 2008
Organic sales growth (decline) 10% (9)% (3)%Extra week in fiscal year (1) 1 –Foreign currency translation 1 (4) 3Acquisitions, net of divestitures – – 7
Reported sales growth (decline)(1) 9% (11)% 6%
(1) Totals may not sum due to rounding.
Net Income (Loss)In 2010, we had net income of approximately $317 million, compared to anet loss of approximately $747 million in 2009.
Factors affecting changes in net income in 2010 compared to 2009included:
Positive factors:• No impairment of goodwill and indefinite-lived intangible assets,
which impacted results in the prior year• Higher volume• Cost savings from productivity improvement initiatives, including
savings from restructuring actions• Lower restructuring, asset impairment, and lease cancellation
charges related to cost reduction actions• Lower net legal settlement costs• Lower loss on debt extinguishment
15 Avery Dennison Corporation2010 Annual Report
Management’s Discussion andAnalysis of Results of Operationsand Financial Condition

Negative factors:• Higher raw material costs• Higher tax expense• Higher employee-related costs• Higher investments in growth and infrastructure• Impact of changes in customer programs in the Office and Consumer
Products segment
Cost Reduction ActionsQ3 2010 — Q4 2010 ActionsIn the second half of 2010, we recorded approximately $10 million inpretax charges, consisting of severance and related costs for the reduc-tion of approximately 725 positions, asset impairment charges, and leasecancellation costs. We anticipate approximately $12 million in annualizedsavings from these restructuring actions to be realized by the end of 2012.
Q4 2008 — Q2 2010 ProgramIn the fourth quarter of 2008, we initiated a restructuring program thatgenerated approximately $180 million in annualized savings. We realizedactual savings, net of transition costs, of approximately $75 million in 2009and an incremental $72 million in 2010. We expect the remainder of thesavings to be realized in 2011.
We recorded approximately $150 million in pretax charges (of which$105 million represents cash charges) related to this restructuring pro-gram, consisting of severance and related costs, asset impairmentcharges, and lease cancellation costs. Of the total charges, approximately$12 million was recorded in 2008, $129 million was recorded in 2009, and$9 million was recorded in 2010. Severance and related costs were relatedto approximately 4,350 positions. We do not expect to incur any furthercharges related to this program.
Q1 2008 — Q3 2008 ActionsDuring the first three quarters of 2008, we implemented cost reductionactions resulting in pretax charges of $22.8 million, including severance andrelated costs for approximately 775 positions, asset impairment charges,and lease cancellation costs. We achieved annualized savings of approxi-mately $20 million (most of which benefited 2009) as a result of these actions.
Refer to Note 10, “Cost Reduction Actions,” to the ConsolidatedFinancial Statements for further information.
Free Cash FlowWe use free cash flow as a measure of funds available for other corporatepurposes, such as dividends, debt reduction, acquisitions, and repur-chases of common stock. We believe that this measure provides mean-ingful supplemental information to our investors to assist them in theirfinancial analysis of the Company.
(In millions) 2010 2009 2008
Net cash provided by operatingactivities $ 486.7 $ 569.0 $ 539.7
Purchase of property, plant andequipment, net (83.5) (69.7) (118.4)
Purchase of software and otherdeferred charges (25.1) (30.6) (63.1)
Proceeds from sale (purchase) ofinvestments, net(1) .8 (.5) 17.2
Free cash flow $ 378.9 $ 468.2 $ 375.4
(1) Net proceeds from sale (purchase) of investments relate to net sales/purchases of securities heldby our captive insurance company in 2010, 2009 and 2008, and sales of other investments in2010 and 2008.
Free cash flow in 2010 reflected higher income from operations, theamount and timing of payments for inventory purchases, and improvedaccounts receivable collection efforts, as well as lower spending on soft-ware and other deferred charges. These factors were more than offset byhigher accounts receivable and inventory levels due to the increase insales, payments of severance and other costs related to various restruc-turing programs, bonuses and trade rebates, as well as higher net spend-ing on property, plant, and equipment.
Free cash flow in 2009 reflected improved inventory management andcollection of trade accounts receivables, as well as lower spending onproperty, plant and equipment, software and other deferred charges,partially offset by lower income from operations.
See “Analysis of Results of Operations” and “Liquidity” below for moreinformation.
OutlookCertain factors that we believe may contribute to results for 2011 com-pared to results for 2010 are listed below.
We expect revenue and earnings to increase in 2011, the extent towhich is subject, but not limited, to the amount of higher costs, principallydue to expected raw materials inflation, that can be offset with productivitymeasures and/or price increases and changes in global economicconditions.
We expect a reduction in ongoing retirement plan expenses andcontributions to our pension plans (domestic and international) of approx-imately $50 million in 2011.
We anticipate restructuring cash charges to be approximately$20 million.
We anticipate 2011 interest expense to be comparable to 2010. Ourassumptions on interest expense are subject to changes in market ratesthrough the remainder of the year.
Our annual effective tax rate may be impacted by future eventsincluding changes in tax laws, geographic income mix, repatriation ofcash, tax audits, closure of tax years, legal entity restructuring, andchanges in valuation allowances on deferred tax assets. Our effectivetax rate can potentially have wide variances from quarter to quarter,resulting from interim reporting requirements and the recognition of dis-crete events.
We anticipate increased investments in marketing, research anddevelopment, and infrastructure.
We anticipate our capital and software expenditures to be approx-imately $175 million.
16Management’s Discussion and Analysisof Results of Operations and Financial Condition
ANALYSIS OF RESULTS OF OPERATIONS
Income (Loss) Before Taxes:(In millions) 2010 2009 2008
Net sales $ 6,512.7 $ 5,952.7 $ 6,710.4Cost of products sold 4,686.7 4,366.2 4,983.4
Gross profit 1,826.0 1,586.5 1,727.0Marketing, general and
administrative expense 1,370.4 1,268.8 1,304.3Goodwill and indefinite-lived
intangible asset impairmentcharges – 832.0 –
Interest expense 76.6 85.3 115.9Other expense, net 27.7 191.3 36.2
Income (loss) before taxes $ 351.3 $ (790.9) $ 270.6
As a Percent of Sales: % % %
Gross profit margin 28.0 26.7 25.7Marketing, general and
administrative expense 21.0 21.3 19.4Income (loss) before taxes 5.4 (13.3) 4.0
SalesSales increased 9% in 2010 and decreased 11% in 2009.
The increase in 2010 reflected higher sales on an organic basis andthe favorable impact of foreign currency translation (approximately $27 mil-lion), partially offset by the estimated impact of the extra week in the firstquarter of 2009. On an organic basis, the sales growth in 2010 reflectedhigher volume driven by increased demand across all major regions, led bydouble-digit growth in the Pressure-sensitive Materials and Retail Infor-mation Services segments.
The decrease in 2009 reflected lower sales on an organic basis,partially offset by incremental sales from the DM Label Group (“DM Label”)acquisition (approximately $9 million) and the estimated impact of the extraweek in the first quarter of 2009. In addition, foreign currency translationhad an unfavorable impact on the change in sales of approximately$269 million. On an organic basis, sales declined 9% in 2009, as dete-rioration in market conditions contributed to volume declines, partiallyoffset by the effect of changes in pricing to offset the cumulative impact ofinflation experienced in 2008.
Gross Profit MarginGross profit margin in 2010 improved compared to 2009, reflectingincreased volume and the benefits from restructuring and productivityinitiatives. These benefits were partially offset by raw material inflation,higher employee costs, and the impact of changes in customer programsin the Office and Consumer Products segment.
Gross profit margin in 2009 improved compared to 2008, primarilydue to benefits from restructuring and productivity improvement initiatives,the effect of changes in pricing to offset the cumulative impact of inflationexperienced in 2008, and lower raw material and energy costs. Thesebenefits were partially offset by reduced fixed-cost leverage due to lowervolume, unfavorable segment mix, and higher employee costs.
Marketing, General and Administrative ExpenseThe increase in marketing, general and administrative expense in 2010compared to 2009 primarily reflected higher employee-related costs,higher investments in growth and infrastructure, and lower spending in2009 due to adverse global economic conditions. These increases werepartially offset by savings from restructuring and productivity initiatives.
Marketing, general and administrative expense in 2009 decreasedfrom 2008 as cost reductions consistent with a recessionary environment,benefits from restructuring and productivity initiatives, and the impact offoreign currency translation (approximately $40 million) were partially offsetby higher employee costs, investment in growth initiatives, and the esti-mated impact of the extra week in 2009.
Interest ExpenseInterest expense decreased 10%, or approximately $9 million, in 2010,and 26%, or approximately $31 million, in 2009, due to retirements andrepayments of certain indebtedness and lower interest rates on short-termborrowings.
Other Expense, net(In millions, pretax) 2010 2009 2008
Restructuring costs $ 15.3 $ 86.8 $ 29.8Asset impairment and lease cancellation
charges 3.7 42.3 10.9Other items 8.7 62.2 (4.5)
Other expense, net $ 27.7 $ 191.3 $ 36.2
For all three years presented, “Other expense, net” consisted ofcharges for restructuring, including severance and related costs, assetimpairment charges, and lease cancellation costs, as described above in“Cost Reduction Actions.” Refer also to Note 10, “Cost ReductionActions,” to the Consolidated Financial Statements for more information.
In 2010, other items in “Other expense, net” included:• Loss from curtailment and settlement of pension obligations
($4.3 million)• Loss from debt extinguishment ($4 million)• Net legal settlement costs ($.9 million)• Gain on sale of investment ($.5 million)
In 2009, other items in “Other expense, net” included:• Legal settlement costs ($41 million)• Loss from debt extinguishment ($21.2 million)
For more information regarding the debt extinguishment, refer to“Financial Condition” below, and Note 4, “Debt,” to the ConsolidatedFinancial Statements. For more information regarding the legal settlementcosts, refer to Note 8, “Contingencies,” to the Consolidated FinancialStatements.
In 2008, other items included in “Other expense, net” consisted of again on sale of investments ($4.5 million).
17 Avery Dennison Corporation2010 Annual Report
Management’s Discussion and Analysisof Results of Operations and Financial Condition

Net Income (Loss) and Earnings per Share:(In millions, except per share amounts) 2010 2009 2008
Income (loss) before taxes $ 351.3 $ (790.9) $ 270.6Provision for (benefit from) income
taxes 34.4 (44.2) 4.5
Net income (loss) $ 316.9 $ (746.7) $ 266.1
Net income (loss) per common share $ 3.00 $ (7.21) $ 2.70Net income (loss) per common share,
assuming dilution $ 2.97 $ (7.21) $ 2.70
Net income (loss) as a percent ofsales 4.9% (12.5)% 4.0%
Effective tax rate 9.8% 5.6% 1.7%
Provision for (Benefit from) Income TaxesThe effective tax rate was approximately 10% for 2010 compared to approx-imately 6% for 2009. The 2010 effective tax rate reflected $45.5 million ofbenefit from net operating losses resulting from the local statutory write downof certain investments in Europe and a $17.7 million net benefit from releasesand accruals of certain tax reserves.
The effective tax rate was approximately 6% for 2009 compared toapproximately 2% for 2008. The 2009 effective tax rate was most signif-icantly influenced by the non-cash goodwill and indefinite-lived intangibleasset impairment charges, as these expenses were largely not tax deduct-ible, and from one-time benefits from tax planning actions, partially offsetby increases to our tax reserves.
Refer to Note 11, “Taxes on Income,” to the Consolidated FinancialStatements for more information.
RESULTS OF OPERATIONS BY SEGMENT
Operating income (loss) refers to income (loss) before interest and taxes.
Pressure-sensitive Materials Segment(In millions) 2010 2009 2008
Net sales including intersegmentsales $ 3,796.8 $ 3,447.1 $ 3,816.3
Less intersegment sales (157.0) (147.1) (172.5)
Net sales $ 3,639.8 $ 3,300.0 $ 3,643.8Operating income(1) 317.8 184.7 257.2
(1) Included restructuring costs and assetimpairment charges for all years presented,loss from curtailment of domestic pensionobligations in 2010, and lease cancellationcosts in 2009 and 2008 $ 6.9 $ 75.3 $ 12.6
Net SalesSales in our Pressure-sensitive Materials segment increased 10% in 2010and decreased 9% in 2009.
In 2010, the increase reflected sales growth on an organic basis and thefavorable impact of foreign currency translation (approximately $17 million),partially offset by the estimated impact of the extra week in the first quarter of2009. On an organic basis, sales grew 11% in 2010, reflecting higher volumedriven by increased demand.
On an organic basis, sales in our roll materials business in 2010increased at a low-double digit rate compared to 2009, reflecting growth inall of our geographic regions.
On an organic basis, sales in our graphics and reflective businessincreased at a high-single digit rate, reflecting increased promotionalspending by customers and our new product launches.
In 2009, the decrease in reported sales reflected lower sales on anorganic basis and the unfavorable impact of foreign currency translation(approximately $186 million), partially offset by the estimated impact of theextra week in the first quarter of 2009. On an organic basis, sales declined6% in 2009 primarily due to declines in volume, partially offset by the effectof changes in pricing to offset the cumulative impact of inflation experi-enced in 2008.
On an organic basis, sales in our roll materials business in 2009declined at a high single-digit rate in Europe, a mid single-digit rate(excluding intercompany sales) in North America, and a low single-digitrate in Latin America, reflecting weakness in end markets. These declineswere partially offset by mid-single digit growth in Asia. On an organic basis,sales in our emerging markets (Asia, Latin America, and Eastern Europe)remained flat in 2009 compared to 2008.
On an organic basis, sales in our graphics and reflective business in2009 declined at a mid-teen rate, reflecting lower promotional spending bybusinesses in response to weak market conditions.
Operating IncomeIncreased operating income in 2010 reflected higher volume, lower net legalsettlement costs, cost savings from restructuring and productivity improve-ment initiatives, the benefits from pricing, and lower restructuring and assetimpairment charges, partially offset by raw material inflation, higher employee-related costs, and higher investments in growth and infrastructure.
Decreased operating income in 2009 reflected lower volume, legalsettlement costs, the unfavorable impact of currency translation, higherrestructuring, asset impairment, and lease cancellation charges, andhigher employee costs. These factors were partially offset by the effectof changes in pricing to offset the cumulative impact of inflation experi-enced in 2008, cost savings from restructuring and productivity improve-ment initiatives, and lower raw material and energy costs.
Retail Information Services Segment(In millions) 2010 2009 2008
Net sales including intersegmentsales $ 1,523.7 $ 1,322.5 $ 1,549.3
Less intersegment sales (2.0) (1.6) (2.1)
Net sales $ 1,521.7 $ 1,320.9 $ 1,547.2Operating income (loss)(1)(2) 65.0 (899.0) 13.5
(1) Included restructuring costs, assetimpairment charges, and leasecancellation costs in all years presented,and loss from curtailment of domesticpension obligations and net legalsettlement costs in 2010 $ 5.8 $ 51.6 $ 12.2
(2) Included goodwill and indefinite-livedintangible asset impairment charges in2009 and transition costs associated withacquisition integrations in 2008 $ – $ 832.0 $ 24.1
18Management’s Discussion and Analysisof Results of Operations and Financial Condition
Net SalesSales in our Retail Information Services segment increased 15% in 2010and decreased 15% in 2009.
In 2010, sales on reported and organic bases increased 15% com-pared to 2009, as the favorable impact of foreign currency translation(approximately $7 million) was offset by the estimated impact of the extraweek in the first quarter of 2009. The sales growth reflected increaseddemand due in part to significant inventory reductions by apparel retailersduring 2009, as well as new programs with key brands and retailers.
In 2009, the decrease in reported sales reflected lower sales on anorganic basis and the unfavorable impact of foreign currency translation(approximately $46 million), partially offset by the estimated impact of theextra week in the first quarter of 2009 and incremental sales from the DMLabel acquisition (approximately $9 million). On an organic basis, salesdeclined 14% in 2009 due primarily to lower volume from weakness in theapparel markets in the U.S. and Europe, and tighter inventory controls byretailers and brands.
Operating Income (Loss)Increased operating income in 2010 primarily reflected the absence of thegoodwill and indefinite-lived intangible asset impairment charges recordedin the prior year. Operating income also increased due to the benefits ofhigher volume, cost savings from restructuring and productivity improve-ment initiatives, and lower restructuring, asset impairment charges andlease cancellation costs, partially offset by higher employee-related costs.
Operating loss in 2009 reflected goodwill and indefinite-lived intan-gible asset impairment charges, lower volume, higher restructuring, assetimpairment and lease cancellation charges, changes in pricing, and higheremployee costs. These factors were partially offset by incremental savingsfrom integration actions and the benefit of restructuring and productivityimprovement initiatives, along with reduced transition costs associatedwith acquisition integrations in 2009.
Office and Consumer Products Segment(In millions) 2010 2009 2008
Net sales including intersegment sales $ 816.0 $ 850.0 $ 937.0Less intersegment sales (.8) (.7) (1.2)
Net sales $ 815.2 $ 849.3 $ 935.8Operating income(1) 91.5 118.1 145.7(1) Included restructuring costs in all years
presented, asset impairment charges in 2009and 2008, and loss from curtailment andsettlement of pension obligations and leasecancellation costs in 2010 $ 8.4 $ 14.0 $ 12.7
Net SalesSales in our Office and Consumer Products segment decreased 4% in2010 and 9% in 2009.
Sales in our Office and Consumer Products segment on a reportedand organic basis decreased 4% in 2010 compared to 2009, as theestimated impact of the extra week in the first quarter of 2009 offset thefavorable impact of foreign currency translation (approximately $5 million).On an organic basis, the sales decline in 2010 reflected continued weakend-market demand, increased competition in the label category, andchanges in customer programs.
In 2009, the decrease in reported sales reflected lower sales on anorganic basis and the unfavorable impact of foreign currency translation
(approximately $22 million), partially offset by the estimated impact of theextra week in the first quarter of 2009. On an organic basis, sales declined8% in 2009 due primarily to lower volume from weak end market demandled by slower corporate purchasing activity, partially offset by strongback-to-school sales and the effect of changes in pricing to offset thecumulative impact of inflation experienced in 2008.
Operating IncomeDecreased operating income in 2010 reflected higher investment indemand creation, innovation, and consumer promotions and marketing,changes in customer programs, and raw material inflation, partially offsetby benefits from restructuring and productivity improvement initiatives andlower restructuring and asset impairment charges.
Decreased operating income in 2009 reflected the impact of lowervolume, higher employee costs, and increased marketing and productdevelopment spending, partially offset by cost savings from restructuringand productivity improvement initiatives and the effect of changes inpricing to offset the cumulative impact of inflation experienced in 2008.
Other specialty converting businesses(In millions) 2010 2009 2008
Net sales including intersegment sales $ 566.7 $ 498.3 $ 609.9Less intersegment sales (30.7) (15.8) (26.3)
Net sales $ 536.0 $ 482.5 $ 583.6Operating income (loss)(1) 4.8 (44.1) 5.2(1) Included restructuring costs and asset
impairment charges for all years presented andloss from curtailment of domestic pensionobligations in 2010 $ 3.1 $ 29.2 $ 3.2
Net SalesSales in our other specialty converting businesses increased 11% in 2010and decreased 18% in 2009.
Sales in our other specialty converting businesses increased 11% in2010 compared to 2009, due primarily to the increase in sales on anorganic basis, partially offset by the unfavorable impact of foreign currencytranslation (approximately $2 million) and the estimated impact of the extraweek in the first quarter of 2009. On an organic basis, sales grew 12% in2010, reflecting increased demand for products for automotive applica-tions, which was down sharply in 2009.
In 2009, the decrease in reported sales reflected lower sales on anorganic basis and the unfavorable impact of foreign currency translation(approximately $15 million), partially offset by the estimated impact of theextra week in the first quarter of 2009. On an organic basis, sales declined16% in 2009, primarily reflecting lower volume in products sold to theautomotive, housing, and construction industries.
Operating Income (Loss)Operating income for these businesses in 2010 reflected lower restruc-turing and asset impairment charges, higher volume, and the benefits fromrestructuring and productivity improvement initiatives, partially offset byraw material inflation and higher employee-related costs.
Operating loss for these businesses in 2009 reflected lower volumeand higher restructuring and asset impairment charges, partially offset bythe benefit of restructuring and productivity improvement initiatives.
19 Avery Dennison Corporation2010 Annual Report
Management’s Discussion and Analysisof Results of Operations and Financial Condition
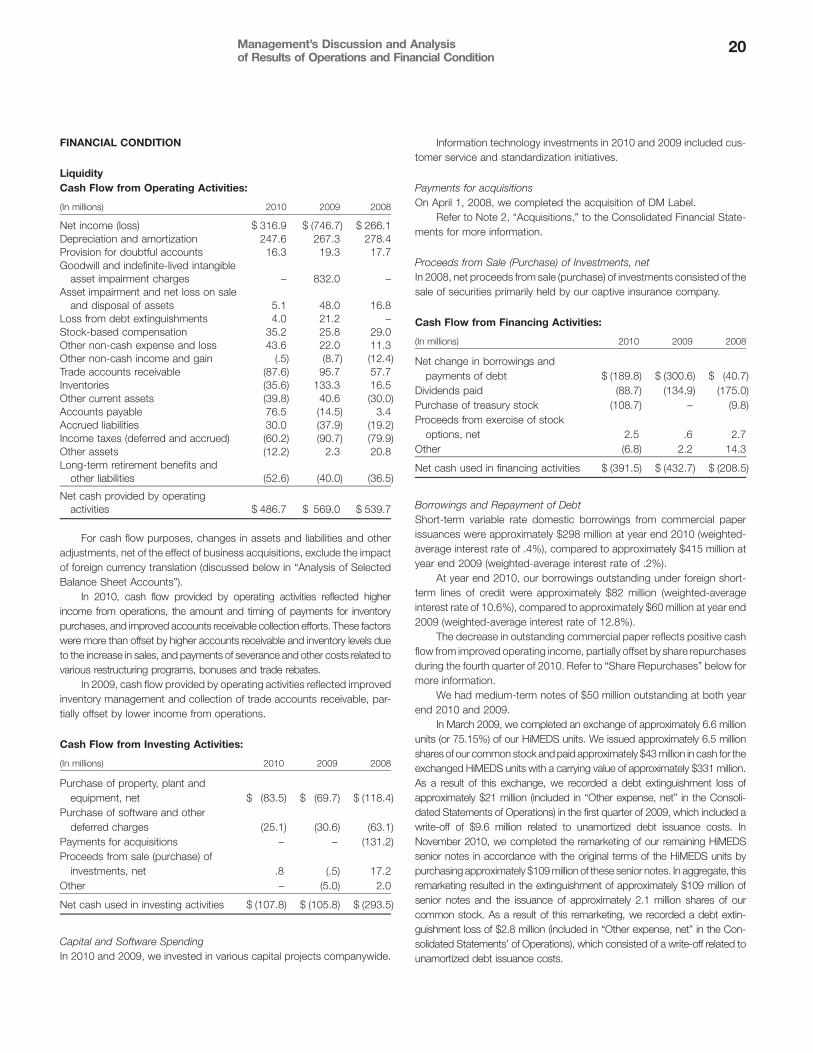
FINANCIAL CONDITION
LiquidityCash Flow from Operating Activities:
(In millions) 2010 2009 2008
Net income (loss) $ 316.9 $ (746.7) $ 266.1Depreciation and amortization 247.6 267.3 278.4Provision for doubtful accounts 16.3 19.3 17.7Goodwill and indefinite-lived intangible
asset impairment charges – 832.0 –Asset impairment and net loss on sale
and disposal of assets 5.1 48.0 16.8Loss from debt extinguishments 4.0 21.2 –Stock-based compensation 35.2 25.8 29.0Other non-cash expense and loss 43.6 22.0 11.3Other non-cash income and gain (.5) (8.7) (12.4)Trade accounts receivable (87.6) 95.7 57.7Inventories (35.6) 133.3 16.5Other current assets (39.8) 40.6 (30.0)Accounts payable 76.5 (14.5) 3.4Accrued liabilities 30.0 (37.9) (19.2)Income taxes (deferred and accrued) (60.2) (90.7) (79.9)Other assets (12.2) 2.3 20.8Long-term retirement benefits and
other liabilities (52.6) (40.0) (36.5)
Net cash provided by operatingactivities $ 486.7 $ 569.0 $ 539.7
For cash flow purposes, changes in assets and liabilities and otheradjustments, net of the effect of business acquisitions, exclude the impactof foreign currency translation (discussed below in “Analysis of SelectedBalance Sheet Accounts”).
In 2010, cash flow provided by operating activities reflected higherincome from operations, the amount and timing of payments for inventorypurchases, and improved accounts receivable collection efforts. These factorswere more than offset by higher accounts receivable and inventory levels dueto the increase in sales, and payments of severance and other costs related tovarious restructuring programs, bonuses and trade rebates.
In 2009, cash flow provided by operating activities reflected improvedinventory management and collection of trade accounts receivable, par-tially offset by lower income from operations.
Cash Flow from Investing Activities:
(In millions) 2010 2009 2008
Purchase of property, plant andequipment, net $ (83.5) $ (69.7) $ (118.4)
Purchase of software and otherdeferred charges (25.1) (30.6) (63.1)
Payments for acquisitions – – (131.2)Proceeds from sale (purchase) of
investments, net .8 (.5) 17.2Other – (5.0) 2.0
Net cash used in investing activities $ (107.8) $ (105.8) $ (293.5)
Capital and Software SpendingIn 2010 and 2009, we invested in various capital projects companywide.
Information technology investments in 2010 and 2009 included cus-tomer service and standardization initiatives.
Payments for acquisitionsOn April 1, 2008, we completed the acquisition of DM Label.
Refer to Note 2, “Acquisitions,” to the Consolidated Financial State-ments for more information.
Proceeds from Sale (Purchase) of Investments, netIn 2008, net proceeds from sale (purchase) of investments consisted of thesale of securities primarily held by our captive insurance company.
Cash Flow from Financing Activities:
(In millions) 2010 2009 2008
Net change in borrowings andpayments of debt $ (189.8) $ (300.6) $ (40.7)
Dividends paid (88.7) (134.9) (175.0)Purchase of treasury stock (108.7) – (9.8)Proceeds from exercise of stock
options, net 2.5 .6 2.7Other (6.8) 2.2 14.3
Net cash used in financing activities $ (391.5) $ (432.7) $ (208.5)
Borrowings and Repayment of DebtShort-term variable rate domestic borrowings from commercial paperissuances were approximately $298 million at year end 2010 (weighted-average interest rate of .4%), compared to approximately $415 million atyear end 2009 (weighted-average interest rate of .2%).
At year end 2010, our borrowings outstanding under foreign short-term lines of credit were approximately $82 million (weighted-averageinterest rate of 10.6%), compared to approximately $60 million at year end2009 (weighted-average interest rate of 12.8%).
The decrease in outstanding commercial paper reflects positive cashflow from improved operating income, partially offset by share repurchasesduring the fourth quarter of 2010. Refer to “Share Repurchases” below formore information.
We had medium-term notes of $50 million outstanding at both yearend 2010 and 2009.
In March 2009, we completed an exchange of approximately 6.6 millionunits (or 75.15%) of our HiMEDS units. We issued approximately 6.5 millionshares of our common stock and paid approximately $43 million in cash for theexchanged HiMEDS units with a carrying value of approximately $331 million.As a result of this exchange, we recorded a debt extinguishment loss ofapproximately $21 million (included in “Other expense, net” in the Consoli-dated Statements of Operations) in the first quarter of 2009, which included awrite-off of $9.6 million related to unamortized debt issuance costs. InNovember 2010, we completed the remarketing of our remaining HiMEDSsenior notes in accordance with the original terms of the HiMEDS units bypurchasing approximately $109 million of these senior notes. In aggregate, thisremarketing resulted in the extinguishment of approximately $109 million ofsenior notes and the issuance of approximately 2.1 million shares of ourcommon stock. As a result of this remarketing, we recorded a debt extin-guishment loss of $2.8 million (included in “Other expense, net” in the Con-solidated Statements’ of Operations), which consisted of a write-off related tounamortized debt issuance costs.
20Management’s Discussion and Analysisof Results of Operations and Financial Condition

In January 2009, one of our subsidiaries entered into an amendmentto a credit agreement for a $400 million term loan credit facility (“CreditFacility”) with certain domestic and foreign banks, which we guaranteed.Financing available under the Credit Facility was permitted to be used forworking capital and other general corporate purposes. The amendmentincreased our flexibility for a specified period of time in complying with thefinancial covenants to which the Credit Facility is subject and excludedcertain restructuring charges from the calculation of the financial ratiosunder those covenants. The amendment also increased the annual inter-est rate of the Credit Facility. In April 2010, we issued $250 million of seniornotes bearing an interest rate of 5.375% per year, due April 2020. Approx-imately $248 million in proceeds from the offering, net of underwritingdiscounts and offering expenses, were used, together with commercialpaper borrowings, to repay the $325 million in indebtedness outstandingunder the Credit Facility in May 2010. In the second quarter of 2010, werecorded a debt extinguishment loss of $1.2 million related to unamortizeddebt issuance costs from the Credit Facility.
Refer to Note 4, “Debt,” to the Consolidated Financial Statements formore information.
Refer to “Capital Resources” below for further information on the2010 and 2009 borrowings and repayment of debt.
Dividend PaymentsIn July 2009, we reduced our quarterly dividend per share of $.41 to $.20,resulting in an annual dividend per share of $.80 in 2010 compared to$1.22 in 2009.
Subsequent to the end of 2010, on February 2, 2011, we announced a firstquarter 2011 dividend of $.25 per share, which represents a 25% increasefrom our previous dividend of $.20 per share.
Share RepurchasesThe Board of Directors authorizes share repurchases of our outstandingcommon stock. Repurchased shares may be reissued under our stockoption and incentive plans or used for other corporate purposes. Werepurchased approximately 2.7 million shares totaling $108.7 million dur-ing the fourth quarter of 2010 to offset the impact of dilution on earningsper share associated with the issuance of approximately 2.1 million sharesof our common stock as a result of the remarketing of our remainingHiMEDS senior notes in November 2010. Additionally, in December 2010,we executed the repurchase of approximately .3 million shares for $13.5million which settled in January 2011. As of January 1, 2011, approxi-mately 1.2 million shares were available for repurchase under the Board ofDirectors’ October 2006 authorization.
Subsequent to the end of 2010, on January 27, 2011, the Board ofDirectors authorized us to repurchase an additional five million shares ofour stock.
Analysis of Selected Balance Sheet AccountsLong-lived AssetsGoodwill decreased approximately $10 million during 2010, which prima-rily reflected the impact of foreign currency translation.
Other intangibles resulting from business acquisitions, net, decreasedapproximately $33 million during 2010, which primarily reflected currentyear amortization expense.
Refer to Note 3, “Goodwill and Other Intangibles Resulting fromBusiness Acquisitions,” to the Consolidated Financial Statements for moreinformation.
Other assets decreased approximately $16 million during 2010,which reflected amortization expense of software and other deferredcharges ($38 million), a decrease in long-term pension assets ($6 million),a reclassification of a third-party loan receivable to short-term receivables($5 million), the write-off of unamortized debt issuance costs associatedwith the remarketing of the HiMEDS units, net of additional financing costs,related to the issuance of senior notes discussed in “Borrowings andRepayment of Debt” ($2 million), and the impact of foreign currencytranslation ($2 million). These decreases were partially offset by purchasesof software and other deferred charges ($25 million) and an increase in thecash surrender value of our corporate-owned life insurance ($12 million).
Shareholders’ Equity AccountsOur shareholders’ equity was $1.65 billion at year end 2010, compared to$1.36 billion at year end 2009. The increase in our shareholders’ equitywas primarily due to higher net income, a decrease in dividend paymentsand recognition of current year stock-based compensation expense.
The value of our Employee Stock Benefit Trust (“ESBT”) decreasedapproximately $170 million in 2010 due primarily to the release of approxi-mately 4.3 million common shares from the ESBT, resulting from the settle-ment of our employee benefit obligations ($163 million). These shares wereincluded as “Treasury stock at cost” in the Consolidated Balance Sheet. Thedecrease was also attributable to the issuance of shares under our incentiveplans and our defined contribution plan ($22 million), partially offset by anincrease in the market value of shares held in the trust ($15 million).
Accumulated other comprehensive loss decreased by approximately$2 million during 2010 due primarily to the impact of foreign currencytranslation ($18 million) and lower net loss on derivative instrumentsdesignated as cash flow and firm commitment hedges ($2 million). Thesedecreases were partially offset by the current year amortization of netpension transition obligations, prior service cost, and net actuarial losses inour pension and other postretirement plans ($18 million). Refer to Note 6,“Pension and Other Postretirement Benefits,” to the Consolidated Finan-cial Statements for more information.
Impact of Foreign Currency Translation:
(In millions) 2010 2009 2008
Change in net sales $ 27 $ (269) $ 168Change in net income (3) (6) 8
In 2010, international operations generated approximately 68% of ournet sales. Our future results are subject to changes in political and eco-nomic conditions in the regions in which we operate and the impact offluctuations in foreign currency exchange and interest rates.
The effect of currency translation on sales in 2010 primarily reflected apositive impact from sales in the currencies of Australia, Brazil, Canadaand South Korea, partially offset by a negative impact from sales denom-inated in euros.
Translation gains and losses for operations in hyperinflationary econ-omies, if any, are included in net income in the period incurred. Operationsare treated as being in a hyperinflationary economy based on the
21 Avery Dennison Corporation2010 Annual Report
Management’s Discussion and Analysisof Results of Operations and Financial Condition

cumulative inflation rate over the past three years. In 2010, 2009 and 2008,we had no operations in hyperinflationary economies.
Effect of Foreign Currency TransactionsThe impact on net income from transactions denominated in foreigncurrencies may be mitigated because the costs of our products aregenerally denominated in the same currencies in which they are sold. Inaddition, to reduce our income and cash flow exposure to transactions inforeign currencies, we may enter into foreign exchange forward, optionand swap contracts, where available and appropriate.
Analysis of Selected Financial RatiosWe utilize certain financial ratios to assess our financial condition andoperating performance, as discussed below.
Operational Working Capital RatioWorking capital (deficit) (current assets minus current liabilities) as a per-cent of net sales increased in 2010 due to a decrease in short-term and thecurrent portion of long-term debt, as well as an increase in net accountsreceivable, net inventory, and current deferred tax assets, partially offset byan increase in accounts payable.
Operational working capital, as a percent of net sales, is a non-GAAPfinancial measure and is reconciled with working capital below. We use thisnon-GAAP financial measure as a tool to assess our working capitalrequirements because it excludes the impact of fluctuations attributableto our financing and other activities (that affect cash and cash equivalents,deferred taxes, other current assets, and other current liabilities) that tendto be disparate in amount and timing, and therefore, may increase thevolatility of the working capital ratio from period to period. Additionally, theitems excluded from this measure are not necessarily indicative of theunderlying trends of our operations and are not significantly influenced bythe day-to-day activities that are managed at the operating level. Refer to“Non-GAAP Financial Measures.” Our objective is to minimize our invest-ment in operational working capital, as a percentage of sales, by reducingthis ratio to maximize cash flow and return on investment.
Operational Working Capital:
(In millions) 2010 2009
(A) Working capital (deficit) (current assetsminus current liabilities) $ 120.1 $ (134.5)
Reconciling items:Cash and cash equivalents (127.5) (138.1)Current deferred and refundable income taxes
and other current assets (308.4) (199.2)Short-term and current portion of long-term
debt 381.0 535.6Current deferred and payable income taxes and
other current accrued liabilities 702.6 642.3
(B) Operational working capital $ 767.8 $ 706.1
(C) Net sales $6,512.7 $5,850.8(1)
Working capital (deficit), as a percent ofnet sales (A) � (C) 1.8% (2.3)%
Operational working capital, as a percentof net sales (B) � (C) 11.8% 12.1%
(1) Adjusted for the estimated impact of the extra week in the first quarter of 2009
As a percent of net sales, operational working capital in 2010decreased compared to 2009. The primary factors contributing to thischange, which includes the impact of foreign currency translation, arediscussed below.
Accounts Receivable RatioThe average number of days sales outstanding was 57 days in 2010compared to 59 days in 2009, calculated using a four-quarter averageaccounts receivable balance divided by the average daily sales for the year.The change from prior year in the average number of days sales out-standing primarily reflected improvement in collection efforts.
Inventory RatioAverage inventory turnover was 8.6 in 2010 compared to 8.4 in 2009,calculated using the annual cost of sales divided by a four-quarter averageinventory balance. The change from prior year in the average inventoryturnover reflected a continued focus on improvements in inventorymanagement.
Accounts Payable RatioThe average number of days payable outstanding was 58 days in 2010compared to 53 days in 2009, calculated using a four-quarter averageaccounts payable balance divided by the average daily cost of productssold for the year. The change from prior year in the average number of dayspayable outstanding was primarily due to the amount and timing ofinventory purchases and timing of payments to vendors.
Net Debt to EBITDA Ratio(Dollars in millions) 2010 2009 2008
Net income (loss) $ 316.9 $ (746.7) $ 266.1Reconciling items:Interest expense 76.6 85.3 115.9Provision for (benefit from) income
taxes 34.4 (44.2) 4.5Depreciation 172.9 187.6 204.6Amortization 74.7 79.7 73.8
EBITDA $ 675.5 $ (438.3) $ 664.9
Total debt $1,337.2 $1,624.3 $2,209.8Less cash and cash equivalents (127.5) (138.1) (105.5)
Net debt $1,209.7 $1,486.2 $2,104.3
Net debt to EBITDA ratio 1.8 n/m(1) 3.2
(1) The net debt to EBITDA ratio was not meaningful for 2009 as EBITDA was negative. EBITDA in2009 included $832 in charges related to the impairment of goodwill and indefinite-livedintangibles.
We believe that the net debt to EBITDA ratio is a meaningful mea-surement because investors view it as an indicator of our leverage position.
In 2010, the net debt to EBITDA ratio improved compared to 2009primarily due to the impact of goodwill and indefinite-lived intangible assetimpairment charges recorded in the prior year, repayment of debt, and anincrease in operating income.
Financial CovenantsOur various loan agreements in effect at year end require that we maintainspecified financial covenant ratios on total debt and interest expense in
22Management’s Discussion and Analysisof Results of Operations and Financial Condition

relation to certain measures of income. As of January 1, 2011, we were incompliance with these financial covenants. In January 2009, we amendedthe covenants included in the revolving credit agreement and term loanagreement to exclude certain restructuring charges and adjust covenantlevels. The adjusted covenant levels changed quarterly and reverted backto the pre-amendment levels during 2010. The amendments also resultedin increased pricing levels for borrowings under both agreements throughthe end of their respective terms. Refer to Note 4, “Debt,” to the Consol-idated Financial Statements for further information.
The fair value of our long-term debt is estimated primarily based onthe credit spread above U.S. Treasury securities on notes with similarrates, credit rating, and remaining maturities. At year end, the fair value ofour total debt, including short-term borrowings, was $1.39 billion in 2010and $1.60 billion in 2009. Fair value amounts were determined primarilybased on Level 2 inputs, defined as inputs other than quoted prices inactive markets that are either directly or indirectly observable. Refer toNote 1, “Summary of Significant Accounting Policies” to the ConsolidatedFinancial Statements for further information.
Capital ResourcesCapital resources include cash flows from operations, cash and cashequivalents and debt financing. At year end 2010, we had cash and cashequivalents of approximately $128 million held in accounts at third-partyfinancial institutions.
Our $1 billion revolving credit facility, which supports our commercialpaper programs in the U.S. and Europe, matures in 2012. Based upon ourcurrent outlook for our business and market conditions, we believe thatthis facility, in addition to the uncommitted bank lines of credit maintainedin the countries in which we operate, will provide the liquidity to fund ouroperations during 2011.
We are exposed to financial market risk resulting from changes ininterest and foreign currency rates, and to possible liquidity and credit risksof our counterparties.
Capital from DebtOur total debt decreased by approximately $287 million in 2010 to$1.34 billion compared to $1.62 billion at year end 2009, reflecting adecrease in long-term borrowings, as well as a decrease in commercialpaper borrowings. Refer to “Borrowings and Repayment of Debt” abovefor more information.
We have $1.2 million of debt maturities due in 2011.We had standby letters of credit outstanding of $41.1 million and
$52.5 million at the end of 2010 and 2009, respectively. The aggregatecontract amount of outstanding standby letters of credit approximated fairvalue.
Our uncommitted lines of credit were approximately $407 million atyear end 2010 and may be cancelled by the banks or us at any time.
Credit ratings are a significant factor in our ability to raise short-termand long-term financing. The credit ratings assigned to us also impact theinterest rates paid and our access to commercial paper, credit facilities,and other borrowings. A downgrade of our short-term credit ratings belowour current levels would impact our ability to access the commercial papermarkets. If our access to commercial paper markets is limited, our revolv-ing credit facility and other credit facilities are available to meet our short-term funding requirements, if necessary. When determining a credit rating,the rating agencies place significant weight on our competitive position,business outlook, consistency of cash flows, debt level and liquidity,geographic dispersion and management team. We remain committedto retaining an investment grade rating.
Contractual Obligations, Commitments and Off-Balance Sheet ArrangementsContractual Obligations at End of Year 2010:
(In millions) Total 2011 2012 2013 2014 2015 Thereafter
Payments Due by Period
Short-term lines of credit $ 379.8 $ 379.8 $ – $ – $ – $ – $ –
Long-term debt 949.2 .1 – 250.0 – 5.0 694.1
Long-term capital leases 8.2 1.1 2.3 2.0 1.6 .6 .6
Interest on long-term debt(1) 503.2 54.6 54.6 42.9 42.4 42.4 266.3
Operating leases 244.2 66.1 52.2 36.8 23.1 17.5 48.5
Pension and postretirement benefit payments (unfunded plans) 56.7 4.5 4.3 3.8 4.0 4.0 36.1
Total contractual obligations $ 2,141.3 $ 506.2 $ 113.4 $ 335.5 $ 71.1 $ 69.5 $ 1,045.6
(1) Interest on floating rate debt was estimated using the index rate in effect as of January 1, 2011.
We enter into operating leases primarily for office and warehousespace and equipment for electronic data processing and transportation.The table above includes minimum annual rental commitments on oper-ating leases having initial or remaining non-cancelable lease terms of oneyear or more. The terms of our leases do not impose significant restrictionsor unusual obligations, except for the commercial facility located in Mentor,Ohio, as noted below.
The table above does not include:• Purchase obligations or open purchase orders at year end. It is
impracticable for us to either obtain such information or provide areasonable estimate due to the decentralized nature of our
purchasing systems. In addition, purchase orders are generallyat fair value and are cancelable without penalty.
• Cash funding requirements for pension benefits payable to certaineligible current and future retirees under our funded plans — Benefitspaid by our funded pension plans are paid through a trust or trustequivalent. Cash funding requirements for our funded plans, whichcan be significantly impacted by earnings on investments, the dis-count rate, changes in the plans, and funding laws and regulations,are not included in this table as we are not able to estimate requiredcontributions to the trust or trust equivalent. Refer to Note 6, “Pen-sion and Other Postretirement Benefits,” to the Consolidated Finan-cial Statements for expected contributions to our plans.
23 Avery Dennison Corporation2010 Annual Report
Management’s Discussion and Analysisof Results of Operations and Financial Condition

• Unfunded termination indemnity benefits to certain employees out-side of the U.S. — These benefits are subject to applicable agree-ments, local laws and regulations. We have not incurred significantcosts related to performance under these types of arrangements.
• Unrecognized tax benefit reserves of approximately $154 million, ofwhich approximately $14 million may become payable during2011. The resolution of the balance, including the timing of pay-ments, is contingent upon various unknown factors and cannot bereasonably estimated. Refer to Note 11, “Taxes Based on Income,”to the Consolidated Financial Statements for further information onunrecognized tax benefits.
• Obligations associated with the headquarters and research centerfor our roll materials division (the “Facility”), located in Mentor,Ohio — We completed the lease financing for the Facility, whichconsists generally of land, buildings, equipment and office furnish-ings, on September 9, 2005. We have leased the Facility under anoperating lease arrangement, which contains a residual valueguarantee of $33.4 million.
Legal ProceedingsOn May 21, 2003, The Harman Press filed in the Superior Court for theCounty of Los Angeles, California, a purported class action on behalf ofindirect purchasers of label stock against us, UPM-Kymenne Corporation(“UPM”) and UPM’s subsidiary Raflatac (“Raflatac”), seeking treble dam-ages and other relief for alleged unlawful competitive practices, withallegations including that the defendants attempted to limit competitionamong themselves through anticompetitive understandings. Three similarcomplaints were filed in various California courts. In November 2003, onpetition from the parties, the California Judicial Council ordered the casesbe coordinated for pretrial purposes. The cases were assigned to acoordination trial judge in the Superior Court for the City and County ofSan Francisco on March 30, 2004. On September 30, 2004, the HarmanPress amended its complaint to add Bemis Company Inc.’s subsidiaryMorgan Adhesives Company (“MACtac”) as a defendant. On January 21,2005, American International Distribution Corporation filed a purportedclass action on behalf of indirect purchasers in the Superior Court forChittenden County, Vermont. Similar actions were filed by Richard Wrobel,on February 16, 2005, in the District Court of Johnson County, Kansas;and by Chad and Terry Muzzey, on February 16, 2005 in the District Courtof Scotts Bluff County, Nebraska. On February 17, 2005, Judy Bensonfiled a purported multi-state class action on behalf of indirect purchasers inthe Circuit Court for Cocke County, Tennessee. Without admitting liability,we agreed to pay plaintiffs $2 million to resolve all claims related to thepurported state class actions in the states of Kansas, Nebraska, Tennes-see and Vermont. Those settlements were approved by the Tennesseecourt on March 12, 2010 and the complaints in those state actions weredismissed with prejudice. We recorded $2 million in the third quarter of2009 in respect of the settlement of those claims, and made that paymenton December 28, 2009. Also, without admitting liability, we paid $2.5 mil-lion on July 15, 2010 to resolve all claims in the California action. OnDecember 8, 2010, the California court granted final approval of thesettlement and dismissed all claims against us with prejudice. In respectof settlement of this claim, we recorded $.7 million in the fourth quarter of2009 and $.3 million and $1.5 million in the first and second quarters of2010, respectively.
We and our subsidiaries are involved in various other lawsuits, claims,inquiries, and other regulatory and compliance matters, which are either
routine to the nature of our business, or, based upon current information, ifdetermined to be adverse for us, are not expected to have a material effecton our financial condition, results of operations and cash flows.
Environmental MattersAs of January 1, 2011, we have been designated by the U.S. Environ-mental Protection Agency (“EPA”) and/or other responsible state agenciesas a potentially responsible party (“PRP”) at fourteen waste disposal orwaste recycling sites, which are the subject of separate investigations orproceedings concerning alleged soil and/or groundwater contaminationand for which no settlement of our liability has been agreed. We areparticipating with other PRPs at such sites and anticipate that our share ofcleanup costs will be determined pursuant to remediation agreementsentered into in the normal course of negotiations with the EPA or othergovernmental authorities.
We have accrued liabilities for these and certain other sites where it isprobable that a loss will be incurred and the cost or amount of loss can bereasonably estimated. However, because of the uncertainties associatedwith environmental assessment and remediation activities, future expenseto remediate the currently identified sites and any sites that could beidentified in the future for cleanup could be higher than the liabilitiesaccrued.
The activity in 2010 and 2009 related to environmental liabilities wasas follows:
(In millions) 2010 2009
Balance at beginning of year $ 51.5 $ 54.6Purchase price adjustments related to acquisitions – .9Accruals (1.2) 1.0Payments (4.0) (5.0)
Balance at end of year $ 46.3 $ 51.5
At year end 2010, approximately $9 million of the total balance wasclassified as short-term.
These estimates could change depending on various factors, such asmodification of currently planned remedial actions, changes in remediationtechnologies, changes in site conditions, changes in the estimated time tocomplete remediation projects, changes in laws and regulations affectingremediation requirements and other factors.
OtherWe participate in international receivable financing programs with severalfinancial institutions whereby advances may be requested from thesefinancial institutions. Such advances are guaranteed by us. At year end2010, we had guaranteed approximately $14 million.
At year end 2010, we guaranteed up to approximately $17 million ofcertain of our foreign subsidiaries’ credit granted by suppliers and$393 million of certain of our subsidiaries’ lines of credit with variousfinancial institutions.
Refer to Note 1, “Summary of Significant Accounting Policies,” in theConsolidated Financial Statements for information regarding asset retire-ment obligations and product warranties.
24Management’s Discussion and Analysisof Results of Operations and Financial Condition

CRITICAL ACCOUNTING POLICIES AND ESTIMATES
The preparation of financial statements in conformity with accountingprinciples generally accepted in the United States of America requiresmanagement to make estimates and assumptions for the reporting periodand as of the financial statement date. These estimates and assumptionsaffect the reported amounts of assets and liabilities, the disclosure ofcontingent liabilities and the reported amounts of revenue and expense.Actual results could differ from those estimates.
Critical accounting policies are those that are important to the por-trayal of our financial condition and results, and which require us to makedifficult, subjective and/or complex judgments. Critical accounting policiescover accounting matters that are inherently uncertain because the futureresolution of such matters is unknown. We believe that critical accountingpolicies include accounting for revenue recognition, sales returns andallowances, accounts receivable allowances, inventory and inventoryreserves, long-lived asset impairments, goodwill, fair value measurements,pension and postretirement benefits, income taxes, stock-based com-pensation, restructuring and severance costs, litigation and environmentalmatters, and business combinations.
Revenue RecognitionSales are recognized when persuasive evidence of an arrangement exists,pricing is determinable, delivery has occurred based on applicable salesterms, and collection is reasonably assured. Sales terms are generally freeon board (f.o.b.) shipping point or f.o.b. destination, depending upon localbusiness customs. For most regions in which we operate, f.o.b. shippingpoint terms are utilized and sales are recorded at the time of shipment,because this is when title and risk of loss are transferred. In certain regions,notably in Europe, f.o.b. destination terms are generally utilized and salesare recorded when the products are delivered to the customer’s deliverysite, because this is when title and risk of loss are transferred. Furthermore,sales, provisions for estimated returns, and the cost of products sold arerecorded at the time title transfers to customers and when the customersassume the risks and rewards of ownership. Actual product returns arecharged against estimated sales return allowances.
Sales rebates and discounts are common practice in the industries inwhich we operate. Volume, promotional, price, cash and other discountsand customer incentives are accounted for as a reduction to gross sales.Rebates and discounts are recorded based upon estimates at the timeproducts are sold. These estimates are based upon historical experiencefor similar programs and products. We review such rebates and discountson an ongoing basis and accruals for rebates and discounts are adjusted,if necessary, as additional information becomes available.
Sales Returns and AllowancesSales returns and allowances represent credits we grant to our customers(both affiliated and non-affiliated) for the return of unsatisfactory product ora negotiated allowance in lieu of return. We accrue for returns andallowances based upon the gross price of the products sold and historicalexperience for such products. We record these allowances based on thefollowing factors: (i) customer specific allowances; and (ii) an estimatedamount, based on our historical experience, for issues not yet identified.
Accounts Receivable AllowancesWe are required to make judgments as to the collectability of accountsreceivable based on established aging policy, historical experience andfuture expectations. The allowances for doubtful accounts representallowances for customer trade accounts receivable that are estimatedto be partially or entirely uncollectible. These allowances are used toreduce gross trade receivables to their net realizable value. We recordthese allowances based on estimates related to the following factors:(i) customer specific allowances; (ii) amounts based upon an aging sched-ule; and (iii) an estimated amount, based on our historical experience, forissues not yet identified. No single customer represented 10% or more ofour net sales in, or trade accounts receivable at year end of, 2010 or 2009.However, during 2010, our ten largest customers by net sales represented12% of our net sales. As of January 1, 2011, our ten largest customers bytrade accounts receivable represented 13% of our trade accounts receiv-able. These customers were primarily concentrated in Office and Con-sumer Products segment. The financial position and operations of thesecustomers are monitored on an ongoing basis.
Inventory and Inventory ReservesInventories are stated at the lower-of-cost-or-market value and are cat-egorized as raw materials, work-in-progress or finished goods. Cost isdetermined using the first-in, first-out (“FIFO”) method. Inventory reservesare recorded for matters such as damaged, obsolete, excess and slow-moving inventory. We use estimates to record these reserves. Slow-moving inventory is reviewed by category and may be partially or fullyreserved for depending on the type of product and the length of time theproduct has been included in inventory.
Impairment of Long-lived AssetsWe record impairment charges when the carrying amounts of long-livedassets are determined not to be recoverable. Impairment is measured byassessing the usefulness of an asset or by comparing the carrying value ofan asset to its fair value. Fair value is typically determined using quotedmarket prices, if available, or an estimate of undiscounted future cashflows expected to result from the use of the asset and its eventualdisposition. The key estimates applied when preparing cash flow projec-tions relate to revenues, gross margins, economic life of assets, over-heads, taxation and discount rates. The amount of impairment loss iscalculated as the excess of the carrying value over the fair value. Changesin market conditions and management strategy have historically causedus to reassess the carrying amount of our long-lived assets.
GoodwillOur reporting units are composed of either a discrete business or anaggregation of businesses with similar economic characteristics. Ourreporting units for the purpose of performing the impairment tests forgoodwill consist of roll materials; retail information services; office andconsumer products; graphics and reflective products; industrial products;and business media. For the purpose of performing the required impair-ment tests, we primarily apply a present value (discounted cash flow)method to determine the fair value of the reporting units with goodwill. Weperform our annual impairment test of goodwill during the fourth quarter.
Certain factors may result in the need to perform an impairment testprior to the fourth quarter, including significant underperformance of ourbusiness relative to expected operating results, significant adverse
25 Avery Dennison Corporation2010 Annual Report
Management’s Discussion and Analysisof Results of Operations and Financial Condition
economic and industry trends, significant decline in our market capital-ization for an extended period of time relative to net book value, or decisionto divest an individual business within a reporting unit.
We estimate the fair value of our reporting units using various valu-ation techniques, with the primary technique being a discounted cash flowanalysis. A discounted cash flow analysis requires us to make variousassumptions about sales, operating margins, growth rates and discountrates. Assumptions about discount rates are based on a weighted-aver-age cost of capital for comparable companies. Assumptions about sales,operating margins, and growth rates are based on our forecasts, businessplans, economic projections, anticipated future cash flows and market-place data. Assumptions are also made for varying perpetual growth ratesfor periods beyond the long-term business plan period.
Goodwill impairment is determined using a two-step process. Thefirst step is to identify if a potential impairment exists by comparing the fairvalue of a reporting unit with its carrying amount, including goodwill. If thefair value of a reporting unit exceeds its carrying amount, goodwill of thereporting unit is not considered to have a potential impairment and thesecond step of the impairment is not necessary. However, if the carryingamount of a reporting unit exceeds its fair value, the second step isperformed to determine if goodwill is impaired and to measure the amountof impairment loss to recognize, if any.
The second step, if necessary, compares the implied fair value ofgoodwill with the carrying amount of goodwill. If the implied fair value ofgoodwill exceeds the carrying amount, then goodwill is not consideredimpaired. However, if the carrying amount of goodwill exceeds the impliedfair value, an impairment loss is recognized in an amount equal to thatexcess.
Fair Value MeasurementsWe define fair value as the price that would be received from selling anasset or paid to transfer a liability in an orderly transaction between marketparticipants at the measurement date. When determining the fair valuemeasurements for assets and liabilities which are required to be recordedat fair value, we consider the principal or most advantageous market inwhich we would transact and the market-based risk measurements orassumptions that market participants would use in pricing the asset orliability.
We determine fair value based on a three-tier fair value hierarchy,which we use to prioritize the inputs used in measuring fair value. Thesetiers include: Level 1, defined as observable inputs such as quoted pricesin active markets; Level 2, defined as inputs other than quoted prices inactive markets that are either directly or indirectly observable; and Level 3,defined as unobservable inputs in which little or no market data exists,therefore requiring an entity to develop its own assumptions to determinethe best estimate of fair value.
Pension and Postretirement BenefitsAssumptions used in determining projected benefit obligations and the fairvalue of plan assets for our pension plan and other postretirement benefitplans are evaluated by management in consultation with outside actuar-ies. In the event we determine that changes are warranted in the assump-tions used, such as the discount rate, expected long-term rate of return, orhealth care costs, future pension and postretirement benefit expensescould increase or decrease. Due to changing market conditions orchanges in the participant population, the actuarial assumptions we
use may differ from actual results, which could have a significant impacton our pension and postretirement liability and related cost.
Discount RateWe, in consultation with our actuaries, annually review and determine thediscount rates to be used in connection with our postretirement obliga-tions. The assumed discount rate for each pension plan reflects marketrates for high quality corporate bonds currently available. In the U.S., ourdiscount rate is determined by evaluating several yield curves consisting oflarge populations of high quality corporate bonds. The projected pensionbenefit payment streams are then matched with the bond portfolios todetermine a rate that reflects the liability duration unique to our plans.
Long-term Return on AssetsWe determine the long-term rate of return assumption for plan assets byreviewing the historical and expected returns of both the equity and fixedincome markets, taking into consideration that assets with higher volatilitytypically generate a greater return over the long run. Additionally, currentmarket conditions, such as interest rates, are evaluated and peer data isreviewed to check for reasonability and appropriateness.
Healthcare Cost Trend RateOur practice is to fund the cost of postretirement benefits on a cash basis.For measurement purposes, an 8.5% annual rate of increase in the percapita cost of covered health care benefits was assumed for 2011. Thisrate is expected to decrease to approximately 5% by 2018.
Income TaxesDeferred tax assets and liabilities reflect temporary differences betweenthe amount of assets and liabilities for financial and tax reporting purposes.Such amounts are adjusted, as appropriate, to reflect changes in tax ratesexpected to be in effect when the temporary differences reverse. A val-uation allowance is recorded to reduce our deferred tax assets to theamount that is more likely than not to be realized. Changes in tax laws oraccounting standards and methods may affect recorded deferred taxes infuture periods.
Income taxes have not been provided on certain undistributed earn-ings of international subsidiaries because such earnings are considered tobe indefinitely reinvested.
When establishing a valuation allowance, we consider future sourcesof taxable income such as “future reversals of existing taxable temporarydifferences, future taxable income exclusive of reversing temporary dif-ferences and carryforwards” and “tax planning strategies.” A tax planningstrategy is defined as “an action that: is prudent and feasible; an enterpriseordinarily might not take, but would take to prevent an operating loss or taxcredit carryforward from expiring unused; and would result in realization ofdeferred tax assets.” In the event we determine the deferred tax assets willnot be realized in the future, the valuation adjustment to the deferred taxassets will be charged to earnings in the period in which we make such adetermination. We have also acquired certain net deferred tax assets withexisting valuation allowances. If it is later determined that it is more likelythan not that the deferred tax assets will be realized, we will release thevaluation allowance to current earnings or adjust the purchase priceallocation.
We calculate our current and deferred tax provision based on esti-mates and assumptions that could differ from the actual results reflected in
26Management’s Discussion and Analysisof Results of Operations and Financial Condition

income tax returns filed in subsequent years. Adjustments based on filedreturns are recorded when identified.
Investment tax credits are accounted for in the period earned inaccordance with the flow-through method.
The amount of income taxes we pay is subject to ongoing audits byfederal, state and foreign tax authorities. Our estimate of the potentialoutcome of any uncertain tax issue is subject to management’s assess-ment of relevant risks, facts, and circumstances existing at that time. Weuse a more-likely-than-not threshold for financial statement recognitionand measurement of tax positions taken or expected to be taken in a taxreturn. We record a liability for the difference between the benefit recog-nized and measured and tax position taken or expected to be taken on ourtax return. To the extent that our assessment of such tax positionschanges, the change in estimate is recorded in the period in which thedetermination is made. We report tax-related interest and penalties as acomponent of income tax expense.
We do not believe there is a reasonable likelihood that there will be amaterial change in the tax related balances or valuation allowance bal-ances. However, due to the complexity of some of these uncertainties, theultimate resolution may be materially different from the current estimate.
Stock-Based CompensationValuation of Stock OptionsOur stock-based compensation expense is the estimated fair value ofoptions granted, amortized on a straight-line basis over the requisiteservice period. The fair value of each of our stock option awards isestimated as of the date of grant using the Black-Scholes option-pricingmodel. This model requires input assumptions for our expected dividendyield, expected stock price volatility, risk-free interest rate and theexpected option term.
Risk-free interest rate was based on the 52-week average of theTreasury-Bond rate that has a term corresponding to the expected optionterm.
Expected stock price volatility for options was determined based onan average of implied and historical volatility.
Expected dividend yield was based on the current annual dividenddivided by the 12-month average of our monthly stock price prior to grant.
Expected option term was determined based on historical experienceunder our stock option plans.
Forfeiture rate assumption was determined based on historical dataof our stock option forfeitures.
Certain of the assumptions used above are based on management’sestimates. If factors change and require us to change our assumptionsand estimates, our stock-based compensation expense could be signif-icantly different in the future.
The fair value of certain stock-based awards that are subject toperformance metrics based on market conditions is determined usingthe Monte-Carlo simulation model, which utilizes multiple input variables,including expected volatility assumptions and other assumptions appro-priate for determining fair value to estimate the probability of satisfying themarket condition target stipulated in the award.
We have not capitalized costs associated with stock-basedcompensation.
Accounting for Income Taxes for Stock-based CompensationWe elected to use the short-cut method to calculate the historical pool ofwindfall tax benefits related to employee stock-based compensation
awards. In addition, we elected to follow the tax ordering laws to determinethe sequence in which deductions and net operating loss carryforwardsare utilized, as well as the direct-only approach to calculating the amountof windfall or shortfall tax benefits.
Restructuring and Severance CostsWe have severance pay plans that provide eligible employees with sev-erance payments in the event of an involuntary termination due to qual-ifying cost reduction actions. We calculate severance pay using theseverance benefit formula under the plans. Accordingly, we record pro-visions for such amounts and other related exit costs when they areprobable and estimable. In the absence of a plan or established localpractice for overseas jurisdictions, liabilities for severance and relatedcosts are recognized when incurred.
Litigation and Environmental MattersWe are currently involved in various lawsuits, claims, inquiries and otherregulatory and compliance matters, most of which are routine to the natureof our business. When it is probable that obligations have been incurredand where a range of the cost of compliance or remediation can beestimated, the best estimate within the range — or, if the most likelyamount cannot be determined, the low end of the range — is accrued.The ultimate resolution of these claims could affect future results ofoperations should our exposure be materially different from our estimatesor should liabilities be incurred that were not previously accrued.
Environmental expenditures are generally expensed. However, envi-ronmental expenditures for newly acquired assets and those which extendor improve the economic useful life of existing assets are capitalized andamortized over the remaining asset life. During each annual reportingperiod, we review our estimates of costs of compliance with environmentallaws related to remediation and cleanup of various sites, including sites inwhich governmental agencies have designated us a potentially respon-sible party. When it is probable that obligations have been incurred andwhere a range of the cost of compliance or remediation can be estimated,the best estimate within the range is accrued. When the best estimatewithin the range cannot be determined, the low end of the range isaccrued. Potential insurance reimbursements are not offset against poten-tial liabilities, and such liabilities are not discounted.
Asset Retirement ObligationsWe recognize liabilities for the fair value of conditional asset retirementobligations based on estimates determined through present value tech-niques. An asset retirement is ‘conditional’ when the timing and (or)method of settlement of the retirement obligation is conditioned upon afuture event that may or may not be within our control. Our asset retirementobligations primarily relate to lease restoration costs.
Business CombinationsWe record the assets acquired and liabilities assumed from acquiredbusinesses at fair value, and we make estimates and assumptions todetermine such fair values.
We utilize a variety of assumptions and estimates that are believed tobe reasonable in determining fair value for assets acquired and liabilitiesassumed. These assumptions and estimates include discounted cashflow analysis, growth rates, discount rates, current replacement cost forsimilar capacity for certain assets, market rate assumptions for certain
27 Avery Dennison Corporation2010 Annual Report
Management’s Discussion and Analysisof Results of Operations and Financial Condition
obligations and certain potential costs of compliance with environmentallaws related to remediation and cleanup of acquired properties. We alsoutilize information obtained from management of the acquired businessesand our own historical experience from previous acquisitions.
We apply significant assumptions and estimates in determining cer-tain intangible assets resulting from the acquisitions (such as customerrelationships, patents and other acquired technology, and trademarks andtrade names, as well as related applicable useful lives), property, plant andequipment, receivables, inventories, investments, tax accounts, environ-mental liabilities, stock option awards, lease commitments and restruc-turing and integration costs. Unanticipated events and circumstances mayoccur, which may affect the accuracy or validity of such assumptions,estimates or actual results. As such, decreases to fair value of assetsacquired and liabilities assumed (including cost estimates for certainobligations and liabilities) are recorded as an adjustment to goodwillindefinitely, whereas increases to estimates are recorded as an adjustmentto goodwill during the purchase price allocation period (generally withinone year of the acquisition date) and as operating expenses thereafter.
RECENT ACCOUNTING REQUIREMENTS
During 2010, we adopted certain accounting and financial disclosurerequirements of the Financial Accounting Standards Board (“FASB”), noneof which had a significant impact on our financial results of operations andfinancial position. Refer to Note 1, “Summary of Significant AccountingPolicies,” to the Consolidated Financial Statements for more information.
MARKET-SENSITIVE INSTRUMENTS AND RISK MANAGEMENT
Risk ManagementWe are exposed to the impact of changes in interest rates and foreigncurrency exchange rates.
Our policy is not to purchase or hold foreign currency, interest rate orcommodity contracts for trading purposes.
Our objective in managing the exposure to foreign currency changesis to reduce the risk to our earnings and cash flow associated with foreignexchange rate changes. As a result, we enter into foreign exchangeforward, option and swap contracts to reduce risks associated with thevalue of our existing foreign currency assets, liabilities, firm commitmentsand anticipated foreign revenues and costs, when available and appro-priate. The gains and losses on these contracts are intended to offsetchanges in the related exposures. We do not hedge our foreign currencyexposure in a manner that would entirely eliminate the effects of changes inforeign exchange rates on our consolidated net income.
Our objective in managing our exposure to interest rate changes is toreduce the impact of interest rate changes on earnings and cash flows. Toachieve our objectives, we may periodically use interest rate contracts tomanage the exposure to interest rate changes related to our borrowings.
Additionally, we enter into certain natural gas futures contracts toreduce the risks associated with anticipated domestic natural gas used inmanufacturing and operations. These amounts are not material to ourfinancial statements.
In the normal course of operations, we also face other risks that areeither non-financial or non-quantifiable. Such risks principally includechanges in economic or political conditions, other risks associated with
foreign operations, commodity price risk and litigation risk, which are notrepresented in the analyses that follow.
Foreign Exchange Value-At-RiskWe use a Value-At-Risk (“VAR”) model to determine the estimated max-imum potential one-day loss in earnings associated with our foreignexchange positions and contracts. This approach assumes that marketrates or prices for foreign exchange positions and contracts are normallydistributed. The VAR model estimates were made assuming normal mar-ket conditions. Firm commitments, accounts receivable and accountspayable denominated in foreign currencies, which certain of these instru-ments are intended to hedge, were included in the model. Forecastedtransactions, which certain of these instruments are intended to hedge,were excluded from the model.
In 2010, the VAR was estimated using a variance-covariance meth-odology. The currency correlation was based on one-year historical dataobtained from one of our domestic banks. The estimated maximumpotential one-day loss in earnings for our foreign exchange positionsand contracts was approximately $.8 million at year end 2010.
In 2009, the VAR was estimated using a variance-covariance meth-odology based on historical volatility for each currency. The volatility andcorrelation used in the calculation were based on two-year historical dataobtained from one of our domestic banks. The estimated maximumpotential one-day loss in earnings for our foreign exchange positionsand contracts was approximately $1 million at year end 2009.
In both 2010 and 2009, a 95% confidence level was used for aone-day time horizon.
The VAR model is a risk analysis tool and does not purport torepresent actual losses in fair value that could be incurred by us, nordoes it consider the potential effect of favorable changes in market factors.
Interest Rate SensitivityAn assumed 19 basis point move in interest rates affecting our variable-rate borrowings (10% of our weighted-average interest rate on floating ratedebt) would have had an estimated $1 million effect on our 2010 earnings.
An assumed 25 basis point move in interest rates affecting ourvariable-rate borrowings (10% of our weighted-average interest rate onfloating rate debt) would have had an estimated $3 million effect on our2009 earnings.
28Management’s Discussion and Analysisof Results of Operations and Financial Condition

(Dollars in millions) 2010 2009
AssetsCurrent assets:
Cash and cash equivalents $ 127.5 $ 138.1Trade accounts receivable, less allowances of $51.4 and $56.2 at end of year 2010 and 2009, respectively 996.1 918.6Inventories, net 519.9 477.3Current deferred and refundable income taxes 144.7 103.5Other current assets 163.7 95.7
Total current assets 1,951.9 1,733.2Property, plant and equipment, net 1,262.9 1,354.7Goodwill 940.8 950.8Other intangibles resulting from business acquisitions, net 228.9 262.2Non-current deferred and refundable income taxes 266.0 236.6Other assets 448.9 465.3
$5,099.4 $5,002.8
Liabilities and Shareholders’ EquityCurrent liabilities:
Short-term and current portion of long-term debt $ 381.0 $ 535.6Accounts payable 748.2 689.8Accrued payroll and employee benefits 259.7 216.0Accrued trade rebates 126.0 115.1Current deferred and payable income taxes 53.2 40.8Other accrued liabilities 263.7 270.4
Total current liabilities 1,831.8 1,867.7Long-term debt 956.2 1,088.7Long-term retirement benefits and other liabilities 541.1 556.0Non-current deferred and payable income taxes 124.6 127.8Commitments and contingencies (see Notes 7 and 8)Shareholders’ equity:
Common stock, $1 par value, authorized — 400,000,000 shares at end of year 2010 and 2009; issued —124,126,624 shares at end of year 2010 and 2009; outstanding — 105,391,940 shares and105,298,317 shares at end of year 2010 and 2009, respectively 124.1 124.1
Capital in excess of par value 768.0 722.9Retained earnings 1,727.9 1,499.7Employee stock benefit trust, 1,784,741 shares and 6,744,845 shares
at end of year 2010 and 2009, respectively (73.2) (243.1)Treasury stock at cost, 16,934,943 shares and 12,068,462 shares
at end of year 2010 and 2009, respectively (758.2) (595.8)Accumulated other comprehensive loss (142.9) (145.2)
Total shareholders’ equity 1,645.7 1,362.6
$5,099.4 $5,002.8
See Notes to Consolidated Financial Statements
29 Avery Dennison Corporation2010 Annual Report
Consolidated Balance Sheets

(In millions, except per share amounts) 2010 2009 2008
Net sales $6,512.7 $5,952.7 $6,710.4Cost of products sold 4,686.7 4,366.2 4,983.4
Gross profit 1,826.0 1,586.5 1,727.0Marketing, general and administrative expense 1,370.4 1,268.8 1,304.3Goodwill and indefinite-lived intangible asset impairment charges – 832.0 –Interest expense 76.6 85.3 115.9Other expense, net 27.7 191.3 36.2
Income (loss) before taxes 351.3 (790.9) 270.6Provision for (benefit from) income taxes 34.4 (44.2) 4.5
Net income (loss) $ 316.9 $ (746.7) $ 266.1
Per share amounts:Net income (loss) per common share $ 3.00 $ (7.21) $ 2.70
Net income (loss) per common share, assuming dilution $ 2.97 $ (7.21) $ 2.70
Dividends $ .80 $ 1.22 $ 1.64
Average shares outstanding:Common shares 105.8 103.6 98.4Common shares, assuming dilution 106.8 103.6 98.7
See Notes to Consolidated Financial Statements
30Consolidated Statements of Operations

(Dollars in millions, except per share amounts)
Commonstock, $1par value
Capital inexcess ofpar value
Retainedearnings
Cost ofunallocated
ESOPshares
Employeestock
benefittrust
Treasurystock
Accumulatedother
comprehensiveincome (loss) Total
Fiscal year ended 2007 $124.1 $ 781.1 $2,290.2 $(3.8) $(428.8) $(858.2) $ 84.8 $1,989.4Comprehensive income:
Net income 266.1 266.1Other comprehensive income (loss):
Foreign currency translation adjustment (177.3) (177.3)Effective portion of gains or losses on cash flow
hedges, net of tax of $(.6) 1.0 1.0Net actuarial loss, prior service cost and net
transition asset, net of tax of $(103.5) (191.0) (191.0)
Other comprehensive loss (367.3) (367.3)
Total comprehensive loss (101.2)Repurchase of 195,221 shares for treasury, net of
shares issued (9.5) (9.5)Stock issued under option plans, including $13.4 of
tax and dividends paid on stock held in stock trust 36.2 7.5 43.7Dividends: $1.64 per share (175.0) (175.0)ESOP transactions, net 2.6 2.6Employee stock benefit trust market value adjustment (174.4) 174.4 –
Fiscal year ended 2008 124.1 642.9 2,381.3 (1.2) (246.9) (867.7) (282.5) 1,750.0Comprehensive income:
Net loss (746.7) (746.7)Other comprehensive income (loss):
Foreign currency translation adjustment 103.4 103.4Effective portion of gains or losses on cash flow
hedges, net of tax of $2.9 4.8 4.8Net actuarial loss, prior service cost and net
transition asset, net of tax of $6.2 29.1 29.1
Other comprehensive income 137.3 137.3
Total comprehensive loss (609.4)Issuance of 6,459,088 shares for treasury in
conjunction with HiMEDS conversion 16.0 296.9 312.9Employee stock benefit trust transfer of
686,500 shares to treasury 25.0 (25.0) –Stock issued under option plans, including $8.2 of tax
and dividends paid on stock held in stock trust 28.1 14.7 42.8Dividends: $1.22 per share (134.9) (134.9)ESOP transactions, net 1.2 1.2Employee stock benefit trust market value adjustment 35.9 (35.9) –
Fiscal year ended 2009 124.1 722.9 1,499.7 – (243.1) (595.8) (145.2) 1,362.6Comprehensive income:
Net income 316.9 316.9Other comprehensive income:
Foreign currency translation adjustment 18.1 18.1Effective portion of gains or losses on cash flow
hedges, net of tax of $1.2 2.0 2.0Net actuarial loss, prior service cost and net
transition asset, net of tax of $(3.3) (17.8) (17.8)
Other comprehensive income 2.3 2.3
Total comprehensive income 319.2Issuance of 2,133,656 shares for treasury in
conjunction with HiMEDS remarketing 109.3 109.3Repurchase of 2,683,243 shares for treasury (108.7) (108.7)Employee stock benefit transfer of 4,316,894 shares to
treasury 163.0 (163.0) –Stock issued under stock option plans, including $4.4 of
tax and dividends paid on stock held in stock trust 29.8 22.2 52.0Dividends: $.80 per share (88.7) (88.7)Employee stock benefit trust market value adjustment 15.3 (15.3) –
Fiscal year ended 2010 $124.1 $ 768.0 $1,727.9 $ – $ (73.2) $(758.2) $(142.9) $1,645.7
See Notes to Consolidated Financial Statements
31 Avery Dennison Corporation2010 Annual Report
Consolidated Statements ofShareholders’ Equity

(In millions) 2010 2009 2008
Operating ActivitiesNet income (loss) $ 316.9 $ (746.7) $ 266.1Adjustments to reconcile net income (loss) to net cash provided by operating activities:
Depreciation 172.9 187.6 204.6Amortization 74.7 79.7 73.8Provision for doubtful accounts 16.3 19.3 17.7Goodwill and indefinite-lived intangible asset impairment charges – 832.0 –Asset impairment and net loss on sale and disposal of assets of $2.8, $9.4, and $6.5 in 2010, 2009,
and 2008, respectively 5.1 48.0 16.8Loss from debt extinguishments 4.0 21.2 –Stock-based compensation 35.2 25.8 29.0Other non-cash expense and loss 43.6 22.0 11.3Other non-cash income and gain (.5) (8.7) (12.4)
Changes in assets and liabilities and other adjustments, net of the effect of business acquisitions:Trade accounts receivable (87.6) 95.7 57.7Inventories (35.6) 133.3 16.5Other current assets (39.8) 40.6 (30.0)Accounts payable 76.5 (14.5) 3.4Accrued liabilities 30.0 (37.9) (19.2)Taxes on income (12.0) .3 34.3Deferred taxes (48.2) (91.0) (114.2)Other assets (12.2) 2.3 20.8Long-term retirement benefits and other liabilities (52.6) (40.0) (36.5)
Net cash provided by operating activities 486.7 569.0 539.7
Investing ActivitiesPurchase of property, plant and equipment, net (83.5) (69.7) (118.4)Purchase of software and other deferred charges (25.1) (30.6) (63.1)Payments for acquisitions – – (131.2)Proceeds from sale (purchase) of investments, net .8 (.5) 17.2Other – (5.0) 2.0
Net cash used in investing activities (107.8) (105.8) (293.5)
Financing ActivitiesNet decrease in borrowings (maturities of 90 days or less) (98.4) (192.3) (390.1)Additional borrowings (maturities longer than 90 days) 249.8 – 400.1Payments of debt (maturities longer than 90 days) (341.2) (108.3) (50.7)Dividends paid (88.7) (134.9) (175.0)Purchase of treasury stock (108.7) – (9.8)Proceeds from exercise of stock options, net 2.5 .6 2.7Other (6.8) 2.2 14.3
Net cash used in financing activities (391.5) (432.7) (208.5)
Effect of foreign currency translation on cash balances 2.0 2.1 (3.7)
(Decrease) increase in cash and cash equivalents (10.6) 32.6 34.0Cash and cash equivalents, beginning of year 138.1 105.5 71.5
Cash and cash equivalents, end of year $ 127.5 $ 138.1 $ 105.5
See Notes to Consolidated Financial Statements
32Consolidated Statements of Cash Flows

NOTE 1. SUMMARY OF SIGNIFICANT ACCOUNTING POLICIES
Nature of OperationsAvery Dennison Corporation (the “Company”) is an industry leader thatdevelops innovative identification and decorative solutions for businessesand consumers worldwide. The Company’s products include pressure-sensitive labeling technology and materials; graphics imaging media; retailbranding and information solutions; radio-frequency identification (“RFID”)inlays and tags; organization and identification products for offices andconsumers; specialty tapes; and a variety of specialized labels for auto-motive, industrial and durable goods applications.
Principles of ConsolidationThe consolidated financial statements include the accounts of majority-owned subsidiaries. Intercompany accounts, transactions and profits areeliminated in consolidation. Investments representing less than 20% own-ership are accounted for using the cost method of accounting.
Financial PresentationCertain prior year amounts have been reclassified to conform to thecurrent year presentation.
Segment ReportingThe Company has determined that it has three reportable segments forfinancial reporting purposes:
• Pressure-sensitive Materials — manufactures and sells pressure-sensitive labeling technology and materials, films for graphic andreflective applications, performance polymers (largely adhesivesused to manufacture pressure-sensitive materials), and extrudedfilms
• Retail Information Services — designs, manufactures and sells awide variety of branding and information products and services,including brand and price tickets, tags and labels, and related ser-vices, supplies and equipment
• Office and Consumer Products — manufactures and sells a variety ofoffice and consumer products, including labels, binders, dividers,sheet protectors, and writing instruments
Certain operating segments are aggregated or combined based onmateriality, quantitative factors, and similar qualitative economic charac-teristics, including primary products, production processes, customers,and distribution methods. Operating segments that do not exceed thequantitative thresholds or are not considered for aggregation are reportedin a category entitled “other specialty converting businesses,” which iscomprised of several businesses that produce specialty tapes and highlyengineered labels, including RFID inlays and labels and other convertedproducts.
In 2010, the Pressure-sensitive Materials segment contributedapproximately 56% of the Company’s total sales, while the Retail Infor-mation Services and Office and Consumer Products segments contrib-uted approximately 23% and 13%, respectively, of the Company’s totalsales. The other specialty converting businesses contributed the remain-ing 8% of the Company’s total sales. Of the Company’s total sales in 2010,international and domestic operations generated approximately 68% and32%, respectively. Refer to Note 12, “Segment Information,” for furtherinformation.
Fiscal YearNormally, each fiscal year consists of 52 weeks, but every fifth or sixth fiscalyear consists of 53 weeks. The Company’s 2010 and 2008 fiscal yearsconsisted of 52-week periods ending January 1, 2011 and December 27,2008, respectively. The Company’s 2009 fiscal year consisted of a53-week period ending January 2, 2010, with the extra week reflectedin the first quarter.
Use of EstimatesThe preparation of financial statements in conformity with accountingprinciples generally accepted in the United States of America, or GAAP,requires management to make estimates and assumptions for the report-ing period and as of the financial statement date. These estimates andassumptions affect the reported amounts of assets and liabilities, thedisclosure of contingent liabilities and the reported amounts of revenueand expense. Actual results could differ from these estimates.
Cash and Cash EquivalentsCash and cash equivalents consist of cash on hand, deposits in banks,and short-term investments with maturities of three months or less whenpurchased. The carrying value of these assets approximates fair value dueto the short maturity of the instruments. Cash paid for interest and incometaxes was as follows:
(In millions) 2010 2009 2008
Interest, net of capitalized amounts $ 69.7 $ 78.3 $ 114.6Income taxes, net of refunds 94.5 47.5 77.0
In 2010, 2009, and 2008, non-cash activities included accruals for capitalexpenditures of approximately $12 million, $8 million, and $5 million, respec-tively, due to the timing of payments. In 2010, the Company released approx-imately 4.3 million common shares, totaling $163 million, from the Company’sEmployee Stock Benefit Trust (“ESBT”), resulting from the settlement of theCompany’s employee benefit obligations. These shares were included as“Treasury Stock at Cost” in the Consolidated Balance Sheets.
Accounts ReceivableThe Company records trade accounts receivable at the invoiced amount.The allowance for doubtful accounts represents allowances for customertrade accounts receivable that are estimated to be partially or entirelyuncollectible. The customer complaint reserve represents estimated salesreturns and allowances. These allowances are used to reduce gross tradereceivables to their net realizable values. The Company records theseallowances based on estimates related to the following factors:
• Customer-specific allowances• Amounts based upon an aging schedule• An estimated amount, based on the Company’s historical experience
No single customer represented 10% or more of the Company’s netsales in, or trade accounts receivable at year end of, 2010 or 2009.However, during 2010, the ten largest customers by net sales represented12% of the Company’s net sales. As of January 1, 2011, the ten largestcustomers by trade accounts receivable represented 13% of theCompany’s trade accounts receivable. These customers were primarilyconcentrated in the Office and Consumer Products segment. The Com-pany does not generally require its customers to provide collateral.
33 Avery Dennison Corporation2010 Annual Report
Notes to Consolidated FinancialStatements

InventoriesInventories are stated at the lower-of-cost-or-market value and are cat-egorized as raw materials, work-in-progress or finished goods. Cost isdetermined using the first-in, first-out (“FIFO”) method. Inventory reservesare recorded for matters such as damaged, obsolete, excess and slow-moving inventory. The Company uses estimates to record these reserves.Slow-moving inventory is reviewed by category and may be partially or fullyreserved for depending on the type of product and the length of time theproduct has been included in inventory.
Inventories at end of year were as follows:
(In millions) 2010 2009
Raw materials $ 243.3 $ 217.9Work-in-progress 130.5 119.6Finished goods 205.3 205.2
Inventories at lower of cost or market(approximates replacement cost) 579.1 542.7
Inventory reserves (59.2) (65.4)
Inventories, net $ 519.9 $ 477.3
Property, Plant and EquipmentMajor classes of property, plant and equipment are stated at cost and wereas follows:
(In millions) 2010 2009
Land $ 65.1 $ 68.4Buildings and improvements 738.1 764.1Machinery and equipment 2,325.7 2,334.8Construction-in-progress 57.3 40.6
Property, plant and equipment 3,186.2 3,207.9Accumulated depreciation (1,923.3) (1,853.2)
Property, plant and equipment, net $ 1,262.9 $ 1,354.7
Depreciation is generally computed using the straight-line methodover the estimated useful lives of the assets ranging from two to forty-fiveyears for buildings and improvements and two to fifteen years for machin-ery and equipment. Leasehold improvements are depreciated over theshorter of the useful life of the asset or the term of the associated leases.Maintenance and repair costs are expensed as incurred; renewals andbetterments are capitalized. Upon the sale or retirement of assets, theaccounts are relieved of the cost and the related accumulated depreci-ation, with any resulting gain or loss included in net income. There were nosignificant capital lease assets at year end 2010 and 2009.
SoftwareThe Company capitalizes internal and external software costs that areincurred during the application development stage of the software devel-opment, including costs incurred for the design, coding, installation tohardware, testing, and upgrades and enhancements that provide addi-tional functionalities and capabilities to the software and hardware of thechosen path. Internal and external software costs during the preliminaryproject stage are expensed, as are those costs during the post-imple-mentation and/or operation stage, including internal and external trainingcosts and maintenance costs.
Capitalized software, which is included in “Other assets” in theConsolidated Balance Sheet, is amortized on a straight-line basis overthe estimated useful life of the software, ranging from two to ten years.Capitalized software costs were as follows:
(In millions) 2010 2009
Cost $ 381.7 $ 364.0Accumulated amortization (238.7) (214.1)
$ 143.0 $ 149.9
Impairment of Long-lived AssetsImpairment charges are recorded when the carrying amounts of long-livedassets are determined not to be recoverable. Impairment is measured byassessing the usefulness of an asset or by comparing the carrying value ofan asset to its fair value. Fair value is typically determined using quotedmarket prices, if available, or an estimate of undiscounted future cashflows expected to result from the use of the asset and its eventualdisposition. The key estimates applied when preparing cash flow projec-tions relate to revenues, gross margins, economic life of assets, over-heads, taxation and discount rates. The amount of impairment loss iscalculated as the excess of the carrying value over the fair value. Histor-ically, changes in market conditions and management strategy havecaused the Company to reassess the carrying amount of its long-livedassets.
Goodwill and Other Intangibles Resulting from BusinessAcquisitionsBusiness combinations are accounted for by the purchase method, andthe excess of the acquisition cost over the fair value of net tangible assetsand identified intangible assets acquired is considered goodwill. As aresult, the Company discloses goodwill separately from other intangibleassets. Other identifiable intangibles include customer relationships, pat-ents and other acquired technology, trade names and trademarks, andother intangibles.
The Company’s reporting units for the purpose of performing theimpairment tests for goodwill consist of roll materials; retail informationservices; office and consumer products; graphics and reflective products;industrial products; and business media. In performing the requiredimpairment tests, the Company primarily applies a present value (dis-counted cash flow) method to determine the fair value of the reporting unitswith goodwill. The Company performs its annual impairment test ofgoodwill during the fourth quarter.
Certain factors may result in the need to perform an impairment testprior to the fourth quarter, including significant underperformance of theCompany’s business relative to expected operating results, significantadverse economic and industry trends, significant decline in the Compa-ny’s market capitalization for an extended period of time relative to netbook value, or a decision to divest an individual business within a reportingunit.
The Company estimates the fair value of its reporting units usingvarious valuation techniques, with the primary technique being a dis-counted cash flow analysis. A discounted cash flow analysis requires theCompany to make various assumptions about sales, operating margins,growth rates and discount rates. Assumptions about discount rates arebased on a weighted-average cost of capital for comparable companies.Assumptions about sales, operating margins, and growth rates are based
34Notes to Consolidated Financial Statements

on the Company’s forecasts, business plans, economic projections,anticipated future cash flows and marketplace data. Assumptions arealso made for varying perpetual growth rates for periods beyond the long-term business plan period.
Goodwill impairment is determined using a two-step process. Thefirst step is to identify if a potential impairment exists by comparing the fairvalue of a reporting unit with its carrying amount, including goodwill. If thefair value of a reporting unit exceeds its carrying amount, goodwill of thereporting unit is not considered to have a potential impairment and thesecond step of the impairment is not necessary. However, if the carryingamount of a reporting unit exceeds its fair value, the second step isperformed to determine if goodwill is impaired and to measure the amountof impairment loss to recognize, if any.
The second step, if necessary, compares the implied fair value of goodwillwith the carrying amount of goodwill. If the implied fair value of goodwillexceeds the carrying amount, then goodwill is not considered impaired.However, if the carrying amount of goodwill exceeds the implied fair value,an impairment loss is recognized in an amount equal to that excess.
See also Note 3, “Goodwill and Other Intangibles Resulting fromBusiness Acquisitions.”
Foreign CurrencyAsset and liability accounts of international operations are translated intoU.S. dollars at current rates. Revenues and expenses are translated at theweighted-average currency rate for the fiscal year. Translation gains and lossesof subsidiaries operating in hyperinflationary economies, if any, are included innet income in the period incurred. Gains and losses resulting from hedging thevalue of investments in certain international operations and from translation ofbalance sheet accounts are recorded directly as a component of othercomprehensive income.
Gains and losses resulting from foreign currency transactions areincluded in income in the period incurred. Transactions in foreign curren-cies (including receivables, payables and loans denominated in currenciesother than the functional currency) decreased net income by $5.8 millionand $2.8 million in 2010 and 2009, respectively, and increased net incomeby $16.1 million in 2008. In 2008, transactions in foreign currenciesincluded a foreign currency net gain related to certain intercompanytransactions of approximately $9 million. These amounts exclude theeffects from translation of foreign currencies on the Company’s financialstatements.
The Company had no operations in hyperinflationary economies infiscal years 2010, 2009, and 2008.
Financial InstrumentsThe Company enters into certain foreign exchange hedge contracts toreduce its risk from exchange rate fluctuations associated with receiv-ables, payables, loans and firm commitments denominated in certainforeign currencies that arise primarily as a result of its operations outsidethe U.S. The Company enters into certain interest rate contracts to helpmanage its exposure to interest rate fluctuations. The Company alsoenters into certain natural gas and other commodity futures contractsto hedge price fluctuations for a portion of its anticipated domestic pur-chases. The maximum length of time for which the Company hedges itsexposure to the variability in future cash flows for forecasted transactions isgenerally 12 to 24 months.
On the date the Company enters into a derivative contract, it deter-mines whether the derivative will be designated as a hedge. Those
derivatives not designated as hedges are recorded on the balance sheetsat fair value, with changes in the fair value recognized in earnings. Thosederivatives designated as hedges are classified as either (1) a hedge of thefair value of a recognized asset or liability or an unrecognized firm com-mitment (a “fair value” hedge); or (2) a hedge of a forecasted transaction orthe variability of cash flows that are to be received or paid in connectionwith a recognized asset or liability (a “cash flow” hedge). The Companygenerally does not purchase or hold any foreign currency, interest rate orcommodity contracts for trading purposes.
The Company assesses, both at the inception of the hedge and on anongoing basis, whether hedges are highly effective. If it is determined that ahedge is not highly effective, the Company prospectively discontinueshedge accounting. For cash flow hedges, the effective portion of therelated gains and losses is recorded as a component of other compre-hensive income, and the ineffective portion is reported in earnings.Amounts in accumulated other comprehensive income (loss) are reclas-sified into earnings in the same period during which the hedged forecastedtransaction is consummated. In the event the anticipated transaction is nolonger likely to occur, the Company recognizes the change in fair value ofthe instrument in current period earnings. Changes in fair value hedges arerecognized in current period earnings. Changes in the fair value of under-lying hedged items (such as recognized assets or liabilities) are alsorecognized in current period earnings and offset the changes in the fairvalue of the derivative.
In the Statements of Cash Flows, hedge transactions are classified inthe same category as the item hedged, primarily in operating activities.
See also Note 5, “Financial Instruments.”
Fair Value MeasurementsThe Company defines fair value as the price that would be received fromselling an asset or paid to transfer a liability in an orderly transactionbetween market participants at the measurement date. When determiningthe fair value measurements for assets and liabilities which are required tobe recorded at fair value, the Company considers the principal or mostadvantageous market in which the Company would transact and themarket-based risk measurements or assumptions that market participantswould use in pricing the asset or liability.
The Company determines fair value based on a three-tier fair valuehierarchy, which it uses to prioritize the inputs used in measuring fair value.These tiers include: Level 1, defined as observable inputs such as quotedprices in active markets; Level 2, defined as inputs other than quotedprices in active markets that are either directly or indirectly observable; andLevel 3, defined as unobservable inputs in which little or no market dataexists, therefore requiring an entity to develop its own assumptions todetermine the best estimate of fair value.
Revenue RecognitionSales are recognized when persuasive evidence of an arrangement exists,pricing is determinable, delivery has occurred based on applicable salesterms, and collection is reasonably assured. Sales terms are generally freeon board (f.o.b.) shipping point or f.o.b. destination, depending upon localbusiness customs. For most regions in which the Company operates,f.o.b. shipping point terms are utilized and sales are recorded at the time ofshipment, because this is when title and risk of loss are transferred. Incertain regions, notably in Europe, f.o.b. destination terms are generallyutilized and sales are recorded when the products are delivered to thecustomer’s delivery site, because this is when title and risk of loss are
35 Avery Dennison Corporation2010 Annual Report
Notes to Consolidated Financial Statements
transferred. Furthermore, sales, provisions for estimated returns, and thecost of products sold are recorded at the time title transfers to customersand when the customers assume the risks and rewards of ownership.Actual product returns are charged against estimated sales returnallowances.
Sales rebates and discounts are common practice in the industries inwhich the Company operates. Volume, promotional, price, cash and otherdiscounts and customer incentives are accounted for as a reduction togross sales. Rebates and discounts are recorded based upon estimates atthe time products are sold. These estimates are based upon historicalexperience for similar programs and products. The Company reviews suchrebates and discounts on an ongoing basis and accruals for rebates anddiscounts are adjusted, if necessary, as additional information becomesavailable.
Advertising CostsAdvertising costs included in “Marketing, general and administrativeexpense” were approximately $39 million in 2010, $24 million in 2009,and $23 million in 2008. The Company’s policy is to expense advertisingcosts as incurred.
Research and DevelopmentResearch and development costs are related to research, design and testingof new products and applications and are expensed as incurred. Researchand development expense was $95.6 million in 2010, $90.7 million in 2009,and $94 million in 2008.
Pension and Postretirement BenefitsAssumptions used in determining projected benefit obligations and the fairvalue of plan assets for the Company’s pension plans and other postre-tirement benefit plans are evaluated by management in consultation withoutside actuaries. In the event that the Company determines that changesare warranted in the assumptions used, such as the discount rate,expected long-term rate of return, or health care costs, future pensionand postretirement benefit expenses could increase or decrease. Due tochanging market conditions or changes in the participant population, theactuarial assumptions that the Company uses may differ from actualresults, which could have a significant impact on the Company’s pensionand postretirement liability and related cost. Refer to Note 6, “Pension andOther Postretirement Benefits,” for further information on suchassumptions.
Product WarrantyThe Company provides for an estimate of costs that may be incurred underits basic limited warranty at the time product revenue is recognized. Thesecosts primarily include materials and labor associated with the service orsale of the product. Factors that affect the Company’s warranty liabilityinclude the number of units installed or sold, historical and anticipated rateof warranty claims on those units, cost per claim to satisfy the Company’swarranty obligation and availability of insurance coverage. Because thesefactors are impacted by actual experience and future expectations, theCompany assesses the adequacy of its recorded warranty liability andadjusts the amounts as necessary. The Company’s liability associated withproduct warranty was $1.7 million and $2 million at year end 2010 and2009, respectively.
Stock-Based CompensationThe Company’s stock-based compensation expense is the estimated fairvalue of options granted, amortized on a straight-line basis over therequisite service period. The fair value of the Company’s stock optionawards is estimated as of the date of grant using the Black-Scholesoption-pricing model. This model requires input assumptions for theCompany’s expected dividend yield, expected stock price volatility, risk-free interest rate and the expected option term.
The fair value of certain stock-based awards that are subject toperformance metrics based on market conditions is determined usingthe Monte-Carlo simulation model, which utilizes multiple input variables,including expected volatility assumptions and other assumptions appro-priate for determining fair value to estimate the probability of satisfying themarket condition target stipulated in the award.
The Company uses the short-cut method to calculate the historicalpool of windfall tax benefits related to employee stock-based compen-sation awards. In addition, the Company elected to follow the tax orderinglaws to determine the sequence in which deductions and net operatingloss carryforwards are utilized, as well as the direct-only approach tocalculating the amount of windfall or shortfall tax benefits.
See also Note 9, “Shareholders’ Equity and Stock-Based Compensation.”
Environmental ExpendituresEnvironmental expenditures are generally expensed. However, environ-mental expenditures for newly acquired assets and those which extend orimprove the economic useful life of existing assets are capitalized andamortized over the remaining asset life. During each annual reportingperiod, the Company reviews its estimates of costs of compliance withenvironmental laws related to remediation and cleanup of various sites,including sites in which governmental agencies have designated theCompany as a potentially responsible party. When it is probable thatobligations have been incurred and where a range of the cost of compli-ance or remediation can be estimated, the best estimate within the rangeis accrued. When the best estimate within the range cannot be deter-mined, the low end of the range is accrued. Potential insurance reim-bursements are not offset against potential liabilities, and such liabilities arenot discounted. Refer to Note 8, “Contingencies,” for further information.
Asset Retirement ObligationsThe Company recognizes a liability for the fair value of conditional assetretirement obligations based on estimates determined through presentvalue techniques. An asset retirement is ‘conditional’ when the timing and(or) method of settlement of the retirement obligation is conditional upon afuture event that may or may not be within the control of the Company. TheCompany’s asset retirement obligations primarily relate to lease restorationcosts. The Company’s estimated liability associated with asset retirementobligations was $8 million and $7.9 million at year end 2010 and 2009,respectively.
Restructuring and Severance CostsThe Company has severance pay plans that provide eligible employeeswith severance payments in the event of an involuntary termination due toqualifying cost reduction actions. Severance pay is calculated by using aseverance benefit formula under the plans. Accordingly, the provisions forsuch amounts and other related exit costs are recorded when they are
36Notes to Consolidated Financial Statements
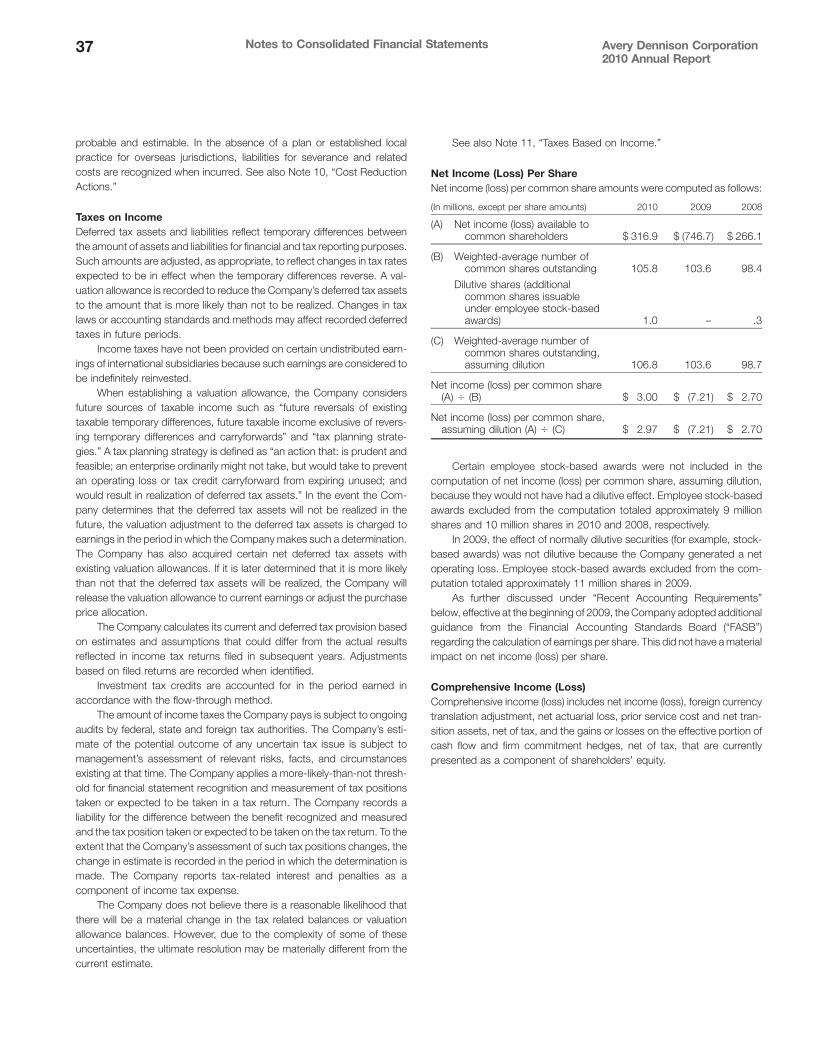
probable and estimable. In the absence of a plan or established localpractice for overseas jurisdictions, liabilities for severance and relatedcosts are recognized when incurred. See also Note 10, “Cost ReductionActions.”
Taxes on IncomeDeferred tax assets and liabilities reflect temporary differences betweenthe amount of assets and liabilities for financial and tax reporting purposes.Such amounts are adjusted, as appropriate, to reflect changes in tax ratesexpected to be in effect when the temporary differences reverse. A val-uation allowance is recorded to reduce the Company’s deferred tax assetsto the amount that is more likely than not to be realized. Changes in taxlaws or accounting standards and methods may affect recorded deferredtaxes in future periods.
Income taxes have not been provided on certain undistributed earn-ings of international subsidiaries because such earnings are considered tobe indefinitely reinvested.
When establishing a valuation allowance, the Company considersfuture sources of taxable income such as “future reversals of existingtaxable temporary differences, future taxable income exclusive of revers-ing temporary differences and carryforwards” and “tax planning strate-gies.” A tax planning strategy is defined as “an action that: is prudent andfeasible; an enterprise ordinarily might not take, but would take to preventan operating loss or tax credit carryforward from expiring unused; andwould result in realization of deferred tax assets.” In the event the Com-pany determines that the deferred tax assets will not be realized in thefuture, the valuation adjustment to the deferred tax assets is charged toearnings in the period in which the Company makes such a determination.The Company has also acquired certain net deferred tax assets withexisting valuation allowances. If it is later determined that it is more likelythan not that the deferred tax assets will be realized, the Company willrelease the valuation allowance to current earnings or adjust the purchaseprice allocation.
The Company calculates its current and deferred tax provision basedon estimates and assumptions that could differ from the actual resultsreflected in income tax returns filed in subsequent years. Adjustmentsbased on filed returns are recorded when identified.
Investment tax credits are accounted for in the period earned inaccordance with the flow-through method.
The amount of income taxes the Company pays is subject to ongoingaudits by federal, state and foreign tax authorities. The Company’s esti-mate of the potential outcome of any uncertain tax issue is subject tomanagement’s assessment of relevant risks, facts, and circumstancesexisting at that time. The Company applies a more-likely-than-not thresh-old for financial statement recognition and measurement of tax positionstaken or expected to be taken in a tax return. The Company records aliability for the difference between the benefit recognized and measuredand the tax position taken or expected to be taken on the tax return. To theextent that the Company’s assessment of such tax positions changes, thechange in estimate is recorded in the period in which the determination ismade. The Company reports tax-related interest and penalties as acomponent of income tax expense.
The Company does not believe there is a reasonable likelihood thatthere will be a material change in the tax related balances or valuationallowance balances. However, due to the complexity of some of theseuncertainties, the ultimate resolution may be materially different from thecurrent estimate.
See also Note 11, “Taxes Based on Income.”
Net Income (Loss) Per ShareNet income (loss) per common share amounts were computed as follows:
(In millions, except per share amounts) 2010 2009 2008
(A) Net income (loss) available tocommon shareholders $ 316.9 $ (746.7) $ 266.1
(B) Weighted-average number ofcommon shares outstanding 105.8 103.6 98.4
Dilutive shares (additionalcommon shares issuableunder employee stock-basedawards) 1.0 – .3
(C) Weighted-average number ofcommon shares outstanding,assuming dilution 106.8 103.6 98.7
Net income (loss) per common share(A) � (B) $ 3.00 $ (7.21) $ 2.70
Net income (loss) per common share,assuming dilution (A) � (C) $ 2.97 $ (7.21) $ 2.70
Certain employee stock-based awards were not included in thecomputation of net income (loss) per common share, assuming dilution,because they would not have had a dilutive effect. Employee stock-basedawards excluded from the computation totaled approximately 9 millionshares and 10 million shares in 2010 and 2008, respectively.
In 2009, the effect of normally dilutive securities (for example, stock-based awards) was not dilutive because the Company generated a netoperating loss. Employee stock-based awards excluded from the com-putation totaled approximately 11 million shares in 2009.
As further discussed under “Recent Accounting Requirements”below, effective at the beginning of 2009, the Company adopted additionalguidance from the Financial Accounting Standards Board (“FASB”)regarding the calculation of earnings per share. This did not have a materialimpact on net income (loss) per share.
Comprehensive Income (Loss)Comprehensive income (loss) includes net income (loss), foreign currencytranslation adjustment, net actuarial loss, prior service cost and net tran-sition assets, net of tax, and the gains or losses on the effective portion ofcash flow and firm commitment hedges, net of tax, that are currentlypresented as a component of shareholders’ equity.
37 Avery Dennison Corporation2010 Annual Report
Notes to Consolidated Financial Statements
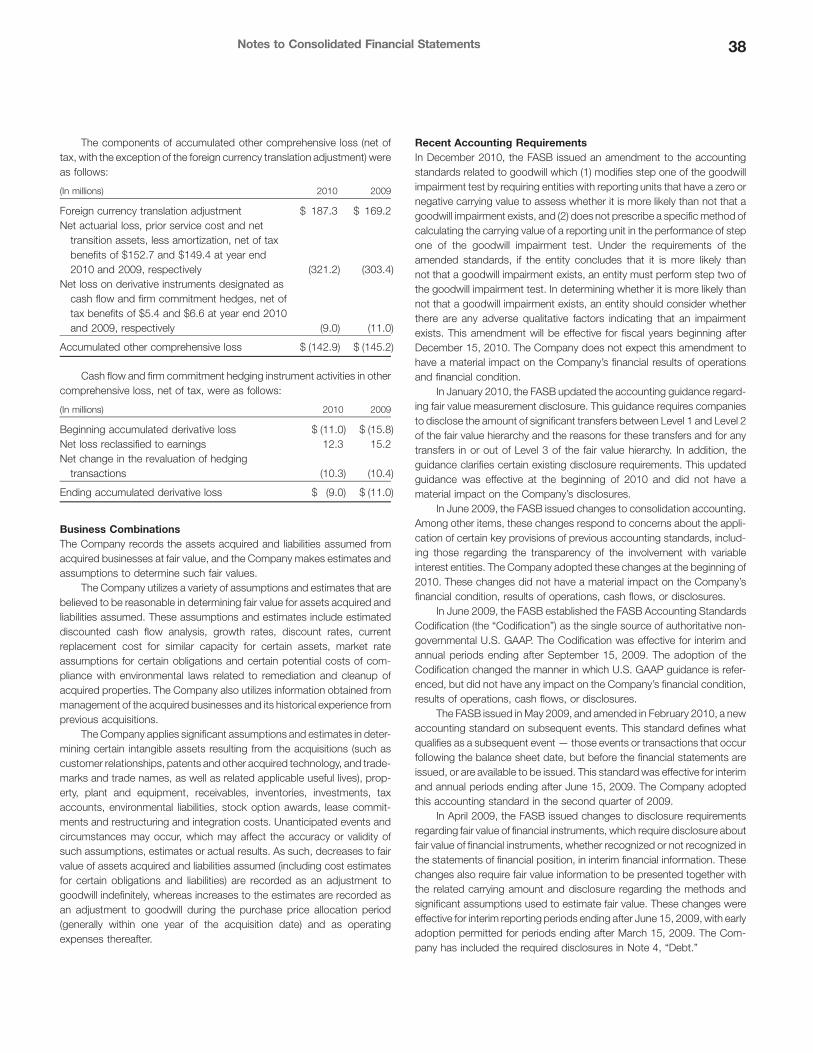
The components of accumulated other comprehensive loss (net oftax, with the exception of the foreign currency translation adjustment) wereas follows:
(In millions) 2010 2009
Foreign currency translation adjustment $ 187.3 $ 169.2Net actuarial loss, prior service cost and net
transition assets, less amortization, net of taxbenefits of $152.7 and $149.4 at year end2010 and 2009, respectively (321.2) (303.4)
Net loss on derivative instruments designated ascash flow and firm commitment hedges, net oftax benefits of $5.4 and $6.6 at year end 2010and 2009, respectively (9.0) (11.0)
Accumulated other comprehensive loss $ (142.9) $ (145.2)
Cash flow and firm commitment hedging instrument activities in othercomprehensive loss, net of tax, were as follows:
(In millions) 2010 2009
Beginning accumulated derivative loss $ (11.0) $ (15.8)Net loss reclassified to earnings 12.3 15.2Net change in the revaluation of hedging
transactions (10.3) (10.4)
Ending accumulated derivative loss $ (9.0) $ (11.0)
Business CombinationsThe Company records the assets acquired and liabilities assumed fromacquired businesses at fair value, and the Company makes estimates andassumptions to determine such fair values.
The Company utilizes a variety of assumptions and estimates that arebelieved to be reasonable in determining fair value for assets acquired andliabilities assumed. These assumptions and estimates include estimateddiscounted cash flow analysis, growth rates, discount rates, currentreplacement cost for similar capacity for certain assets, market rateassumptions for certain obligations and certain potential costs of com-pliance with environmental laws related to remediation and cleanup ofacquired properties. The Company also utilizes information obtained frommanagement of the acquired businesses and its historical experience fromprevious acquisitions.
The Company applies significant assumptions and estimates in deter-mining certain intangible assets resulting from the acquisitions (such ascustomer relationships, patents and other acquired technology, and trade-marks and trade names, as well as related applicable useful lives), prop-erty, plant and equipment, receivables, inventories, investments, taxaccounts, environmental liabilities, stock option awards, lease commit-ments and restructuring and integration costs. Unanticipated events andcircumstances may occur, which may affect the accuracy or validity ofsuch assumptions, estimates or actual results. As such, decreases to fairvalue of assets acquired and liabilities assumed (including cost estimatesfor certain obligations and liabilities) are recorded as an adjustment togoodwill indefinitely, whereas increases to the estimates are recorded asan adjustment to goodwill during the purchase price allocation period(generally within one year of the acquisition date) and as operatingexpenses thereafter.
Recent Accounting RequirementsIn December 2010, the FASB issued an amendment to the accountingstandards related to goodwill which (1) modifies step one of the goodwillimpairment test by requiring entities with reporting units that have a zero ornegative carrying value to assess whether it is more likely than not that agoodwill impairment exists, and (2) does not prescribe a specific method ofcalculating the carrying value of a reporting unit in the performance of stepone of the goodwill impairment test. Under the requirements of theamended standards, if the entity concludes that it is more likely thannot that a goodwill impairment exists, an entity must perform step two ofthe goodwill impairment test. In determining whether it is more likely thannot that a goodwill impairment exists, an entity should consider whetherthere are any adverse qualitative factors indicating that an impairmentexists. This amendment will be effective for fiscal years beginning afterDecember 15, 2010. The Company does not expect this amendment tohave a material impact on the Company’s financial results of operationsand financial condition.
In January 2010, the FASB updated the accounting guidance regard-ing fair value measurement disclosure. This guidance requires companiesto disclose the amount of significant transfers between Level 1 and Level 2of the fair value hierarchy and the reasons for these transfers and for anytransfers in or out of Level 3 of the fair value hierarchy. In addition, theguidance clarifies certain existing disclosure requirements. This updatedguidance was effective at the beginning of 2010 and did not have amaterial impact on the Company’s disclosures.
In June 2009, the FASB issued changes to consolidation accounting.Among other items, these changes respond to concerns about the appli-cation of certain key provisions of previous accounting standards, includ-ing those regarding the transparency of the involvement with variableinterest entities. The Company adopted these changes at the beginning of2010. These changes did not have a material impact on the Company’sfinancial condition, results of operations, cash flows, or disclosures.
In June 2009, the FASB established the FASB Accounting StandardsCodification (the “Codification”) as the single source of authoritative non-governmental U.S. GAAP. The Codification was effective for interim andannual periods ending after September 15, 2009. The adoption of theCodification changed the manner in which U.S. GAAP guidance is refer-enced, but did not have any impact on the Company’s financial condition,results of operations, cash flows, or disclosures.
The FASB issued in May 2009, and amended in February 2010, a newaccounting standard on subsequent events. This standard defines whatqualifies as a subsequent event — those events or transactions that occurfollowing the balance sheet date, but before the financial statements areissued, or are available to be issued. This standard was effective for interimand annual periods ending after June 15, 2009. The Company adoptedthis accounting standard in the second quarter of 2009.
In April 2009, the FASB issued changes to disclosure requirementsregarding fair value of financial instruments, which require disclosure aboutfair value of financial instruments, whether recognized or not recognized inthe statements of financial position, in interim financial information. Thesechanges also require fair value information to be presented together withthe related carrying amount and disclosure regarding the methods andsignificant assumptions used to estimate fair value. These changes wereeffective for interim reporting periods ending after June 15, 2009, with earlyadoption permitted for periods ending after March 15, 2009. The Com-pany has included the required disclosures in Note 4, “Debt.”
38Notes to Consolidated Financial Statements
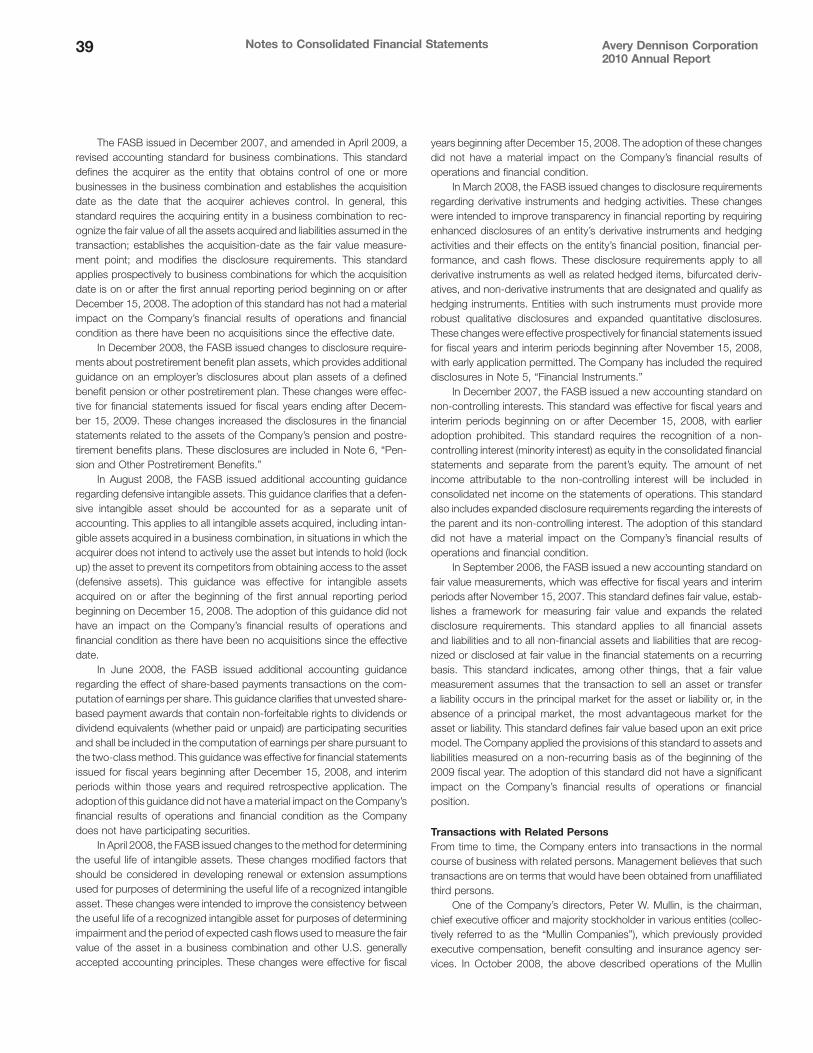
The FASB issued in December 2007, and amended in April 2009, arevised accounting standard for business combinations. This standarddefines the acquirer as the entity that obtains control of one or morebusinesses in the business combination and establishes the acquisitiondate as the date that the acquirer achieves control. In general, thisstandard requires the acquiring entity in a business combination to rec-ognize the fair value of all the assets acquired and liabilities assumed in thetransaction; establishes the acquisition-date as the fair value measure-ment point; and modifies the disclosure requirements. This standardapplies prospectively to business combinations for which the acquisitiondate is on or after the first annual reporting period beginning on or afterDecember 15, 2008. The adoption of this standard has not had a materialimpact on the Company’s financial results of operations and financialcondition as there have been no acquisitions since the effective date.
In December 2008, the FASB issued changes to disclosure require-ments about postretirement benefit plan assets, which provides additionalguidance on an employer’s disclosures about plan assets of a definedbenefit pension or other postretirement plan. These changes were effec-tive for financial statements issued for fiscal years ending after Decem-ber 15, 2009. These changes increased the disclosures in the financialstatements related to the assets of the Company’s pension and postre-tirement benefits plans. These disclosures are included in Note 6, “Pen-sion and Other Postretirement Benefits.”
In August 2008, the FASB issued additional accounting guidanceregarding defensive intangible assets. This guidance clarifies that a defen-sive intangible asset should be accounted for as a separate unit ofaccounting. This applies to all intangible assets acquired, including intan-gible assets acquired in a business combination, in situations in which theacquirer does not intend to actively use the asset but intends to hold (lockup) the asset to prevent its competitors from obtaining access to the asset(defensive assets). This guidance was effective for intangible assetsacquired on or after the beginning of the first annual reporting periodbeginning on December 15, 2008. The adoption of this guidance did nothave an impact on the Company’s financial results of operations andfinancial condition as there have been no acquisitions since the effectivedate.
In June 2008, the FASB issued additional accounting guidanceregarding the effect of share-based payments transactions on the com-putation of earnings per share. This guidance clarifies that unvested share-based payment awards that contain non-forfeitable rights to dividends ordividend equivalents (whether paid or unpaid) are participating securitiesand shall be included in the computation of earnings per share pursuant tothe two-class method. This guidance was effective for financial statementsissued for fiscal years beginning after December 15, 2008, and interimperiods within those years and required retrospective application. Theadoption of this guidance did not have a material impact on the Company’sfinancial results of operations and financial condition as the Companydoes not have participating securities.
In April 2008, the FASB issued changes to the method for determiningthe useful life of intangible assets. These changes modified factors thatshould be considered in developing renewal or extension assumptionsused for purposes of determining the useful life of a recognized intangibleasset. These changes were intended to improve the consistency betweenthe useful life of a recognized intangible asset for purposes of determiningimpairment and the period of expected cash flows used to measure the fairvalue of the asset in a business combination and other U.S. generallyaccepted accounting principles. These changes were effective for fiscal
years beginning after December 15, 2008. The adoption of these changesdid not have a material impact on the Company’s financial results ofoperations and financial condition.
In March 2008, the FASB issued changes to disclosure requirementsregarding derivative instruments and hedging activities. These changeswere intended to improve transparency in financial reporting by requiringenhanced disclosures of an entity’s derivative instruments and hedgingactivities and their effects on the entity’s financial position, financial per-formance, and cash flows. These disclosure requirements apply to allderivative instruments as well as related hedged items, bifurcated deriv-atives, and non-derivative instruments that are designated and qualify ashedging instruments. Entities with such instruments must provide morerobust qualitative disclosures and expanded quantitative disclosures.These changes were effective prospectively for financial statements issuedfor fiscal years and interim periods beginning after November 15, 2008,with early application permitted. The Company has included the requireddisclosures in Note 5, “Financial Instruments.”
In December 2007, the FASB issued a new accounting standard onnon-controlling interests. This standard was effective for fiscal years andinterim periods beginning on or after December 15, 2008, with earlieradoption prohibited. This standard requires the recognition of a non-controlling interest (minority interest) as equity in the consolidated financialstatements and separate from the parent’s equity. The amount of netincome attributable to the non-controlling interest will be included inconsolidated net income on the statements of operations. This standardalso includes expanded disclosure requirements regarding the interests ofthe parent and its non-controlling interest. The adoption of this standarddid not have a material impact on the Company’s financial results ofoperations and financial condition.
In September 2006, the FASB issued a new accounting standard onfair value measurements, which was effective for fiscal years and interimperiods after November 15, 2007. This standard defines fair value, estab-lishes a framework for measuring fair value and expands the relateddisclosure requirements. This standard applies to all financial assetsand liabilities and to all non-financial assets and liabilities that are recog-nized or disclosed at fair value in the financial statements on a recurringbasis. This standard indicates, among other things, that a fair valuemeasurement assumes that the transaction to sell an asset or transfera liability occurs in the principal market for the asset or liability or, in theabsence of a principal market, the most advantageous market for theasset or liability. This standard defines fair value based upon an exit pricemodel. The Company applied the provisions of this standard to assets andliabilities measured on a non-recurring basis as of the beginning of the2009 fiscal year. The adoption of this standard did not have a significantimpact on the Company’s financial results of operations or financialposition.
Transactions with Related PersonsFrom time to time, the Company enters into transactions in the normalcourse of business with related persons. Management believes that suchtransactions are on terms that would have been obtained from unaffiliatedthird persons.
One of the Company’s directors, Peter W. Mullin, is the chairman,chief executive officer and majority stockholder in various entities (collec-tively referred to as the “Mullin Companies”), which previously providedexecutive compensation, benefit consulting and insurance agency ser-vices. In October 2008, the above described operations of the Mullin
39 Avery Dennison Corporation2010 Annual Report
Notes to Consolidated Financial Statements

Companies were sold to a subsidiary of Prudential Financial, Inc. (“Pru-dential”). During 2010, the Company paid premiums to insurance carriersfor life insurance originally placed by the Mullin Companies in connectionwith various Company employee benefit plans (however, the interests ofthe Mullin Companies in this insurance were sold to Prudential in October2008). Prudential has advised the Company that it earned commissionsfrom such insurance carriers in an aggregate amount of approximately$.4 million, $.4 million, and $.6 million in 2010, 2009, and 2008, respec-tively, for the placement and renewal of this insurance, in which Mr. Mullinhad an interest of approximately $.09 million, $.09 million, and $.3 million in2010, 2009, and 2008, respectively. Mr. Mullin’s interest in the 2010 and2009 commissions was determined in accordance with the terms of acommission sharing agreement entered into between Mr. Mullin andPrudential at the time of the sale.
The Mullin Companies own a minority interest in M Financial Holdings,Inc. (“MFH”). Substantially all of the life insurance policies, which theCompany originally placed through the Mullin Companies, are issuedby insurance carriers that participate in reinsurance agreements enteredinto between these insurance carriers and M Life Insurance Company (“MLife”), a wholly-owned subsidiary of MFH. Reinsurance returns earned byM Life are determined annually by the insurance carriers and can be
negative or positive, depending upon the results of M Life’s aggregatereinsurance pool, which consists of the insured lives reinsured by M Life.The Mullin Companies have advised that in 2010, 2009 and 2008 theyparticipated in net reinsurance gains (without risk of forfeiture) of M Life, ofwhich approximately $.2 million, none and $.2 million, respectively, of suchgains were ascribed by M Life to the Company’s life insurance policiesreferred to above, and in which gains Mr. Mullin had an interest ofapproximately $.1 million, none and $.1 million, respectively. In addition,the Mullin Companies have advised that in 2010, 2009 and 2008, they alsoparticipated in net reinsurance gains of M Life that are subject to risk offorfeiture, of which approximately $.03 million, none and $.05 million,respectively, of such gains were ascribed by M Life to the Company’s lifeinsurance policies, and in which gains Mr. Mullin had an interest ofapproximately $.02 million, none and $.04 million, respectively.
NOTE 2. ACQUISITIONS
On April 1, 2008, the Company acquired DM Label Group (“DM Label”).DM Label operations are included in the Company’s Retail InformationServices segment.
NOTE 3. GOODWILL AND OTHER INTANGIBLES RESULTING FROM BUSINESS ACQUISITIONS
Results from the Company’s annual impairment test in the fourth quarter of2010 indicated that no impairment had occurred in 2010.
In connection with the preparation of its first quarter 2009 financialstatements, the Company determined that there was a need to initiate aninterim impairment test of goodwill and indefinite-lived intangible assets(“goodwill impairment”). The factors considered included both a sustaineddecline in the Company’s stock price and a decline in the Company’s 2009revenue projections for the retail information services reporting unit, fol-lowing lower than expected revenues in March 2009, which continued inApril 2009. The peak season for the retail information services reportingunit has traditionally been March through the end of the second quarter.
The Company’s interim impairment analysis indicated that the fairvalue of each of the Company’s reporting units exceeded its carrying value,except for the Company’s retail information services reporting unit, whichhad a fair value less than its carrying value. In evaluating the fair value of theretail information services reporting unit, the Company assumed furtherdeclines in revenue for 2009 from 2008, reflecting continued and furtherweakness in the retail apparel market. The Company then assumed thatrevenues by 2012 would increase to levels comparable with 2007 (includ-ing estimated sales for Paxar Corporation (“Paxar”), a business acquired in
2007, and DM Label, adjusted for foreign currency translation). TheCompany also assumed a discount rate of 14.5% reflecting the increaseduncertainty of global economic conditions in the first three months of 2009.
In the first quarter of 2009, the Company recorded non-cash impair-ment charges of $832 million for the retail information services reportingunit, of which $820 million was related to goodwill and $12 million wasrelated to indefinite-lived intangible assets. The Company completed itsinterim goodwill impairment test in the second quarter of 2009, with noadditional impairment charge recorded thereafter. Results from the Com-pany’s annual impairment test in the fourth quarter of 2009 indicated thatno further impairment had occurred.
The primary factors contributing to the $832 million of non-cashimpairment charges relative to the Company’s goodwill impairment testin the fourth quarter of 2008 were the assumed increase in the discountrate, the reduced assumptions for revenue growth through 2013, and theassociated cash flow impact from these reduced projections. The changein these factors reflected worsening economic projections and marketconditions.
40Notes to Consolidated Financial Statements

GoodwillChanges in the net carrying amount of goodwill from operations for 2010 and 2009, by reportable segment, were as follows:
(In millions)
Pressure-sensitiveMaterials
RetailInformation
Services
Office andConsumer
Products
Otherspecialty
convertingbusinesses Total
Balance as of December 27, 2008 $ 334.4 $ 1,211.6 $ 167.2 $ 3.5 $ 1,716.7Acquisition adjustments(1) – 30.9 – – 30.9Goodwill impairment charges(2) – (820.0) – – (820.0)Translation adjustments 17.0 .3 5.8 .1 23.2
Balance as of January 2, 2010 351.4 422.8 173.0 3.6 950.8
Goodwill 351.4 1,242.8 173.0 3.6 1,770.8Accumulated impairment losses – (820.0) – – (820.0)
Balance as of January 2, 2010 351.4 422.8 173.0 3.6 950.8Acquisitions – .7 – – .7Translation adjustments (5.4) (.3) (4.9) (.1) (10.7)
Balance as of January 1, 2011 346.0 423.2 168.1 3.5 940.8
Goodwill 346.0 1,243.2 168.1 3.5 1,760.8Accumulated impairment losses – (820.0) – – (820.0)
Balance as of January 1, 2011 $ 346.0 $ 423.2 $ 168.1 $ 3.5 $ 940.8
(1) Acquisition adjustments in 2009 consisted of opening balance sheet adjustments associated with the DM Label acquisition in April 2008 of $32.6 and other acquisition adjustments of $(1.7).
(2) As part of the interim goodwill impairment test completed in the second quarter of 2009, the Company recorded a non-cash impairment charge of $820 for the retail information services reporting unit in thefirst quarter of 2009, with no additional impairment charge recorded thereafter.
Indefinite-Lived Intangible AssetsIn connection with the acquisition of Paxar, the Company acquired approximately $30 million of indefinite-lived intangible assets, consisting of certain tradenames and trademarks, which are not subject to amortization because they have an indefinite useful life. In the first quarter of 2009, the Company recordeda non-cash impairment charge of $12 million related to these indefinite-lived intangible assets, with no additional impairment charge recorded thereafter. AtJanuary 1, 2011, the carrying value of these indefinite-lived intangible assets was $18 million. At January 2, 2010, the carrying value of these indefinite-livedintangible assets was $17.9 million, which included $.1 million of negative currency impact.
Finite-Lived Intangible AssetsThe following table sets forth the Company’s finite-lived intangible assets resulting from business acquisitions at January 1, 2011 and January 2, 2010,which continue to be amortized:
(In millions)
GrossCarryingAmount
AccumulatedAmortization
NetCarryingAmount
GrossCarryingAmount
AccumulatedAmortization
NetCarryingAmount
2010 2009
Customer relationships $ 291.9 $ 119.2 $ 172.7 $ 295.0 $ 94.8 $ 200.2Patents and other acquired technology 53.6 28.1 25.5 53.6 23.5 30.1Trade names and trademarks 44.8 38.0 6.8 47.0 39.8 7.2Other intangibles 14.4 8.5 5.9 13.9 7.1 6.8
Total $ 404.7 $ 193.8 $ 210.9 $ 409.5 $ 165.2 $ 244.3
Amortization expense on finite-lived intangible assets resulting from business acquisitions was $32.9 million for 2010, $33.5 million for 2009, and$32.8 million for 2008. The estimated amortization expense for finite-lived intangible assets resulting from completed business acquisitions for each of thenext five fiscal years is expected to be approximately $33 million in 2011, $33 million in 2012, $31 million in 2013, $28 million in 2014, and $24 million in2015.
41 Avery Dennison Corporation2010 Annual Report
Notes to Consolidated Financial Statements

As of January 1, 2011, the weighted-average amortization periods from the date of acquisition and weighted-average remaining useful lives of finite-lived intangible assets were as follows:
(In years)
Weighted-averageamortization periods
from the date ofacquisition
Weighted-averageremaininguseful life
Customer relationships 13 8Patents and other acquired technology 13 6Trade names and trademarks 12 5Other intangibles 7 3
NOTE 4. DEBT
Short-term variable rate domestic borrowings from commercial paperissuances were approximately $298 million (weighted-average interestrate of .4%) at January 1, 2011 and approximately $415 million (weighted-average interest rate of .2%) at January 2, 2010.
The Company had $81.8 million (weighted-average interest rate of10.6%) and $60.1 million (weighted-average interest rate of 12.8%) ofborrowings outstanding under foreign short-term lines of credit at Janu-ary 1, 2011 and January 2, 2010, respectively.
Uncommitted lines of credit were approximately $407 million atJanuary 1, 2011 and may be cancelled at any time by the Company orthe banks.
Available short-term financing arrangements totaled $1.03 billion atJanuary 1, 2011.
Commitment fees related to the Company’s committed lines of creditin 2010, 2009, and 2008 were $2.6 million, $2.3 million, and $.8 million,respectively.
Long-term debt and its respective weighted-average interest rates atJanuary 1, 2011 consisted of the following:
(In millions) 2010 2009
Medium-term notes:Series 1995 at 7.5% — due 2015 through 2025 $ 50.0 $ 50.0
Long-term notes:Bank term loan – 340.0Senior notes due 2013 at 4.8% 250.0 250.0Senior notes due 2017 at 6.6% 249.2 249.0HiMEDS Senior notes – 109.4Senior notes due 2020 at 5.4% 249.8 –Senior notes due 2033 at 6.0% 150.0 150.0Other long-term borrowings 8.4 .8Less amount classified as current (1.2) (60.5)
Total long-term debt $ 956.2 $ 1,088.7
The Company’s medium-term notes have maturities from 2015through 2025 and accrue interest at various fixed rates.
Maturities of long-term debt during the years 2011 through 2015 are$1.2 million (classified as current), $2.3 million, $252 million, $1.6 millionand $5.6 million, respectively, with $694.7 million maturing in 2016 andthereafter.
In March 2009, the Company completed an exchange of approxi-mately 6.6 million units (or 75.15%) of its HiMEDS units. The Companyissued approximately 6.5 million shares of its common stock and paidapproximately $43 million in cash for the exchanged HiMEDS units with a
carrying value of approximately $331 million. As a result of this exchange,the Company recorded a debt extinguishment loss of approximately$21 million (included in “Other expense, net” in the Consolidated State-ments of Operations) in the first quarter of 2009, which included a write-offof $9.6 million related to unamortized debt issuance costs. In November2010, the Company completed the remarketing of its remaining HiMEDSsenior notes in accordance with the original terms of the HiMEDS units bypurchasing approximately $109 million of these senior notes. In aggregate,this remarketing resulted in the extinguishment of approximately $109 mil-lion of senior notes and the issuance of approximately 2.1 million shares ofthe Company’s common stock. As a result of this remarketing, the Com-pany recorded a debt extinguishment loss of $2.8 million (included in“Other expense, net” in the Consolidated Statements of Operations),which consisted of a write-off related to unamortized debt issuance costs.
In January 2009, the Company entered into an amendment to a creditagreement for a $1 billion revolving credit facility (the “Revolver”) withcertain domestic and foreign banks, maturing August 10, 2012. Theamendment increased the Company’s flexibility for a specified period oftime in complying with the financial covenants to which the Revolver issubject and excluded certain restructuring charges from the calculation ofthe financial ratios under those covenants. Additionally, the amendmentincreased the annual interest rate of the Revolver and provided for anincrease in the facility fee payable under the Revolver. Financing availableunder the Revolver was used as a commercial paper back-up facility andto finance other corporate requirements.
In January 2009, a wholly-owned subsidiary of the Company enteredinto an amendment to a credit agreement for a $400 million term loancredit facility (“Credit Facility”) with certain domestic and foreign banks.The subsidiary’s payment and performance under the agreement wereguaranteed by the Company. Financing available under the Credit Facilitywas permitted to be used for working capital and other general corporatepurposes. The amendment increased the Company’s flexibility for a spec-ified period of time in complying with the financial covenants to which theCredit Facility is subject and excluded certain restructuring charges fromthe calculation of the financial ratios under those covenants. The amend-ment also increased the annual interest rate of the Credit Facility. In April2010, the Company issued $250 million of senior notes bearing an interestrate of 5.375% per year, due April 2020. Approximately $248 million inproceeds from the offering, net of underwriting discounts and offeringexpenses, were used, together with commercial paper borrowings, torepay the $325 million in indebtedness outstanding under the CreditFacility in May 2010. In the second quarter of 2010, the Companyrecorded a debt extinguishment loss of $1.2 million related to unamortizeddebt issuance costs from the Credit Facility.
42Notes to Consolidated Financial Statements

As of January 1, 2011, the Company was in compliance with itsfinancial covenants.
The Company’s total interest costs in 2010, 2009 and 2008 were$80.6 million, $89.5 million and $122.1 million, respectively, of which$4 million, $4.2 million and $6.2 million, respectively, were capitalizedas part of the cost of assets.
The fair value of the Company’s long-term debt is estimated primarilybased on the credit spread above U.S. Treasury securities on comparablenotes with similar rates, credit rating, and remaining maturities. The fairvalue of the Company’s total debt, including short-term borrowings, was$1.39 billion at January 1, 2011 and $1.60 billion at January 2, 2010. Fairvalue amounts were determined primarily based on Level 2 inputs. Refer toNote 1, “Summary of Significant Accounting Policies.”
The Company had standby letters of credit with an aggregate con-tract amount of outstanding totaling $41.1 million and $52.5 million atJanuary 1, 2011 and January 2, 2010, respectively. The aggregate con-tract amount of outstanding standby letters of credit approximated fairvalue.
NOTE 5. FINANCIAL INSTRUMENTS
As of January 1, 2011, the U.S. dollar equivalent notional values of theCompany’s outstanding commodity contracts and foreign exchange con-tracts were approximately $6.9 million and $1.18 billion, respectively.
The Company recognizes all derivative instruments as either assets orliabilities at fair value in the statements of financial position. The Companydesignates commodity forward contracts on forecasted purchases ofcommodities and foreign currency contracts on forecasted transactionsas cash flow hedges and foreign currency contracts on existing balancesheet items as fair value hedges.
In April 2010, the Company entered into a contract to lock in theTreasury rate component of the interest rate on its $250 million debtissuance, which is discussed in Note 4, “Debt.” On April 9, 2010, thecontract settled at a loss of $.3 million, which is being amortized intointerest expense over the term of the related debt.
The following table provides the balances and locations of derivatives as of January 1, 2011:
(In millions) Balance Sheet Location Fair Value Balance Sheet Location Fair Value
Asset Liability
Foreign exchange contracts Other current assets $16.8 Other current liabilities $ 7.9Commodity contracts Other current assets .1 Other current liabilities 2.4
$16.9 $10.3
The following table provides the balances and locations of derivatives as of January 2, 2010:
(In millions) Balance Sheet Location Fair Value Balance Sheet Location Fair Value
Asset Liability
Foreign exchange contracts Other current assets $5.0 Other current liabilities $ 6.5Commodity contracts Other current assets .5 Other current liabilities 3.5
$5.5 $10.0
Fair Value HedgesFor derivative instruments that are designated and qualify as a fair valuehedge, the gain or loss on the derivative, as well as the offsetting loss orgain on the hedged item attributable to the hedged risk, are recognized incurrent earnings, resulting in no net material impact to income.
The following table provides the components of the gain (loss) rec-ognized in income related to fair value hedging contracts. The corre-sponding gains or losses on the underlying hedged items approximatedthe net gain on these fair value hedging contracts.
(In millions) Location of Gain (Loss) in Income 2010 2009
Foreign exchangecontracts Cost of products sold $ (3.4) $ (2.8)
Foreign exchangecontracts
Marketing, general andadministrative expense 40.2 15.3
$ 36.8 $ 12.5
Cash Flow HedgesFor derivative instruments that are designated and qualify as a cash flowhedge, the effective portion of the gain or loss on the derivative is reportedas a component of other comprehensive income (loss) and reclassified into
earnings in the same period or periods during which the hedged trans-action affects earnings. Gains and losses on the derivative representingeither hedge ineffectiveness or hedge components excluded from theassessment of effectiveness are recognized in current earnings.
The following table provides the components of the loss recognized inaccumulated other comprehensive loss on derivatives (effective portion)related to cash flow hedging contracts:
(In millions) 2010 2009
Interest rate contracts $ (.3) $ –Foreign exchange contracts (6.0) (7.7)Commodity contracts (4.0) (2.7)
$ (10.3) $ (10.4)
43 Avery Dennison Corporation2010 Annual Report
Notes to Consolidated Financial Statements

The following table provides the components of the loss reclassifiedfrom accumulated other comprehensive loss (effective portion) related tocash flow hedging contracts:
(In millions) Location of Loss in Income 2010 2009
Interest rate contracts Interest expense $ (4.8) $ (6.9)Foreign exchange
contracts Cost of products sold (2.9) (2.5)Commodity contracts Cost of products sold (4.6) (5.8)
$ (12.3) $ (15.2)
The amount of gain or loss recognized in income related to theineffective portion of, and the amounts excluded from, effectivenesstesting for cash flow hedges and derivatives not designated as hedginginstruments was not significant in 2010 and 2009.
As of January 1, 2011, a net loss of approximately $8 million isexpected to be reclassified from accumulated other comprehensive lossto earnings within the next 12 months.
NOTE 6. PENSION AND OTHER POSTRETIREMENT BENEFITS
Defined Benefit PlansThe Company sponsors a number of defined benefit plans coveringeligible U.S. employees and employees in certain other countries. TheCompany makes contributions that are sufficient to meet the minimumfunding requirements of applicable laws and regulations, plus additionalamounts, if any, that management determines to be appropriate, to theseplans. Benefits payable to employees are based primarily on years ofservice and employees’ pay during their employment with the Company.Certain benefits provided by one of the Company’s U.S. defined benefitplans may be paid, in part, from an employee stock ownership plan. Whilethe Company has not expressed any intent to terminate these plans, theCompany may do so at any time, subject to applicable laws andregulations.
The Company is also obligated to pay unfunded termination indem-nity benefits to certain employees outside of the U.S. These benefits aresubject to applicable agreements, local laws and regulations. The Com-pany has not incurred significant costs related to performance under thesetypes of arrangements and the associated liability is not included in thedisclosures below.
The Company’s U.S. defined benefit pension plans and early retireemedical plan were closed to employees hired after December 31, 2008.Employees who participated in these plans before December 31, 2008continued to participate and accrue pension benefits after satisfying theeligibility requirements of these plans.
Effective December 31, 2010, benefits for three of the Company’sU.S. defined benefit plans — the Avery Dennison Pension Plan (“ADPP”),the Benefit Restoration Plan (“BRP”), and the Supplemental ExecutiveRetirement Plan (“SERP”) — were frozen. Benefits under these plansstopped accruing; however, pension benefits accrued throughDecember 31, 2010 were preserved and will be paid out (for employeesfully vested at the time of retirement or other qualified event) under theterms of their respective plans. As a result of freezing the ADPP and BRP,the Company recognized a curtailment loss of $2.4 million in 2010,recorded in “Other expense, net” in the Consolidated Statements ofOperations. No curtailment gain or loss was recognized from freezing
the SERP, as future service continues to impact the plan’s benefits and thedetermination of the value is not known until retirement of the participants.In connection with the freezing of the SERP, the Company granted anaggregate of approximately .2 million of stock options to the active SERPparticipants, which resulted in approximately $2.2 million of pretax stock-based compensation expense in the fourth quarter of 2010. This expensereflected the immediate recognition of compensation cost associated withthose stock options granted to employees who are retirement eligible, asdefined in the Company’s stock option and incentive plan. Refer to Note 9,“Shareholders’ Equity and Stock-based Compensation.”
Additionally, settlement events in Canada, Belgium, and Korearesulted in the Company’s recognition of a $2.3 million settlement lossin 2010.
Plan AssetsAssets of the Company’s U.S. defined benefit pension plans are investedin a diversified portfolio that consists primarily of equity and fixed incomesecurities. Furthermore, equity investments are diversified across U.S. andnon-U.S. stocks, including growth, value, and both small and large cap-italization stocks. The Company’s target plan asset investment allocationin the U.S. is 75% in equity securities and 25% in fixed income securitiesand cash, subject to periodic fluctuations in these respective assetclasses. The investment objective of the plans is to maximize the totalrate of return (income and appreciation) within the limits of prudent risk-taking and Section 404 of the Employee Retirement Income Security Act of1974, as amended. The plans are diversified across asset classes, strivingto achieve an optimal balance between risk and return and betweenincome and capital appreciation. Because many of the pension liabilitiesare long-term, the investment horizon is also long-term, but the investmentplan must also ensure adequate near-term liquidity to meet benefitpayments.
Assets of the Company’s international plans are invested in accor-dance with local accepted practices and include equity securities, fixedincome securities, insurance contracts and cash. Asset allocations andinvestments vary by country and plan. The Company’s target plan assetinvestment allocation for its international plans combined is 54% in equitysecurities, 37% in fixed income securities and cash, and 8% in insurancecontracts and other investments, subject to periodic fluctuations in theserespective asset classes.
The weighted-average asset allocations for the Company’s definedbenefit pension plans at end of year 2010 and 2009, by asset category, areas follows:
U.S. Int’l U.S. Int’l
2010 2009
Equity securities 70% 47% 71% 42%Fixed income securities and cash 30 43 29 47Insurance contracts and other
investments – 10 – 11
Total 100% 100% 100% 100%
44Notes to Consolidated Financial Statements
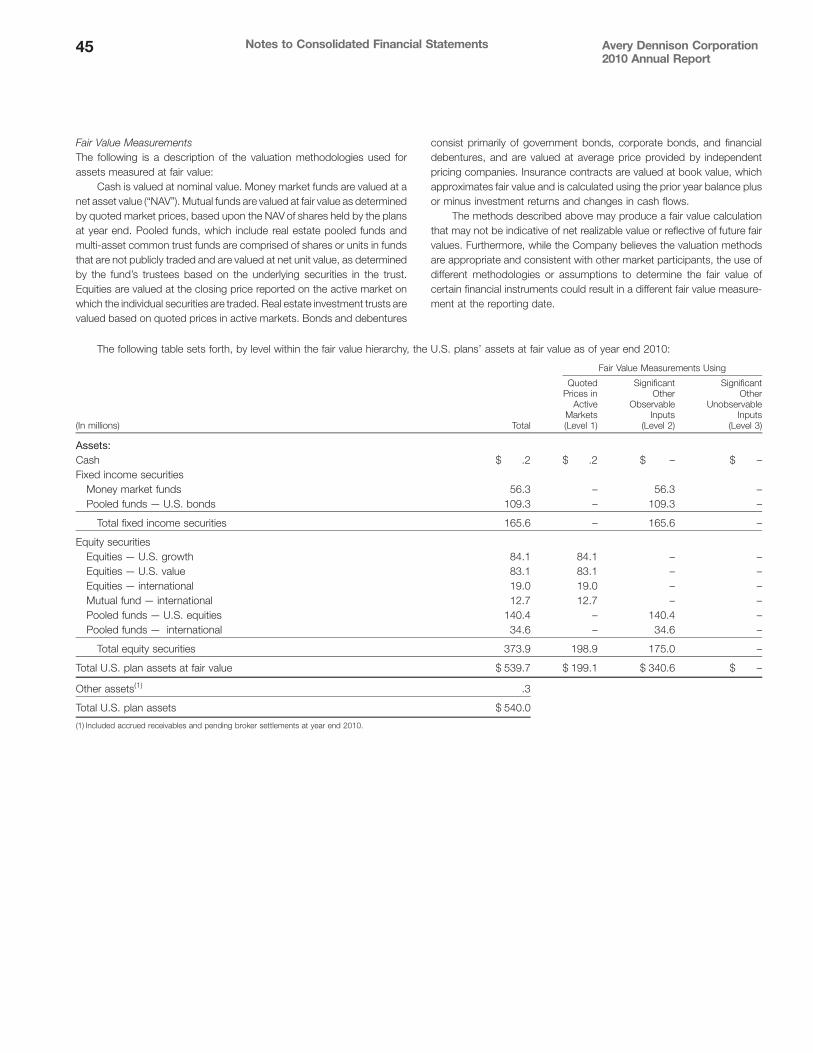
Fair Value MeasurementsThe following is a description of the valuation methodologies used forassets measured at fair value:
Cash is valued at nominal value. Money market funds are valued at anet asset value (“NAV”). Mutual funds are valued at fair value as determinedby quoted market prices, based upon the NAV of shares held by the plansat year end. Pooled funds, which include real estate pooled funds andmulti-asset common trust funds are comprised of shares or units in fundsthat are not publicly traded and are valued at net unit value, as determinedby the fund’s trustees based on the underlying securities in the trust.Equities are valued at the closing price reported on the active market onwhich the individual securities are traded. Real estate investment trusts arevalued based on quoted prices in active markets. Bonds and debentures
consist primarily of government bonds, corporate bonds, and financialdebentures, and are valued at average price provided by independentpricing companies. Insurance contracts are valued at book value, whichapproximates fair value and is calculated using the prior year balance plusor minus investment returns and changes in cash flows.
The methods described above may produce a fair value calculationthat may not be indicative of net realizable value or reflective of future fairvalues. Furthermore, while the Company believes the valuation methodsare appropriate and consistent with other market participants, the use ofdifferent methodologies or assumptions to determine the fair value ofcertain financial instruments could result in a different fair value measure-ment at the reporting date.
The following table sets forth, by level within the fair value hierarchy, the U.S. plans’ assets at fair value as of year end 2010:
(In millions) Total
QuotedPrices in
ActiveMarkets(Level 1)
SignificantOther
ObservableInputs
(Level 2)
SignificantOther
UnobservableInputs
(Level 3)
Fair Value Measurements Using
Assets:Cash $ .2 $ .2 $ – $ –Fixed income securities
Money market funds 56.3 – 56.3 –Pooled funds — U.S. bonds 109.3 – 109.3 –
Total fixed income securities 165.6 – 165.6 –
Equity securitiesEquities — U.S. growth 84.1 84.1 – –Equities — U.S. value 83.1 83.1 – –Equities — international 19.0 19.0 – –Mutual fund — international 12.7 12.7 – –Pooled funds — U.S. equities 140.4 – 140.4 –Pooled funds — international 34.6 – 34.6 –
Total equity securities 373.9 198.9 175.0 –
Total U.S. plan assets at fair value $ 539.7 $ 199.1 $ 340.6 $ –
Other assets(1) .3
Total U.S. plan assets $ 540.0
(1) Included accrued receivables and pending broker settlements at year end 2010.
45 Avery Dennison Corporation2010 Annual Report
Notes to Consolidated Financial Statements

The following table sets forth, by level within the fair value hierarchy, the international plans’ assets at fair value as of year end 2010:
(In millions) Total
QuotedPrices in
ActiveMarkets(Level 1)
SignificantOther
ObservableInputs
(Level 2)
SignificantOther
UnobservableInputs
(Level 3)
Fair Value Measurements Using
Assets:Cash $ 4.1 $ 4.1 $ – $ –Fixed income securities
Money market funds – – – –Mutual funds .3 .3 – –Pooled funds — European bonds 179.4 – 179.4 –
Total fixed income securities 179.7 .3 179.4 –
Equity securitiesPooled funds — global 79.3 – 79.3 –Pooled funds — European region 63.8 – 63.8 –Pooled funds — Asia Pacific region 12.2 – 12.2 –Pooled funds — U.S. 11.9 – 11.9 –Pooled funds — emerging markets 9.3 – 9.3 –Pooled funds — real estate investment trusts 21.7 – 21.7 –
Total equity securities 198.2 – 198.2 –
Other investmentsPooled funds — other 16.7 – 16.7 –Insurance contracts 27.3 – – 27.3
Total other investments 44.0 – 16.7 27.3
Total international plan assets at fair value $ 426.0 $ 4.4 $ 394.3 $ 27.3
Other assets(1) .6
Total international plan assets $ 426.6
(1) Included accrued receivables and pending broker settlements at year end 2010.
The following table presents a reconciliation of Level 3 assets heldduring the year ended January 1, 2011:
(In millions)InsuranceContracts
Level 3 assets
Beginning balance at January 2, 2010 $ 26.9Net realized and unrealized gain .8Net purchases, issuances and settlements (.3)Net transfers in (out) of Level 3 –Impact of changes in foreign currency exchange rates (.1)
Ending balance at January 1, 2011 $ 27.3
46Notes to Consolidated Financial Statements

The following table sets forth, by level within the fair value hierarchy, the U.S. plans’ assets at fair value as of year end 2009:
(In millions) Total
QuotedPrices in
ActiveMarkets(Level 1)
SignificantOther
ObservableInputs
(Level 2)
SignificantOther
UnobservableInputs
(Level 3)
Fair Value Measurements Using
Assets:Cash $ .3 $ .3 $ – $ –Fixed income securities
Money market funds 40.5 – 40.5 –Pooled funds 97.8 – 97.8 –
Total fixed income securities 138.3 – 138.3 –
Equity securitiesEquities 174.9 174.9 – –Mutual funds 15.2 15.2 – –Pooled funds 137.3 – 137.3 –
Total equity securities 327.4 190.1 137.3 –
Real estate investment trusts 1.9 1.9 – –
Total U.S. plan assets at fair value $ 467.9 $192.3 $275.6 $ –
Other assets(1) (.2)
Total U.S. plan assets $ 467.7
(1) Included accrued receivables and pending broker settlements at year end 2009.
The following table sets forth, by level within the fair value hierarchy, the international plans’ assets at fair value as of year end 2009:
(In millions) Total
QuotedPrices in
ActiveMarkets(Level 1)
SignificantOther
ObservableInputs
(Level 2)
SignificantOther
UnobservableInputs
(Level 3)
Fair Value Measurements Using
Assets:Cash $ 4.7 $4.7 $ – $ –Fixed income securities
Mutual funds .2 .2 – –Bonds and debentures 1.0 – 1.0 –Pooled funds 179.8 – 179.8 –
Total fixed income securities 181.0 .2 180.8 –
Equity pooled funds 163.9 – 163.9 –Insurance contracts 26.9 – – 26.9Real estate pooled funds 18.2 – 18.2 –Multi-asset common trust funds 7.0 – 7.0 –
Total international plan assets at fair value $ 401.7 $4.9 $369.9 $26.9
Other assets(1) .4
Total international plan assets $ 402.1
(1) Included accrued receivables and pending broker settlements at year end 2009.
47 Avery Dennison Corporation2010 Annual Report
Notes to Consolidated Financial Statements

The following table presents a reconciliation of Level 3 assets heldduring the year ended January 2, 2010:
(In millions)InsuranceContracts
Level 3 assets
Beginning balance at December 27, 2008 $23.0Net realized and unrealized gain .9Net purchases, issuances and settlements 1.8Net transfers in (out) of Level 3 –Impact of changes in foreign currency exchange rates 1.2
Ending balance at January 2, 2010 $26.9
Postretirement Health BenefitsThe Company provides postretirement health benefits to certainU.S. retired employees up to the age of 65 under a cost-sharing arrange-ment, and provides supplemental Medicare benefits to certain U.S. retireesover the age of 65. The Company’s policy is to fund the cost of thepostretirement benefits on a cash basis. While the Company has notexpressed any intent to terminate postretirement health benefits, theCompany may do so at any time.
Plan AssumptionsDiscount RateThe Company, in consultation with its actuaries, annually reviews anddetermines the discount rates to be used in connection with its postre-tirement obligations. The assumed discount rate for each pension planreflects market rates for high quality corporate bonds currently available. Inthe U.S., the Company’s discount rate was determined by evaluatingseveral yield curves consisting of large populations of high quality
corporate bonds. The projected pension benefit payment streams werethen matched with the bond portfolios to determine a rate that reflectedthe liability duration unique to the Company’s plans.
Long-term Return on AssetsThe Company determines the long-term rate of return assumption for planassets by reviewing the historical and expected returns of both the equityand fixed income markets, taking into consideration that assets withhigher volatility typically generate a greater return over the long run.Additionally, current market conditions, such as interest rates, are evalu-ated and peer data is reviewed to check for reasonability andappropriateness.
Healthcare Cost Trend RateThe Company’s practice is to fund the cost of postretirement benefits on acash basis. For measurement purposes, an 8.5% annual rate of increasein the per capita cost of covered health care benefits was assumed for2011. This rate is expected to decrease to approximately 5% by 2018.
A one-percentage-point change in assumed health care cost trendrates would have the following effects:
(In millions)One-percentage-point
increaseOne-percentage-point
decrease
Effect on total of serviceand interest costcomponents $ .2 $ (.2)
Effect on postretirementbenefit obligation 3.5 (3.1)
Plan Balance Sheet ReconciliationsThe following provides a reconciliation of benefit obligations, plan assets, funded status of the plans and accumulated other comprehensive income:
Plan Benefit Obligations
(In millions) U.S. Int’l U.S. Int’l2010 2009 2010 2009
Pension BenefitsU.S. Postretirement
Health Benefits
Change in projected benefit obligation:Projected benefit obligation at beginning of year $693.6 $465.8 $611.9 $449.9 $37.0 $31.8Service cost 23.8 9.8 18.9 11.8 1.5 1.0Interest cost 40.1 24.5 38.8 25.8 1.9 1.9Participant contribution – 4.1 – 4.3 1.2 1.8Amendments .8 .1 – (.3) – –Actuarial loss (gain) 56.3 50.3 63.2 (25.0) 1.9 5.3Plan transfer(1) 2.0 .3 2.0 – – –Benefits paid (37.8) (19.5) (41.2) (20.1) (4.8) (4.8)Net transfer in – – – .3 – –Pension curtailment (34.0) (.8) – – – –Pension settlements(2) – (8.2) – (.8) – –Foreign currency translation – (21.7) – 19.9 – –
Projected benefit obligation at end of year $744.8 $504.7 $693.6 $465.8 $38.7 $37.0
Accumulated benefit obligation at end of year $742.3 $474.9 $658.0 $439.2
(1) Plan transfer for the U.S. represented a transfer from the Company’s savings plan.
(2) Pension settlements in 2010 represented settlement events in Canada, Belgium, Korea, Taiwan, and France.
48Notes to Consolidated Financial Statements
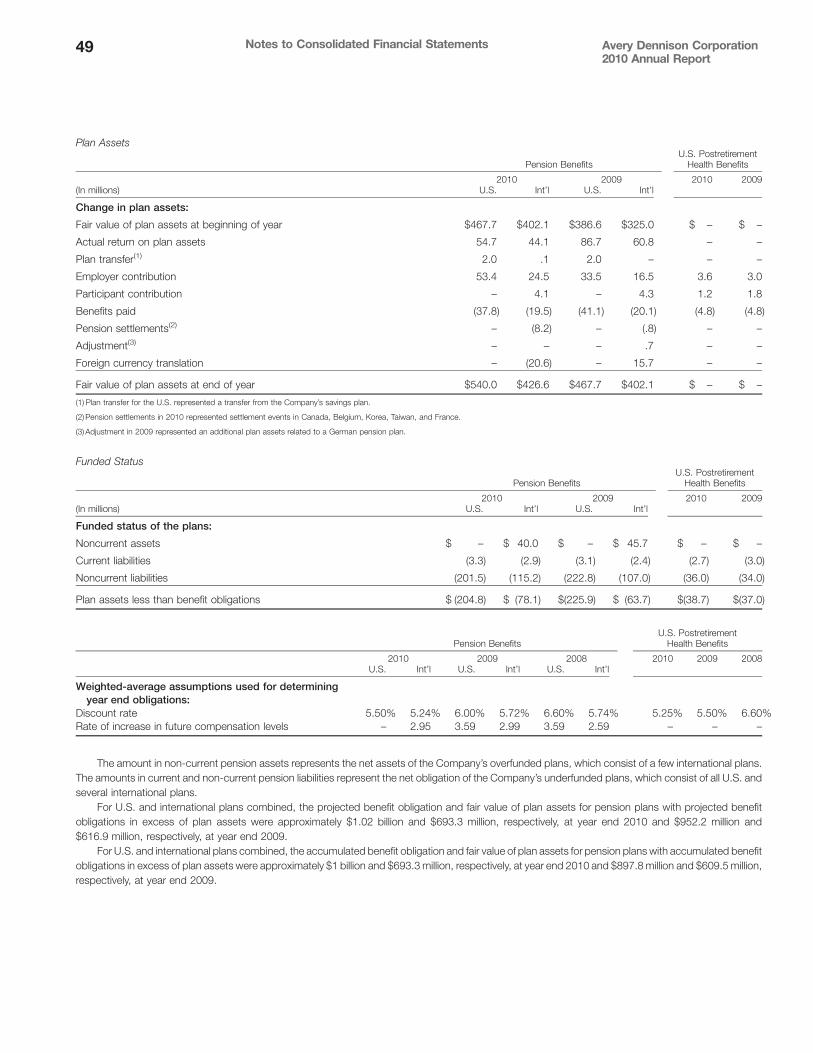
Plan Assets
(In millions) U.S. Int’l U.S. Int’l2010 2009 2010 2009
Pension BenefitsU.S. Postretirement
Health Benefits
Change in plan assets:
Fair value of plan assets at beginning of year $467.7 $402.1 $386.6 $325.0 $ – $ –
Actual return on plan assets 54.7 44.1 86.7 60.8 – –
Plan transfer(1) 2.0 .1 2.0 – – –
Employer contribution 53.4 24.5 33.5 16.5 3.6 3.0
Participant contribution – 4.1 – 4.3 1.2 1.8
Benefits paid (37.8) (19.5) (41.1) (20.1) (4.8) (4.8)
Pension settlements(2) – (8.2) – (.8) – –
Adjustment(3) – – – .7 – –
Foreign currency translation – (20.6) – 15.7 – –
Fair value of plan assets at end of year $540.0 $426.6 $467.7 $402.1 $ – $ –
(1) Plan transfer for the U.S. represented a transfer from the Company’s savings plan.
(2) Pension settlements in 2010 represented settlement events in Canada, Belgium, Korea, Taiwan, and France.
(3) Adjustment in 2009 represented an additional plan assets related to a German pension plan.
Funded Status
(In millions) U.S. Int’l U.S. Int’l2010 2009 2010 2009
Pension BenefitsU.S. Postretirement
Health Benefits
Funded status of the plans:
Noncurrent assets $ – $ 40.0 $ – $ 45.7 $ – $ –
Current liabilities (3.3) (2.9) (3.1) (2.4) (2.7) (3.0)
Noncurrent liabilities (201.5) (115.2) (222.8) (107.0) (36.0) (34.0)
Plan assets less than benefit obligations $ (204.8) $ (78.1) $(225.9) $ (63.7) $(38.7) $(37.0)
U.S. Int’l U.S. Int’l U.S. Int’l2010 2009 2008 2010 2009 2008
Pension BenefitsU.S. Postretirement
Health Benefits
Weighted-average assumptions used for determiningyear end obligations:
Discount rate 5.50% 5.24% 6.00% 5.72% 6.60% 5.74% 5.25% 5.50% 6.60%Rate of increase in future compensation levels – 2.95 3.59 2.99 3.59 2.59 – – –
The amount in non-current pension assets represents the net assets of the Company’s overfunded plans, which consist of a few international plans.The amounts in current and non-current pension liabilities represent the net obligation of the Company’s underfunded plans, which consist of all U.S. andseveral international plans.
For U.S. and international plans combined, the projected benefit obligation and fair value of plan assets for pension plans with projected benefitobligations in excess of plan assets were approximately $1.02 billion and $693.3 million, respectively, at year end 2010 and $952.2 million and$616.9 million, respectively, at year end 2009.
For U.S. and international plans combined, the accumulated benefit obligation and fair value of plan assets for pension plans with accumulated benefitobligations in excess of plan assets were approximately $1 billion and $693.3 million, respectively, at year end 2010 and $897.8 million and $609.5 million,respectively, at year end 2009.
49 Avery Dennison Corporation2010 Annual Report
Notes to Consolidated Financial Statements

Accumulated Other Comprehensive Income (“AOCI”)The pretax amounts recognized in “Accumulated other comprehensive income (loss)” in the Consolidated Balance Sheet:
(In millions) U.S. Int’l U.S. Int’l2010 2009 2010 2009
Pension BenefitsU.S. Postretirement
Health Benefits
Net actuarial loss (gain) $355.1 $ (.7) $359.3 $ (1.3) $ 25.8 $ 25.6Prior service cost (credit) 2.2 3.8 4.7 4.1 (16.5) (18.5)Net transition obligation – 104.2 – 78.9 – –
Net amount recognized in AOCI $357.3 $107.3 $364.0 $81.7 $ 9.3 $ 7.1
The after-tax amounts and reconciliation of AOCI components as of January 1, 2011 are as follows:
(In millions)
Before-TaxAmounts
U.S.
Before-TaxAmounts
Int’l Tax EffectNet-of-Tax
Amount
Before-Tax
Amount Tax EffectNet-of-Tax
Amount
Pension BenefitsU.S. Postretirement
Health Benefits
AOCI at January 2, 2010 $364.0 $ 81.7 $(146.7) $299.0 $7.1 $(2.7) $4.4Less: Amortization (23.4) (4.7) 9.7 (18.4) .4 (.2) .2
Net AOCI 340.6 77.0 (137.0) 280.6 7.5 (2.9) 4.6Net actuarial loss (gain) 15.9 30.1(1) (11.8) 34.2 1.8 (.7) 1.1Prior service cost (credit) .8 .2 (.3) .7 – – –
AOCI at January 1, 2011 $357.3 $107.3 $(149.1) $315.5 $9.3 $(3.6) $5.7
(1) Net of foreign currency translation gain of $2.1.
Plan Income Statement ReconciliationsThe following table sets forth the components of net periodic benefit cost:
(In millions) U.S. Int’l U.S. Int’l U.S. Int’l2010 2009 20082010 2009 2008
Pension BenefitsU.S. Postretirement
Health Benefits
Components of net periodic benefit cost:Service cost $ 23.8 $ 9.8 $ 18.9 $ 11.8 $ 19.5 $ 14.1 $ 1.5 $ 1.0 $ 1.0Interest cost 40.1 24.5 38.8 25.8 36.1 28.1 2.0 1.9 1.8Expected return on plan assets (48.4) (25.9) (48.6) (26.8) (50.9) (29.0) – –Recognized net actuarial loss 20.2 2.4 9.3 2.1 6.0 3.6 1.6 1.5 1.5Amortization of prior service cost .8 .5 .8 .5 1.1 1.4 (2.0) (2.0) (2.0)Amortization of transition obligation (asset) – (.5) – (.6) – (.6) – – –Recognized loss (gain) on curtailment 2.4 (.9) – – – (.1) – – –Recognized loss on settlement – 2.3(1) .9 .2 – – – – –
Net periodic benefit cost $ 38.9 $ 12.2 $ 20.1 $ 13.0 $ 11.8 $ 17.5 $ 3.1 $ 2.4 $ 2.3
(1) Represented settlement events in Canada, Belgium, and Korea.
U.S. Int’l U.S. Int’l U.S. Int’l2010 2009 20082010 2009 2008
Pension BenefitsU.S. Postretirement
Health Benefits
Weighted-average assumptions used fordetermining net periodic cost:
Discount rate 6.00%(1) 5.72% 6.60% 5.74% 6.55% 5.53% 5.50% 6.60% 6.30%Expected long-term rate of return on plan assets 8.75 6.23 8.75 6.51 8.75 6.66 – – –Rate of increase in future compensation levels 3.59 2.99 3.59 2.59 3.59 2.66 – – –
(1) The ADPP and BRP were remeasured on August 1, 2010 at 5.40% to reflect the plan freezes effective December 31, 2010.
Plan ContributionsIn 2011, the Company expects to contribute approximately $8 million andmay contribute up to an additional $25 million to its U.S. pension plans,
and expects to contribute $21 million to its international pension plans(totaling approximately $50 million). The Company also expects to con-tribute approximately $3 million to its postretirement benefit plan in 2011.
50Notes to Consolidated Financial Statements
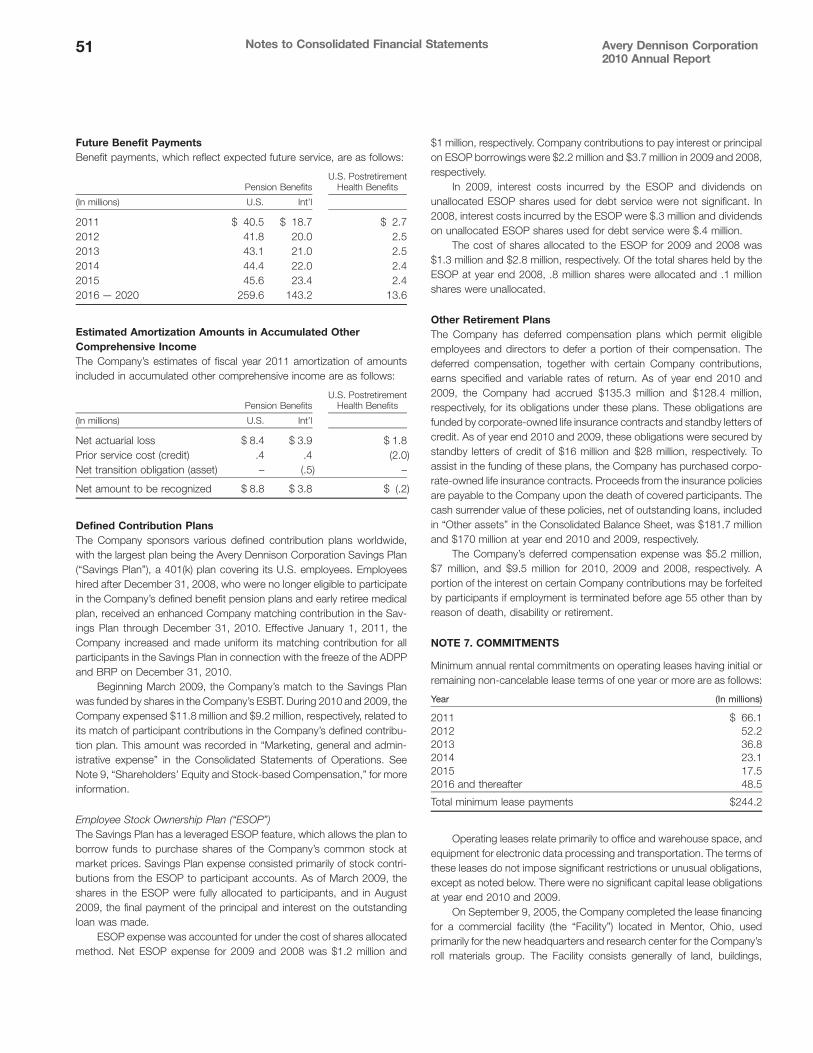
Future Benefit PaymentsBenefit payments, which reflect expected future service, are as follows:
(In millions) U.S. Int’l
Pension BenefitsU.S. Postretirement
Health Benefits
2011 $ 40.5 $ 18.7 $ 2.72012 41.8 20.0 2.52013 43.1 21.0 2.52014 44.4 22.0 2.42015 45.6 23.4 2.42016 — 2020 259.6 143.2 13.6
Estimated Amortization Amounts in Accumulated OtherComprehensive IncomeThe Company’s estimates of fiscal year 2011 amortization of amountsincluded in accumulated other comprehensive income are as follows:
(In millions) U.S. Int’l
Pension BenefitsU.S. Postretirement
Health Benefits
Net actuarial loss $ 8.4 $ 3.9 $ 1.8Prior service cost (credit) .4 .4 (2.0)Net transition obligation (asset) – (.5) –
Net amount to be recognized $ 8.8 $ 3.8 $ (.2)
Defined Contribution PlansThe Company sponsors various defined contribution plans worldwide,with the largest plan being the Avery Dennison Corporation Savings Plan(“Savings Plan”), a 401(k) plan covering its U.S. employees. Employeeshired after December 31, 2008, who were no longer eligible to participatein the Company’s defined benefit pension plans and early retiree medicalplan, received an enhanced Company matching contribution in the Sav-ings Plan through December 31, 2010. Effective January 1, 2011, theCompany increased and made uniform its matching contribution for allparticipants in the Savings Plan in connection with the freeze of the ADPPand BRP on December 31, 2010.
Beginning March 2009, the Company’s match to the Savings Planwas funded by shares in the Company’s ESBT. During 2010 and 2009, theCompany expensed $11.8 million and $9.2 million, respectively, related toits match of participant contributions in the Company’s defined contribu-tion plan. This amount was recorded in “Marketing, general and admin-istrative expense” in the Consolidated Statements of Operations. SeeNote 9, “Shareholders’ Equity and Stock-based Compensation,” for moreinformation.
Employee Stock Ownership Plan (“ESOP”)The Savings Plan has a leveraged ESOP feature, which allows the plan toborrow funds to purchase shares of the Company’s common stock atmarket prices. Savings Plan expense consisted primarily of stock contri-butions from the ESOP to participant accounts. As of March 2009, theshares in the ESOP were fully allocated to participants, and in August2009, the final payment of the principal and interest on the outstandingloan was made.
ESOP expense was accounted for under the cost of shares allocatedmethod. Net ESOP expense for 2009 and 2008 was $1.2 million and
$1 million, respectively. Company contributions to pay interest or principalon ESOP borrowings were $2.2 million and $3.7 million in 2009 and 2008,respectively.
In 2009, interest costs incurred by the ESOP and dividends onunallocated ESOP shares used for debt service were not significant. In2008, interest costs incurred by the ESOP were $.3 million and dividendson unallocated ESOP shares used for debt service were $.4 million.
The cost of shares allocated to the ESOP for 2009 and 2008 was$1.3 million and $2.8 million, respectively. Of the total shares held by theESOP at year end 2008, .8 million shares were allocated and .1 millionshares were unallocated.
Other Retirement PlansThe Company has deferred compensation plans which permit eligibleemployees and directors to defer a portion of their compensation. Thedeferred compensation, together with certain Company contributions,earns specified and variable rates of return. As of year end 2010 and2009, the Company had accrued $135.3 million and $128.4 million,respectively, for its obligations under these plans. These obligations arefunded by corporate-owned life insurance contracts and standby letters ofcredit. As of year end 2010 and 2009, these obligations were secured bystandby letters of credit of $16 million and $28 million, respectively. Toassist in the funding of these plans, the Company has purchased corpo-rate-owned life insurance contracts. Proceeds from the insurance policiesare payable to the Company upon the death of covered participants. Thecash surrender value of these policies, net of outstanding loans, includedin “Other assets” in the Consolidated Balance Sheet, was $181.7 millionand $170 million at year end 2010 and 2009, respectively.
The Company’s deferred compensation expense was $5.2 million,$7 million, and $9.5 million for 2010, 2009 and 2008, respectively. Aportion of the interest on certain Company contributions may be forfeitedby participants if employment is terminated before age 55 other than byreason of death, disability or retirement.
NOTE 7. COMMITMENTS
Minimum annual rental commitments on operating leases having initial orremaining non-cancelable lease terms of one year or more are as follows:
Year (In millions)
2011 $ 66.12012 52.22013 36.82014 23.12015 17.52016 and thereafter 48.5
Total minimum lease payments $244.2
Operating leases relate primarily to office and warehouse space, andequipment for electronic data processing and transportation. The terms ofthese leases do not impose significant restrictions or unusual obligations,except as noted below. There were no significant capital lease obligationsat year end 2010 and 2009.
On September 9, 2005, the Company completed the lease financingfor a commercial facility (the “Facility”) located in Mentor, Ohio, usedprimarily for the new headquarters and research center for the Company’sroll materials group. The Facility consists generally of land, buildings,
51 Avery Dennison Corporation2010 Annual Report
Notes to Consolidated Financial Statements

equipment and office furnishings. The Company has leased the Facilityunder an operating lease arrangement, which contains a residual valueguarantee of $33.4 million.
Rent expense for operating leases, which includes maintenance andinsurance costs and property taxes, was approximately $99 million in2010, $100 million in 2009, and $105 million in 2008.
NOTE 8. CONTINGENCIES
Legal ProceedingsOn May 21, 2003, The Harman Press filed in the Superior Court for theCounty of Los Angeles, California, a purported class action on behalf ofindirect purchasers of label stock against the Company, UPM-KymenneCorporation (“UPM”) and UPM’s subsidiary Raflatac (“Raflatac”), seekingtreble damages and other relief for alleged unlawful competitive practices,with allegations including that the defendants attempted to limit compe-tition among themselves through anticompetitive understandings. Threesimilar complaints were filed in various California courts. In November2003, on petition from the parties, the California Judicial Council orderedthe cases be coordinated for pretrial purposes. The cases were assignedto a coordination trial judge in the Superior Court for the City and County ofSan Francisco on March 30, 2004. On September 30, 2004, the HarmanPress amended its complaint to add Bemis Company Inc.’s subsidiaryMorgan Adhesives Company (“MACtac”) as a defendant. On January 21,2005, American International Distribution Corporation filed a purportedclass action on behalf of indirect purchasers in the Superior Court forChittenden County, Vermont. Similar actions were filed by Richard Wrobel,on February 16, 2005, in the District Court of Johnson County, Kansas;and by Chad and Terry Muzzey, on February 16, 2005 in the District Courtof Scotts Bluff County, Nebraska. On February 17, 2005, Judy Bensonfiled a purported multi-state class action on behalf of indirect purchasers inthe Circuit Court for Cocke County, Tennessee. Without admitting liability,the Company agreed to pay plaintiffs $2 million to resolve all claims relatedto the purported state class actions in the states of Kansas, Nebraska,Tennessee and Vermont. Those settlements were approved by the Ten-nessee court on March 12, 2010 and the complaints in those state actionswere dismissed with prejudice. The Company recorded $2 million in thethird quarter of 2009 in respect of the settlement of those claims, andmade that payment on December 28, 2009. Also, without admittingliability, the Company paid $2.5 million on July 15, 2010 to resolve allclaims in the California action. On December 8, 2010, the California courtgranted final approval of the settlement and dismissed all claims againstthe Company with prejudice. In respect of settlement of this claim, theCompany recorded $.7 million in the fourth quarter of 2009 and $.3 millionand $1.5 million in the first and second quarters of 2010, respectively.
The Company and its subsidiaries are involved in various other law-suits, claims, inquiries, and other regulatory and compliance matters, mostof which are routine to the nature of the Company’s business. Based uponcurrent information, management believes that the impact of the resolutionof these other matters is not material to the Company’s financial position,or is not estimable.
Environmental MattersAs of January 1, 2011, the Company has been designated by theU.S. Environmental Protection Agency (“EPA”) and/or other responsiblestate agencies as a potentially responsible party (“PRP”) at fourteen waste
disposal or waste recycling sites, which are the subject of separateinvestigations or proceedings concerning alleged soil and/or groundwatercontamination and for which no settlement of the Company’s liability hasbeen agreed. The Company is participating with other PRPs at such sitesand anticipates that its share of cleanup costs will be determined pursuantto remediation agreements entered into in the normal course of negoti-ations with the EPA or other governmental authorities.
The Company has accrued liabilities for these and certain other siteswhere it is probable that a loss will be incurred and the cost or amount of losscan be reasonably estimated. However, because of the uncertainties associ-ated with environmental assessment and remediation activities, future expenseto remediate the currently identified sites and any sites that could be identifiedin the future for cleanup could be higher than the liabilities accrued.
The activity in 2010 and 2009 related to environmental liabilities wasas follows:
(In millions) 2010 2009
Balance at beginning of year $ 51.5 $ 54.6Purchase price adjustments related to
acquisitions – .9Accruals (1.2) 1.0Payments (4.0) (5.0)
Balance at end of year $ 46.3 $ 51.5
As of January 1, 2011, approximately $9 million of the total balancewas classified as short-term.
These estimates could change depending on various factors, such asmodification of currently planned remedial actions, changes in remediationtechnologies, changes in site conditions, changes in the estimated time tocomplete remediation projects, changes in laws and regulations affectingremediation requirements and other factors.
OtherThe Company participates in international receivable financing programswith several financial institutions whereby advances may be requestedfrom these financial institutions. Such advances are guaranteed by theCompany. At January 1, 2011, the Company had guaranteed approxi-mately $14 million.
As of January 1, 2011, the Company guaranteed up to approximately$17 million of certain foreign subsidiaries’ credit granted by suppliers, and$393 million of certain subsidiaries’ lines of credit with various financialinstitutions.
NOTE 9. SHAREHOLDERS’ EQUITY AND STOCK-BASEDCOMPENSATION
Common Stock and Common Stock Repurchase ProgramThe Company’s Certificate of Incorporation authorizes five million shares of$1 par value preferred stock (none outstanding), with respect to which theBoard of Directors may fix the series and terms of issuance, and 400 millionshares of $1 par value voting common stock.
In 1996, the Company established the ESBT to help meet the Com-pany’s future obligations under employee benefit and compensation plans,including stock plans, 401(k) plans, and other employee benefit plans bycontributing common stock of the Company. The Board of Directors pre-viously authorized the issuance of up to 18 million shares to be used for the
52Notes to Consolidated Financial Statements

issuance of stock options and the funding of other Company obligationsarising from various employee benefit plans. During 2010 and 2009, approx-imately 4.3 million and .7 million ESBTshares (with fair values of $163 millionand $25 million, respectively) were released by the ESBT upon the settle-ment of the Company’s employee benefit obligations. These released shareswere included as “Treasury stock at cost” in the Consolidated BalanceSheets. As of January 1, 2011, approximately 2 million shares remainingavailable for issuance are held in the ESBT. The ESBT common stock iscarried at market value with changes in share price from prior reportingperiods reflected as an adjustment to capital in excess of par value.
The Board of Directors authorizes the Company to repurchase sharesof the Company’s outstanding common stock. Repurchased shares maybe reissued under the Company’s stock option and incentive plans or usedfor other corporate purposes. During the fourth quarter of 2010, theCompany repurchased approximately 2.7 million shares totaling$108.7 million. Additionally, in December 2010, the Company executedthe repurchase of approximately .3 million shares for $13.5 million, whichsettled in January 2011. As of January 1, 2011, approximately 1.2 millionshares were available for repurchase under the Board of Directors’October 2006 authorization.
Subsequent to the end of 2010, on January 27, 2011, the Board ofDirectors authorized the Company to repurchase an additional 5 millionshares of the Company’s stock.
Stock Based CompensationThe Company maintains various stock option and incentive plans. Netincome for 2010, 2009 and 2008 included pretax stock-based compen-sation expense, which related to stock options, performance units (“PUs”),restricted stock units (“RSUs”) and restricted stock, of $35.2 million,$25.8 million and $29 million, respectively. These expenses were includedin “Marketing, general and administrative expense” and were recorded incorporate expense and the Company’s operating segments, as appropriate.The total recognized tax benefit related to these stock-based compensationexpenses for 2010, 2009 and 2008 was $11.9 million, $8.5 million and$9.7 million, respectively. No stock-based compensation cost was capital-ized for the years ended 2010, 2009 and 2008, respectively.
Stock OptionsStock options granted to directors and employees may be granted at no lessthan 100% of the fair market value of the Company’s common stock on the
date of the grant. Options generally vest ratably over a three-year period fordirectors and over a four-year period for employees. Prior to fiscal year 2010,options granted to directors generally vested ratably over a two-year period.Unexercised options expire ten years from the date of grant. All stockoptions granted under these plans have an exercise price equal to the fairmarket value of the underlying common stock on the date of grant.
The Company’s stock-based compensation expense related to stockoptions is the estimated fair value of options granted, amortized on astraight-line basis over the requisite service period. The fair value of theCompany’s stock option awards is estimated as of the date of grant usingthe Black-Scholes option-pricing model. This model requires inputassumptions for the Company’s expected dividend yield, expected stockprice volatility, risk-free interest rate and the expected option term. Thefollowing describes the assumptions used in estimating fair value ofgranted stock options.
Risk-free interest rate was based on the 52-week average of theTreasury-Bond rate that has a term corresponding to the expected optionterm.
Expected stock price volatility for options represents an average of theimplied and historical volatility.
Expected dividend yield was based on the current annual dividenddivided by the 12-month average of the Company’s monthly stock priceprior to grant.
Expected option term was determined based on historical experienceunder the Company’s stock option plan.
Forfeiture rate of 5% was determined based on historical data of theCompany’s stock option forfeitures.
The weighted-average fair value per share of options granted during2010 was $8.76, compared to $6.57 for the year ended 2009 and $13.82for the year ended 2008.
The underlying weighted-average assumptions used were as follows:
2010 2009 2008
Risk-free interest rate 2.61% 2.76% 4.15%Expected stock price volatility 31.99% 41.51% 29.86%Expected dividend yield 2.51% 3.83% 2.76%Expected option term 6.0 years 6.1 years 6.0 years
The following table sets forth stock option information related to the Company’s stock option plans during 2010:
Numberof options
(in thousands)
Weighted-averageexercise
price
Weighted-average
remainingcontractual
life (in years)
Aggregateintrinsic value
(in millions)
Outstanding at January 2, 2010 10,760.2 $ 49.72 5.87 $ 34.0Granted 1,850.8 33.09Exercised (121.2) 21.10Forfeited or expired (921.4) 53.41
Outstanding at January 1, 2011 11,568.4 $ 47.06 5.75 $ 62.0Options vested and expected to vest at January 1, 2011 11,441.9 47.25 5.72 60.0Options exercisable at January 1, 2011 8,298.1 $ 52.70 4.69 $ 20.5
53 Avery Dennison Corporation2010 Annual Report
Notes to Consolidated Financial Statements

The total intrinsic value of stock options exercised was $1.9 million in 2010, $.2 million in 2009 and $1.9 million in 2008. Cash received by theCompany from the exercise of these stock options was approximately $2.5 million in 2010, $.6 million in 2009 and $3 million in 2008. The tax deductionassociated with these options exercised was $.6 million in 2010, $.1 million in 2009 and $.6 million in 2008. The intrinsic value of the stock options is basedon the amount by which the market value of the underlying stock exceeds the exercise price of the option.
In April and February 2010, the Company granted its annual stock-based compensation awards to its directors and certain of its eligibleemployees, respectively. Awards granted to retirement-eligible employeesare treated as though they were immediately vested; as a result, thecompensation expense related to stock option awards of $2.5 million,$.5 million and $3 million was recognized during 2010, 2009 and 2008,respectively, and was included in the stock option expense noted below.
Net income for 2010, 2009 and 2008 included pretax expense forstock options of $19.4 million, $17 million and $18.6 million, respectively.
The following table summarizes the Company’s unvested stockoptions during 2010:
Numberof options
(in thousands)
Weighted-average
exercise price
Unvested options outstanding atJanuary 2, 2010 3,566.3 $36.01
Granted 1,850.8 33.09Vested (2,006.8) 38.59Forfeited (140.0) 36.32
Unvested options outstanding atJanuary 1, 2011 3,270.3 $32.76
As of January 1, 2011, the Company had approximately $20 million ofunrecognized compensation cost related to unvested stock option awardsgranted under the Company’s plans. This cost is expected to be recog-nized over the weighted-average remaining requisite service period ofapproximately 3 years.
Performance UnitsSince the second quarter of 2008, following the shareholder approval ofthe Company’s amended and restated stock option and incentive plan onApril 24, 2008, the Company has granted PUs to certain eligible employ-ees of the Company. These PUs are payable in shares of the Company’scommon stock at the end of a three-year cliff vesting period provided thatcertain performance metrics are achieved at the end of each respectiveperformance period. Over the performance period, the number of theCompany’s common stock issued will be adjusted upward or downwardbased upon the probability of achievement of performance metrics. Theactual number of shares issued can range from 0% to 200% of the targetshares at the time of grant.
The pretax compensation expense related to PUs was $7.7 million,$3.1 million and $1.2 million for the years ended 2010, 2009 and 2008,respectively. The tax deduction associated with the vesting of PUs and therelated issuance of common stock was $.2 million in 2010 and $.2 millionin 2009.
The following table summarizes information about awarded PUs:
Number ofPUs
(in thousands)
Weighted-average
grant-datefair value
Unvested at January 2, 2010 651.2 $22.12Granted at target 342.5 29.06Vested (15.1) 28.66Forfeited (60.5) 23.45
Unvested at January 1, 2011 918.1 $24.52
As of January 1, 2011, the Company had approximately $12 million ofunrecognized compensation cost related to these PUs, which reflects theCompany’s current expectation of meeting certain performance metrics.This cost is expected to be recognized over the weighted-average remain-ing requisite service period of approximately 2 years.
Restricted Stock Units and Restricted StockRSU’s are granted under the Company’s stock option and incentive planand vest based on one of the following:
• A vesting period of 1 to 5 years provided that employment continuesfor 1 to 5 years after the date of the award; or
• A vesting period of 3 years provided that a certain performanceobjective is met at the end of the third year after the year of theaward. If the performance objective is not achieved at the end of thethird year, these same RSUs may vest if the performance objective ismet at the end of the fourth year, and if not achieved at that time, thenthese same RSUs may vest if the performance objective is met at theend of the fifth year following the year of grant.
For both groups, if the above vesting conditions are not met, theRSUs will be forfeited.
Certain RSUs granted from 2005 through 2008 include dividendequivalents in the form of additional RSUs, which are equivalent to theamount of the dividend paid or property distributed on a single share ofcommon stock multiplied by the number of RSUs in the employee’saccount. Starting in fiscal year 2008, the Company began granting RSUswithout dividend equivalents.
The following table summarizes information about awarded RSUs:
Number ofRSUs
(in thousands)
Weighted-average
grant-datefair value
Unvested at January 2, 2010 783.3 $32.24Granted 598.4 30.01Vested (197.8) 39.00Forfeited (56.0) 29.76
Unvested at January 1, 2011 1,127.9 $30.00
54Notes to Consolidated Financial Statements
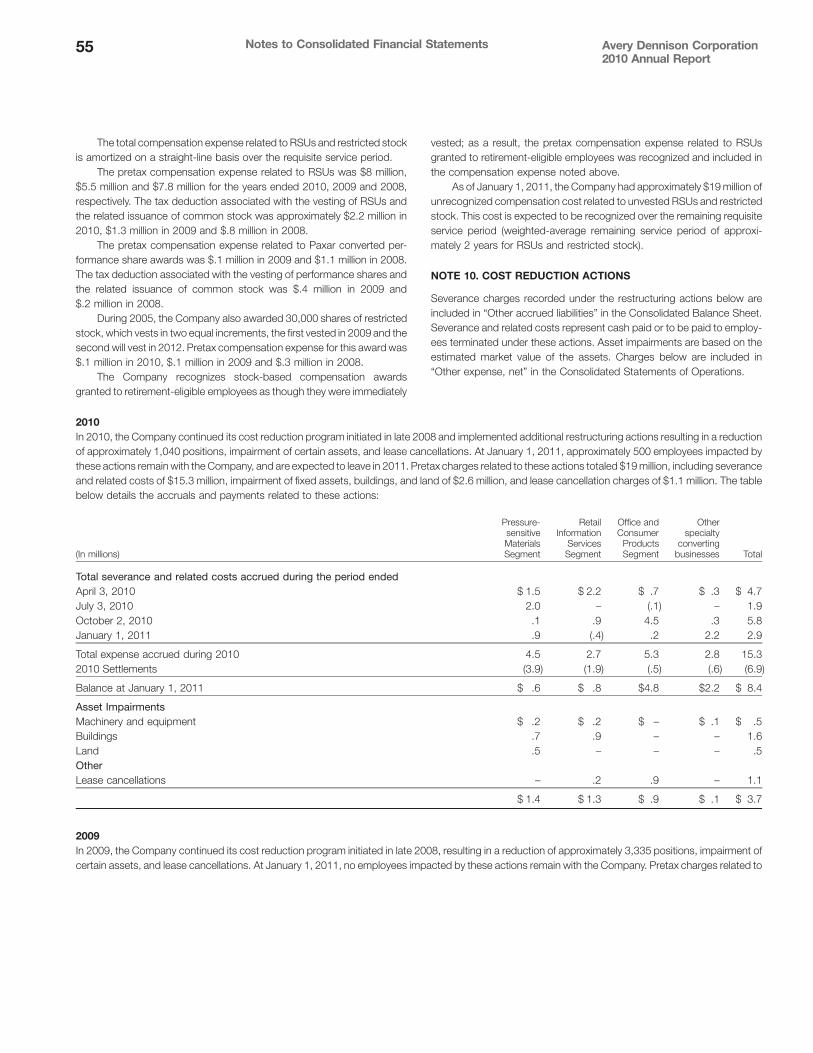
The total compensation expense related to RSUs and restricted stockis amortized on a straight-line basis over the requisite service period.
The pretax compensation expense related to RSUs was $8 million,$5.5 million and $7.8 million for the years ended 2010, 2009 and 2008,respectively. The tax deduction associated with the vesting of RSUs andthe related issuance of common stock was approximately $2.2 million in2010, $1.3 million in 2009 and $.8 million in 2008.
The pretax compensation expense related to Paxar converted per-formance share awards was $.1 million in 2009 and $1.1 million in 2008.The tax deduction associated with the vesting of performance shares andthe related issuance of common stock was $.4 million in 2009 and$.2 million in 2008.
During 2005, the Company also awarded 30,000 shares of restrictedstock, which vests in two equal increments, the first vested in 2009 and thesecond will vest in 2012. Pretax compensation expense for this award was$.1 million in 2010, $.1 million in 2009 and $.3 million in 2008.
The Company recognizes stock-based compensation awardsgranted to retirement-eligible employees as though they were immediately
vested; as a result, the pretax compensation expense related to RSUsgranted to retirement-eligible employees was recognized and included inthe compensation expense noted above.
As of January 1, 2011, the Company had approximately $19 million ofunrecognized compensation cost related to unvested RSUs and restrictedstock. This cost is expected to be recognized over the remaining requisiteservice period (weighted-average remaining service period of approxi-mately 2 years for RSUs and restricted stock).
NOTE 10. COST REDUCTION ACTIONS
Severance charges recorded under the restructuring actions below areincluded in “Other accrued liabilities” in the Consolidated Balance Sheet.Severance and related costs represent cash paid or to be paid to employ-ees terminated under these actions. Asset impairments are based on theestimated market value of the assets. Charges below are included in“Other expense, net” in the Consolidated Statements of Operations.
2010In 2010, the Company continued its cost reduction program initiated in late 2008 and implemented additional restructuring actions resulting in a reductionof approximately 1,040 positions, impairment of certain assets, and lease cancellations. At January 1, 2011, approximately 500 employees impacted bythese actions remain with the Company, and are expected to leave in 2011. Pretax charges related to these actions totaled $19 million, including severanceand related costs of $15.3 million, impairment of fixed assets, buildings, and land of $2.6 million, and lease cancellation charges of $1.1 million. The tablebelow details the accruals and payments related to these actions:
(In millions)
Pressure-sensitiveMaterialsSegment
RetailInformation
ServicesSegment
Office andConsumer
ProductsSegment
Otherspecialty
convertingbusinesses Total
Total severance and related costs accrued during the period endedApril 3, 2010 $ 1.5 $ 2.2 $ .7 $ .3 $ 4.7July 3, 2010 2.0 – (.1) – 1.9October 2, 2010 .1 .9 4.5 .3 5.8January 1, 2011 .9 (.4) .2 2.2 2.9
Total expense accrued during 2010 4.5 2.7 5.3 2.8 15.32010 Settlements (3.9) (1.9) (.5) (.6) (6.9)
Balance at January 1, 2011 $ .6 $ .8 $4.8 $2.2 $ 8.4
Asset ImpairmentsMachinery and equipment $ .2 $ .2 $ – $ .1 $ .5Buildings .7 .9 – – 1.6Land .5 – – – .5OtherLease cancellations – .2 .9 – 1.1
$ 1.4 $ 1.3 $ .9 $ .1 $ 3.7
2009In 2009, the Company continued its cost reduction program initiated in late 2008, resulting in a reduction of approximately 3,335 positions, impairment ofcertain assets, and lease cancellations. At January 1, 2011, no employees impacted by these actions remain with the Company. Pretax charges related to
55 Avery Dennison Corporation2010 Annual Report
Notes to Consolidated Financial Statements
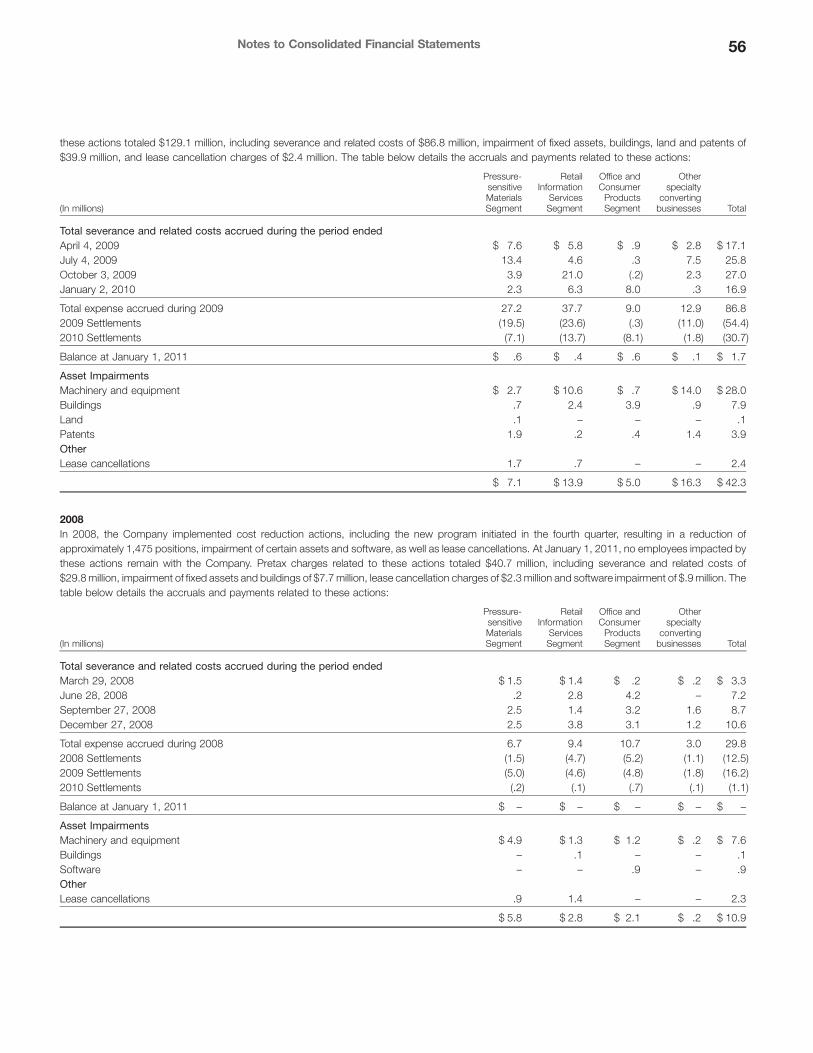
these actions totaled $129.1 million, including severance and related costs of $86.8 million, impairment of fixed assets, buildings, land and patents of$39.9 million, and lease cancellation charges of $2.4 million. The table below details the accruals and payments related to these actions:
(In millions)
Pressure-sensitiveMaterialsSegment
RetailInformation
ServicesSegment
Office andConsumer
ProductsSegment
Otherspecialty
convertingbusinesses Total
Total severance and related costs accrued during the period endedApril 4, 2009 $ 7.6 $ 5.8 $ .9 $ 2.8 $ 17.1July 4, 2009 13.4 4.6 .3 7.5 25.8October 3, 2009 3.9 21.0 (.2) 2.3 27.0January 2, 2010 2.3 6.3 8.0 .3 16.9
Total expense accrued during 2009 27.2 37.7 9.0 12.9 86.82009 Settlements (19.5) (23.6) (.3) (11.0) (54.4)2010 Settlements (7.1) (13.7) (8.1) (1.8) (30.7)
Balance at January 1, 2011 $ .6 $ .4 $ .6 $ .1 $ 1.7
Asset ImpairmentsMachinery and equipment $ 2.7 $ 10.6 $ .7 $ 14.0 $ 28.0Buildings .7 2.4 3.9 .9 7.9Land .1 – – – .1Patents 1.9 .2 .4 1.4 3.9OtherLease cancellations 1.7 .7 – – 2.4
$ 7.1 $ 13.9 $ 5.0 $ 16.3 $ 42.3
2008In 2008, the Company implemented cost reduction actions, including the new program initiated in the fourth quarter, resulting in a reduction ofapproximately 1,475 positions, impairment of certain assets and software, as well as lease cancellations. At January 1, 2011, no employees impacted bythese actions remain with the Company. Pretax charges related to these actions totaled $40.7 million, including severance and related costs of$29.8 million, impairment of fixed assets and buildings of $7.7 million, lease cancellation charges of $2.3 million and software impairment of $.9 million. Thetable below details the accruals and payments related to these actions:
(In millions)
Pressure-sensitiveMaterialsSegment
RetailInformation
ServicesSegment
Office andConsumer
ProductsSegment
Otherspecialty
convertingbusinesses Total
Total severance and related costs accrued during the period endedMarch 29, 2008 $ 1.5 $ 1.4 $ .2 $ .2 $ 3.3June 28, 2008 .2 2.8 4.2 – 7.2September 27, 2008 2.5 1.4 3.2 1.6 8.7December 27, 2008 2.5 3.8 3.1 1.2 10.6
Total expense accrued during 2008 6.7 9.4 10.7 3.0 29.82008 Settlements (1.5) (4.7) (5.2) (1.1) (12.5)2009 Settlements (5.0) (4.6) (4.8) (1.8) (16.2)2010 Settlements (.2) (.1) (.7) (.1) (1.1)
Balance at January 1, 2011 $ – $ – $ – $ – $ –
Asset ImpairmentsMachinery and equipment $ 4.9 $ 1.3 $ 1.2 $ .2 $ 7.6Buildings – .1 – – .1Software – – .9 – .9OtherLease cancellations .9 1.4 – – 2.3
$ 5.8 $ 2.8 $ 2.1 $ .2 $ 10.9
56Notes to Consolidated Financial Statements
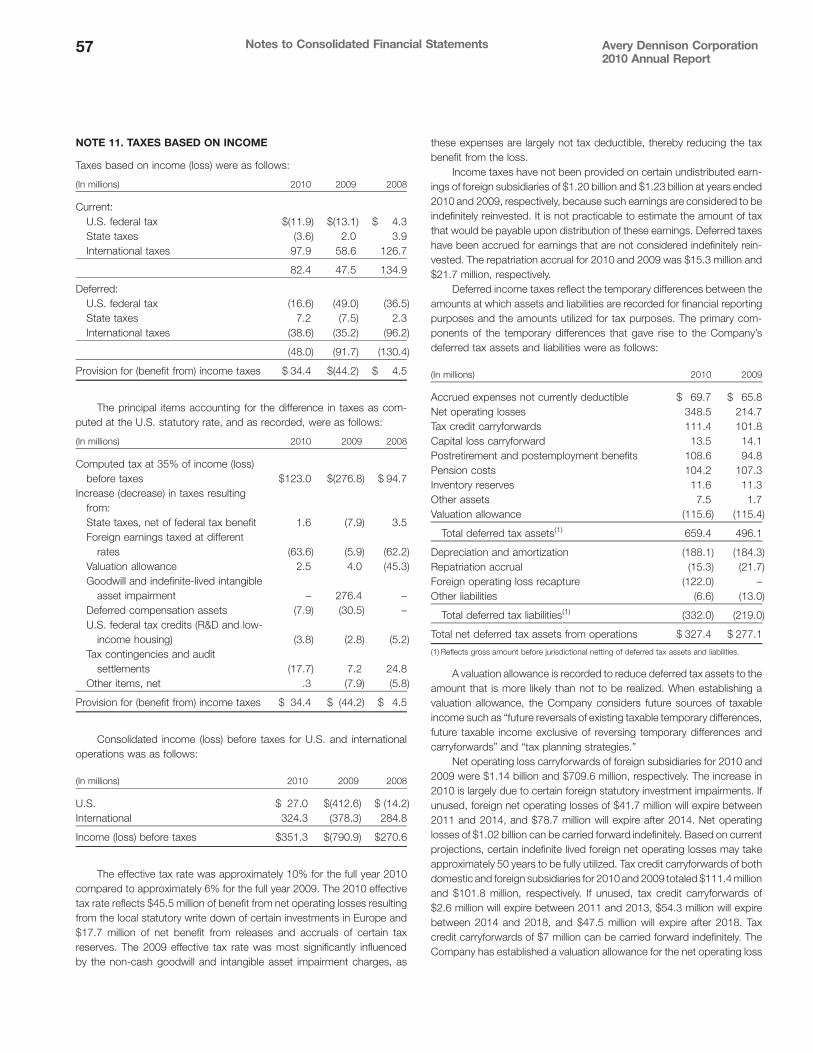
NOTE 11. TAXES BASED ON INCOME
Taxes based on income (loss) were as follows:
(In millions) 2010 2009 2008
Current:U.S. federal tax $(11.9) $(13.1) $ 4.3State taxes (3.6) 2.0 3.9International taxes 97.9 58.6 126.7
82.4 47.5 134.9
Deferred:U.S. federal tax (16.6) (49.0) (36.5)State taxes 7.2 (7.5) 2.3International taxes (38.6) (35.2) (96.2)
(48.0) (91.7) (130.4)
Provision for (benefit from) income taxes $ 34.4 $(44.2) $ 4.5
The principal items accounting for the difference in taxes as com-puted at the U.S. statutory rate, and as recorded, were as follows:
(In millions) 2010 2009 2008
Computed tax at 35% of income (loss)before taxes $123.0 $(276.8) $ 94.7
Increase (decrease) in taxes resultingfrom:State taxes, net of federal tax benefit 1.6 (7.9) 3.5Foreign earnings taxed at different
rates (63.6) (5.9) (62.2)Valuation allowance 2.5 4.0 (45.3)Goodwill and indefinite-lived intangible
asset impairment – 276.4 –Deferred compensation assets (7.9) (30.5) –U.S. federal tax credits (R&D and low-
income housing) (3.8) (2.8) (5.2)Tax contingencies and audit
settlements (17.7) 7.2 24.8Other items, net .3 (7.9) (5.8)
Provision for (benefit from) income taxes $ 34.4 $ (44.2) $ 4.5
Consolidated income (loss) before taxes for U.S. and internationaloperations was as follows:
(In millions) 2010 2009 2008
U.S. $ 27.0 $(412.6) $ (14.2)International 324.3 (378.3) 284.8
Income (loss) before taxes $351.3 $(790.9) $270.6
The effective tax rate was approximately 10% for the full year 2010compared to approximately 6% for the full year 2009. The 2010 effectivetax rate reflects $45.5 million of benefit from net operating losses resultingfrom the local statutory write down of certain investments in Europe and$17.7 million of net benefit from releases and accruals of certain taxreserves. The 2009 effective tax rate was most significantly influencedby the non-cash goodwill and intangible asset impairment charges, as
these expenses are largely not tax deductible, thereby reducing the taxbenefit from the loss.
Income taxes have not been provided on certain undistributed earn-ings of foreign subsidiaries of $1.20 billion and $1.23 billion at years ended2010 and 2009, respectively, because such earnings are considered to beindefinitely reinvested. It is not practicable to estimate the amount of taxthat would be payable upon distribution of these earnings. Deferred taxeshave been accrued for earnings that are not considered indefinitely rein-vested. The repatriation accrual for 2010 and 2009 was $15.3 million and$21.7 million, respectively.
Deferred income taxes reflect the temporary differences between theamounts at which assets and liabilities are recorded for financial reportingpurposes and the amounts utilized for tax purposes. The primary com-ponents of the temporary differences that gave rise to the Company’sdeferred tax assets and liabilities were as follows:
(In millions) 2010 2009
Accrued expenses not currently deductible $ 69.7 $ 65.8Net operating losses 348.5 214.7Tax credit carryforwards 111.4 101.8Capital loss carryforward 13.5 14.1Postretirement and postemployment benefits 108.6 94.8Pension costs 104.2 107.3Inventory reserves 11.6 11.3Other assets 7.5 1.7Valuation allowance (115.6) (115.4)
Total deferred tax assets(1) 659.4 496.1
Depreciation and amortization (188.1) (184.3)Repatriation accrual (15.3) (21.7)Foreign operating loss recapture (122.0) –Other liabilities (6.6) (13.0)
Total deferred tax liabilities(1) (332.0) (219.0)
Total net deferred tax assets from operations $ 327.4 $ 277.1
(1) Reflects gross amount before jurisdictional netting of deferred tax assets and liabilities.
A valuation allowance is recorded to reduce deferred tax assets to theamount that is more likely than not to be realized. When establishing avaluation allowance, the Company considers future sources of taxableincome such as “future reversals of existing taxable temporary differences,future taxable income exclusive of reversing temporary differences andcarryforwards” and “tax planning strategies.”
Net operating loss carryforwards of foreign subsidiaries for 2010 and2009 were $1.14 billion and $709.6 million, respectively. The increase in2010 is largely due to certain foreign statutory investment impairments. Ifunused, foreign net operating losses of $41.7 million will expire between2011 and 2014, and $78.7 million will expire after 2014. Net operatinglosses of $1.02 billion can be carried forward indefinitely. Based on currentprojections, certain indefinite lived foreign net operating losses may takeapproximately 50 years to be fully utilized. Tax credit carryforwards of bothdomestic and foreign subsidiaries for 2010 and 2009 totaled $111.4 millionand $101.8 million, respectively. If unused, tax credit carryforwards of$2.6 million will expire between 2011 and 2013, $54.3 million will expirebetween 2014 and 2018, and $47.5 million will expire after 2018. Taxcredit carryforwards of $7 million can be carried forward indefinitely. TheCompany has established a valuation allowance for the net operating loss
57 Avery Dennison Corporation2010 Annual Report
Notes to Consolidated Financial Statements

and credit carryforwards not expected to be utilized. The valuation allow-ance for 2010 and 2009 is $115.6 million and $115.4 million, respectively.
The Company has been granted tax holidays in several jurisdictionsincluding Bangladesh, China, Thailand and Vietnam. The tax holidaysexpire between 2011 and 2016. These tax holidays benefit the Company’sconsolidated effective tax rate on operations by less than 2%.
Tax Benefit ReserveOn January 1, 2011, the Company’s unrecognized tax benefits totaled$154.2 million, including $102.1 million of unrecognized tax benefitswhich, if recognized, would reduce the annual effective income tax rate.As of January 2, 2010, the Company’s unrecognized tax benefits totaled$182.0 million, including $121.8 million of unrecognized tax benefitswhich, if recognized, would reduce the annual effective income tax rate.
Where applicable, the Company recognizes potential accrued inter-est and penalties related to unrecognized tax benefits from its globaloperations in income tax expense. The Company recognized a benefit of$2.6 million of interest and penalties in the Consolidated Statements ofOperations in 2010 and an expense of $1.1 million and $7.6 million ofinterest and penalties in the Consolidated Statements of Operations in2009 and 2008, respectively. The Company has accrued for $20.9 millionand $23.4 million of interest and penalties in the Consolidated BalanceSheets in 2010 and 2009, respectively.
A reconciliation of the beginning and ending amount of unrecognizedtax benefits is as follows:
(In millions) 2010 2009
Balance at beginning of year $151.7 $142.9Acquired balance – 8.0Additions based on tax positions related to the
current year 17.4 32.0Additions for tax position of prior years 7.0 9.8Reductions for tax positions of prior years:
Changes in judgment – (1.8)Settlements (7.9) (2.1)Lapses of applicable statute (36.7) (41.9)
Changes due to translation of foreign currencies (4.3) 4.8
Balance at end of year (excluding interest andpenalties) 127.2 151.7
Interest and penalties associated with uncertain taxpositions 27.0 30.3
Balance at end of year (including interest andpenalties) $154.2 $182.0
The amount of income taxes the Company pays is subject to ongoingaudits by taxing jurisdictions around the world. The Company’s estimate ofthe potential outcome of any uncertain tax issue is subject to management’sassessment of relevant risks, facts, and circumstances existing at that time.The Company believes that it has adequately provided for reasonablyforeseeable outcomes related to these matters. However, the Company’sfuture results may include favorable or unfavorable adjustments to its esti-mated tax liabilities in the period the assessments are made or resolved,which may impact the Company’s effective tax rate. With some exceptions,the Company and its subsidiaries are no longer subject to income taxexaminations by tax authorities for years prior to 2005.
It is reasonably possible that during the next 12 months, the Companymay realize a decrease in its gross uncertain tax positions by approxi-mately $32 million, primarily as the result of cash payments and closing taxyears. The Company anticipates that it is reasonably possible that cashpayments of up to $14 million relating to gross uncertain tax positionscould be paid within the next 12 months.
NOTE 12. SEGMENT INFORMATION
The accounting policies of the segments are described in Note 1, “Sum-mary of Significant Accounting Policies.” Intersegment sales are recordedat or near market prices and are eliminated in determining consolidatedsales. The Company evaluates performance based on income from oper-ations before interest expense and taxes. General corporate expenses arealso excluded from the computation of income from operations for thesegments.
The Company does not disclose total assets by reportable segmentsince the Company does not produce and review such information inter-nally. The Company does not disclose revenues from external customersfor each product because it is impracticable to do so. As the Company’sreporting structure is not organized by country, results by individual coun-try are not provided because it is impracticable to do so.
Financial information by reportable segment and other businessesfrom operations is set forth below. Prior year amounts have been restatedto reflect the transfer of a business from Retail Information Services toother specialty converting businesses to align with a change in theCompany’s internal reporting structure.
(In millions) 2010 2009 2008
Net sales to unaffiliated customers:Pressure-sensitive Materials $3,639.8 $3,300.0 $3,643.8Retail Information Services 1,521.7 1,320.9 1,547.2Office and Consumer Products 815.2 849.3 935.8Other specialty converting
businesses 536.0 482.5 583.6
Net sales to unaffiliated customers $6,512.7 $5,952.7 $6,710.4
Intersegment sales:Pressure-sensitive Materials $ 157.0 $ 147.1 $ 172.5Retail Information Services 2.0 1.6 2.1Office and Consumer Products .8 .7 1.2Other specialty converting
businesses 30.7 15.8 26.3Eliminations (190.5) (165.2) (202.1)
Intersegment sales $ – $ – $ –
Income (loss) before taxes:Pressure-sensitive Materials $ 317.8 $ 184.7 $ 257.2Retail Information Services 65.0 (899.0) 13.5Office and Consumer Products 91.5 118.1 145.7Other specialty converting
businesses 4.8 (44.1) 5.2Corporate expense (51.2) (65.3) (35.1)Interest expense (76.6) (85.3) (115.9)
Income (loss) before taxes $ 351.3(1) $ (790.9)(2) $ 270.6(3)
58Notes to Consolidated Financial Statements

(In millions) 2010 2009 2008
Capital expenditures:Pressure-sensitive Materials $ 50.2 $ 41.5 $ 50.1Retail Information Services 28.2 19.6 45.0Office and Consumer Products 4.4 5.6 6.1Other specialty converting
businesses 22.7 7.6 16.6Corporate 1.8 1.3 1.4
Capital expenditures(4) $ 107.3 $ 75.6 $ 119.2
Depreciation expense:Pressure-sensitive Materials $ 77.8 $ 86.2 $ 91.7Retail Information Services 53.2 58.3 65.6Office and Consumer Products 11.2 13.6 17.0Other specialty converting
businesses 26.7 25.6 26.3Corporate 4.0 3.9 4.0
Depreciation expense $ 172.9 $ 187.6 $ 204.6
(1) Results for 2010 included “Other expense, net” totaling $27.7, consisting of restructuring costs,asset impairment charges and lease cancellation costs of $19, loss from curtailment andsettlement of pension obligations of $4.3, loss from debt extinguishments of $4, net legalsettlement costs of $.9, partially offset by a gain on a sale of investment of $(.5). Of the total$27.7, the Pressure-sensitive Materials segment recorded $6.9, the Retail Information Servicessegment recorded $5.8, the Office and Consumer Products segment recorded $8.4, the otherspecialty converting businesses recorded $3.1, and Corporate recorded $3.5.
(2) Results for 2009 included “Other expense, net” totaling $191.3, consisting of restructuringcosts, asset impairment charges and lease cancellation costs of $129.1, legal settlements of$41, and a loss from debt extinguishment of $21.2. Of the total $191.3, the Pressure-sensitiveMaterials segment recorded $75.3, the Retail Information Services segment recorded $51.6, theOffice and Consumer Products segment recorded $14, the other specialty converting busi-nesses recorded $29.2 and Corporate recorded $21.2.
Additionally, 2009 operating loss for the Retail Information Services segment included goodwilland indefinite-lived intangible asset impairment charges of $832 taken in the first quarter of2009.
(3) Results for 2008 included “Other expense, net” totaling $36.2, consisting of restructuring costs,asset impairment charges and lease cancellation costs of $40.7, partially offset by a gain on saleof investments of $(4.5). Of the total $36.2, the Pressure-sensitive Materials segment recorded$12.6, the Retail Information Services segment recorded $12.2, the Office and ConsumerProducts segment recorded $12.7, the other specialty converting businesses recorded $3.2and Corporate recorded $(4.5).
Additionally, 2008 operating income for the Retail Information Services segment includedtransition costs associated with the Paxar and DM Label acquisitions of $24.1.
(4) Included capital expenditures accrued but not paid of $12.4 in 2010, $8.2 in 2009 and $4.7 in2008. Capital expenditures refer to purchases of property, plant and equipment.
Financial information relating to the Company’s operations by geo-graphic area is set forth below:
(In millions) 2010 2009 2008
Net sales to unaffiliated customers:U.S. $2,111.5 $2,026.4 $2,218.4Europe 2,019.5 1,949.4 2,366.6Asia 1,513.3 1,236.8 1,297.6Latin America 484.3 394.2 448.0Other international 384.1 345.9 379.8
Net sales $6,512.7 $5,952.7 $6,710.4
Property, plant and equipment, net:U.S. $ 488.4 $ 509.3 $ 604.2International 774.5 845.4 888.8
Property, plant and equipment, net $1,262.9 $1,354.7 $1,493.0
Revenues are attributed to geographic areas based on the location towhich the product is shipped. Export sales from the United States tounaffiliated customers are not a material factor in the Company’s business.
NOTE 13. QUARTERLY FINANCIAL INFORMATION (Unaudited)
(In millions, except per share data)First
Quarter(1)SecondQuarter(2)
ThirdQuarter(3)
FourthQuarter(4)
2010Net sales $1,554.7 $1,680.1 $1,640.8 $1,637.1Gross profit 440.8 490.4 453.0 441.8Net income 54.7 83.8 64.2 114.2Net income per common share .52 .79 .61 1.08Net income per common share, assuming dilution .51 .78 .60 1.06
2009Net sales $1,426.2 $1,455.4 $1,549.3 $1,521.8Gross profit 345.1 390.3 436.0 415.1Net income (loss) (898.9) 39.8 62.5 49.9Net income (loss) per common share (8.99) .38 .59 .47Net income (loss) per common share, assuming dilution (8.99) .38 .59 .47
(1) Results in the first quarter of 2010 included pretax “Other expense, net” totaling $6.3, consisting of restructuring costs of $4.7, asset impairment charges of $.2, and an accrual for legal settlements of $1.4.
Results in the first quarter of 2009 included pretax “Other expense, net” totaling $97.3 consisting of asset impairment charges of $21.9, restructuring costs of $17.1, lease cancellation charges of $.1, anaccrual for a legal settlement of $37, and a loss of $21.2 from debt extinguishment. Additionally, results included goodwill and indefinite-lived intangible asset impairment charges of $832.
(2) Results in the second quarter of 2010 included pretax “Other expense, net” totaling $4.6, consisting of restructuring costs of $1.9, asset impairment charges of $.6, a loss from curtailment and settlementof a foreign pension obligation of $1.9, and a loss of $1.2 from debt extinguishment, partially offset by a gain on sale of investment of $(.5) and net gain on legal settlements of $(.5).
Results in the second quarter of 2009 included pretax “Other expense, net” totaling $29.6 consisting of restructuring costs of $25.8 asset impairment charges of $3.3, and lease cancellation charges of $.5.
59 Avery Dennison Corporation2010 Annual Report
Notes to Consolidated Financial Statements

(3) Results in the third quarter of 2010 included pretax “Other expense, net” totaling $10.5, consisting of restructuring costs of $5.8, asset impairment charges of $1.3 and lease cancellation costs of $1 and aloss from curtailment and settlement of domestic pension obligations of $2.4.
Results in the third quarter of 2009 included pretax “Other expense, net” totaling $35.5 consisting of restructuring costs of $27 and asset impairment charges of $4.7, lease cancellation charges of $1.8,and legal settlement charges of $2.
(4) Results in the fourth quarter of 2010 included pretax “Other expense, net” totaling $6.3 consisting of restructuring costs of $2.9, asset impairment charges of $.4, and lease cancellation charges of $.2, anda loss of $2.8 from debt extinguishment.
Results in the fourth quarter of 2009 included pretax “Other expense, net” totaling $28.9 consisting of restructuring costs of $16.9, asset impairment charges of $9.9, lease cancellation charges of $.1, andlegal settlement charges of $2. Additionally, results included out-of-period adjustments related to deferred compensation assets of $4.9 and a deferred tax asset of $1, which decreased net income by$5.9.
NOTE 14. FAIR VALUE MEASUREMENTS
Recurring Fair Value MeasurementsThe following table provides the assets and liabilities carried at fair value measured on a recurring basis as of January 1, 2011:
(In millions) Total
Quoted Prices inActive Markets
(Level 1)
SignificantOther
ObservableInputs
(Level 2)
SignificantOther
UnobservableInputs
(Level 3)
Fair Value Measurements Using
Assets:Available for sale securities $12.2 $12.2 $ – $ –Derivative assets 16.9 .1 16.8 –
Liabilities:Derivative liabilities $10.3 $ 2.4 $ 7.9 $ –
The following table provides the assets and liabilities carried at fair value measured on a recurring basis as of January 2, 2010:
(In millions) Total
Quoted Prices inActive Markets
(Level 1)
SignificantOther
ObservableInputs
(Level 2)
SignificantOther
UnobservableInputs
(Level 3)
Fair Value Measurements Using
Assets:Available for sale securities $11.9 $11.9 $ – $ –Derivative assets 5.5 .5 5.0 –
Liabilities:Derivative liabilities $10.0 $ 3.5 $6.5 $ –
Available for sale securities are measured at fair value using quoted prices and classified within Level 1 of the valuation hierarchy. Derivatives that areexchange-traded are measured at fair value using quoted market prices and are classified within Level 1 of the valuation hierarchy. Derivatives measuredbased on inputs that are readily available in public markets are classified within Level 2 of the valuation hierarchy.
Non-recurring Fair Value MeasurementsThe following table summarizes the fair value measurements of assets measured on a non-recurring basis during 2010:
(In millions) Total
Quoted Prices inActive Markets
(Level 1)
SignificantOther
ObservableInputs
(Level 2)
SignificantOther
UnobservableInputs
(Level 3)Total
Gains (Losses)
Fair Value Measurements Using
Long-lived assets $2.4 $ – $2.4 $ – $(1.0)
Long-lived assets with carrying amounts totaling $3.4 million were written down to their fair values of $2.4 million, resulting in an impairment charge of$1.0 million during 2010, which was included in “Other expense, net” in the Consolidated Statements of Operations.
60Notes to Consolidated Financial Statements

The following table summarizes the fair value measurements of assets measured on a non-recurring basis during 2009:
(In millions) Total
Quoted Prices inActive Markets
(Level 1)
SignificantOther
ObservableInputs
(Level 2)
SignificantOther
UnobservableInputs
(Level 3)Total
Gains (Losses)
Fair Value Measurements Using
Goodwill $415.0 $ – $ – $415.0 $(820.0)Indefinite-lived intangible assets 18.0 – – 18.0 (12.0)Long-lived assets 11.0 – 8.0 3.0 (20.3)
Long-lived assets with carrying amounts totaling $31.3 million were written down to their fair values totaling $11 million, resulting in impairmentcharges of $20.3 million during 2009. These charges were included in “Other expense, net” in the Consolidated Statements of Operations.
Goodwill with a carrying amount of $1.21 billion was written down to its estimated implied fair value of $415 million, resulting in a non-cash impairmentcharge of $820 million in the first quarter of 2009. Additionally, certain indefinite-lived assets with a carrying value of approximately $30 million were writtendown to their estimated implied fair value of $18 million, resulting in a non-cash impairment charge of $12 million in the first quarter of 2009. These chargeswere included in “Goodwill and indefinite-lived intangible asset impairment charges” in the Consolidated Statements of Operations. Refer to Note 3,“Goodwill and Other Intangibles Resulting from Business Acquisitions,” for further information.
61 Avery Dennison Corporation2010 Annual Report
Notes to Consolidated Financial Statements

STATEMENT OF MANAGEMENT RESPONSIBILITY FOR FINANCIAL STATEMENTS
The consolidated financial statements and accompanying information were prepared by and are the responsibility of management. The statements wereprepared in conformity with accounting principles generally accepted in the United States of America and, as such, include amounts that are based onmanagement’s best estimates and judgments.
Oversight of management’s financial reporting and internal accounting control responsibilities is exercised by the Board of Directors, through the AuditCommittee, which is comprised solely of independent directors. The Committee meets periodically with financial management, internal auditors and theindependent registered public accounting firm to obtain reasonable assurance that each is meeting its responsibilities and to discuss matters concerningauditing, internal accounting control and financial reporting. The independent registered public accounting firm and the Company’s internal auditdepartment have free access to meet with the Audit Committee without management’s presence.
MANAGEMENT’S REPORT ON INTERNAL CONTROL OVER FINANCIAL REPORTING
Management is responsible for establishing and maintaining adequate internal control over financial reporting, as such term is defined in Exchange ActRule 13a-15(f). Under the supervision and with the participation of management, including the chief executive officer and chief financial officer, theCompany conducted an evaluation of the effectiveness of internal control over financial reporting based on the framework in Internal Control — IntegratedFramework issued by the Committee of Sponsoring Organizations of the Treadway Commission. Based on the Company’s evaluation under the frameworkin Internal Control — Integrated Framework, management has concluded that internal control over financial reporting was effective as of January 1, 2011.Management’s assessment of the effectiveness of internal control over financial reporting as of January 1, 2011 has been audited by Pricewaterhou-seCoopers LLP, an independent registered public accounting firm, as stated in their report which is included herein.
Dean A. ScarboroughChairman, President andChief Executive Officer
Mitchell R. ButierSenior Vice Presidentand Chief Financial Officer
62

TO THE BOARD OF DIRECTORS AND SHAREHOLDERS OF AVERY DENNISON CORPORATION:
In our opinion, the accompanying consolidated balance sheets and the related consolidated statements of operations, shareholders’ equity, and cashflows present fairly, in all material respects, the financial position of Avery Dennison Corporation and its subsidiaries at January 1, 2011 and January 2,2010, and the results of their operations and their cash flows for each of the three years in the period ended January 1, 2011 in conformity with accountingprinciples generally accepted in the United States of America. Also in our opinion, the Company maintained, in all material respects, effective internalcontrol over financial reporting as of January 1, 2011, based on criteria established in Internal Control — Integrated Framework issued by the Committee ofSponsoring Organizations of the Treadway Commission (COSO). The Company’s management is responsible for these financial statements, formaintaining effective internal control over financial reporting and for its assessment of the effectiveness of internal control over financial reporting,included in the accompanying “Management’s Report on Internal Control over Financial Reporting.” Our responsibility is to express opinions on thesefinancial statements and on the Company’s internal control over financial reporting based on our integrated audits. We conducted our audits in accordancewith the standards of the Public Company Accounting Oversight Board (United States). Those standards require that we plan and perform the audits toobtain reasonable assurance about whether the financial statements are free of material misstatement and whether effective internal control over financialreporting was maintained in all material respects. Our audits of the financial statements included examining, on a test basis, evidence supporting theamounts and disclosures in the financial statements, assessing the accounting principles used and significant estimates made by management, andevaluating the overall financial statement presentation. Our audit of internal control over financial reporting included obtaining an understanding of internalcontrol over financial reporting, assessing the risk that a material weakness exists, and testing and evaluating the design and operating effectiveness ofinternal control based on the assessed risk. Our audits also included performing such other procedures as we considered necessary in the circumstances.We believe that our audits provide a reasonable basis for our opinions.
A company’s internal control over financial reporting is a process designed to provide reasonable assurance regarding the reliability of financial reportingand the preparation of financial statements for external purposes in accordance with generally accepted accounting principles. A company’s internalcontrol over financial reporting includes those policies and procedures that (i) pertain to the maintenance of records that, in reasonable detail, accuratelyand fairly reflect the transactions and dispositions of the assets of the company; (ii) provide reasonable assurance that transactions are recorded asnecessary to permit preparation of financial statements in accordance with generally accepted accounting principles, and that receipts and expenditures ofthe company are being made only in accordance with authorizations of management and directors of the company; and (iii) provide reasonable assuranceregarding prevention or timely detection of unauthorized acquisition, use, or disposition of the company’s assets that could have a material effect on thefinancial statements.
Because of its inherent limitations, internal control over financial reporting may not prevent or detect misstatements. Also, projections of any evaluation ofeffectiveness to future periods are subject to the risk that controls may become inadequate because of changes in conditions, or that the degree ofcompliance with the policies or procedures may deteriorate.
PricewaterhouseCoopers LLPLos Angeles, CaliforniaFebruary 25, 2011
63 Avery Dennison Corporation2010 Annual Report
Report of Independent RegisteredPublic Accounting Firm

64
CounselLatham & Watkins LLPLos Angeles, California
Independent Registered Public Accounting FirmPricewaterhouseCoopers LLPLos Angeles, California
Transfer Agent — RegistrarComputershare Trust Co., N.A.P. O. Box 43078Providence, Rhode Island 02940-3078(877) 498-8861(800) 952-9245 (TDD/TTY)www.computershare.com/investor
Annual meetingThe Annual Meeting of Shareholders will be held at 1:30 p.m. on April 28, 2011 in the Conference Center of the Avery Dennison Miller Corporate Center, 150 North Orange Grove Boulevard, Pasadena, California.
The DirectSeRvICe™ Investment ProgramShareholders of record may reinvest their cash dividends in additional shares of Avery Dennison common stock at market price. Investors may also invest optional cash payments of up to $12,500 per month in Avery Dennison common stock at market price. Avery Dennison investors not yet participating in the program, as well as brokers and custodians who hold Avery Dennison common stock for clients, may obtain a copy of the program by writing to The DirectSERVICE™ Investment Program, c/o Computershare Trust Co., Inc. (include a reference to Avery Dennison in the correspondence), P.O. Box 43078, Providence, RI 02940-3078, calling (877) 498-8861, or logging onto their web site at www.computershare.com/investor.
Direct Deposit of DividendsAvery Dennison shareholders may deposit quarterly dividend checks directly into their checking or savings accounts. For more information, call Avery Dennison’s transfer agent and registrar, Computershare Trust Co., Inc., at (877) 498-8861.
Other InformationThe Company included Exhibits 31.1 and 31.2 to its Annual Report on Form 10-K for fiscal year 2010 filed with the Securities and Exchange Commission (“SEC”), certificates of the Chief Executive Officer and Chief Financial Officer of the Company pursuant to Section 302 of the Sarbanes-Oxley Act of 2002, and the Company submitted to the New York Stock Exchange (“NYSE”) the Company’s annual written affirmation on April 28, 2010, along with the Chief Executive Officer’s certificate that he was not aware of any violation by the Company of NYSE’s corporate governance listing standards. A copy of the Company’s Annual Report on Form 10-K, as filed with the SEC, will be furnished to shareholders and interested investors free of charge upon written request to the Secretary of the Company. Copies may also be obtained from the “Investors” section of the Company’s web site at www.averydennison.com.
Corporate headquartersAvery Dennison CorporationMiller Corporate Center150 North Orange Grove BoulevardPasadena, California 91103Phone: (626) 304-2000Fax: (626) 792-7312
mailing AddressP.O. Box 7090Pasadena, California 91109-7090
Stock and Dividend DataCommon shares of Avery Dennison are listed on the NYSE.Ticker symbol: AVY 2010 2009 High Low High Low
market Price (1)
First Quarter $ 40.07 $ 30.79 $ 33.61 $ 17.26 Second Quarter 41.39 31.32 29.76 23.94Third Quarter 38.04 31.67 36.56 24.23Fourth Quarter 42.49 35.80 40.02 34.81
(1) Prices shown represent closing prices on the NYSE
2010 2009
dividends Per common shareFirst Quarter $ .20 $ .41Second Quarter .20 .41Third Quarter .20 .20Fourth Quarter .20 .20
Total $ .80 $ 1.22
Number of shareholders of record as of year end 7,610 8,180
©2011 Avery Dennison Corporation. All rights reserved. Avery Dennison, Avery and all other Avery brands, product names and codes are trademarks of Avery Dennison Corporation. All other brands and product names are trademarks of their respective owners.
Corporate Information
Corporate Information

Avery Dennison Corporation 2010 Annual Report
65
notes

66
notes

Avery Dennison Corporation 2010 Annual Report
67
notes

68
notes

DE
SIG
N: V
SA
Par
tner
s, In
c.
PR
INTI
NG
: Bow
ne &
Co.
, Inc
. P
HO
TOG
RA
PH
Y: M
icha
el H
eves
y
We encourage you to visit www.averydennison.com/2010review and experience the Avery Dennison 2010 Year in Review to read more about how our solutions make brands more inspiring and the world more intelligent.Investor InformationObtain stock quotes and annual reports at www.investors.averydennison.com Send inquiries via e-mail to [email protected]
Career OpportunitiesLearn more about the Avery Dennison difference at www.averydennison.com/careers
Other Company Web Sites include:www.fasson.com www.rbis.averydennison.com www.avery.com www.averygraphics.com

Avery Dennison Corporationmiller Corporate Center150 north Orange grove BoulevardPasadena, California 91103www.averydennison.com