background statement for semi draft document...
TRANSCRIPT

Background Statement for SEMI Draft Document 4571J NEW STANDARD: TEST METHOD OF PDP TONE AND COLOR REPRODUCTION
Notice: This background statement is not part of the balloted item. It is provided solely to assist the recipient in reaching an informed decision based on the rationale of the activity that preceded the creation of this Document. Notice: Recipients of this Document are invited to submit, with their comments, notification of any relevant patented technology or copyrighted items of which they are aware and to provide supporting documentation. In this context, “patented technology” is defined as technology for which a patent has issued or has been applied for. In the latter case, only publicly available information on the contents of the patent application is to be provided. Background
Different types of flat panel displays (e.g., LCD, PDP, and OLED) have different features and characteristics depending on their nature like luminance by the APL characteristics.
For example, the maximum luminance of PDP varies according to the average picture level (APL) by its limitation of power consumption characteristics. The APL characteristics are not always disadvantages but sometimes advantages from the perspective of eye fatigue while watching TV. So, PDP module and PDP TV need a reasonable standard for display characteristics. In order to determine a reasonable standard, we can consider a fixed window measurement, for example 1/16 of the display (1/4 of the display both horizontally and vertically) to test gamma. For most scenes the average brightness does not change suddenly; the variation of APL during watching TV has almost no influence on the picture quality. This document is necessary to set an industry standard on PDP tone and color reproduction (gamma and color gamut accuracy) for estimation of basic picture quality for PDPs.
Revision Control
Date Version Name Edits
June, 2008 1.0 Kyungjin Kang First version of this document
October, 2008 1.1 Kyungjin Kang Document was transferred to the FPD Metrology Committee to resolve scope issue.
February, 2009 1.2 Kyungjin Kang Improved English
January, 2010 1.3 Kyungjin Kang Reflected reject comments, Improved figures
February, 2011 1.4 Kyungjin Kang Failed to get 60% return rate
June, 2011 1.5 Kyungjin Kang Reflected reject comments, Improved figures
January, 2012 1.6 Kyungjin Kang Reflected reject comments, Improved figures
March, 2012 1.7 Kyungjin Kang Reflected reject comments, Improved figures
February, 2013 1.8 Kyungjin Kang Reflected reject comments, Improved figures
June, 2013 1.9 Kyungjin Kang Reflected reject comments, Improved figures
Review and Adjudication Information
Task Force Adjudication Committee Adjudication
Group: To be reviewed at the Korea Tone and Color TF meeting
Korea FPD Metrology Technical Committee

Date: Thursday, November 7, 2013 Thursday, November 7, 2013
Time & Time Zone: 13:00 – 15:00 (KST) 15:00 – 17:00 (KST)
Location: SEMI Korea office SEMI Korea office
City, State/Country: Seoul, Korea Seoul, Korea
Leader(s): Kyung Jin Kang (LG Electronics), [email protected]
Jong Seo Lee (Samsung Electronics) [email protected] Il-Ho Kim (LMS) [email protected]
Document Originator(s) Kyung Jin Kang (LG Electronics), [email protected]
Kyung Jin Kang (LG Electronics), [email protected]
Standards Staff: Natalie Shim (SEMI Korea) 82.2.531.7808 [email protected]
Natalie Shim (SEMI Korea) 82.2.531.7808 [email protected]

This is a Draft Document of the SEMI International Standards program. No material on this page is to be construed as an official or adopted Standard or Safety Guideline. Permission is granted to reproduce and/or distribute this document, in whole or in part, only within the scope of SEMI International Standards committee (document development) activity. All other reproduction and/or distribution without the prior written consent of SEMI is prohibited.
Page 3 Doc. 4571J SEMI
Semiconductor Equipment and Materials International 3081 Zanker Road San Jose, CA 95134-2127 Phone: 408.943.6900, Fax: 408.943.7943
LE
TT
ER
(Y
EL
LO
W)
BA
LL
OT
DRAFTDocument Number: 4571J
Date: 2013-08-27
SEMI Draft Document 4571J NEW STANDARD: TEST METHOD OF PDP TONE AND COLOR REPRODUCTION
1 Purpose
1.1 This test method describes the measurement methods of principal characteristics of PDP (Plasma Display Panel) or PDP-TV, which is related to TV standard reproduction characteristics of fidelity to original video.
1.2 This standard is used to define methodologies used for measurement of PDP’s native features based on APL (Average Picture Level).
2 Scope
2.1 This standard is applicable to display quality evaluations standard of PDP modules or PDP TVs, but the metrology except APL luminance related equations, it can be applied to the other display device like LCD and OLED.
2.2 The standard includes practical methodologies of tone and color reproduction measurements. It does not address optical performance like contrast or brightness.
2.3 Tone and color of display device is basic features of a general display device. For standardization of PDP, high accuracy and fidelity to these standard features are necessary.
2.4 This standard is only for general purpose for display methodology. Hence special languages for special features or phenomena are not included.
NOTICE: SEMI Standards and Safety Guidelines do not purport to address all safety issues associated with their use. It is the responsibility of the users of the Documents to establish appropriate safety and health practices, and determine the applicability of regulatory or other limitations prior to use.
3 Referenced Standards and Documents
3.1 CIE Standards1
3.1.1 CIE — Standard colorimetric system
3.1.2 CIE 1931 — xy coordinates color space
3.1.3 CIE 1976 — u’v’ coordinates uniform color space
3.2 ICDM Standards2
3.2.1 IDMS — Information Display Measurements Standard, Version 1.03, June. 2012
3.3 ITU Standards3
3.3.1 ITU-R BT.709-5 — Parameter values for the HDTV standards for production and international program exchange, 2002
3.4 SMPTE Standards4
3.4.1 SMPTE 303M-2002 — Color Reference Pattern, August. 2002
3.5 Referenced Documents
3.5.1 R.W. G. Hunt, Measuring Color, 2nd ed. Chichester, U.K.: Ellis Horwood, 1987.
NOTICE: Unless otherwise indicated, all documents cited shall be the latest published versions.
1 CIE International Commission on Illumination, Kegelgasse 27, A-1030 Vienna, Austria 2 International Committee for Display Metrology, http://www.icdm-sid.org/, http://vesa.org/ 3 International Telecommunication Union – Telecommunication Standardization Sector, http://www.itu.int/ 4 The Society of Motion Picture and Television Engineers, http://smpte.org/

This is a Draft Document of the SEMI International Standards program. No material on this page is to be construed as an official or adopted Standard or Safety Guideline. Permission is granted to reproduce and/or distribute this document, in whole or in part, only within the scope of SEMI International Standards committee (document development) activity. All other reproduction and/or distribution without the prior written consent of SEMI is prohibited.
Page 4 Doc. 4571J SEMI
Semiconductor Equipment and Materials International 3081 Zanker Road San Jose, CA 95134-2127 Phone: 408.943.6900, Fax: 408.943.7943
LE
TT
ER
(Y
EL
LO
W)
BA
LL
OT
DRAFTDocument Number: 4571J
Date: 2013-08-27
4 Terminology
4.1 The definitions of general terms follow IDMS 1.03 and its following version.
4.2 Acronyms and Abbreviations
4.2.1 APL — average picture level
4.2.2 CCT — correlated color temperature
4.2.3 PDP — plasma display panel
4.3 Optical Terminology
4.3.1 tone — the gradation of output brightness by a display input variation. This usually means the gradation of gray, but color tone also includes the gradation of color.
4.3.2 color — the perceptual concept from hue and saturation of video signals including chrominance components. Generally the term color might be defined to include black, white and gray colors that have no chrominance component, but here color is defined as output with some chrominance components.
4.3.3 IRE — an arbitrary unit used to describe a video signal. White is defined to be 100 IRE and the blanking level is defined to be 0 IRE. It stands for Institute of Radio Engineers.
4.4 Measurement Terminology
4.4.1 average picture level (APL) — there are two kinds of APL, pre-gamma APL (Type 1 APL) for gamma corrected input signal(R, G, B) and post-gamma APL (Type 2 APL) for gamma de-corrected panel display signal(R’, G’, B’). APL without any notice usually indicates the post-gamma APL because APL is used for panel load processing. The post-gamma APL means the average of the total R, G and B data after gamma de-correction, not input signal (gamma corrected) values. The unit of APL is usually % and generally just APL means the post-gamma APL. The APL of input signal is greater than the post-gamma APL. The gamma de-corrected value of the input signal average is less than or equal to APL, where the equal case is only when all input data are equal or 0/100 IRE data.
4.4.2 correlated color temperature (CCT) — a term used to describe the color of a light source whose chromaticity lies close to the Planckian (black body) locus on a CIE 1960 chromaticity chart. In general, it is the temperature of a black body radiator which is the most similar to chromaticity of the evaluated light source and it is expressed in degree Kelvin. CCT is used to adjust white balance.
4.4.3 gamma —power relationship between R, G, or B input signals and their output luminance. It is applied to subdivide low level’s tone resolution with limited number of bits, and expressed by form(V’)γ of power function and it is specially called decoding gamma (γ_D). Conversely, its reciprocal is called encoding gamma (γ_E) which is processed on video camera side. Normally, decoding gamma(γ_D) = 2.2.
4.4.4 primary color — one of a set of colors that are combined to produce any desired set of intermediate colors, within a limitation called the “gamut.” The primary colors for color television are red, green, and blue. The exact red, green, blue colors used are dependent on the television standard. Display devices do not usually use the same primary colors, resulting in minor color changes from ideal.
4.4.5 white balance — adjustment or accuracy of color coordinates at a white input level, usually equal to or greater than 70% APL of full screen.
4.4.6 gray balance — adjustment or accuracy of color coordinates at all input ranges, usually from 5 IRE to 100 IRE inputs. It is explained by all range white balance meaning.
4.4.7 luminance uniformity — In IDMS, it is calculated by Minimum luminance divided by Maximum luminance among the defined screen positions and presented by %. For the measurement positions of a screen, refer to IDMS
5 Test Setup
5.1 Setup conditions
5.1.1 All measurements shall be carried out in a dark room normally under 1 lux.

This is a Draft Document of the SEMI International Standards program. No material on this page is to be construed as an official or adopted Standard or Safety Guideline. Permission is granted to reproduce and/or distribute this document, in whole or in part, only within the scope of SEMI International Standards committee (document development) activity. All other reproduction and/or distribution without the prior written consent of SEMI is prohibited.
Page 5 Doc. 4571J SEMI
Semiconductor Equipment and Materials International 3081 Zanker Road San Jose, CA 95134-2127 Phone: 408.943.6900, Fax: 408.943.7943
LE
TT
ER
(Y
EL
LO
W)
BA
LL
OT
DRAFTDocument Number: 4571J
Date: 2013-08-27
5.1.2 Warm up time of the display is at least an hour for all measurements, if not specified by the manufacturer of the display.
5.1.3 For tone measurement, all picture quality enhancement functions shall be bypassed to preserve the native picture qualities (luminance curve, APL, etc.). When some picture quality enhancement functions are active in the measurement, it shall be recorded in the report. When the measurement is applied to some picture mode of a PDP set (normal, economy, dynamic, living room, etc.), it shall also be recorded in the report. And any picture mode should be at just-scan mode without over-scan of image.
5.2 Measurement Setup
5.2.1 The measuring equipment shall be set as shown in Figure 1 for non-contact LMD (light measurement device). The optical axis of non-contact LMD shall be normal to the centre of the display surface. The measuring point is the center of effective screen area of the display. When other point is measured, it shall be noted in the report.
5.2.2 During the measuring process, any residual level or image sticking by previous images should not exist on the display screen. The measurement order of a tone pattern shall be from lower level to higher level as preventing residual level as possible.
Figure 1
The Measurement Set-up
6 Tone Measurement
6.1 Each test pattern to be displayed may occupy some percentage of area at over-scan screen mode, but it is not concerned whether it is at just-scan or over-scan mode. To match the results in PDP module and TV set, however, the just-scan mode shows the accurate results of PDP module and TV set.
6.2 Constant APL Gamma
6.2.1 Gray-bar Window Gamma
Plasma display
Light measurement device
Control PC
Signal generator Measurement point

This is a Draft Document of the SEMI International Standards program. No material on this page is to be construed as an official or adopted Standard or Safety Guideline. Permission is granted to reproduce and/or distribute this document, in whole or in part, only within the scope of SEMI International Standards committee (document development) activity. All other reproduction and/or distribution without the prior written consent of SEMI is prohibited.
Page 6 Doc. 4571J SEMI
Semiconductor Equipment and Materials International 3081 Zanker Road San Jose, CA 95134-2127 Phone: 408.943.6900, Fax: 408.943.7943
LE
TT
ER
(Y
EL
LO
W)
BA
LL
OT
DRAFTDocument Number: 4571J
Date: 2013-08-27
6.2.1.1 Since PDP luminance for inputs varies by APL, the gamma values are measured at 10% to 90% APL(post-gamma APL) separately with 11 steps gray-bar pattern varying each input data step by 10%. In this document, just APL means the post-gamma APL.
6.2.1.2 When it is measured on a screen, the background signal level is changed for each APL while maintaining gray-bar pattern at the screen center.
6.2.1.3 For the measurement of avoiding luminance non-uniformity, each box of luminance levels is moved to center of measurement point of Figure 2 where change the positions each other in regular sequence.
NOTE 1: Example of area ratio : Each bar of gray pattern : 0.98%
NOTE 2: The whole gray-bar pattern : 0.97% x 11 = 10.78%
NOTE 3: Background area : 100% - 10.78% = 89.22%
Figure 2
General Pattern of Gray-bar Window Gamma
6.2.1.4 The APL of the pattern in Figure 2 can be calculated by display module inputted values after gamma de-correction in range 0~255 of 8 bits. In case of conventional 2.2 gamma (shortly 2.2 gamma),
APL(%) = 10.78×0.331 + 89.22×(Y/255)2.2 (1)
6.2.1.5 In Equation (1), 0.331 means the APL of 11 step gray-bar data. Outer background data Y is calculated using the following equation.
Y = 255×( ( APL−10.78× 0.331 ) / 89.22 )1/2.2 (2)
6.2.1.6 For ITU-R BT. 709 (shortly BT. 709) gamma, the APL and Y value are also calculated by a similar method but it is substituted by 2.2 gamma equation because APL is just the approximate test case.
6.2.1.7 Figure 3 shows an example of a gamma measurement graph in 9 kinds of output APL(post-gamma APL).

This is a Draft Document of the SEMI International Standards program. No material on this page is to be construed as an official or adopted Standard or Safety Guideline. Permission is granted to reproduce and/or distribute this document, in whole or in part, only within the scope of SEMI International Standards committee (document development) activity. All other reproduction and/or distribution without the prior written consent of SEMI is prohibited.
Page 7 Doc. 4571J SEMI
Semiconductor Equipment and Materials International 3081 Zanker Road San Jose, CA 95134-2127 Phone: 408.943.6900, Fax: 408.943.7943
LE
TT
ER
(Y
EL
LO
W)
BA
LL
OT
DRAFTDocument Number: 4571J
Date: 2013-08-27
Figure 3
An Example of Input-Luminance Curve by APLs
6.2.2 Single Window Gamma
6.2.2.1 Single window gamma measures white luminance according to APL change of Plasma module in a fixed window.
6.2.2.2 In order to fix the APL, luminance of outer area would be changed down from high to low IRE while a center box is measured from 0 to 100 IRE which means 0 to 255 gray levels.
6.2.2.3 The size of the box is 1/5 horizontal and vertical pixel numbers of source video, using approximately 4% of the total screen area in a display.
Figure 4
General Pattern of Single Window Gamma
0
20
40
60
80
100
120
0 IRE 10 IRE 20 IRE 30 IRE 40 IRE 50 IRE 60 IRE 70 IRE 80 IRE 90 IRE 100IRE
Ou
tpu
t L
um
inan
ce (
cd/m
2 )
Input Signal Level
10 APL
20 APL
30 APL
40 APL
50 APL
60 APL
70 APL
80 APL
90 APL
Outer data Y(Keeping for an APL)
Inner data X (Measured)
4% screen area
This is a Draft Document of the SEMI International Standards program. No material on this page is to be construed as an official or adopted Standard or Safety Guideline. Permission is granted to reproduce and/or distribute this document, in whole or in part, only within the scope of SEMI International Standards committee (document development) activity. All other reproduction and/or distribution without the prior written consent of SEMI is prohibited.
Page 8 Doc. 4571J SEMI
Semiconductor Equipment and Materials International 3081 Zanker Road San Jose, CA 95134-2127 Phone: 408.943.6900, Fax: 408.943.7943
LE
TT
ER
(Y
EL
LO
W)
BA
LL
OT
DRAFTDocument Number: 4571J
Date: 2013-08-27
6.2.2.4 The APL of the pattern in Figure 4 is calculated by gamma de-correction in 8 bit. In case of conventional 2.2 gamma,
APL(%) = 4×(X/255)2.2 + 96×(Y/255)2.2 (3)
6.2.2.5 Outer background data Y is obtained using the following Equation (4).
Y = 255×( ( APL−4×( X / 255 )2.2 ) / 96 )1/2.2 (4)
6.2.3 RGB Gamma
6.2.3.1 The luminance gamma measurements in above are also used for RGB gamma measurement.
6.2.3.2 The explanation is abbreviated because it is a similar method except for APL calculation.
6.2.3.3 The inner window’s APL with one color among R, G or B would be one–third of Gray pattern.
6.3 Constant-luminance APL Gamma
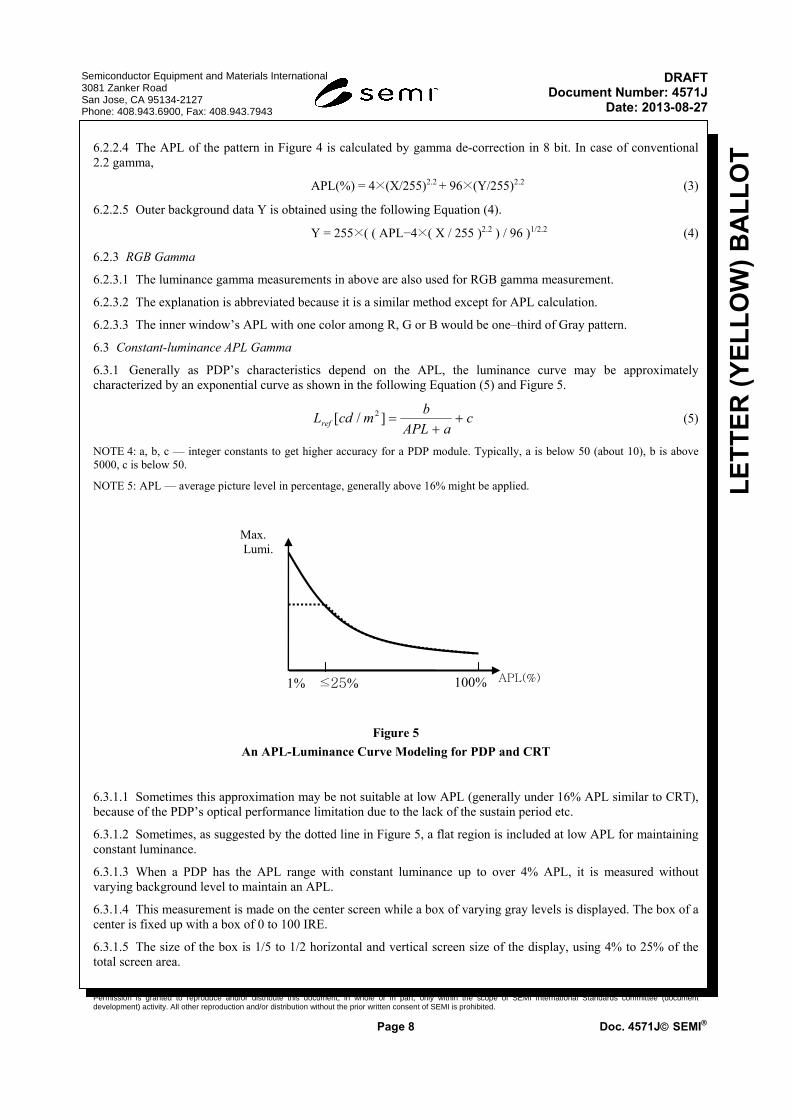
6.3.1 Generally as PDP’s characteristics depend on the APL, the luminance curve may be approximately characterized by an exponential curve as shown in the following Equation (5) and Figure 5.
(5)
NOTE 4: a, b, c — integer constants to get higher accuracy for a PDP module. Typically, a is below 50 (about 10), b is above 5000, c is below 50.
NOTE 5: APL — average picture level in percentage, generally above 16% might be applied.
Figure 5
An APL-Luminance Curve Modeling for PDP and CRT
6.3.1.1 Sometimes this approximation may be not suitable at low APL (generally under 16% APL similar to CRT), because of the PDP’s optical performance limitation due to the lack of the sustain period etc.
6.3.1.2 Sometimes, as suggested by the dotted line in Figure 5, a flat region is included at low APL for maintaining constant luminance.
6.3.1.3 When a PDP has the APL range with constant luminance up to over 4% APL, it is measured without varying background level to maintain an APL.
6.3.1.4 This measurement is made on the center screen while a box of varying gray levels is displayed. The box of a center is fixed up with a box of 0 to 100 IRE.
6.3.1.5 The size of the box is 1/5 to 1/2 horizontal and vertical screen size of the display, using 4% to 25% of the total screen area.
caAPL
bmcdLref
]/[ 2
APL(%)1% ≤25% 100%
Max. Lumi.

This is a Draft Document of the SEMI International Standards program. No material on this page is to be construed as an official or adopted Standard or Safety Guideline. Permission is granted to reproduce and/or distribute this document, in whole or in part, only within the scope of SEMI International Standards committee (document development) activity. All other reproduction and/or distribution without the prior written consent of SEMI is prohibited.
Page 9 Doc. 4571J SEMI
Semiconductor Equipment and Materials International 3081 Zanker Road San Jose, CA 95134-2127 Phone: 408.943.6900, Fax: 408.943.7943
LE
TT
ER
(Y
EL
LO
W)
BA
LL
OT
DRAFTDocument Number: 4571J
Date: 2013-08-27
6.3.1.6 The larger window means that the display has a constant luminance curve from 0 to the higher APL as large as the window size.
6.3.1.7 In the previous APL luminance equation, to evaluate and compare the shape regulation of the APL luminance curve with CRT in 16% to 100% APL range, APL luminance regulation accuracy is defined as following Equations (6), (7), (8), and Figure 6.
(6)
NOTE 6: LAPL — Maximum Luminance (cd/m2) at each APLs (4, 9, 16, 25, 36, 49, 64, 81, 100)
Figure 6
Examples of Maximum White Luminance Curve by APLs
6.3.1.7.1 In these examples, for PDP A, Equation (7) is adapted to get the regulation accuracy 93.5%.
(7)
6.3.1.7.2 For PDP B, Equation (8) is used to get the regulation accuracy 96.4%.
(8)
6.3.2 Luminance Gamma
6.3.2.1 Luminance gamma measures the luminance of 21 gray patterns which change the gray value from white to black with the same linear steps in 4% to 25% boxes.
6.3.2.2 A level of outer area is fixed at 0 IRE and its APL is not constant. Usually this measurement is meaning at flat luminance range like the dotted line of above Figure 5.
6.3.2.3 All gray patterns are presented sequentially from 0 to 100 IRE in steps of 5% to 10%.
||7
1100[%]Re_ accu. refAPL
APL
LLgL
0
50
100
150
200
250
300
350
4 9 16 25 36 49 64 81 100
Wh
ite
Lu
min
ance
(cd
/m2 )
APL (%)
PDP A
Reference for PDP A
PDP B
Reference for PDP B
125
5000]/[ 2
max
APL
mcdL
1014
7000]/[ 2
max
APL
mcdL

This is a Draft Document of the SEMI International Standards program. No material on this page is to be construed as an official or adopted Standard or Safety Guideline. Permission is granted to reproduce and/or distribute this document, in whole or in part, only within the scope of SEMI International Standards committee (document development) activity. All other reproduction and/or distribution without the prior written consent of SEMI is prohibited.
Page 10 Doc. 4571J SEMI
Semiconductor Equipment and Materials International 3081 Zanker Road San Jose, CA 95134-2127 Phone: 408.943.6900, Fax: 408.943.7943
LE
TT
ER
(Y
EL
LO
W)
BA
LL
OT
DRAFTDocument Number: 4571J
Date: 2013-08-27
Figure 7
Window Pattern of Gamma Measurement
Figure 8
An Example of Gamma Measurement Result
6.3.3 RGB Gamma
6.3.3.1 RGB gamma measures the luminance scale of the primary colors (R,G,B) using 11 ~ 21 color levels at 10% or 5% steps.
6.3.3.2 As the luminance gamma, 4% ~ 25% area window changes from black to highest level of the colors, and calculate a “gamma” value for each color.
0
20
40
60
80
100
120
0 IRE 10IRE
20IRE
30IRE
40IRE
50IRE
60IRE
70IRE
80IRE
90IRE
100IRE
Out
put
Lu
min
ance
(cd
/m2 )
Input Signal Level
4 ~ 25%
window
0~100 IRE
0 IRE
1/5H ~ 1/2H/
1/5V ~ 1/2V

This is a Draft Document of the SEMI International Standards program. No material on this page is to be construed as an official or adopted Standard or Safety Guideline. Permission is granted to reproduce and/or distribute this document, in whole or in part, only within the scope of SEMI International Standards committee (document development) activity. All other reproduction and/or distribution without the prior written consent of SEMI is prohibited.
Page 11 Doc. 4571J SEMI
Semiconductor Equipment and Materials International 3081 Zanker Road San Jose, CA 95134-2127 Phone: 408.943.6900, Fax: 408.943.7943
LE
TT
ER
(Y
EL
LO
W)
BA
LL
OT
DRAFTDocument Number: 4571J
Date: 2013-08-27
Figure 9
Window Pattern of RGB Gamma Measurement
6.4 Gamma Value Calculation
6.4.1 Table 1 is the data of standard gamma for about 5% step inputs.
6.4.2 In ITU-R BT.709, under 8.1% of input data is not used because it is a linear slope region. So, gamma calculation for ITU-R BT.709 is done so that the luminance of 8.1% input is treated as an offset.
Table 1 Gamma De-corrected Luminance by 8 bit Inputs
Input Values, I Display Luminance
% Full Scale (IRE)
8 bit Integer Inputs
(0–255, Ik)
ITU-R BT. 709 % Full Scale
2.2 Gamma % Full Scale
0 0 0.000 0.000
5(*) 13 1.133 0.143
10 26 2.292 0.658
15 38 3.659 1.518
20 51 5.543 2.899
25 64 7.864 4.778
30 77 10.639 7.176
35 90 13.881 10.115
40 102 17.298 13.321
45 115 21.473 17.344
4 ~ 25%window
Red
0 IRE
4 ~ 25%windowGreen
0 IRE
4 ~ 25%window
Blue
0 IRE

This is a Draft Document of the SEMI International Standards program. No material on this page is to be construed as an official or adopted Standard or Safety Guideline. Permission is granted to reproduce and/or distribute this document, in whole or in part, only within the scope of SEMI International Standards committee (document development) activity. All other reproduction and/or distribution without the prior written consent of SEMI is prohibited.
Page 12 Doc. 4571J SEMI
Semiconductor Equipment and Materials International 3081 Zanker Road San Jose, CA 95134-2127 Phone: 408.943.6900, Fax: 408.943.7943
LE
TT
ER
(Y
EL
LO
W)
BA
LL
OT
DRAFTDocument Number: 4571J
Date: 2013-08-27
Input Values, I Display Luminance
50 127 25.770 21.576
55 140 30.917 26.736
60 153 36.584 32.504
65 165 42.283 38.377
70 178 48.973 45.346
75 191 56.208 52.952
80 204 63.994 61.207
85 217 72.339 70.117
90 229 80.544 78.931
95 242 89.983 89.126
100 255 100.000 100.000
NOTE 7: “*” Marked value is not used for the gamma calculation, but involved for graph.
6.4.3 The gamma curve shall be approximately linear by converting the measured luminance data to logarithm (Y-axis).
6.4.4 The Y-axis is normalized log10 (L-L0) where L0 is the luminance at start point of the exponential gamma curve as 0 IRE in 2.2 gamma and the X-axis is just input signal. For example, the logarithmic plot for a gamma curve of Figure 8 is shown in Figure 10.
6.4.5 If output luminance and input signals are calculated in logarithmic value between 0 IRE (or 8.1 IRE for BT.709) and 10 IRE ~ 95 IRE, then the average of the ratios becomes the display gamma (decoding gamma) like Equation (9).
0.00
0.20
0.40
0.60
0.80
1.00
1.20
0 IRE 10 IRE 20 IRE 30 IRE 40 IRE 50 IRE 60 IRE 70 IRE 80 IRE 90 IRE 100IRE
Log
(Ou
tpu
t lu
mia
nn
ce)
Input Signal Level

This is a Draft Document of the SEMI International Standards program. No material on this page is to be construed as an official or adopted Standard or Safety Guideline. Permission is granted to reproduce and/or distribute this document, in whole or in part, only within the scope of SEMI International Standards committee (document development) activity. All other reproduction and/or distribution without the prior written consent of SEMI is prohibited.
Page 13 Doc. 4571J SEMI
Semiconductor Equipment and Materials International 3081 Zanker Road San Jose, CA 95134-2127 Phone: 408.943.6900, Fax: 408.943.7943
LE
TT
ER
(Y
EL
LO
W)
BA
LL
OT
DRAFTDocument Number: 4571J
Date: 2013-08-27
Figure 10 Normalized Logarithmic Luminance Plot
6.4.6 In the case of the Constant APL gamma or Constant–luminance APL gamma, the gamma is calculated with normalized value by the maximum luminance of the gamma curve.
(9)
NOTE 8: n — 9 to 18 (10% ~ 5% input step) from 10 IRE to 95 IRE for 2.2 gamma or ITU-R BT.709 gamma.
NOTE 9: Lnorm,k — Normalized value of the luminance measured at each level,
(Lmeasured−L0) / (Lmax −Lo ) for 2.2 gamma
(Lmeasured−L8.1%) / (Lmax −L8.1% ) for BT.709 gamma
NOTE 10: Inorm,k — Normalized value of input digital value at each level over 8.1% (21 of 255)
Ik/255 for 2.2 gamma
(Ik−21)/234 for BT.709
6.4.7 Actually, ITU-R BT. 709 gamma equation has offset of 0.099 and scaling factor of 1.099, but these are negated by over 8.1% input condition and normalization effect respectively.
6.4.8 Especially, in case of the Constant APL gamma, the gamma values of each APLs might be different depends on APL and should be averaged with each gamma values of 10% ~ 90% APL.
(10)
NOTE 11: m — generally 9 from 10%, 20%, …., 90% APL
6.5 Gamma Accuracy
6.5.1 Although the gamma is calculated near to 2.2, we still don’t know the deviation of the gamma values at each level. So, a method to estimate the accuracy of the gamma is necessary. Gamma accuracy (%) for Y gamma and RGB gamma is defined as follows.
(11)
NOTE 12: γ S = 2.2, for conventional 2.2 gamma
NOTE 13: γ S = 1/0.45, for BT. 709 gamma
6.6 Inter-level Gamma
6.6.1 In general, the gamma is calculated based on the black level (luminance of 0 data input). But, for the purpose of more detail gamma estimation between each level, it needs to get the logarithmic ratio of each neighbored input and output levels in the normalized luminance curve.
(12)
n
k knorm
knorm
I
L
n 1 ,
,D log
log1
mmDDD
D,2,1, ....
100.
S
DSSaccu
knorm
1knorm
knorm
1knorm
kD
I
I
L
L
,
,
,
,
,
log
log

This is a Draft Document of the SEMI International Standards program. No material on this page is to be construed as an official or adopted Standard or Safety Guideline. Permission is granted to reproduce and/or distribute this document, in whole or in part, only within the scope of SEMI International Standards committee (document development) activity. All other reproduction and/or distribution without the prior written consent of SEMI is prohibited.
Page 14 Doc. 4571J SEMI
Semiconductor Equipment and Materials International 3081 Zanker Road San Jose, CA 95134-2127 Phone: 408.943.6900, Fax: 408.943.7943
LE
TT
ER
(Y
EL
LO
W)
BA
LL
OT
DRAFTDocument Number: 4571J
Date: 2013-08-27
NOTE 14: Lnorm,k — Normalized value of the luminance measured at each level,
(Lmeasured−L0) / (Lmax −Lo ) for 2.2 gamma
(Lmeasured−L8.1%) / (Lmax −L8.1% ) for BT.709 gamma
6.6.2 Generally, this inter-level gamma values have wider range gamma value comparing with general (black level based) gamma because the black level based gamma has longer input intervals from black to level k.
7 Color Measurement
7.1 Primary and Secondary Color
7.1.1 This is to measure the luminance and chromaticity coordinates of primary Red, Green, and Blue of 100 IRE at the center of the full screen or in a window box measuring 4% ~ 25% of the full screen. Additionally, it is useful to measure the secondary colors (Cyan, Magenta and Yellow) by the same method.
Figure 11
Full Screen Pattern for Primary Color Measurement
7.2 Primary and Second Color Coordinates
7.2.1 This measures the CIE 1931 chromaticity coordinates (x, y) or CIE 1976 (u',v') of the primary and secondary colors in color area that a display represents. To do this, a full screen (or partial screen box, depending on APL luminance) of all the primary and secondary colors is displayed and it is done by measuring the luminance and (x, y) or (u',v')chromaticity coordinates at the center of the screen.
7.2.2 From the following additive color mixture equations (Grassman’s Law), the standard (x, y) coordinates of these colors at any white balance CCT are available based on ITU-R BT.709 coordinates of D65 white. In the equations, and are gains of mixed 3 colors that are R, G and B respectively where their coordinates are (x1, y1), (x2, y2) and (x3, x3). The 3 gains of R, G and B might be 0 to 255 in case of 8 bits integer representation.
(13a)
(13b)
100 IRE Red
100 IRE Green
100 IRE Blue
333
222
111
33
332
2
221
1
11
4 111y
Yy
Yy
Y
Yyx
Yyx
Yyx
x
333
222
111
3322114 111
yY
yY
yY
YYYy
This is a Draft Document of the SEMI International Standards program. No material on this page is to be construed as an official or adopted Standard or Safety Guideline. Permission is granted to reproduce and/or distribute this document, in whole or in part, only within the scope of SEMI International Standards committee (document development) activity. All other reproduction and/or distribution without the prior written consent of SEMI is prohibited.
Page 15 Doc. 4571J SEMI
Semiconductor Equipment and Materials International 3081 Zanker Road San Jose, CA 95134-2127 Phone: 408.943.6900, Fax: 408.943.7943
LE
TT
ER
(Y
EL
LO
W)
BA
LL
OT
DRAFTDocument Number: 4571J
Date: 2013-08-27
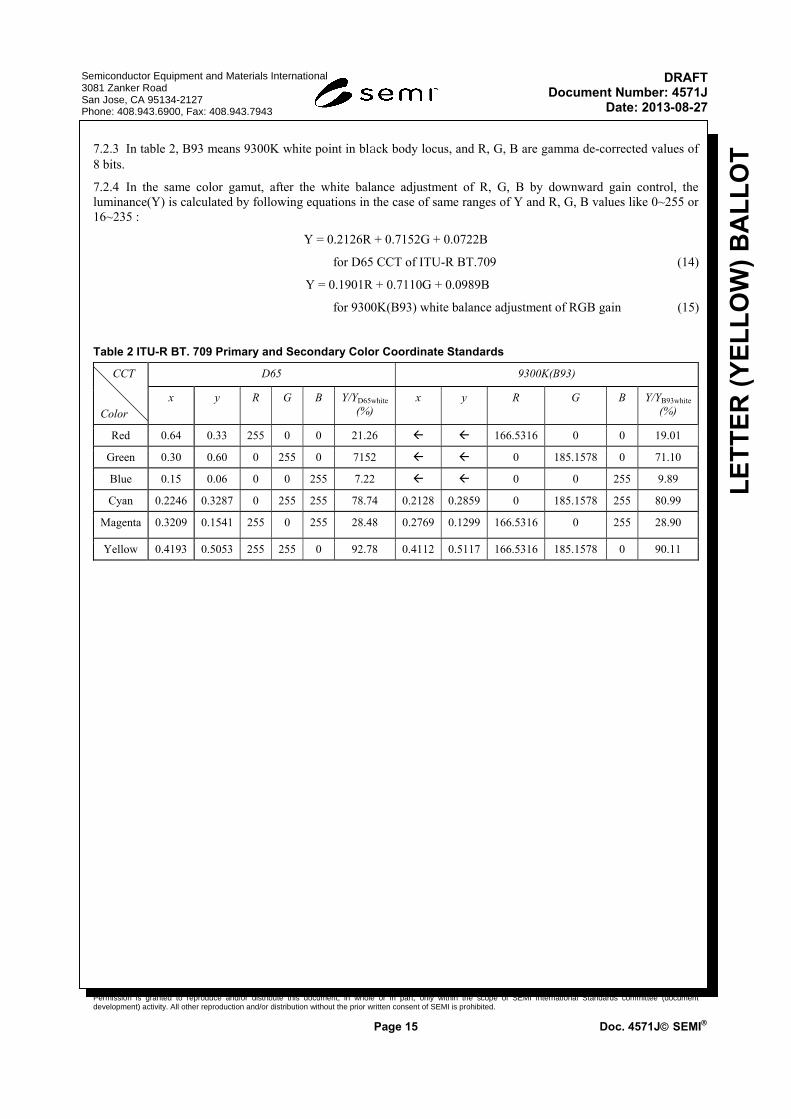
7.2.3 In table 2, B93 means 9300K white point in black body locus, and R, G, B are gamma de-corrected values of 8 bits.
7.2.4 In the same color gamut, after the white balance adjustment of R, G, B by downward gain control, the luminance(Y) is calculated by following equations in the case of same ranges of Y and R, G, B values like 0~255 or 16~235 :
Y = 0.2126R + 0.7152G + 0.0722B
for D65 CCT of ITU-R BT.709 (14)
Y = 0.1901R + 0.7110G + 0.0989B
for 9300K(B93) white balance adjustment of RGB gain (15)
Table 2 ITU-R BT. 709 Primary and Secondary Color Coordinate Standards
CCT
Color
D65 9300K(B93)
x y R G B Y/YD65white (%)
x y R G B Y/YB93white (%)
Red 0.64 0.33 255 0 0 21.26 166.5316 0 0 19.01
Green 0.30 0.60 0 255 0 7152 0 185.1578 0 71.10
Blue 0.15 0.06 0 0 255 7.22 0 0 255 9.89
Cyan 0.2246 0.3287 0 255 255 78.74 0.2128 0.2859 0 185.1578 255 80.99
Magenta 0.3209 0.1541 255 0 255 28.48 0.2769 0.1299 166.5316 0 255 28.90
Yellow 0.4193 0.5053 255 255 0 92.78 0.4112 0.5117 166.5316 185.1578 0 90.11
This is a Draft Document of the SEMI International Standards program. No material on this page is to be construed as an official or adopted Standard or Safety Guideline. Permission is granted to reproduce and/or distribute this document, in whole or in part, only within the scope of SEMI International Standards committee (document development) activity. All other reproduction and/or distribution without the prior written consent of SEMI is prohibited.
Page 16 Doc. 4571J SEMI
Semiconductor Equipment and Materials International 3081 Zanker Road San Jose, CA 95134-2127 Phone: 408.943.6900, Fax: 408.943.7943
LE
TT
ER
(Y
EL
LO
W)
BA
LL
OT
DRAFTDocument Number: 4571J
Date: 2013-08-27
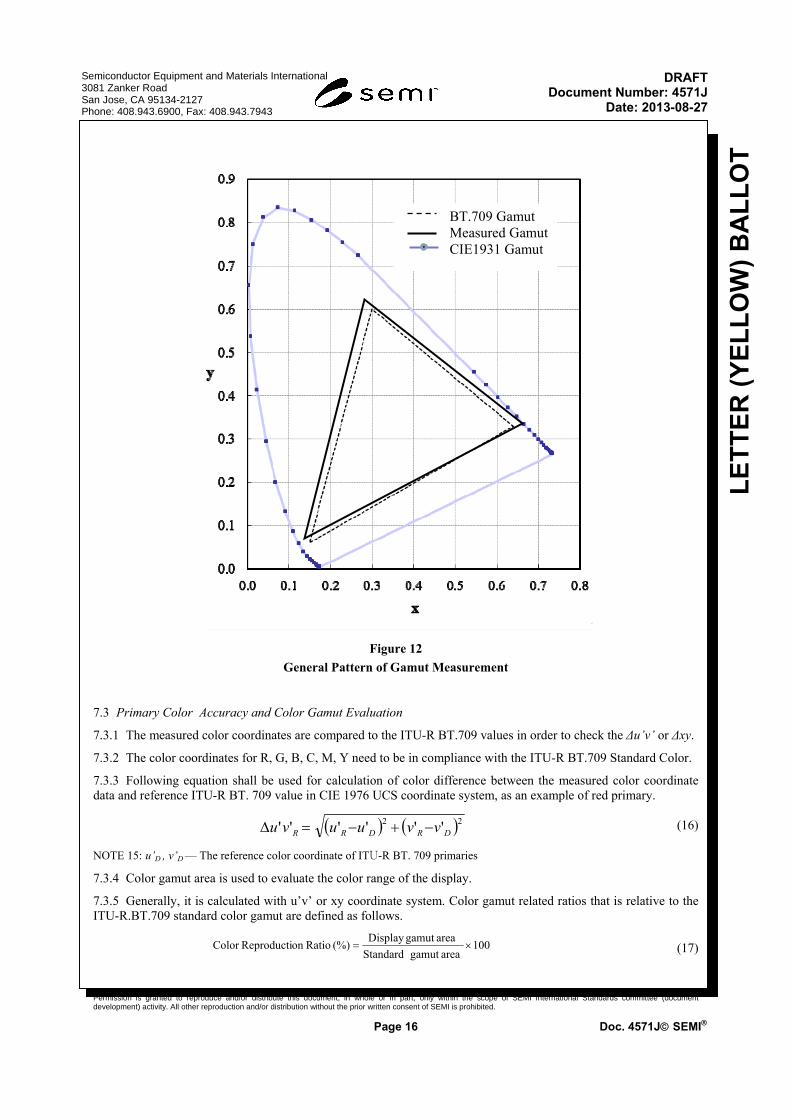
Figure 12
General Pattern of Gamut Measurement
7.3 Primary Color Accuracy and Color Gamut Evaluation
7.3.1 The measured color coordinates are compared to the ITU-R BT.709 values in order to check the Δu’v’ or Δxy.
7.3.2 The color coordinates for R, G, B, C, M, Y need to be in compliance with the ITU-R BT.709 Standard Color.
7.3.3 Following equation shall be used for calculation of color difference between the measured color coordinate data and reference ITU-R BT. 709 value in CIE 1976 UCS coordinate system, as an example of red primary.
(16)
NOTE 15: u’D , v’D — The reference color coordinate of ITU-R BT. 709 primaries
7.3.4 Color gamut area is used to evaluate the color range of the display.
7.3.5 Generally, it is calculated with u’v’ or xy coordinate system. Color gamut related ratios that is relative to the ITU-R.BT.709 standard color gamut are defined as follows.
(17)
22 '''''' DRDRR vvuuvu
100 areagamut Standard
areagamut Display (%) Ratioon ReproductiColor
BT.709 Gamut Measured Gamut CIE1931 Gamut

This is a Draft Document of the SEMI International Standards program. No material on this page is to be construed as an official or adopted Standard or Safety Guideline. Permission is granted to reproduce and/or distribute this document, in whole or in part, only within the scope of SEMI International Standards committee (document development) activity. All other reproduction and/or distribution without the prior written consent of SEMI is prohibited.
Page 17 Doc. 4571J SEMI
Semiconductor Equipment and Materials International 3081 Zanker Road San Jose, CA 95134-2127 Phone: 408.943.6900, Fax: 408.943.7943
LE
TT
ER
(Y
EL
LO
W)
BA
LL
OT
DRAFTDocument Number: 4571J
Date: 2013-08-27
(18)
(19a)
(19b)
8 White Balance Measurement
8.1 The CCT and Δ uv of PDP vary according to APL and input level as shown in the following Figure 13. So, the White Balance of PDP needs to be measured for all APL and all input levels. Further, it is conceptually considered as Gray Balance rather than White Balance.
Figure 13
An Example of CCT and Δuv according to APL and Input Level (Bare PDP Module)
8.1.1 Δuv means the perpendicular deviation from Planckian (black body) locus with plus or minus sign based on a CIE 1960 uv chromaticity space, It is different from Euclidean distance Δu’v’ for color difference at CIE 1976 u’v’ color space.
8.1.2 From the example of Figure 13, the curves have some fluctuation because they are from a bare PDP module before it is adjusted on a TV board. CCT goes up and Δuv goes down while the level varies high in a APL. But, CCT goes down and Δuv goes up while the APL varies high in a level.
8.2 Constant APL White Balance Accuracy
8.2.1 White balance is important to display exact colors through all levels because it is the origin of primary colors. So it is effective to describe as concept of accuracy for the standard white points in Table 3.
100 areagamut Standard
areaOverlap (%) RatioonReproductiStandard
100 ratioon Reproducti Color
ratioon Reproducti Standard (%)Fidelity Standard
100 areagamut Display
areaOverlap
5000
6000
7000
8000
20 IRE 30 IRE 40 IRE 50 IRE 60 IRE 70 IRE 80 IRE 90 IRE 100 IRE
CC
T(K
)
Input Signal
10 APL 20 APL 30 APL40 APL 50 APL 60 APL70 APL 80 APL 90 APL
-0.015
-0.005
0.005
0.015
20 IRE 30 IRE 40 IRE 50 IRE 60 IRE 70 IRE 80 IRE 90 IRE 100 IRE
Δu
v
Input Signal

This is a Draft Document of the SEMI International Standards program. No material on this page is to be construed as an official or adopted Standard or Safety Guideline. Permission is granted to reproduce and/or distribute this document, in whole or in part, only within the scope of SEMI International Standards committee (document development) activity. All other reproduction and/or distribution without the prior written consent of SEMI is prohibited.
Page 18 Doc. 4571J SEMI
Semiconductor Equipment and Materials International 3081 Zanker Road San Jose, CA 95134-2127 Phone: 408.943.6900, Fax: 408.943.7943
LE
TT
ER
(Y
EL
LO
W)
BA
LL
OT
DRAFTDocument Number: 4571J
Date: 2013-08-27
Table 3 Standards of White Points
Coordinates
White CCT
CIE 1931 CIE 1976 CCT Δuv (deviation)
x y u’ v’
D65 0.3127 0.3290 0.1978 0.4683 6504 0.003
D93 0.2831 0.2971 0.1888 0.4457 9300 0.003
9300K(B93) 0.2850 0.2934 0.1916 0.4437 9300 0
8.2.2 For measuring the white balance accuracy, all level input at all APLs are needed, so the Constant APL gamma pattern is used like Figure 2 or 4. Besides D65, white accuracy (%) is calculated at any white points according to CCT with following equation.
(20)
NOTE 16: m — 9 (10, 20, .…. , 90% APL), 100% APL is meaningless because full screen is 100 IRE.
NOTE 17: n — 10 (10, 20, ….. , 100 IRE) or 9 (20, 30, ..... , 100 IRE)
8.3 White Balance Evaluation at an APL
8.3.1 For the white balance evaluation of an APL range, Δu’v’ of chromaticity space and ΔE*uv based on relatively perceivable lightness viewpoint are measured.
8.3.2 ΔE*uv implies the relative luminance deviation added to Δu*v*.
8.3.3 ΔE*uv is drived from CIELUV(CIE 1976 L*u*v*) color space.
8.3.4 These are executed like the pattern for the Constant-luminance APL gamma which is made on a center screen box with 4% ~ 25% of total screen area while a box of varying gray level is displayed.
8.3.5 The input of a center box is varied from 10 IRE to 100 IRE.
(21)
NOTE 18: u’k , v’k — the box window coordinate from 10 IRE to 100 IRE
2*2*2** )()()( vuLuvE (22)
NOTE 19: ΔL* = L*1–L*
2 , Δu* = u*1–u*
2 , Δv* = v*1–v*
2
NOTE 20: , where u’W, v’W are for target white and u’D, v’D are for measured display.
8.3.6 We want to know only the white balance deviation not luminance difference, when we assume the maximum luminance up to 4% ~ 25% APL is approximately same to ΔL* = 0. (The gamma is constant up to 4% ~ 25% APL)
8.3.7 Also, the 100 IRE white of the window shall be chosen as a relative base coordinate,
u*2 = 13L×(u’W - u’W)=0 (23)
Similarly, v*
2 = 0 (24)
8.3.8 Then, at the input k of the window,
22_ '''''' kWkWkWB vvuuvu
)(13)(13 ''**''**DWDW vvLvanduuLu
m
j
n
kkjvu
mnW
1 1,accu. ''
1000100

This is a Draft Document of the SEMI International Standards program. No material on this page is to be construed as an official or adopted Standard or Safety Guideline. Permission is granted to reproduce and/or distribute this document, in whole or in part, only within the scope of SEMI International Standards committee (document development) activity. All other reproduction and/or distribution without the prior written consent of SEMI is prohibited.
Page 19 Doc. 4571J SEMI
Semiconductor Equipment and Materials International 3081 Zanker Road San Jose, CA 95134-2127 Phone: 408.943.6900, Fax: 408.943.7943
LE
TT
ER
(Y
EL
LO
W)
BA
LL
OT
DRAFTDocument Number: 4571J
Date: 2013-08-27
(25)
NOTE 21: , where the range of Yk is from 10 IRE.
NOTE 22: Here, Yref is obtained at 100 IRE of the window and Yk means the window luminance from 10 IRE to 100 IRE.
8.4 Full-screen White Balance
8.4.1 Generally, full-screen CCT and Δuv have representative values of above all gray points’ CCT and Δuv including all APLs and input levels.
Figure 14
Pattern for the Full-screen White Balance Measurement
8.4.1.1 In Figure 14,
APL(%) = 100×(Y/255)2.2 (26) Y = 255×(APL / 100 )1/2.2 (27)
(28)
(29)
NOTE 23: j — index for 10, 20, .…. , 100% APL
9 Color Accuracy Measurement based on a Reference Pattern
9.1 Geometry and APL of Reference Pattern
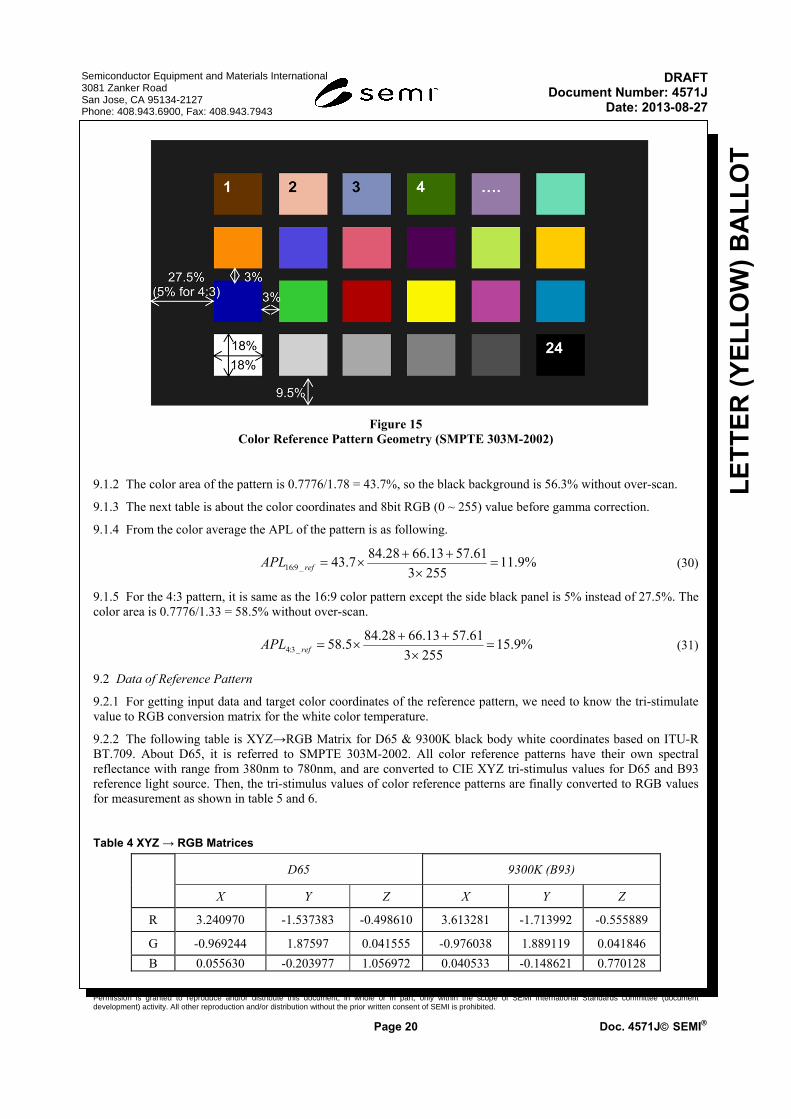
9.1.1 Figure 15 is for the color reference pattern from the SMPTE standard. It is presented that the vertical size is 100%, so the horizontal size is 160% in 16:9 pattern which is symmetrical in up-down and left-right.
2''2''*
2*2*_
*
)()(13
)()(
kWkWk
kkkWB
vvuuL
vuE
--
008856.016)(116 '3
1*
ref
k
ref
kk Y
Yfor
Y
YL
Full-screen data Y (for varying APL)
10–100% APL
10
110
1
jjAPL CCTCCT
10
110
1
jjAPL uvuv
This is a Draft Document of the SEMI International Standards program. No material on this page is to be construed as an official or adopted Standard or Safety Guideline. Permission is granted to reproduce and/or distribute this document, in whole or in part, only within the scope of SEMI International Standards committee (document development) activity. All other reproduction and/or distribution without the prior written consent of SEMI is prohibited.
Page 20 Doc. 4571J SEMI
Semiconductor Equipment and Materials International 3081 Zanker Road San Jose, CA 95134-2127 Phone: 408.943.6900, Fax: 408.943.7943
LE
TT
ER
(Y
EL
LO
W)
BA
LL
OT
DRAFTDocument Number: 4571J
Date: 2013-08-27
Figure 15
Color Reference Pattern Geometry (SMPTE 303M-2002)
9.1.2 The color area of the pattern is 0.7776/1.78 = 43.7%, so the black background is 56.3% without over-scan.
9.1.3 The next table is about the color coordinates and 8bit RGB (0 ~ 255) value before gamma correction.
9.1.4 From the color average the APL of the pattern is as following.
(30)
9.1.5 For the 4:3 pattern, it is same as the 16:9 color pattern except the side black panel is 5% instead of 27.5%. The color area is 0.7776/1.33 = 58.5% without over-scan.
(31)
9.2 Data of Reference Pattern
9.2.1 For getting input data and target color coordinates of the reference pattern, we need to know the tri-stimulate value to RGB conversion matrix for the white color temperature.
9.2.2 The following table is XYZ→RGB Matrix for D65 & 9300K black body white coordinates based on ITU-R BT.709. About D65, it is referred to SMPTE 303M-2002. All color reference patterns have their own spectral reflectance with range from 380nm to 780nm, and are converted to CIE XYZ tri-stimulus values for D65 and B93 reference light source. Then, the tri-stimulus values of color reference patterns are finally converted to RGB values for measurement as shown in table 5 and 6.
Table 4 XYZ → RGB Matrices
D65 9300K (B93)
X Y Z X Y Z
R 3.240970 -1.537383 -0.498610 3.613281 -1.713992 -0.555889
G -0.969244 1.87597 0.041555 -0.976038 1.889119 0.041846
B 0.055630 -0.203977 1.056972 0.040533 -0.148621 0.770128
%9.112553
61.5713.6628.847.43_9:16
refAPL
%9.152553
61.5713.6628.845.58_3:4
refAPL

This is a Draft Document of the SEMI International Standards program. No material on this page is to be construed as an official or adopted Standard or Safety Guideline. Permission is granted to reproduce and/or distribute this document, in whole or in part, only within the scope of SEMI International Standards committee (document development) activity. All other reproduction and/or distribution without the prior written consent of SEMI is prohibited.
Page 21 Doc. 4571J SEMI
Semiconductor Equipment and Materials International 3081 Zanker Road San Jose, CA 95134-2127 Phone: 408.943.6900, Fax: 408.943.7943
LE
TT
ER
(Y
EL
LO
W)
BA
LL
OT
DRAFTDocument Number: 4571J
Date: 2013-08-27
9.2.3 The following tables are about color coordinates of the color reference pattern and RGB video data before gamma correction for D65 and B93 based on each XYZ RGB matrices.
Table 5 Color Reference Pattern based on D65 and ITU-R BT. 709 primaries
Color no.(k) Color Patch u’ v’ Y R G B
1 Dark skin 0.2512 0.4999 9.7 44.9291 19.9311 12.8442
2 Light skin 0.2347 0.4930 35.58 142.6004 78.7350 56.7626
3 Blue sky 0.1752 0.4213 19.08 28.9130 50.7890 85.6503
4 Foliage 0.1797 0.5195 12.98 24.0793 37.8387 12.7127
5 Blue flower 0.1959 0.4160 24.38 60.2714 57.5887 113.1331
6 Bluish green 0.1552 0.4770 42.73 34.0932 131.8578 102.6622
7 Orange 0.2952 0.5342 29.32 178.8899 50.7692 5.7967
8 Purple blue 0.1780 0.3510 11.76 17.4699 27.0331 96.1321
9 Moderate red 0.3179 0.4832 19.22 142.2931 23.0839 31.0988
10 Purple 0.2306 0.3897 6.52 27.4974 11.2932 37.4336
11 Yellow green 0.1840 0.5445 43.66 88.9915 127.9867 12.1604
12 Orange yellow 0.2571 0.5404 43.12 201.8460 93.0516 6.7614
13 Blue 0.1753 0.2920 6.22 6.8935 12.1725 78.8147
14 Green 0.1462 0.5349 23.58 15.3020 77.9700 15.4241
15 Red 0.3787 0.4993 11.82 113.7446 7.2430 10.7286
16 Yellow 0.2289 0.5481 59.64 217.2603 147.7824 2.6967
17 Magenta 0.2875 0.4237 19.27 129.0837 22.6783 75.7903
18 Cyan 0.1343 0.4148 19.87 0.0000 63.4766 98.2349
19 White 0.1985 0.4720 88.76 228.6634 226.8261 214.6543
20 Neutral 8 0.1982 0.4699 58.87 151.0927 150.1681 146.7584
21 Neutral 6.5 0.1978 0.4695 35.51 90.5989 90.6903 89.0232
22 Neutral 5 0.1977 0.4691 19.3 49.0931 49.3033 48.6999
23 Neutral 3.5 0.1976 0.4691 8.4 21.3351 21.4696 21.1792
24 Black 0.1995 0.4679 2.95 7.7294 7.4586 7.5458
Ave. 0.2165 0.4666 27.1767 84.28 66.13 57.61
Table 6 Color Reference Pattern based on 9300K and ITU-R BT. 709 primaries
Color no.(k) Color Patch u’ v’ Y R G B
1 Dark skin 0.2405 0.4822 9.497 45.2757 20.0841 13.3072
2 Light skin 0.2241 0.4753 35.110 142.0002 80.0357 56.5845
3 Blue sky 0.1731 0.3896 19.390 28.8170 50.0576 84.7573
4 Foliage 0.1738 0.5063 12.950 23.2875 38.4149 13.1110

This is a Draft Document of the SEMI International Standards program. No material on this page is to be construed as an official or adopted Standard or Safety Guideline. Permission is granted to reproduce and/or distribute this document, in whole or in part, only within the scope of SEMI International Standards committee (document development) activity. All other reproduction and/or distribution without the prior written consent of SEMI is prohibited.
Page 22 Doc. 4571J SEMI
Semiconductor Equipment and Materials International 3081 Zanker Road San Jose, CA 95134-2127 Phone: 408.943.6900, Fax: 408.943.7943
LE
TT
ER
(Y
EL
LO
W)
BA
LL
OT
DRAFTDocument Number: 4571J
Date: 2013-08-27
5 Blue flower 0.1903 0.3837 24.635 60.1993 56.6797 111.8690
6 Bluish green 0.1520 0.4561 43.370 28.4225 134.1358 100.0252
7 Orange 0.2863 0.5281 28.185 182.5859 51.0394 8.0715
8 Purple blue 0.1773 0.3161 12.118 18.0538 25.5721 93.8265
9 Moderate red 0.3027 0.4629 18.476 143.7652 23.3026 31.7356
10 Purple 0.2217 0.3492 6.504 28.4496 10.3716 38.2844
11 Yellow green 0.1770 0.5388 43.378 86.1372 130.6242 14.3024
12 Orange yellow 0.2487 0.5350 41.862 205.0539 93.8543 9.9321
13 Blue 0.1767 0.2604 6.532 7.6825 10.8361 75.6511
14 Green 0.1423 0.5253 23.706 12.4267 79.5279 16.1514
15 Red 0.3620 0.4855 11.119 113.5190 7.8680 11.2470
16 Yellow 0.2200 0.5450 58.466 216.9467 150.7514 6.5429
17 Magenta 0.2709 0.3891 18.769 130.6178 21.6272 76.5936
18 Cyan 0.1353 0.3885 20.651 0.0000 64.6180 93.6365
19 White 0.1914 0.4454 88.714 224.8641 227.2632 221.3603
20 Neutral 8 0.1918 0.4441 58.376 149.0491 148.9614 147.7575
21 Neutral 6.5 0.1916 0.4437 35.816 91.1186 91.4152 91.1348
22 Neutral 5 0.1916 0.4436 20.305 51.6819 51.8094 51.7356
23 Neutral 3.5 0.1907 0.4423 9.263 23.1702 23.6924 23.9734
24 Black 0.1903 0.4393 3.358 8.3140 8.5714 8.9809
Ave. 0.2093 0.4448 27.1063 84.23 66.71 58.36
9.2.4 The next table is about the gamma corrected video input values when the pattern generator should be inputted with integer 8 bit R’, G’ and B’ instead of original color reference pattern scene. From this table, the pre-gamma APL is 21.56% for 2.2 gamma, 16:9 screen, while the post-gamma APL is 11.88%.
9.2.5 Mathematically, by Cauchy-Schwarz inequality, the average of exponential γD of positive values is greater than or equal to the exponential γD of average of the values when γD > 1. The pre-gamma APL with general video level’s distribution, it might be roughly 2 times of post-gamma APL.
(32)
NOTE 24: APLpre — pre-gamma APL (%)
NOTE 25: APLpost — post-gamma APL (%)
NOTE 26: the equal — in the case of single data or 0/100 IRE all around full screen
NOTE 27: n — number of pixel in the screen
NOTE 28: pixelk — 8 bit pixel value,
n
kk
postpre DD pixeln
APLAPL
1
)255/(1
100)
100(
255))255/( Ekoriginal

This is a Draft Document of the SEMI International Standards program. No material on this page is to be construed as an official or adopted Standard or Safety Guideline. Permission is granted to reproduce and/or distribute this document, in whole or in part, only within the scope of SEMI International Standards committee (document development) activity. All other reproduction and/or distribution without the prior written consent of SEMI is prohibited.
Page 23 Doc. 4571J SEMI
Semiconductor Equipment and Materials International 3081 Zanker Road San Jose, CA 95134-2127 Phone: 408.943.6900, Fax: 408.943.7943
LE
TT
ER
(Y
EL
LO
W)
BA
LL
OT
DRAFTDocument Number: 4571J
Date: 2013-08-27
Table 7 Color Reference Pattern Integer Inputs for D65 ITU-R BT. 709 Primaries
Col. no. (k)
8 bit Inputs (2.2 Gamma corrected) 2.2 Gamma de-corrected
R’ G’ B’ R G B
1 116 80 66 45.0775 19.9044 13.0361
2 196 149 129 142.9273 78.1919 56.9442
3 95 122 155 29.0498 50.3667 85.2867
4 87 107 65 23.9383 37.7395 12.6055
5 132 130 176 59.8983 57.5887 112.7924
6 102 189 169 33.9682 131.9373 103.1579
7 217 122 46 178.7982 50.3667 5.8914
8 75 92 164 17.2698 27.0698 96.5624
9 196 86 98 142.9273 23.3372 31.1064
10 93 62 107 27.7213 11.3609 37.7395
11 158 186 64 88.9605 127.3738 12.1828
12 229 161 49 201.2750 92.7190 6.7699
13 49 64 150 6.7699 12.1828 79.3510
14 71 149 71 15.3081 78.1919 15.3081
15 177 51 60 114.2071 7.3928 10.5702
16 237 199 32 217.0692 147.7844 2.6514
17 187 85 147 128.8853 22.7443 75.9014
18 0 136 165 0.0000 63.9643 97.8625
19 243 242 236 229.3431 227.2718 215.0593
20 201 200 198 151.0717 149.4231 146.1555
21 159 159 158 90.2039 90.2039 88.9605
22 121 121 120 49.4629 49.4629 48.5680
23 83 83 82 21.5836 21.5836 21.0156
24 52 51 51 7.7154 7.3928 7.3928
Ave. 136.50 126.07 114.92 84.31 66.06 57.62
Table 8 Color Reference Pattern Outputted by Integer Input of D65 ITU-R BT. 709 Primaries
Col. no. (k)
D65 White Balance adjusted B93 White Balance adjusted
u’ v’ Y/YD65white (%) u’ v’ Y/YB93white (%)
1 0.2514 0.4992 9.71 0.2407 0.4830 9.42
2 0.2353 0.4926 35.46 0.2254 0.4741 34.67
3 0.1756 0.4210 18.96 0.1731 0.3899 19.52
4 0.1795 0.5197 12.94 0.1753 0.5075 12.80
5 0.1956 0.4161 24.34 0.1895 0.3843 24.90
6 0.1551 0.4767 42.76 0.1549 0.4533 43.32

This is a Draft Document of the SEMI International Standards program. No material on this page is to be construed as an official or adopted Standard or Safety Guideline. Permission is granted to reproduce and/or distribute this document, in whole or in part, only within the scope of SEMI International Standards committee (document development) activity. All other reproduction and/or distribution without the prior written consent of SEMI is prohibited.
Page 24 Doc. 4571J SEMI
Semiconductor Equipment and Materials International 3081 Zanker Road San Jose, CA 95134-2127 Phone: 408.943.6900, Fax: 408.943.7943
LE
TT
ER
(Y
EL
LO
W)
BA
LL
OT
DRAFTDocument Number: 4571J
Date: 2013-08-27
Col. no. (k)
D65 White Balance adjusted B93 White Balance adjusted
u’ v’ Y/YD65white (%) u’ v’ Y/YB93white (%)
7 0.2958 0.5340 29.20 0.2864 0.5318 27.60
8 0.1777 0.3505 11.77 0.1755 0.3177 12.58
9 0.3176 0.4835 19.34 0.3024 0.4640 18.37
10 0.2307 0.3896 6.57 0.2181 0.3553 6.70
11 0.1842 0.5444 43.49 0.1793 0.5408 42.62
12 0.2572 0.5403 42.98 0.2486 0.5388 41.12
13 0.1750 0.2913 6.23 0.1740 0.2634 6.98
14 0.1461 0.5352 23.64 0.1451 0.5265 23.54
15 0.3783 0.4999 11.89 0.3661 0.4873 10.99
16 0.2289 0.5481 59.62 0.2214 0.5483 57.49
17 0.2872 0.4236 19.27 0.2684 0.3913 18.89
18 0.1429 0.4189 20.71 0.1467 0.3881 21.63
19 0.1985 0.4720 88.95 0.1922 0.4482 88.81
20 0.1985 0.4699 58.64 0.1921 0.4456 58.59
21 0.1979 0.4692 35.34 0.1916 0.4448 35.33
22 0.1979 0.4695 19.37 0.1916 0.4452 19.36
23 0.1979 0.4701 8.45 0.1917 0.4458 8.44
24 0.1999 0.4688 2.93 0.1934 0.4443 2.92
Ave. 0.2169 0.4668 27.19 0.2101 0.4466 26.94
Figure 16
Test Pattern Management for Maintaining APL
9.2.6 Table 8 is about the output color coordinates by the gamma corrected D65 integer inputs for D65 and B93 white balance, it is a little different with the original coordinates of the color reference pattern because of the integer gamma corrected inputs of 8 bits.
9.2.7 In this table, B93 target values are calculated by white balance gain control from D65 RGB inputs instead of B93 XYZ RGB table because display input data shout be same irrespective of a display CCT mode.
9.2.8 For measuring convenience of the same position, screen uniformity and the same APL of the color reference pattern, it can be done as Figure 16.

This is a Draft Document of the SEMI International Standards program. No material on this page is to be construed as an official or adopted Standard or Safety Guideline. Permission is granted to reproduce and/or distribute this document, in whole or in part, only within the scope of SEMI International Standards committee (document development) activity. All other reproduction and/or distribution without the prior written consent of SEMI is prohibited.
Page 25 Doc. 4571J SEMI
Semiconductor Equipment and Materials International 3081 Zanker Road San Jose, CA 95134-2127 Phone: 408.943.6900, Fax: 408.943.7943
LE
TT
ER
(Y
EL
LO
W)
BA
LL
OT
DRAFTDocument Number: 4571J
Date: 2013-08-27
9.2.9 For the color reference pattern, the average color accuracy (%) is calculated as follows:
Caccu_k = 100 - 1000 x Δu’v’k (33)
CRP_C ∑ C _ (34)
9.2.10 The average ΔE* accuracy (%) is calculated as follows:
ΔE*accu_k = 100 - ΔE*
k (35)
CRP_∆E* ∑ ∆E _* (36)
10 Report
10.1 For example, the measurement results are reported as given in Table.
Table 9 Example of tone and color measurement results
Display model no. TEST 1001-01
Gamma accuracy (%)
R G B White
γD γaccu. γD γaccu. γD γaccu. γD γaccu. 2.25 97.73 2.17 98.64 2.16 98.18 2.18 99.09
Primary/ Secondary color
& Gamut
Color Reference Measurement Color
Reproduction Ratio (%)
Standard Reproduction
Ratio (%)
Standard Fidelity (%) u’ v’ u’ v’
R 0.4507 0.5229 0.480 0.522
107.15 97.57 91.06
G 0.1250 0.5625 0.122 0.572 B 0.1754 0.1579 0.169 0.177
C 0.1383 0.4555 0.144 0.462
M 0.3050 0.3297 0.293 0.321
Y 0.2039 0.5529 0.212 0.551
White balance accuracy
Reference D65 A number of APL Accuracy (%)
u’ v’ 9 96.1
0.1978 0.4683
Color accuracy (%) CRP_ΔE*accu (D65) 95.4 CRP_ΔE*accu (B93) 94.2
NOTICE: Semiconductor Equipment and Materials International (SEMI) makes no warranties or representations as to the suitability of the Standards and Safety Guidelines set forth herein for any particular application. The determination of the suitability of the Standard or Safety Guideline is solely the responsibility of the user. Users are cautioned to refer to manufacturer’s instructions, product labels, product data sheets, and other relevant literature, respecting any materials or equipment mentioned herein. Standards and Safety Guidelines are subject to change without notice.
By publication of this Standard or Safety Guideline, SEMI takes no position respecting the validity of any patent rights or copyrights asserted in connection with any items mentioned in this Standard or Safety Guideline. Users of this Standard or Safety Guideline are expressly advised that determination of any such patent rights or copyrights, and the risk of infringement of such rights are entirely their own responsibility.