bahrain economic quarterly - invest in bahrain · stock market sell-off toward the end of the year....
TRANSCRIPT

BAHRAIN ECONOMIC QUARTERLY| DECEMBER 2018
Please refer to the disclaimer at the end of the document. Page 1 of 43
Bahrain Economic Quarterly
December 2018

BAHRAIN ECONOMIC QUARTERLY| DECEMBER 2018
Please refer to the disclaimer at the end of the document. Page 2 of 43
S U M M A R Y
NON-OIL GROWTH CONTINUITY
Reflecting a somewhat muted recovery in the broader region, along with renewed oil price volatility, growth in Bahrain has decelerated from its previous trend in the course of 2018. Lower than expected oil production further contributed to slower headline growth:
Headline growth in Bahrain relapsed slightly in Q3, bringing the YoY rate in Q1-3 markedly down from the pace observed in recent years. The annual rate of real GDP growth in Q3 was 1.6%, although higher oil prices pushed up nominal growth to 7.5%. The oil sector posted a 1.5% YoY contraction whereas growth in the non-oil economy was characterized by relative continuity at 2.4%
Volatility in GDP growth during 1-3Q took place around a lower trend. YoY real growth during the first three quarters of the year came in at just 1.1%. The main reason was a 5% YoY contraction in the oil sector, primarily because of one-off maintenance in Q1. However, even non-oil growth proved slower than in recent years in something of a convergence with the regional trend. The non-oil economy expanded by an annual 2.5% during 1-3Q18
Regional growth has continued its gradual rebound, although renewed crude output controls will likely mute the momentum going forward. Overall, 2017 saw a sharp acceleration in regional growth from the oil-led 0.7% contraction in 2017. Growth was estimated at 2.4% in 2018. Going forward, non-oil growth is set to continue its gradual improvement but the resumption of OPEC-led output cuts will contain the gains in headline growth
Global growth is once again showing signs of becoming more dependent on stimulus. The combination of somewhat weaker economic figures and political risk factors, notably the US-China trade disputes, are prompting a policy review in many countries. Slower tightening by the Fed as well as renewed stimulus should nonetheless shore up growth prospects this year
Bahrain economic outlook 2017 2018e 2019f 2020f Real GDP growth, % 3.8% 2.0% 2.3% 2.4%
Non-hydrocarbons sector 4.9% 2.7% 2.9% 3.0% Hydrocarbons sector -0.7% -1.0% -0.5% -0.5%
Nominal GDP growth, % 9.9% 6.5% 2.8% 4.7% Inflation (CPI %) 1.4% 2.2% 2.8% 2.5% Current account (% of GDP) -3.8% -3.5% -3.2% -3.0% Fiscal balance (% of GDP) -10.1% -6.2% -4.1% -2.1% Crude Oil Brent (USD) 53 72 65 60
Source: Bahrain Economic Development Board estimates
SUMMARY 2
GLOBAL ECONOMY 3
THE GCC REGION 8
BAHRAIN 18
KEY SECTORS 39

BAHRAIN ECONOMIC QUARTERLY| DECEMBER 2018
Page 3 of 43 Please refer to the disclaimer at the end of the document.
G L O B A L E C O N O M Y
A TURBULENT END TO 2018
A generally upbeat year 2018 closed with something of a perfect storm as mounting worries about global growth and political risk contributed to a pronounced increase in financial market pessimism. The persistent trade tensions between China and the US emerged as a particular concern as evidence mounted of their adverse impact on growth while concrete progress toward a deal failed to materialize in spite of high-level discussions.
The increased nervousness about the gloabal economic outlook was particularly evident in a sharp stock market sell-off toward the end of the year. The MSCI ACWI index of global stocks shed 7.2% in December alone. Losses during Q4 reached 13.1% as compared to 11.2% during the generally lackluster year as a whole. Apart from the downtrend, markets have also been characterized by unusual bouts of volality.
In spite of the financial market jitters, the underlying global growth outlook remains generally benign. However, there are growing signs of the cycle turning and various risks factors have clearly tested confidence. This is triggering some downward revisions in growth projections. The World Bank most recently revised its global growth outlook to an estimated 3.0% in 2018 and 2.9% in 2019. Growth in China is projected at 6.2% in 2019 while the US economy is expected to post real growth of 2.5%.
Global equity market performance (Jan 2017 = 100)
Source: MSCI
90
100
110
120
130
140
150
Jan
Feb
Mar Apr
May
June
July
Aug
Sept Oct
Nov
Dec
Jan
Feb
Mar Apr
May Jun Jul
Aug
Sep
Oct
Nov
Dec
2017 2018
ACWI World EFM GCC
Global growth is decelerating somewhat in a maturing cycle as confidence is being tested by political risk factors
BAHRAIN ECONOMIC QUARTERLY| DECEMBER 2018
Page 4 of 43 Please refer to the disclaimer at the end of the document.
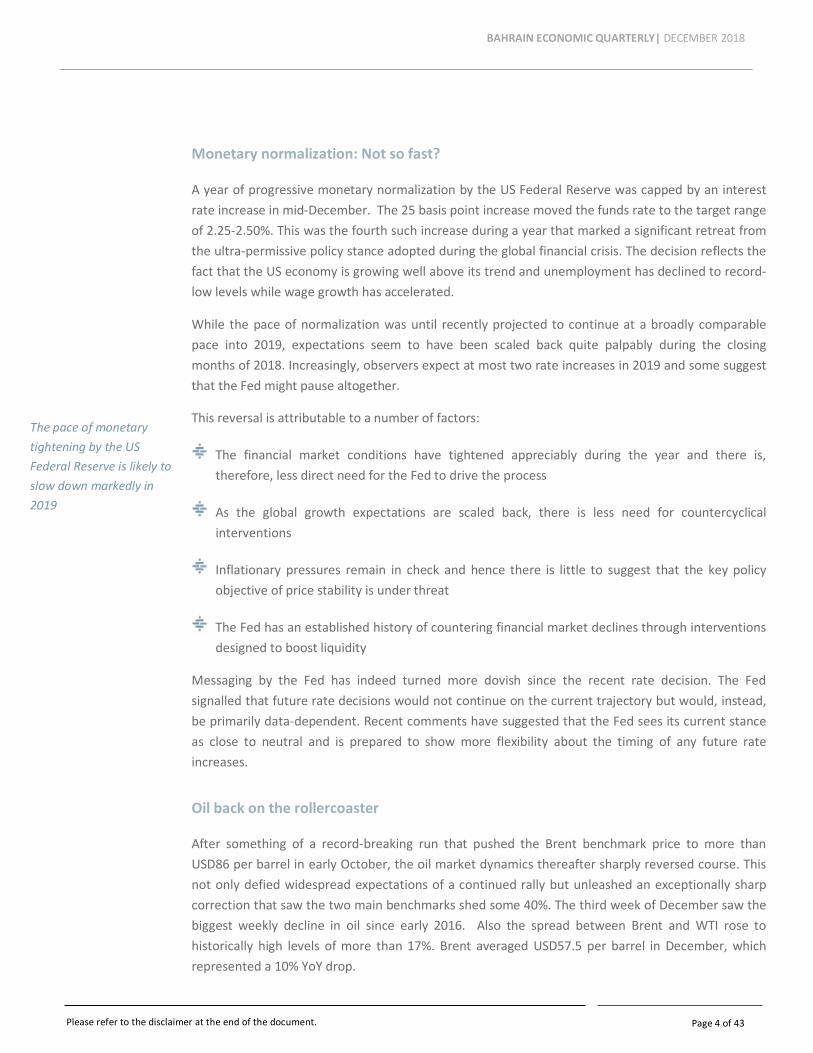
Monetary normalization: Not so fast?
A year of progressive monetary normalization by the US Federal Reserve was capped by an interest rate increase in mid-December. The 25 basis point increase moved the funds rate to the target range of 2.25-2.50%. This was the fourth such increase during a year that marked a significant retreat from the ultra-permissive policy stance adopted during the global financial crisis. The decision reflects the fact that the US economy is growing well above its trend and unemployment has declined to record-low levels while wage growth has accelerated.
While the pace of normalization was until recently projected to continue at a broadly comparable pace into 2019, expectations seem to have been scaled back quite palpably during the closing months of 2018. Increasingly, observers expect at most two rate increases in 2019 and some suggest that the Fed might pause altogether.
This reversal is attributable to a number of factors:
The financial market conditions have tightened appreciably during the year and there is, therefore, less direct need for the Fed to drive the process
As the global growth expectations are scaled back, there is less need for countercyclical interventions
Inflationary pressures remain in check and hence there is little to suggest that the key policy objective of price stability is under threat
The Fed has an established history of countering financial market declines through interventions designed to boost liquidity
Messaging by the Fed has indeed turned more dovish since the recent rate decision. The Fed signalled that future rate decisions would not continue on the current trajectory but would, instead, be primarily data-dependent. Recent comments have suggested that the Fed sees its current stance as close to neutral and is prepared to show more flexibility about the timing of any future rate increases.
Oil back on the rollercoaster
After something of a record-breaking run that pushed the Brent benchmark price to more than USD86 per barrel in early October, the oil market dynamics thereafter sharply reversed course. This not only defied widespread expectations of a continued rally but unleashed an exceptionally sharp correction that saw the two main benchmarks shed some 40%. The third week of December saw the biggest weekly decline in oil since early 2016. Also the spread between Brent and WTI rose to historically high levels of more than 17%. Brent averaged USD57.5 per barrel in December, which represented a 10% YoY drop.
The pace of monetary tightening by the US Federal Reserve is likely to slow down markedly in 2019

BAHRAIN ECONOMIC QUARTERLY| DECEMBER 2018
Page 5 of 43 Please refer to the disclaimer at the end of the document.
A number of factors contributed to the sharp end-year correction:
The primary trigger for this reversal was an unexpectedly wide range of exemptions from the re-imposed US sanctions in Iran. The eight main buyers of Iranian crude were unexpectedly given a 180-day reprieve. This meant that the expected oil market tightening, to which some countries had responded by ramping up their production, failed to materialize. This, in turn, created a situation where short-selling took over the short-term market dynamics
The negative dynamics were further reinforced by renewed financial market volatility, the strong Dollar, and worries about Chinese growth and the general outlook for global trade. The mounting pessimism about the global growth outlook is fuelling fears about the demand growth for oil slowing
The expected adverse impact of infrastructure bottlenecks on US production has been less than expected. The October and November output data were revised up by over 500,000 b/d. US production in late December averaged 11.7 mbd, which marked a remarkable 20% YoY increase. The Baker Hughes rig count for the US was up by 154 YoY to a total of 1.083. The lower prices, along with higher interest rates, may have contributed to this by putting a growing proportion of the American shale producers in the red. Most of them are heavily levered and not covering their costs in the lower price range. In many instances, this prompted them to boost production so as to protect their cash flow situation
In spite of this sharp reversal, there is ample reason to believe that the market sell-off in oil has been exaggerated.
Even with fears of slower growth, global demand for oil is continuing to expand at a fairly brisk pace with the IEA projecting an increment of 1.3 mbd in 2018 and 1.4 mbd in 2019, to a projected total of 100.6 mbd. The IEA, in fact, has projected a global oil shortage by 2Q19
The glut that emerged following the exemptions to the Iran deal is being countered. OPEC and their 11 partners on 7 December agreed to reduce production by 1.4 mbd in a bid to rebalance the markets. 800,000 b/d of this will come from OPEC and 400,000 b/d from the other producers, led by Russia. Also Canada has imposed mandatory output reductions signalled plans to scale back production
OPEC has indicated its readiness to be flexible in order to meet its objectives. A number of countries have voiced their support for the Saudi suggestion that the cuts could last for another six months beyond the initial target
Under the circumstance, an oil price recovery in 2019 seems highly likely. Most projections currently put the Brent benchmark in 2019 at up about USD65 per barrel. However, recent market dynamics suggest that bouts of price volatility may well be becoming the norm for the market.
The recent sell-off in oil looks overdone, although the market remains subject to significant uncertainties

BAHRAIN ECONOMIC QUARTERLY| DECEMBER 2018
Page 6 of 43 Please refer to the disclaimer at the end of the document.
Monthly average crude oil prices (USD/barrel)
Source: US Energy Information Administration
Global oil demand and supply dynamics (mbd) IEA OPEC EIA*
2018 Global oil demand (mbd) 99.2 98.8 100.0 Advanced economies 47.8 47.9 47.6 Developing economies 51.4 50.9 52.4 China 13.1 12.7 13.9
2019 Global oil demand (mbd) 100.6 100.1 101.5 Advanced economies 48.1 48.1 48.1 Developing economies 52.5 52.0 53.5 China 13.5 13.1 14.3
2018 Global oil supply (mbd) - - 100.4 OPEC - - 37.2 Non-OPEC 60.4 60.0 63.2
2019 Global oil supply (mbd) - - 101.8 OPEC - - 36.2 Non-OPEC 61.9 62.2 65.5
*Petroleum and other liquids data Source: International Energy Agency, Organization of the Petroleum Exporting Countries, US Energy Information Administration
20
30
40
50
60
70
80
90
Jan Mar May Jul Sep Nov Jan Mar May Jul Sep Nov Jan Mar May Jul Sep Nov
2016 2017 2018
WTI spot Europe Brent spot

BAHRAIN ECONOMIC QUARTERLY| DECEMBER 2018
Page 7 of 43 Please refer to the disclaimer at the end of the document.
Implications for Bahrain
The global environment entails a generally benign environment for Bahrain:
A slower pace of monetary tightening by the Fed would suggest relative continuity in the monetary conditions and the cost of the capital
The oil price environment is likely to be marked be relative continuity but underscores the importance of fiscal consolidation
BAHRAIN ECONOMIC QUARTERLY| DECEMBER 2018
Page 8 of 43 Please refer to the disclaimer at the end of the document.
T H E G C C R E G I O N
A “NEW NORMAL” TAKES SHAPE
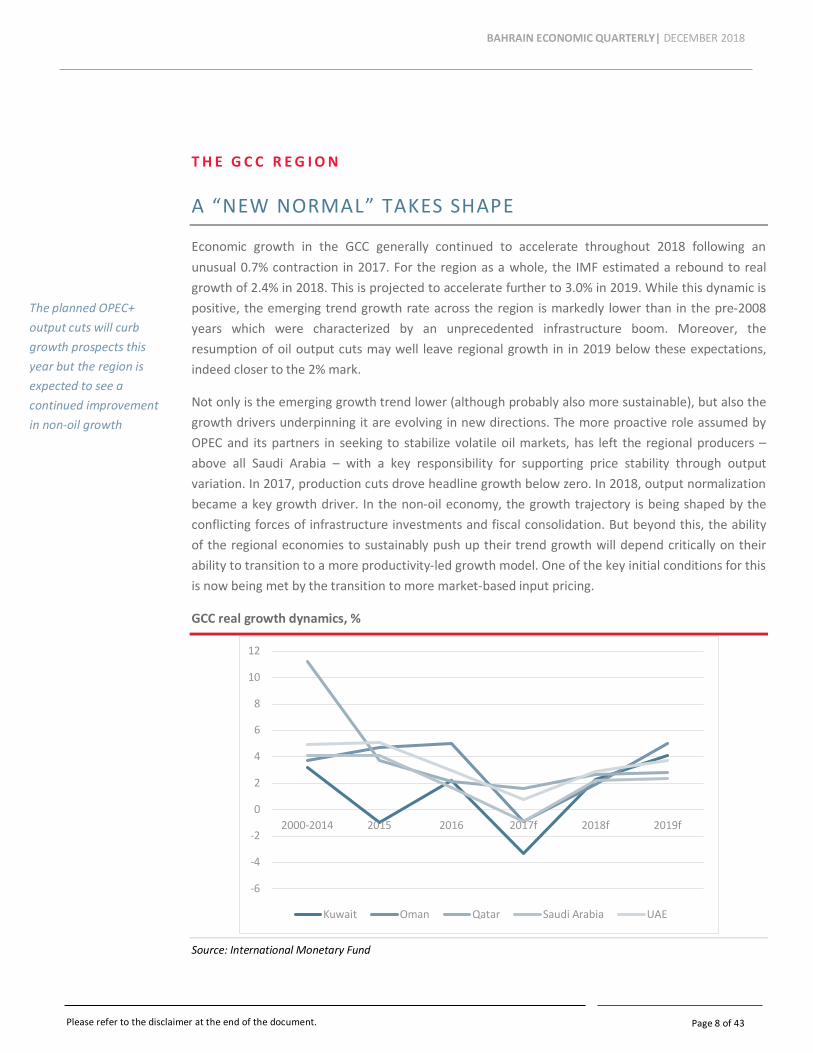
Economic growth in the GCC generally continued to accelerate throughout 2018 following an unusual 0.7% contraction in 2017. For the region as a whole, the IMF estimated a rebound to real growth of 2.4% in 2018. This is projected to accelerate further to 3.0% in 2019. While this dynamic is positive, the emerging trend growth rate across the region is markedly lower than in the pre-2008 years which were characterized by an unprecedented infrastructure boom. Moreover, the resumption of oil output cuts may well leave regional growth in in 2019 below these expectations, indeed closer to the 2% mark.
Not only is the emerging growth trend lower (although probably also more sustainable), but also the growth drivers underpinning it are evolving in new directions. The more proactive role assumed by OPEC and its partners in seeking to stabilize volatile oil markets, has left the regional producers – above all Saudi Arabia – with a key responsibility for supporting price stability through output variation. In 2017, production cuts drove headline growth below zero. In 2018, output normalization became a key growth driver. In the non-oil economy, the growth trajectory is being shaped by the conflicting forces of infrastructure investments and fiscal consolidation. But beyond this, the ability of the regional economies to sustainably push up their trend growth will depend critically on their ability to transition to a more productivity-led growth model. One of the key initial conditions for this is now being met by the transition to more market-based input pricing.
GCC real growth dynamics, %
Source: International Monetary Fund
-6
-4
-2
0
2
4
6
8
10
12
2000-2014 2015 2016 2017f 2018f 2019f
Kuwait Oman Qatar Saudi Arabia UAE
The planned OPEC+ output cuts will curb growth prospects this year but the region is expected to see a continued improvement in non-oil growth

BAHRAIN ECONOMIC QUARTERLY| DECEMBER 2018
Page 9 of 43 Please refer to the disclaimer at the end of the document.
Stronger non-oil momentum checked by oil ouput cuts
The regional economy has been characterized by a measured acceleration in non-oil growth over the past year. This trend is set to continue, indeed accelerate somewhat. By contrast, the resumption of output controls by OPEC will once again dampen growth in the oil sector. Across the region, activity is set to benefit from fairly brisk infrastructure investment activity, whether in preparation for key events (such as Dubai Expo 2020) or because of planned commitments driven by medium-term development strategies. Growth should receive further support from a continued gradual retreat from the most ambitious initial phase of fiscal consolidation, as well as ongoing regulatory reforms designed to improve the business climate.
The Saudi economy is estimated by the Ministry of Finance to have grown by 2.3% in 2018 in a sharp improvement over the -0.9% contraction recorded in 2017. Non-oil growth in 2018 was estimated to be in line with the headline figure. Growth is projected to accelerate to 2.6% in 2019, although the renewed crude output cuts present something of a downside risk. Non-oil growth will benefit from the expansionary 2019 budget which foresees government expenditure reaching an all-time record of SAR1.1trn. Revenues are projected at SAR975bn. In a positive sign for long-term growth potential, the capital expenditure allocation is seen as rising fairly sharply from SAR205bn in 2018 to SAR246bn. Current spending is set for a 4% increase even as the public sector wage bill is expected to decline by 4%. Highlighting the continued progress of revenue diversification, non-oil government income is expected to increase by 9% to SAR313bn. Oil revenues are projected to reach SAR662bn. The government posted a SAR136bn deficit in 2018, equal to 4.6% of GDP.
According to the UAE Central Bank estimates, economic growth in the country accelerated from 2.1% in Q2 to 3.1% in Q3. Following a small -0.6% YoY drop in Q2, the real oil GDP rose by 2.7% in Q3. Non-oil growth is estimated to have held steady at 3.3%. During the year as a whole, real GDP growth is projected to reach 2.8% with a 3.3% expansion in the non-oil economy and a projected 1.7% increase in the oil sector. This compares to 0.8% headline growth in 2017. GDP growth in 2019 is expected to accelerate further to 4.2%, with the non-oil economy set to grow by 3.7%. The resumption of oil output controls may well reduce this somewhat below the 4% mark.
Non-oil growth in Kuwait is likely to accelerate somewhat from the estimated 2.8% pace in 2018. Overall growth is expected to remain above 2% in 2019 following a rebound to an estimated 2.9% in 2018. Growth is Kuwait has been held back by slower than expected capital expenditure, partly in connection with delays in implementing planned flagship projects in energy, petrochemicals, and road infrastructure. Project implementation is expected to accelerate in 2019 whereas consumption growth is showing signs of decelerating somewhat. Similarly, oil output controls will limit upward potential. With a markedly improving fiscal position, also the government has increased spending, by some 9% in FY2017/18 and an estimated 5% in FY2018/19. Even with these gains, government spending is set to remain some 6% below its FY2014/15 peak.
Some regional governments are seeking o boost growth through a combination of fiscal stimulus and regulatory reform

BAHRAIN ECONOMIC QUARTERLY| DECEMBER 2018
Page 10 of 43 Please refer to the disclaimer at the end of the document.
Growth in Qatar is expected to show relative continuity with some moderation in the non-oil space and a rebound in the hydrocarbons sectors. Qatari growth has been estimated at around 2% during 1-3Q18. Growth in Oman is set to improve from just below 3% in 2018 to slightly above 3% with non-oil growth accelerating toward the 3% mark.
Forward-looking indicators of regional growth have displayed some volatility in recent months, partly mirroring the dynamic in oil prices. Both the Saudi and the UAE Purchasing Managers’ Indices dropped in December to 54.5 and 54.0, respectively, even as both indicated continued expansion with readings above 50. Following the December drop, the UAE average for the year as a whole declined from 56.1 in 2017 to 55.5 in 2018. Saudi Arabia saw an even sharper drop from 56.1 to 53.8. Nonetheless, nearly two-thirds of the companies surveyed in the UAE expect better economic conditions within 12 months with only 5.2% foreseeing a deterioration. In Saudi Arabia, the corresponding shares were 53.8% and nil. In both countries, growth appears to have become more reliant on domestic orders which are often secured through some price discounting.
Emirates NBD Purchasing Managers’ Index
Source: Emirates NBD, Markit
Oil production records set in November
Following the steady tightening of oil markets during much of 2018, the regional producers generally increased their output during the closing months of the year. In particular, Saudi production rose to an all-time record of 1.1 mbd in November. During the first 11 months of 2018, Saudi crude production averaged 10.3 mbd, up 3.4% on the 9.9 mbd pace observed during the corresponding period in 2017. All indications are that the recent record production levels will not be matched soon following OPEC’s decision to return to output controls and Saudi Arabia’s communications that it is
484950515253545556575859
Jan Mar May Jul Sep Nov Jan Mar May Jul Sep Nov Jan Mar May Jul Sep Nov
2016 2017 2018
Saudi Arabia United Arab Emirates
Business confidence has shown renewed volatility but a vast majority of companies expect better conditions over the coming 12 months

BAHRAIN ECONOMIC QUARTERLY| DECEMBER 2018
Page 11 of 43 Please refer to the disclaimer at the end of the document.
prepared to cut production as needed to rebalance the currently oversold markets. Saudi production is expected to fall back to 10.2 mbd by January.
Monthly oil production by Saudi Arabia (‘000 b/d)
Source: Joint Organisations Data Initiative, OPEC, Reuters
Production in the rest of the region has been more variable, with the UAE and Oman postings the sharpest increases in their crude extraction. Having troughed at 2.8 mbd in February, the UAE output rose by nearly 20% to 3.3 mbd in November. Oman, having produced fairly consistently under one mbd, saw its output climb above the 1.1 mbd mark in November. Production in Kuwait and Qatar has been fairly flat.
9,000
9,500
10,000
10,500
11,000
11,500
Jan Mar May Jul Sep Nov Jan Mar May July Sep Nov Jan Mar May Jul Sep Nov
2016 2017 2018
Most of the region has seen a clear increase in oil production during 2H18 but the renewed OPEC= controls are set to reverse some of this

BAHRAIN ECONOMIC QUARTERLY| DECEMBER 2018
Page 12 of 43 Please refer to the disclaimer at the end of the document.
Crude oil production in other GCC countries, ‘000 b/d
Source: Joint Organisations Data Initiative, OPEC, Bloomberg
Minimal inflationary pressures
Consumer prices across the region have posted relatively minimal increases in recent months. The sole exception to this trend in Saudi Arabia where annual headline inflation accelerated in September-November, eventually reaching 2.8%. This took the YoY increase in consumer prices almost to the peak recorded at the beginning of the year, following the introduction of VAT.
The UAE has seen unusual volatility in its inflation readings. Having hovered above the 3% mark since the beginning of the year, and briefly even exceeding 4%, inflation declined sharply in September-November. Having peaked at 4.8% in January, it declined to 1.3% in November. While inflationary pressures generally weakened across the board, the sharpest reversal was observed in housing costs, where the YoY pace of change turned sharply negative. It reached -5.2% in October and -5.3% in November. Reflective of a broader trend across, the region, this dynamic is due to combination of increasing new supply in the face of weaker demand due to slower job creation and more anemic wage growth. Real estate prices in Dubai were declining by an annual 7.4% as of 3Q18 while in Abu Dhabi, the drop was 6.1%. Dubai rents declined by an annual 9.6% in Q3 whereas the drop in Abu Dhabi was 11.3%. Also local firms, in line with their peers across the region, have increasingly resorted to output price discounting in a bid to protect order growth.
Oman has seen inflation hover around 1%, whereas both Kuwait and Qatar are experiencing nearly no price pressures. Indeed, Qatari inflation has been mildly negative since September.
0
500
1,000
1,500
2,000
2,500
3,000
3,500
4,000
Jan Mar May Jul Sep Nov Jan Mar May July Sep Nov Jan Mar May Jul Sep Nov
2016 2017 2018
Kuwait Oman Qatar UAE
In spite of continued fiscal consolidation measures, inflationary pressures in the regional have generally diminished

BAHRAIN ECONOMIC QUARTERLY| DECEMBER 2018
Page 13 of 43 Please refer to the disclaimer at the end of the document.
Consumer price inflation, %
Source: National statistical agencies
A mixed end of year
Bank lending in the region has shown a renewed divergence in recent months. Markets such as Qatar and Oman have continued to see a gradual slowdown in new bank lending. In Kuwait, an analogous trend was sharp enough to make the YoY growth rate in bank credit negative. By contrast, Saudi Arabia and the UAE, which tended to see very stagnant lending during much of 2017 and 2018, have experienced a clear acceleration, albeit from a low base.
-1
0
1
2
3
4
5
6
Janu
ary
Mar
ch
May July
Sept
embe
r
Nove
mbe
r
Janu
ary
Mar
ch May
July
Sept
embe
r
Nove
mbe
r
Janu
ary
Mar
ch May July
Sept
embe
r
Nove
mbe
r
2016 2017 2018
Kuwait Oman Qatar Saudi Arabia UAE

BAHRAIN ECONOMIC QUARTERLY| DECEMBER 2018
Page 14 of 43 Please refer to the disclaimer at the end of the document.
Bank credit growth, %
Source: Regional central banks
The performance of the regional equity markets was generally subdued during the last quarter of 2018, which partly reflected the unusually tumultuous end of the year for financial market globally. It further reflected the sharp oil price correction. The only two regional bourses to post net gains during the quarter were Qatar (4.9%) and Kuwait (0.1%). At the other end of the spectrum, Dubai shed 10.8% while Oman declined by 4.8%. Saudi Arabia’s TASI fell by 2.2% and Abu Dhabi was almost flat with a 0.4% drop.
During 2018 as a whole, the regional exchanges have had strikingly divergent fortunes. The strongest performer was Qatar which, after a weak 2017, posted a 20.8% gain. Abu Dhabi increased by 11.7% and Saudi Arabia’s TASI by 8.3%. At the other extreme, Dubai – weighed by real estate companies – declined by 24.9% and Oman by 15.2%. Kuwait posted a small 1.9% contraction.
-5
0
5
10
15
20
25
Janu
ary
Mar
ch
May July
Sept
embe
r
Nove
mbe
r
Janu
ary
Mar
ch
May July
Sept
embe
r
Nove
mbe
r
Janu
ary
Mar
ch
May July
Sept
embe
r
Nove
mbe
r
2016 2017 2018
Kuwait Oman Qatar Saudi Arabia UAE
The performance of the regional stock exchanges has been divergent in 2018

BAHRAIN ECONOMIC QUARTERLY| DECEMBER 2018
Page 15 of 43 Please refer to the disclaimer at the end of the document.
GCC equity market indices (end-December 2016=100)
Source: Regional stock exchanges
Primary equity market activity in 3Q18 remained broadly in line with the first half of the year. Leejam Sports Co. in Saudi Arabia raised USD218mn. Kuwait saw its first IPO in a decade with the offering of Integrated Holding Company KCSC, a manufacturing group that raised USD218mn. In Oman, Dhofar Generating Company raised USD52mn.
In total, the GCC region saw 12 IPOs during 1-3Q18. These raised USD1.4bn. As compared to the same period in 2017, the number of IPOs declined (from 20) while the aggergate proceeds increased fairly sharply (from USD845mn).
Saudi Arabia saw the IPO of the National Company for Learning and Education in October. The offered value was SAR247mn. In November, Saudi Arabia’s Alkhabeer REIT Fund conducted and IPO that raised SAR237.5mn. This was the seventh REIT offering in 2018. Saudi Arabia continued to dominate the regional primary market in 2018 with a total of nine IPOs that raised SAR4.2bn and took the total number of listed companies to 190.
707580859095
100105110115120
Jan
Feb
Mar Ap
r
May Jun Jul
Aug
Sep
Oct
Nov
Dec
Jan
Feb
Mar Ap
r
May Jun Jul
Aug
Sep
Oct
Nov
Dec
2017 2018
Oman Qatar Saudi Arabia Abu Dhabi Dubai
2018 proved a fairly active year for regional IPOs

BAHRAIN ECONOMIC QUARTERLY| DECEMBER 2018
Page 16 of 43 Please refer to the disclaimer at the end of the document.
GCC initial public offerings
Source: Regional stock exchanges
Activity in the fixed income space has been somewhat more subdued thanks to lower soveregin financing requirements in a better fiscal and oil price environment. After three record-breaking years, total GCC primary bond and sukuk issuance in 2018 fell by 14.1% to USD105.9bn. This was in spite of a 20% increase in corporate paper to USD47.2bn. GCC sukuk issuance declined by 20.3% to USD33.4bn led by a 54% drop in Saudi Arabia.
A broadly similar situation is expected in 2019. Saudi Arabia projects a SAR131bn deficit, some SAR118bn of which is due to be financed through debt. In an important step toward further developing its fixed income markets, Saudi Arabia’s new primary market saw offerings of US Dollar-denominated Reg S bonds. The 10-year tranche raised USD4bn and a 31-ye ar tranche USD 3.5bn.
S&P Global expect the funding requirements of the GCC sovereigns to decline from USD450bn between 2015 and 2017 to USD300bn between 2018 and 2020. This is due to higher oil prices and fiscal consolidation efforts by the regional governments. The combined deficit for 2019 is USD75bn, or some 5.5% of the regional GDP. This is down on USD190bn in 2016 – an estimated 16% of GDP. The average net asset position of the GCC is expected to decline from 130% of GDP in 2017 to 110% in 2021.
All the GCC countries will be included in the JP Morgan emerging market government bond indices in 2019. The entry will take place in stages between the end of January and the end of September. The Saudi Ministry of Finance expects the inclusion to boost foreign fixed income inflows by up to UDS11bn.
0
2
4
6
8
10
12
0
500
1000
1500
2000
2500
3000
Q1 Q2 Q3 Q4 Q1 Q2 Q3 Q4 Q1 Q2 Q3
2016 2017 2018
Value (USD mn) Number (RHS)
Healthier government finances have curbed sovereign fixed income issuances as compared to 2017

BAHRAIN ECONOMIC QUARTERLY| DECEMBER 2018
Page 17 of 43 Please refer to the disclaimer at the end of the document.
Implications for Bahrain
The regional backdrop should be generally supportive of growth in Bahrain:
The ongoing fiscal rebalancing should boost confidence and contribute to economic continuity
Faster non-oil growth entails growing discretionary income and increased positive spill-overs. However, the scale of these effects is likely to be relatively modest by recent standards

BAHRAIN ECONOMIC QUARTERLY| DECEMBER 2018
Page 18 of 43 Please refer to the disclaimer at the end of the document.
B A H R A I N
NON-OIL GROWTH CONTINUITY
After a pronounced rebound in real GDP growth in Q2, the momentum weakened somewhat in Q3. Among other things, the oil sector posted a small YoY contraction, according to the preliminary data. Even non-oil growth remained range-bound in spite of some positive leading indicators. The slower momentum is likely to be partly reflective of the broader regional environment as well as increased global economic uncertainty.
Headline annual real growth in Q3 reached 1.6%. Nominal growth was much faster at 7.5% because of the benign oil price environment during the quarter. The oil sector, while posting a remarkable 40.5% increase in nominal terms, saw a 1.5% YoY contraction in real terms even though production actually increased as compared to Q2. The growth dynamics were much more resilient in the non-oil sector which posted a 2.4% YoY expansion.
Overall, the preliminary data for the first three quarters of the year suggest that after a couple of very strong years, growth in Bahrain has converged to an extent with the more subdued regional trend. Because of the oil-led GDP contraction recorded in Q1, the YoY real growth rate during the first three quarters of the year is estimated at the historically modest 1.1%. Whereas the non-oil economy expanded by a healthy 2.5%, the oil sector posted a 5% YoY contraction.
Real GDP growth, %
Source: Information & e-Government Authority
-3
-2
-1
0
1
2
3
4
5
6
7
Q1 Q2 Q3 Q4 Q1 Q2 Q3 Q4 Q1 Q2 Q3
2016 2017 2018
QoQ YoY
Growth in 3Q18 proved more subdued than expected, partly because of a YoY drop in the oil sector

BAHRAIN ECONOMIC QUARTERLY| DECEMBER 2018
Page 19 of 43 Please refer to the disclaimer at the end of the document.
Forecast: Evolving growth drivers Bahrain economic outlook
2017 2018e 2019f 2020f
Real GDP growth, % 3.8% 2.0% 2.3% 2.4%
Non-hydrocarbons sector 4.9% 2.7% 2.9% 3.0%
Hydrocarbons sector -0.7% -1.0% -0.5% -0.5%
Nominal GDP growth, % 9.9% 6.5% 2.8% 4.7%
Inflation (CPI %) 1.4% 2.2% 2.8% 2.5%
Current account (% of GDP) -3.8% -3.5% -3.2% -3.0%
Fiscal balance (% of GDP) -10.1% -6.2% -4.1% -2.1%
Crude Oil Brent (USD) 53 72 61 60
Source: Bahrain Economic Development Board
After a period of very strong expansion, the GDP growth dynamics in Bahrain have become somewhat more volatile as well as more measured. Headline growth in 2018 is now likely to fall significantly below the 2017 figure – to the neighbourhood of 2%. This is to a large extent due to a larger-than-expected contraction in the oil sector but also reflects more subdued non-oil momentum. Going forward, non-oil growth will be pulled down somewhat by the implementation of the Fiscal Balance Programme which will reduce annual government expenditure by some BHD800mn. On the other hand, however, non-oil activity will benefit from the launch and scaling to capacity of Alba Line 6 as well as the implementation of important further infrastructure projects, such as the Bapco Modernization Program and the Khalijj al Bahrain oil field development. While these counterveiling factors entail an unusual margin of error, the baseline projection for next two years is in the range of 2-2.5%.
Real GDP growth composition
Source: Bahrain Economic Development Board, Information & eGovernment Authority
-0.5
0
0.5
1
1.5
2
2.5
3
3.5
4
4.5
2016 2017 2018e 2019f 2020f
Hydrocarbons Non-oil GDP GDP

BAHRAIN ECONOMIC QUARTERLY| DECEMBER 2018
Page 20 of 43 Please refer to the disclaimer at the end of the document.
Non-oil growth marked by continuity
Following a pronounced pick-up in non-oil growth in Q2, the period between July and September was, by contrast, characterized by relative continuity. The YoY real non-oil growth rate during Q3 came in at 2.4% which was slightly lower than the 2.8% pace recorded in Q2. During the first three quarters of the year taken together, the non-oil economy expanded by an annual 2.5% in real terms.
The fastest growing single sector in Q3 was, very atypically, Government Services. This was the case even though the Government Services sector posted a fairly pronounced 12.4% drop from the previous quarter. The brisk annual growth was due to base effects – an unusually weak Q3 in 2017. The annual rate of expansion of Government Services during the first three quarters of the year was 4.6%.
The Construction sector, which had lead growth in 1H18, continued to perform well with 5.4% YoY growth in Q3. The annual rate of expansion during the first three quarters of the year was 6.2%. This should begin to percolate through to faster growth in other parts of the non-oil sector given the strong linkages between Construction and the other parts of the non-oil economy. As a signal of these linkages, the Real Estate & Business Activities sector has posted good forward momentum with 2.9% YoY growth in Q3 and 3.2% during Q1-3 taken together.
The Manufacturing has also seen a clear acceleration since 2017. It posted 3.0% YoY growth in Q3 and expanded by an annual 3.8% during the first three quarters. The Social & Personal Services sector posted 3.1% growth in Q3 and 3.6% during the first three quarters.
Growth was weakest in tourism, trade, and transportation. More complete data for the Hotels & Restaurants points to greater resilience than initially estimated but the sector nonetheless contracted by 1.4% YoY in Q3 and by 3.4% during the first three quarters. The Trade sector contracted by 0.8% YoY in Q3 and by 1.4% during the first three quarters. The Transportation & Communications sector posted a 1.9% YoY contraction in Q3 and a small 0.1% YoY increased in Q1-3. Performance in all three areas has been affected by slower disposable income growth across the region, which has contained discretionary spending locally and by visiting tourists. Also, while increased capacity in tourism and retail drove growth in 2017, these factors have been less important this year.
Non-oil growth has remained generally stable in Q1-3 led by the Construction sector

BAHRAIN ECONOMIC QUARTERLY| DECEMBER 2018
Page 21 of 43 Please refer to the disclaimer at the end of the document.
Real GDP growth composition
Source: Information & eGovernment Authority
-4
-3
-2
-1
0
1
2
3
4
5
6
Q1 Q2 Q3 Q4 Q1 Q2 Q3 Q4 Q1 Q2 Q3
2016 2017 2018
Oil Government Other GDP

BAHRAIN ECONOMIC QUARTERLY| DECEMBER 2018
Page 22 of 43 Please refer to the disclaimer at the end of the document.
Sector-specific real growth rates, YoY (%)
2017 2018
YoY growth, % Annual Q1 Q2 Q3 Q1-3
Crude Pet. & Nat. Gas
-0.75% -14.67% 0.82% -1.54% -4.98%
Manufacturing 1.07% 4.14% 4.42% 2.98% 3.84%
Construction 1.75% 6.68% 6.65% 5.36% 6.23%
Trade 8.54% -2.70% -0.76% -0.84% -1.43%
Hotels & Restaurants
9.45% -2.75% -6.13% -1.41% -3.43%
Transp. & Comm’s 6.16% 2.60% -0.10% -1.95% 0.15%
Social & Pers. Serv. 9.38% 4.09% 3.17% 3.07% 3.62%
Real Est. & Bus. Act.
6.42% 3.73% 3.04% 2.94% 3.23%
Finance 4.97% -0.06% 0.09% 0.82% 0.28%
Government 3.87% 3.71% 3.67% 6.52% 4.56%
Other 9.71% -3.58% 12.38% 3.40% 4.13%
GDP 3.80% -0.88% 2.46% 1.62% 1.09%
Non-oil GDP 4.9% 2.2% 2.8% 2.4% 2.5%
Source: Information & eGovernment Authority

BAHRAIN ECONOMIC QUARTERLY| DECEMBER 2018
Page 23 of 43 Please refer to the disclaimer at the end of the document.
In spite of slower trend growth in Q1-3 as compared to 2017, business confidence has remained generally resilient. Opinions about the current business environment in W3 were almost unchanged as compared to the quarter before. A clear majority of respondents – 61.3% -- were neutral. Positive responses accounted for just over a quarter – 25.9% -- of the total. Only a small minority of 12.8% were pessimistic, a slight increase on 11.8% the quarter before.
Bahrain QBPS opinions regarding current business performance, 2-3Q18
Source: Information & eGovernment Authority
Forward-looking expectations were, similarly, little changed. Just under half (49.3%) of the respondents were neutral regarding the Q4 outlook, while the share of optimists was 43.8%. Pessimists accounted for 6.8% of the total. Both proportion of optimists as well as the share of pessimists declined slightly from the previous quarter in favour of neutral perceptions.
0%10%20%30%40%50%60%70%80%90%
100%
Q1 Q2 Q3 Q4 Q1 Q2 Q3
2017 2018
Favourable Neutral Unfavourable
Business confidence continues to be characterized by a high degree of continuity

BAHRAIN ECONOMIC QUARTERLY| DECEMBER 2018
Page 24 of 43 Please refer to the disclaimer at the end of the document.
Bahrain Business Confidence Index, forward-looking expectations for 3-4Q18
Source: Information & eGovernment Authority
Business confidence levels tended to be highest among medium-sized companies (51-100 employees) and lowest among large companies. The optimistic sectors of the economy were banks and real estate followed by manufacturing and construction.
Oil production stable in Q3
Oil output levels from both the offshore Abu Sa’afah and the onshore Bahrain Field have held steady during the second half of 2018. Total production in Q3 averaged 198,890 b/d and continued virtually unchanged in October. The overall production level in Q3 was 3.4% lower than in Q2 and a comparable 3.4% down YoY. During the first three quarters of the year, average production was 6.4% lower than in 2017, reflecting the impact of a weak Q1 due to field maintenance.
Production from the offshore Abu Sa’afah field averaged 150,463 b/d during the first three quarters of 2018. This represented a 5.8% YoY drop. Production from the onshore Bahrain field has continued to trend down and was 8.3% lower in Q1-3 than a year earlier. It averaged just over 40,000 b/d during Q1-3.
0%10%20%30%40%50%60%70%80%90%
100%
Q2 Q3 Q4 Q1 Q2 Q3 Q4
2017 2018
Optimistic Neutral Pessimistic
Oil production has remained stable since a maintenance-related drop in 1Q18

BAHRAIN ECONOMIC QUARTERLY| DECEMBER 2018
Page 25 of 43 Please refer to the disclaimer at the end of the document.
Crude oil production, b/d
Source: National Oil and Gas Authority
The Government recently announced that the Italian oil company Eni is planning to invest some USD30mn in exploring Block 1, an offshore area of more than 2,800 sq km that is still largely unexplored. The block is located in the northern territorial waters and has water depth ranging from 10 to 70 metres. A production concession is expected within a year.
Project implementation remains a key growth driver
Infrastructure expenditure has been an important source of economic continuity in Bahrain recent years. It is set to remain an important source of economic continuity also in the medium-term with a continued build-up of projects under the auspices of the USD7.5bn GCC Development Program but also a range of private and semi-government projects.
Project activity in the GCC-funded projects has seen another major build-up in 2018 with the cumulative total of active (commenced) projects rising to USD3.8bn from USD3.3bn a year earlier – a 16.3% YoY increase. The cumulative cash flow of the projects for the first time broke through the USD2bn mark at the end of 2018. The aggregate total of USD2.2bn was a remarkable 57.8% higher than a year earlier.
0
50,000
100,000
150,000
200,000
250,000
Q1 Q2 Q3 Q4 Q1 Q2 Q3 Q4 Q1 Q2 Q3 X
2016 2017 2018
Bahrain Field Abu Sa'afah

BAHRAIN ECONOMIC QUARTERLY| DECEMBER 2018
Page 26 of 43 Please refer to the disclaimer at the end of the document.
GCC Development Program project pipeline, USD mn (cumulative totals)
Source: Government sources
An important flagship project in the infrastructure space reached an important milestone at the end of the year when Alba produced the first aluminium from in new Line 6 on 13 December. Once fully operational, the 1.4-km long pot-line will boost Alba’s capacity by 540,000tn per year from the current 1mn tn/year, making Alba the world’s largest single-site smelter.
Also the airport modernization project is making headway. The first phase of the USD1.1bn passenger terminal is on schedule to be completed in 3Q19. Companies were invited to bid for the operation concept of lounges at the new terminal in December. France’s Egis International won a USD4.7mn contract to supervise the design and construction of a cargo express village. Bids are being evaluated for design and operate an airport hotel. The Civil Aviation Affairs building will be converted to a new VIP terminal.
Also other major projects are expected to start soon in the transportation space:
The transaction advisory contract for the first phase of the light rail network project is imminent. A detailed study for the scheme was completed earlier this year. Phase 1 is expected to have 30 km of track and 20 station. The entire system envisages a network of 184 km made up of six lines and is expected to be completed by 2030
Bids are expected by February on the transaction advisory contract for the King Hamad Causeway. The 25km causeway will be the second overland connection between Saudi Arabia and Bahrain. It will be aligned with the existing King Fahad Causeway but will also provide a platform for the GCC railway. Construction is expected to start within three years and the projected budget is USD3-4bn
0
1000
2000
3000
4000
5000
6000
7000
Q1 Q2 Q3 Q4 Q1 Q2 Q3 Q4 Q1 Q2 Q3 Q4*
2016 2017 2018
Tendered Awarded Commenced Disbursed
Landmark infrastructure projects in manufacturing and transportation, led by Alba Line 6 and the new airport, are nearing completion

BAHRAIN ECONOMIC QUARTERLY| DECEMBER 2018
Page 27 of 43 Please refer to the disclaimer at the end of the document.
The energy sector remains another major focus for investment:
The 112 km AB-4 oil pipeline. The 112 km pipeline between Abqaiq in Saudi Arabia and Bapco’s Sitra refinery was commissioned in October It has a capacity of 350,000 b/d, as compared to the 230,000 b/d capacity of the oil pipeline. The increased capacity will help supply the refinery after its modernization project which is expected to be completed in 2022 and will boost capacity to 360,000 b/d
Tatweer Petroleum is evaluating tenders for two gas dehydration unit trains in the Awali field, each of them with a processing capacity of 500mn cfd.
In the real estate sector, Eagle Hills Diyar has awarded contracts for a 200,000 sq me Marassi Galleria Mall as well Vida Hotel and Serviced Apartments. This is part of a larger mixed-use development which, among other things, includes a 2 km beach.
Trade dynamics reflect continuity
Bahraini exports of local origin totalled USD5.5bn during the first 11 months of 2011. This was up by just under 9% in YoY terms. Re-exports during the period reached USD1.2bn. This represented a 2.2% drop as compared to the corresponding period of 2017. Bahraini imports reached an aggregated total of USD13.6bn during the January-November 2018 period. This figure was up 13.3% YoY.
Non-oil trade, USD mn
Source: Information & eGovernment Authority, preliminary data from Customs Affairs
-2000
-1500
-1000
-500
0
500
1000
Jan
Mar
May Ju
l
Sep
Nov
Jan
Mar
May Ju
l
Sep
Nov
Jan
Mar
May July
Sept
embe
r
Nove
mbe
r
2016 2017 2018
Re-exports Exports Imports
Trade volumes have continued to expand with a 9% YoY increase in exports of national origin during the first 11 months of 2018

BAHRAIN ECONOMIC QUARTERLY| DECEMBER 2018
Page 28 of 43 Please refer to the disclaimer at the end of the document.
Introducing VAT
The Government of Bahrain introduced the value added tax (VAT) as of 1 in January 2019. The implementation will be staggered in three stages spanning the full year. It will start with the largest companies with annual taxable supplies of at least BHD5mn. The second stage is due to cover businesses with annual taxable supplies of more than BHD500,000 with implementation set to take place on 1 June. The final stage, effective on 1 January 2020, will cover businesses with annual taxable supplies in excess of BHD37,500. Voluntary registration is possible for companies with taxable supplies in excess of BHD18,750. Non-resident business supplying taxable goods and services will have to register as of the date of their first taxable supply. While filing is expected to be at most quarterly during the first year, it is eventually expected to be monthly for larger businesses and quarterly for companies with taxable supplies of less than BHD3mna year.
While most goods and services will come under the 5% tax, there will be several areas where a 0% rate applies, such as:
Basic foodstuffs
Healthcare and medication
Construction of new buildings
Education
Local transportation
Oil and gas
In addition, some activities will be exempt, notably the lease or sale of real estate and most kinds of financial services with the expectation of fees and commissions.
The inflationary impact of VAT should be significantly less than in Saudi Arabia and the UAE because of the exemptions for categories of goods that dominate the CPI basket.
Weaker price pressures
Inflationary pressures in the economy have continued to trend down. The year-to-date inflation rate in November was 2.1%. However, the annual pace for November itself was only 0.7%. Price dynamics have weakened markedly since the summer and dipped at just 0.5% in October. Among other things, imported inflation has been minimal because of the strength of the US Dollar.
Among the main categories of the CPI basket, food prices have shown some volatility. They fell to 0.7%R In September but had rebounded by 2.5% by November. By contrast, housing costs have ceased to contribute to inflation with the YoY pace turning slightly negative as of September. The
Lower housing cost inflation has contributed to waning price pressures in line with region-wide trends

BAHRAIN ECONOMIC QUARTERLY| DECEMBER 2018
Page 29 of 43 Please refer to the disclaimer at the end of the document.
same reading was recorded in November. Rental inflation has been contained by new supply whereas other housing costs have been fairly static. Transportation costs, by contrast, have continued to increase by an annual pace of 10% and still reflect the scaling back of transportation fuel subsidies.
Consumer price inflation, % YoY
Source: Information & e-Government Authority
Credit growth remains strong
In an encouraging sign for the non-oil sector, credit growth has remained robust throughout the year, even if it has moderated marginally from the peak rates recorded in the summer. It should be noted, however, that the moderation has been largely due to a decline in loans to the Government. Lending to the private sector actually reached its fastest growth in September-November. With 9.2% YoY growth in November, bank credit in Bahrain was growing faster than anywhere else in the region.
Total outstanding retail bank loans stood at BHD9.4bn in November. 53.5% of the total were business loans and 43.8% personal loans. The aggregate value of business loans has increased by 9.7% over the past year. Personal loans have gone up by 10.6% over the same period.
In a major corporate deal, the Al Dur Power & Water Company in November closed a USD1.3bn refinancing facility to replace an original package put in place in 2009. The new package is composed of USD450mn of convention and USD850mn of Shariah-compliant funding with tenors of up to 14 years. The new package involved 20 local and international financial institutions. Al Dur generated one-third of Bahrain’s power and water needs with a capacity of 1,243 GW of power and 48mn imperial gallons of water per day. The project is operated by the French Engie company and the Gulf
-10
-5
0
5
10
15
20
Jan Mar May Jul Sep Nov Jan Mar May Jul Sep Nov Jan Mar May Jul Sep Nov
2016 2017 2018
CPI
Food and non-alcoholic beverages
Housing, water, electricity, gas, and other fuels
Transportation
Bank lending has continued to growth at a brisk pace well ahead of the regional average

BAHRAIN ECONOMIC QUARTERLY| DECEMBER 2018
Page 30 of 43 Please refer to the disclaimer at the end of the document.
Investment Corporation domiciled in Kuwait. Operational since 2012, the company has a 25-year power and water purchase agreement signed in 2009.
YoY growth in credit issued by retail banks, BHD mn
Source: Central Bank of Bahrain
Deposit growth has relapsed markedly from its double-digit peak growth in the spring. Nonetheless, deposits have continued to expand at a fairly brisk pace of around 5% YoY. This is likely at least partly reflective of the higher interest rate environment following the recent US interest rate increases which the Central Bank of Bahrain has mirrored. Most recently, on 19 December, the CBB increased its key policy rate on the one-week deposit facility from 2.5% to 2.75%. The overnight rate was increased from 2.25% to 2.5% and the lending rate from 4.25% to 4.5%. The one-month deposit rate was left unchanged at 3.25%.
0.00%
2.00%
4.00%
6.00%
8.00%
10.00%
12.00%
14.00%
-400
-200
0
200
400
600
800
1000
Jan
Mar
May Ju
l
Sep
Nov
Jan
Mar
May Ju
l
Sep
Nov
Jan
Mar
May Ju
l
Sep
Nov
2016 2017 2018
Private sector Government Total credit growth, RHS
Deposit growth has accelerated to around 5% YoY

BAHRAIN ECONOMIC QUARTERLY| DECEMBER 2018
Page 31 of 43 Please refer to the disclaimer at the end of the document.
Deposit liabilities to non-banks, BHD mn
Source: Central Bank of Bahrain
The cost of borrowing has continued to increase in tandem with the higher policy rates. The increase has been particularly pronounced with respect to business loans, although these have also shown far greater volatility. In the second half of the year (excluding December), the cost of business loans averaged 6.5%, peaking at 7% in November. This compared to 5.9% during the first half of the year. The cost of personal loans averaged 5.3% in July-November, up only marginally from 5.2% during the first half of the year.
Average rate of interest on credit facilities (conventional retail banks)
Source: Central Bank of Bahrain
-2
0
2
4
6
8
10
12
14
16
02000400060008000
100001200014000160001800020000
Jan Mar May Jul Sep Nov Jan Mar May Jul Sep Nov Jan Mar May Jul Sep Nov
2016 2017 2018
Government Private sector Foreign YoY % change
3.00%
3.50%
4.00%
4.50%
5.00%
5.50%
6.00%
6.50%
7.00%
7.50%
Jan Mar May Jul Sep Nov Jan Mar May Jul Sept Nov Jan Mar May Jul Sep Nov
2016 2017 2018
Business Loans (Excluding overdraft approvals) Personal Loans
BAHRAIN ECONOMIC QUARTERLY| DECEMBER 2018
Page 32 of 43 Please refer to the disclaimer at the end of the document.
Continued stability at the Bourse
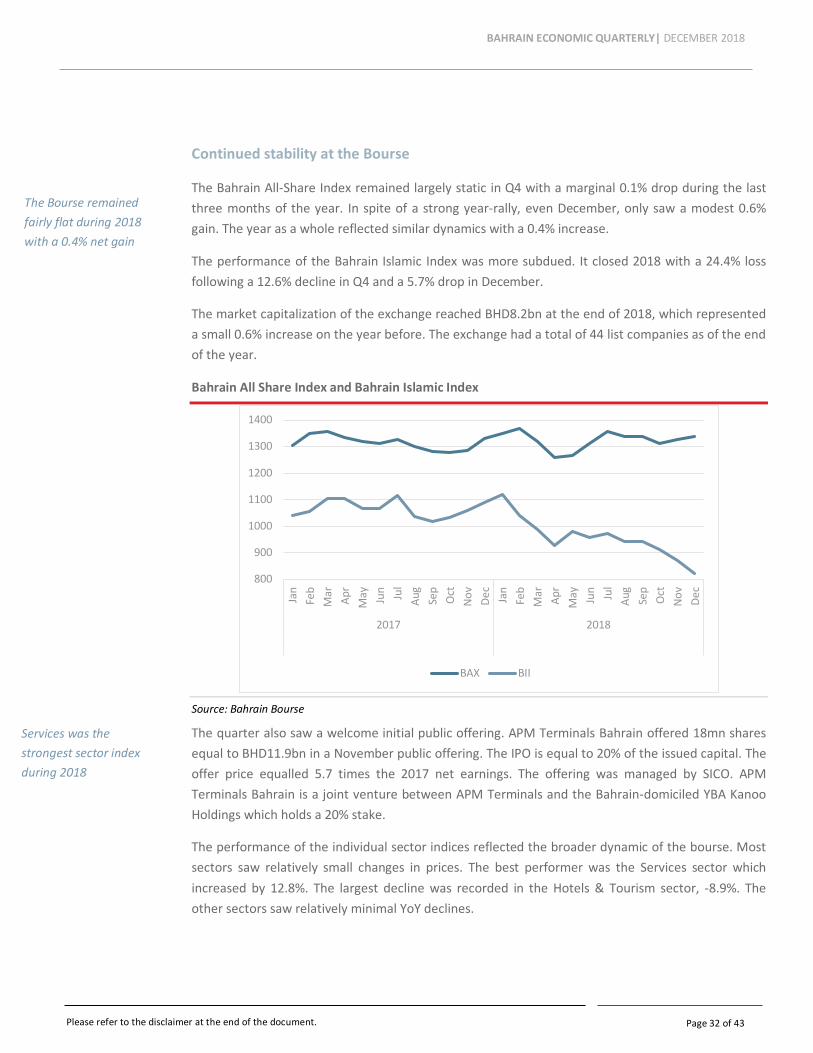
The Bahrain All-Share Index remained largely static in Q4 with a marginal 0.1% drop during the last three months of the year. In spite of a strong year-rally, even December, only saw a modest 0.6% gain. The year as a whole reflected similar dynamics with a 0.4% increase.
The performance of the Bahrain Islamic Index was more subdued. It closed 2018 with a 24.4% loss following a 12.6% decline in Q4 and a 5.7% drop in December.
The market capitalization of the exchange reached BHD8.2bn at the end of 2018, which represented a small 0.6% increase on the year before. The exchange had a total of 44 list companies as of the end of the year.
Bahrain All Share Index and Bahrain Islamic Index
Source: Bahrain Bourse
The quarter also saw a welcome initial public offering. APM Terminals Bahrain offered 18mn shares equal to BHD11.9bn in a November public offering. The IPO is equal to 20% of the issued capital. The offer price equalled 5.7 times the 2017 net earnings. The offering was managed by SICO. APM Terminals Bahrain is a joint venture between APM Terminals and the Bahrain-domiciled YBA Kanoo Holdings which holds a 20% stake.
The performance of the individual sector indices reflected the broader dynamic of the bourse. Most sectors saw relatively small changes in prices. The best performer was the Services sector which increased by 12.8%. The largest decline was recorded in the Hotels & Tourism sector, -8.9%. The other sectors saw relatively minimal YoY declines.
800
900
1000
1100
1200
1300
1400
Jan
Feb
Mar Apr
May Jun Jul
Aug
Sep
Oct
Nov
Dec
Jan
Feb
Mar Apr
May Jun Jul
Aug
Sep
Oct
Nov
Dec
2017 2018
BAX BII
The Bourse remained fairly flat during 2018 with a 0.4% net gain
Services was the strongest sector index during 2018

BAHRAIN ECONOMIC QUARTERLY| DECEMBER 2018
Page 33 of 43 Please refer to the disclaimer at the end of the document.
Changes in sectoral stock market indices, 2017 vs. 2018
Source: Bahrain Bourse
In the fixed income space, Nogaholding in November issued as USD1bn dual-tranche bond, the second issue in its USD3bn program. The offering was composed in equal measure from a 7.625% six-year notes and 8.375% 10-year notes. The offering drew a total order book of USD2.5bn and 70% of the subscriptions came from US and UK investors. The joint global coordinators were BNP Paribas, Citi, and JP Morgan.
The CBB in December launched a new liquidity management tool known as Interbank Repurchase for local currency-denominated Government of Bahrain conventional securities. This allows local banks to raise liquidity by selling government securities to another bank for an agreed-up period and at a mutually agreed price. The transaction is automatically reversed on the closing date. The transfer and settlement are conducted by the Scripless Securities Settlement System and the Real Time Gross Settlement System operated by the CBB.
-20% 0% 20% 40% 60% 80% 100%
Commercial Banks
Investment
Insurance
Services
Industrial
Hotels & Tourism
2018 2017
Nogaholding placed a USD1bn bond in November

BAHRAIN ECONOMIC QUARTERLY| DECEMBER 2018
Page 34 of 43 Please refer to the disclaimer at the end of the document.
Short-term bond and sukuk issues arranged by the Central Bank of Bahrain Issue date
Issue Value,
BHD mn Maturity,
days
Average interest/
profit rate, %
Average price, %
Over-subscripti
on, %
3 Oct 2018 Treasury bill No. 1724 70 91 4.18 98.955 131
10 Oct 2018 Treasury bill No. 1725 70 91 4.20 98.950 138
11 Oct 2018 Sukuk al ijarah No. 158 26 182 4.37 100
17 Oct 2018 Sukuk al salam No. 210 43 91 4.20 100
24 Oct 2018 Treasury bill No. 1726 70 91 4.21 98.947 101
25 Oct 2018 12-month Treasury bill
No. 50 100 365 4.89 95.284 148
31 Oct 2018 Treasury bill No. 1727 70 91 4.26 98.934 120
8 Nov 2018 Sukuk al ijarah No. 159 26 182 4.27 100
11 Nov 2018 Treasury bill No. 1729 35 182 4.40 97.825 103
14 Nov 2018 Treasury bill No. 1730 70 91 4.26 98.934 122
21 Nov 2018 Sukuk al salam No. 211 43 91 4.25 100
28 Nov 2018 Treasury bill No. 1731 70 91 4.27 98.933 154
2 Dec 2018 Treasury bill No. 1732 35 182 4.45 97.800 118
5 Dec 2018 Treasury bill No. 1733 70 91 4.27 98.932 106
12 Dec 2018 Treasury bill No. 1734 70 91 4.27 98.932 105
13 Dec 2018 Sukuk al ijarah No. 160 26 182 4.45 100
19 Dec 2018 Sukuk al salam No. 212 43 91 4.27 100
26 Dec 2018 Treasury bill No. 1735 70 91 4.25 98.938 138
27 Dec 2018 12-month Treasury bill
No. 52 100 365 4.90 95.279 148
30 Dec 2018 Treasury bill No. 1736 35 182 4.40 97.825 199
2 Jan 2019 Treasury bill No. 1737 70 91 4.25 98.936 132
Source: Central Bank of Bahrain
Labour markets largely unchanged
The labour market has continued its gradual normalization after a sharp deceleration in employment growth last year. This followed a number of administrative measures to regularize the labour market and achieve better synchronization of the processes of different government agencies. The labour market review has continued to an extent also this year with more than 13,000 records of foreign domestic workers cleansed in 2Q18.
The total number of contributors to the Social Insurance Organisation stood at just under 650,000 in Q3. It was down 0.3% in annual terms. The number of foreign workers in the private sector declined by an annual 0.6%. By contrast, Bahraini employment has continued to grow at a measured pace. It reached just under 147,000 in Q3 in spite of a sustained gradual decline in public sector
The labour markets are continuing to normalize after an unusual 2017

BAHRAIN ECONOMIC QUARTERLY| DECEMBER 2018
Page 35 of 43 Please refer to the disclaimer at the end of the document.
employment. Bahraini employment in the public sector declined by an annual 1.4%. 63.5% of Bahraini nationals now work in the private sector.
Change in Social Insurance Organisation contributors (%)
Source: Social Insurance Organisation
-2
-1
0
1
2
3
4
5
6
7
Q1 Q2 Q3 Q4 Q1 Q2 Q3 Q4 Q1 Q2 Q3
2016 2017 2018
QoQ YoY

BAHRAIN ECONOMIC QUARTERLY| DECEMBER 2018
Page 36 of 43 Please refer to the disclaimer at the end of the document.
External assessments
Index/report Description Global rank
MENA rank
Key strengths highlighted
B2C E-commerce Index by UNCTAD
Measures the preparedness of economies to support online shopping on the basis of four indicators:
Share of individuals with an account
Share of individuals using the internet
Secure internet servers
UPU Postal Reliability Index
62 (out of 151)
5
96% of the population use the internet
83% of the population own a financial account or mobile money-service provider
Global Knowledge Index by UNDP and Mohammed bin Rashid Al Maktoum Foundation
Measures knowledge and highlights the importance of developing objective and scientific tools to measure and evaluate it. Focuses on:
Pre-university education
Technical vocational education and training
Higher education
Research, development and innovation
Economic openness and knowledge competitiveness
Enabling environment
44 (out of 134)
3
Inclusive education and relatively high attainment
Good access to training and talent
Effective ICT development and inclusion
Low unemployment and liberal business regulations
Islamic Finance Development Indicator by ICD and Thomson Reuters
Measures the overall development of the Islamic finance industry by providing an assessment of its performance on the basis of:
Quantitative indicators of development
Governance
CSR
Knowledge (education, research)
Awareness
2 1
High concentration of Islamic financial institutions
Increased sukuk issuance and listing
Supportive infrastructure for Islamic banking
CSR disclosure

BAHRAIN ECONOMIC QUARTERLY| DECEMBER 2018
Page 37 of 43 Please refer to the disclaimer at the end of the document.
Doing Business Report by the World Bank
Measures and tracks changes in ten areas relevant to businesses:
Starting a business
Dealing with construction permits
Getting electricity
Protecting minority investors
Registering property
Getting credit
Resolving insolvency
Trading across borders
Enforcing contracts
Paying taxes
62 (out of 190)
3
Acknowledges recent reforms in two areas:
Strengthening protection of minority investors: increasing shareholders rights in major decisions, clarifying ownership and control structures, and requiring greater corporate transparency
Trading across borders: strengthened border infrastructure for imports and improved electronic submission and processing of documents for imports
Global Competitiveness Report by World Economic Forum
Measures national competitiveness based on:
Enabling environment
Markets
Human capital
Innovation ecosystem
50 (out of 140)
5
Education and skills of the workforce
Electricity quality
98% of the population are internet users
Cooperation in labour-employer relations
Wage determination flexibility
Cost of starting a business
Expat Explorer Survey by HSBC
Ranks countries based on expatriates’ overall views. The index components include:
Economics
Experience
Family
5 (out of 31)
1
Personal finance: wage growth, disposable income and savings
Careers: career progression, work/life balance and job security
Lifestyle: quality of life and making friends
Setting up: availability of property & healthcare
Education & childcare: school quality and cost and quality of childcare
Relationships: tolerance & social life

BAHRAIN ECONOMIC QUARTERLY| DECEMBER 2018
Page 38 of 43 Please refer to the disclaimer at the end of the document.
Human Capital Index by the World Bank Group
Measures the amount of human capital a child born today could expect to attain by age 18. The components include:
Survival
School
Health
47 (out of 157)
1
The index is higher for girls than for boys
Expected years of schooling highest in the GCC: an average of 13.3 years by age 18
Score of 452 on international student achievement testing programs in the highest in the GCC

BAHRAIN ECONOMIC QUARTERLY| DECEMBER 2018
Page 39 of 43 Please refer to the disclaimer at the end of the document.
K E Y S E C T O R S
INNOVATION AGENDA MOVES FORWARD
A record year for FDI
The Bahrain Economic Development Board attracted a total of 92 companies and investments worth BHD314mn to Bahrain in the course of 2018. These projects are expected to generate a total of 4,700 new job opportunities over the coming three-year period. The EDB also received a United Nations award for excellence in boosting sustainable investment in line with the Sustainable Development Goals. Bahrain was one of four countries recognized in 2018 and the only one from the Middle East-North Africa region.
This continues a strong build-up in foreign investment inflows into the Kingdom in recent years. According to the final foreign investment data published by the Information & eGovernment Authority, total foreign direct investment inflows into the Kingdom reached BHD536.22 in 2017. The total value of foreign inward investment of all kinds reached BHD1.5bn.
Bahrain foreign inward investment dynamics, 2016-2017
Type of foreign inward investment
Flow, BHD mn Year-end stock, BHD mn
2017 2016 2017
Foreign direct investment
536.22 9,796.80 10,333.02
Foreign portfolio investment
-235.93 3,611.68 3,375.75
Other foreign investment
1,189.40 8,288.29 9,477.69
Total foreign inward investment
1,489.68 21,696.78 23,186.46
Source: Information & eGovernment Authority
Financial services accounted for 75.5% of inward FDI flows in 2017. The share of banking alone was 64.8% and that of insurance 10.7%. The manufacturing sector made up 12.4% of Bahrain’s inward FDI.
Continuing a positive trend in FDI, the EDB attracted investments worth BHD314mn in the course of 2018

BAHRAIN ECONOMIC QUARTERLY| DECEMBER 2018
Page 40 of 43 Please refer to the disclaimer at the end of the document.
The inward FDI stock as of the end of 2017 involved investments from 68 countries, up from 63 a year earlier. The GCC remain the most important source of inward FDI with a 65.3% share of the total in 2017. FinTech momentum
The efforts to develop Bahrain’s emerging FinTech cluster are continuing to make good progress. Bahrain in October won the MENA Fintech Hub of the Year Award which recognizes excellence in creating an active and innovative FinTech ecosystem. The Award was conferred by Fintech Galaxy, a digital crowdfunding platform, and the Entrepreneur Middle East magazine at the FinX 2018 event in Dubai. The award recognizes collaboration among different stakeholders as well as a regulatory environment that promotes innovation.
The CBB announced in early December that Tarabut Gateway, a subsidiary of Almoayed Technologies, was the first company graduate from the FinTech sandbox. The company received the CBB’s confirmation in principle under the Open Banking regulatory framework.
Collaboration with other jurisdictions is seen as central for the FinTech development agenda:
Abu Dhabi Global Markets and the Central Bank of Bahrain in November signed a memorandum of understanding to promote innovation in financial services in the UAE and Bahrain. Signed by the foreign minister of the two countries, the agreement creates an official mechanism for the two regulatory agencies collaborate of regulatory and other initiatives. The two sides can exchange information and collaborate on the supervision of FinTech companies in their respective jurisdictions. Both the CBB and ADGM belong to the recently established Global Financial Innovation Network made up of 12 regulators around the world.
The CBB and the Monetary Authority of Singapore in November signed a memorandum of understanding to foster innovation in financial services between the two countries. In particular, the MoU seeks to facilitate the exchange of information on developments in FinTech and financial innovation more generally. The collaboration is further expected to contribute to a common framework to help FinTech companies prepare for regulatory requirements in the two countries. Both regulators have dedicated units for the purpose of driving innovation. MAS has operated a Financial Technology & Innovation Group since 2015 with the objective of driving its Smart Financial Center initiative
The EDB in December signed an MoU with the Government of the Indian State of Maharashtra to foster the development of FinTech.
The CBB has continued to drive regulatory initiatives to support the development of the FinTech ecosystem. The Central Bank in November expanded the range of services covered under its crowdfunding regulations. The new regulations implement, among other things, the following changes:
A reduction in minimum capital requirements for crowdfunding platform operators
Q4 saw a number of positive steps to better connect Bahrain with other financial innovation hubs

BAHRAIN ECONOMIC QUARTERLY| DECEMBER 2018
Page 41 of 43 Please refer to the disclaimer at the end of the document.
Removal of the prohibition on business to business lending or investing through platforms
An increase in lending limited
The removal of a range of restrictions on lending
A consumer protection mechanism permitted any lender or investor to withdraw a commitment he or she has made within a 48-hour window
The objective of the revised regulations is to achieve more efficient business models for platform operators and to improve access to capital for smaller businesses.
December saw the release of rules on open banking which are designed to encourage innovation in the provision of banking services. The rules provide for account information services that permit customer access to aggregated bank account information through a single platform. Payment initiation services allowed licensed third parties to initiate payments on behalf of customers and permit seamless transfers between different accounts through a mobile-based application.
The CBB in October granted a representative office license to Bank Intesa Sanpaolo Private Bank (Suisse) SA to operate in Bahrain. A Swiss subsidiary of Italry’s Intesa Sanpaolo SPA which in operation since 2001.
Alba Line 6 launches
Aluminium Bahrain (Alba)’s sixth potline was officially commissioned on 13 December 2018. It will boost Alba’s production capacity by 540,000 metric tonnes to a total of 1.5 mn tn. The project, which has a capex of some USD3bn, will make Alba the world’s largest single-site smelter. The smelter’s overall progress as of the end of 2018 was 80%.
The company achieved a record sales volume of 1,012,548 tn in 2017. This marked at 3.5% increase on 978,195 tn the year before. Production rose to over 1,011,101 tn. Value added sales account for 60% of the total shipments in 2018.
Alba has begun production from its new potline 6 which should be fully operational by the end of June. The project is set to create 500 direct jobs beyond the current total of 3,200. The indirect employment effect could be 3-4 times as large.
In the logistics space, Agility has invested USD10mn to expand its regional hub in Bahrain by 28,500 sq m. The project will boost the company’s local headcount by almost a quarter to 270. The new facility provides ambient, chilled, and frozen storage along with solutions for high-value cargo. It follows the expansion of Agility overland distribution fleet in Bahrain.

BAHRAIN ECONOMIC QUARTERLY| DECEMBER 2018
Page 42 of 43 Please refer to the disclaimer at the end of the document.
A positive momentum continues in tourism
Recent years have seen inbound tourism numbers into Bahrain post strong growth. The total number of inbound visitors in 2017 reached 12mn, which was up by a quarter on the 9.5mn figure recorded in 2015. The Bahrain Tourism and Exhibitions Authority has set itself the target of achieving a total of 14.6mn inbound tourists by 2022. Most tourist visitors coming to Bahrain continue to arrive from Saudi Arabia and the other GCC countries.
The number of tourist nights spent in Bahrain rose to 13mn in 2017, up 44% on 9mn in 2015. The target for 2022 is 15.9mn. The average length of stay per tourist has increased by 26% from 2.26 nights in 2015 to 2.85 last year.
The daily average spending by inbound visitors reached of BHD80 last year, up 10% from BHD72.4 in 2015. The 2022 target is BHD97.9.
Tourism contributed an estimated 4.6% of Bahrain’s GDP in 2015 and the authority is hoping to boost this to 8.3% by 2022.
Bahrain is continuing to invest heavily in tourism-related infrastructure. The country had a total of 21,465 hotel rooms as of the end of 2017. 22 hotels are currently under construction and expected to be ready in three to four years.
Bahrain’s tourism strategy focuses on the themes of innovation, digital transformation, entrepreneurship, education and employment, as well as social, cultural and environmental sustainability.
Bahrain saw a 25% increase in tourist visitors in 2015-2017

BAHRAIN ECONOMIC QUARTERLY| DECEMBER 2018
Page 43 of 43 Please refer to the disclaimer at the end of the document.
DISCLAIMER
Copyright © 2019 by the Bahrain Economic Development Board.
All rights reserved. No part of this publication may be reproduced, stored in a retrieval system, or transmitted, in any form or by any means, electronic, mechanical, photocopying, or otherwise without the prior permission of the Bahrain Economic Development Board.
CONTACT
Bahrain Economic Development Board 3rd floor ARCAPITA Building Bahrain Bay P.O. Box 11299 Manama Bahrain T: +973 17589962 Email: [email protected]