bank watch - mercer capital
TRANSCRIPT

Bank Watch
March 2016
www.mercercapital.com
Activist Investors, Optionality and Comerica 1
Preferences and FinTech Valuations 4
Public Market Indicators 6
M&A Market Indicators 7
Regional Public
Bank Peer Reports 8
About Mercer Capital 9
© 2016 Mercer Capital // www.mercercapital.com 1
Bank Watch
March 2016
Activist Investors, Optionality and Comerica
Jeff K. Davis, CFA, Managing Director of Mercer Capital’s Financial Institutions Group, is a regular editorial contributor to SNL Financial. This contribution was originally published February 16, 2016, at SNL Financial. It is reprinted here with permission.
Dallas-based Comerica Inc. is having a rough go of it in 2016. Oil cannot find a bottom, and the Street’s pipe dream for Fed rate hikes that would push the bank’s NIM higher has been replaced with a term that entered the mainstream media’s lexicon last week: NIRP, or negative interest rate policies. Neither is good news for Comerica or U.S. banks, though low gas prices should support consumer credit portfolios even if consumers bank the savings rather than spend it. I do not know where to start with NIRP. It is a fraudulent proposition to me — something one could expect from European socialists, but not here.
In the whatever category, S&P downgraded the company’s long-term issuer rating to BBB+ on February 9th due to its energy-sector exposure. The headline may not sound great, but the parent company retained an investment grade rating.
The backdrop occurs as Comerica and CIT Group Inc. have become the target of Hudson Executive Capital LP, a relatively new hedge fund with an impressive roster of executive advisers. CEO partners from the financial services industry include Bill Harrison (JPMorgan Chase & Co.) Richard Kovacevich (Wells Fargo & Co.) and Howard Milstein (New York Private Bank & Trust). These are not hacks; they are highly accomplished bankers and investors. Hudson’s mission statement discusses value creation through constructive engagement with a target rather than a public contest and proxy battle.
Comerica is among the larger banks to come under fire to sell of late, joining Ally Financial Inc., CIT and two that pulled the trigger: Astoria Financial Corp. and First Niagara Financial

© 2016 Mercer Capital // www.mercercapital.com 2
Mercer Capital’s Bank Watch March 2016
value if sold, and the like. I am not a corporate securities attorney. My take on board governance is that boards are not required to make decisions for a short-term gain (e.g., sell) if there is a reasonable plan to create long-term value. The “business judgment rule” has served corporate America, its shareholders, and U.S. capitalism well by giving boards the benefit of the doubt as long as directors make informed decisions in good faith that are believed to be in shareholders’ best interest.
Comerica is not an illogical choice for Hudson to target based on ROE and ROTE; however, the gap with peers is not that wide given the rate environment and Comerica’s business bank model that focuses on C&I lending with a high level of non-interest bearing deposit funding. ROE for the YTD period through September 30 was in the 34th percentile (i.e., 66% were above) according to the regulators’ bank holding company performance report; it was 48% in 2014.
Middling ROE notwithstanding, I think management has done a good job over the years by avoiding the trap door that is the key arbiter in bank performance over long periods of time: credit. Maybe the highly cyclical nature of the southeast Michigan economy taught management how to navigate lending cycles a little bit better. Or, maybe it instilled more conservatism in management.
Unlike some peers, Comerica was not forced to raise a massive amount of common equity in the aftermath of the financial crisis. Its sole raise was a 25 million share offering in March 2010 on what was then about 150 million shares outstanding. In a testament to how far bank stocks have fallen the past few months, that offering six years ago priced above the current price at $35.00 per share. At the time, investors were banking on an improvement in credit (correct) and Fed rate hikes that would push the NIM and EPS higher (wrong then, too).
Also, I think management has done a good job in managing the cost structure. The efficiency ratio in 2015 was 67%, which is roughly unchanged over the past few years. That is not a great number and may speak to Hudson’s views about the cost structure and ROE; however, it is not bad considering that the NIM was 2.60% in 2015 compared to 3.19% in 2011. That is a lot of foregone net interest income and ROE.
Group Inc. Depending upon when the position was established, Hudson may have lost part of its shirt. Comerica’s shares are down 21% year-to-date (and 29% over the past year), as of February 12th.
According to media reports, Hudson views Comerica as being too small to incur the cost of being a SIFI. Other reports spoke to the cheapness of the shares, which were trading for about 11x 2016 consensus EPS and 84% of tangible book value, as of February 12th. The P/E multiple is higher than peers such as Huntington Bancshares Inc., Regions Financial Corp., and Fifth Third Bancorp, although the P/TB multiple for most peers is higher. The difference in book multiples reflects a somewhat lower ROE and ROTE. Comerica posted ROE and ROTE of 7.1% and 7.7% in 2015, down from 8.0% and 8.7% in 2014.
Hudson’s approach may be softer than Lion Point Capital LP’s cage rattling of Ally, but it is useful. There is nothing wrong with shareholders who make boards take an intense look at strategy, historical performance, prospective performance, realizable
What We’re Reading
Bloomberg BNA had a piece entitled “Community Banks Continue to Stabilize in
2015.”
http://mer.cr/1Ldku3f
Bank Director’s President, Al Dominick, has “Three Questions to Ask About Your Bank’s
DNA.”
http://mer.cr/1TMqRgY
American Banker had an interesting piece entitled “Try to Be Customers’ Favorite
Bank, Not Their Only One.”
http://mer.cr/1pgREFm

© 2016 Mercer Capital // www.mercercapital.com 3
Mercer Capital’s Bank Watch March 2016
Comerica is not an island. It has to operate in the same rate and competitive environments as its peers. Unlike some peers, the company does not have a big consumer lending franchise, processing business, and asset management unit to counter the impact that ZIRP has on the NIM. ZIRP is brutal for banks. It is especially brutal when one of the key tenants of a business model is LIBOR-based commercial lending that relies on a high level of non-interest bearing deposit funding. Competition has compressed the margin at which businesses can borrow over LIBOR, while non-interest bearing deposits add little to the NIM compared to when short rates are “normal.” Comerica’s loan yields are low; there is no easy or obvious offset to change that.
I have no idea what the board’s thoughts are about staying the course versus selling (or buying). The company would appeal to a number of banks, I think. Its geography that encompasses Michigan, Texas and California with smaller outposts in Arizona and Florida is attractive. The eventual retirement of long-time CEO Ralph Babb, age 66, may cause the board to re-evaluate the path regardless of Hudson’s engagement. If I were on the board I would want to see how the energy book performed this year. The shares have a high degree of optionality in terms of oil prices moving higher and the dying dream of the Fed being able to “normalize” short rates. On the other hand, NIRP would be an unmitigated disaster for Comerica and its competitors. Hudson’s engagement has occurred at an interesting time when the optionality of “where from here” is very high.
Jeff K. Davis, CFA [email protected]
615.345.0350
MERCER CAPITAL Stress Testing Webinar March 1, 2016
View the Replay
Complimentary Webinar Recording
Community Bank Stress Testing:What You Need to Know
If you were unable to join Jay D. Wilson, CFA, ASA,
CBA, for the webinar “Community Bank Stress Testing:
What You Need to Know,” a recording is available.
While there is no requirement for community banks
to perform stress tests, recent regulatory commentary
suggests that community banks should be developing
and implementing some form of stress testing on at
least an annual basis.
The benefits of stress testing include enhancing strategic decisions; improving risk
management and capital planning; and enhancing the value of the bank. However,
community bank stress testing can be a complex exercise for a bank to undertake by
itself. There are a variety of potential stress testing methods and economic scenarios
for the bank to consider when setting up their test. In addition, the qualitative, written
support for the test and its results is often as important as the quantitative results
themselves. Therefore, it is important that banks begin building their stress testing
expertise sooner rather than later.
Whether you are considering performing the test in-house or with outside assistance,
this webinar will be of interest to you. This complimentary 60-minute webinar will:
» Cover the basics of community bank stress testing
» Review the economic scenarios published by the Federal Reserve
» Provide detail on the key steps to developing a sound community bank
stress test
» Discuss how to analyze and act upon the outputs of your stress tests

© 2016 Mercer Capital // www.mercercapital.com 4
Mercer Capital’s Bank Watch March 2016
Preferences and FinTech Valuations
Originally published in the Fourth Quarter 2015 issue of Mercer Capital’s Value Focus: FinTech industry newsletter. Subscribe at mer.cr/fintech-nl.
2015 was a strong year for FinTech. For those still skeptical, consider the following:
• All three publicly traded FinTech niches that we track (Payments, Solutions, and
Technology) beat the broader market, rising 11 to 14% compared to a 1% return
for the S&P 500;
• FinTech M&A volume and pricing rose sharply over recent historical periods with
195 announced deals and a median deal value of $74 million in 2015 (Figure 1);
• A number of notable fundings for private FinTech companies occurred with
roughly $9.0 billion raised among approximately 130 U.S. FinTech companies in
larger funding rounds (only includes raises over $10 million).
One of the more notable FinTech events in 2015 was Square’s IPO, which occurred in
the fourth quarter. Square is a financial services and mobile payments company that
is one of the more prominent FinTech companies with its high profile founder (Jack
Dorsey, the Twitter co-founder and CEO) and early investors (Kleiner Perkins and
Sequoia Capital). Its technology is recognizable with most of us having swiped a card
through one of their readers attached to a phone after getting a haircut, sandwich, or
cup of coffee. Not surprisingly, Square was among the first FinTech Unicorns, reaching
that mark in June 2011. Its valuation based on private funding rounds sat at the top of
U.S.-based FinTech companies in mid-2015.
So all eyes in the FinTech community were on Square as it went public in late 2015.
Market conditions were challenging then (compared to even more challenging in early
2016 for an IPO), but Square had a well-deserved A-list designation among investors.
Unfortunately, the results were mixed. Although the IPO was successful in that the shares
priced, Square went public at a price of $9 per share, which was below the targeted
range of $11 to $13 per share. Also, the IPO valuation of about $3 billion was sharply
below the most recent fundraising round that valued the company in excess of $5 billion.
In the category its great pay if you can get it, most Series E investors in the last
funding round had a ratchet provision that provided for a 20% return on their
investment, even if the offering price fell below the $18.56 per share price required
to produce that return. The ratchet locked in through the issuance of additional shares
to the Series E investors. The resulting dilution was borne by other investors not
protected by the ratchet.
On the flip side the IPO was not so bad for new investors. Square shares rose more
than 45% over the course of the opening day of trading and then traded in the vicinity
of $12 to $13 per share through year-end. With the decline in equity markets in early
2016, the shares traded near the $9 IPO price in mid-February.
$0.0 !
$20.0 !
$40.0 !
$60.0 !
$80.0 !
$100.0 !
0!
50!
100!
150!
200!
250!
2011! 2012! 2013! 2014! 2015!
Med
ian
Deal
Val
ue ($
M)!
# of
Dea
ls!
Median Deal Value ($M)! # of Deals!
Figure 1: FinTech M&A Overview2011 – 2015
Source: SNL Financial
© 2016 Mercer Capital // www.mercercapital.com 5
Mercer Capital’s Bank Watch March 2016
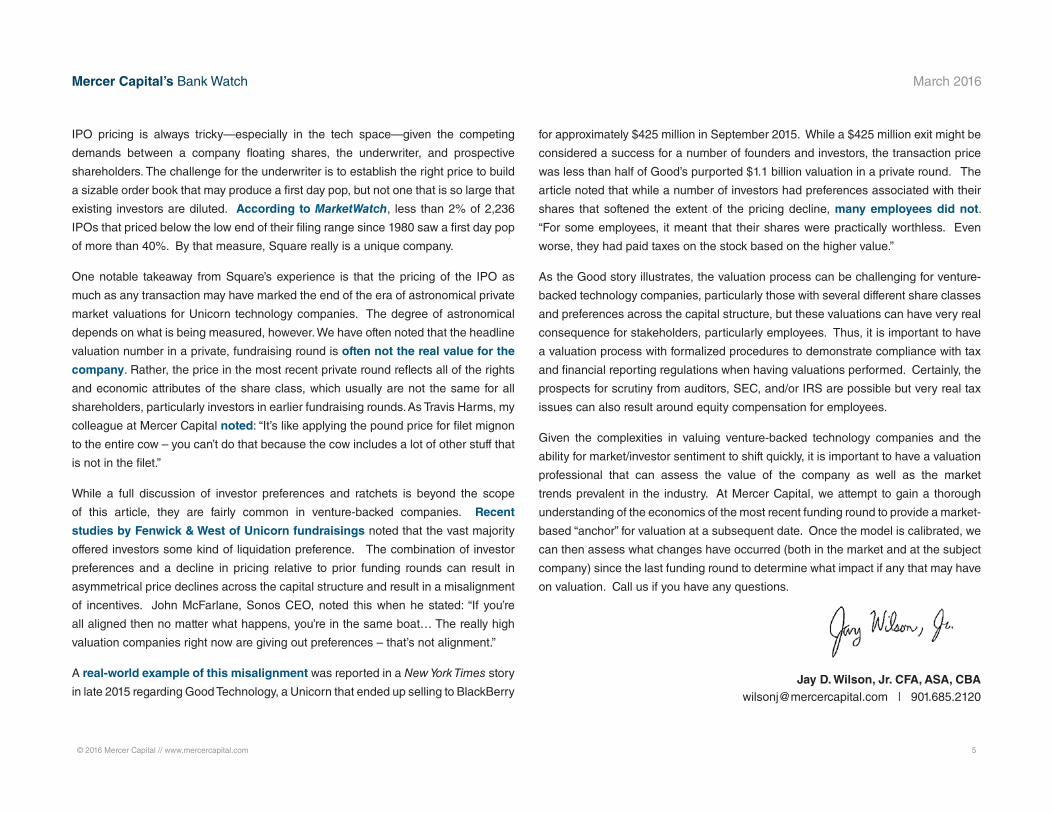
IPO pricing is always tricky—especially in the tech space—given the competing
demands between a company floating shares, the underwriter, and prospective
shareholders. The challenge for the underwriter is to establish the right price to build
a sizable order book that may produce a first day pop, but not one that is so large that
existing investors are diluted. According to MarketWatch, less than 2% of 2,236
IPOs that priced below the low end of their filing range since 1980 saw a first day pop
of more than 40%. By that measure, Square really is a unique company.
One notable takeaway from Square’s experience is that the pricing of the IPO as
much as any transaction may have marked the end of the era of astronomical private
market valuations for Unicorn technology companies. The degree of astronomical
depends on what is being measured, however. We have often noted that the headline
valuation number in a private, fundraising round is often not the real value for the
company. Rather, the price in the most recent private round reflects all of the rights
and economic attributes of the share class, which usually are not the same for all
shareholders, particularly investors in earlier fundraising rounds. As Travis Harms, my
colleague at Mercer Capital noted: “It’s like applying the pound price for filet mignon
to the entire cow – you can’t do that because the cow includes a lot of other stuff that
is not in the filet.”
While a full discussion of investor preferences and ratchets is beyond the scope
of this article, they are fairly common in venture-backed companies. Recent
studies by Fenwick & West of Unicorn fundraisings noted that the vast majority
offered investors some kind of liquidation preference. The combination of investor
preferences and a decline in pricing relative to prior funding rounds can result in
asymmetrical price declines across the capital structure and result in a misalignment
of incentives. John McFarlane, Sonos CEO, noted this when he stated: “If you’re
all aligned then no matter what happens, you’re in the same boat… The really high
valuation companies right now are giving out preferences – that’s not alignment.”
A real-world example of this misalignment was reported in a New York Times story
in late 2015 regarding Good Technology, a Unicorn that ended up selling to BlackBerry
for approximately $425 million in September 2015. While a $425 million exit might be
considered a success for a number of founders and investors, the transaction price
was less than half of Good’s purported $1.1 billion valuation in a private round. The
article noted that while a number of investors had preferences associated with their
shares that softened the extent of the pricing decline, many employees did not.
“For some employees, it meant that their shares were practically worthless. Even
worse, they had paid taxes on the stock based on the higher value.”
As the Good story illustrates, the valuation process can be challenging for venture-
backed technology companies, particularly those with several different share classes
and preferences across the capital structure, but these valuations can have very real
consequence for stakeholders, particularly employees. Thus, it is important to have
a valuation process with formalized procedures to demonstrate compliance with tax
and financial reporting regulations when having valuations performed. Certainly, the
prospects for scrutiny from auditors, SEC, and/or IRS are possible but very real tax
issues can also result around equity compensation for employees.
Given the complexities in valuing venture-backed technology companies and the
ability for market/investor sentiment to shift quickly, it is important to have a valuation
professional that can assess the value of the company as well as the market
trends prevalent in the industry. At Mercer Capital, we attempt to gain a thorough
understanding of the economics of the most recent funding round to provide a market-
based “anchor” for valuation at a subsequent date. Once the model is calibrated, we
can then assess what changes have occurred (both in the market and at the subject
company) since the last funding round to determine what impact if any that may have
on valuation. Call us if you have any questions.
Jay D. Wilson, Jr. CFA, ASA, CBA [email protected] | 901.685.2120
© 2016 Mercer Capital // Data provided by SNL Financial 6
80 !
90 !
100 !
110 !
120 !
130 !
140 !
150 !
8/31/2
012!
9/30/2
012!
10/31
/2012!
11/30
/2012!
12/31
/2012!
1/31/2
013!
2/28/2
013!
3/31/2
013!
4/30/2
013!
5/31/2
013!
6/30/2
013!
7/31/2
013!
Augu
st 3
1, 2
012
= 10
0!
MCM Index - Community Banks! SNL Bank! S&P 500!
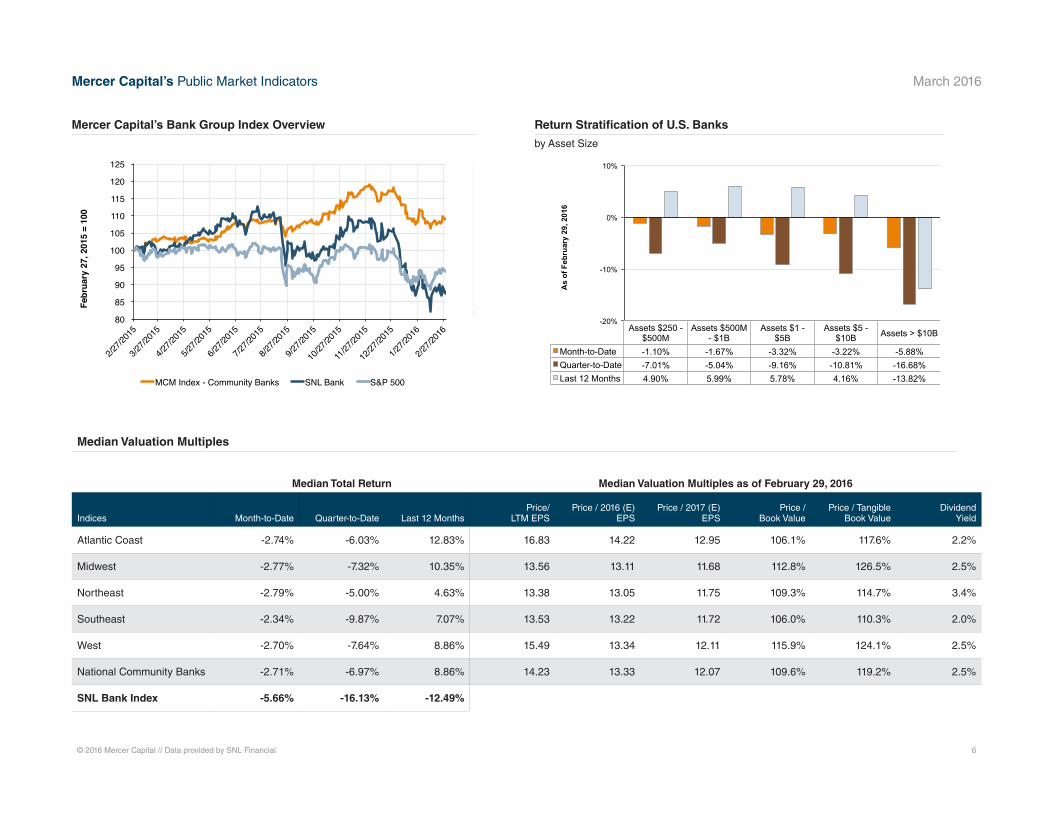
Median Valuation Multiples
Mercer Capital’s Bank Group Index Overview Return Stratification of U.S. Banks
by Asset Size
Assets $250 - $500
MM
Assets $500 MM -
$1 BN
Assets $1 - $5 BN
Assets $5 - $10 BN
Assets > $10 BN
Month-to-Date -1.02% -0.92% -5.00% -4.54% -5.67% Year-to-Date 24.98% 22.75% 21.26% 26.38% 21.49% Last 12 Months 32.00% 23.72% 26.18% 27.55% 36.68%
-10%
0%
10%
20%
30%
40%
As o
f Aug
ust 3
0, 2
013
Median Total Return Median Valuation Multiples as of February 29, 2016
Indices Month-to-Date Quarter-to-Date Last 12 MonthsPrice/
LTM EPSPrice / 2016 (E)
EPSPrice / 2017 (E)
EPSPrice /
Book ValuePrice / Tangible
Book ValueDividend
Yield
Atlantic Coast -2.74% -6.03% 12.83% 16.83 14.22 12.95 106.1% 117.6% 2.2%
Midwest -2.77% -7.32% 10.35% 13.56 13.11 11.68 112.8% 126.5% 2.5%
Northeast -2.79% -5.00% 4.63% 13.38 13.05 11.75 109.3% 114.7% 3.4%
Southeast -2.34% -9.87% 7.07% 13.53 13.22 11.72 106.0% 110.3% 2.0%
West -2.70% -7.64% 8.86% 15.49 13.34 12.11 115.9% 124.1% 2.5%
National Community Banks -2.71% -6.97% 8.86% 14.23 13.33 12.07 109.6% 119.2% 2.5%
SNL Bank Index -5.66% -16.13% -12.49%
Assets $250 - $500M
Assets $500M - $1B
Assets $1 - $5B
Assets $5 - $10B Assets > $10B
Month-to-Date -1.10% -1.67% -3.32% -3.22% -5.88% Quarter-to-Date -7.01% -5.04% -9.16% -10.81% -16.68% Last 12 Months 4.90% 5.99% 5.78% 4.16% -13.82%
-20%
-10%
0%
10%
As
of F
ebru
ary
29, 2
016
80 !
85 !
90 !
95 !
100 !
105 !
110 !
115 !
120 !
125 !
2/27/2
015!
3/27/2
015!
4/27/2
015!
5/27/2
015!
6/27/2
015!
7/27/2
015!
8/27/2
015!
9/27/2
015!
10/27
/2015!
11/27
/2015!
12/27
/2015!
1/27/2
016!
2/27/2
016!
Febr
uary
27,
201
5 =
100!
MCM Index - Community Banks! SNL Bank! S&P 500!
Mercer Capital’s Public Market Indicators March 2016

© 2016 Mercer Capital // Data provided by SNL Financial 7
2004 2005 2006 2007 2008 2009 2010 2011 2012 2013 2014 2015 LTM U.S. 18.3% 19.9% 19.9% 18.7% 12.0% 6.9% 6.3% 5.4% 4.3% 5.5% 7.5% 7.5% 7.4%
0%
5%
10%
15%
20%
25%
Cor
e D
epos
it P
rem
ium
s
2004 2005 2006 2007 2008 2009 2010 2011 2012 2013 2014 2015 LTM U.S. 246% 243% 243% 228% 196% 145% 141% 132% 130% 134% 155% 148% 148%
0%
50%
100%
150%
200%
250%
300%
350%
Pric
e / T
angi
ble
Boo
k Va
lue
2004 2005 2006 2007 2008 2009 2010 2011 2012 2013 2014 2015 LTM U.S. 22.3 22.0 22.0 22.1 19.9 19.3 21.7 21.9 17.0 16.5 17.5 18.8 18.2
0
5
10
15
20
25
30
Pric
e / L
ast 1
2 M
onth
s E
arni
ngs
Regions
Price / LTM
Earnings
Price / Tang.
BV
Price / Core Dep Premium
No. of
Deals
Median Deal
Value
Target’s Median Assets
Target’s Median
LTM ROAE (%)
Atlantic Coast 22.16 1.51 8.4% 23 95.48 505,647 7.44%
Midwest 17.95 1.50 6.9% 70 21.48 130,323 8.95%
Northeast 22.44 1.30 5.2% 8 41.94 374,607 6.63%
Southeast 16.27 1.43 8.9% 25 36.70 239,214 9.06%
West 17.45 1.44 6.9% 14 48.75 229,029 10.52%
National Community Banks
18.22 1.48 7.4% 140 41.02 196,439 8.63%
Source: Per SNL Financial
Median Valuation Multiples for M&A Deals
Target Banks’ Assets <$5B and LTM ROE >5%, 12 months ended February 2016
Median Core Deposit Multiples
Target Banks’ Assets <$5B and LTM ROE >5%
Median Price/Tangible Book Value Multiples
Target Banks’ Assets <$5B and LTM ROE >5%
Median Price/Earnings Multiples
Target Banks’ Assets <$5B and LTM ROE >5%
Mercer Capital’s M&A Market Indicators March 2016

Updated weekly, Mercer Capital’s Regional Public Bank Peer Reports offer a closer look at the market pricing and performance of publicly traded banks in the states of five U.S. regions. Click on the map to view the reports from the representative region.
© 2016 Mercer Capital // Data provided by SNL Financial 8
Atlantic Coast Midwest Northeast
Southeast West
Mercer Capital’s Regional Public Bank Peer Reports
Mercer Capital’s Bank Watch March 2016
Mercer Capital assists banks, thrifts, and credit unions with significant corporate valuation requirements, transactional advisory services, and other strategic decisions.
Mercer Capital pairs analytical rigor with industry knowledge to deliver unique insight into issues facing banks. These insights
underpin the valuation analyses that are at the heart of Mercer Capital’s services to depository institutions.
» Bank valuation
» Financial reporting for banks
» Goodwill impairment
» Litigation support
» Stress Testing
Mercer Capital is a thought-leader among valuation firms in the banking industry. In addition to scores of articles and books, The
ESOP Handbook for Banks, Acquiring a Failed Bank, The Bank Director’s Valuation Handbook, and Valuing Financial Institutions,
Mercer Capital professionals speak at industry and educational conferences.
For more information about Mercer Capital, visit www.mercercapital.com.
Mercer CapitalFinancial Institutions Services
Jeff K. Davis, [email protected]
Andrew K. Gibbs, CFA, CPA/ABV [email protected]
Jay D. Wilson, Jr., CFA, ASA, CBA [email protected]
MERCER CAPITAL
Memphis5100 Poplar Avenue, Suite 2600Memphis, Tennessee 38137901.685.2120
Dallas12201 Merit Drive, Suite 480Dallas, Texas 75251214.468.8400
Nashville102 Woodmont Blvd., Suite 231Nashville, Tennessee 37205615.345.0350
www.mercercapital.com
Contact Us
Copyright © 2016 Mercer Capital Management, Inc. All rights reserved. It is illegal under Federal law to reproduce this publication or any portion of its contents without the publisher’s permission. Media quotations with source attribution are encouraged.
Reporters requesting additional information or editorial comment should contact Barbara Walters Price at 901.685.2120. Mercer Capital’s Bank Watch is published monthly and does not constitute legal or financial consulting advice. It is offered as an
information service to our clients and friends. Those interested in specific guidance for legal or accounting matters should seek competent professional advice. Inquiries to discuss specific valuation matters are welcomed. To add your name to our mailing list
to receive this complimentary publication, visit our web site at www.mercercapital.com.
» Loan portfolio valuation
» Tax compliance
» Transaction advisory
» Strategic planning