baseline study for rural and remote - unicef.org · 3 iii the authors wish to acknowledge the...
TRANSCRIPT

3

3
Baseline Study for Rural and Remote
Education Initiative for Papuan
Provinces
Report of Findings
Prepared for
Dr. Monika Nielsen
Education Specialist
The United Nations Children‘s Fund (UNICEF) / Papua
Kantor Dinas Otonom PEMDA Tingkat 1, Kotaraja
Jayapura, Papua
Prepared by
Myriad Research
The Boulevard Office Tower UG Floor Unit A
Jl. Fachrudin Raya no. 5 Tanah Abang Bukit
Jakarta Pusat 1020

3
iii
The authors wish to acknowledge the important contributions to the numerous people who
made this study possible. Dr. Monika Nielsen, Sri Widuri, Siti Eliza Mufti, Hiro R Sugi, and R.
Justin Sodo of the United Nations Children‘s Fund (UNICEF) / Indonesia provided valuable
guidance and support throughout the preparation and implementation of this study. Dr.
Margareth Dubeck, Katherine Batchelder, and Chris Cummmiskey of the RTI International
provided scientific guidance on the EGRA and SSME instrument and data analysis. The
Ministry of Education and Culture (MOEC) also made important contributions in developing
and implementing this study and helped to ensure that the instruments were appropriately
aligned to an Indonesian context. In particular, we wish to thank Dr. Asrijanty, Head of the
Analysis and Assessment Information System – Centre of Education Assessment and Dr
Dewi Utama Faizah, Head of the Assessment and Accreditation Directorate of Primary
Education, from MOEC, for their support. The technical experts of this study – Dr. Wayan
Susila, Dr. Yeti Mulyawati, Dr. Agus Suyatna, Neny Isharyanti M.A provided invaluable
support throughout the study. Most importantly, this work could not have succeeded
without the cooperation and contributions of the six area coordinators, 72 assessors and
supervisors, and the students, parents, teachers, head teachers, heads of villages, and
education authority officers at the district and provincial levels included in the study. Finally,
we would like to pay tribute to the contributions of our beloved colleague, Retno Maruti,
who was ill and passed away during the data collection of this study.
ACKNOWLEDGMENTS

3
iv
Page
Acknowledgment iii
List of Figures vi
List of Tables ix
Abbreviations xi
Executive Summary 1
1 Introduction 6
1.1 Background ................................................................................................................... 6
1.2 Objective ..................................................................................................................... 10
1.3 Overview of the Early Grade Reading Assessment ........................................... 11
1.3.1 Why Test Early Grade Reading? ........................................................... 11
1.3.2 What EGRA Measures ............................................................................ 14
1.4 Overview of the Snapshot of School Management Effectiveness ................... 16
2 Methodology 18
2.1 Desk Research .......................................................................................................... 18
2.2 Quantitative Research .............................................................................................. 19
2.3 Sampling ....................................................................................................................... 20
2.4 Qualitative Research................................................................................................. 22
2.5 Research Ethics on Vulnerable Populations and Children ............................... 24
2.6 Recruitment and Training of Assessors .............................................................. 25
2.7 Piloting the Research Instrument .......................................................................... 26
2.8 Data Collection ......................................................................................................... 26
2.8 Final Sample ................................................................................................................ 28
3 Results and Findings : Snapshots of School Management
Effectivenerss 30
3.1 The Students Profiles and Their Voices ............................................................... 30
3.2 The Parent Profiles and Their Voices ................................................................... 36
3.3 The Teacher Profiles and Their Voices ................................................................ 46
3.4 The Head Teachers' Profiles and Their Voices .................................................. 62
3.5 School Infrastructure and Facilities ....................................................................... 72
3.6 Classroom Characteristics ...................................................................................... 77
4 Results and Findings : Early Grade Reading Assessment 81
4.1 Overview of EGRA Performance .......................................................................... 81
TABLE OF CONTENTS

3
v
4.2 EGRA Results vs. Student Profiles ........................................................................ 89
4.3 EGRA Results vs. Parent Profiles ........................................................................... 81
4.4 EGRA Results vs. Teachers' Profiles ..................................................................... 82
4.5 EGRA Results vs School and Classroom‘s Characteristics............................ 101
4.6 The Impact of Students‘ Characteristics on EGRA Results ........................... 105
4.7 The Impact of Parents' and Teachers' Characteristics on EGRA
Results .................................................................................................................... 107
4.8 The Impact of School and Classroom Characteristics on EGRA
Results .................................................................................................................... 108
4.9 The Overall Impact of SSME Dimensions on EGRA Results ......................... 110
5 Qualitative Interview Finding 113
5.1 Students Interview Findings .................................................................................. 113
5.2 Parents' Interview Findings .................................................................................... 122
5.3 School Principal Interview Findings ..................................................................... 133
5.4 Teacher Interview Findings ................................................................................... 145
5.5 Community Leader Interview Findings .............................................................. 157
5.6 MOEC Interview Finding ....................................................................................... 174
5.7 Policy and Structure ............................................................................................... 198
6 Conclusions and Implications 205
References 211

3
vi
Figure 1.1: Percentage and Number of Illiterates in Indonesia ....................................... 7
Figure 1.2: Relationship Pattern between Poverty and Illiteracy Rates ........................ 8
Figure 2.1: Triangulation Research Design ....................................................................... 18
Figure 3.1: Teacher Absenteeism According to the Students ..................................... 33
Figure 3.2: Teacher Reactions According to the Students ........................................... 34
Figure 3.3: Availability of Books at Home ........................................................................ 36
Figure 3.4: Students Who Read Aloud at Home ............................................................ 36
Figure 3.5: Parents‘ Language .............................................................................................. 37
Figure 3.6: Parents‘ Education Level .................................................................................. 37
Figure 3.7: Household Monthly Income ............................................................................ 38
Figure 3.8: Economic Level vs. Daily Needs .................................................................... 39
Figure 3.9: Discussing What Happened in School with Children ............................... 40
Figure 3.10: Rewards towards the Children ...................................................................... 40
Figure 3.11: Punishment towards the Children ................................................................. 41
Figure 3.12: Children Studying at Home ............................................................................. 42
Figure 3.13: Parents' Literacy ................................................................................................ 42
Figure 3.14: Teachers' Absenteeism and Tardiness According to Parents ................. 44
Figure 3.15: Availability of Books at Home ........................................................................ 45
Figure 3.16: Parental Involvement in School ...................................................................... 45
Figure 3.17: Gender and Age of Teachers .......................................................................... 46
Figure 3.18: Teachers‘ Experience ....................................................................................... 47
Figure 3.19: Teachers‘ Native Language .............................................................................. 48
Figure 3.20: Teachers‘ Education Background ................................................................... 49
Figure 3.21: Pre-Service Training .......................................................................................... 49
Figure 3.22: Training to Support the Teachers‘ Roles ..................................................... 50
Figure 3.23: Training on How to Teach Reading .............................................................. 51
Figure 3.24: Teacher Certification ........................................................................................ 51
Figure 3.25: Teachers' Employment Status ......................................................................... 52
Figure 3.26: Multi-Grade Teachers ...................................................................................... 52
Figure 3.27: The Usage of Lesson Plans .............................................................................. 53
Figure 3.28: The Development of Lesson Plans ................................................................ 53
Figure 3.29: Student Attendance List ................................................................................... 54
Figure 3.30: Time Spent for Reading in Class .................................................................... 55
Figure 3.31: Reading Materials ............................................................................................... 55
Figure 3.32: Other Reading Book Materials ....................................................................... 56
Figure 3.33: Measurement of Students‘ Academic Progress .......................................... 57
LIST OF FIGURES

3
vii
Figure 3.34: The Usage of Oral and Written Assessments ............................................ 58
Figure 3.35: Unusual Behavior of Students and the Causes ........................................... 59
Figure 3.36: Teacher Action towards a Violence Victim Student ................................. 59
Figure 3.37: Parental Support of their Children Based on Teachers‘ Perspectives .. 60
Figure 3.38: Satisfaction towards Parental Support .......................................................... 61
Figure 3.39: Availability of Dinas‘ Support .......................................................................... 62
Figure 3.40: Head Teachers‘ Experience ............................................................................ 62
Figure 3.41: Number of Teachers for Second and Third Grades ................................. 63
Figure 3.42: Head Teacher Responses to Teacher Absenteeism .................................. 64
Figure 3.43: Action Taken for a Classroom without a Teacher .................................... 65
Figure 3.44: Types of Curriculum Implemented ............................................................... 65
Figure 3.45: Textbook Availability ........................................................................................ 66
Figure 3.46: Library Availability ............................................................................................. 67
Figure 3.47: Reading Corner Availability ............................................................................. 67
Figure 3.48: Satisfaction with the Contributions of School Committees .................... 68
Figure 3.49: Number of Visits from School Superintendents......................................... 68
Figure 3.50: Safety as another Problem at School ............................................................ 69
Figure 3.51: Results of the TKD/Calistung Test According to Head Teachers ......... 70
Figure 3.52: The Usage of RKS at Schools ......................................................................... 71
Figure 3.53: The Usage of RAPBS/RKAS at Schools ........................................................ 71
Figure 3.54: Ways to Develop School Capabilities........................................................... 72
Figure 3.55: Major Repairs Needed ..................................................................................... 73
Figure 3.56: School Cleanliness and Tidiness ..................................................................... 73
Figure 3.57: Toilet Availability and Conditions .................................................................. 74
Figure 3.58: Availability of Clean Water ............................................................................. 75
Figure 3.59: Library Availability and Usage ......................................................................... 76
Figure 3.60: Availability of Electricity ................................................................................... 76
Figure 3.61: Rules and Instructional Materials Displayed in Classrooms .................... 77
Figure 3.62: Student Works Displayed in Classrooms .................................................... 78
Figure 3.63: Classroom Seating Arrangements ................................................................. 79
Figure 3.64: Lesson Plan Availability ..................................................................................... 79
Figure 3.65: Availability and Accessibility of Books for Students .................................. 80
Figure 3.66: Availability of a Reading Corner..................................................................... 80
Figure 4.1: Percentage of Correct Listening Comprehension: Means for a
Particular Item, Disaggregated by Grade- in Tanah Papua ....................... 83

3
viii
Figure 4.2: Percentage of Correct Oral Vocabulary Comprehension: Means for
Particular Item, Disaggregated by Grade- West Papua ............................ 84
Figure 4.3: Reading Ability of Early Grade Students in Tanah Papua ......................... 88
Figure 5.1: Model of Factors that Make Students Absent and Tardy from
School ................................................................................................................. 115
Figure 5.2: Model of Teachers‘ Reactions to Students Who Didn‘t Do Their
Homework ........................................................................................................ 118
Figure 5.3: Model of Teacher Appreciation to Their Students ................................. 120
Figure 5.4: Model of Difficulties that Children Encountered at School Based on
Parents' Interview Findings ............................................................................ 123
Figure 5.5: Model of Parental Support to Their Children‘s Education Based on
Parents‘ Interview Findings ............................................................................ 126
Figure 5.6: Model of Parents‘ Perceptions and Interest in Education Based on
Parent Interview Findings .............................................................................. 131
Figure 5.7: Model of Principals‘ Roles.............................................................................. 134
Figure 5.8: Model of Students‘ Constraints from Principals‘ Perspectives .............. 139
Figure 5.9: Model of Students‘ Constraints from Principals‘ Perspectives .............. 141
Figure 5.10: Model of Teachers‘ Roles .............................................................................. 151
Figure 5.11: Model of the Teachers‘ Obstacle Sources in Performing the Roles .... 154
Figure 5.12: Model of Type of Curriculum that Was Implemented ........................... 156
Figure 5.13: Model of Social and Economy Status Based on Community Leader
Interview Findings ............................................................................................ 158
Figure 5.14: Model of the School Conditions in Tanah Papua ..................................... 164
Figure 5.15: Model of Difficulties in Playing the Role of Village Head ........................ 166
Figure 5.16: Model of Educational Aid Programs ............................................................ 171
Figure 5.17: Model of Weaknesses of Basic Education .................................................. 180
Figure 5.18: Model of Roles of the Ministry of Education in Basic Education in
Papua .................................................................................................................. 186
Figure 5.19: Model of Educational Aid Programs ............................................................ 192
Figure 5.20: Factors Impacting the Basic Education Quality in Papuan Provinces ... 204

3
ix
Table 1.1: Oral Reading Fluency Levels (Correct Words per Minute) in EGRA ...... 12
Table 1.2: Oral Reading Fluency Level (Correct Words Per Minute) in
Indonesia EGRA .................................................................................................... 13
Table 1.3: EGRA Instrument Subtask in Baseline Study .................................................. 16
Table 1.4: SSME Components in a Baseline Study ............................................................ 17
Table 2.1: Intervention Schools of the UNICEF Programs vs. Control Schools ....... 21
Table 2.2: Samples Breakdown ............................................................................................. 22
Table 2.3: Number of In-depth Interviews ......................................................................... 23
Table 2.4: Number of Teaching Process Recorded ......................................................... 23
Table 2.5: Piloting the Research Instruments .................................................................... 26
Table 2.6: Final Sample ............................................................................................................ 29
Table 2.7: Final Sample, by School Types ........................................................................... 29
Table 3.1: Student Age Ranges by District ......................................................................... 30
Table 3.2: Pre-School Attendance ........................................................................................ 31
Table 3.3: Afraid of Going to School ................................................................................... 31
Table 3.4: Student Absenteeism and Tardiness ................................................................. 32
Table 3.5: Exercise Book Ownership and Teacher Feedback........................................ 33
Table 3.6: Homework and Family Support......................................................................... 35
Table 3.7: Parental Literacy Rate .......................................................................................... 35
Table 3.8: Reasons for Children's Absenteeism According to Parents ....................... 43
Table 3.9: Reasons for Children's Tardiness According to Parents ............................. 43
Table 3.10: Chair and Table Sufficiency ................................................................................. 78
Table 4.1: EGRA Performance of Students in Tanah Papua ........................................... 81
Table 4.2: EGRA Results by Students‘ Grades .................................................................. 83
Table 4.3: EGRA Results by District .................................................................................... 85
Table 4.4: EGRA Results by Grades & District ................................................................. 86
Table 4.5: Score of Zero for EGRA by Subtask ................................................................ 87
Table 4.6: Score of Zero for EGRA by Subtask and Grade ........................................... 87
Table 4.7: Reading Ability of Early Grade Students by District ..................................... 89
Table 4.8: Correlation Analysis of EGRA Subtasks .......................................................... 90
Table 4.9: Oral Reading Fluency and Reading Comprehension by Demographics ... 91
Table 4.10: Oral Reading Fluency and Reading Comprehension by Book
Ownership .............................................................................................................. 92
Table 4.11: Oral Reading Fluency and Reading Comprehension by Reading Habit .... 93
Table 4.12: Oral Reading Fluency and Reading Comprehension by Homework ......... 93
Table 4.13: Oral Reading Fluency and Reading Comprehension, by Pre-school
Attendance, Main Language a Home, and Teacher Recognition ................ 94
LIST OF TABLES

3
x
Table 4.14: Oral Reading Fluency and Reading Comprehension by Teachers‘
Reactions to Students‘ Inability to Answer Questions ................................. 95
Table 4.15: Oral Reading Fluency and Reading Comprehension from Parental
Support .................................................................................................................... 96
Table 4.16: Oral Reading Fluency and Reading Comprehension from Student
Absenteeism ........................................................................................................... 96
Table 4.17: Oral Reading Fluency and Reading Comprehension Based on Parents‘
Education Level ..................................................................................................... 97
Table 4.18: Oral Reading Fluency and Reading Comprehension Based on Parents‘
Characteristics ....................................................................................................... 98
Table 4.19: Oral Reading Fluency and Reading Comprehension Based on
Teachers‘ Characteristics .................................................................................... 99
Table 4.20: Oral Reading Fluency and Reading Comprehension Based on
Teachers‘ Language ............................................................................................. 100
Table 4.21: Students‘ Main Language ................................................................................... 100
Table 4.22: Teachers‘ Main Language................................................................................... 101
Table 4.23: Oral Reading Fluency and Reading Comprehension Based on School
Characteristics ..................................................................................................... 101
Table 4.24: Oral Reading Fluency and Reading Comprehension Based on School
Characteristics ..................................................................................................... 102
Table 4.25: Oral Reading Fluency and Reading Comprehension Based on School
Characteristics ..................................................................................................... 103
Table 4.26: Oral Reading Fluency and Reading Comprehension Based on
Classroom Characteristics................................................................................ 104
Table 4.27: Oral Reading Fluency and Reading Comprehension Based on
Classroom Characteristics................................................................................ 104
Table 4.28: Oral Reading Fluency and Reading Comprehension: Impact of
Students‘ Characteristics ................................................................................... 105
Table 4.29: Oral Reading Fluency and Reading Comprehension: Impact of
Parents‘ Characteristics ..................................................................................... 107
Table 4.30: Oral Reading Fluency and Reading Comprehension: Impact of
Teachers‘ Characteristic ................................................................................... 108
Table 4.31: Oral Reading Fluency and Reading Comprehension: Impact of a
School‘s Characteristics .................................................................................... 109
Table 4.32: Oral Reading Fluency and Reading Comprehension: Impact of
Classroom Characteristics................................................................................ 110
Table 4.33: Oral Reading Fluency and Reading Comprehension: Impact of all
SSME Dimensions........................................................................................ 111-112
Table 6.1: Tactical Improvements Needed at Each Stakeholder Level ...................... 210
3
xi
ABK Anak Berkebutuhan Khusus (children with special needs)
APK Angka Partisipasi Kasar (participation rate estimation)
APM Angka Partisipasi Murni (real participation rate)
AUSAID Australian Agency for International Development
BOS Bantuan Operasional Sekolah (budget support for school operation)
BOSDA BOS Daerah (budget support for school operation at district level)
BPMK Badan Pemberdayaan Masyarakat Kampung (Agency for village
community development)
BPS Badan Pusat Statistik (Central Statistics Agency)
Calistung Tes membaca, menulis, berhitung (reading, writing, and arithmetic)
DAK Dana Alokasi Khusus (special budget allocation)
DIKTI Pendidikan Tinggi (Directorate General of Higher Education)
DINAS Dinas Pendidikan tingkat Kabupaten/Propinsi (District/Provincial
Education Office)
DPA Dokumen Pelaksanaan Anggaran (budget planning document)
EdData II Education Data II
EGRA Early Grade Reading Assessment
KAT Komunitas Adat Terpencil (remote community group)
KKG Kelompok Kerja Guru (teachers working group)
KKKS Kelompok Kerja Kepala Sekolah (head teacher working group)
KPG Kursus Pendidikan Guru (teacher training)
KTSP 2006 Kurikulum Tingkat Satuan Pendidikan 2006 (education unit level
curriculum 2006)
MBS Manajemen Berbasis Sekolah (school based management)
MGMP Musyawarah Guru Mata Pelajaran (discussion forum of teachers who
teach similar subject)
MOEC Ministry of Education and Culture
MUSRENBANG Musyawarah Perencanaan Pembangunan (development planning
forum)
NGO Non Government Organisation
NT Nusa Tenggara
ORF Oral Reading Fluency
OTSUS Otonomi Khusus (special autonomy)
PAUD Pendidikan Anak Usia Dini (early childhood education)
PAUDNI Pendidikan Anak Usia Dini, Non Formal, Informal (early childhood
education, non formal and informal education)
ABBREVIATIONS

3
xii
PERDASUS Peraturan Daerah Khusus (regulations for special district)
PGSD Pendidikan Guru Sekolah Dasar (primary school teacher education)
PISA Program for International Student Assessment
PKH Program Keluarga Harapan (Government program for poor family)
PKLK Pembinaan Pendidikan Khusus dan Layanan Khusus (supervision of
special education and services)
PNPM Program Nasional Pemberdayaan Masyarakat (national program of
community development)
PSM Program Serta Masyarakat (community participation program)
PUSKESMAS Pusat Kesehatan Masyarakat (community health centre)
RAPBS Rencana Anggaran Pendapatan Belanja Sekolah (school budget and
spending plan)
RENJA Rencana Kerja (working plan)
RENSTRA Rencana Strategi (strategic plan)
RESPEK Rencana Strategi Pengembangan Kampung (village development
strategy planning)
RKAS Rencana Kegiatan dan Anggaran Sekolah (school activity and budget
plan)
RKB Ruang Kelas Baru (new classroom)
RKS Rencana Kerja Sekolah (school work plan)
RPP Rencana Pelaksanaan Pembelajaran (lesson plan)
RTI RTI International (a trade name of Research Triangle Institute)
SMA Sekolah Menengah Atas (senior high school)
SPG Sekolah Pendidikan Guru (teacher education -senior high school level)
SPGA Sekolah Pendidikan Guru Agama (religious teacher education-senior
high school level)
SSME Snapshot of School Management Effectiveness
STBM Sanitasi Total Berbasis Masyarakat (community based sanitation)
3T Terdepan (forefront), Terluar (outer), Tertinggal (left behind)
TIMSS Trends in International Mathematics and Science Study
TK Taman Kanak Kanak (kindergarten)
TKD Tes Kemampuan Dasar (basic competency test)
TNP2K Tim Nasional Percepatan Penanggulangan Kemiskinan (national team
for the acceleration for povery reduction)
UKS Unit Kesehatan Sekolah (school health unit)
UNESCO the United Nations Educational, Scientific and Cultural Organisation

3
xiii
UNICEF the United Nations Children‘s Fund
UPTD Unit Pelaksana Teknis Dinas Daerah (technical implementor unit at
district level)
USAID the United States Agency for International Development
YKW Yayasan Kristen Wamena (Wamena Christian foundation)
YPK Yayasan Pendidikan Kristen (Christian education foundation)

3
xiv

3
1
Papua and West Papua provinces rank among the lowest in Indonesia across most human
development indices. The two provinces also have higher poverty rates than the national
average. In terms of illiteracy rate, Papua and West Papua are among provinces with the
highest rates. As a result, Papua and West Papua are both provinces with a high amount of
illiteracy and poverty (UNESCO and MOEC, 2012). UNICEF et al. (2012) revealed significant
disparities in literacy rates between urban and rural Papuans, with higher illiteracy in rural
areas (49%) compared to urban areas (5%). Disparities are most pronounced in the highland
districts where rates of illiteracy range from 48% to 92%. The data shows the inequality of
students‘ access to quality education services in rural and remote areas of the two
provinces.
UNICEF Indonesia, funded by AUSAID, successfully implemented Phase 1 of the Papua and
West Papua Education Programme during 2010-2013. Following the first phase, the second
phase of the program has been started to support the district and provincial governments
and key education foundations to facilitate improved educational opportunities for children
living in rural and remote areas of Papua and West Papua. To provide relevant information
on early grade reading and school management, a baseline study of Early Grade Reading
Assessment (EGRA) and Snapshot of School Management Effectiveness (SSME) was
conducted in March-April 2015. The EGRA measured the basic skills that a student must
possess to eventually be able to read fluently and comprehend; and the SSME survey
captured the ―best‖ ways in which effective schools influence student learning.
Myriad administered the two surveys to 180 schools, equally allocated across the six
districts, namely: Biak, Jayapura, Mimika, Jayawijaya, Sorong, and Manokwari. The surveys
involved 2,934 grade 2 and 3 students, 2,645 parents, 330 teachers, and 178 head teachers.
In addition, 162 in-depth interviews with students and their parents, teachers, head
teachers, community leaders, as well as district and provincial education officers were also
conducted. An equal number of in-depth interviews across districts were carried out.
Overall, this baseline study revealed that the majority of early grade students in rural and
remote areas of Papuan provinces were readers with limited comprehension (38.55%) or
non-readers (48.47%). Only less than 15% of them were categorized as readers: reading
with limited comprehension (5.35%) or reading fluently with comprehension (7.63%). This
EXECUTIVE SUMMARY
3
2
reading ability was far below the average range for students in Indonesia, and similarly, far
below other students in Maluku, Nusa Tenggara, and Papua region (from an EGRA National
Survey conducted by RTI International and USAID/Indonesia in 2014). Furthermore, the
students‘ reading ability was inconsistent across the surveyed districts. Jayapura students
significantly outperformed their counterparts from the other five districts; while on the
other hand, Jayawijaya students obtained the lowest performance. This baseline study
revealed all the components that are related to the stakeholders of basic education in
Papuan provinces, including students and their families, teachers, head teachers and schools,
the communities, and local education authorities, which contributed to the low level of
reading ability.
Students faced several challenges to achieve better reading performance. The challenges
included economic, geographic, and socio-cultural disadvantages. Students obtained limited
support from their families, such as the unavailability of parental support when they were
studying at home, the necessity to help their parents earn a living, the unavailability of any
books at home other than the limited textbooks provided by their schools, and in a few
cases incidents of domestic physical abuse. As a result, there was a very limited learning and
reading environment at home. The condition was even worsened by the geographical and
social disadvantages. This study found that, apart from being sick, the main reason for
students‘ absence was due to geographical and social disadvantages such as: the unavailability
of transportation, the occurrences of bad weather, and the danger of traveling to school due
to local conflicts. This absenteeism had a significant negative impact on the students‘ reading
performance.
Parents were only involved in and informed about their children's academic progress on a
limited basis. Also, they were never informed about the school plans or programs. Parents
were dissatisfied about teachers‘ absences and their limited involvement, but on the other
hand, the teachers were also unhappy about parental support. As a result, limited
communication and collaboration between parents and teachers/schools occurred.
The teacher factor also contributed to students‘ disadvantages. There was a lack of teachers
for early grade classrooms, so that teachers were forced to teach multiple classrooms.
There were cases of mismatches between teachers‘ academic backgrounds and their

3
3
subjects. In addition, teachers‘ employment status, in which the majority of teachers were
honorary teachers, also disadvantaged students, not to mention the limited supervision and
control from the head teachers and school superintendents. These all have resulted in
teachers' low motivation and ultimately led to teachers‘ absenteeism and reduced quality of
teaching.
Head teachers had their own contributions to students‘ disadvantages. They had limited
manpower in school; while on the other hand, they were required to handle administrative
tasks from MOEC at the district level. Balancing these two responsibilities made it difficult
for them to manage the schools optimally. In addition, the head teachers were also not fully
supported by the community and the school superintendents.
Schools and classroom facilities also hindered the students‘ potentials to learn and read
more. The majority of schools had very limited facilities, and they were not clean and tidy.
The unavailability of proper toilets, clean water resources, electricity, libraries, and a
sufficient number of books in the libraries and classrooms, and even a sufficient number of
seats and desks in the classrooms, have resulted in the low quality of teaching and learning
processes that could be provided to the students.
This baseline study also revealed the most consistent factors impacting students‘ reading
performance, namely: district differences, students‘ grades, parents‘ education and literacy,
students‘ and parents‘ main language, parents‘ income, teachers‘ academic qualifications,
classroom seating arrangements, book availability and accessibility, students‘ displayed
works, school type - either public or private, school accreditation, as well as the availability
and the usage of library services. However, among these factors, some of them are ―policy
relevant‖ but they can unlikely be changed for individual students, such as district, wealth,
school type and accreditation, and teacher academic qualification. Meanwhile, some others
are ―in-school and student factors‖ and doing something about these factors would have a
meaningful impact on students‘ reading performance. For instance, changing students‘ seating
arrangement from the classical model to the U-shaped or small group arrangement also has
a significant impact. Allocating enough funds to purchase attractive and interesting reading
materials for early grade students, and letting them have access to borrow the books would
also improve their reading performance. In addition, creating a more academic but cheerful

3
4
classroom environment by displaying the students‘ works would also have a significant
impact.
This baseline study also revealed that students' reading habits at home had a significant
impact on their reading performance. Therefore, the teachers might assign the students to
read aloud at home to other family members. Furthermore, the teachers might need to be
encouraged to give written feedback on their students‘ exercise books, as this factor
significantly increased students‘ reading performance. In relation to the exercise book,
teachers and head teachers might need to pay attention to the students who even do not
have the book. In addition, homework frequency might also need to be increased. This study
found that homework had a significant impact on students‘ reading performance, but the
frequency was found to be still insufficient. Moreover, the students need to be appreciated
by both teachers and parents, while at the same time, proper- non physical punishment is
also required. The balance of giving rewards and applying punishment was found to
significantly increase the students‘ reading performance.
This study also revealed that students‘ reading performance was not differentiated by the
teachers‘ training experiences and their academic qualifications. Students whose teachers
were with or without pre-service training had a relatively similar level of reading
performance. Furthermore, students whose teachers said that they had ever attended
training on how to teach reading also had a similar level of reading performance as those
whose teachers never did. Interestingly, this study also found that teachers with Bachelor‘s
Degree qualifications did not necessarily have students with better reading performance
than their fellow teachers who graduated from senior high school.
The last factor of ―in-school and student factors‖ is the school's condition and facilities. As
this study found that this factor had a significant impact on students‘ reading performance,
the education authority at the district level needs to pay close attention to this. From the
desk research and in-depth interviews, it was found that there is a specific budget for school
facility improvements. However, the results from school observations told a different story.
This baseline study also recognized the other factors which significantly contributed to the
low level of students‘ reading performance. The synergy among key stakeholders: head

3
5
teachers, school superintendents, community leaders, and MOEC officers at the district and
provincial levels was not optimally achieved. A lack of control and supervision over the head
teachers from the school superintendents and MOEC officers lowered the head teachers‘
school management quality. It was not uncommon to find schools without the presence of
head teachers during the data collection. Meanwhile, the lack of school superintendents to
cover the large and remote geographical areas of Papua also contributes to the insufficient
control and supervision. At the end side of the control is MOEC at the district and
provincial levels. These authorities were not without problems. Classical problems such as a
lack of personal and a lack of manpower with enough and appropriate competences to do
the job were among the reasons frequently stated during the interviews. Consequently,
what was happening in the primary schools located in rural and remote areas of the
provinces was not fully understood by these authorities.
While no single solution is suggested for improving the conditions of basic education in rural
and remote areas of the Papuan provinces, this baseline study identified ―in-school and
student factors‖ that might be more manageable and easier to be improved at the school
level by the head teachers and supported by parents and the community, in order to obtain
significant improvement in the reading ability of the early grade students. Meanwhile, the
―policy-relevant factors‖ which are unlikely to be changed immediately, need to be gradually
improved by provincial and district education authorities. To be able to do this, an adequate
capacity and commitment of the provincial and district education officers for strategic
planning and management of the school system is urgently needed.

3

3
6
This chapter discusses the background and the objectives of the baseline study. It is followed
by an overview of the Early Grade Reading Assessment (EGRA), which consists of
discussions on the reasons to test early grade reading, and what the measures are. Following
the discussions on the EGRA, the Snapshot of School Management Effectiveness (SSME) is
discussed at the end of this chapter.
1.1 Background
Papua and West Papua (known together as Tanah Papua) have a total population of more
than 3.9 million (BPS, 2015). According to Elmslie (2010), in 2010, 47.89% of the population
is indigenous Papuan. Approximately 70% of the population resides in rural and remote
areas characterised by considerable educational inequalities across different socio-economic
groups and between indigenous and non-indigenous populations.
Papua and West Papua provinces rank among the lowest in Indonesia across most human
development indices. In 2013, with a national average human development index of 73.81,
the Papua index was 66.25, while the West Papua index was 70.62. In addition, the two
provinces have a higher poverty rate than the national average. According to BPS (2014),
the national poverty rate average was 11.25%, while Papua was 30.05% and West Papua was
27.13%, with a significant disparity between urban and rural areas.
In terms of illiteracy rate, Papua and West Papua are among provinces with the highest rate.
UNESCO and the Ministry of Education and Culture (MOEC) in 2012 indicated a national
average score of 4.43% or 6,730,682 illiterate people, but there are discrepancies among
provinces. Figure 1.1 indicates the percentage of adult literacy and the number of illiterates
at the provincial level (UNESCO and MOEC, 2012). There are four provinces whose
illiteracy rate is the highest, namely West Nusa Tenggara (16.48%), East Nusa Tenggara
(10.13%), West Sulawesi (10.33%), and Papua (36.31%). In addition, there are seven
provinces with illiteracy rates between 5.0% - 9.9%, namely Gorontalo (5.05%), Bali (6.35%),
Southeast Sulawesi (6.76%), West Papua (7.37%), East Java (7.87%), West Kalimantan
(7.88%), and South Sulawesi (9.57%).
1 INTRODUCTION

3
7
Figure1.1: Percentage and Number of Illiterates in Indonesia
UNESCO and MOEC (2012) also indicated a close connection between illiteracy and
poverty at all levels, as shown in Figure 1.2. The provinces with the lowest level of literacy
are also normally the poorest economically. If a province has a high number of illiterates, the
province‘s poverty rate is also high or vice versa. Papua and West Papua are both located in
Quadrant II, namely provinces with a high amount of illiteracy and poverty.

3
8
Figure 1.2: Relationship Pattern between Poverty and Illiteracy Rates
Recent research conducted by RTI International was funded by USAID- on the National
Early Grade Reading Assessment (EGRA) among second grade students in primary schools
across Indonesia revealed that the eastern part of Indonesia (Maluku, Nusa Tenggara, and
Papua) has the highest percentage of non-readers, namely 22% as compared to the national
average of 5.8%. Java, Bali, and Sumatera regions have the lowest percentage of non-readers.
The non-readers are defined as second grade students who could not read at all.
UNICEF et al. (2012) pointed out the disparities of the illiteracy rate in rural and remote
areas of Papua and West Papua as compared to the urban areas. In Papua Province, about
37% of the population resides in mountainous highland districts, 41% lives in easy-to-access
lowland districts, and 21% resides in lowland difficult-to-access districts. Families and
children living in rural and remote areas experience the highest economic and educational
disparities. Significant disparities exist in literacy rates between urban and rural Papuans,
with higher illiteracy in rural areas (49%) compared to urban areas (5%). Disparities are
most pronounced in the highland districts where rates of illiteracy range from 48% to 92%.
Almost 50% of the population in rural Papua above 5 years of age has never attended
school, compared to 5% in urban areas.

3
9
To reduce the gap, MOEC has prioritized the eastern parts of Indonesia, including Papua
and West Papua, to receive higher budget allocations of Bantuan Operasional Sekolah or
budget support for school operation (hereafter BOS). The aim is to enhance basic and
middle education quality in the provinces. At the higher education level, MOEC has a
specific program for provinces that is classified as 3T (Terdepan= forefront; Terluar = outer;
Tertinggal = left behind), including Papua and Papua Barat. The scope of the program covers
teachers' training in the 3T areas of Papua and Papua Barat (Directorate General of Higher
Education-DIKTI, MOEC, 2014).
Although MOEC has several programs targeted to the 3T provinces, the results of the study
conducted by RTI International revealed a significant gap in terms of teacher qualifications
across regions. Almost 80% of teachers in Java-Bali had a Bachelor‘s Degree, while only 47%
in Maluku, Nusa Tenggara, and Papua regions had such a qualification. Students of teachers
with a secondary level diploma (senior high school level) were more likely to have lower
oral reading fluency scores than those whose teachers had Bachelor‘s Degrees.
Unfortunately, teachers with secondary level diplomas were more common in the remote
and rural areas of Papua and West Papua. Less than 20% of the teachers have formal
teaching qualifications.
On the other hand, the data from MOEC shows relatively different figures. In Papua and
Papua Barat, according to MOEC (2014), the percentages of teachers who hold Bachelor‘s
Degrees are 74.10% and 80.75%, respectively. In terms of the number of primary school
teachers, in 2013/2014, there were 13,016 primary school teachers in Papua, and 7,062
teachers in Papua Barat. These teachers in Papua handled 223,683 students, while the
teachers in Papua Barat handled 110,045 students. Therefore, based on these figures, the
ratio of teacher vs. student in Papua and Papua Barat is 1:17 and 1:15, respectively.
Compared to the national figures, in which the total number of primary school teachers in
2013/2014 was 1,900,831 versus the number of students at 25,796,669, it resulted in a ratio
of 1:14. Given these numbers, it seems that statistically there are no problems in terms of
teacher qualifications and teacher quantity in these two provinces. However, the results of
this baseline study tell us a relatively different story, especially when the context of this
study is about basic education in the rural and remote areas of the Papuan provinces.

3
10
The results from an SSME survey conducted by RTI International and USAID/Indonesia in
2014 also revealed that student absenteeism and tardiness in the Maluku-Nusa Tenggara-
Papua region was twice higher than other regions. In terms of the length of the school day,
around 30% of the schools in Maluku-NT-Papua had less than 5 hours, while the national
average is around 20%. The SSME survey also reported that around 87% of principals in the
Maluku-NT-Papua region observed the classroom every 2-3 months up to once a year as
compared to the national average of 60%. These findings might be among various
explanations why the performance of early grade students in eastern parts of Indonesia is
lower than others.
The above data shows the inequality of students‘ access to quality education services in the
eastern parts of Indonesia compared to those in the western parts. These issues are
considered as important by UNICEF Indonesia. In 2010-2013, UNICEF successfully
implemented Phase 1 of the Papua and West Papua Education Programme, funded by
AusAID. Following the first phase, the second phase of the program has been started to
support the district and provincial governments and key education foundations (yayasan) to
facilitate improved educational opportunities for children living in rural and remote areas of
Papua and West Papua to overcome the educational challenges (inequalities) in accessing
and completing quality basic education. To provide actual and current information on early
grade reading and school management, a baseline study should be conducted so that Phase 2
of the program can be better implemented.
1.2 Objectives
The main objectives of the research are as follows:
a. To establish baseline data and information for interventions in 6 districts
of Papua and West Papua. The data and information covers several key
indicators as outlined in the monitoring and evaluation framework of the program.
The same indicators will be reassessed in the post-intervention study to be
conducted at programme completion in 2016.
b. To provide robust data and to address information gaps. The study will be
carried out at sub-district, district, and provincial levels with key informants and

3
11
respondents that include children, households/parents, communities, community
leaders, religious figures, as well as education authorities.
c. To collect and analyze data. It will cover learning outcomes among students in
early grades, the quality of education, school management, parents‘ attitudes toward
education, and information provided by education authorities.
1.3 Overview of Early Grade Reading Assessment
1.3.1 Why Test Early Grade Reading?
The Early Grade Reading Assessment (EGRA) is an oral student assessment designed to
measure the most basic foundation skills for literacy acquisition in the early grades:
recognizing letters of the alphabet, reading simple words, understanding sentences and
paragraphs, and listening with comprehension. EdData II developed the EGRA methodology
in 2006 and has applied it in 11 countries and 19 languages. It has been adopted and used
by other implementing partners in more than 30 other countries and in more than 60
other languages. RTI International holds the current EdData II task order contract from
USAID/Washington (USAID Education Data Global, 2014).
Why early grade reading? The ability to read and understand a simple text is one of the
most fundamental skills a child can learn. Without basic literacy, there is little chance that a
child can escape the intergenerational cycle of poverty. Yet, in many countries students
enrolled in schools for as many as six years are unable to read and understand a simple
text. Recent evidence indicates that learning to read both early and at a sufficient rate are
essential for learning to read well. Acquiring literacy becomes more difficult as students
grow older; children who do not learn to read in the first few grades are more likely to
repeat and eventually drop out, while the gap between early readers and non-readers
increases over time.
Most national and international assessments are paper-and-pencil tests administered to
students in grades four and above (that is, they assume that the students can read and
write). Results for those few low-income countries that participated in PISA or TIMSS

3
12
indicate that the median child in a low-income country performs at about the third
percentile of a high-income country distribution. From these results, we can tell what
students did not know but cannot ascertain what they did know (often because they
scored so poorly that the test could not distinguish whether the child did not know the
content or simply could not read the test).
On the other hand, EGRA is designed to orally assess the most basic foundation skills for
literacy acquisition in early grades, including pre-reading skills such as listening
comprehension. The test components are based on recommendations made by an
international panel of reading and testing experts and include timed, 1-minute assessments
of letter naming, nonsense and familiar words, and paragraph reading. Additional (untimed)
segments include comprehension, relationship to print, and dictation. In each of the
language pilots conducted to date, EGRA meets psychometric standards as a reliable and
valid measure of early reading skills.
Based on the EGRA applications in more than forty countries, RTI International reported
the results thus far indicate generally low levels of student acquisition of foundation literacy
skills. To provide an overall sense of the reading levels in the countries where EGRA has
been applied, RTI International provides summary averages for oral reading fluency in
terms of correct words per minute as shown in Table 1.1. Country names have been
excluded to avoid comparisons as cross-language comparisons are not encouraged due to
differences in language structure.
Table 1.1: Oral Reading Fluency Levels (Correct Words per Minute) in EGRA
In Indonesia, a 2014 National EGRA survey revealed that the national average of correct
words per minute for second grade students was 52.1. However, this result was not
1 2 3
French 2.9 17.4 32.4
English 1 2.2 4.0 9.2
English 2 11.4
English 59.0 73.1
Spanish 1 9.2 29.3
Spanish 2 32.0 59.6 78.8
Grade
Africa (Low
Income)
Latin America
(Lower Middle
Income)

3
13
consistent across regions. Second grade students in the Java-Bali region significantly
outperformed all other regions, even outscoring the national average by more than 7 words
per minute. Maluku, Nusa Tenggara, and Papua, on the other hand, showed the lowest
correct words per minute at only 29.7, as shown in Table 1.2. The table may indicate the
existence of reading problems in the eastern part of Indonesia.
Table 1.2: Oral Reading Fluency Level (Correct Words Per Minute) in Indonesia EGRA
The EGRA results can be used by policy makers to identify schools with particular needs
and develop instructional approaches for improving foundation skills, for example: poor
letter naming results may indicate the need for additional alphabet exercises. In addition,
based on the EGRA results, teachers may be taught to monitor students‘ oral reading
fluency and practice decoding strategies. In some African countries, such as Mali and Niger,
EGRA results were used to convey the development of materials and sequenced, as well as
scripted teaching. The continuous assessment strategies have demonstrated very promising
results. As a result, EGRA data is used for planning, monitoring, and evaluating education
policies and programs.
RTI International (2014), however, acknowledges the limitations of EGRA and its results.
Firstly, EGRA measures a specific set of critical early grade reading skills, not necessarily all
important literacy skills. Secondly, the individual nature of assessment administration and the
size of a typical sample mean that it is usually used to report results at the district, regional,
national, or program level, not at the school or student level. Thirdly, EGRA is not a high-
stake accountability tool. Finally, the assessment is not suited for direct cross-language
comparisons, but could be used to report on the percentage of children meeting grade-level
expectations. Despite the limitations, EGRA has been applied to assess early grade reading
Grade
2
National 52.1
Jawa-Bali 59.2
Sumatera 47.4
Kalimantan-Sulawesi 42.4
Maluku, Nusa Tenggara, Papua 29.7
Region

3
14
ability in many countries, including Indonesia, as there is no clear benchmark for reading
ability in the national curriculum.
1.3.2 What EGRA Measures
The EGRA instrument consists of a variety of subtasks designed to assess foundational
reading skills that are crucial to becoming a fluent reader. EGRA measures the basic skills
that a child must possess to eventually be able to read fluently and with comprehension—
the ultimate goal of reading. There are five key components of EGRA measures, namely:
alphabetic principle, phonemic awareness, fluency, vocabulary, and comprehension, which
each is further described in the following sections.
Alphabetic Principle
To learn to read, children need to be familiar with the alphabet and the written spelling
systems. An alphabetic principle is the knowledge that letters and letter sequences
represent the sounds of spoken language. EGRA subtasks that measure this skill are: letter
name identification, syllable reading, non-word decoding, and dictation.
Phonemic Awareness
Phonemic awareness is the ability to hear, manipulate and break apart the smallest units of
sounds (phonemes) in words. EGRA subtasks that measure this skill are initial sound
identification and phoneme segmentation.
Fluency
Fluency measures not only whether a child knows something (accuracy), but whether s/he
has integrated the knowledge and can process the information automatically (quickly). Oral
reading fluency is the ability to read a text out loud with speed, accuracy, and expression.
Being able to comprehend text requires being able to read words correctly at some minimal
speed per minute. An EGRA subtask that measures this skill is oral reading fluency (ORF).
Vocabulary
Vocabulary is knowledge of the meaning of words. There are two types of vocabulary:
expressive vocabulary and receptive vocabulary. Expressive vocabulary is the ability to put

3
15
words that we understand into use when we speak or write. Receptive vocabulary is the
ability to understand the meanings of words that we hear or read. EGRA subtasks that
measure these skills are oral vocabulary, reading comprehension, and listening
comprehension.
Comprehension
Comprehension is the ability to understand, interpret, and use what has been read.
Comprehension is dependent on all other components of reading. EGRA subtasks that
measure this skill are reading comprehension and listening comprehension.
EGRA measures each of the previously mentioned abilities/components to assess the
foundational reading skills. The skills are tested in individual subtasks and presented in order
of increased level of difficulty. Because the first few subtasks are easier, EGRA can,
therefore, measure a range of reading abilities for beginning readers.
EGRA, in Indonesia and elsewhere, is not intended to be a high-stakes accountability
measure to determine whether a student should move up to the next grade level.
Additionally, EGRA should not be used to evaluate individual teachers. The final EGRA
instrument for this baseline study included seven subtasks, all of which are summarized in
Table 1.3.

3
16
Table 1.3: EGRA Instrument Subtasks in a Baseline Study
Three of the subtasks were timed, namely letter sound identification, non-word reading, and
oral passage reading. Each timed subtask was administered over a one-minute period during
which the student responded to as many items in the task as possible. For scoring purposes,
the assessor noted which letters or words were read correctly/incorrectly, and at the end
of a minute, the assessor noted how many items the student attempted in the time available.
The score for each timed subtask was calculated and expressed as ―correct items per
minute.‖ Therefore, these subtasks can be characterized as ―fluency‖ measures. Non-fluency
subtasks included untimed sets of questions. The results were calculated and expressed as
―percentage of items correct out of total items attempted.‖
1.4 Overview of the Snapshot of School Management Effectiveness
The SSME framework is based on research reported by Craig and Heneveld (1996) and
Carasco, Munene, Kasente, and Odada (1996). The SSME is an instrument that yields a quick
but rigorous and multifaceted figure of school management and pedagogic practice in a
country or region. The instrument was designed to capture ―best‖ indicators of effective
Subtask Skill Description: the student was asked to...
Letter sound
identification (timed)
Alphabetic principle: letter-
sound correspondence
...say the sound each letter makes, while looking at a
printed page of 100 letters of the alphabet in random order
and in upper and lower case
Nonword reading
(timed)
Alphabetic principle: letter-
sound correspondence
Fluency- automatic decoding
...read a list of 50 nonwords printed on a page. Words were
constructed from actual orthography, but were not real
words in bahasa Indonesia; such as ―kone‖
Oral passage reading
(timed)
Fluency- automatic word
reading in context
... read a grade-appropriate short story out loud from a
printed page
Reading comprehension Comprehension ...orally respond to 5 questions that the assesor asked
about the short story
Listening
comprehension
Oral language comprehension
and vocabulary
...listen to a story that the assessor read out loud, then
orally answer 3 questions about the story
Oral vocabulary Basic vocabulary and oral
langauge comprehension
...point to body parts or objects in the room as identified
by the assesor; place pencil to show understanding of
prepositions
Dictation Oral comprehension; writing
skills; alphabetic process
...write down a sentence spoken aloud by the assessor. The
sentence was read a total of three times and answers were
scored both for word accuracy and for grammar

3
17
schools that, as past research has shown, affect student learning. The resulting data is
designed to let school, district, provincial, or national administrators and donors learn what
is currently occurring in their schools and classrooms and to assess how to make their
schools more effective.
Based on the framework for analyzing effective schools described in the literature about
effective schools, the SSME collects information about basic school inputs such as school
infrastructure, pedagogical materials, teacher and head teacher characteristics, student
characteristics, as well as parental and community involvement and learning outcome data,
via the application of core portions of the EGRA.
The SSME is administered during one school day by the assessor team. In this baseline study,
it was carried out in conjunction with the EGRA and in the same selected schools. Each of
the components of the SSME is designed to supply information from a different perspective.
The SSME design aims to balance the need to include a broad mix of variables—to allow
potentially impactful characteristics to be identified—with the competing need to create a
tool that is as undisruptive to the school day as possible. The combined components of the
SSME can produce a comprehensive figure of a school‘s learning environment, and when the
results from multiple schools in a region are compared, it becomes possible to account for
differences in school performance. Table 1.4 lists the SSME components in this baseline
study.
Table 1.4: SSME Components in a Baseline Study
Level Main Variables to be Measured Data Sources
School
School leadership, teacher characteristics, enrollment,
attendance, infrastructure and facilities, school closings
Head teacher
questionnaires
Teacher characteristics and practices, pedagogical
oversight
Teacher
questionnaires
Infrastructure and facilities, repairs, safety, availability
and use of teaching and learning materials
School and
classroom inventory
Student and Parent
Student background, interactions with the teacher,
interaction with family members
Student and parent
questionnaires

3
18

3
18
To achieve the research objectives, a triangulation research design was applied. Desk
research to collect secondary data, along with qualitative and quantitative research was
carried out. The details about this triangulation technique are displayed in Figure 2.1.
Figure 2.1: Triangulation Research Design
2.1 Desk Research
Relevant secondary data on education statistics at the local level (provincial, district, and
sub-district) along with results from previous studies, notes, and other information related
to the programme design (pillars) as well as indicators were collected and analyzed to
support and explain the findings from qualitative and quantitative research. The Badan Pusat
Statistik (Central Statistics Agency), Pusat Data dan Statistik Pendidikan (Centre for
Education Data and Statistics), and Kementerian Pendidikan dan Kebudayaan (Ministry of
Education and Culture) were other resources of the secondary data. The Centre was also
the source of information regarding the data on schools and student populations that was
used in the sampling process.
Desk Research:
Secondary data collection, especially from MOEC at National, Provincial,
and District Level
Qualitative Research:
In-depth interviews with children, parents, community leaders, school personel and education authorities
Quantitative Research:
Student reading assessment and structured interviews with parents,
teachers and head-teachers
2 METHODOLOGY

3
19
2.2 Quantitative Research
Surveys were carried out among children, parents (households), school teachers, and head
teachers. The survey was conducted through face-to-face structured interviews. For
children, the focus of measurement was on reading skills, while for schools -through
teachers and head teachers- key school indicators such as enrollment, attendance rates,
school facilities, number of teachers, etc. were also covered in the survey. For these
surveys, research instruments, in particular reading assessment, were developed in
collaboration with different experts/sources and in consultation with the national and
provincial education officials.
As the main objective of the Rural and Remote Education Initiative for Papuan Provinces are
gains in reading skills in grade 2 and 3. Thus, the instrument was designed to measure basic
reading skills among students in early grades. The sample was designed to measure reading
skills of grade 2 students. However, in certain cases where the number of grade 2 students
was less than the sample size required, then students from grade 3 were also assessed.
Meanwhile, the parent survey captured several measurements such as: children‘s reading
habits at home, parental and family support at home, socio-economic conditions, etc. In
addition to the student reading assessment and parent interviews, the survey also covered
snapshots on school management effectiveness. The snapshots covered teacher and head
teacher interviews, as well as observations on school and classroom facilities.
In this baseline study, research protocols of Early Grade Reading Assessment (EGRA) and
Snapshots of School Management Effectiveness (SSME) developed by RTI International-
USAID were adjusted and adapted to a Papuan context, while at the same time also
referred to international and national reading assessments (for example, EGRA, Save the
Children reading tools and the Indonesian government‘s measurement- Calistung.)
Students from second grade (or in some cases they might be from third grade) were
involved with a relatively equal distribution between girls and boys. The surveys covered
schools where the UNICEF Programme is going to be implemented (intervention schools)

3
20
and schools without UNICEF‘s intervention (control schools). For this baseline study, the
data analysis will not be conducted separately between these school groups, as intervention
schools have not received any intervention yet.
2.3 Sampling
The intervention schools that will be supported through the Rural and Remote Education
Initiative for Papuan Provinces were selected in collaboration with the district education
offices of DINAS Pendidikan. The selection consists of 120 intervention schools in 6
districts, and it will be equally distributed across districts. Hence, each district has 20
intervention schools to adapt 2 models of intervention:
1. Model A: Cluster, at 10 schools per district
2. Model B: On the job / in school, at 10 schools per district
Based on the calculation of the sample sufficiencies, using the below formula, each model of
intervention and control group should have at least 1,200 student samples in order to have
a 5% margin of error at a 95% confidence level:
[
⁄
⁄]
( )
As a result, we had 2,400 samples of students from the intervention schools and 1,200
students from the control schools. To achieve 1,200 samples of students per intervention
model or control school, we assessed 20 students per school. The samples were taken from
second grade students. In the case where the number of second grade students was less
than 20, students from third grade were assessed to fill the gap. The following mechanism
was applied in selecting the classrooms:
1. If the school had more than one second grade classroom, and the total number of
students in each classroom was more than 20, we selected one second grade
classroom to achieve 20 students in a random manner.

3
21
2. If the school only had one second grade classroom, and the total number of students in
the classroom was more than 20, then the students from this classroom were
randomly selected.
3. If the school only had one second grade classroom and the total number of students
was less than 20, we selected students from a third grade classroom to meet the quota.
4. If the school only had one classroom for both second and third grade students, the
students were randomly selected from that classroom.
Table 2.1: Intervention Schools of the UNICEF Programs vs. Control Schools
The students were randomly selected and equally distributed between boys and girls, unless
the student population in the school could not meet this gender-balanced criterion. The
assessor made a list of the students' names from the selected classrooms, based on their
seating arrangement. The list was separated into girls' names and boys' names. Then, from
each classroom, random numbers were assigned to select the names from each list.
Pair samples of children and their parents were applied, so that the same number of parents
or caregivers was interviewed, unless the parents refused or failed to be interviewed. With
regards to the teacher sample size, from each selected school, one teacher from second
grade and one from third grade were interviewed. Consequently, there were 240 teachers
from the intervention schools and 120 from the control schools. The teacher was chosen
from the selected classroom(s). The head teacher from each sampled schools was also
interviewed. The breakdown of the number of children, parents, teachers, and head
teachers / principals that were interviewed is shown in Table 2.2.
Province District
Number of
Intervention
Schools: Model A
Number of
Intervention
Schools: Model B
Number of
Control Schools
Papua
Biak Numfor 10 10 10
Jayawijaya 10 10 10
Jayapura 10 10 10
Mimika 10 10 10
Papua Barat Manokwari 10 10 10
Sorong 10 10 10
Total 60 60 60

3
22
Table 2.2: Sample Breakdown
2.4 Qualitative Research
In-depth interviews with children, parents, community leaders, teachers, and head teachers,
along with the Dinas Pendidikan (Office of Education) at provincial and district levels were
conducted. Specific research instruments were developed for each type of respondent. To
gain insightful information during the in-depth interviews from non-education authority
respondents, especially in capturing specific barriers of education that have been faced by
them, projective techniques were applied in the form of completion of statements and figure
association. The idea behind this technique is that people cannot, rather than will not, tell
their real opinions, perceptions, or fears. This is not a matter of will or ability. By applying
this technique, the interviewees are encouraged to project their feelings and thoughts
Province District
Number of Students
from Intervention
Schools: Model A
Number of Students
from Intervention
Schools: Model B
Number of Students
from Control Schools
Papua
Biak Numfor 200 200 200
Jayawijaya 200 200 200
Jayapura 200 200 200
Mimika 200 200 200
Papua Barat Manokwari 200 200 200
Sorong 200 200 200
Total 1200 1200 1200
Province District
Number of Parents
from Intervention
Schools: Model A
Number of Parents
from Intervention
Schools: Model B
Number of Parents
from Control Schools
Papua
Biak Numfor 200 200 200
Jayawijaya 200 200 200
Jayapura 200 200 200
Mimika 200 200 200
Papua Barat Manokwari 200 200 200
Sorong 200 200 200
Total 1200 1200 1200
Province District
Number of Teacher &
Head Teacher from
Intervention Schools:
Model A
Number of Teacher &
Head Teacher from
Intervention Schools:
Model B
Number of Teacher
and Head Teacher from
Control Schools
Papua
Biak Numfor 30 30 30
Jayawijaya 30 30 30
Jayapura 30 30 30
Mimika 30 30 30
Papua Barat Manokwari 30 30 30
Sorong 30 30 30
Total 180 180 180

3
23
through pictures or a completion of statements. The number of in-depth interviews in this
baseline survey is shown in Table 2.3.
Table 2.3: Number of In-depth Interviews
In addition to the above in-depth interviews, we also observed a few teachers while they
were delivering Bahasa Indonesia lessons to their students. The observations were
conducted by recording the process in 2 x 25 minutes. The number of observations
conducted is shown in Table 2.4. The records of the observation were analyzed separately
by UNICEF‘s Education Team.
Table 2.4: Number of Teaching Processes Recorded
Type of
Respondents
Papua Papua Barat
Biak Numfor Jayawijaya Jayapura Mimika Manokwari Sorong
Children 5 5 5 5 5 5
Parents 5 5 5 5 5 5
Teacher 5 5 5 5 5 5
Head Teacher 5 5 5 5 5 5
Community Leaders 5 5 5 5 5 5
MOEC at District &
Provincial Level 2 2 2 2 2 2
Grand Total 162
Province District Number of Teaching
Recording: Model A
Number of Teaching
Recording: Model B
Number of Teaching
Recording: Control
Schools
Papua
Biak Numfor 3 3 3
Jayawijaya 3 3 3
Jayapura 3 3 3
Mimika 3 3 3
Papua Barat Manokwari 3 3 3
Sorong 3 3 3
Total 18 18 18

3
24
2.5 Research Ethics on Vulnerable Populations and Children
All of the respondents‘ rights in this survey were strictly protected. As this survey involved
children and adults living in rural areas with a relatively low level of education and low
socio-economic conditions, ethics on vulnerable populations and children were applied.
For child respondents in this survey, their participation was protected according to the
UNICEF‘s Guidelines (2002). The convention on the rights of the children‘s participation in
this research is:
1. All rights must be available to all children without discrimination of any kind. Equity and
non-discrimination should be emphasized.
2. The best interests of the child must be a major factor in all actions concerning children.
3. Children‘s views must be considered and taken into account in all matters that affect
them. They should not be used merely as data subjects of an investigation.
In addition, the children and other vulnerable populations in this survey were fully informed
and had to understand the consequences and impact of expressing their opinions. They
were free to not participate and were not pressured. Their participation was a right, not an
obligation.
Based on the guidelines, the followings were implemented during the data collection to
ensure the respondents‘ rights:
1. Ensured the confidentiality of the respondents: their names were not included in the
information to be collected.
2. Informed the respondents: the respondents were informed about the purpose of the
interviews and the general steps of the interviews. They could feel free to answer or to
express their opinions, they did not have to answer the questions if they did not want
to, etc.
3. Consent was sought by asking for their oral agreement to participate in the study.
4. Equity and non-discrimination were strictly applied through the random selection of the
students, parents, and teachers. More specifically, the socio-economic conditions of the
students and their parents were not barriers in selecting them.

3
25
5. Respect of respondents and their views was applied through the questionnaire design.
For the child respondents, a participatory and friendly questionnaire was designed.
2.6 Recruitment and Training of Assessors
For the quantitative survey, the data was collected by local assessors, while the in-depth
interviews of the qualitative research were conducted by Myriad‘s researchers. Myriad
recruited and trained the assessors to collect the data at the school level.
The assessors were recruited from local universities located in Papua and West Papua.
Based on Myriad‘s experiences in conducting the EGRA survey under RTI International -
funded by USAID, college students from local universities provided optimal results as they
spoke local languages and they were accustomed to the local culture. Therefore, university
students enrolled in local higher education institutions located in each district were
recruited.
The assessors were grouped into 4 persons per team. They collected the data from
children, parents, teachers, and head teachers in a 3-day assessment period per school. One
of the team members was assigned as the team leader with certain roles such as acting as
the spokesperson of the team in the school visit, checking the quality of his team members
in the data collection process, and leading and motivating the team members during data
collection. The total number of teams and assessors was 18 teams with 72 assessors.
After the selection had been completed, the assessors were trained by Myriad Team on
how to implement the research instruments in the field. Five days of training were carried
out to cover all research instruments, sampling methods, research areas, and logistical
aspects. Six trainers were assigned to train assessors of each district, so that the training
was conducted in a parallel manner across 6 districts.

3
26
2.7 Piloting the Research Instruments
Piloting the research instruments was conducted prior to the data collection. The main
objective of the piloting was to implement research instruments in a real situation so that
challenges could be identified and overcome, and adjustments could be made. Piloting was
carried out after the assessor training workshop in 6 targeted districts. Each assessor team
carried out a pilot in 1 school, which resulted in a total of 18 schools. The activity was
completed in 3 days, with details as explained in Table 2.5.
Table 2.5: Piloting the Research Instruments
After the pilot program, no major adjustments were made on the research instruments
except for a few minor changes in the flow of the SSME questions to make the interviews
flow smoothly.
2.8 Data Collection
A Computer Assisted Personal Interview (CAPI) was applied using Nexus Tablet. Research
instruments were loaded into the electronic device. The main reason for applying the CAPI
technique was two-fold. First, it was more efficient as the data was automatically punched
and stored in the Myriad server. In other words, no data entry was required. Second, quality
Children Parents TeacherHead
Teacher
Papua Biak Numfor 3 3 60 60 6 3
Jayawijaya 3 3 60 60 6 3
Jayapura 3 3 60 60 6 3
Mimika 3 3 60 60 6 3
Papua Barat Manokwari 3 3 60 60 6 3
Sorong 3 3 60 60 6 3
Total 18 18 360 360 36 18
Number of Respondents in the Pilot
Province District
Number
of
Assessor
Team
Number
of School
in the
Pilot

3
27
control of the data collection could be optimized as the date, time, and GPS of the school
location could be monitored from the device.
The step-by-step activities that were carried out by each assessor team in each school are
as follows:
a. The assessors introduced themselves and sought permission from the head teacher
upon their arrival. The team leader explained the purpose of the assessment. A room
for assessment was requested, such as in the library, an extra curricula room, empty
classroom, etc.
b. The assessor team selected the second grade classroom with the mechanism that was
explained in the previous sub-section. If required, third grade students were also
involved. A simple random sampling was applied.
c. The assessor team chose 20 students from the selected classrooms. The names of the
students were listed on two separate lists: boys and girls based on their seating
arrangement. The assessor team requested random numbers from their electronic
device in order to select the students.
d. Selected students were then taken to the assessment room one by one until all 20
students completed the interviews.
e. Two teachers from the selected classroom (observing gender balance) were randomly
chosen using a simple random sample method. Teacher interviews were conducted
after the students were interviewed.
f. Lastly, the head teacher was interviewed.
g. Parallel with the school assessment, two assessors from the team started interviews
with the parents or the caregivers. Home interviews were conducted. The addresses of
the selected students were requested from the head teacher.
h. Each assessor team assessed one school for 3 days. Therefore, the total number of
survey days was around 30 days.
For the in-depth interviews, the following are the step-by-step activities:
a. The key informants were identified and then approached to be interviewed. Children
and their parents were selected from the sample of the quantitative survey. The same
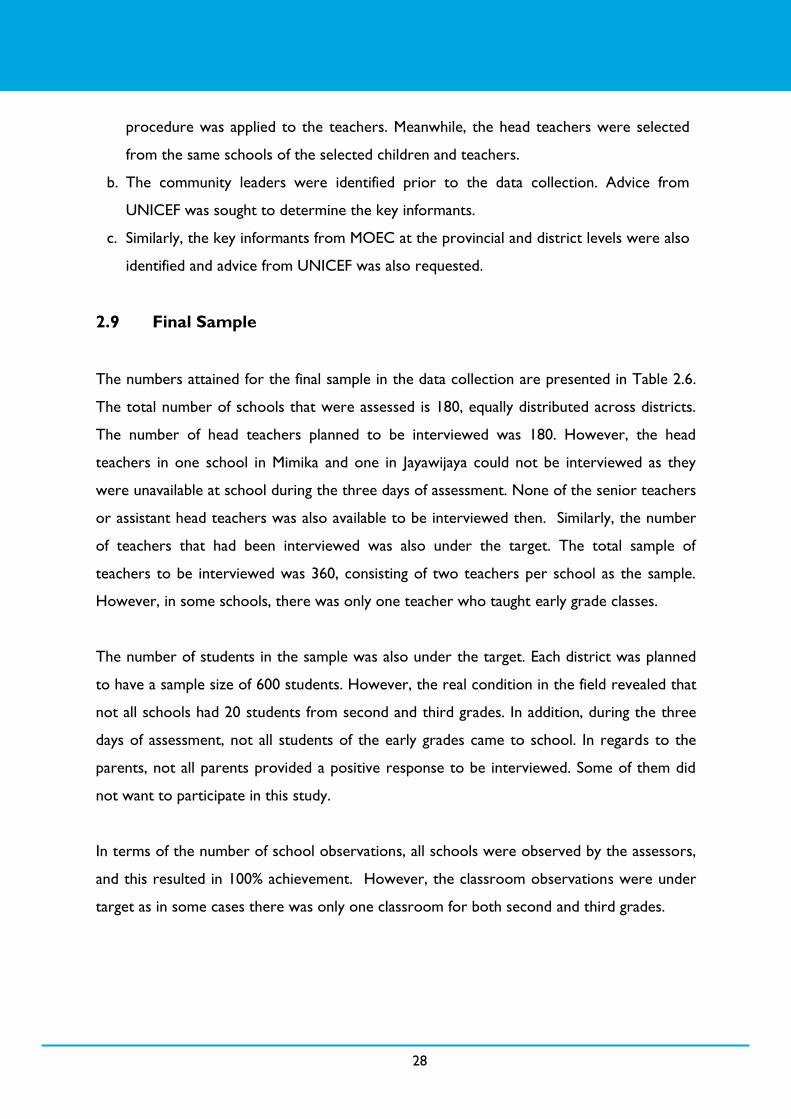
3
28
procedure was applied to the teachers. Meanwhile, the head teachers were selected
from the same schools of the selected children and teachers.
b. The community leaders were identified prior to the data collection. Advice from
UNICEF was sought to determine the key informants.
c. Similarly, the key informants from MOEC at the provincial and district levels were also
identified and advice from UNICEF was also requested.
2.9 Final Sample
The numbers attained for the final sample in the data collection are presented in Table 2.6.
The total number of schools that were assessed is 180, equally distributed across districts.
The number of head teachers planned to be interviewed was 180. However, the head
teachers in one school in Mimika and one in Jayawijaya could not be interviewed as they
were unavailable at school during the three days of assessment. None of the senior teachers
or assistant head teachers was also available to be interviewed then. Similarly, the number
of teachers that had been interviewed was also under the target. The total sample of
teachers to be interviewed was 360, consisting of two teachers per school as the sample.
However, in some schools, there was only one teacher who taught early grade classes.
The number of students in the sample was also under the target. Each district was planned
to have a sample size of 600 students. However, the real condition in the field revealed that
not all schools had 20 students from second and third grades. In addition, during the three
days of assessment, not all students of the early grades came to school. In regards to the
parents, not all parents provided a positive response to be interviewed. Some of them did
not want to participate in this study.
In terms of the number of school observations, all schools were observed by the assessors,
and this resulted in 100% achievement. However, the classroom observations were under
target as in some cases there was only one classroom for both second and third grades.

3
29
Table 2.6: Final Sample
In terms of school profiles, 62% of the sampled schools were public schools, and the
remaining 38% were private schools. Mimika was represented by the highest percentage of
private schools as compared to other districts. In contrast, Manokwari had the highest
percentage of public schools.
Table 2.7: Final Sample, by School Types
Province District
Type of Respondent
School Head
Teacher Teacher Students Parents
School
Inventory
Classroom
Inventory
Papua
Biak 30 30 60 541 541 30 54
Jayapura 30 30 59 541 500 30 48
Mimika 30 29 58 459 369 30 53
Jayawijaya 30 29 55 520 448 30 55
Papua Barat Manokwari 30 30 51 395 366 30 49
Sorong 30 30 47 478 421 30 44
Total 180 178 330 2934 2645 180 303
Public School Private School
All Papua 62% 38%
Biak 60% 40%
Jayapura 63% 37%
Mimika 53% 47%
Jayawijaya 70% 30%
Manokwari 87% 13%
Sorong 70% 30%

3
30

3
30
3.1 The Student Profiles and Their Voices
The students in this baseline study consist of almost an equal proportion of boys (51%) and
girls (49%) across all districts. The majority of the students were in the second grade (66%),
and the rest (34%) were third grade students. In terms of age, 60% of them were 6-8 years
old, 37% were 9-11 years old, and the remaining 3% were over 11 years old. All the districts
had second and third grade students at the age of 12 years old and over.
Table 3.1: Student Age Ranges by District
District
Student Ages
6-8 y.o 9-11 y.o 12 y.o or
more
Biak 64% 34% 2%
Jayapura 61% 37% 2%
Mimika 55% 40% 5%
Jayawijaya 56% 40% 4%
Manokwari 52% 42% 6%
Sorong 60% 37% 3%
Half of the students (56%) stated that they attended pre-school, while the other half (43%)
said that they never did. As a comparison, at the national level, 80% of early grade students
attended the pre-school. Looking at the district level, Jayawijaya and Sorong have the largest
number of students who said that they never attended pre-school. In contrast, the majority
of students in Jayapura stated that they attended pre-school.
3 RESULTS AND FINDINGS: SNAPSHOTS OF SCHOOL MANAGEMENT EFFECTIVENESS

3
31
Table 3.2: Pre-School Attendance
Some of the students in this baseline study (7%) said that they were afraid to go to school.
Higher percentages of students in Sorong, Mimika, and Jayawijaya said that they were afraid
to go to school compared to students in the other studied districts.
Table 3.3: Afraid of Going to School
District Students Afraid of Going to
School Yes No
Biak 3% 97%
Jayapura 4% 96%
Mimika 12% 88%
Jayawijaya 9% 91%
Manokwari 3% 97%
Sorong 14% 86%
District
Attended Pre-School
(PAUD/ TK)
Yes No
National 80% 20%
Biak 52% 48%
Jayapura 82% 18%
Mimika 65% 35%
Jayawijaya 24% 76%
Manokwari 77% 23%
Sorong 45% 55%
National : taken from the RTI International &
USAID/Indonesia EGRA National Survey 2014.

3
32
In terms of the students‘ absenteeism and tardiness, almost half of the students admitted
that they were absent (53%) or came late to school (59%) in the past week. Across all
districts, illness was the main reason for absenteeism (46.52%), while having to work at
home was revealed as the second main reason (12.25%). Other reasons for the students‘
absenteeism were related to socio-economic and geographical disadvantages such as having
no transportation, dealing with bad weather, being treated poorly by other students or by
teachers, being without food at home, and having no teacher at school. A relatively similar
pattern of the main reasons for students‘ absenteeism was identified across all districts.
Table 3.4: Student Absenteeism and Tardiness
The teachers‘ attendance in school was observed by the students, as 11% of the students
stated that their teacher was not always in school. Jayawijaya and Sorong had a relatively
higher level of teacher absenteeism compared to other districts according to the students.
Reason for Absenteeism Tanah
Papua Biak Jayapura Mimika Jayawijaya Manokwari Sorong
I was sick 46.52% 42.27% 53.61% 45.83% 40.00% 45.09% 49.51%
There was other work at home 12.25% 15.37% 6.56% 17.27% 16.94% 8.40% 8.89%
I woke up late 11.37% 11.43% 11.17% 9.71% 8.47% 19.05% 8.27%
I had to take care of a family member 9.54% 11.70% 8.68% 7.23% 13.35% 4.05% 13.72%
I was lazy going to school 4.47% 6.43% 5.55% 3.60% 4.36% 0.49% 1.52%
I had no transportation 3.70% 0.68% 1.80% 4.60% 6.13% 12.12% 2.46%
Out of town with family 3.60% 4.14% 5.33% 2.45% 2.08% 1.56% 4.09%
Bad Weather 2.42% 0.92% 2.07% 2.48% 2.91% 3.74% 3.00%
Emergency situation 2.09% 2.60% 2.63% 1.76% 1.04% 2.76% 1.56%
I am treated poorly by other students at
school 1.84% 3.76% 0.90% 1.44% 1.82% 1.20% 3.51%
Going and being in school was dangerous 0.60% 0.00% 0.36% 1.83% 0.00% 1.01% 0.00%
Parents scold/ beat me 0.49% 0.00% 0.45% 1.08% 1.04% 0.00% 0.00%
There was a religious event in churce 0.42% 0.68% 0.45% 0.00% 0.83% 0.00% 0.78%
I don‘t have book and pencil 0.23% 0.00% 0.00% 0.72% 0.00% 0.43% 0.35%
I am treated poorly by teachers at school 0.18% 0.00% 0.45% 0.00% 0.00% 0.00% 0.78%
No food at home 0.18% 0.00% 0.00% 0.00% 1.04% 0.00% 0.78%
No teacher at school 0.10% 0.00% 0.00% 0.00% 0.00% 0.09% 0.78%
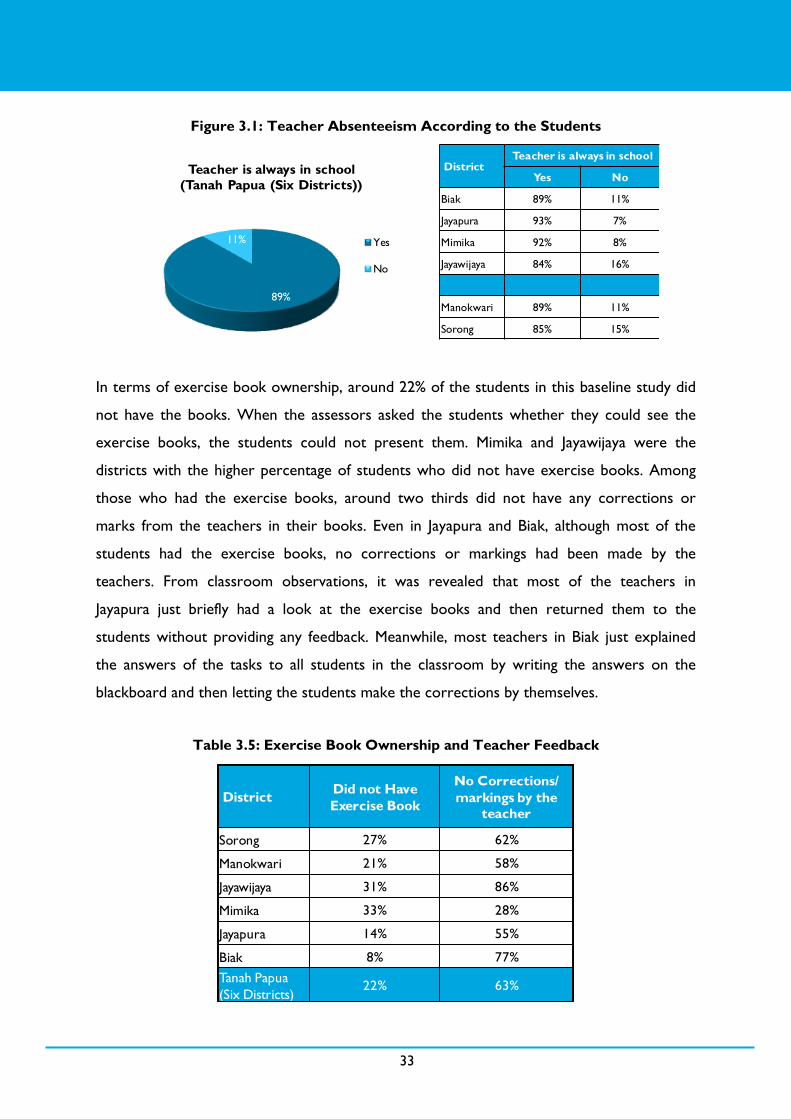
3
33
Figure 3.1: Teacher Absenteeism According to the Students
In terms of exercise book ownership, around 22% of the students in this baseline study did
not have the books. When the assessors asked the students whether they could see the
exercise books, the students could not present them. Mimika and Jayawijaya were the
districts with the higher percentage of students who did not have exercise books. Among
those who had the exercise books, around two thirds did not have any corrections or
marks from the teachers in their books. Even in Jayapura and Biak, although most of the
students had the exercise books, no corrections or markings had been made by the
teachers. From classroom observations, it was revealed that most of the teachers in
Jayapura just briefly had a look at the exercise books and then returned them to the
students without providing any feedback. Meanwhile, most teachers in Biak just explained
the answers of the tasks to all students in the classroom by writing the answers on the
blackboard and then letting the students make the corrections by themselves.
Table 3.5: Exercise Book Ownership and Teacher Feedback
89%
11%
Teacher is always in school
(Tanah Papua (Six Districts))
Yes
No
District Teacher is always in school
Yes No
Biak 89% 11%
Jayapura 93% 7%
Mimika 92% 8%
Jayawijaya 84% 16%
Manokwari 89% 11%
Sorong 85% 15%
District Did not Have
Exercise Book
No Corrections/
markings by the
teacher
Sorong 27% 62%
Manokwari 21% 58%
Jayawijaya 31% 86%
Mimika 33% 28%
Jayapura 14% 55%
Biak 8% 77%
Tanah Papua
(Six Districts) 22% 63%

3
34
Teacher feedback of the students‘ achievements seemed to be limited. Only around one
third (34%) of the teachers praised the students when they achieved a good grade, while the
rest did nothing. In contrast, when the students could not answer the teacher‘s question
properly, the students said that they were scolded (13.43%) or hit (20.57%) by the teacher.
Higher percentages of teachers in Jayapura, Sorong, and Jayawijaya hit their students as
compared to the ones in the other three districts.
Figure 3.2: Teacher Reactions According to the Students
The students‘ learning environment at home was not conducive for the majority of the
students. Most of the students (83%) stated that they were given homework from their
teachers in the past one week; however, about half of the students (54%) said that they did
the homework without any family support. Looking at the parents‘ literacy that might have
15.33%
1.65%
5.43%
2.26%
5.08%
13.43%
0.26%
20.57%
0.29%
13.25%
22.45%
Rephrases/explains
the question
Asks again(without
explaining)
Encouragesthe studentto try again
Asksanotherstudent
Correctsthe student,but does not
scoldhim/her
Scoldsstudent
Sendsstudentoutside
of classroom
Hitsstudent
Sendsstudent
to cornerof classroom
Others* NoResponse
Teacher reaction to student who was unable to answer question
(Tanah Papua (Six Districts))
Teacher reaction to student who
was unable to answer question Biak Jayapura Mimika Jayawijaya Manokwari Sorong
Rephrases/explains the question 16% 8% 26% 13% 14% 15%
Asks again (without explaining) 1% 2% 2% 2% 1% 0%
Encourages the student to try again 11% 9% 2% 2% 2% 2%
Asks another student 5% 1% 1% 1% 3% 3%
Corrects the student, but does not
scold him/her 9% 7% 3% 2% 5% 2%
Scolds student 3% 21% 9% 16% 24% 12%
Sends student outside of classroom 0% 0% 0% 0% 0% 2%
Hits student 12% 30% 15% 24% 17% 26%
Sends student to corner of classroom 0% 0% 1% 0% 0% 1%
Others* 24% 9% 19% 4% 5% 16%
No Response 20% 11% 22% 35% 30% 21%
*Others include give a bad grade, give more homework/ additional assignment, ask to clean classroom and school.

3
35
influenced the level of parental support, this study found a relatively higher level of illiteracy
in Jayawijaya, Manokwari, and Mimika, as shown in Table 3.7. For these three districts, the
absence of parental support might be related to the illiteracy rate. Meanwhile, for Jayapura
and Biak, where the illiteracy rate was much lower, the absence of support might be related
to the students‘ independent learning.
Table 3.6: Homework and Family Support
Table 3.7: Parental Literacy Rate
Apart from school textbooks, 39% of the students in this baseline study said that they did
not have any books at home. Jayawijaya and Manokwari had the highest percentage of
students who said that they did not have any books at home.
District
Student was helped when
doing homework
Yes No
Biak 40% 60%
Jayapura 43% 57%
Mimika 49% 51%
Jayawijaya 52% 48%
Manokwari 48% 52%
Sorong 51% 49%
District
Student had homework last
week
Yes No
Biak 90% 10%
Jayapura 89% 11%
Mimika 86% 14%
Jayawijaya 68% 32%
Manokwari 84% 16%
Sorong 82% 18%
District Mother knows how to read
Yes No
National 95% 5%
Tanah Papua 78% 22%
Biak 92% 8%
Jayapura 93% 7%
Mimika 81% 20%
Jayawijaya 45% 56%
Manokwari 72% 28%
Sorong 82% 18%
District Father knows how to read
Yes No
National 94% 6%
Tanah Papua 86% 14%
Biak 93% 7%
Jayapura 94% 6%
Mimika 89% 11%
Jayawijaya 69% 31%
Manokwari 79% 21%
Sorong 91% 9%
National : taken from the RTI International & USAID/Indonesia EGRA National Survey 2014.

3
36
Figure 3.3: Availability of Books at Home
Regardless of the limited book ownership at home, around half of the students (47%) still
have motivation to read aloud at home. Jayapura and Sorong have higher percentages of
students who said that they read aloud at home, while in contrast Jayawijaya has the lowest.
A further analysis revealed that 34% of children who said that they read aloud at home (at
least once a week) came from an illiterate family background. Despite this disadvantage,
these students still had the motivation to learn how to read at home.
Figure 3.4: Students Who Read Aloud at Home
3.2 Parent Profiles and their Voices
Almost half of the parents in this baseline study were mothers (48%), while the rest
consisted of fathers (37%) and caregivers (15%). The majority of them were in the age range
61%
39%
Tanah Papua
(Six Districts)
Yes
No
District
Apart from school books,
student had books at home
Yes No
Biak 76% 24%
Jayapura 70% 30%
Mimika 61% 39%
Jayawijaya 42% 58%
Manokwari 44% 56%
Sorong 66% 34%
District
Student read book a loud at home
No, never Once a
week
2-3 times
per week Every day
Biak 51% 16% 24% 9%
Jayapura 43% 17% 32% 8%
Mimika 52% 24% 18% 6%
Jayawijaya 68% 15% 11% 6%
Manokwari 56% 24% 15% 5%
Sorong 40% 26% 25% 9%
53%
19%
21% 7%
Tanah Papua
(Six Districts)
No, never Once a week
2-3 times per week Every day

3
37
of 26-35 years old (38%) and 36-45 years old (33%). Almost 60% of them said that Bahasa
Indonesia was their primary language at home, while around 40% spoke local languages at
home. Jayawijaya was the district with the highest usage of local languages as their main
language at home, while in contrast, Jayapura was the lowest. The usage of a local language
as the main language at home was also relatively high in Biak, Mimika, Manokwari, and
Sorong.
Figure 3.5: Parents’ Language
In terms of education level, 12% of parents said that they never attended school at all, while
56% were elementary and primary school graduates. Jayawijaya has the highest percentage
of parents without any formal education (37%), while Jayapura and Biak have the highest
percentages of parents who graduated from senior high school and college.
Figure 3.6: Parents’ Education Level
57%
1%
42%
Tanah Papua
(Six Districts)
Bahasa
Indonesia
Bahasa Jawa
Local Language
District
Parent’s Language
Bahasa Indonesia
Bahasa Jawa
Local Language
Biak 58% 0% 42%
Jayapura 86% 1% 13%
Mimika 56% 0% 44%
Jayawijaya 6% 0% 94%
Manokwari 47% 2% 51%
Sorong 59% 2% 39%
District
Parent’s Education Level
Never Elementary Junior high
school
Senior high
school College
Biak 3% 28% 27% 30% 12%
Jayapura 3% 24% 23% 40% 10%
Mimika 9% 45% 24% 17% 5%
Jayawijaya 38% 24% 14% 18% 6%
Manokwari 16% 42% 14% 20% 8%
Sorong 12% 36% 22% 23% 7%
12%
35%
22%
24%
7%
Tanah Papua
(Six Districts)
Never
Elementary
Junior high
school
Senior high
school
College

3
38
In this study, parents‘ economic condition can be classified based on household income. The
majority of the households earned less than IDR 3 million rupiah per month. This finding is
consistent across districts.
Figure 3.7: Household Monthly Income
Half of the parents in this baseline study stated that their monthly income was not enough
to cover their daily needs, not to mention for their children‘s education needs. Jayawijaya
and Manokwari have higher percentages of parents who stated so. According to 15% of
parents in this survey, they still had to pay for school fees. In addition, they also needed to
buy books and stationery, school uniforms, shoes, and school bags. Pocket money and
transportation costs were the other expenses that the parents had to provide for their
children. Therefore, it is not too surprising if one of the reasons for student absenteeism
was due to no transportation funds or no food at home.
17%
21%
58%
3% 1%
Tanah Papua
(Six Districts)
Less than 500.000
500.000 – 999.999
1.000.000 – 2.999.999
3.000.000 – 6.000.000
More than 6.000.000
District
Household’s Monthly Income (IDR)
Less than
500.000
500.000 –
999.999
1.000.000 –
2.999.999
3.000.000 –
6.000.000
More than
6.000.000
Biak 25% 25% 48% 2% 0%
Jayapura 12% 22% 59% 5% 2%
Mimika 6% 15% 74% 3% 2%
Jayawijaya 24% 18% 56% 1% 0%
Manokwari 11% 30% 57% 2% 0%
Sorong 15% 19% 65% 1% 1%

3
39
Figure 3.8: Economic Level vs. Daily Needs
In terms of parents‘ attention to and support of their children‘s education, the majority of
parents (81%) claimed that they talked to their children about what happened in their
schools. According to one third of the parents, they talked about it every day. Jayapura has
the highest percentage of parents who claimed that they talked to their children about their
schools on a daily basis.
District
Household’s income was
enough for daily needs
Yes No
Biak 50% 50%
Jayapura 42% 58%
Mimika 46% 54%
Jayawijaya 29% 71%
Manokwari 26% 74%
Sorong 46% 54%
45%
55%
Household’s income was enough
for daily needs
(Tanah Papua (Six Districts))
Yes
No
33%
34%
15%
10% 8%
Spending money for children’s
education need
(Tanah Papua (Six Districts))
Buy the book
Buy stationery
Pay school fees
Children transportation
Other
District
Spending money for children’s education need
Buy the book Buy
stationery
Pay school
fees
Children
transportation Other
Biak 34% 33% 15% 8% 10%
Jayapura 31% 32% 17% 14% 6%
Mimika 32% 35% 14% 12% 7%
Jayawijaya 33% 36% 17% 8% 6%
Manokwari 37% 37% 10% 7% 9%
Sorong 32% 31% 19% 9% 9%

3
40
Figure 3.9: Discussing What Happened in School with Children
Almost half of parents (48%) said that they praised their children when the children
obtained good grades at school, while on the other hand, there are still 16% of them who
physically punished their children if they failed to study well at school. Only around 2% of
parents consulted the teachers. Mimika and Jayawijaya have the highest percentage of
parents who physically punished their children.
Figure 3.10: Rewards towards the Children
34%
51%
15%
Tanah Papua
(Six Districts)
Every day
Frequently
If Necessary
District Parent asks what happen at school
Every day Frequently If Necessary
Biak 27% 66% 7%
Jayapura 45% 43% 12%
Mimika 28% 46% 26%
Jayawijaya 35% 43% 22%
Manokwari 21% 64% 15%
Sorong 34% 50% 16%
District
Parent’s reaction to student’s good grade
Nothing Praised
him/her
Gave me a
hug/kiss
Gave me a
prize Other
Biak 16% 39% 7% 26% 12%
Jayapura 19% 42% 9% 17% 13%
Mimika 8% 63% 15% 5% 9%
Jayawijaya 32% 40% 10% 14% 4%
Manokwari 16% 60% 4% 11% 9%
Sorong 16% 50% 7% 13% 14%
*Others include Advised children to learn more, Monitoring children in studying
17%
48%
8%
14%
13%
Tanah Papua
(Six Districts)
Nothing
Praised him/her
Gave me a hug/kiss
Gave me a prize
Other

3
41
Figure 3.11: Punishment towards the Children
According to the majority of parents (64%), their children studied at home on a daily basis
for less than one hour. On the other hand, there were also 5% of them who admitted that
their children never studied at home. Jayawijaya has the highest percentage of parents who
said that their children never studied at home. The majority of the students, according to
their parents, spent less than one hour a day for studying at home. This pattern was
relatively consistent across districts.
83%
17%
Tanah Papua
(Six Districts)
Yes
No
District
Parent’s reaction to child who is unable to study well at school
Physical
punishment
Non-Physical
punishment None
Helping
child
Consulting
teacher Others
Biak 12% 33% 19% 23% 0% 13%
Jayapura 10% 22% 5% 43% 2% 18%
Mimika 37% 19% 4% 15% 2% 23%
Jayawijaya 27% 24% 24% 18% 2% 5%
Manokwari 11% 47% 23% 10% 1% 8%
Sorong 15% 26% 13% 27% 2% 17%
*Others include Confine students at home, Sent him/ her to learn with friends, Promising a
prize if they get good grade, Pray for child properly

3
42
Figure 3.12: Children Studying at Home
When the parents were asked whether they supported their children in doing homework,
the majority of them (83%) claimed that they did. However, as explained in the previous
section, only 46% of the children stated that they were supported by their parents in doing
homework.
The majority of parents (83%) in this baseline study stated that they could read. This finding
is consistent with what the children stated about their parents' ability to read as explained in
the previous section. Jayawijaya has the highest percentage of parents who said that they
could not read at all.
Figure 3.13: Parents' Literacy
In terms of child absenteeism and tardiness, parents had lower claims than their children. As
explained previously, 53% of children stated that they were absent from school in the past
week, and 59% admitted that they were late. Meanwhile, only 17% of parents stated that
5%
64%
29% 2%
0%
Children spent time to study at
home
(Tanah Papua (Six Districts))
Never study Less than 1 hour
1-2 hours 2-3 hours
More than 3 hours
District
Children spent time to study at home
Never study Less than 1
hour 1-2 hours 2-3 hours
More than 3
hours
Biak 1% 73% 24% 2% 0.2%
Jayapura 3% 63% 32% 2% 0.2%
Mimika 5% 60% 34% 1% 0.0%
Jayawijaya 17% 58% 23% 2% 0.0%
Manokwari 2% 76% 20% 2% 0.4%
Sorong 5% 64% 29% 2% 0.1%
83%
17%
Know how to read
(Tanah Papua (Six Districts))
Yes
No
District Know how to read
Yes No
Biak 94% 6%
Jayapura 94% 6%
Mimika 88% 12%
Jayawijaya 62% 38%
Manokwari 78% 22%
Sorong 83% 17%

3
43
their children did not go to school the previous week, and 16% said that their children were
late. Apart from illness as the main reason, the parents stated that waking up late, feeling
lazy to go to school, and having to work at home were the other main reasons for their
children‘s absenteeism. In addition, parents pointed out that teachers‘ absenteeism also
contributed to their children‘s absenteeism.
Meanwhile, waking up late and dealing with bad weather were the main reasons for the
children's tardiness. Teachers who frequently came late to school and rarely came to school
were also stated by the parents as the other reasons for students' tardiness.
Table 3.8: Reasons for Children's Absenteeism According to Parents
Table 3.9: Reasons for Children's Tardiness According to Parents
District
Reason why children did not go to school last week
Sick
Had
work at
home
Took care
a family
member
No
transport
Bad
weather
Too
dangerous
Woke
up late
Treated
poorly by
teachers
at school
Treated
poorly by
other
students
at school
Lazy
to go
to
school
Because
teacher
rarely
come to
school
Others
Biak 36% 7% 3% 2% 7% 1% 23% 1% 1% 11% 4% 4%
Jayapura 39% 5% 1% 7% 13% 0% 17% 0% 0% 10% 0% 8%
Mimika 43% 15% 2% 3% 4% 2% 16% 0% 1% 6% 1% 7%
Jayawijaya 29% 7% 4% 5% 6% 4% 18% 0% 0% 21% 3% 3%
Manokwari 42% 10% 1% 3% 9% 0% 21% 0% 0% 3% 4% 7%
Sorong 21% 13% 0% 11% 0% 0% 9% 3% 0% 23% 4% 16%
Others include student did not have pocket money, did not have uniform, books and pencils, distance of home to school is too far, and not
doing homework.
District
Reason why child was late going to school any day last week
Sick
Had
work at
home
Took
care a
family
member
No
transport
Bad
weather
Emergency
Situation
Too
dangerous
Woke
up late
Teacher
frequently
late to
school
Teacher
rarely
come to
school
Others
Biak 11% 5% 1% 5% 11% 0% 0% 48% 8% 4% 7%
Jayapura 3% 4% 0% 13% 11% 5% 0% 43% 7% 3% 11%
Mimika 16% 7% 1% 6% 10% 4% 3% 42% 0% 1% 11%
Jayawijaya 2% 5% 1% 10% 23% 5% 1% 38% 3% 2% 11%
Manokwari 24% 7% 1% 9% 20% 1% 2% 13% 8% 8% 5%
Sorong 4% 6% 3% 13% 7% 5% 0% 51% 0% 0% 12%
Others includes the distance from home to school, chidren just want to play at home.

3
44
Teachers‘ absenteeism and tardiness were noticed by the parents, as 20% of them said that
the teachers rarely came to school and 43% of them said that the teachers always came late.
This concern was significant in Manokwari, Mimika, and Jayawijaya. Consequently, around
20% of parents in this study said that they were unhappy with the school.
Figure 3.14: Teachers' Absenteeism and Tardiness According to Parents
In terms of availability of other books at home, consistent with their children, around 43%
of parents in this study also admitted that they did not have any books at home other than
what their children obtained from school. Jayawijaya and Manokwari have the highest
percentage of parents who stated so.
57%
43%
Teacher was always on time
(Tanah Papua (Six Districts))
Yes
No
District
Teacher was always on
time
Yes No
Biak 46% 53%
Jayapura 52% 48%
Mimika 70% 30%
Jayawijaya 65% 35%
Manokwari 52% 48%
Sorong 57% 43%
20%
80%
Teacher rarely come to school
(Tanah Papua (Six Districts))
Yes
No
District
Teacher rarely come to
school
Yes No
Biak 26% 74%
Jayapura 17% 83%
Mimika 6% 94%
Jayawijaya 15% 85%
Manokwari 73% 27%
Sorong 18% 82%

3
45
Figure 3.15: Availability of Books at Home
Parental involvement in school affairs could be considered as limited. The majority of them
stated that they were never informed about the usage of BOS and had never been invited to
school to discuss school programs. In addition, one third of them also stated that they had
never been informed about the requirements of a passing grade. The findings were relatively
consistent across districts.
Figure 3.16: Parental Involvement in School
57%
43%
Apart from school books, child
had books at home
(Tanah Papua (Six Districts))
Yes
No
District
Apart from school books,
student had books at home
Yes No
Biak 66% 34%
Jayapura 67% 33%
Mimika 53% 47%
Jayawijaya 45% 55%
Manokwari 41% 59%
Sorong 56% 44%
37%
63%
Parent was informed about
the use of BOS
(Tanah Papua (Six Districts))
Yes
No
45%
55%
Parent invited to school to
discuss about school
program
(Tanah Papua (Six Districts))
Yes
No66%
34%
Parent was informed about
passing grade requirement
(Tanah Papua (Six Districts))
Yes
No
District
Parent was informed
about the use of BOS
Yes No
Biak 37% 63%
Jayapura 38% 62%
Mimika 27% 73%
Jayawijaya 43% 57%
Manokwari 34% 66%
Sorong 41% 59%
District
Parent invited to
school to discuss
about school program
Yes No
Biak 35% 65%
Jayapura 53% 47%
Mimika 43% 57%
Jayawijaya 53% 47%
Manokwari 46% 54%
Sorong 47% 53%
District
Parent was informed
about passing grade
requirement
Yes No
Biak 76% 24%
Jayapura 69% 31%
Mimika 66% 34%
Jayawijaya 66% 34%
Manokwari 49% 51%
Sorong 60% 40%

3
46
3.3 Teacher Profiles and Voices
In this baseline study, slightly more female teachers were interviewed (57%) as compared to
the male ones (43%). Jayawijaya has the highest percentage of male teachers, while Jayapura
has the highest percentage of female teachers. This finding is in line with the finding of the
absenteeism study in Tanah Papua that was conducted by the UNICEF et al. (2012). The
study found that women are more highly represented in lowland easy-to-access districts,
while the proportion of men is higher in difficult-to-access lowland or highland districts.
Figure 3.17: Gender and Age of Teachers
43% 57%
Teacher Gender
(Tanah Papua (Six Districts))
Male
Female
District Teacher Gender
Male Female
Biak 40% 60%
Jayapura 27% 73%
Mimika 35% 65%
Jayawijaya 74% 26%
Manokwari 45% 55%
Sorong 40% 60%
District
Teacher’s Age
17 - 19
years
20 - 22
years
23 - 25
years
26 - 28
years
29 - 31
years
More than 31
years
Biak - 2% 42% 16% 24% 16%
Jayapura - 8% 22% 15% 22% 33%
Mimika - 7% 40% 25% 14% 14%
Jayawijaya 4% 13% 19% 17% 30% 21%
Manokwari 4% 16% 40% 10% 15% 19%
Sorong - 9% 15% 23% 27% 26%
1%
9%
30%
18% 21% 21%
17 - 19 years 20 - 22 years 23 - 25 years 26 - 28 years 29 - 31 years More than 31
years
Teacher’s Age
(Tanah Papua (Six Districts))

3
47
In terms of age, Biak, Mimika, and Manokwari had a higher percentage of teachers who were
20-25 years old as compared to the other three districts. On the other hand, Jayapura and
Jayawijaya had a higher percentage of teachers who were more than 30 years old. This
finding is in line with the teachers‘ experience. The teachers in this baseline study consisted
of those with long experience as early grade teachers, as around 40% of them had more
than 10 years of experience. Jayawijaya and Jayapura have the highest percentage of
experienced teachers.
Figure 3.18: Teachers’ Experience
Half of the teachers said that Bahasa Indonesia was their native language. The higher
percentage of teachers who said that Bahasa Indonesia was their main language resided in
Jayapura, Mimika, Sorong, and Manokwari. In contrast, Jayawijaya has the lowest percentage
of teachers who spoke Bahasa Indonesia as their main language. In this district, a relatively
equal percentage of teachers spoke local languages or other languages as their main language
such as Bahasa Biak, Bahasa Jawa, Bahasa Baliem, Bahasa Toraja, Bahasa Meyah, Bahasa Hatam,
Bahasa Moi, and Bahasa Lani. Although the teachers‘ native language is not the local language,
the majority of them (62%) said that they spoke the local language fluently.
Length of Experiences as a Teacher
1 – 3 years 4 – 6 years 7 – 9 years 10 – 12 years More than 12
years
Biak 30% 20% 12% 10% 28%
Jayapura 21% 24% 9% 10% 36%
Mimika 40% 28% 11% 9% 12%
Jayawijaya 30% 9% 11% 10% 40%
Manokwari 48% 18% 5% 12% 16%
Sorong 17% 28% 20% 11% 23%
31%
20%
11% 10%
28%
1 – 3 years 4 – 6 years 7 – 9 years 10 – 12 years More than 12
years
Tanah Papua
(Six Districts)

3
48
Figure 3.19: Teachers’ Native Language
The majority of the teachers resided in villages (69%), and around 21% lived in neighboring
villages, while the rest were in the district capitals (10%). Furthermore, the distance
between the house and the school was not too problematic for the majority of the teachers,
as 66% of them said that it only took less than 10 minutes of travel time. Only a very small
percentage of the teachers (5%) stated that they needed around one hour to reach the
school. This finding is consistent across districts and is also confirmed by the head teacher
study findings. Comparing this finding to a previous study that was conducted by UNICEF et
al. (2012), the figure was similar in terms of percentage of teachers who resided in the
village of the school, namely 69%.
In terms of teacher education background, 48% of them held Bachelor‘s Degrees. This
finding confirms the result of the RTI/USAID Indonesian national survey which revealed that
47% of the Bachelor‘s Degree holders were in the Maluku-Nusa Tenggara- Papua area.
However, the figure was not in line with the absenteeism study results which found that
only 14% of the teachers had Bachelor‘s Degrees. Looking at the discrepancy across
districts, this study found that Mimika, Jayawijaya, and Manokwari had a fewer number of
teachers with Bachelor‘s Degree qualifications than Sorong, Jayapura, and Biak.
50%
28%
22%
Tanah Papua
(Six Districts)
Bahasa Indonesia
Local Language
Other language
District
Teachers’ Native Language
Bahasa
Indonesia
Local
Language Others
Biak 48% 48% 4%
Jayapura 59% 19% 22%
Mimika 62% 18% 20%
Jayawijaya 19% 43% 38%
Manokwari 67% 2% 31%
Sorong 60% 15% 25%

3
49
Figure 3.20: Teachers’ Education Background
Not all of the teachers had attended pre-service training. Around 20% of the teachers never
attended such training. Jayawijaya and Manokwari have the highest percentage of teachers
who never received this type of training. Meanwhile, among those who claimed that they
had pre-service training, most of them revealed that they have PGSD/KPG training.
Figure 3.21: Pre-Service Training
In addition to the pre-service training, 68% of the teachers stated that they had attended
training programs to support their roles as teachers. Jayawijaya was the district with the
District
Teacher’s academic qualification
Junior High
School
Senior High
School Diploma
Bachelor’s
degree
Biak 0% 35% 15% 50%
Jayapura 0% 30% 12% 58%
Mimika 0% 21% 42% 37%
Jayawijaya 10% 47% 6% 37%
Manokwari 6% 34% 11% 49%
Sorong 2% 20% 4% 74%
2%
33%
17%
48%
Tanah Papua
(Six Districts)
Junior High School
Senior High School
Diploma
Bachelor‘s degree
District Received Pre-service Training
Yes No
Biak 93% 7%
Jayapura 82% 18%
Mimika 85% 15%
Jayawijaya 62% 38%
Manokwari 63% 37%
Sorong 79% 21%
If yes
District Type of Pre-service Training
PGSD/KPG Non PGSD
Biak 70% 30%
Jayapura 77% 23%
Mimika 68% 32%
Jayawijaya 31% 69%
Manokwari 63% 37%
Sorong 72% 28%
79%
21%
Received Pre-service Training
(Tanah Papua (Six Districts))
Yes
No64%
36%
Type of Pre-service Training
(Tanah Papua (Six districts))
PGSD/
KPG
Non
PGSD

3
50
lowest level of teacher training. Among the training programs that they had attended, the
2013 curriculum training, KKG training, and KTSP training were the ones most often
mentioned by the teachers. This finding reveals that teachers in rural and remote areas of
Papuan provinces have limited access to other/different professional development training
programs besides the new 2013 curriculum training.
Figure 3.22: Training to Support the Teachers’ Roles
In regards to a specific training program on how to teach reading, half of the teachers said
that they had never received it either during their pre-service training or after they became
a teacher. Compared to other districts, Sorong was the district with the lowest percentage
of teachers who claimed that they had previous training on how to teach reading.
68%
32%
Have attended training to support
their role as teacher
(Tanah Papua (Six Districts))
Yes
No
District
Have attended training to
support their role as teacher
Yes No
Biak 22% 78%
Jayapura 33% 67%
Mimika 25% 75%
Jayawijaya 45% 55%
Manokwari 33% 67%
Sorong 26% 74%
2%
3%
4%
4%
6%
7%
14%
15%
20%
40%
PAUD training
Training about students developing
Composing lesson plan training
Training about HIV and AIDS
Training from Dinas/ Institution/
Foundation
MBS training
Training about school lesson
KTSP training
KKG training
Implementation of curriculum 2013
School Course Training
(Tanah Papua (Six Districts)) District
Biak Jayapura Mimika Jayawijaya Manokwari Sorong
49% 38% 51% 23% 65% 41%
23% 41% 12% 3% 24% 22%
28% 10% 14% 10% 35% 6%
11% 5% 40% 13% 24% 6%
6% 8% 9% 7% 18% 0%
4% 5% 9% 10% 12% 0%
0% 8% 2% 7% 6% 6%
6% 3% 7% 3% 0% 3%
2% 0% 0% 7% 12% 6%
2% 3% 0% 3% 6% 0%

3
51
Figure 3.23: Training on How to Teach Reading
In terms of teacher certification, the majority of the teachers (72%) in this study were non-
certified teachers. Compared to the teacher absenteeism study (UNICEF et al., 2012), the
percentage was slightly higher as the study revealed that 79% of the teachers were non-
certified teachers. Jayapura and Jayawijaya had a slightly higher percentage of certified
teachers than the other four districts.
Figure 3.24: Teacher Certification
The employment status of the teachers varies across districts. However, at the aggregate
level, the proportion of civil servant teachers and honorary teachers was relatively in
balance, at 45% and 41%, respectively. Mimika and Manokwari have the lowest percentages
of civil servant teachers but the highest percentage of honorary teachers.
48% 52%
Tanah Papua
(Six Districts)
Yes
No
District
Training on how to teach
reading
Yes No
Biak 57% 43%
Jayapura 44% 56%
Mimika 52% 48%
Jayawijaya 44% 56%
Manokwari 58% 42%
Sorong 35% 65%
28%
72%
Certified as a Teacher
(Tanah Papua (Six Districts))
Yes
No
District Certified as a Teacher
Yes No
Biak 25% 75%
Jayapura 34% 66%
Mimika 23% 77%
Jayawijaya 34% 66%
Manokwari 23% 77%
Sorong 26% 74%

3
52
Figure 3.25: Teachers' Employment Status
In their daily activities as teachers, around half of them (56%) taught a multi-grade
classroom. Jayawijaya and Manokwari have more multi-grade classroom teachers than the
other districts. The main reason for a multi-grade classroom was due to a lack of teachers
(86%), although around 13% said that this was caused by the absences of their fellow
teachers.
Figure 3.26: Multi-Grade Teachers
With regards to lesson plans, only around half of the teachers in this study had and used
them when teaching. Biak has the highest percentage of teachers who had and used lesson
plans in teaching, while in contrast Jayawijaya has the lowest percentage.
45%
2%
41%
12%
Tanah Papua
(Six Districts)
Civil Servant
Permanent
teacher infoundation
Honorary
teacher
Others
District
Employment Status
Civil
Servant
Permanent
Teacher in
Foundation
Honorary
Teacher Others
Biak 52% 0% 42% 6%
Jayapura 53% 2% 42% 3%
Mimika 28% 2% 53% 17%
Jayawijaya 44% 4% 25% 27%
Manokwari 34% 2% 56% 8%
Sorong 68% 0% 25% 7%
*Others include volunteer teacher, helper teacher, SM3T teacher, etc.
District
Teaching Multiple Grade
Yes No
Biak 55% 45%
Jayapura 57% 43%
Mimika 36% 64%
Jayawijaya 70% 30%
Manokwari 67% 33%
Sorong 52% 48%
District
Reason for being a Multiple Grade Teacher
Slightly
number of
students
Lack of
teachers
Fellow teacher
is often absent
Biak 0% 97% 3%
Jayapura 3% 85% 12%
Mimika 0% 93% 7%
Jayawijaya 0% 67% 33%
Manokwari 0% 90% 10%
Sorong 0% 90% 10%
If yes
56%
44%
Teaching Multiple Grade
(Tanah Papua (Six Districts))
Yes
No
1%
86%
13%
Reason for being a Multiple Grade
Teacher
(Tanah Papua (Six Districts))
Slightly number of
students
Lack of teachers
Fellow teacher is
often absent
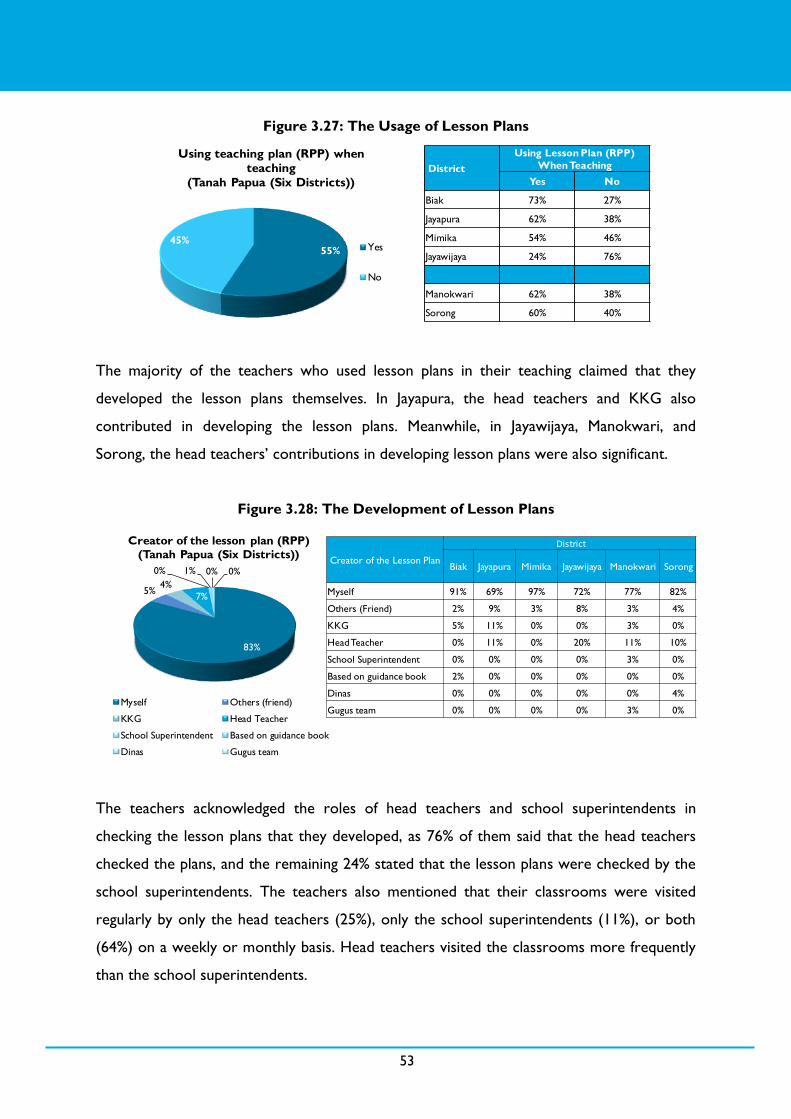
3
53
Figure 3.27: The Usage of Lesson Plans
The majority of the teachers who used lesson plans in their teaching claimed that they
developed the lesson plans themselves. In Jayapura, the head teachers and KKG also
contributed in developing the lesson plans. Meanwhile, in Jayawijaya, Manokwari, and
Sorong, the head teachers‘ contributions in developing lesson plans were also significant.
Figure 3.28: The Development of Lesson Plans
The teachers acknowledged the roles of head teachers and school superintendents in
checking the lesson plans that they developed, as 76% of them said that the head teachers
checked the plans, and the remaining 24% stated that the lesson plans were checked by the
school superintendents. The teachers also mentioned that their classrooms were visited
regularly by only the head teachers (25%), only the school superintendents (11%), or both
(64%) on a weekly or monthly basis. Head teachers visited the classrooms more frequently
than the school superintendents.
55% 45%
Using teaching plan (RPP) when
teaching
(Tanah Papua (Six Districts))
Yes
No
District
Using Lesson Plan (RPP)
When Teaching
Yes No
Biak 73% 27%
Jayapura 62% 38%
Mimika 54% 46%
Jayawijaya 24% 76%
Manokwari 62% 38%
Sorong 60% 40%
83%
5% 4%
7%
0% 1% 0% 0%
Creator of the lesson plan (RPP)
(Tanah Papua (Six Districts))
Myself Others (friend)
KKG Head Teacher
School Superintendent Based on guidance book
Dinas Gugus team
Creator of the Lesson Plan
District
Biak Jayapura Mimika Jayawijaya Manokwari Sorong
Myself 91% 69% 97% 72% 77% 82%
Others (Friend) 2% 9% 3% 8% 3% 4%
KKG 5% 11% 0% 0% 3% 0%
Head Teacher 0% 11% 0% 20% 11% 10%
School Superintendent 0% 0% 0% 0% 3% 0%
Based on guidance book 2% 0% 0% 0% 0% 0%
Dinas 0% 0% 0% 0% 0% 4%
Gugus team 0% 0% 0% 0% 3% 0%

3
54
Regarding student absenteeism, it seems that the students‘ attendance was not fully
registered by the teachers. This baseline study reveals that 15% of the teachers did not have
a student attendance list. Jayawijaya and Manokwari even have higher percentages of
teachers who did not have a student attendance list. Among the teachers who had
attendance lists, the majority of them had a daily record completion - although a number of
them only completed the attendance list on a weekly or bi-weekly basis.
Figure 3.29: Student Attendance List
The time spent to read in the classroom varied across districts. Only around one third of
the teachers stated that they spent almost an hour on it, while the remaining two thirds
spent from 10 to 50 minutes. Sorong and Jayapura have the highest percentages of teachers
who said that they spent 50-60 minutes for reading class.
District
The Student’s Attendance Registration
Register was
not available to
be examined
Attendance
records were
completed daily
Attendance records
were completed
weekly
Attendance records
were completed
biweekly
Attendance records
were completed
monthly
Biak 3% 91% 4% 2% 0%
Jayapura 17% 83% 0% 0% 0%
Mimika 12% 82% 2% 2% 2%
Jayawijaya 24% 76% 0% 0% 0%
Manokwari 23% 77% 0% 0% 0%
Sorong 16% 81% 3% 0% 0%
16%
82%
1% 1% 0%
Register was not
available to beexamined
Attendance records
were completeddaily
Attendance records
were completedweekly
Attendance records
were completedbiweekly
Attendance records
were completedmonthly
Tanah Papua
(Six Districts)

3
55
Figure 3.30: Time Spent for Reading in Class
The majority of teachers (77%) said that they used reading materials from the Bahasa
Indonesia course textbook of the KTSP 2006 curriculum to teach the students reading.
Meanwhile, for those who used other reading materials, they mentioned other course
textbooks or story books as their teaching media.
Figure 3.31: Reading Materials
District
Time Spent for Reading in The Class
0 - 10
minutes
11 - 20
minutes
21 - 30
minutes
31 - 40
minutes
41 - 50
minutes
51 - 60
minutes
Biak 18% 20% 23% 4% 0% 35%
Jayapura 3% 21% 28% 7% 0% 41%
Mimika 18% 25% 27% 4% 2% 24%
Jayawijaya 35% 12% 17% 3% 1% 32%
Manokwari 15% 28% 18% 3% 4% 32%
Sorong 7% 16% 22% 4% 0% 51%
17% 20%
23%
4% 2%
34%
0 - 10 minutes 11 - 20 minutes 21 - 30 minutes 31 - 40 minutes 41 - 50 minutes 51 - 60 minutes
Tanah Papua
(Six Districts)
77%
23%
Reading material in
Indonesian textbook
Other reading book
material
Tanah Papua
(Six Districts) District
Reading Materials Used in Class
Reading materials
in Indonesian
textbook
Other reading
book material
Biak 84% 16%
Jayapura 70% 30%
Mimika 67% 33%
Jayawijaya 84% 16%
Manokwari 89% 11%
Sorong 94% 6%

3
56
Looking at the district level, Mimika and Jayapura have the highest level of usage of other
reading book materials which might consist of other course textbooks, story books, special
reading books, religious books, or books received from foundations or organisations. In
terms of story books, Jayapura has the highest percentage of schools which use story books
as the medium for reading lessons.
Figure 3.32: Other Reading Book Materials
The students‘ academic progress was measured in various ways. Written tests and
homework were mostly mentioned, and then followed by oral evaluations. This pattern was
relatively consistent across districts.
44%
26% 22%
5% 3%
Other courses
textbook
Storybook Special reading
book
Religion book Books from
foundation/organization
Tanah Papua
(Six Districts)
District
Other Reading Book Material
Other courses
textbook Storybook
Special
reading book Religion book
Books from
foundation/
organization
Biak 70% 0% 20% 0% 10%
Jayapura 51% 45% 0% 4% 0%
Mimika 39% 18% 27% 8% 8%
Jayawijaya 24% 24% 52% 0% 0%
Manokwari 33% 33% 17% 17% 0%
Sorong 0% 0% 100% 0% 0%

3
57
Figure 3.33: Measurement of Students’ Academic Progress
According to the teachers in this study, evaluations of students‘ academic progress,
especially oral and written assessments, were used mainly to rank the students. In addition,
the assessments were also used to evaluate students‘ understanding of the subjects and to
adapt teaching methods to better suit the students‘ needs.
31%
22%
4%
26%
1% 7% 8%
2% 1%
Written
tests
Oral
evaluation
Portfolios
and otherprojects
Homework Debate/
participation
Worksheets End-of-term
evaluation
Classroom
ObservationForm
Others
Tanah Papua
(Six Districts)
District
Measurement the student’s academic progress
Written
tests
Oral
evaluations
Portfolios
and other
projects
Homework Debate/
participation Worksheets
End-of-
term
evaluation
Classroom
Observation
Form
Others
Biak 30% 20% 2% 30% 1% 8% 7% 1% 1%
Jayapura 31% 17% 7% 25% 2% 9% 8% 1% 0%
Mimika 26% 19% 4% 23% 2% 9% 11% 4% 2%
Jayawijaya 35% 27% 2% 28% 0% 3% 3% 1% 1%
Manokwari 32% 28% 2% 18% 0% 5% 11% 2% 2%
Sorong 33% 31% 3% 23% 0% 2% 4% 2% 2%

3
58
Figure 3.34: The Usage of Oral and Written Assessments
Besides asking the teachers about the assessments or an evaluation of the students‘
academic achievements, this baseline study also covered the teachers‘ attention to unusual
behavior conducted by their students. Surprisingly, around 45% of teachers admitted that
some of their students had these experiences. Biak was the district with the highest
percentage of teachers who noticed unusual behavior. According to the teachers, the
unusual behavior of the students was caused by the students being victims of violence at
home or encountering violence/bullying at school. Looking at the district level, the major
cause of the unusual behavior in Jayapura and Mimika was violence at home. Meanwhile, Biak
and Jayawijaya tend to have a higher rate of violence at school. When the teachers found
out that the unusual behavior was due to violence, the majority of them claimed that they
consulted the problem to the head teacher or talked directly to the parents.
40%
25%
8% 13% 13%
2%
Rank the students Evaluate students‘ understanding of
subject matter
Plan teaching
activities
Adapt teaching to better suit students‘
needs
Report to parents Material for
conducting classactivities research
How do teachers use results of oral & written assessments
(Tanah Papua (Six Districts))
District
How do teachers use results of oral & written assessments
Rank
the
students
Evaluate students’
understanding of
subject matter
Plan
teaching
activities
Adapt teaching
to better suit
students’ needs
Report to
parents
Material for
conducting class
activities research
Biak 27% 28% 8% 14% 22% 1%
Jayapura 38% 26% 10% 10% 12% 4%
Mimika 40% 19% 11% 19% 10% 1%
Jayawijaya 69% 18% 4% 4% 4% 1%
Manokwari 44% 28% 2% 14% 6% 6%
Sorong 28% 42% 2% 3% 23% 2%

3
59
Figure 3.35: Unusual Behavior of Students and the Causes
Figure 3.36: Teacher Action towards a Violence Victim Student
7%
18%
21%
27%
27%
Others
Sick
Less attention from parents
Being a violence/ bullying victim at
school
Being a violence victim at home
Causes of the student’s behavior change
(Tanah Papua (Six Districts))
45%
51%
4%
Unusual Behavior of Students
(Tanah Papua (Six Districts))
Yes
No
I don't pay
attention
District
Unusual Behavior of Students
Yes No I don’t pay
attention
Biak 65% 32% 3%
Jayapura 38% 62% 0%
Mimika 36% 59% 5%
Jayawijaya 44% 51% 5%
Manokwari 41% 55% 4%
Sorong 36% 48% 16%
District
Causes of the student’s behavior change
Being a violence
victim at home
Being a violence/
bullying victim at
school
Sick Less attention
from parents Others
Biak 20% 35% 16% 22% 8%
Jayapura 46% 19% 19% 8% 8%
Mimika 43% 11% 26% 15% 5%
Jayawijaya 10% 45% 10% 31% 4%
Manokwari 13% 30% 28% 17% 12%
Sorong 16% 9% 6% 59% 10%
41%
3% 3%
33%
2% 5%
2%
12%
Discussing this
matter withhead teacher
Discussing this
matter withpastor
Discussing this
matter withtraditional
leaders
Discussing this matter with
student‘s parents
Discussing this
matter withanother teacher
Giving a moral
support to child
Helping to save
the child
None
Tanah Papua
(Six Districts)
District
Teacher’s action to a violence victim student
Discussing
this matter
with head
teacher
Discussing
this matter
with pastor
Discussing this
matter with
traditional
leaders
Discussing this
matter with
student’s
parents
Discuss this
matter with
another
teacher
Give a
moral
support to
child
Help to
save the
child
None
Biak 38% 1% 1% 39% 1% 6% 1% 13%
Jayapura 36% 5% 4% 38% 0% 2% 0% 15%
Mimika 45% 2% 4% 26% 2% 5% 3% 13%
Jayawijaya 56% 3% 3% 16% 3% 8% 3% 8%
Manokwari 43% 0% 1% 48% 1% 0% 1% 6%
Sorong 26% 1% 4% 42% 0% 6% 5% 16%

3
60
In terms of parental role in supporting student learning at home, the teachers in this study
believed that the parents accompanied their children while they were studying at home and
also checked their homework. However, some teachers were not really sure whether the
parents supported their children's learning at home, as shown in Figure 3.37.
Figure 3.37: Parental Support of their Children Based on Teachers’ Perspectives
Despite their beliefs regarding parental support, the majority of the teachers were still
dissatisfied with that support, except for the teachers in Biak District.
31%
6%
20%
9% 5% 5%
2% 4% 2%
14%
Accompanyingkids study at
home
Assisting kids inexam
preparation
Examining kid‘s homework
Ensuring kidshave breakfastbefore they go
to school
Listening totheir complaintsor stories that
related toschool
Communicatingabout
development of
kids withteacher
Bringing thechild to school
None Others Don't know
Tanah Papua
(Six Districts)
District
Parents support given to their kids for their learning activity
Accompanying
kids study at
home
Assisting
kids in exam
preparation
Examine
kid‘s
homework
Ensure kids
having
breakfast
before they
go to school
Listening to
their
complaints or
stories that
related to
school
Communicate
about
development of
kids with
teacher
Bringing the
child to
school
None Others Don't
know
Biak 30% 8% 21% 13% 12% 8% 1% 0% 4% 3%
Jayapura 34% 6% 27% 6% 3% 7% 0% 5% 0% 12%
Mimika 26% 8% 21% 9% 1% 3% 4% 6% 2% 20%
Jayawijaya 36% 1% 11% 9% 3% 1% 7% 6% 3% 23%
Manokwari 39% 4% 17% 6% 7% 4% 1% 1% 0% 21%
Sorong 34% 5% 13% 4% 2% 6% 4% 5% 6% 21%

3
61
Figure 3.38: Satisfaction towards Parental Support
In addition to the teachers' dissatisfaction of parental support, dissatisfaction towards the
Education Office‘s support was also identified in this study. Less than 10% of teachers said
that DINAS Pendidikan (the District Education Office – if not explained before) paid enough
attention to their request for support. Almost half of them stated that Dinas never
responded to their requests. Jayapura and Manokwari have the highest percentage of
teachers who said that Dinas never paid attention to their requests.
Figure 3.39: Availability of Dinas’ Support
District
Satisfied with Parent’s
Involvement in their
Children’s Homework
Yes No
Biak 67% 33%
Jayapura 34% 66%
Mimika 20% 80%
Jayawijaya 45% 55%
Manokwari 29% 71%
Sorong 35% 65%
40%
60%
Satisfied with Parent’s
Involvement in their Children’s
Homework
(Tanah Papua (Six Districts))
Yes
No
District
Responsiveness of Dinas to Support
School/ Teacher Request
Always Sometimes Never
Biak 7% 55% 38%
Jayapura 2% 36% 62%
Mimika 8% 51% 41%
Jayawijaya 8% 54% 38%
Manokwari 6% 33% 61%
Sorong 17% 51% 32%
7%
48%
45%
Responsiveness of Dinas to
Support School/ Teacher Request
(Tanah Papua (Six Districts))
Always
Sometimes
Never
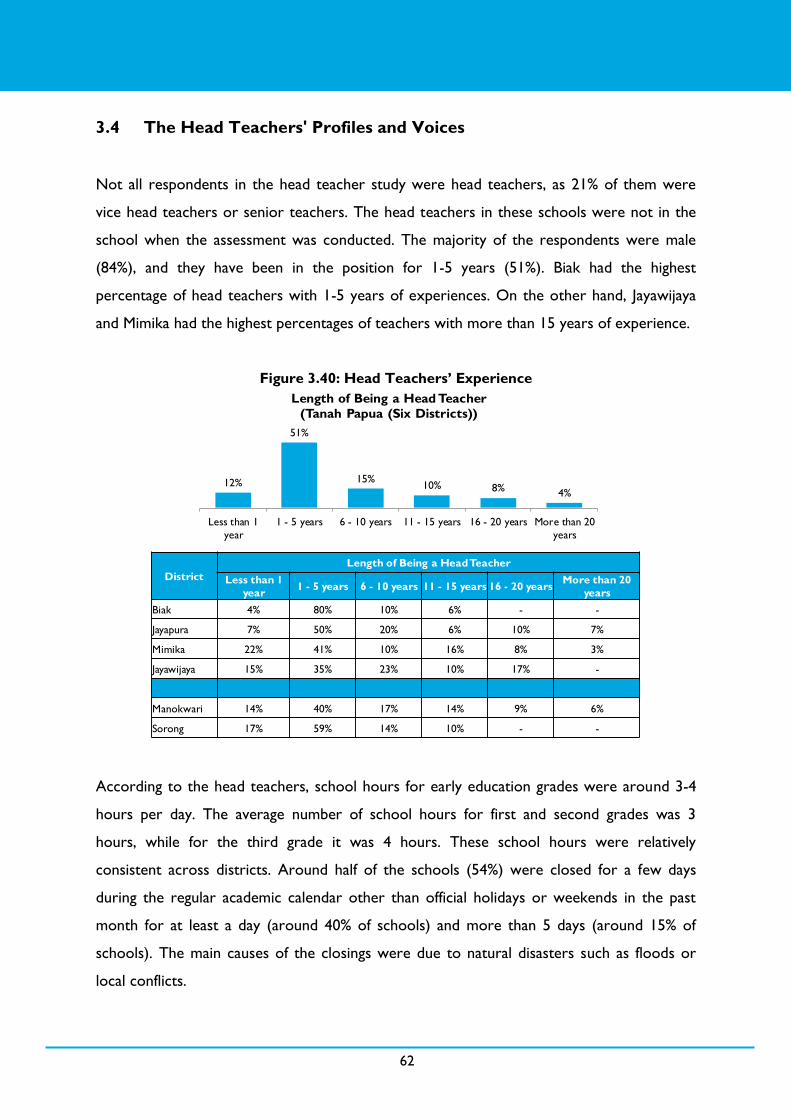
3
62
3.4 The Head Teachers' Profiles and Voices
Not all respondents in the head teacher study were head teachers, as 21% of them were
vice head teachers or senior teachers. The head teachers in these schools were not in the
school when the assessment was conducted. The majority of the respondents were male
(84%), and they have been in the position for 1-5 years (51%). Biak had the highest
percentage of head teachers with 1-5 years of experiences. On the other hand, Jayawijaya
and Mimika had the highest percentages of teachers with more than 15 years of experience.
Figure 3.40: Head Teachers’ Experience
According to the head teachers, school hours for early education grades were around 3-4
hours per day. The average number of school hours for first and second grades was 3
hours, while for the third grade it was 4 hours. These school hours were relatively
consistent across districts. Around half of the schools (54%) were closed for a few days
during the regular academic calendar other than official holidays or weekends in the past
month for at least a day (around 40% of schools) and more than 5 days (around 15% of
schools). The main causes of the closings were due to natural disasters such as floods or
local conflicts.
District
Length of Being a Head Teacher
Less than 1
year 1 - 5 years 6 - 10 years 11 - 15 years 16 - 20 years
More than 20
years
Biak 4% 80% 10% 6% - -
Jayapura 7% 50% 20% 6% 10% 7%
Mimika 22% 41% 10% 16% 8% 3%
Jayawijaya 15% 35% 23% 10% 17% -
Manokwari 14% 40% 17% 14% 9% 6%
Sorong 17% 59% 14% 10% - -
12%
51%
15% 10% 8%
4%
Less than 1
year
1 - 5 years 6 - 10 years 11 - 15 years 16 - 20 years More than 20
years
Length of Being a Head Teacher
(Tanah Papua (Six Districts))

3
63
Head teachers said that 48% of their teachers had Bachelor‘s Degrees, and 50% had
Associate Degrees or were senior high school graduates, and the remaining 2% were junior
high school graduates. This finding is relatively consistent with the teacher study findings.
Jayawijaya and Manokwari have the highest percentages of teachers who are junior and
senior high school graduates, at 38% and 35% respectively.
The majority of the schools (around 90%) had one second or third grade teacher, and very
few schools (around 8%) had more than one teacher for each grade. In addition, 43% of the
studied schools had one classroom consisting of second and third grade students and taught
by one teacher. This study also found a low percentage of the studied schools (less than
10%) did not have second and third grade teachers.
Figure 3.41: Number of Teachers for Second and Third Grades
When the teachers were absent without any notice, the majority (50%) of the head teachers
said that they gave them an oral warning, while around 30% did nothing about it. Written
and other formal punishment measures were rarely implemented.
District
Number of Teachers
Grade 2 Grade 3 Grade 2 &
Grade 3
None 1 2 - 3 4 - 5 > 5 None 1 2 - 3 4 - 5 > 5 None 1
Biak 97% 3% - - - 97% 3% - - 60% 40%
Jayapura 3% 87% 7% 3% - - 90% 10% - - 51% 49%
Mimika 7% 66% 24% 3% - - 83% 14% 3% - 59% 41%
Jayawijaya 7% 87% 6% - - 7% 90% 3% - - 66% 34%
Manokwari 3% 94% 3% - - 10% 90% - - - 54% 46%
Sorong 7% 90% 3% - - - 97% 3% - - 50% 50%
4% 3%
57%
86% 90%
43%
8% 6% 0% 2% 1% 0% 0% 0% 0%
Grade 2 Grade 3 Grade 2 & Grade 3
Tanah Papua
(Six Districts)
None
1
2-3
4-5
More than 5
District
Number of Teachers
Grade 2 Grade 3 Grade 2 &
Grade 3
None 1 2 - 3 4 - 5 > 5 None 1 2 - 3 4 - 5 > 5 None 1
Biak 97% 3% - - - 97% 3% - - 60% 40%
Jayapura 3% 87% 7% 3% - - 90% 10% - - 47% 53%
Mimika 7% 66% 24% 3% - - 83% 14% 3% - 59% 41%
Jayawijaya 7% 87% 6% - - 7% 90% 3% - - 66% 34%
Manokwari 3% 94% 3% - - 10% 90% - - - 54% 46%
Sorong 7% 90% 3% - - - 97% 3% - - 50% 50%

3
64
Figure 3.42: Head Teacher Responses to Teacher Absenteeism
The head teachers admitted that they had to make a quick decision on how to handle a
classroom if the teacher did not come. The majority of them (47%) said that teachers from
other classrooms would take over the class, or the head teacher handled the classroom
him/herself (35%). Meanwhile, there were also a number of classrooms that were without
any replacement at all. Looking at the district level, Manokwari had the highest percentage
of schools that combined the students into one classroom as a way to overcome the
teacher absences.
50%
3% 1% 0%
27%
16%
3%
OralWarning
WrittenWarning
WrittenReport
to UPTD
Downgrading inPerformance
Appraisal
DoingNothing
Teacherneverabsent
Givingpunishment
Head Teacher Response to Teacher Who is Absent Without Permission
(Tanah Papua (Six Districts))
Head Teacher Response to Teacher
Who is Absent Without Permission Biak Jayapura Mimika Jayawijaya Manokwari Sorong
Oral Warning 43% 34% 59% 59% 50% 57%
Written Warning - - - - 3% 17%
Written Report to UPTD - - - - 3% -
Downgrading in Performance Appraisal - - - - - -
Doing Nothing 43% 33% 41% - 27% 13%
Teacher never absent - 33% - 41% 10% 13%
Giving punishment 14% - - - 7% -

3
65
Figure 3.43: Action Taken for a Classroom without a Teacher
In terms of the curriculum that was implemented, the majority of the head teachers said
that their schools implemented the KTSP 2006 curriculum. Only a small percentage of them
implemented the 2013 curriculum. Jayapura, Biak, Manokwari, and Sorong have schools that
implemented the 2013 curriculum. In contrast, there was also a small percentage of schools
in Jayawijaya that still implemented the 2004 curriculum.
Figure 3.44: Types of Curriculum Implemented
The availability of textbooks for students was considered as a problem by 33% of the head
teachers in this study. The schools did not have enough textbooks for all grades (22%) or
4%
47%
29%
1% 1% 1% 4%
35%
2% 1%
Let the classproceedwithout
a teacher
Allocate thatclass
to anotherteacher
Join allstudents
in one class
Bring in extrateacher
(from outsideschool)
Dismissstudents
for the day
Send childrento play
Distributechildrenamongother
classrooms
HeadTeachertake over
theclassroom
Givestudents
work to do
Movestudents
to the library
Head Teacher Action If The Teacher is Absent
(Tanah Papua (Six Districts))
Head Teacher Action If The Teacher is
Absent Biak Jayapura Mimika Jayawijaya Manokwari Sorong
Let the class proceed without a teacher 3% - - 3% - 13%
Allocate that class to another teacher 57% 60% 31% 66% 27% 43%
Join all students in one class 17% 23% 21% 34% 60% 17%
Bring in extra teacher (from outside school) - - - 3% - -
Dismiss students for the day 3% - - - 3% -
Send children to play - - - 7% - -
Distribute children among other classrooms 3% - - 10% 10% -
Head Teacher take over the classroom 43% 20% 59% 14% 27% 47%
Give students work to do - 7% - - - 3%
Move students to the library - 3% - - - -
4%
95%
1%
Tanah Papua
(Six Districts)
Curriculum
2013
KTSP 2006
Curriculum
2004
District
Curriculum Implemented
Curriculum
2013 KTSP 2006
Curriculum
2004
Biak 7% 93% -
Jayapura 13% 87% -
Mimika - 100% -
Jayawijaya - 97% 3%
Manokwari 3% 97% -
Sorong 3% 97% -

3
66
the books were enough for certain grades only. Jayawijaya had a serious problem with the
availability of textbooks, as 52% of the schools stated that they did not have enough
textbooks for their students.
Figure 3.45: Textbook Availability
School facilities were also discussed with the head teachers during the interviews. On
average, almost half of the studied schools admitted that they did not have a library, with
Jayapura as the exception as 80% of schools in Jayapura said that they had it. However,
among the schools which had a library, almost one third did not have enough and
appropriate books. Moreover, 40% of schools with a library did not allow their early grade
students to read or borrow the books.
22%
67%
11%
School Has the Appropriate
Number of Textbooks for
Students
(Tanah Papua (Six Districts)
No
Yes for all grade
Yes, only for
some grade
District
School Has the Appropriate Number of
Textbooks for Students
No Yes for all grade Yes, only for some
grade
Biak 20% 57% 23%
Jayapura 20% 73% 7%
Mimika 7% 93% -
Jayawijaya 38% 48% 14%
Manokwari 30% 50% 20%
Sorong 20% 77% 3%

3
67
Figure 3.46: Library Availability
When asked about a reading corner for early graders, the majority of the head teachers
(77%) said that they did not have it. Even the majority of Jayapura schools did not have this
reading facility for the early grade students.
Figure 3.47: Reading Corner Availability
Although the studied schools were located in rural and remote areas of Papuan provinces,
the existence of a school committee was relatively good as the majority of schools already
had it (79% of the studied schools had a school committee). However, the head teachers
were not fully satisfied with the contributions of the school committees.
47% 53%
The School Has a Library
(Tanah Papua (Six Districts))
Yes
No
District
The School Has a
Library
Yes No
Biak 53% 47%
Jayapura 80% 20%
Mimika 41% 59%
Jayawijaya 48% 52%
Manokwari 13% 87%
Sorong 43% 57%
78%
22%
There are Books at Library
(Tanah Papua (Six Districts))
Yes
No
District
There are Books at
Library
Yes No
Biak 56% 44%
Jayapura 92% 8%
Mimika 83% 17%
Jayawijaya 93% 7%
Manokwari 50% 50%
Sorong 85% 15%
23%
77%
The School Has a Reading
Corner
(Tanah Papua (Six Districts))
Yes
No
District
The School Has a Reading
Corner
Yes No
Biak 30% 70%
Jayapura 33% 67%
Mimika 24% 76%
Jayawijaya 21% 79%
Manokwari 20% 80%
Sorong 40% 60%

3
68
Figure 3.48: Satisfaction with the Contributions of School Committees
In addition, the head teachers in this study also received insufficient support from the school
superintendents. According to one third of the head teachers, they were not visited by the
school superintendents in the past year, while another one third of the schools received less
than one visit per year.
Figure 3.49: Number of Visits from School Superintendents
Safety is another challenge that a quarter of the head teachers faced in this study. Jayapura,
Manokwari, and Mimika have higher percentages of head teachers who considered safety as
59%
41%
Satisfied With the Level of
Support from The
Committee
(Tanah Papua (Six Districts)
Yes
No
District
Satisfied With the Level of
Support from The Committee
Yes No
Biak 64% 36%
Jayapura 43% 57%
Mimika 74% 26%
Jayawijaya 76% 24%
Manokwari 53% 47%
Sorong 41% 59%
District
The Number of Inspection or Support Visit From The School
Superintendents
Never Once a
year
Less than
once a month
Once a
month
Once every
week
Biak 7% 40% 37% 9% 7%
Jayapura 27% 50% 10% 3% 10%
Mimika 41% 31% 24% 4% -
Jayawijaya 28% 41% 31% - -
Manokwari 50% 30% 17% 3% -
Sorong 43% 40% 11% 3% 3%
33% 39%
21%
4% 3%
Never Once a year Less than once a
month
Once a month Once every week
Tanah Papua
(Six Districts)
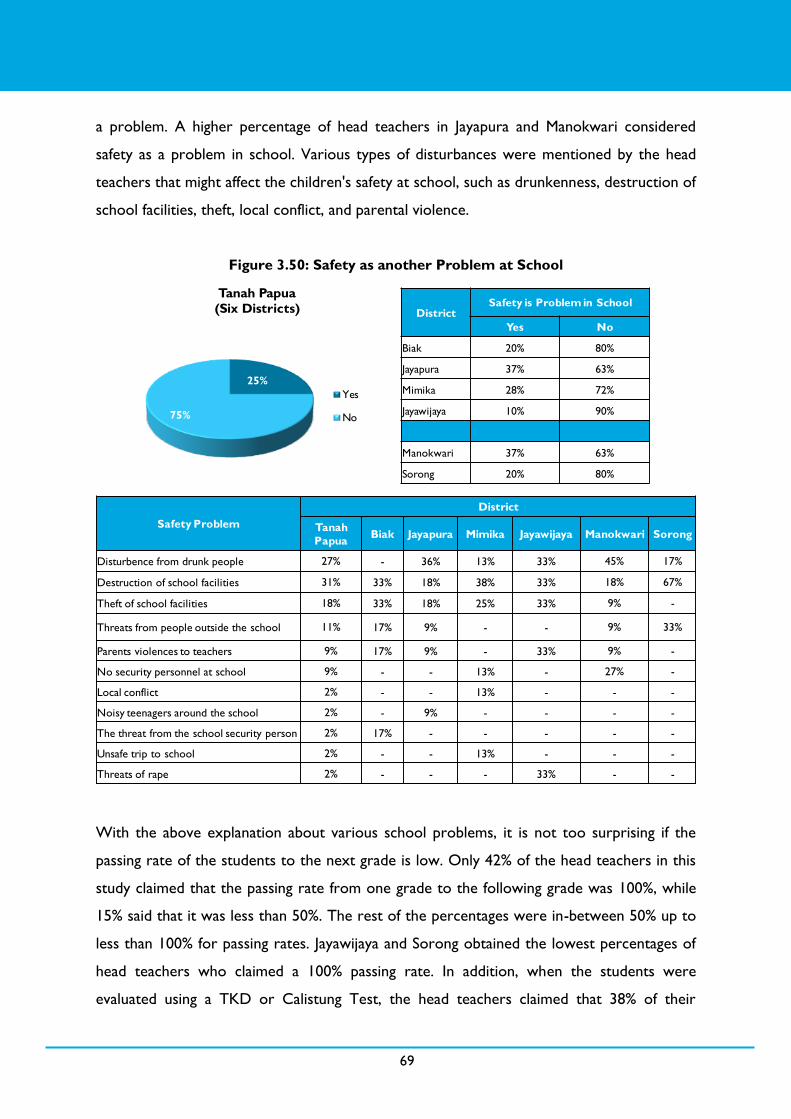
3
69
a problem. A higher percentage of head teachers in Jayapura and Manokwari considered
safety as a problem in school. Various types of disturbances were mentioned by the head
teachers that might affect the children's safety at school, such as drunkenness, destruction of
school facilities, theft, local conflict, and parental violence.
Figure 3.50: Safety as another Problem at School
With the above explanation about various school problems, it is not too surprising if the
passing rate of the students to the next grade is low. Only 42% of the head teachers in this
study claimed that the passing rate from one grade to the following grade was 100%, while
15% said that it was less than 50%. The rest of the percentages were in-between 50% up to
less than 100% for passing rates. Jayawijaya and Sorong obtained the lowest percentages of
head teachers who claimed a 100% passing rate. In addition, when the students were
evaluated using a TKD or Calistung Test, the head teachers claimed that 38% of their
25%
75%
Tanah Papua
(Six Districts)
Yes
No
District Safety is Problem in School
Yes No
Biak 20% 80%
Jayapura 37% 63%
Mimika 28% 72%
Jayawijaya 10% 90%
Manokwari 37% 63%
Sorong 20% 80%
Safety Problem
District
Tanah
Papua Biak Jayapura Mimika Jayawijaya Manokwari Sorong
Disturbence from drunk people 27% - 36% 13% 33% 45% 17%
Destruction of school facilities 31% 33% 18% 38% 33% 18% 67%
Theft of school facilities 18% 33% 18% 25% 33% 9% -
Threats from people outside the school 11% 17% 9% - - 9% 33%
Parents violences to teachers 9% 17% 9% - 33% 9% -
No security personnel at school 9% - - 13% - 27% -
Local conflict 2% - - 13% - - -
Noisy teenagers around the school 2% - 9% - - - -
The threat from the school security person 2% 17% - - - - -
Unsafe trip to school 2% - - 13% - - -
Threats of rape 2% - - - 33% - -

3
70
students obtained good results. The remaining 62% of the students obtained average or low
scores. On the other hand, only 5% of schools stated that they did not do the test. Sorong
had the highest percentage of schools which never had a TKD or Calistung Test.
Figure 3.51: Results of the TKD/Calistung Test According to Head Teachers
Despite the challenges in managing the schools, the head teachers claimed that they had
developed a proper plan and budget for school activities. Around two thirds of the head
teachers stated that they had the RKS. However, when the assessors requested to see the
RKS, 40% of the head teachers were unwilling to show it. Mimika, Jayawijaya, Manokwari,
and Sorong have smaller percentages of head teachers who said that they had the RKS as
compared to Biak and Jayapura. Among the head teachers who said that they had the RKS,
the majority of them (66%) claimed that they developed the RKS by themselves. The head
teachers also acknowledged other parties‘ roles in developing the RKS. Teachers and school
committees were also involved in the development of the RKS. In a few cases, even parents
were also involved.
District
Student’s Achievement are Measured by TKD/ CALISTUNG Test
Good Medium Poor School didn’t do TKD,
CALISTUNG
Biak 20% 63% 17% -
Jayapura 57% 7% 29% 7%
Mimika 55% 17% 24% 4%
Jayawijaya 34% 48% 14% 4%
Manokwari 30% 40% 27% 3%
Sorong 30% 20% 33% 17%
38% 33%
24%
5%
Good Medium Poor School didn‘t do TKD, CALISTUNG
Student’s Achievement are Measured by TKD/ CALISTUNG Test
(Tanah Papua (Six Districts))

3
71
Figure 3.52: The Usage of RKS at Schools
In addition to the RKS, the majority of head teachers (68%) also stated that they had the
2014/2015 RAPBS/RKAS. Four districts in Papua have higher percentages of head teachers
who said that they had it. Almost all head teachers (95%) claimed that the RAPBS/RKAS was
used as their guideline in implementing school activities.
Figure 3.53: The Usage of RAPBS/RKAS at Schools
To enhance the school and teacher capabilities, involvement in KKG and KKKS was
mentioned by the majority of the head teachers. Biak is the district with the highest school
involvement in KKG. In addition, in-house training and other training programs were also
named as activities to enhance their capabilities.
67%
33%
Tanah Papua
(Six Districts)
Yes
No
District The Schools has RKS
Yes No
Biak 90% 10%
Jayapura 80% 20%
Mimika 69% 31%
Jayawijaya 66% 34%
Manokwari 57% 43%
Sorong 43% 57%
68%
32%
The School Has
a RAPBS/ RKAS TA
2014/2015
(Tanah Papua (Six Districts))
Yes
No
District
The School Has a RAPBS/ RKAS
TA 2014/2015
Yes No
Biak 90% 10%
Jayapura 70% 30%
Mimika 72% 28%
Jayawijaya 69% 31%
Manokwari 60% 40%
Sorong 47% 53%

3
72
Figure 3.54: Ways to Develop School Capabilities
3.5 School Infrastructure and Facilities
Observations of school conditions specifically in any structural repairs needed show that
around 61% of schools visited were in need of some major repairs. Manokwari and Mimika
were found to have the largest number of schools that needed some major repairs. On the
other hand, Sorong had the fewest number of schools that needed major repairs (37%). The
most common repair needed was the school roof or ceiling (61%), followed by broken
windows (52%).
69%
28% 34%
18%
1% 8%
Active in KKG Active in KKS In-house training Direction/guidancefrom superintendents
Training from LPMAK None
Tanah Papua
(Six Districts)
Ways to Develop Teacher and
School’s Capabilities Biak Jayapura Mimika Jayawijaya Manokwari Sorong
Active in KKG 97% 70% 34% 66% 83% 60%
Active in KKS 40% 43% 14% 31% 17% 23%
In-house training 20% 40% 66% 38% 20% 20%
Direction/guidance from superintendents 17% 30% 10% 24% 17% 10%
Training from LPMAK - - 3% - - -
None - 16% 14% 3% 6% 7%

3
73
Figure 3.55: Major Repairs Needed
Overall, from the 180 schools sampled, around 63% of the schools were considered clean
and tidy. At the district level, Jayapura has the cleanest and tidiest schools, whereas
Manokwari and Biak are considered to have the least.
Figure 3.56: School Cleanliness and Tidiness
The majority of the schools (76%) had toilets on the school grounds, although around 22%
of them were toilets that were out in the open, without closed doors. For those schools
that did have toilets (either closed or open toilets), an observation of toilet cleanliness
showed that around half (52%) were considered fairly clean, and some others were also
considered very clean (12%), whereas the rest were considered as being not clean at all
Major Repair Needed Tanah
Papua Biak Jayapura Mimika Jayawijaya Manokwari Sorong
Broken Window 32% 13% 40% 50% 23% 57% 7%
Celling or Roof 37% 30% 53% 50% 37% 40% 10%
Classroom Walls 28% 27% 33% 33% 30% 37% 7%
School Walls 21% 23% 7% 33% 30% 30% 3%
Playground 29% 23% 27% 33% 27% 60% 7%
61% 57%
67% 70%
60%
77%
37%
Tanah Papua Biak Jayapura Mimika Jayawijaya Manokwari Sorong
School With Some Major Repairs Needed
Major Repair Needed Tanah Papua
(Six Districts) Biak Jayapura Mimika Jayawijaya Manokwari Sorong
Broken Window 53% 24% 60% 71% 39% 78% 18%
Celling or Roof 61% 59% 80% 71% 61% 52% 27%
Classroom Walls 47% 47% 50% 48% 50% 52% 27%
School Walls 39% 47% 10% 52% 50% 44% 27%
Playground 51% 47% 40% 52% 44% 83% 18%
63%
37%
Tanah Papua
(Six Districts)
Yes
No
District School is clean and Tidy
Yes No
Biak 57% 43%
Jayapura 77% 23%
Mimika 70% 30%
Jayawijaya 57% 43%
Manokwari 53% 47%
Sorong 63% 37%

3
74
(36%). The availability of running water in the bathrooms was found only in about 54% of
schools with toilets, which suggests that the rest did not have any water in the bathrooms
which the students could use. At the district level, there was a higher percentage of schools
in Mimika that had no toilets compared to the other five districts.
Figure 3.57: Toilet Availability and Conditions
In terms of other sources of water, only a total of 57% of the sampled schools were found
to have any clean water sources on the school grounds. At the district level, up to 93% of
schools in Jayawijaya did not have any clean water sources on the school grounds. Mimika
was another district with a high number of schools that did not have any clean water
sources. Even so, not all of these schools with water sources had water running or flowing
through them. During the school visits, only around 70% of schools that had water sources
had water available from those sources.
36%
52%
12%
Cleanliness of toilets
(Tanah Papua (Six Districts))
Not clean at all
Fairly clean
Very Clean
54% 22%
24%
Availability of toilets
(Tanah Papua (Six Districts))
Closed Toilets
Open Toilets
No Toilets
46% 54%
Availability of water in
toilets
(Tanah Papua (Six Districts))
Yes
No
District
Availability of toilets
Closed
Toilets
Open
Toilets
No
Toilets
Biak 77% 13% 10%
Jayapura 37% 50% 13%
Mimika 27% 20% 53%
Jayawijaya 67% 3% 30%
Manokwari 67% 13% 20%
Sorong 53% 30% 17%
District
Cleanliness of Toilets
Not clean
at all
Fairly
clean
Very
clean
Biak 37% 52% 11%
Jayapura 19% 50% 31%
Mimika 21% 72% 7%
Jayawijaya 48% 52% 0%
Manokwari 46% 50% 4%
Sorong 40% 44% 16%
District
Availability of
water in toilets
Yes No
Biak 56% 44%
Jayapura 62% 38%
Mimika 50% 50%
Jayawijaya 38% 62%
Manokwari 17% 83%
Sorong 52% 48%

3
75
Figure 3.58: Availability of Clean Water
In this baseline study, in total only 44% of schools were found to have libraries. At the
district level, Jayapura was found to have the largest number of schools with a library, while
Manokwari had the least number of schools with a library with only 7%. During the school
visits, it was observed that while some of these schools did have libraries, not all of them
were used by the students. Only about 31% of these libraries were used by the children
during the visit.
43% 57%
Availability of Clean water
Sources in School
(Tanah Papua (Six Districts))
Yes
No70%
30%
Functioning water sources
(during visit)
(Tanah Papua (Six Districts))
Yes
No
District
Availability of Clean water
Sources in School
Yes No
Biak 57% 43%
Jayapura 60% 40%
Mimika 30% 70%
Jayawijaya 7% 93%
Manokwari 40% 60%
Sorong 63% 37%
District
Functioning water sources
(during visit)
Yes No
Biak 76% 24%
Jayapura 67% 33%
Mimika 56% 44%
Jayawijaya 0% 100%
Manokwari 67% 33%
Sorong 84% 16%

3
76
Figure 3.59: Library Availability and Usage
The availability of electricity was also checked in this baseline study, which shows that only
33% of schools had electricity and were functioning during the visit. The rest of the schools
either were not connected to the electricity grid at all (44%) or had electricity but was not
functioning (23%) during the visit. Jayawijaya had the most schools without any electricity,
followed by Mimika. On the other hand, Jayapura and Biak had the most schools with
functioning electricity.
Figure 3.60: Availability of Electricity
44% 56%
Availability of Library
(Tanah Papua (Six Districts))
Yes
No
31%
69%
Are libraries being used?
(Tanah Papua (Six Districts))
Yes
No
District Availability of Library
Yes No
Biak 47% 53%
Jayapura 77% 23%
Mimika 40% 60%
Jayawijaya 47% 53%
Manokwari 7% 93%
Sorong 50% 50%
District Are libraries being used?
Yes No
Biak 14% 86%
Jayapura 43% 57%
Mimika 50% 50%
Jayawijaya 7% 93%
Manokwari 50% 50%
Sorong 31% 69%
33%
23%
44%
Tanah Papua
(Six Districts)
Yes
Yes, But not functioning
No
District
Availability of Electricity
Yes Yes, But not
functioning No
Biak 50% 17% 33%
Jayapura 57% 30% 13%
Mimika 20% 27% 53%
Jayawijaya 13% 7% 80%
Manokwari 37% 23% 40%
Sorong 20% 37% 43%

3
77
3.6 Classroom Characteristics
Classroom walls were observed to see if they displayed things such as supporting instruction
materials and classroom rules. Among all classrooms observed, only around 42% had any
instructional materials displayed on the classroom walls, while classrooms displaying rules
for students to abide by were only found in 22% of the observed classrooms.
Figure 3.61: Rules and Instructional Materials Displayed in Classrooms
Student works displayed on classroom walls were also observed. It was found that only
around 25% of the classrooms visited had student works displayed. The works displayed
were also further observed to see if they were from recent work or not. In this case,
around 61% of the classrooms that displayed student works still displayed works from more
than one month ago.
42%
58%
Displaying Instructional
Materials
(Tanah Papua (Six Districts))
Yes
No
22%
78%
Displaying Rules in the
Classroom
(Tanah Papua (Six Districts))
Yes
No
District
Displaying Rules in the
Classroom
Yes No
Biak 94% 6%
Jayapura 65% 35%
Mimika 60% 40%
Jayawijaya 87% 13%
Manokwari 75% 25%
Sorong 89% 11%
District
Displaying Instructional
Materials
Yes No
Biak 71% 29%
Jayapura 58% 42%
Mimika 46% 54%
Jayawijaya 57% 43%
Manokwari 53% 47%
Sorong 46% 54%

3
78
Figure 3.62: Student Works Displayed in Classrooms
Not all schools had enough chairs and tables for students. This baseline study found that
more than 70% of classrooms had sufficient seats and tables, which means that the
remaining 30% did not. Schools in Biak and Mimika were found to have the fewest number
of schools with sufficient seating and tables compared to other districts.
Table 3.10: Chair and Table Sufficiency
The majority of the classrooms observed had children sitting in pairs (51%). Another
common classroom seating arrangement was the classic seating with each student sitting
individually (40%). Around one fifth of the schools in Biak District were found to have
students seated in small groups.
25%
18%
27%
38%
15% 11%
38%
TanahPapua
Biak Jayapura Mimika Jayawijaya Manokwari Sorong
Classroom Displaying Student’s Work
61%
50%
43%
88%
33%
67%
52%
TanahPapua
Biak Jayapura Mimika Jayawijaya Manokwari Sorong
Is student work displayed over one month
old? (yes)
(Six Districts) (Six Districts)
District Sufficiency of seats for
students in class
Sufficiency of table for
students in class
Tanah Papua
(Six Districts) 77% 76%
Biak 68% 65%
Jayapura 82% 82%
Mimika 67% 63%
Jayawijaya 86% 86%
Manokwari 78% 83%
Sorong 89% 89%

3
79
Figure 3.63: Classroom Seating Arrangements
Around 34% of the teachers from the classrooms observed claimed to have lesson plans
(RPP) and were willing to show them, while 25% of them claimed to have lesson plans but
for various reasons were unwilling or unable to show them, while the rest (41%) said that
they did not have any lesson plans at all.
Figure 3.64: Lesson Plan Availability
The availability of books other than curriculum textbooks was found in around 38% of the
classes observed; thus, 62% did not have any books in the classrooms that the students
District
Classroom Seating Arrangement
Students seated
classically
Students seated
in small groups
Students seated
in pairs
Students seated
in U formation
Students seated
in the floor
Biak 13% 20% 65% 2% 0%
Jayapura 43% 0% 57% 0% 0%
Mimika 58% 4% 33% 5% 0%
Jayawijaya 63% 0% 33% 2% 2%
Manokwari 5% 0% 90% 5% 0%
Sorong 33% 11% 56% 0% 0%
40%
6%
51%
3% 0%
Students seated
classically
Students seated in
small groups
Students seated in
pairs
Students seated in
U formation
Students seated in
the floor
Tanah Papua
(Six Districts)
District
Classroom Seating Arrangement
Students seated
classically
Students seated
in small groups
Students seated
in pairs
Students seated
in U formation
Students seated
in the floor
Biak 13% 20% 65% 2% 0%
Jayapura 43% 0% 57% 0% 0%
Mimika 58% 4% 33% 5% 0%
Jayawijaya 63% 0% 33% 2% 2%
Manokwari 5% 0% 90% 5% 0%
Sorong 33% 11% 56% 0% 0%
District
Lesson Plan Availability
Yes Yes, but not
willing to show No
Biak 41% 31% 28%
Jayapura 34% 33% 33%
Mimika 53% 14% 33%
Jayawijaya 12% 13% 75%
Manokwari 16% 55% 29%
Sorong 33% 39% 28%
34%
25%
41%
Tanah Papua
(Six Districts)
Yes
Yes, but not
willing to show
No

3
80
could access or read. Sorong was found to have the most classrooms with accessible books,
while in contrast 89% of classrooms observed in Jayawijaya did not have any accessible
books. The number of books available in those classrooms was mostly around 20-39 books.
Figure 3.65: Availability and Accessibility of Books for Students
In total, only about 26% of the classrooms were observed to have a reading corner. In line
with the number of books available and accessibility for students in the classroom, Sorong
was also found to have the most schools with a reading corner up to 61%, while in contrast
Jayawijaya had the least number of schools with a reading corner at only 8%.
Figure 3.66: Availability of a Reading Corner
District
Availability and Accessibility of books for Students
1-4
books
5-9
books
10-19
books
20-39
books
40+
books None
Biak 6% 8% 5% 20% 8% 53%
Jayapura 11% 0% 13% 27% 7% 42%
Mimika 16% 2% 5% 6% 4% 67%
Jayawijaya 4% 2% 4% 1% 0% 89%
Manokwari 12% 2% 2% 2% 0% 82%
Sorong 0% 1% 10% 17% 40% 32%
9% 3%
7% 13%
7%
61%
1-4 books 5-9 books 10-19 books 20-39 books 40+ books None
Tanah Papua
(Six Districts)
26%
35% 31%
22%
8%
15%
61%
Tanah
Papua
Biak Jayapura Mimika Jayawijaya Manokwari Sorong
(Six Districts)

3
81
4.1

3
81
4.2 Overview of EGRA Performance
Prior to conducting a comprehensive analysis of the EGRA results, it is important to check
the internal consistency of the assessment. According to the Institute for Digital and
Education Research, UCLA (2014), the internal consistency is measured by Cronbach‘s
alpha. A Cronbach‘s alpha of 0.70 or higher is considered acceptable in most social science
research situations. In this baseline study, the internal consistency for the overall assessment
was relatively high, with a Cronbach‘s alpha of 0.79. This suggests strong evidence that this
assessment reliably measured a single, underlying construct—namely foundational reading
skills.
Overall, the EGRA performance from this baseline study indicates that early grade students
in rural and remote areas of Tanah Papua had significantly lower reading performance
compared to students in the Maluku Nusa Tenggara and Papua (MNP) region and Indonesian
students in general.
Table 4.1: EGRA Performance of Students in Tanah Papua
Subtask National MNP Tanah
Papua Papua
West
Papua
Letter-sound identification
(letters/min) 75.0 0 - 31.54* 31.04 32.63
Non-word reading
(words/min) 29.90 18.00 5.83* 5.34 7.03*
Oral reading fluency
(words/min) 52.10 29.70 9.55* 8.82 11.57*
Reading comprehension
(%Correct) 62.80% 46.00% 14.61%* 13.44% 17.72%*
Listening comprehension
(%Correct) 53.70% 45.00% 29.07%* 27.09% 33.27%*
Oral Vocabulary
(%Correct) 87.87% - 83.64%* 82.34% 87.11%*
Dictation
(%Correct) 72.80% - 24.59%* 24.55% 25.18%
National and MNP: taken from the RTI International & USAID/Indonesia EGRA National Survey 2014;
Papua covered Biak, Jayapura, Mimika, and Jayawijaya; West Papua covered Sorong and Manokwari.
*) indicates statistical significance at the .05 level towards National and MNP or between Papua and West Papua.
4 RESULTS AND FINDINGS: EARLY GRADE READING ASSESSMENT

3
82
Table 4.1 shows that the students in rural and remote areas of Tanah Papua obtained
significantly lower scores than Indonesian students in general for all EGRA subtasks. In
terms of letter sound identification, early grade students in Tanah Papua read around 30
words per minute, while average students in Indonesia were able to read more than twice
that (75 words per minute). Furthermore, early grade students in Tanah Papua appeared to
have a more difficult time with the non-word reading and dictation subtask as compared to
average students nationally. The biggest issues, however, came with oral reading fluency,
reading comprehension, and listening comprehension subtasks, where average Tanah Papua
students were only able to achieve around 20-30% of the achievement of average students
nationally. However, the early grade students in Tanah Papua managed to have a similar level
of oral vocabulary as compared to the average students nationally. This finding indicates that
the students in Tanah Papua, at least, understood the meaning of simple vocabulary stated
orally in Bahasa Indonesia.
Furthermore, the table also indicates that there is a significant difference of reading
performance between the surveyed districts in Papua and West Papua. Students in West
Papua performed significantly better in 5 out of 7 EGRA subtasks as compared to students
in Papua. The two subtasks in which both provinces performed relatively similar were letter
sound identification and dictation.
Comparing the reading performance of the students in second and third grades, it shows
that the latter have significantly better performance. Looking at the aggregate results from
all surveyed districts in Tanah Papua, the third grade students outperformed the second
grade students across all EGRA subtasks. Interestingly, in Tanah Papua, the second grade
students managed to have a relatively similar performance as the third grade students in
terms of listening comprehension, as shown in Figure 4.1. In addition, second grade students
in West Papua also had relatively equal performance in oral vocabulary as compared to the
third grade students, as shown in Figure 4.2.

3
83
Table 4.2: EGRA Results by Students’ Grades
Figure 4.1: Percentage of Correct Listening Comprehension: Means for a Particular
Item, Disaggregated by Grade- in Tanah Papua
Subtask National MNP Tanah Papua Papua West Papua
Student’s Grade 2nd
Grade
3rd
Grade
2nd
Grade
3rd
Grade
2nd
Grade
3rd
Grade
Letter-sound
identification
(letters/min)
75.0 0 - 26.11 34.00* 26.17 32.72* 26.61 36.12*
Non-word
reading
(words/min)
29.90 18.00 4.26 7.51* 3.98 6.60* 5.24 9.06*
Oral reading
fluency
(words/min)
52.10 29.70 6.68 12.64* 6.45 10.90* 7.89 15.79*
Reading
comprehension
(%Correct)
62.80% 46.00% 10.16% 19.75%* 9.71% 16.91%* 12.27% 24.74%*
Listening
comprehension
(%Correct)
53.70% 45.00% 25.53% 28.92% 24.51% 25.43% 29.04% 34.08%
Oral Vocabulary
(%Correct) 87.87% - 81.76% 86.31%* 80.92% 84.46%* 85.06% 89.50%
Dictation
(%Correct) 72.80% - 18.48% 28.78%* 18.72% 27.98%* 19.60% 29.52%*
National and MNP: taken from the RTI International & USAID/Indonesia EGRA National Survey 2014;
Papua covered Biak, Jayapura, Mimika, and Jayawijaya; West Papua covered Sorong and Manokwari.
*) indicates statistical significance at the .05 level towards National and MNP or between Papua and West Papua.
0%
10%
20%
30%
40%
50%
60%
70%
80%
90%
100%
Where is Mery'snew school?
How is Meri'steacher in her new
school?
Why is Meri sohappy with her
new school?
Grade 2 - West Papua
Grade 3 - West Papua
Grade 2 - Papua
Grade 3 - Papua

3
84
Figure 4.2: Percentage of Correct Oral Vocabulary Comprehension: Means for a
Particular Item, Disaggregated by Grade- West Papua
A district analysis shows that Jayawijaya had the lowest scores for all EGRA subtasks, while
Jayapura managed to obtain the best scores. Biak had slightly better EGRA performance as
compared to Jayawijaya. Meanwhile, Mimika, Manokwari, and Sorong obtained relatively
similar scores across all subtasks.
0%
10%
20%
30%
40%
50%
60%
70%
80%
90%
100%
Body Part Words in around Words about spatial
Grade 2
Grade 3
0%
10%
20%
30%
40%
50%
60%
70%
80%
90%
100%
Grade 2
Grade 3
Body Part Words in around Words about spatial

3
85
Table 4.3: EGRA Results by District
Looking at the difference between reading performance of the second and third grade
students at the district level, Jayapura had distinct differences in reading performance
between the second grade and the third grade students. In other districts, especially in
Mimika, Manokwari, and Jayawijaya, the third grade students did not achieve significantly
better reading performance as compared to the second grade students. This might be the
impact of multi-grade classrooms in which the second and third grade students were placed
in one classroom. From classroom observations, it was revealed that 12% of the surveyed
schools had multiple grade classrooms of second and third grade students. The highest
percentages were revealed in Manokwari (27%) and Jayawijaya (16%).
Subtask Papua Biak Jayapura Mimika Jayawijaya West Papua Manokwari Sorong
Letter-sound
identification
(letters/min)
31.04 22.65 44.85* 35.64* 24.93 32.63 33.92* 33.00*
Non-word reading
(words/min) 5.34 2.82 11.12* 6.07* 2.48 7.03 7.11* 7.54*
Oral reading fluency
(words/min) 8.82 4.16 20.17* 9.23* 3.47 11.57 10.33* 13.78*
Reading comprehension
(%Correct) 13.44% 6.62% 31.09%* 14.81%* 3.92% 17.72% 16.10%* 20.29%*
Listening comprehension
(%Correct) 27.09% 17.13% 52.31%* 33.55%* 5.58% 33.27% 38.48%* 30.54%*
Oral Vocabulary
(%Correct) 82.34% 85.00%* 93.42%* 84.06%* 68.06% 87.11% 85.06%* 89.41%*
Dictation
(%Correct) 24.55% 16.28% 46.01%* 26.14%* 13.57% 25.18% 23.97%* 28.05%*
Papua covered Biak, Jayapura, Mimika, and Jayawijaya; West Papua covered Sorong and Manokwari.
*) indicates statistical significance at the .05 level towards Jayawijaya as reference group

3
86
Table 4.4: EGRA Results by Grade & District
This baseline study also revealed the number of students who obtained a score of zero for
each EGRA subtask. Table 4.5 shows that around 7% of early grade students in rural and
remote areas of Tanah Papua failed to recognize any single letter- they were totally illiterate.
Furthermore, around 40-50% of students in Tanah Papua could not read any sentences-
indicated by 51.98% and 40.98% of students who obtained a score of zero in the subtask of
oral reading fluency in Papua and West Papua, respectively. There is also an indication that
these students might not be able to write any sentences as about one third of the students
obtained a score of zero in dictation.
The condition was even worse as the zero scores were not only identified among the
second grade students. Table 4.6 shows the percentages of third grade students who could
not recognise any single letter, could not read any sentences, and could not write. These
findings indicate a serious problem for early grade education in the rural and remote areas
of Tanah Papua in achieving the average national level of reading performance.
However, despite their lack of reading performance, early grade students in Tanah Papua
had a better understanding of the meanings of simple words as compared to the students at
Subtask Papua Biak Jayapura Mimika Jayawijaya West Papua Manokwari Sorong
Student’s
Grade
2nd
Grade
3rd
Grade
2nd
Grade
3rd
Grade
2nd
Grade
3rd
Grade
2nd
Grade
3rd
Grade
2nd
Grade
3rd
Grade
2nd
Grade
3rd
Grade
2nd
Grade
3rd
Grade
2nd
Grade
3rd
Grade
Letter-sound
identification
(letters/min)
26.17 32.72* 16.77 34.07* 41.85 51.81* 34.80 37.36 21.33 31.34* 26.61 36.12* 31.74 37.52* 28.19 41.86*
Non-word
reading
(words/min)
3.98 6.60* 1.68 5.04* 9.61 14.63* 5.73 6.77 1.93 3.44* 5.24 9.06* 6.80 7.62 5.51 11.29*
Oral reading
fluency
(words/min)
6.45 10.90* 1.91 8.53* 16.92 27.70* 8.50 10.70 2.68 4.88* 7.89 15.79* 9.37 11.91 9.10 22.42*
Reading
comprehension
(%Correct)
9.71% 16.91%* 2.80% 14.02%* 26.46% 41.84%* 13.77% 16.95% 2.64% 6.20% 12.27% 24.74%* 14.07% 19.46% 14.06% 31.79%*
Listening
comprehension
(%Correct)
24.51% 25.43% 14.01% 23.19%* 50.97% 55.42% 31.60% 37.53% 4.00% 8.38% 29.04% 34.08% 36.86% 41.16% 27.74% 35.71%
Oral Vocabulary
(%Correct) 80.92% 84.46%* 83.21% 88.48% 92.62% 95.28% 83.56% 85.10% 66.29% 71.20% 85.06% 89.50%* 83.25% 88.05% 87.69% 92.59%
Dictation
(%Correct) 18.72% 27.98%* 10.28% 27.92%* 42.36% 54.49%* 23.05% 32.45%* 9.89% 20.12%* 19.60% 29.52%* 22.23% 26.85% 23.15% 37.09%*
Papua covered Biak, Jayapura, Mimika, and Jayawijaya; West Papua covered Sorong and Manokwari.
*) indicates statistical significance at the .05 level towards Jayawijaya as reference group

3
87
the average national level. This is indicated by a lower percentage of second and third grade
students in Tanah Papua who obtained a score of zero in oral vocabulary compared to the
national level.
Table 4.5: Score of Zero for EGRA by Subtask
Table 4.6: Score of Zero for EGRA by Subtask and Grade
Subtask National Papua West Papua
Letter-sound
identification
(letters/min)
0.6% 6.61%* 6.83%*
Non-word reading
(words/min) 8.1% 60.49%* 51.65%*
Oral reading fluency
(words/min) 5.8% 51.98%* 40.98%*
Reading comprehension
(%Correct) 9.2% 70.11%* 64.14%*
Listening comprehension
(%Correct) 15.2% 53.43%* 41.94%*
Oral Vocabulary
(%Correct) 0.37% 0.05%* 0.00%*
Dictation
(%Correct) 3.0% 32.00%* 31.59%*
National: taken from the RTI International & USAID/Indonesia EGRA National Survey 2014;
Papua covered Biak, Jayapura, Mimika, and Jayawijaya; West Papua covered Sorong and Manokwari.
*) indicates statistical significance at the .05 level towards National
Subtask National Papua West Papua
Student’s Grade 2nd Grade 3rd
Grade 2nd Grade 3rd
Grade
Letter-sound
identification
(letters/min)
0.6% 7.76% 4.39%* 7.61% 5.33%
Non-word reading
(words/min) 8.1% 66.59% 48.76%* 55.66% 43.89%*
Oral reading fluency
(words/min) 5.8% 58.60% 39.24%* 44.82% 33.54%*
Reading
comprehension
(%Correct)
9.2% 75.11% 60.47%* 69.42% 53.92%*
Listening
comprehension
(%Correct)
15.2% 55.86% 48.76%* 45.63% 34.80%*
Oral Vocabulary
(%Correct) 0.37% 0.08% 0.00% 0.00% 0.00%
Dictation
(%Correct) 3.0% 38.28% 19.91%* 37.38% 20.38%*
National: taken from the RTI International & USAID/Indonesia EGRA National Survey 2014;
Papua covered Biak, Jayapura, Mimika, and Jayawijaya; West Papua covered Sorong and Manokwari.
*) indicates statistical significance at the .05 level towards National

3
88
RTI International further classifies reading ability into four categories, namely: reads fluently
with comprehension, reads with comprehension, reads with limited comprehension, and is a
non-reader. This classification was made based on the combination of oral reading fluency
(i.e. correct words per minute) and reading comprehension (i.e. correct answers) subtask:
1. Reads fluently with comprehension: achieved 80% correct on reading comprehension,
given that the entire passage was read
2. Reads with comprehension: achieved 60% correct on reading comprehension out of the
total items attempted
3. Reads with limited comprehension: reading comprehension is less than 60%, given that
oral reading fluency was greater than zero
4. Is a non-reader: oral reading fluency equaled zero
Based on the above classification, students in the rural and remote areas of Tanah Papua
were mainly classified in the third and fourth groups (87%). The overall trend is clear: almost
half of the early grade students in the two provinces were non-readers (48.47%) and around
40% could read with limited comprehension.
Figure 4.3: Reading Ability of Early Grade Students in Tanah Papua
7.63% 5.35% 38.55% 48.47%
0.00% 10.00% 20.00% 30.00% 40.00% 50.00% 60.00% 70.00% 80.00% 90.00% 100.00%
TanahPapua
Reading fluently with comprehension Reading with comprehension
Reading with limited comprehension Nonreader

3
89
Looking at the district level, Jayapura obviously had the highest percentage of students who
were able to read fluently with comprehension (17.93%), followed by Sorong (12.55%).
Meanwhile, Jayawijaya and Biak had the lowest percentages of students who were able to
read fluently with comprehension (0.58% and 1.29%, respectively). In addition, students who
can be classified as non-readers were mostly found in these two districts, i.e. 71.15% and
60.63% for Jayawijaya and Biak, respectively. Although Jayapura had the highest percentage
of fluent readers, attention should be given to the non-readers in this district as this district
still had around one third of non-readers.
Table 4.7: Reading Ability of Early Grade Students by District
4.2 EGRA Results vs. Student Profiles
Prior to conducting an analysis of the differences of students‘ reading performance vs. each
dimension of SSME, namely: students, parents, teachers, head teachers, as well as school and
classroom conditions, a correlation analysis was applied in order to understand which EGRA
subtask should be the focus of the analysis. Table 4.8 shows the results of the correlation
analysis among the subtasks. From the table, it is clear that oral reading fluency (ORF) and
reading comprehension were strongly correlated with the other EGRA subtasks. Focusing
on these two subtasks is crucial as they are good predictors of students‘ foundational
reading skills.
District
Reading ability
Reading fluently
with
comprehension
(1)
Reading with
comprehension
(2)
Reading with
limited
comprehension
(3)
Nonreader
(4)
Biak 1.29% 2.03% 36.04% 60.63%
Jayapura 17.93% 11.09% 43.44% 27.54%
Mimika 7.85% 5.32% 38.48% 48.35%
Jayawijaya 0.58% 1.54% 26.73% 71.15%
Manokwari 5.66% 5.45% 49.46% 39.43%
Sorong 12.55% 6.69% 38.28% 42.47%
Note:
(1) Reading Comprehension ≥ 80% (2) 60% ≤ Reading Comprehension < 80%
(3) 0% ≤ Reading Comprehension < 60%, ORF > 0
(4) ORF = 0

3
90
Table 4.8: Correlation Analysis of EGRA Subtasks
The demographic profiles of students differentiate their oral reading fluency (ORF). Table
4.9 shows that students from Jayapura outscored students from Jayawijaya by more than16
words per minute. Additionally, students who were over 7 years old and in the third grade
outperformed their younger counterparts who were in the second grade.
Letter-sound
identification (letters/min)
Non-word reading
(words/min)
Oral reading fluency
(words/min)
Reading
comprehension (%Correct)
Listening
comprehension (%Correct)
Oral
Vocabulary (%Correct)
Dictation
(%Correct)
Letter-sound identification
(letters/min) 1.00 0.578** 0.562** 0.592** 0.385** 0.298** 0.641**
Non-word reading
(words/min) 0.578** 1.00 0.830** 0.820** 0.374** 0.271** 0.745**
Oral reading fluency
(words/min) 0.562** 0.830** 1.00 0.838** 0.385** 0.283** 0.715**
Reading comprehension
(%Correct) 0.592** 0.820** 0.838** 1.00 0.464** 0.335** 0.790**
Listening comprehension
(%Correct) 0.385** 0.374** 0.385** 0.464** 1.00 0.450** 0.463**
Oral Vocabulary
(%Correct) 0.298** 0.271** 0.283** 0.335** 0.450** 1.00 0.368**
Dictation (%Correct)
0.641** 0.745** 0.715** 0.790** 0.463** 0.368** 1.00
** indicates statistical significance at the .01 level

3
91
Table 4.9: Oral Reading Fluency and Reading Comprehension by Demographics
Similarly, in terms of reading comprehension, Jayapura students read significantly better than
Jayawijaya students with around a 30% difference in terms of correct answers (31.09%
correct answers in Jayapura vs. 3.92% correct answers in Jayawijaya). In addition, higher age
students and third grade students also had a higher chance to have correct answers in the
reading comprehension subtask. Interestingly, gender did not make any significant difference
in the students‘ ORF and reading comprehension scores. Although female students tended
to have a higher performance in ORF and reading comprehension than male students, the
difference was insignificant.
This study also revealed that the usage of exercise books differentiates students‘ reading
performance. Students who had used their exercise books for more than ¼ obtained a
significantly higher ORF score as well as better reading comprehension as compared to
those who rarely used their exercise books. Furthermore, teachers‘ marking in the exercise
books also differentiated the students‘ ORF scores and reading comprehension. Students
who had exercise books which were mostly or fully marked by the teacher doubled their
ORF scores and reading comprehension scores as compared to those without marks.
Moreover, books ownership at home also played an important role in supporting students‘
SSME Category Indicator ORF
(Words/minute)
Reading
Comprehension
(% Correct)
Student Districts Biak 4.16 6.62%*
Jayapura 20.17* 31.09%*
Mimika 9.23* 14.81%*
Jayawijaya (ref) 3.47 3.92%
Manokwari 10.33* 16.10%*
Sorong 13.78* 20.29%*
Gender Male 9.76 15.17%
Female 10.61 15.71%
Age Of-age (6-7 y.o) 8.04 12.21%
Over age (more than 7 y.o) 10.89* 16.50%*
Student‘ Grade 2nd Grade 7.99 12.22%
3th Grade 14.27* 21.47%*
ref : signifies the reference group
* : indicates statistical significance at the .05 level

3
92
reading performance. Students who had other books at home, other than their school
books, obtained significantly higher ORF scores as well as better reading comprehension
scores than those without any other books at home.
Table 4.10: Oral Reading Fluency and Reading Comprehension by Book Ownership
Students‘ reading habits and parents‘ literacy signify the differences in reading performance.
Students with a daily reading habit at home obtained almost triple the ORF score than those
who never read at home. Similarly, they also had much better reading comprehension. In
the case of parents' literacy, if other family members read for the students at home, it also
had a significant impact on the students‘ reading performance. A mother‘s and father‘s
literacy also mattered. When the students had parents who could read, they had better
reading performance, as their ORF scores and reading comprehension doubled.
Interestingly, this study revealed that if a mother knew how to read, it had a higher impact
than the father on the students‘ reading performance.
SSME Category Indicator ORF
(Words/minute)
Reading
Comprehension
(% Correct)
Student
The usage of exercise
book
0 – ¼ (ref) 6.79 7.98%
¼ 10.6* 16.76%*
½ and more 14.58* 22.76%*
Availability of Teacher‘s
comments in student‘s
exercise book
None (ref) 9.09 13.06%
Some pages 13.11* 21.90%*
Most to all pages 20.42* 30.52%*
Availability of other
books, apart from
school books, that
students can read at
home
Yes 12.43* 19.32%*
No 6.82 9.66%
ref : signifies the reference group
* : indicates statistical significance at the .05 level

3
93
Table 4.11: Oral Reading Fluency and Reading Comprehension by Reading Habit
Homework also plays an important role in building students‘ reading skills. This study
revealed that students who were given regular homework had higher chances to obtain
better ORF scores and reading comprehension.
Table 4.12: Oral Reading Fluency and Reading Comprehension by Homework
Students‘ reading performance was also differentiated by their pre-school attendance.
Those who had attended pre-school/kindergarten obtained significantly higher ORF scores
and better reading comprehension than those who never attended. Meanwhile, students‘
SSME Category Indicator ORF
(Words/minute)
Reading
Comprehension
(% Correct)
Student
Student reads aloud at
home
No, never (ref) 6.33 9.21%
Once a week 12.20* 19.08%*
2-3 times per week 15.81* 24.38%*
Every day 16.28* 24.76%*
Someone at home
reads to the student
Yes 11.88* 18.33%*
No 8.26 12.17%
Mother knows how to
read
Yes 11.51* 17.62%*
No 5.63 7.98%
Father knows how to
read
Yes 10.92* 16.60%*
No 5.74 8.48%
ref : signifies the reference group
* : indicates statistical significance at the .05 level
SSME Category Indicator ORF
(Words/minute)
Reading
Comprehension
(% Correct)
Student During this school year,
student had any
homework
Yes 11.08* 16.87%*
No 1.84 2.11%
Student had any
homework last week
Yes 11.80* 17.88%*
No 7.26 11.54%
ref : signifies the reference group
* : indicates statistical significance at the .05 level

3
94
who used Bahasa Indonesia as their main language at home obtained higher ORF scores and
better reading comprehension than their counterparts who used a local language as their
main language at home. Moreover, teachers‘ recognition of students‘ achievement was also
very important. Students‘ who received enough recognition from their teachers, even when
they just saw that their teachers looked happy, obtained significantly higher ORF scores and
better reading comprehension than those who never received such recognition. Other
motivational and moral aspects such as praise, giving prizes, and excusing the students from
chores or homework also impacted their improvement in ORF and reading comprehension.
Table 4.13: Oral Reading Fluency and Reading Comprehension, by Pre-school
Attendance, Main Language a Home, and Teacher Recognition
When the students were unable to answer a question or answered a question incorrectly,
the teachers‘ reactions signified the differences in students‘ reading performance.
Interestingly, the teachers‘ reactions either in a persuasive action or punishment, both had a
positive impact on the ORF scores and reading comprehension. For instance, sending
SSME Category Indicator ORF
(Words/minute)
Reading
Comprehension
(% Correct)
Student Attended preschool or
kindergarten
Yes 12.08* 18.34%*
No 7.75 11.72%
Students‘ main
language at home
Indonesian Language 12.94* 19.90%*
Local Language 6.17 8.97%
Teacher‘s reaction
towards students
achievement
Did nothing (ref) 7.69 11.54%
Praises me 12.91* 20.20%*
Gives me a prize 12.88* 17.41%*
Excuses me from a chore or
homework 11.39* 23.33%*
Gives good grade 9.56 13.19%
Gives material to study at home 11.92* 21.54%*
Teaches more lesson 8.04 12.00%
Was happy 30.33* 30.43%*
Advised to learn more 4.59 7.27%
ref : signifies the reference group
* : indicates statistical significance at the .05 level

3
95
students to the corner of the classroom had a similar positive impact on ORF and reading
comprehension as encouraging the student to try again.
Table 4.14: Oral Reading Fluency and Reading Comprehension by Teachers’ Reactions
to Students’ Inability to Answer Questions
The students also need parental support in their reading skill development. This study
reveals that students with sufficient attention from their parents had better ORF scores and
reading comprehension. Providing recognition of their children's achievement by giving
encouragement, hugging, and advising them to learn more, significantly increased the
children‘s ORF scores and reading comprehension as compared to those who never
received it.
SSME Category Indicator ORF
(Words/minute)
Reading
Comprehension
(% Correct)
Student Teachers‘ reactions when
student was unable to
answer a question or
answer a question
incorrectly
Do nothing (ref) 5.02 6.82%
Rephrases/explains the question 12.82* 19.61%*
Asks again (without explaining) 14.45* 20.00%*
Encourages the student to try again 15.72* 24.48%*
Asks another student 12.58* 20.28%*
Corrects the student, but does not
scold him/her 12.14* 17.99%*
Scolds student 13.11* 19.58%*
Sends student outside of classroom 14.64 20.00%
Hits student 8.92* 14.50%*
Sends student to corner of
classroom 23.71* 34.29%*
Gives bad grade 6.89 12.00%
Gives additional homework 0.40 0.00%
Asks to clean classroom or school 6.00 6.67%
ref : signifies the reference group
* : indicates statistical significance at the .05 level

3
96
Table 4.15: Oral Reading Fluency and Reading Comprehension from Parental Support
Students‘ absenteeism also made a difference in the ORF scores and reading
comprehension. Students who were absent in the past week had lower ORF scores and
reading comprehension performance than those who attended class.
Table 4.16: Oral Reading Fluency and Reading Comprehension from Student
Absenteeism
4.3 EGRA Results vs. Parent Profiles
Parents' education level plays an important role in students‘ reading performance. Parents
who graduated from senior high school and university (24% and 7% of total parents sampled,
respectively) had children with significantly higher ORF scores and much better reading
comprehension as compared to parents who only graduated from primary school (40.2% of
total parents sampled). Compared to parents who did not have any formal education, the
ORF score was almost tripled. Interestingly, this study revealed that children whose parents
graduated from senior high school have almost an equal reading performance as those who
have parents with Bachelor‘s Degrees, as shown in Table 4.17.
SSME Category Indicator ORF
(Words/minute)
Reading
Comprehension
(% Correct)
Student When parent knew that
student did well, what
did they do?
Did nothing (ref) 9.25 13.26%
Congratulated or encouraged me 12.59* 19.60%*
Gave me a hug/kiss 19.55* 31.43%*
Gave me a treat 11.90 19.79%*
Advised to learn more 14.15* 21.15%*
ref : signifies the reference group
* : indicates statistical significance at the .05 level
Category Indicator ORF
(Words/minute)
Reading
Comprehension
(% Correct)
Students was absent last
week
Yes 8.48 12.59%
No 10.49* 15.96%*
ref : signifies the reference group
* : indicates statistical significance at the .05 level

3
97
Table 4.17: Oral Reading Fluency and Reading Comprehension Based on Parents’
Education Level
In line with parents‘ education background, parents‘ economic condition also contributed
to the differences in students‘ reading performance. As expected, parents with a better
economic condition had children with better reading performance. Those who had monthly
incomes of more than IDR 6 million, had children with ORF scores of 23.71 words per
minute as compared to those with less than IDR 0.5 million with only 7.84 words per
minute.
SSME Category Indicator ORF
(Words/minute)
Reading
Comprehension
(% Correct)
Parent Parent‘s Education
Level
Never study (ref) 5.42 8.08%
Primary school 9.22* 14.08%*
Junior high school 9.06* 13.96%*
Senior high school 14.11* 21.36%*
University 14.42* 21.00%*
ref : signifies the reference group
* : indicates statistical significance at the .05 level

3
98
Table 4.18: Oral Reading Fluency and Reading Comprehension Based on Parents’
Characteristics
In addition, parental support of their children‘s learning at home also had a positive result.
Parents‘ attention to their children‘s homework and their encouragement of their children
to study regularly for about 2-3 hours or even more than 3 hours at home had a positive
impact on their children‘s ORF scores and reading comprehension. Children who spent
more than 3 hours to learn at home obtained ORF scores almost ten times higher than
those who never studied at home. Furthermore, parents who spoke mainly Indonesian
language at home also had children with better reading performance.
4.4 EGRA Results vs. Teachers’ Profiles
The gender of the teacher, either male or female, did not have any significant difference in
terms of students‘ ORF scores and reading comprehension. Although the EGRA scores of
the students who were taught by female teachers were slightly higher, it was statistically
insignificant. In terms of teachers‘ academic qualifications, it is obvious that teachers with
higher academic backgrounds than junior high school graduates resulted in students with
higher ORF scores and better reading comprehension. Interestingly, as shown in Table 4.19,
teachers who had Bachelor‘s Degrees obtained almost an equal level of students‘ reading
SSME Category Indicator ORF
(Words/minute)
Reading
Comprehension
(% Correct)
Parent
Parent‘s Income
Less than 500.000 IDR (ref) 7.84 11.32%
500.000 – 999.999 IDR 8.51 13.72%
1.000.000 – 2.999.999 IDR 10.80* 16.20%*
3.000.000 – 6.000.000 IDR 19.52* 30.15%*
More than 6.000.000 IDR 23.71* 41.33%*
Parents help the child‘s
homework at home
Yes 6.91 10.76%
No 10.82* 16.35%*
Child spent time to
learn at home
Never study at home (ref) 4.33 5.36%
Less than 1 hour 9.89* 14.72%*
1 – less than 2 hours 11.74* 18.86%*
2 – 3 hours 12.91* 18.93%*
More than 3 hours 38.00* 53.33%*
Parent‘s Language Indonesian Language 12.70* 19.79%*
Local Language 6.44 8.98%
ref : signifies the reference group
* : indicates statistical significance at the .05 level

3
99
performance as those who graduated from senior high school. This finding challenges the
effectiveness of MOEC‘s program to allocate Bachelor‘s Degree teachers from big cities of
Indonesia to the 3T areas of Indonesia, including the rural and remote areas of Tanah Papua.
Moreover, teachers‘ pre-service training did not differentiate students‘ reading performance.
Whether they had attended pre-service training or not, their students obtained relatively
similar ORF scores and reading comprehension. The same is true with training on how to
teach reading. It seems that the training has not yet improved the teachers‘ skills.
Table 4.19: Oral Reading Fluency and Reading Comprehension Based on Teachers’
Characteristics
The main language of the teachers also had a significant impact on their students‘ reading
performance. Teachers whose main language was Bahasa Indonesia had students with
significantly higher ORF scores and better reading comprehension than those who did not
use Bahasa Indonesia as their main language. In addition, having a similar language between
teacher and students enabled the students to have better reading comprehension.
SSME Category Indicator ORF
(Words/minute)
Reading
Comprehension
(% Correct)
Teacher Teacher Gender
Male 9.70 14.98%
Female 10.53 15.77%
Teacher‘s highest level
of academic education
Junior high school 4.09 7.83%
Senior high school
(SMA/SPG/SPGA) 11.12* 16.39%*
Diploma 1,2,3 7.14* 10.44%*
Bachelor 10.84* 16.75%*
Teacher received any
pre-service training
Yes 10.30 15.69%
No 9.67 14.36%
Teacher received
special training on how
to teach reading
Yes 9.28 14.04%
No 11.03 16.80%
ref : signifies the reference group
* : indicates statistical significance at the .05 level

3
100
Table 4.20: Oral Reading Fluency and Reading Comprehension Based on Teachers’
Language
As discussed in the previous chapter, 58% of students in this baseline study speak Bahasa
Indonesia as their main language, while 50% of their teachers speak the language as their
main language. Meanwhile, the other half of the students and their teachers speak other
languages as their main language. The details of the other languages are shown in Table 4.21
and Table 4.22, for students and teachers, respectively. From the table, it was revealed that
the teachers might not speak a similar language to their students although both do not speak
Bahasa Indonesia as their main language. This is another challenge for primary schools in
rural and remote areas of Tanah Papua to obtain better (Bahasa Indonesia) reading
performance.
Table 4.21: Students’ Main Language
SSME Category Indicator ORF
(Words/minute)
Reading
Comprehension
(% Correct)
Teacher Teacher language
Indonesian Language 10.74* 16.58%*
Local Language 9.58 14.21%
Teacher‘s language =
Student‘s language
Yes 10.56 16.10%*
No 9.77 14.71%
ref : signifies the reference group
* : indicates statistical significance at the .05 level
Biak
Language %
Bahasa
Indonesia 75.58%
Biak 22.80%
Papua 0.90%
Walak 0.54%
Wamena 0.18%
Jayapura
Language %
Bahasa
Indonesia 85.50%
Papua 4.59%
Besum 2.02%
Baliem 1.65%
Jawa 0.92%
Wamena 0.92%
Bonggo 0.92%
Ambon 0.73%
Biak 0.73%
Ormu 0.73%
Walak 0.55%
Lani 0.18%
Manado 0.18%
Flores 0.18%
Kupang 0.18%
Mimika
Language %
Bahasa
Indonesia 46.60%
Kamoro 22.55%
Papua 11.28%
Dani 5.11%
Amume 4.26%
Asmat 2.77%
Damal 1.70%
Walak 1.06%
Mioko 0.85%
Agimuga 0.85%
Jawa 0.64%
Kamoro 0.64%
Bugis 0.64%
Manado 0.43%
Kei 0.43%
Klamono 0.21%
Jayawijaya
Language %
Papua 53.36%
Baliem 14.01%
Bahasa
Indonesia 12.28%
Wamena 9.40%
Kamoro 5.76%
Lani 1.34%
Kamoro 1.15%
Dani 0.96%
Walak 0.77%
Ambon 0.38%
Walak 0.38%
Amume 0.19%
Manokwari
Language %
Bahasa
Indonesia 57.99%
Papua 17.44%
Atam 14.99%
Hatam 4.91%
Biak 2.95%
Jawa 0.74%
Ambon 0.49%
Klamono 0.25%
Kupang 0.25%
Sorong
Language %
Bahasa
Indonesia 69.39%
Moi 13.63%
Papua 6.71%
Jawa 3.77%
Walak 2.31%
Biak 1.89%
Klamono 1.05%
Malabam 0.63%
Manado 0.42%
Bugis 0.21%

3
101
Table 4.22: Teachers’ Main Language
4.5 EGRA Results vs. School and Classroom’s Characteristics
In this baseline study, it is revealed that students from public schools had significantly better
ORF scores and reading comprehension. In addition, school accreditation was another
differentiating variable. Non-accredited schools performed significantly lower than
accredited schools in terms of ORF scores and reading comprehension. Compared to the
non-accredited schools, the students of B accredited schools obtained almost double the
ORF scores. Furthermore, students from B accredited schools performed better than C
accredited schools.
Table 4.23: Oral Reading Fluency and Reading Comprehension Based on School
Characteristics
Biak
Language %
Bahasa
Indonesia 48.33%
Local language 48.33%
Enrengkang 1.67%
Toraja 1.67%
Jayapura
Language %
Bahasa
Indonesia 59.32%
Local language 27.10%
Java 5.08%
Kaimana 3.39%
Flores 1.69%
Ternate 1.69%
Toraja 1.69%
Mimika
Language %
Bahasa
Indonesia 62.07%
Local language 27.58%
Java 3.45%
Toraja 3.45%
Flores 1.72%
Manado 1.72%
Jayawijaya
Language %
Local language 74.54%
Bahasa
Indonesia 18.18%
Java 7.27%
Manokwari
Language %
Bahasa
Indonesia 68.63%
Flores 1.96%
Local language 29.40%
Sorong
Language %
Bahasa
Indonesia 61.70%
Local language 31.92%
Manado 4.26%
Ternate 2.13%
SSME Category Indicator ORF
(Words/minute)
Reading
Comprehension
(% Correct)
School School status Public 10.96* 17.03%*
Private 8.71 12.44%
Status type SD Inti (ref) 10.33 15.15%
SD Imbas 10.06 15.68%
School accreditation Non accredited (ref) 7.45 11.54%
A - -
B 15.14* 22.69%*
C 11.56* 16.87%*
ref : signifies the reference group
* : indicates statistical significance at the .05 level

3
102
School facilities also differentiated students‘ reading fluency and comprehension. Having a
library was an important differentiator. Schools which had a library obtained higher ORF
scores and better performance in terms of reading comprehension. Library availability had a
more significant impact on reading performance if the students took advantage of it. When
the students used the library, they read 7 words per minute more than their counterparts
who never used the library. They also comprehended more in their readings. In addition,
the availability of reading books for early grade students in the library also made a significant
contribution to the reading performance.
Table 4.24: Oral Reading Fluency and Reading Comprehension Based on School
Characteristics
Table 4.24 also shows that physical facilities such as electricity and water sources also
differentiated the students‘ reading performance. Schools with power and water sources
had students with higher ORF scores and reading comprehension. They outperformed
students from schools without electricity and water by almost 6 words per minute and
almost double in terms of reading comprehension.
SSME Category Indicator ORF
(Words/minute)
Reading
Comprehension
(% Correct)
There was a school
library
Yes 11.97* 18.02%*
No 8.53 13.06%
Students were using the
library at the time of the
visit
No students are using it 9.63 15.06%
Students are using it 16.46* 23.40%*
There were easy reading
books for small children
Yes 13.16* 19.54%*
No 9.71 16.08%
The school had a source
of electricity
No (ref) 7.33 10.57%
Yes, but not functioning today 11.99* 18.52%*
Yes, and functioning today 12.48* 19.38%*
School had cleaned
water source
Yes 13.31* 20.23%*
No 7.71 11.66%
ref : signifies the reference group
* : indicates statistical significance at the .05 level

3
103
The availability of a reading corner where students can read and borrow books also played a
significant role in students‘ reading performance. Students from schools with a reading
corner(s) obtained almost double ORF scores and much better reading comprehension than
students from schools without a reading corner(s).
Meanwhile, students' scores in a formal government test such as Calistung was also an
important proxy for the EGRA results. Students who obtained good scores on a TKD or
Calistung test, also obtained higher ORF scores and better reading comprehension, and vice
versa.
Table 4.25: Oral Reading Fluency and Reading Comprehension Based on School
Characteristics
It is also important to pay attention to how the teachers manage their classrooms. A
classical class type was not considered to have a strong impact on students‘ reading
performance. In contrast, students from a ―small group‖ classroom or ―u-shaped‖ classroom
outperformed students from a classical classroom with more than 6 words per minute of
ORF. Their reading comprehension was even almost doubled. Furthermore, a classroom
with a reading corner produced students with higher ORF and better reading
comprehension than a classroom without a reading corner.
SSME Category Indicator ORF
(Words/minute)
Reading
Comprehension
(% Correct)
Head
Teacher
Early grade children
had access to the
books from the library
Yes 12.57 19.57%*
No 11.15 16.35%
There was a reading
corner where students
can borrow and read
books
Yes 13.94* 21.44%*
No 8.58 12.89%
Student achievement
are measured by TKD/
CALISTUNG Test
Good 14.17* 21.35%*
Bad 7.11 11.03%
ref : signifies the reference group
* : indicates statistical significance at the .05 level

3
104
Table 4.26: Oral Reading Fluency and Reading Comprehension Based on Classroom
Characteristics
When the classroom teachers allowed their students to read and borrow books from a
reading corner, the classroom had a higher chance to have students with better reading
performance. The more available and accessible the books were for the students, the higher
the ORF scores and the reading comprehension were. If the reading corner had more than
40 books that were actively used by the students, the ORF score was almost tripled than a
classroom without books. Finally, a classroom with student works displayed on the walls
had almost double the ORF score and reading comprehension of students from a classroom
without any displays.
Table 4.27: Oral Reading Fluency and Reading Comprehension Based on Classroom
Characteristics
SSME Category Indicator ORF
(Words/minute)
Reading
Comprehension
(% Correct)
Classroom How the students
were seated
Students seated classically (ref) 9.04 13.97%
Students seated in small groups 14.20* 20.59%*
Students seated in pairs 10.26 15.42%
Students seated in U formation 14.94* 24.71%*
Class had a reading
corner
Yes 8.56 12.75%
No 14.04* 21.87%*
ref : signifies the reference group
* : indicates statistical significance at the .05 level
SSME Category Indicator ORF
(Words/minute)
Reading
Comprehension
(% Correct)
Classroom
Books/booklets other
than textbooks are
available and accessible
(not locked away) for
children to read
None (ref) 6.96 10.48%
1 – 9 9.61* 14.98%*
10 – 19 15.62* 21.70%*
20 – 39 16.45* 26.74%*
More than 40 17.88* 26.54%*
Students‘ work were
displayed on the walls
Yes 15.21* 23.58%*
No 8.53 12.76%
ref : signifies the reference group
* : indicates statistical significance at the .05 level

3
105
4.6 The Impact of Students’ Characteristics on EGRA Results
To understand the impact of each student‘s characteristic factor on the mean of ORF scores
and reading comprehension, a regression analysis was applied. A regression analysis is a
statistical process for estimating the relationships among variables. It includes many
techniques for modeling and analysing several variables, while the focus is on the relationship
between a dependent variable and one or more independent variables. In this analysis, the
regression model consisted of five factors of the student‘s characteristics, namely: district,
student‘s age, student‘s grade, parents‘ literacy, and student‘s main language. The regression
coefficient was then put into the final column of the table as shown in Table 4.28. The
regression coefficient can be interpreted as the impact of a given variable on ORF and
reading comprehension, controlling all other factors in the table. For example, the last row
of the results reveals that if the district, student‘s grade, and parents‘ literacy are constant,
the impact of speaking Bahasa Indonesia as their language was about 4 additional words per
minute and 6% more correct answers in reading comprehension (as compared to a student
who shared all other variables but did not speak Indonesian language as one‘s main language
at home).
Table 4.28: Oral Reading Fluency and Reading Comprehension: Impact of Students’
Characteristics
SSME Category Indicator ORF
(Words/minute)
Reading
Comprehension
(% Correct)
Student
Districts
Biak 3.08* 3.30%*
Jayapura 12.81* 21.00%*
Mimika 3.57* 7.40%*
Jayawijaya (ref) - -
Manokwari 4.06* 7.80%*
Sorong 7.15* 11.40%*
Student‘s Grade 2nd Grade -6.55* -9.70%*
3th Grade
Parents know how to
read
Yes 3.02* 4.80%*
No - -
Student‘s language Indonesian Language 3.78* 5.90%*
Local Language - -
Constant 5.82 7.20%
ref : signifies the reference group
* : indicates statistical significance at the .05 level

3
106
Table 4.28 also shows that the district variable had the largest overall impact on the ORF
score and reading comprehension. After all other variables in the model were accounted
for, residing in Jayapura District provided an expected increase of about 12.81 words per
minute in the ORF and 21% more correct answers in reading comprehension. Conversely,
attending a second grade classroom as opposed to a third grade classroom was associated
with nearly 7 fewer correct words per minute on the ORF, and almost 10% fewer correct
answers on reading comprehension. Furthermore, having literate parents was expected to
increase students‘ ORF by about 3 words per minute, and result in 5% more correct
answers on the reading comprehension.
In regards to the district impact, it would be interesting to analyze Biak‘s case. Table 4.28
reveals that residing in Biak District provided an expected increase of only about 3 words
per minute in the ORF and about 3% more correct answers in reading comprehension.
Based on the analysis of the SSME components that were discussed in Chapter 3, in general,
the district seems to have relatively similar characteristics as other districts such as Mimika,
Manokwari, and Sorong, yet the impact was slightly lower than those districts. A further
detailed analysis revealed several variables that might contribute to the low impact, namely:
the second highest district with no corrections or feedback from teachers in the students‘
exercise books (77%); the highest district with no parental support for students‘ homework
(60%); the second highest district whose students never studied or spent less than 1 hour to
study at home (74%); the second highest district whose students woke up late or felt lazy to
go to school (34%); the district with the highest percentage of teacher tardiness (53%); the
district with the highest percentage of parents who said that they were never involved by
the school (65%); the highest percentage of teachers who spoke a local language as their
main language (52%); and the highest percentage of head teachers who had less than 5 years
of experience (84%).

3
107
4.7 The Impact of Parents’ and Teachers’ Characteristics on EGRA
Results
A regression model was also applied in order to understand the impact of parents‘ and
teachers‘ characteristics on the ORF and reading comprehension. There were three
variables of parents‘ characteristics that had significant impacts on students‘ reading
performance, namely: parents‘ income, parents‘ level of education, and parents‘ main
language at home. From these three variables, parents‘ income had the largest impact on the
ORF and reading comprehension scores. A student from a better economic background was
expected to have an increase of about 13.86 words per minute on the ORF and an increase
of almost 30% higher correct answers on the reading comprehension.
Table 4.29: Oral Reading Fluency and Reading Comprehension: Impact of Parents’
Characteristics
In addition, students who had parents with a good education level (senior high school or
university graduate) were associated with 5 additional words per minute in the ORF and 7-
8% more correct answers in the reading comprehension as opposed to students with
uneducated parents. Parents' language at home also had a significant impact. A student who
had parents who mainly spoke in Indonesian language at home provided an expected
SSME Category Indicator ORF
(Words/minute)
Reading
Comprehension
(% Correct)
Parent Parent‘s Income Less than 500.000 IDR (ref) - -
500.000 – 999.999 IDR 0.05 1.40%
1.000.000 – 2.999.999 IDR 1.25 2.00%
3.000.000 – 6.000.000 IDR 9.03* 14.70%*
More than 6.000.000 IDR 13.86* 26.90%*
Parent‘s level of
education
Never study (ref)
Primary school 1.01 1.00%
Junior high school 0.81 0.80%
Senior high school 5.42* 7.50%*
University 5.42* 6.70%*
Parent‘s Language Indonesian Language 5.31* 9.60%*
Local Language - -
Constant 3.82 5.00%
ref : signifies the reference group
* : indicates statistical significance at the .05 level

3
108
increase of about 5 words per minute on the ORF and almost a 10% increase in the correct
answers of reading comprehension.
To understand the impact of teachers‘ academic qualifications on students‘ reading
performance, a regression analysis was also applied. A student who was taught by a senior
high school graduate teacher, provided an expected increase of about 7 words per minute in
the ORF and 8.60% increase of correct answers in the reading comprehension. A similar
impact was also identified from teachers who were university graduates.
Table 4.30: Oral Reading Fluency and Reading Comprehension: Impact of Teachers’
Characteristic
4.8 The Impact of School and Classroom Characteristics on EGRA
Results
The impact of school and classroom characteristics on the EGRA score was also examined
using a regression model. There were six factors of a school‘s characteristics that had a
significant impact on the ORF score and reading comprehension, namely: school status
(public or private school), school accreditation, library ownership, reading corner
availability, as well as availability of electricity and clean water resources. These factors had a
relatively similar impact on the EGRA scores. Attending a public school provided an
expected increase of about 2 words per minute in the ORF. In addition, students from a
higher level of school accreditation had the opportunity to increase their ORF score to
about 4-5 words per minute. Meanwhile, the availability of a library and reading corner
improved students' reading performance to about 3 words per minute in the ORF, and
SSME Category Indicator ORF
(Words/minute)
Reading
Comprehension
(% Correct)
Teacher Teacher‘s academic
qualification
Junior high school - -
Senior high school
(SMA/SPG/SPGA) 7.03* 8.60%*
Diploma 1,2,3 3.05* 2.60%*
Bachelor (ref) 6.75* 8.90%*
Constant 4.09 7.80%
ref : signifies the reference group
* : indicates statistical significance at the .05 level

3
109
about a 4-5% increase in correct answers was found in the reading comprehension. Finally,
the school‘s infrastructure such as electricity and clean water also played a significant role in
improving students‘ reading performance.
Table 4.31: Oral Reading Fluency and Reading Comprehension: Impact of a School’s
Characteristics
This baseline study also revealed that various classroom factors had a significant impact on
the EGRA results. There were three factors that significantly contributed to the ORF scores
and reading comprehension results, namely: seating arrangement, availability of other books
in the classroom in which the students had access to read or borrow them, and student
works displayed on the walls. From these three factors, book availability had the largest
impact on the ORF scores and reading comprehension. It provided an expected increase of
about 10 words per minute in the ORF and an increase of about 13% correct answers in the
reading comprehension. From this finding, it can be seen that providing reading books for
children to read in a classroom is important.
SSME Category Indicator ORF
(Words/minute)
Reading
Comprehension
(% Correct)
School School status Public 1.77* 3.80%
Private - -
School accreditation Not accredited (ref) - -
A 1.13 3.60%
B 4.47* 5.70%*
C 3.69* 4.60%*
There was a school library Yes 2.86* 4.20%*
No - -
The school had a source of
electricity
No (ref) - -
Yes, but not functioning today 2.67* 4.90%*
Yes, and functioning today 2.11* 4.30%*
School had clean water
source
Yes 3.67* 5.60%*
No - -
There was a reading
corner where students could borrow and read
books
Yes 3.39* 5.30%*
No - -
Constant 1.69 1.60%
ref : signifies the reference group
* : indicates statistical significance at the .05 level

3
110
Table 4.32: Oral Reading Fluency and Reading Comprehension: Impact of Classroom
Characteristics
4.9 The Overall Impact of SSME Dimensions on EGRA Results
This baseline study analyzed the aggregate impact of all dimensions of SSME, namely
students, parents, teachers, head teachers, as well as school and classroom characteristics
on the EGRA results. All of the variables that had a significant impact on the ORF score and
reading comprehension were simultaneously integrated into a model. The results are
presented in Table 4.33. From the overall model, it can be concluded that there are 12
factors that contributed significantly to the ORF and reading comprehension, namely:
district, student‘s grade, student‘s language, mother‘s literacy, parents‘ income, parents‘
education, teacher‘s academic qualifications, seating arrangement, reading book availability,
school type (public vs. private) and its accreditation, and library availability. These factors
provided an expected increase of more than 5 words per minute in the ORF and more than
a 5% increase of correct answers in the reading comprehension.
SSME Category Indicator ORF
(Words/minute)
Reading
Comprehension
(% Correct)
Classroom
How the students were
seated
Students seated classically (ref) - -
Students seated in small groups 1.94 1.30%
Students seated in pairs 0.46 3.00%
Students seated in U formation 6.22* 10.90%*
Others -2.48 -3.70%
Books/booklets other than
textbooks were available and
accessible (not locked away)
for children to read
None (ref) - -
1 – 9 1.48 2.50%
10 – 19 8.59* 11.10%*
20 – 39 8.72* 15.00%*
More than 40 9.96* 12.90%*
Students‘ work was
displayed on the walls
Yes 3.64* 6.20%*
No - -
Constant 6.05* 9.30%*
ref : signifies the reference group
* : indicates statistical significance at the .05 level

3
111
Table 4.33: Oral Reading Fluency and Reading Comprehension: Impact of all SSME
Dimensions
ORFReading
Comprehension
(Words/minute) (% Correct)
Biak 6.27* 7.70%*
Jayapura 8.89* 14.40%*
Mimika 3.01* 6.30%*
Jayawijaya (ref) - -
Manokwari 4.65* 8.70%*
Sorong 4.70* 7.30%*
2nd
Grade -7.52* -11.10%*
3th
Grade - -
Yes 1.91* 3.20%*
No - -
Indonesian Language 2.29* 3.70%*
Local Language - -
Less than 500.000 IDR (ref) - -
500.000 – 999.999 IDR -1.2 -0.70%
1.000.000 – 2.999.999 IDR 0.47 0.80%
3.000.000 – 6.000.000 IDR 5.18* 8.60%*
More than 6.000.000 IDR 4.4 12.60%*
Never studied (ref) - -
Primary school -0.16 -1.10%
Junior high school -0.72 -1.80%
Senior high school 3.07* 3.50%*
University 4.18* 4.30%
Indonesian Language 0.64 2.50%*
Local Language - -
SSME Category Indicator
Students
Districts
Students‘ grades
Mother knows how
to read
Students' language
Parents
Parents' income
Parents‘ education
Parents' language

3
112
Table 4.33: Oral Reading Fluency and Reading Comprehension: Impact of all SSME
Dimensions (continued)
ORFReading
Comprehension
(Words/minute) (% Correct)
Junior high school (ref) - -
Senior high school 5.99* 7.30%*
Diploma 1,2,3 3.38 3.50%
Bachelor's Degree 3.54 4.50%
Other 1.22 1.70%
Students seated classically (ref) - -
Students seated in small groups 9.33* 11.20%*
Students seated in pairs -0.36 -1.50%
Students seated in a U-formation 5.62* 8.70%*
Other 3.81* 5.60%*
None (ref) - -
1 – 9 2.09 2.80%*
10 – 19 5.33* 5.80%*
20 – 39 6.24* 10.60%*
More than 40 4.40* 5.90%*
Yes 1.35 2.80%*
No - -
Public 2.03* 4.50%*
Private - -
Not accredited (ref) - -
A - -
B 3.53* 3.90%*
C 2.63* 3.30%*
Yes 1.62* 2.50%*
No - -
No (ref) - -
Yes, but not functioning today -1.54 -1.40%
Yes, and functioning today -0.03 0.40%
Yes 0.74 0.90%
No - -
Yes 1.16 2.00%
No - -
-2.35 -4.30%
Schools
School accreditation
Library availability
School type
Source of electricity
Clean water source
Presence of a reading
corner where
students can borrow
and read books
Constant
TeachersTeachers‘ academic
qualifications
SSME Category
Classrooms
Seating arrangement
Books/booklets other
than textbooks are
available and
accessible (not locked
away) for children to
read
Student works were
displayed on the walls
Indicator

113
5.1

113
5.1 Student Interview Findings
For the qualitative interviews, 30 students from 30 schools were selected. They came from
6 districts: Manokwari, Sorong, Jayawijaya, Jayapura, Mimika, and Biak. The interview findings
will describe portraits of the students‘ socio-economic conditions, pre-school learning,
factors that made students absent and tardy from school, teachers‘ roles and reactions to
students, teachers' appreciation of students, and students‘ interest in education.
Portraits of Students’ Social-Economic Conditions
In general, the students selected as the respondents of the in-depth interviews belonged to
the middle and lower classes. They lived in different types of housing, such as a house with
the roofing made of zinc, a house with wooden walls, or even a honai house. These students
commonly lived with their parents and siblings. The number of family members who shared
the house was usually around 3 up to 14 people. The majority of the students had more
than two siblings; there were even some students who had as many as 12 siblings.
“There are 14 people at home. My father, my mother, and my 12 siblings. My father and mother do farming,
planting vegetables and sweet potatoes.” A student from Jayawijaya – Papua
After school, students usually played with their friends, studied, and finished their
homework. Among those who were interviewed, some students revealed that they also
helped their parents‘ work, such as cleaning the house, helping in the field, and catching fish,
sago, or wood.
“At home, I help my mom in the field, get the water, and help her carrying the sweet potatoes” A student
from Jayawijaya – Papua
“I learn how to write, read, relax, get water, and go with my father to gather wood.” A student from
Manokwari – Papua Barat
The students‘ parents did different types of jobs, depending on the locations and the
availability of natural products around their areas. For example, among students who lived
next to the seashore or a river, most of their parents worked as fishermen and shipbuilders.
5 QUALITATIVE INTERVIEW FINDINGS

114
On the other hand, among students who lived in mountainous or highland areas, most of
their parents did farming, had plantations, and gathered wood or sago in the forest.
“My father cuts logs and sets up traps for pigs. My father is a mountain man. My mother cooks at home,
washes the dishes, and does the laundry. My older sibling is in his 5th grade in Manado, my second sibling is in
the 4th grade, while my younger sibling is not yet in school, still 3 years old.” A student from Sorong –
Papua Barat
“My mother works at home, while my father builds ships.” A student from Mimika – Papua
There were also some students whose parents worked as teachers and civil servants. Some
had their own businesses, like running a daily needs store.
“My mother works as a teacher in a class. My father runs his own stall.” A student from Mimika – Papua
“My father is a public transportation driver for my village. My mother works in the field every day.” A student
from Biak – Papua
Pre-School Learning
Based on the quantitative results, about 56% of the sampled students attended PAUD or
TK. Then, the students who were interviewed generally had attended both a PAUD
(Pendidikan Anak Usia Dini or Early Childhood Education) or a TK (Taman Kanak-kanak or
Kindergarten). From six districts in Papua and Papua Barat, only one student of Biak and
Sorong District was once in a TK and PAUD. There were three students who attended a
TK or a PAUD in the Jayawijaya and Jayapura District, and there were four in Manokwari
and Mimika. According to the students, there used to be a PAUD facility in the past, but it
was not running any longer. Each student interviewed who attended a PAUD or a TK said
that they were happy when they studied in PAUD or TK. Because the PAUD or TK was
located nearby in their districts, students went to PAUD or TK on foot with their parents
or friends.
“I was in a PAUD for a week at the church, but it is closed now.” A student from Biak – Papua
“I went to a TK in Milma Village.” A student from Jayawijaya – Papua
“Yes, at TK Warombaim, because I had a lot of friends.” A student from Jayapura – Papua

115
Factors that Make Students Absent and Tardy from School
According to the students‘ answers, there are several conditions that prevented them from
going to school. Figure 5.1 shows a model of the students reasons for being absent and
tardy from school. This model was developed using NVivo, a qualitative data analysis
software.
Figure 5.1. Model of Factors that Make Students Absent and Tardy from School
Internal Factors
Students from Jayawijaya District mentioned that sometimes their parents asked them to go
to the field, and thus, they did not go to school. Some other things that prevented the
students from going to school were due to their own mistakes, like oversleeping or being
lazy. Some could not go because they did not have stationary and books. In Biak District,
three out of five students interviewed stated that they could not go to school due to
malaria.
“I couldn’t go to school because my parents took me to the field.” A student from Jayawijaya – Papua
“I didn’t go since I would arrive late. I played a lot on the way to school so I was late.” A student from
Jayawijaya – Papua

116
“I couldn’t go to school since I overslept. I woke up too late because I watched TV until morning.” A student
from Jayapura – Papua
“I skipped once because I was feeling lazy. I only played at home. Sometimes I was absent because I was
sick.” A student from Sorong – Papua Barat
“Since I didn’t have any books or pens to study at school.” A student from Manokwari – Papua Barat
“Because of malaria.” A student from Jayapura – Papua
External Factors
There were students who reported that the rain prevented them from going to school. The
field observations showed that such rain in the mountainous areas could flood the
transportation paths with mud and thus, made it difficult for people to travel by.
“I didn’t go to school because I got malaria. I just stayed at home for three days.” A student from Biak –
Papua
However, some students that were interviewed admitted that they kept going to school
albeit on foot every day, no matter whether they lived nearby or far away from the school.
The students were not afraid to walk to their school since they went with their friends.
“I am not afraid of walking to school. I am happy because I can study and play with my friends.” A student
from Biak – Papua
Teachers’ Roles and Reactions to Students
Students learned both at school and at home. They studied at school under the guidance of
their teachers, while at home they were under the supervision and the guidance of their
parents. Students perceived the roles of their teachers positively. For those students, the
teachers taught well, and they also included fun activities, like singing and playing games. The
learning activities usually took place in the classroom. Students did outdoor activities when
they worked together to clean the school environment.
“We just study inside our classroom. We have an outdoor activity when our teacher asks us to clean the
yard.” A student from Biak – Papua

117
“We have activities outside the class only to weed the grass.” A student of Manokwari – Papua Barat
Besides learning in class, the students were also assigned homework. Sometimes, the
students did not do their homework. As a punishment for not doing the homework, the
teacher asked them to do their homework in class.
Punishment to a Student – Jayapura
My teacher gave me homework to do at home. Sometimes, I forgot to do it at home. When I went
to class the next morning, the teacher asked me to do my homework in the class until I was finished.
Figure 5.2 showed more about the teachers' reactions to students who didn't do their
homework based on the findings of the student interviews.

118
Figure 5.2. Model of Teachers’ Reactions to Students Who Didn’t Do Their Homework
According to the students, other teachers‘ reactions when the students did not do their
homework were:
1. Standing in the front of the class or outside the class
Some of the teachers punished students by making them stand in front of the class
or outside the class. This activity only lasted for a few minutes, and when the
punishment time was over, the teacher let the students sit.
“My teacher made me stand for a few minutes in front of the class, but then let me sit.” A student from
Sorong – Papua Barat
2. Writing their homework on the board and prohibiting the students from going home
before they finished their homework

119
One of the teachers from Biak punished the students by making them do their
homework on the board in front of the class or prohibiting the students from going
home before they finished their homework.
“Punished, my teacher made me do my homework in front of the class.” A student from Biak – Papua
3. Hitting students with a rattan and tweaking students‘ ears
One of the teachers from Jayapura hit the students with a rattan if they did not do
their homework. However, one student said that the teacher didn‘t hit him hard
with the rattan.
“My teacher hit me with a rattan cane, but not too hard.” A student from Jayapura – Papua
4. Scolding and humiliating the students
The students from Manokwari said that if they got bad grades, their teacher would
scold them and tell them to study hard. Other students from Manokwari said that
the teacher said that they were stupid in the front of the class.
“If my grade was bad, my teacher didn’t like it. He told me that I was stupid.” A student from Manokwari
– Papua Barat
5. Doing nothing
There were also some teachers who did not give any kinds of punishment for
students who did not complete their homework or did not do it well.
“My teacher did not give any grades; he didn’t do anything. He would tell the answers later on.” A student
from Jayapura – Papua
Teacher Appreciation to Students
In general, teachers appreciated students who finished their homework or their assignments
well by praising them. Figure 5.3 showed a model of the teachers' appreciation towards
their students.

120
Figure 5.3. Model of Teacher Appreciation to Their Students
Some teachers also gave gifts and exempted the students from doing their next assignments.
One of the teachers in Biak District gave dolls as gifts to the students who could complete
the assignments well and correctly. Another teacher in Jayapura gave a Pinang Fruit (Areca)
as an appreciation for students who did their homework well.
“My teacher told me that I was smart. She then told me to reread it. She never gave me any gifts.” A
student from Jayawijaya – Papua
“Once my teacher gave me a Barbie doll since I could answer the questions correctly and well.” A student
from Biak – Papua
“My teacher didn’t praise me, but he gave me an Areca.” A student from Jayapura – Papua
“My teacher praised me, she told me that it was good and she told me that I would pass, and excused me
from doing the other assignment.” A student from Manokwari – Papua Barat
Parents’ Roles at Home
Students‘ learning activities also took place at home. During that process, teachers played an
important role in guiding and supervising the students' studies. Besides parents, siblings also
helped the students‘ learning process at home. For example, students from the Jayawijaya
District received assistance from their siblings when their fathers were busy working.

121
“My father helps me do my homework. When he is working, my older sibling helps me.” A student from
Jayawijaya – Papua
During the learning process at home, both parents and siblings also read books to the
students. These books were generally textbooks, religious storybooks, and children‘s
storybooks. If the parents were unable to read, the siblings or the uncle replaced their role.
“My mother helps by reading the school textbook and storybook for me.” A student from Biak – Papua
“My older sibling reads to me, but not my parents. My mother cannot read.” A student from Jayawijaya –
Papua
“She did. My mom usually reads to me. She usually reads books that tell stories about God to me.” A
student from Jayapura – Papua
When the parents could not fulfill their roles at home, there were grandparents who
replaced the parents‘ duties.
The Grandparents’ Role at Home – Biak
My father works in Jayapura and never comes back home. My mother works in Serui and only comes
home once every three months. I live with my grandparents, and they always watch me study at
home.
There were also some students who studied by reading independently without the help of
their parents or siblings.
“Nobody reads books to me. My mother cannot read. I read by myself and practice writing. When I feel
sleepy, I directly go to sleep.” A student from Jayapura – Papua

122
Students’ Interest in Education
Students had a strong interest and passion to study. The students revealed that they were
happy when they studied at school. One of the reasons was because the school would make
them happy and make it easier for them to achieve their aspirations.
Students‘ aspirations varied, such as to become a teacher because this profession educates
people to be smart, to become a doctor because a doctor heals people‘s illnesses, to
become a soldier because a soldier will protect the security of the village, to become a civil
servant, and to become a mechanic in order to get money.
“I dream to be a doctor when I’m grown up, since I will be able to give injections and prescribe medicine.” A
student from Biak – Papua
“To become a teacher who shares knowledge with everyone.” A student from Biak – Papua
“To become a nurse, because I can then work in a hospital, looking after and giving medicine to sick people.”
A student from Biak – Papua
“A soldier, so I can protect my own village.” A student from Jayapura – Papua
“A civil servant because I can just sit, but I get money.” A student from Manokwari – Papua Barat
“I want to be a teacher, because I can make people smart.” A student from Sorong – Papua Barat
5.2 Parents’ Interview Findings
In this study there were 30 parents from 30 schools involved. They came from 6 districts;
Manokwari, Sorong, Jayawijaya, Jayapura, Mimika, and Biak. The parents‘ interview findings
described children‘s roles at home, difficulties that the children encountered at school,
parental support, challenges in parenting, parents‘ perceptions and interest in education, and
parents‘ hope for school.
Children’s Roles at Home
At home, children generally studied, helped clean the house, and sometimes joined their
parents in their work. Parents who made their living by farming, taking care of their
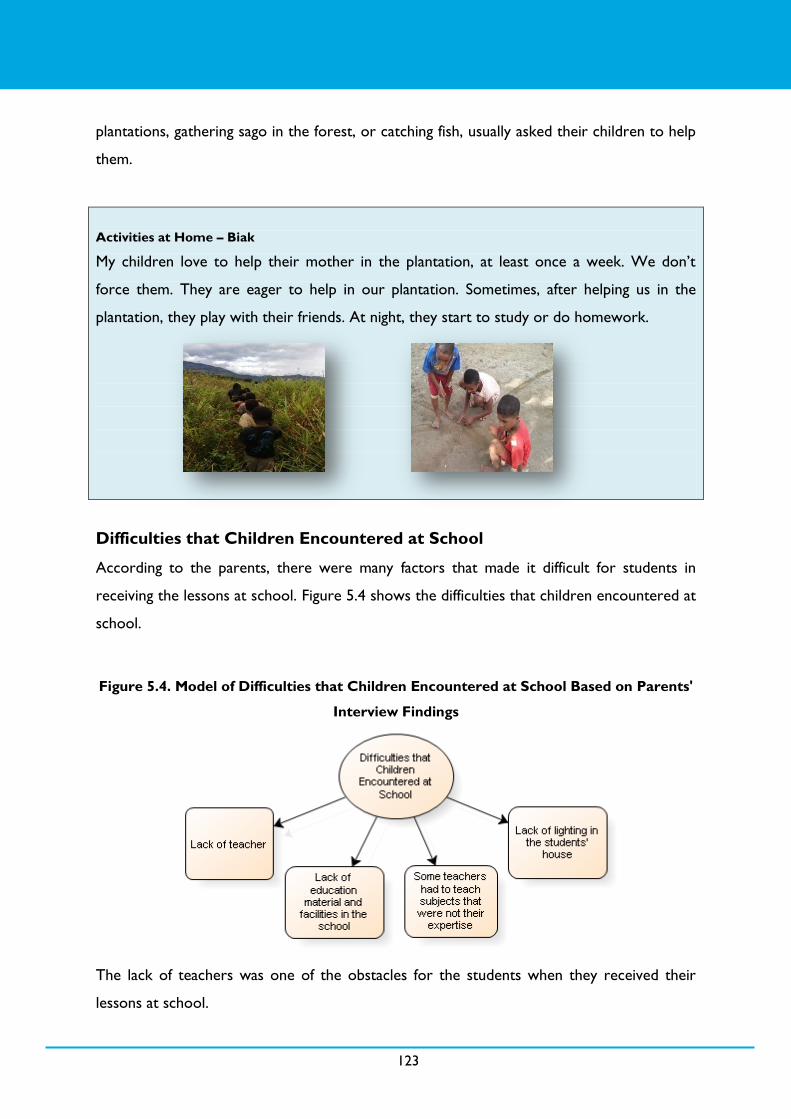
123
plantations, gathering sago in the forest, or catching fish, usually asked their children to help
them.
Activities at Home – Biak
My children love to help their mother in the plantation, at least once a week. We don‘t
force them. They are eager to help in our plantation. Sometimes, after helping us in the
plantation, they play with their friends. At night, they start to study or do homework.
Difficulties that Children Encountered at School
According to the parents, there were many factors that made it difficult for students in
receiving the lessons at school. Figure 5.4 shows the difficulties that children encountered at
school.
Figure 5.4. Model of Difficulties that Children Encountered at School Based on Parents'
Interview Findings
The lack of teachers was one of the obstacles for the students when they received their
lessons at school.

124
“I think my child is hardworking, but there aren't enough teachers. This school is good, it’s near the street,
active, but from back then, I see that it doesn’t have enough teachers.” A parent from Biak – Papua
“The issue is a lack of teachers. There are 2 government and part-time teachers. For sure, the school’s lack of
teachers will make it difficult for the students to study.” A parent from Manokwari – Papua Barat
“Regarding the difficulty in studying, I think what prevents my child to study is the fact that the teacher has to
give more attention to those other students who can’t read yet, while my child can already read.” A parent
from Mimika – Papua
“The issue that the children have at school is with reading. Oftentimes, there isn’t a teacher to teach them,
and thus they feel not really motivated to learn how to read.” A parent from Biak – Papua
A parent from the Manokwari District thought that the quality of the teachers in their area
was still low. Some teachers had to teach subjects that were not their expertise, for
example, a religion teacher taught Mathematics and Indonesian language. The parents
thought that children would not learn effectively when teachers who taught the subjects did
not have proper qualifications.
“I don’t think the children themselves have problems. Instead, I feel that it’s the content that is lacking in
quality. This primary school here has always lacked teachers. Furthermore, the teachers available here also
lack knowledge. For example, one teacher has background knowledge in Religion, but s/he has to teach
Mathematics and Indonesian Language. They don’t master those subjects.” A parent from Manokwari –
Papua Barat
However, some other schools had a sufficient number of teachers, and parents hoped that,
with additional lessons, students at early levels would absorb the lessons better.
“There isn’t any additional lesson, only for those in the 6th grade. Thus, parents have to help the children at
home.” A parent from Sorong – Papua Barat
A parent in the Jayawijaya District stated that his/her child encountered difficulty in receiving
lessons at school due to the lack of lighting facilities in their house. Their house was a honai
that only had limited lighting.
“We have an issue. There isn’t proper lighting at our house, so sometimes we have to use fire, a candle, or a
flashlight. That’s the only issue.” A parent from Jayawijaya – Papua

125
Parental Support
Parents played an important role in the development of their children‘s education by guiding
and monitoring the learning activities at home. The parents‘ interest in their children‘s
education was very high, although they sometimes made their children help them to sustain
their livelihoods during school hours. However, some parents acted reversely.
Parents who refrained their daughter from going to school – Jayawijaya
My youngest child is a girl. She doesn‘t go to school. I just make her stay at home until she gets
married later. She is willing to go to school. We get money from the foundation, but I don‘t want
her to go to school. When she‘s older I will just make her marry someone.
There were parents from the Jayawijaya District who did not allow their daughters to go to
school, although they already got educational support from certain foundations. They only
had their daughters stay at home and would marry them off as they grew up.
However, the parents mostly really supported their children to go to school. Parental
support was divided into two categories, emotional support and financial support. Figure 5.5
shows a model of the parental support of their children‘s education:

126
Figure 5.5. Model of Parental Support to Their Children’s Education Based on Parents’
Interview Findings
Emotional Support
In general, they showed their supports by motivating and encouraging their children. Parents
also accompanied their children when they studied at home. By accompanying their children,
parents created a positive bond between themselves and their children.
Financial Support
Most of the parents prepared meals for their children and also provided the materials that
the students needed for their study. The parents from the Jayawijaya District also motivated
their children by giving them bicycles when they passed a grade.
“Yes, probably by giving pocket money. I motivate my child to go to school. Before my child goes to school, s/he
has his/her breakfast first, a sweet potato and a cup of tea, if we have it. If not, just a sweet potato. I also
prepare him/her a lunchbox.” A parent from Jayawijaya – Papua

127
Picture 5.1: Selling
“I want them to go to school. Therefore, I encourage them by giving them pocket money and paying the school
fees.” A parent from Manokwari - Papua Barat
“I support him/her. For example, if s/he graduates from primary school and continues to junior high school, I
will buy him/her a bicycle, since the distance from our home to school is far. I hope that makes him/her
motivated to go to school.” A parent from Jayawijaya – Papua
Parents supported their children because they wanted their children to have a better life
than they did. Although these parents belonged to the lower economic class, their
awareness of the importance of education for the future was present.
“Probably by giving advice. It’s obvious that it’s difficult to study over here. So, I told my child, since your dad is
someone who sells fish, you have to study well, so that one day, you won’t be a person who sells fish, but a
person who buys it.” A parent from Mimika – Papua
“When at school, you should listen to your teacher, and when you go home from school, you should do your
assignments. I also help with the lessons if something is difficult.” A parent from Manokwari – Papua
Barat
Challenges in Parenting
Before answering questions about the obstacles or difficulties they had experienced, the
parents first received five pictures, namely Picture 5.1: Selling, Picture 5.2: Gathering Wood,
Picture 5.3: Gathering Sago, Picture 5.4: Wooden Bridge, and Picture 5.5: Illiteracy.
Generally, those five pictures showed the
obstacles or difficulties faced by the
students‘ parents. Those parents who had
ever worked or were working as sellers
described (Picture 5.1) their difficulty in
giving attention to their children, especially
the ones regarding the development of
their children's education.
“I chose Picture 5.1, because I used to be a seller, and I felt how difficult life was. It’s better now because I’m
a supervisor for a palm oil plantation.” A parent from Sorong – Papua Barat

128
“Picture 5.1, because parents are busy going to the market and planting, and thus it’s difficult for me to see
the development of my children at school.” A parent from Jayapura – Papua
Parents usually prepared their children‘s needs in the morning. For example, they prepared
the children‘s clothes and breakfast, and they made sure that their children had taken a bath.
Besides that, the parents always encouraged their children to stay motivated to go to
school.
“I prepare what my children need to go to school in the morning, such as their breakfast. I make sure they
have already taken a bath, and I prepare their uniforms.” A parent from Jayapura – Papua
“A child should go to school and study well, remember what his/her parents advise him/her for his/her future.”
A parent from Jayapura – Papua
Some parents were worried that they could not afford to finance their children if they could
not trade in the market. One of the parents from the Biak District stated that when they
could not sail and thus, could not sell fish, they would then look for other alternatives to
sell, such as palm oil.
“Saving money, I manage my money. When the weather is not good, I sell palm oil at the Bosnik Market” A
parent from Biak – Papua
“Picture no 5.1 (market) is an obstacle of parents who are farmers. The issue is when I sell produce, but
nobody buys it. So, I don’t have any money to pay the tuition fee.” A student from Biak – Papua
Parents also revealed the obstacles they faced
when they were gathering wood (Picture 5.2). It
was wood that people used for their daily lives;
parents sold it to pay for their daily needs. To
gather that wood, it required time and energy,
and thus it took away the parents‘ attention from
their children. To deal with that obstacle, parents
explained their condition to the children and
asked for their children's understanding.
Picture 5.2: Looking for Wood

129
Picture 5.3. Looking for Sago
“Picture 5.2. We cook with wood. We have to gather wood for cooking, and thus we get tired. Carrying wood
back and forth is tiring, and then I still have to look after my children.” A parent from Manokwari –
Papua Barat
“For this very problem, children have to go to school. They should make progress with their school work, so
that they can later on become an officer, a regent, or a soldier. Then they can help their parents.” A parent
from Manokwari – Papua Barat
“I usually sell things, gather firewood, and gather sago. They become obstacles for me in educating my child.
But our school is free, so we can still afford it.” A parent from Sorong – Papua Barat
Parents usually got help from their children when they were gathering wood, as mentioned
by a parent from the Jayapura District.
“Number 5.2. Our child sometimes helps us to gather wood. My wife does too. Then, we sell that wood.” A
parent from Jayapura – Papua
Parents from the Mimika District pointed at
Picture no 5.3, as an obstacle that they were
facing. The children usually also helped to plant
and gather the sago, although the parents actually
preferred them to go to school.
“Picture no 5.3. It’s a picture that shows planting vegetables, gathering sago. Yes, because my child goes with
me. That becomes an issue.” A parent from Mimika – Papua
“We always tell our children that our work is heavy; they don't need to do it. This work is indeed our living, but
we also have to progress with our lives.” A parent from Mimika – Papua

130
Some parents also faced an obstacle in the form of
transportation, like when the bridge that connected
the villages was broken (Picture 5.4). For them, the
bridge was an important connecting infrastructure
between villages, because there was no other
alternative means to reach the other village.
“Picture no 5.4 (bridge). It connects our village to the other village.” A parent from Biak – Papua
“Since the road is ruined, and the bridge is out of order, our children cannot go to school” A parent from
Jayawijaya – Papua
Parents also considered the fifth picture as an
obstacle and barrier. As they themselves, neither
the mother nor the father, were able to read, it
was difficult for them to help their children to
study at home. If only one of the parents was
unable to read (for example, the mother), then it
was the duty of the father to help the child to
study at home.
Picture 5.5: Illiteracy
“Number 5, since I myself cannot read.” A parent from Jayawijaya – Papua
“Number 5, since we need to get rid of illiteracy. Many of us didn't go to school, and thus they can’t read.” A
parent from Biak – Papua
“Picture 5, because if we are illiterate, how will we introduce letters to our children.” A parent from
Jayawijaya – Papua
“Number 5. I accompany my child and help with the studying at home. My wife didn’t go to school.” A
parent from Jayawijaya – Papua
Picture 5.4: Wooden Bridge

131
In every district, there were several parents who felt that they did not face any significant
obstacles or barriers. Those parents were certain that when their children got a good
education, it would benefit their family in the future.
“I feel motivated. There isn’t any obstacle or difficulty. I think I have to help my children now, so they can help
me in the future.” A parent from Mimika – Papua
Parents’ Perceptions and Interest in Education
Parents considered education as an important thing in order to get a better future. They
sent their children to school with the hope that their children could obtain a better future,
and later on, would be able to help their parents, or even better, could get their families out
of poverty. Figure 5.6 shows the parents‘ perceptions and interest in their children‘s
education.
Figure 5.6. Model of Parents’ Perceptions and Interest in Education Based on Parent
Interview Findings
“I hope that they will be good and perfect human beings. We have to get rid of our habits as Komoronese and
Papuans. I think they need to go to school. Those children have to be better than their parents.” A parent
from Mimika – Papua
“I hope my child learns at school; how to read, to write, and to count. Thus, s/he will be a better person in the
future.” A parent from Sorong – Papua Barat
“Children have to go to school since it’s for their own future. And if their parents are already unable to work,
they can make their own living, for example, by taking a test to be civil servants. They can be individuals who
can make their own livings.” A parent from Manokwari – Papua Barat

132
Parents’ Hopes for School
Parents had high hopes for the schools. Parents from the Mimika District hoped that their
children would be able to compete with children from cities.
“I hope that my children here can study as well as those who are from the cities. Regarding the difficulty with
reading, I want them to be able to read fluently since the first grade.” A parent from Mimika – Papua
Parents from the Sorong District hoped that the teachers in their area would be more
active in teaching and that they did not skip classes too often, since the absence of the
teachers at school decreased the students‘ motivation to go to school.
“I hope that the teachers here, especially the female teachers, can be more active. When only the male
teachers are active, our children often miss their studies.” A parent from Sorong – Papua Barat
The quality and the qualifications of the teachers who taught there was also one of the
parents‘ concerns, especially for teachers who taught Indonesian language subject. According
to parents from the Manokwari District, teachers who taught English were generally of
better quality than those who taught Indonesian. Besides that, it would be better if the
schools could provide other local language lessons, such as Serui, Biak, and Mandacan
languages.
“There are many lessons that children receive at school, for example, English. The teacher that teaches the
subject is an expert in that subject. Why is that not the case with Indonesian? Many students here did not
pass the Indonesian language exam. There is a severe lack of reading lessons here. Students also need to be
taught Papuan language, like Serui, Biak, and Mandacan languages. They need to speak those languages.” A
parent from Manokwari – Papua Barat
Other facilities that the students needed were a library or a mobile library that, in the
parents‘ opinion, would increase the students‘ motivation to read. Moreover, the
government had to really monitor the schools.
“I hope to see a main school that accommodates students with above average academic achievement, which
is strictly supervised by the government. Hence, it will create a smart generation. Besides that, there is a need
to have a mobile library that can increase the students’ motivation to read.” A parent from Biak – Papua

133
Some students skipped school because they went with their parents to the forest to gather
sago, and this usually took a long time. The parents explained that they had to take their
children to the forest or to the field since nobody watched over their children at home. A
parent from the Mimika District suggested building a dormitory for such children. With the
presence of such a dormitory, parents would not have to worry about their children when
they did their activities.
“Yes. Once someone from UNICEF came, and we said this. If there’s a dormitory here, there will be someone
who can watch over our children.” A parent from Mimika – Papua
5.3 School Principal Interview Findings
In this study there were 30 principals from 30 schools involved. They came from 6 districts
covered; Manokwari, Sorong, Jayawijaya, Jayapura, Mimika, and Biak. Therefore, each district
was represented by five principals. The school principals' interview findings explain about
the principals‘ roles, students‘ constraints from principals‘ perspectives, school rules,
educational aid programs, and policy implementation.
Principals’ Roles
A principal, as the leader of the school, had many roles. Figure 5.7 gives a clear picture of
the principals‘ roles. Those roles are related to the teachers, students, and school.

134
Figure 5.7. Model of Principals’ Roles
Roles Related to the Teacher
Monitoring Teacher Roles
The first role related to the teacher is monitoring the teachers‘ roles in teaching. From the
principals‘ perspectives, from their observations, some teachers carried out their roles well.
Nonetheless, there were some who did not. The reason for this was the poor economic
situation of the teachers whose welfare was not cared for. The other obstacles that the
teachers experienced were the low students‘ attendance, the students‘ laziness, the threats
from the parents should the students fail, and the lack of supporting facilities and
infrastructure.
“The obstacles that the teachers encounter in performing their duties in this school are the personal economic
situations and the students’ issues. Therefore, other efforts to fulfill the teachers’ needs are required.” A
principal from Manokwari – Papua
“Students’ laziness in studying, the low student attendance, and the threats from the parents should their
children not pass.” A principal from Jayapura – Papua
“The lack of books and visual aids to support teachers while teaching.” A principal from Sorong – Papua
Barat

135
Monitoring Teacher Attendance
Besides monitoring the teachers‘ roles in teaching, the second role is monitoring the
teachers‘ attendance rate at school. The rate varied too. There were teachers who came to
school every day, but there were some who did not. The causes for their absence were
various. It could be due to an official work duty, a personal/ family-related issue, a health
issue, an economic issue, or insufficient welfare. Nonetheless, there were some teachers
who were absent because they were lazy and irresponsible.
“Some teachers are active, but some aren’t. The reasons vary, like no housing, no welfare incentives, or their
own laziness and irresponsibility. I once asked them if they had other jobs, but they didn’t answer. I already
told the Head of the Department to demote those inactive teachers or to cut their wages, but since the wages
are still given, those teachers don’t feel troubled.” A principal from Jayawijaya – Papua
“The teachers’ attendance rate at school is quite good. Teachers are usually absent when they really have an
urgent matter to attend to, whether it is an official or a personal one, like getting sick.” A principal from
Sorong – Papua Barat
Teacher Replacement
The third role is in some schools that had a limited number of teachers, the principal also
had to substitute the teachers who did not come to school to teach the students. The lack
of teachers and teachers‘ absenteeism were some of the problems that the principal had to
face in performing his/her duty. On one hand, the principal had to prepare him/herself to
teach, while on the other hand, s/he still had many other responsibilities.
“Helping the teacher by becoming a substitute, encouraging the teachers and the students, giving additional
tasks to the teachers, like additional lessons for the students in the afternoon.” A principal from Jayapura
– Papua
“From my experience so far, the teaching staff is very insufficient. There is only one part-time teacher here, so
I also have to play a role as a teacher to help teach in the class.” A principal from Jayawijaya – Papua
Motivate Teachers in the Teaching Process
The last role related to the teacher is the principal could be a motivator for them in the
teaching-learning process. The principal could give spirit, evaluate, and give guidance in the
teaching-learning process for the improvement of the teachers‘ quality.

136
“The principal in this school has given the motivational spirit, provided guidance, and directed the teachers in
the teaching-learning process.” A principal from Manokwari – Papua Barat
Roles Related to the Student
Motivate Students in the Learning Process
The first primary role related to the student is motivating students in the learning process.
So the motivation did not only come from the teacher but also from the principal. The
principal also had to know the students‘ conditions and whether or not they were lazy to go
to school. Besides that, the principal had to know how much the students were involved in
the learning process.
Monitor Student Attendance
The second principal role related to the student is monitoring student attendance. Some
principals in several schools would monitor their students with the class teacher or observe
the class directly. If they found the students did not attend, they would ask the reason on
another day when they came.
Roles Related to the School
Improving the School Quality
The first role is the presence of a principal in a school could help improve the quality of
the school. A principal who was constantly present at school could perform his/her duties
effectively and could make the school well-supervised. Nonetheless, there were some
principals who rarely came to school. This absence could be due to a number of different
things, like carrying out an out of town work-related duty. It could be due to personal/
family-related issues too. Issues like a sickness in the family, or the distance of the house
worsened by the difficult and expensive cost of transportation could make it difficult for a
principal to go to school.
“The principal has not showed up at school since December or January 2015, and thus, nobody plays the role
as an evaluator.” A principal from Biak – Papua
“This new principal regularly comes to school, and many changes are visible, unlike the previous principal.” A
principal from Mimika – Papua
137
“If there’s an official duty like attending an invitation from the Department of Education, the principal cannot
come. The event usually takes place on market days, like Tuesdays, Thursdays, or Saturdays. Another reason
that makes the principal miss the school is a family-related issue that can’t be left. The principal will then
usually have 1 or 2 days off from school.” A principal from Sorong – Papua Barat
Supervision of the Teaching-Learning Process in School
The second role is supervision. Besides the attendance of the principal, supervision of the
teaching-learning process was also necessary to improve the school‘s quality. The
supervision could be performed by the principal or by the school superintendent. The
frequency of the supervision varied, depending on each school‘s policy. Some schools had
this every day; some had it 1-3 times in a month; some had 1-2 times per semester; while
some did not schedule the frequency of class supervision. The activities that the principal
performed while supervising the class were observing how the teachers taught, watching the
students‘ classroom participation, and giving feedback after the class was over. Once in a
while, the principal also observed the class attendance of both the teachers and the students
in the class, checking how many times they were absent. The District MOEC provided some
schools with a supervision form that the principal had to fill out. This form could help the
principal to perform his supervision.
“I look at the teaching method that the teacher uses in the class, give assessment in the supervision form for
teachers provided by the Department. When teachers see their weaknesses in teaching on that form, teachers
can immediately improve their teaching methods.” A principal from Jayapura – Papua
“I observe how the teachers teach, and see the participation of the students.” A principal from Sorong –
Papua Barat
“I sit in the class and watch how the teacher teaches. If I see any weaknesses, I’ll let the teacher know after
the class. I also check student attendance on the list.” A principal from Mimika – Papua
The next supervision is by the school superintendent. The frequency of the supervision by
the school superintendent also varied. Some of them frequently came, 2-3 times a month,
but some never came at all. The roles of the superintendent were generally to examine how
the policies in relation to the teaching system were carried out, whether these policies
worked well, and if they helped to solve emerging issues. Nevertheless, not all
superintendents carried out their duties optimally. There were many complaints from the

138
schools, stating that they had hoped that the superintendent would help, but in the end the
schools did not get any solutions for the problems.
“The frequency of the school visits by the superintendent is an average of 2 times per month, at the beginning
and the end of the month, in order to check the teaching and learning process. The roles and the performance
of the superintendent in this school are not optimum. The superintendent usually just supervises without giving
any solutions for the problems that the school is facing. We have reported a complaint to the superintendent,
but there isn’t any solution for the issue being experienced by the school.” A principal from Biak – Papua
Conduct School Financial Management, Plan School Activities, and Do
School Administration Activities
The last role that is related to a school is all about the school administration, school
management, and financial aspects. The principal had to arrange the school activities, as well
as plan and manage school financial aspects. Every year, the principal had to think about
what the best plan was for the school for the next year and how to allocate the existing
funds for the plan. Besides that, the principal also played a role in the school‘s administrative
activities.
“The principal in this school is in charge of the school management for the school activities and school funds.
The principal sometimes went to the city to do administrative tasks.” A principal from Manokwari –
Papua Barat
Students’ Constraints from Principals’ Perspectives
The students‘ constraints became the principals‘ concern because it influenced how the
principals played their roles. Figure 5.8 gives a clear picture about the constraints that the
students faced from the principals‘ perspectives.
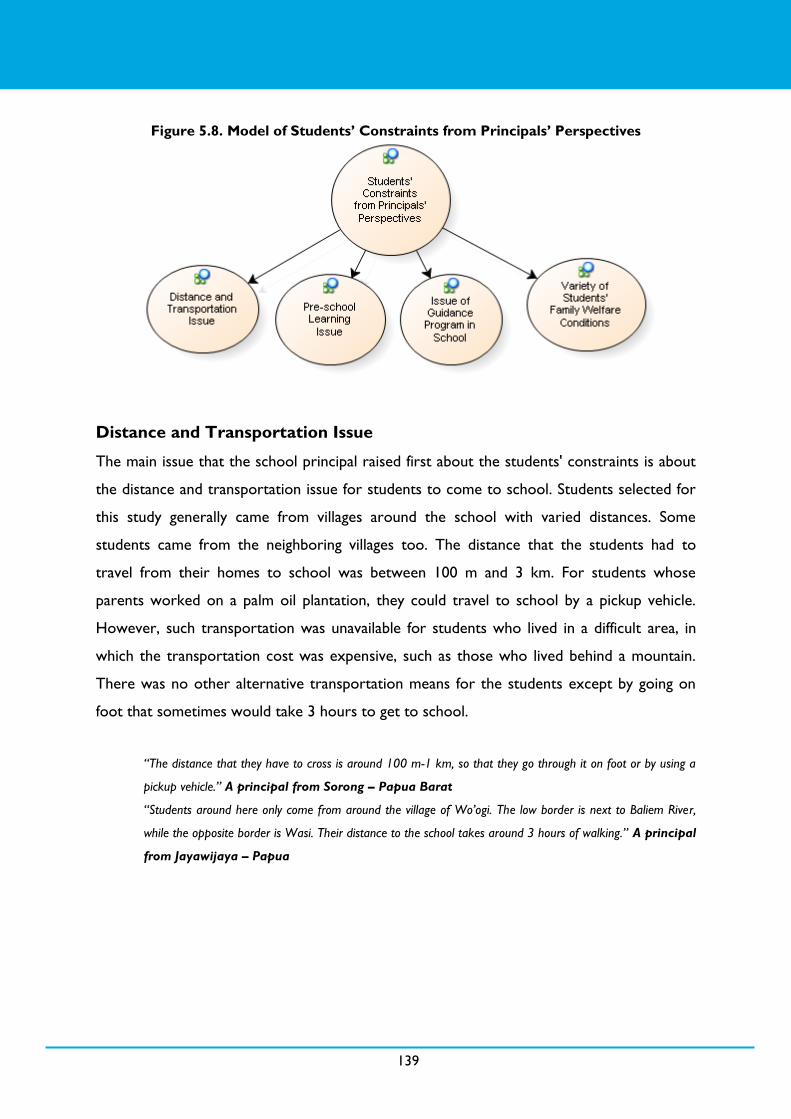
139
Figure 5.8. Model of Students’ Constraints from Principals’ Perspectives
Distance and Transportation Issue
The main issue that the school principal raised first about the students' constraints is about
the distance and transportation issue for students to come to school. Students selected for
this study generally came from villages around the school with varied distances. Some
students came from the neighboring villages too. The distance that the students had to
travel from their homes to school was between 100 m and 3 km. For students whose
parents worked on a palm oil plantation, they could travel to school by a pickup vehicle.
However, such transportation was unavailable for students who lived in a difficult area, in
which the transportation cost was expensive, such as those who lived behind a mountain.
There was no other alternative transportation means for the students except by going on
foot that sometimes would take 3 hours to get to school.
“The distance that they have to cross is around 100 m-1 km, so that they go through it on foot or by using a
pickup vehicle.” A principal from Sorong – Papua Barat
“Students around here only come from around the village of Wo’ogi. The low border is next to Baliem River,
while the opposite border is Wasi. Their distance to the school takes around 3 hours of walking.” A principal
from Jayawijaya – Papua

140
Pre-school Learning Issue
The second issue the principals raised as well is the pre-school learning issue. The average
age of the students when they started the 1st grade was 6-7 years old, but there were some
students who were younger than 6. Most of the students did not enroll in a TK/PAUD
before they started primary school since there was not any TK/PAUD where they lived.
Nonetheless, since the parents cared for their children‘s education, they sent those children
to school even when they were still below 6 years old.
“The average age when they start going to school in the 1st grade is 6-7 years old. They have never been in a
TK or a PAUD, since there isn’t any in their village. Students enroll in this school based on their age, not by the
academic capabilities of themselves.” A principal from Jayapura – Papua
Issue of Guidance Program in School
Some schools did provide a guidance program for their students, but the majority of the
schools did not. The program usually focused on the 6th grade students to help them
prepare themselves for the final examination. The absence of the program for students from
other levels was due to the lack of teachers, the teachers‘ workload, the travel distance, and
the time for the program. Some extracurricular programs offered at the schools were
Pramuka (boy scouts / girl scouts) as well as arts and handicrafts.
“Since the teaching staff is limited, the principal admits that the school has never performed a remedial
program, guidance program, or extracurricular activities.” A principal from Manokwari – Papua Barat
“Other study programs besides the regular ones in the classroom in this school are only additional lessons for
students in the 6th grade. Other classes don’t have a guidance program, remedial program, or extracurricular
activities.” A principal from Mimika – Papua
Variety of Students’ Family Welfare Conditions
Another issue which was raised by the principal was about the variety of students‘ family
welfare conditions. Students came from various socio-economic backgrounds, as well as
different living standards. Some parents worked as civil servants, while some relied on
natural resources, like those who were fishermen or farmers. The parents‘ incomes also
varied. Some had stable and sufficient incomes since they had permanent jobs, but some did
not. Students who belonged to less fortunate families usually had troubles in fulfilling their

141
educational needs. This affected the children‘s involvement at school. For example, some of
them rarely came to school since they had to help their parents.
“In general, the economic status is below the standard. Some don’t have a stable income. Thus, some students
have to help their fathers/mothers earn money.” A principal from Manokwari – Papua Barat
“They will directly sell what they have caught during the market days (Tuesdays, Thursdays, and Saturdays) in
Bosnik Market, Biak Timur. The average income that they get from selling the fish they catch is from Rp.
100,000 to Rp. 200,000.” A principal from Biak – Papua
Educational Aid Programs
In doing the teaching and learning process, schools required the support of many sources.
Figure 5.9 gives a clear picture about the sources and functions of school educational aid
programs.
Figure 5.9. Model of Students’ Constraints from Principals’ Perspectives

142
Educational Aid Programs from the Central and Local Government
The first educational aid program source from the central and local government could be in
the form of either funding or goods. Financial support consisted of Bantuan Operasi Sekolah
(BOS or School Operational Help), Bantuan Operasi Sekolah Daerah (BOSDA or Local
School Operational Help) such as the one in Sorong District, and Dana Alokasi Khusus
(DAK or Specially Allocated Funds). BOS and BOSDA were used to buy books, stationary,
uniforms, other supporting teaching facilities at school, and even to pay the salary of the
part-time teachers. In contrast, DAK was used to build or renovate school buildings and
teacher housing.
“The support from the central government is in the form of Dana Alokasi Khusus (DAK) and is used to
rehabilitate the school buildings and to build a library in 2013. Besides that, they also sent some textbooks for
the 2013 Curriculum for the students just a few days ago.” A principal from Biak – Papua
“The support that comes from the central and local government is in the form of uniforms, shoes, BOSDA
funds, materials for athletic uniforms, and batik.” A principal from Sorong – West Papua
“The government provides some help, which is the BOS fund. We usually use this to buy books and student
uniforms, and to pay the part-time teachers.” A principal from Jayapura – Papua
Educational Aid Programs from Local Communities / School Committees
and Public Figures
The second educational aid program was from local communities / school committees and
public figures, but there were some that did not get any from the communities. The
community members did not help because they did not have any money to give. For such
areas, the communities usually gave their support through moral support, such as
maintaining the schools‘ security. Other support came in the form of giving ideas to the
principal, lending equipment, or providing ships for the students. They usually provided the
ships when the schools had an event like an exam. Hence, the students could travel to
school easily. The local communities also helped the schools by providing manpower, for
example, by helping to make or repair the school fences. There were even school
committees that diligently looked for money to pay the English teacher; to fund the class,
office, and operational administrative needs; and to pay for the school physical maintenance.
The committee struggled for the school building since the land where the school stood still
belonged to the local people.

143
“Local people/NGOs/school committees/public figures show their support when there is an event at school, l ike
an exam. People will help by providing ships.” A principal from Sorong – Papua Barat
“Every month, the school committee collects funding from parents in order to pay for the English teacher, and
to pay for the class administrative needs, the office, and the school building. We need to struggle for the
school building since the land where it now stands still belongs to the people.” A principal from Jayapura –
Papua
Educational Aid Programs from Religious Leaders
The religious leaders also showed support; this is the third source. Each school received
different kinds of aid. There was a school that received money. This fund was later on used
to buy teaching stationary, like chalk, as well as to pay the part-time teachers every three
months. Another school received money too, and it was used to set up electricity, provide
clean water, and buy a genset (diesel generator). However, besides money, the religious
leaders also provided support by giving Bibles, as well as giving special prayers when the
students were going to have an exam.
―The support from the religious leaders of the church was in the form of money to buy teaching materials, like
chalk, as well as to pay incentives for the part-time teachers, given every three months and as much as Rp.
500,000.” A principal from Biak – Papua
“The religious leaders once gave aid in the form of money to be used to install electricity, to buy a genset, to
provide clean water (DAP), to clean the school’s yard, as well as to build a multi-purpose field.” A principal
from Jayapura – Papua
“The aid is only in the form of a prayer. When there’s a meeting or it is near graduation, the leader prays for
their success.” A principal from Jayawijaya – Papua
School Rules
Basically, the principal and the teachers determined the school rules. After the rules were
made, the school then socialized them to the parents and their children. Teachers made the
classroom rules and delivered them to the students. The rules made varied, depending on
each teacher. Some teachers made written rules, while some made unwritten ones. For
unwritten rules, teachers had to remind the students again, for example, to finish the
homework, to respect their friends. Teachers only gave punishment by making students

144
redo their assignments until they finished. In contrast, when students completed their work
well and correctly, they would receive praise from their teachers.
“The rules are already available and they involve the students. Teachers also always remind the students every
time the lesson is over. If a student doesn’t finish his/her homework or assignment, that student has to finish
his/her assignment again at school.” A principal from Biak – Papua
“The school rule says that a student who does not wear his/her uniform will receive a warning. If s/he repeats
it, we’ll ask the parents to come to school. There’s also a rule that demands the students to come on time,
and to bring their books and pencils. The rules are adhered to in the classroom. The teacher also reminds the
students about those rules again. If they don’t obey the rules, they will be punished to clean the school.” A
principal from Sorong – Papua Barat
Policy Implementation
There were many policies from the government that were related to education for remote
and rural areas. However, not all of those rules worked well. The distribution of BOS
funding was one of the policies that was considered to work well. Another policy that did
not work well was the uneven distribution of the teaching staff, which was not in
accordance with the school needs.
“One of the government’s policies that have worked well is the distribution of the BOS funds. The purchasing
of teachers’ and students’ textbooks also worked well.” A principal from Biak – Papua
“One of the government’s policies that hasn’t worked well is the uneven distribution of the teaching staff,
which isn’t in accordance with the school’s needs.” A principal in Biak – Papua
Some suggestions/recommendations that they principals gave in relation to the educational
policies were:
1. It is necessary for teachers who teach in a remote/rural areas to have a comparative
study, since it will motivate and to inspire them, as well as the school;
2. It is necessary to provide incentives for teachers in remote/rural areas, and it is not
enough to only include the program as a program for a remote/rural area;
3. It is necessary to increase the number of teachers;
4. It is necessary to have a policy that calls for the addition of classrooms, desks, and
chairs as a standard for a school; and

145
5. It is necessary to have a regulation that determines which curriculum to use in order
to prevent continuous adaptations of the curriculum.
“My suggestion and recommendation is related to the curriculum that was initially supposed to be the 2013
Curriculum. The books were already available, but then we suddenly had to go back to the 2006 Curriculum.
This has created a problem for the implementation. It was probably due to the changes in the ministry, but it
only makes our school confused.” A principal from Sorong – Papua Barat
5.4 Teacher Interview Findings
In this study there were 30 teachers from 30 schools involved. They came from 6 districts:
Manokwari, Sorong, Jayawijaya, Jayapura, Mimika, and Biak. The teacher interview findings
described students‘ socio-economic status from teachers‘ perspectives, principals‘ roles
from teachers‘ perspectives, teachers‘ roles, obstacles in performing teachers‘ roles, and
curriculum implementation.
Students’ Socio-Economic Status from Teachers’ Perspectives
Based on the information obtained from the teachers that became the in-depth interview
respondents, students came from villages around the school. The nearest distance from
students‘ homes to the school was 10 meters, while the farthest was 3 kilometers. There
were also some villages around the school located far away from the school. Most of the
students came to the school on foot. Some students went by bicycle, some had their
parents drive them on their motorbikes, some had the plantation pickup vehicle drop them
off at school, and some hitchhiked on a passing truck. It could even take students who lived
in a mountainous area such as Jayawijaya 3 hours to get to their school. Students did not
only have to deal with the long distance and the long travel time, but they also had to deal
with the nature itself. Some of them had to climb up a mountain, pass through some slopes,
and cross rivers.
“They generally live around the village of Sundey. The distance from their school to their school is less than
500 meters; thus, they can just go to the school on foot.” A teacher from Biak – Papua
“Some of the students live in an orphanage, and some others live with their parents. The farthest distance is
around 3 km. Students have to first climb the mountain since their houses are located on the mountain slopes.

146
They walk to school. Some live next to Baliem River. If the river overflows, they have to take their uniforms off
first. When their bodies are dried off as they continue walking, only then will they change clothes.” A teacher
from Jayawijaya – Papua
Each school had its own policy in regards to the student school age. In general, students
were around 6-7 years old when they started Grade 1. However, some schools did not set
an age limitation to accept students. For example, in Manokwari, there were some students
who were younger than 6 years old. According to a teacher in that school, parents wanted
to send their children to school, but since there was not any TK/PAUD, they forced their
children to study in the primary school. In some other areas, there were some older
students who remained in Grade 2/3 due to their limited capacity.
“Our school doesn’t limit the age for those living in these 3 villages, and it accepts students no matter what
their situations are. The average age is 7 years old and older. Some who are younger than 6 also study in
Grade 1.” A teacher in Manokwari – Papua Barat
The economic status differed from one family to the other. This economic status depended
on the parents‘ living standards. For those who lived in a mountainous area, the parents
usually farmed or took care of the plantations. They planted vegetables, fruits, taro, pepper,
cocoa, areca nuts, and coconuts. The income they earned was unstable, depending on the
trades of what they planted. The most they earned from selling their produce was around
Rp. 1,000,000 – Rp. 1,500,000. Those who lived next to the shore usually worked as
fishermen. Their income ranged between Rp. 50,000 and Rp. 100,000 on some days. In
some areas, there were parents who lived in the middle of a forest, and thus they took their
children to help them for quite a period of time. However, there were some children whose
parents worked as officials or laborers on a plantation.
“The parents’ occupation is as farmers that plant vegetables and fruits. The average income of the family
ranges between 1 – 1.5 million/month, from selling their crops.” A teacher in Mimika – Papua
“Students generally come from the middle socio-economic class, with the breadwinner of the family working as
a fisherman. They will sell their catch directly on the market days, which are on Tuesdays, Thursdays, and
Saturdays. The average income that they obtain from selling the fish they catch is around Rp. 100,000 – Rp.
200,000. They will use that money to buy their daily needs, for their lives the following day, as well as to pay

147
for the fuel they use to sail the next day. The net income that they bring home with them is on average
around Rp. 50,000 – Rp. 100,000.” A teacher in Biak – Papua
Since the family‘s economic status generally belonged to the lower class, parents focused
more on economic issues. Parents wanted to send their children to school, but they also
hoped to have their children help them. The children studied at school from the morning to
the afternoon. After they finished school, they had to help their parents in the field. Parents
did not care too much either about their children‘s study progress. All they cared about was
that their children passed the exams. Parents did not want to know whether students came
to school or not. Most of the students did not study or do their homework after school.
Instead, they looked for additional income or went to play with their friends since nobody
was watching over them. Outside the school, there were not too many activities, like
additional lessons or extracurricular activities.
“After school, students usually change their clothes and then go to play. They don’t study although their
teacher gives them an assignment. When they go to school the next day, they don’t remember the previous
lesson. It’s all because of the influence of their environment, family and parents that don’t really care about
the children’s education. Extracurricular activities and extra lessons are only available for those who are in
Grade 6.” A teacher from Sorong – Papua Barat
Principals’ Roles from Teachers’ Perspectives
The principals played many roles in relation to the teaching and learning activities. From the
perspective of the teachers, the principals had these following roles:
Be transparent in relation to the planned activities that the school would do;
Be transparent in BOS funding management;
Host a routine meeting program with the board of teachers every month;
Help to provide teaching media;
Manage the incentives for the contract teachers;
Perform the duties of a supervisor who constantly monitors and observes the
teaching-learning process in every class;
Encourage the teachers to stay motivated in teaching;
Give assorted kinds of information that different parties need;

148
Give advice and insights to the teachers to make them come on time and not skip
school;
Show attention in the form of opinions and suggestions related to the teaching and
learning process;
Play a role in bringing the school forward; and
Substitute an absent teacher.
“A principal should give a transparent activity plan about what the school will do, host a routine meeting
program with the board of teachers every month, show their attention through giving advice and suggestions in
relation to the teaching and learning process.” A teacher from Biak – Papua
Principals did have many roles at school, but not all of these roles were performed well. A
good principal should be able to bring the school that s/he leads forward. However, it was
seen that the principals only ran the school as it was, and thus there was not any progress.
The progress of the school could be seen from the quality of the students and the teachers
that the school produced, as well as the available facilities. In the teachers‘ opinions, there
were still some principals who did not perform the duties well. Some of the causes were:
Principals rarely came to school;
Principals showed a lack of attention to the teachers‘ welfare;
Principals did not have adequate responsibility as a leader;
Principals did not manage the school effectively;
Principals did not show enough support toward the teaching and learning process by
not providing sufficient school facilities;
Principals did not bring about enough changes from then till now;
Principals did not provide enough external resources for the development of
education; and
Principals were not transparent in regards to different aids that the school had
received.
“Principals don’t play their roles well. We often complain about his rare presence at school, but he only
answers that he’s been busy. He said that teachers should just teach their classes. He’s also supposed to teach
in Grade V, but he never does, and the part-time teacher always replaces him.” A teacher from
Manokwari – Papua Barat

149
There were principals who rarely came to school, but there were also some who regularly
came. Those who did not come gave the following excuses:
Due to an official travel duty, such as attending an invitation from the Department of
Education;
Due to a family matter that could not be abandoned (This one usually took one or
two days of absence);
Due to health reasons, as the principal got sick;
Due to the long distance between their school and the official housing; or
Due to the transition process from the old one to the new one.
One of the principal‘s roles was to supervise the teaching and learning process. The types of
supervision varied. The frequency also varied between one school and another, depending
on the principals. The most frequent supervision was carried out every day before the
school started. Some schools only had supervision once a week, or 1-3 times per month.
Some did not have scheduled supervision, while some did not have any at all.
“Every day when the school starts at 8:00, the principal will go around the classes to observe the teaching and
learning process at school.” A teacher from Biak – Papua
“The principal visits the class as many as 2-3 times in a month, or substitutes a classroom teacher who is
absent.” A teacher from Sorong – Papua Barat
When making an observation, the principal did not only supervise the teaching and learning
process. The principal also checked the teachers‘ attendance and the number of students. If
a principal visited a classroom and found that the teacher was absent, the principal would
then teach that class. There were times when the principal gave feedback to the classroom
teacher about teaching and the subject taught. The principal would provide input as
feedback for the teacher observed. The principal checked whether the lesson plans matched
with what the teacher implemented during teaching.
“Sometimes the principal gives feedback to a classroom teacher in relation to teaching and to the subject
being taught, so that the teacher can follow the curriculum, apply it despite the limited resources and
materials. The first observation was performed on the teaching tools, such as the lesson plans and the syllabi.
After supervising, the principal then gives the teacher feedback during the meeting with the classroom

150
teachers. However, the principal does not review the feedback from one teacher to the other one. Instead he
gives general feedback.” A teacher from Mimika – Papua
Besides observing the teaching-learning activities, a teacher evaluation meeting was also
required. The principal played a significant role in hosting such an event. Each principal had
his/her own policy regarding this issue. Some principals held this meeting regularly, but some
others never did it at all. From the teachers‘ perspectives, such an evaluation meeting was
necessary in order to discuss the teaching method for each class, and to evaluate the
teachers‘ performance. During this meeting, teachers could give feedback to each other and
exchange ideas about a new teaching system. Each school could arrange its own meeting
schedule. There were some schools that had the meeting every month. Some had it before
the semester started. The evaluation meeting every semester could also be used to discuss
the school‘s plan for the next semester. Some schools had a meeting only to discuss the
BOS fund. Therefore, when there was no BOS fund, there was no meeting.
“Hosting the routine meeting at the beginning of every month with the teachers to discuss the teaching
methods for each class, and to evaluate the teachers’ performance. The teacher meeting is held before the
semester starts to divide the tasks among the teachers throughout the semester and thus, a routine meeting
isn’t necessary.” A teacher from Jayawijaya – Papua
“Hosting the teacher evaluation meeting to discuss the school’s plan for the next semester, the improvements
for the next semester, as well as to let the teachers exchange ideas.” A teacher from Manokwari –
Papua
Teachers’ Roles
Overall, the teachers played roles in the teaching and learning process. Teachers who played
their roles well would produce good students. Teachers were in charge of producing good
students. Figure 5.10 gives a clear picture about their roles in the teaching and learning
process.

151
Figure 5.10. Model of Teachers’ Roles
Related to Students
Be a Reminder for the Students to Study Seriously
Teachers in the teaching-learning process needed to pay attention to all students. When the
students did not seem serious in class the teacher had to remind the students. So the
students could pay attention again to the material that the teacher gave. This was the
teacher‘s role and right in reminding the students.
Lead and Guide the Students
The next teacher roles were leading and guiding the students in the learning process. These
roles were the main teacher roles. When teachers taught, it meant they wanted to lead and
guide the students even just to be able to follow the lessons or become smart students.

152
Share Knowledge
The next role was sharing knowledge. The teachers shared their knowledge to the students
through teaching in class. This role was related to leading and guiding the students. It meant
to lead and guide the students, the teachers needed to share their knowledge.
Give Punishments to Students
The last role was giving punishments. Teachers had the right to give punishments to every
student. The punishment could be because they were lazy or violated the rules. The
punishment that the teachers gave was non-physical punishment.
Stop Students Who Fight
The fourth teacher role was stopping students who fought. Teachers had the right to stop
students who fought because the students came to school to study not to fight. The
teachers had to remind the students of their purpose for coming to school.
Related to Teaching Materials
Prepare Teaching Materials and Supporting Aids
The main role of the teachers was to teach, and thus, before teaching, the teachers needed
to prepare. Some teachers felt that it was necessary to prepare before the class, but some
others did not. Here are different kinds of preparation that the teachers did:
Make lesson plans;
Make other supporting teaching materials; and
Prepare their thinking
“I prepare for teaching every day before I start the class. We make lesson plans and plan other activities for
the students.” A teacher from Biak – Papua
“I don’t need a special preparation since I’m already used to teaching. The most important thing is to know
what should be taught to the students. We need to especially focus on making the students able to read and
write.” A teacher from Mimika – Papua

153
Related to Students’ Financial Assistance
Involved in BOS Fund Management
In relation to the planning and the usage of BOS funds, actually the teachers should take part
because they know exactly what the students‘ need in the teaching and learning process.
However, most of the principals never involved the teachers. Therefore, the teachers only
knew that their schools received such aid, but they never knew the recommendations and
the usage. Only some teachers, who participated in these in-depth interviews, were involved
since they were the school treasurers. In some schools, the BOS fund would be delivered to
the principal, to be managed by the treasurer after that. Regardless, the principals
themselves managed the fund. The treasurers only helped to figure out how to withdraw
the funds. The principals would manage what needs would make use of that fund. The
distribution of the BOS fund was relatively well, but there was a lack of transparency about
the usage. The BOS fund was required to add to the number of books and the school
facilities, but the need was not addressed.
“The principals have never involved the teachers in the planning and the usage of the BOS fund. Therefore,
the teachers only know that such aid has been received, but we never know about the recommendations and
the usage.” A teacher from Biak – Papua
“I’ve never been involved. I myself am a treasurer, but the principal handled everything by himself. He only
took me to the department’s office to sign the papers. He then took me to the bank, but he made me wait in
the parking lot.” A teacher from Jayawijaya – Papua
Obstacles in Performing Teachers’ Roles
In performing their roles, the teachers encountered some obstacles. These could come
from their own selves, as well as from others, such as the students, the principals, or the
school management. Figure 5.11 gives a clear picture about the teacher obstacle sources in
performing their roles.

154
Figure 5.11. Model of the Teachers’ Obstacle Sources in Performing the Roles
Obstacles from Principals and School Management
Some obstacles that the teachers faced when performing their roles came from principals
and the school management. The first obstacle was the limited availability of learning
materials and the teachers‘ books. Besides the limited books, the currently available books
were not in accordance with the curriculum, so the teachers could not teach according to
the curriculum as the second obstacle. The third obstacle was that some teachers did not
get support from the principals in doing their roles. The fourth obstacle was from the
school management which had a lack of school facilities in terms of teaching media. The last
obstacle was a lack of teaching staff since in some schools the teachers had to teach multiple
classes.
“I have a problem with the resources that we need to teach. The currently available books are not in
accordance with the curriculum.” A teacher from Jayawijaya – Papua
Obstacles from Students’ Parents
In performing their roles, the teachers had to face obstacles from students‘ parents. The
teachers only met the students during school hours. It meant the teachers also needed
support from parents when the students were in their house. In fact, some parents did not
give that support or care for the students‘ education. Some of them just got angry to the
teachers when their children did not pass their classes.

155
Obstacles from Students
The next obstacle was from the students. The first obstacle from students was the capability
in taking the lesson. The second was the students‘ absenteeism to come to the class and to
study. The last as the third obstacle from students was the students‘ difficulty to use
Indonesian language.
“The lateness of the students in understanding the lesson taught, so that it requires additional time to teach
them.” A teacher from Sorong – Papua Barat
Obstacles from Teachers Themselves
An obstacle could come from the teachers themselves. One obstacle was teachers‘ poor
economic situation and welfare. Another obstacle was the lack of transportation and
communication means that prevented the teachers from staying updated with information.
Teacher’s Professional Development
In performing their roles, teachers got help from their training. Through that training,
teachers got more experiences and new knowledge. Each teacher got different training.
These are some types of training that the teachers received:
A training hosted by the Puskesmas (Pusat Kesehatan Masyarakat or Community
Health Center) about the UKS (Unit Kesehatan Sekolah or School Health Unit) at
the sub-district level continued to the district level;
A training about the 2013 Curriculum at the district level, organized by the LPMP of
Papua Province, UNICEF, and Cendrawasih University;
A training on early classes that was held by UNICEF and the Department of
Education of the Biak District;
A training on multiple classes that was held by UNICEF and the Department of
Education of the Biak District;
A training on STBM by the NGO Rumsram about community health;
A teacher certification;
A training on how to make a lesson plan, a syllabus, as well as how to teach, which
was held by UNICEF; and

156
A training on Sarjana Mendidik di Daerah Terpencil Terluar dan Terdepan (SM3T)
from the central Directorate of Higher Education.
Curriculum Implementation
In determining the curriculum, each school used different curricula. The curriculum
implemented in schools in Papua and Papua Barat can be seen in Figure 5.12. This model
shows the type of curriculum that was implemented.
Figure 5.12. Model of Type of Curriculum that Was Implemented
In implementing the curriculum, schools had to face the obstacle. Those obstacles were
related to a lack of teaching materials and textbooks for both the students and the teachers.

157
Another obstacle related to the curriculum was the use of a thematic approach in the 2013
Curriculum for weak students. These students had troubles understanding and thus, got
confused. To deal with those obstacles, the teachers looked for materials from old books
that they considered important. They then delivered those materials to the students.
Another method they used to solve the issue was by making an initiative to incorporate
materials available around the school. Teachers also modified the use of the 2006
Curriculum (KTSP) to help the students understand more easily.
5.5 Community Leader Interview Findings
A community leader was defined as a village head or religious leader. In total there were 30
community leaders involved in this study from 30 villages. Out of 30 community leaders, 26
of them were village heads and the rest were religious leaders.
Social and Economic Status
In general, the village consisted of between 55 and 98 families with the total population of
159 – 289 people. Figure 5.13 gives a clear picture of the social and economic status in six
districts from three points of view: welfare parameter, livelihood, and welfare rate.

158
Figure 5.13. Model of Social and Economy Status Based on Community Leader
Interview Findings
Livelihood
During this study, there were two kinds of geographical conditions: mountainous and
shoreline. The villagers in the mountainous area worked as farmers. They planted
vegetables, cassava, areca, and red fruits. Besides farming, there were some villagers who
raised cattle, as well as pigs and fish. On the other hand, in villages around the shore, the
villagers worked as fishermen and fishpond makers. Few people worked as civil servants. For
the fishermen, their average monthly income ranged between Rp. 1,000,000 and Rp.
1,500,000.
“They generally farm. They plant sweet potatoes, corn, and red fruits. Some have fishponds, and some raise
pigs.” A community leader from Jayawijaya – Papua
“The number of family heads was 87, with the total of population of 138 people. The main livelihood of the
Wundi villagers was as fisherman with a monthly average income between Rp. 1,000,000 and Rp.
1,500,000.” A community leader from Biak – Papua

159
Welfare Parameters
According to the community leaders, the welfare rate could be measured by using several
factors. The first factor was a decent house for each family. The second factor was whether
the food need for each family member was fulfilled or not. The third one was the presence
of a good sanitation facility around the housing complex. The fourth one was the
development of roads that connected the villages, the economic roads connecting to
people‘s fields, as well as the roads for tourism, including the lighting for those roads. The
fifth factor was whether the children could receive higher education and graduate.
“Welfare can be measured from the level of education, if the children can become university
graduates.” A community leader from Jayapura – Papua
Welfare Rate
In general, the villagers in every village belonged to the lower class. Their condition was
quite far from what could be considered wealthy. They were unable to fulfill their basic daily
needs properly. Housing was well-organized, but they did not have a good sanitation system
yet. For example, there was a lack of clean water. The waste system was not well-
maintained either. Furthermore, there was not any electricity system in the villagers‘ houses.
There were only a few houses that used solar guards for lighting at night between 7:00 PM
and 12:00 AM.
The economy and the living conditions of the villagers depended very much on the natural
produce. The dry soil and the land composition that consisted of rocks and swamps did not
give many options for the farmers except to plant taro, cassava, and areca. Moreover, they
could harvest taro and cassava only after a year. Furthermore, the farmers had to sell their
produce in markets located in the city. For their daily consumption, they received raskin
(rice allocated for less fortunate people) from the local government.
Like those who worked as farmers, the fishermen also relied very much on the weather.
During the west monsoon, the fishermen could not sail since the waves were big, and thus
they could not pay for their families‘ needs. These people did not usually save their money
either. Every time they returned from the sea, they sold their catch in the market in town.

160
Right after that, they spent everything to buy what their family needed. As they just earned
very little, they could not save some money.
One of the attempts that the village officers had done to help the villagers was by seeking
aid. The fishermen received aid in the form of a Johnson ship, a small wooden ship with an
engine of 15 or 25 PK. The farmers received their aid in the form of pesticides for spraying
for their plants. The fishpond makers received capital for their businesses from the RESPEK
program managed by the community leaders. Besides that, there was the Respect Program
from the local government that gave aid in the form of decent housing. During the time of
the study, around 20% of the villagers‘ houses were decent houses in which the main
building and the restrooms were separated. The other 80% were still houses not yet decent
to live in, made of wood.
Nonetheless, there were also villagers who belonged to the middle class. It was visible from
the house ownership, as they owned their own houses. There was also an equal distribution
of the education for the villagers. There were some villagers who graduated from a
university and lived outside the village. In addition, they had their basic needs, such as health,
clothing, and daily food fulfilled, despite their professions as mere farmers.
Parental Interest to Send Children to School
Despite the various obstacles that prevented children from going to school, like the long
distance and the expensive school fees, parents generally showed a strong interest to send
their children to a primary school, since they wanted their children to be smart. Parents
gave both moral and material support for their children to study at school. They paid for
their children‘s education using their farming produce. They would sell this produce to pay
for the various educational needs of their children.
“I see them sending their children to school. Their houses are far away, but they still send their children to
school. My area is not conducive for education since people’s houses are located far from the school.” A
community leader from Jayawijaya – Papua
Parents also paid attention to their children‘s school progress. There were some parents
who transferred their children to primary schools in other villages, since the lack of teachers

161
there caused the absence of teaching and learning activities in the class. Besides giving
attention to their children‘s development at school, parents also gave moral support by
helping their children do their homework and by providing lunch for their children after
they returned home from school. In Biak District, many parents were involved in the
school-planning meeting. They recommended building school fences to separate the school
with the streets and other people‘s houses around the school.
“Parents wanted their children to study at school, especially through primary school, junior high
school, and up to senior high school, regardless of their economic limitations. They actually wanted
their children to be university graduates, so that they could develop their regions in the future.” A
community leader from Manokwari – Papua Barat
Students’ Interest in Education to Go to School
The interest of students aged between 6-15 years old was relatively strong, but this is not
supported by sufficient learning facilities and means. Students‘ strong interests were not
matched by the lack of teaching staff at the school either. If the teacher rarely showed up in
class, the students rarely would as well. Therefore, many students transferred to schools in
other villages that offered more frequent teaching and learning activities.
“The students usually go to school, but since there isn’t any teacher at school, they will just come once and
then skip school for the next 3 days.” A community leader in Jayawijaya – Papua
After school, children usually helped their parents in the fields, such as cleaning the
vegetables and weeding the grass. During the fruit season, they also went to the fields to
play while waiting for the ripe fruits to fall from the trees. Some of them played football,
played in the forests, and played on the shores while looking for fish for their meals at home
later. Only very few reviewed what they had learned at school. It was due to several
reasons, like the lack of proper lighting. To deal with this issue, there was a
recommendation to set up an electricity meter for each house to enable the students to
study at night.
“In the morning, the children usually go to school. In the afternoon until evening, they help their parents.” A
community leader from Jayapura – Papua

162
Hopes for Children’s Future and Attempts to Make Those Hopes Come
True
The community leaders shared a similar hope for the future of children in their villages.
They hoped that these children could study up to the university level, master technology,
and go back to develop their village. To make that hope come true, the community leaders
made some plans, such as:
1. Encourage the children to be technology literate
The community leaders encouraged the
children to learn how to use a computer and
get technological skills that they could use to
develop their village.
Picture 5.6: Computers
2. Encourage collaboration among the society
Collaboration between everyone was required
to materialize the hopes for the children‘s
future; to train and to educate the children to
have a high education and a mastery of
technology.
Picture 5.7: Community Collaboration
3. Encourage the children to study with everyone
Students were encouraged to study from
everyone who could give them more
knowledge, whether at school or outside the
school, taught by the civil teacher or even
military teacher.
Picture 5.8: Learning with the National Army

163
4. Trade in the market to pay for the school
Community leaders encouraged the villagers to
sell their catch from the sea in the market
located in the city with an appropriate price,
so that they could pay for their living, as well
as for what their children needed for school.
Picture 5.9: Trading in the Market
5. Support decent housing
Community leaders encouraged the building of
decent housing that would make children
comfortable.
Picture 5.10: Building Decent Housing
According to the community leaders, going to school would give some benefits, such as:
1. The creation of a generation that possesses strong motivation to study and improve
humanity.
Schools could motivate the children to have a strong willingness to study. In addition,
they would know and love each other at school.
2. Equip the students to be university graduates.
Schools would create more university students. No matter where the children
went to study, as long as they came from a village, it would be the pride of all the
villagers when any of those children graduated from a university.
3. Eradicate illiteracy
Schools could help the children to know how to read. Hence, children would
become smart and they would understand what was going on around them by
reading.

164
Portraits of Education in Papua
In general, the condition of the schools, whether building-wise or teacher-wise, was not
optimal to support the teaching and learning activities. Figure 5.14 provides a clear picture
about the school conditions in Tanah Papua.
Figure 5.14: Model of the School Conditions in Tanah Papua
Lack of Schools' Building Quality and Supporting Facilities
The majority of the schools had limited classrooms. There were only 5 rooms in total,
consisting of 1 room for teachers and the principal, 1 library, and 3 rooms for the teaching
and learning process. The other facilities could not support the teaching and learning
process either. The desks and the chairs were all worn out. There was not any clean water.
The floors were all dusty. Either there were not any toilets or they were out of order due
to the lack of maintenance. The lighting was inadequate. The library was so dirty that
students were not interested to study there. The schoolyard was rocky and uneven. There
was not any school fence. There were a lot of puddles in the yard. This poor condition of
the school buildings and facilities influenced the low quality of the education. In addition,
according to the community leaders, these terrible facilities would also affect the students‘
health.

165
In contrast, there were some schools that had decent school buildings and only left 2 -3
classes uncovered with ceramic. Students cleaned the school and the yard every day to
make sure they remained clean. Nonetheless, some of the teacher housing located around
the school area had a poor condition since it was built a long time ago and needed
renovating.
Problems with the Teachers
Lack of Teachers
Similar to the bad conditions of the school building and the facilities, how the teachers
conducted the teaching and learning process was not optimal either. During the time of
study, primary schools in Papua and Papua Barat still encountered a lack of teaching staff,
either number-wise or subject-wise. Teachers did not teach subjects based on their
expertise, as they were not hired to teach those subjects.
Low Teacher' Salary
Moreover, most of them were only part-time teachers and they only received their salaries
every 3 to 4 months. Therefore, they lacked motivation to teach and often skipped classes.
According to the community leaders, besides the irresponsiveness of the Department of
Education, such a lack of teachers was also caused by the absence of school progress
reports.
“Another issue that this school is facing is that the teachers rarely show up, since they live far away. The part-
time teachers would like to teach, but what they receive is not enough for their daily living. Since they aren't
civil servants, they only receive their wages every 3 to 4 months.” A community leader in Manokwari –
Papua Barat
High Teacher Absenteeism
Besides number-wise, another issue in relation to the teaching staff was teachers‘
absenteeism and lateness. Oftentimes, teachers did not come to school, or they came late,
because their houses were located far from the school. This made the students unmotivated
to join the teaching and learning process at school.

166
In a severe case, there was not any teaching and learning process for up to a week because
no teachers showed up. The principal had not been active for 3 months due to MPP. The
other teachers were not active either, including a part-time teacher, a transfer teacher who
had not got his letter, and a contract teacher who had been gone for 2 months. The
superintendent had never showed up to supervise the school either.
Village Head Roles in Basic Education
According to the village heads, their roles in helping the educational issue were at the
peripheral level. They felt that they only played a minor role in advancing the primary
education in their village. However, there were several village heads that had quite a big
role, like in Sor Village and Mos Village. The village heads there had started the development
of the school building since 1985 in those two villages since at that time, a school was
available only in Dwar Village and it was located far away from those two villages. They
regularly met with the principals every time the program was about to start. The invitation
came from either the principal or the village head.
In playing their roles to help solve the educational issues in their villages, the village heads
encountered several difficulties as seen in Figure 5.15.
Figure 5.15. Model of Difficulties in Playing the Role of Village Head

167
The difficulties in playing the role of community leader are because of four limitations. The
five limitations are low support from parents, personal limitations, unclear government
policies, geographical and weather limitations, and low school commitment.
1. The lack of support from the community
The community tended to prioritize the living conditions and the incomes of their
own families, and thus oftentimes, they did not support the policies that the village
head had proposed. Moreover, social jealousy would rise should the policy of the
village head seem to benefit only a particular group in the community.
2. Personal limitations of the community leader
To do their roles, the community leaders faced problems because of their personal
limitations such as a lack of funds to play their roles. In Tanah Papua, transportation
also became a problem for the village heads to play their roles, since the distance
between the islands was indeed long and it required a huge expense. Other natural
factors, like bad weather and strong winds, also prevented the village heads from
leaving their islands. Moreover, they also had families that they had to take care of.
3. Unclear government policies
There were several government policies that became barriers for the community
leaders to do their roles. The first was there were no regulations requesting that
there should be a tighter collaboration between the teachers, the village heads, and
the school committee. However, in the field it was shown that there was a lack of
good connection between the school and the village head. There was a view that the
village head was not the superordinate of the school; therefore, there was not any
good cooperation between the school and the village. Afterwards, the head of the
directorate told the principals that they had to cooperate with the village heads in
order to improve the quality of the schools.
The second was the absence of a government decree in regards to the roles of the
village heads. Since the government had not issued any decrees, the village heads
could not convey the policies. The third was a lack of socialization of the

168
government‘s policies to the community. Many policies of the government did not
reach the village and thus the village was left not updated.
The fourth was a lack of government responsibility for the programs they ran. Many
of the ideas that were proposed in the annual Musrenbang (Musyawarah
Perencanaan Pembangunan or Development Planning Forum) did not get direct
responses and there had been no follow up until then. The village heads had
constantly coordinated with the local government to improve the education.
Moreover, they continuously showed their interest to advance the school‘s quality
and education whenever they had a forum with their people. Nonetheless, none of
them were responsive.
4. Lack of School Commitment
The bad behaviors of the village heads, such as their inclination to gamble and get
drunk, also prevented the community leaders from playing their roles to give
support.
The Community Leaders’ Efforts to Improve School Conditions
The community leaders did various efforts to improve the school‘s condition in order to
support the teaching and learning process, such as:
1. Invite different school stakeholders
The community leaders invited people from the school, the school committee, and
the board of teachers to discuss how to fix the school‘s unhealthy situation. The
community leaders also saw the need to make some repairs, such as making fences
for the school in order to keep both the teachers and the students in the school
area.
2. Host a meeting with the Department of Education and the local council
The community leaders once had a meeting with the principals, the Department of
Education, and the local council in order to inform them about the school‘s
situation, as well as the work letters for the teachers. However, they did not get
169
any responses until then. The community leaders had also sent letters to other
related institutions.
3. Have a forum with people and church
The community leaders also reported the issue to the local community members
and the church. They recommended repairing those facilities that were in poor
condition, like the desks and chairs through their own funding. However, nothing
happened until then. He had also sent a request to the Public Service Department
to receive materials to cover the roofs of the teachers‘ housing.
4. Make a request to expedite the teachers‘ work letters
The community leaders realized that some teachers had not gotten their work
letters. They actually tried to have those letters expedited.
5. Raise funds to subsidize students
The community leaders tried to raise funds to subsidize the students, so that they
could continue their further study out of the village.
Community Leader Attempts to Deal with Difficulties
To deal with those difficulties, the community leaders made these following attempts:
1. Cooperate with local NGOs
Like in the Sundey Village, the community leader worked together with the
Rumsram NGO in preparing a traveling library. The community leader also
cooperated with other parties in order to train the children of the Sundey Village,
like through computer and automotive skills.
2. Host a forum
The community leader hosted a forum at the sub-district level to get ideas to be
proposed in the Development Planning Forum at the district level with the council.
They also looked for help from other parties through programs organized by the
community leader.

170
3. Approach the teachers and superintendents
The community leader approached the teachers to make them continue teaching.
The community leader also met with the superintendent to discuss problems at
school, such as to add to the number of teachers and review the behavior of the
principal. However, nothing had worked so far.
4. Use community donations and their own money
To supervise and observe schools located in remote areas, the community leader
used his own money or asked for donations from his people to reach those areas.
5. Connect the school with the community
The community leader connected the school with the community in order to
inform them of what was needed to improve the school. Later on, the local people
were expected to work together to advance the school.
“The community leader connects the school to coordinate with the society leaders in case the school needs
something, so that people can work together to advance the school.” A community leader from Sorong
– Papua Barat
Educational Aid Programs
The community leaders, together with the community, provided different kinds of aid in
order to improve the quality of the primary schools in their villages. Figure 5.16 shows the
target, kinds, and sources of aid.

171
Figure 5.16. Model of Educational Aid Programs
Target of Aid
The targets of educational aid are the school, students, and teachers.
Sources of Aid
For such aids that required funds, the funds were obtained from the PNPM RESPEK
organized by the community leader, NGOs, donor agencies like BMK, and the village church
committee.

172
Kinds of Aid
Some aids that the society provided were as follows:
1. Student School Equipment Aid
Such aid was available to buy school equipment for the students. School equipment
included books, bags, clothes, and shoes.
“BMK provides aid to buy school equipment that includes books, bags, clothes, and shoes.”
A community leader in Mimika - Papua
2. Food Aid for Students‘ Additional Nutrition
The community provided additional food like green bean porridge and milk for the
primary school students.
“The community has given food like green bean porridge and milk for students from the
Inpres Primary School in Sundey.” A community leader in Biak - Papua
3. Food Item Assistance for Teachers
Besides for the students, the teachers also received aid in the form of food items,
such as vegetables and other daily food. People usually gave the teachers the
produce from their fields.
“The aid is in the form of money or food, like vegetables. It’s for the teachers.” A
community leader in Manokwari – Papua Barat
4. Housing Aid for Teachers
This aid was originally provided for teachers who did not have a house or teacher
housing when the school was very far. Thus, people built a modest house with their
own funds. As there was funding from the RESPEK program, this house was
renovated to be a permanent and a decent house. The local people gave such help
with the hope that the teachers would feel more comfortable to stay in the school
area so there would not be an issue of teacher absenteeism or lateness.

173
5. Manpower Aid to Fix the School Facilities
Another aid that the local people provided to the school was their manpower to fix
the broken chairs or desks. They provided such help since the government did not
help to fix or to replace those broken items. With such help, their children could
study comfortably and properly.
The education aids were given in order to increase the schools‘ quality, to develop the
village through education, and to retain the teachers. According to the community leaders,
the teachers needed to give the aid so the teachers could focus on teaching and guiding the
students as they did not have to worry as much about their material needs.
Implementation of Educational Policies in Rural and Remote Areas
Here are some government policies related to education for rural and remote areas that
ran well:
1. The village development aid or the continuous RESPEK Program
2. The withdrawal of BOS funds
On the other hand, according to the community leaders, the government‘s policies related
to education for rural and remote areas were generally not well implemented yet. This is
due to the poor supervision and monitoring. In fact, there was not any superintendent to do
the monitoring. Those policies that did not work well were as follows:
1. BOS fund realization
Unlike the fund withdrawal that worked well, the usage of this fund was
considerably not good since only the principals knew about it.
2. School textbook distribution
By the time of the study, nobody knew the number or the distribution of the
textbooks that the school had received.

174
Community Leaders’ Recommendations and Suggestions
Here are some recommendations in relation to the educational policies for the rural and
remote areas:
1. The placement of teachers in official housing
According to the community leaders, teacher availability was a crucial issue for the
education in rural and remote areas. Therefore, the community leaders
recommended placing the teachers in official housing to motivate them to always
come to class and to come on time. By the time of the study, most of the teachers‘
official houses were uninhabitable and needed repairs by the government.
2. Analysis for the need of subject teachers
There is a need to analyze the number of subject teachers according to the
curriculum being used in the school. Many of the teachers taught subjects that were
not in their expertise.
3. Attention for the welfare of part-time teachers
Part-time teachers were the main pillars for the education in the rural and remote
areas. However, it was unfortunate that there was a lack of attention for their
welfare, as they only received their salary every 3 – 4 months, whereas these
teachers also needed money to pay for their daily needs.
4. School facility repairs
Many of the teaching facilities could not support the teaching and learning process,
such as the chairs, the desks, the classrooms, the restrooms, the libraries, the yards,
and the fences. Actually, the community leaders had personally met the local council
to report the complaints of the school conditions. Nonetheless, no action had been
taken until the time of the study.
5.6 MOEC Interview Findings
There were nine people from the district and two people from the Provincial Ministry of
Education involved in the baseline study. Nine people of the District MOEC came from six
175
districts covered: Biak, Manokwari, Jayapura, Jayawijaya, Sorong, and Mimika. They were the
Division Head of Basic Education and Section Head of Curriculum and Student Affairs. The
Division Head of Basic Education was responsible for helping the Head of District MOEC
arrange the annual working plan, do the monitoring of basic education implementation in the
district, supervise the school supervisors and school principals, submit trimester reports to
the Head of District MOEC, do coordination between the district office and the school
supervisors, manage the activities related to basic education, formulate technical policies,
provide service and education development, as well as conduct human resource (teacher)
management. The Section Head of Curriculum and Student Affairs was responsible for
conducting the preparation of learning materials and technical guidance to assist
kindergartens and primary schools, develop curriculum, test the system, examine the quality
improvement of human resources and arrange the standards of student competency,
organize programs, devise curriculum, and provide technical guidance for student affairs in
kindergarten and primary school.
Meanwhile, the two people from the provincial MOEC of Papua and Papua Barat were the
Head of Education Development and Curriculum. They had several duties, such as to help
the Head of Provincial MOEC to do learning program development and curriculum,
organize the planning and working programs as an education development strategy, as well
as do coordination and supervision of curriculum development. Therefore, the MOEC
interview findings will describe the situation of basic education in Tanah Papua based on the
District and Provincial MOEC point of view.
General Portrait of Basic Education in Tanah Papua
The education in Papua and Papua Barat basically required significant care and attention
from all stakeholders, be it from the school, the parents, or the local communities. So far,
the attention given had always focused on the physical things, and less attention had been
given to the quality of the education, especially the students‘ quality. Specifically for the
primary education, there were many things that needed improvement due to various
weaknesses in the field.

176
According to the data from the District Ministry of Education in Biak and Jayapura, the
participation rate for the basic education that was measured using the Angka Partisipasi
Murni (APM or the Pure Participation Rate), had reached an average of 90%. It indicated
that 90% of the students who belonged to the primary school age had been enrolled in
primary schools in their respective areas.
“The participation rate in the Biak District has reached 90%, while the graduation rate in the last national
exam in 2014 reached 100%.” District MOEC in Biak – Papua
“Seen from the APK and the APS, it has got better, as much as 90%. The APK and the APS is even higher in
the city compared to one of the villages.” District MOEC in Jayapura – Papua
However, according to MOEC, this number did not indicate that the students had
constantly gone to school to study. The nomadic culture of the Papuans that did not let
them stay permanently in a village and that made them continuously move made the
students‘ consistency in participating in the classroom very low. Some did not study at all.
Moreover, some parents involved their children in their daily living, such as taking them to
gather sago. Such actions made the students miss their school for up to 1-2 weeks.
The above data is in line with the statement of the Provincial Ministry of Education in
Jayapura that the trend of Angka Partisipasi Sekolah (APS or the School Participation Rate)
was negative from 2010-2013. The trend tended to decrease by 0.7%.
“Looking at APS, in 2010 it was 75% and the trend tended to be negative during 2010-2013. The decrease is
about 0.7% in each year.” Provincial MOEC in Jayapura - Papua
Then, also based on an interview with District MOEC, the graduation rate from the national
primary education in 2014 for some districts in the provinces of Papua and Papua Barat had
reached 99%-100%. Nonetheless, in reality, when measured using the Calistung (Membaca,
menulis dan berhitung or reading, writing and counting) instrument, the basic abilities of the
students were very low, i.e. less than 50%. The graduation rate that was almost perfect was
due to the threats from the students‘ parents to the schools. Therefore, at the end, the
principal chose to let all the students pass although they were not capable yet of reaching
the minimum standard grades.

177
“The graduation rate is good, on average 99% every year. In reality they haven’t been able to do calistung.
However, the students’ parents threatened the principal with a machete if the students failed to pass.”
District MOEC in Sorong – Papua
Parents’ Interest in Sending Their Children to School
According to the education officials, parents‘ interest in sending their children to school was
relatively good. Parents realized and understood the value of education. According to the
District MOEC interview, the percentage of interested parents who lived in the city was
around 90%. However, the interest of parents who lived in the village was not as big.
Nevertheless, both parents who lived in the city and those who lived in the village gave their
support for their children to go to school. Local communities also realized the importance
of education, and thus, they participated in accelerating the teaching and learning process. In
the Jayapura District, local community members reported the teachers who skipped classes
to the local Directorate of Education.
“Almost every day, our community reports to the directorate when they see teachers who skip classes. The
community realizes how important education is.” District MOEC in Jayapura – Papua
On the other hand, according to the Ministry of Education, the interest of the parents to
send the children to school was very much affected by economic factors, and thus, many of
the parents often took their children to look for food, like by hunting boars or by gathering
sago. Some parents who lived in rural areas also showed a low interest in sending their
children to school. Besides the economic factors, this low interest was also due to the
strong traditional culture, as well as the long distance between the house and the school
that made it unsafe to travel. For example, in the Manokwari District, people still believed in
the myth of Swanggi, who was an evil person who liked to kill children and adults. Such a
belief prevented parents from sending their children to go to school far away from their
residences. Besides this myth, it was custom among the Papuans to leave their old village
and build a new one when they encountered a problem.
“People are afraid of Swanggi, an evil person who likes to kill children and adults. Although it’s just a myth, it
prevents parents from sending their children to a school located far from their residences. Besides that, some
people have a custom to leave their village and build a new one when they have an issue there.” District
MOEC in Manokwari – Papua Barat

178
The Provincial MOEC also claimed during the interview based on WTA organization data
that almost 80% of the children who were actually ready in age, were not prepared to enroll
in primary school.
Children’s Interest to Go to School
Based on the data given by District MOEC, in general, children of school age already
showed an interest to go to school. They were interested because they saw their older
siblings who had gone to school. According to the District MOEC, the interest to go to
school among the children living in the city was as high as 90%, whereas among those who
lived in the village, the number was lower. Nevertheless, the Ministry of Education stated
that it did not mean the students from the villages were unwilling to go to school.
“Children’s interest is quite high, proven by the fact that some schools in some areas in the city have difficulty
to accept all students every year.” District MOEC in Biak – Papua
These children actually wanted to continue going to school, but there were many factors
that affected the consistency of their attendance in school. The first factor was the parents.
Parents often took their children to the field or to the market, and thus, the students would
miss their classes. The second one was the teachers‘ attendance. In Jayawijaya District, areas
were categorized based on ‗Ring‘. Ring I included areas located inside the city. Ring II
covered areas located at the edges of the city. Ring III included the rural areas, whereas,
Ring IV was comprised of the remote areas. In Rings III and IV, teachers often skipped the
classes. The third factor was the traditions and the beliefs. There were some areas that
were nomadic in sending their children to school. Some believed in Swanggi mentioned
earlier and thus, disallowed their children from traveling too far. The parents would rather
sacrifice their children‘s study than let their children get in danger.
“Children have a strong interest, but there are many parents who haven’t realized how important education is.
When they go farming, the will take their children and thus, the students’ study is abandoned.” District
MOEC in Sorong – Papua
“Children do have an interest to go to school, affected by their older siblings who have gone to school.
However, there are still some children who obey whatever their parents tell them. Whenever parents advise
them about traditional messages, these automatically get ingrained in the students’ minds. These traditions
179
include traditional beliefs, or Swanggi. It is related to the dropout rate. Since the children’s safety is under
threat, parents will take them to leave the village. They see that this problem doesn’t only concern the parents,
but also the descendants.” District MOEC in Manokwari – Papua Barat
The Quality of Basic Education at the District Level
The quality of basic education among the six districts was not significantly different. The
basic education quality in the cities had progressed. However, the quality in the rural and
remote areas was still low. The low quality of basic education was visible from the fact that
many of those who had graduated from primary school still could not read, write, or count.
However, there were some schools located in the rural and remote areas that had showed
progress after getting training, such as those trained by NGOs, like the WVI, the Yayasan
Kristen Wamena (YKW or Wamena Christian Foundation), Kumala Foundation, YPK, and
YPKK.
“In general, the basic education quality in Manokwari is between 50-60%. We are trying to improve that. It’s
not 100%. There are still too many problems to resolve. It’s even worse in the remote areas since even getting
information is already difficult there.” District MOEC in Manokwari – Papua Barat
“The quality of basic education in the district/province and the remote/rural areas. The quality of the district is
still good, but for the quality of the rural and remote areas, many students who have completed primary
school there still cannot read, write, or count. Very weak.” District MOEC in Sorong – Papua
“During these past several years, according to survey capacity basic bank, the quality of basic education in
Papua and Papua Barat is in the red range, which shows that the quality is below the standard line.”
Provincial MOEC in Manokwari – Papua Barat
According to the Ministry of Education, the low quality of basic education was due to
several factors. The first factor was the lack of participation and support from the parents
toward their children‘s study. Parents relied totally on the school. The parents also brought
their children wherever they went. Moreover, less of them were concerned about preparing
breakfast for their children before they went to school. The second factor was the lack of
teachers and the low teachers‘ discipline rate; they affected the quality of basic education,
especially in the rural and remote areas. The third factor was the geographical location of
the school that was hard to reach, and thus both teachers and students experienced
difficulties to come to school. Moreover, teachers who had moved to the city would feel

180
reluctant to teach again in the village. The fourth factor was the safety of the teachers. Then,
the fifth factor was insufficient education supporting facilities especially books.
“For the city area, the quality has improved well. However the quality of the villages is still low. Since the
geographical situation is difficult, it becomes an obstacle for the teachers just to get to school. Therefore,
teachers who have moved to the city will feel reluctant to go back to the village to teach.” District MOEC in
Jayapura – Papua
“The quality of basic education in rural and remote areas is still poor. The first cause is because of the
parenting pattern. The parents will bring their children wherever they go. Therefore, the children are not
mentally ready to go to school. The second cause is because the parents are too busy taking care of their
farms, so they do not prepare breakfast for their children before going to school. The third cause is because
the school facilities are still insufficient to support learning activities especially when the school lacks books.”
Provincial MOEC in Jayapura - Papua
Weaknesses of Basic Education
Figure 5.17. Model of Weaknesses of Basic Education
Figure 5.17 shows six weaknesses of basic education in a systematic flow. The following
weaknesses of basic education that were identified by the education officials at the provincial
and district levels are described below:

181
1. The low reading competency
The Ministry of Education witnessed low competence of the students in reading,
writing, and counting (Calistung). Even those who had graduated from primary
school still could not read.
“Calistung is very low and is still a problem until now. These students have passed primary school,
but they are still unable to even read.” District MOEC in Jayawijaya – Papua
2. The problems with the teachers
According to the Ministry of Education, the low Calistung competence was due to
problems encountered by the teachers, whether externally or internally. Some of
those problems are as follows:
Teachers‘ low commitment
The teachers‘ commitment, especially those who taught in the remote and
rural areas, was still questionable. According to the Ministry, their
conscience to give good and quality teaching was still far from the
expectations. The passion to educate and to develop their region had
declined. Another excuse that teachers used to skip classes was the fact that
the teacher housing was not around the school area. They explained that
they had no money to travel to a school located far from the city.
Moreover, many of them had become state teachers, but their commitment
to come to school remained low and at the end, those who taught in the
class were voluntary teachers.
“There were some state teachers who did not show up in the classes, and thus voluntary
teachers became their substitutes.” District MOEC Jayawijaya – Papua
The low teacher competence
Low teacher competence was also one of the issues. The competence
among teachers in the rural areas was still uneven. There were many
teachers who were graduates of teacher education programs, like SPG,
PGA, and such but they did not master their subjects. Many of them were
out-of-date in terms of the development of the education field, the teaching

182
methods, and other things related to teaching and learning processes such as
device operating capability. Until now, teachers had only taught things they
knew while they did not update themselves with what had been going on.
“Sometimes, when the demonstrating devices are available to support teaching learning
like in Biology lessons, the teacher is not capable of using it.” Provincial MOEC in
Manokwari – Papua Barat
Limited number of teachers
At the moment, the availability of teachers that could teach in primary
schools in rural and remote areas was the biggest issue. A grade 6 class in a
primary school typically had 2-3 teachers. Moreover, the absence of subject
teachers made the class neglected. There were some factors that caused the
limited availability of teachers. The first factor was the fact that many of the
primary school teachers had reached retirement age. The second one was
that the incentive was so low that the motivation to teach was weak.
According to District MOEC, the government should issue a policy that
regulates a special incentive for the teachers, so that they would be more
motivated and not ask for a transfer.
“There should be a policy from the government that gives a special incentive for the
teachers, so that they won’t ask for a transfer, falsify a doctor’s letter for sick leave, or
make other excuses.” District MOEC Manokwari – Papua Barat
“The difficulty that the government is facing is the limited availability and the competency
of the teachers. If the number itself is limited, how can we improve the quality of our
basic education? The main tool to improve the quality is the teacher.” District MOEC
in Sorong – Papua
3. The non-transparent use of BOS funds
Another weakness was the ineffective and the transparent use of the BOS and
other funds. Such non-transparent use of the funds by the principal could create
social jealousy that in the end could make the teachers unmotivated to teach.

183
“When we asked the teachers whey they didn’t go to school, they answered that we should just let
the principal teach since he’s the only one who uses the funds.” District MOEC in Jayawijaya -
Papua
4. The lack of parental support
In some areas, the parents did show their care and concern towards the school.
Therefore, they had a sense of ownership toward the school, and thus they often
helped. However, there were also many parents who were not interested to know
the school‘s situation. There were even people around the school who would not
bother to maintain the school‘s facilities, would harm the school, or steal teachers‘
belongings, and thus the teachers were reluctant to teach.
Even worse, according to the Provincial MOEC, the parents thought that going to
primary school was useless because after finishing it, the children would not have a
chance to continue their study. At the end, there was no difference between
children who went to school and those who did not. The children would only
become porters in the market. Therefore, the parents chose not to send their
children to school.
According to the Ministry of Education, the low participation of parents and
communities was also due to the economic factor. Thus, they would prioritize how
to get food over thinking about school. Then, parents and communities both thought
that education was the responsibility of the government only. Therefore, when their
children went to school, they would not do anything else. They just relied entirely
on the school and would not involve themselves.
“The children who live in rural areas prefer to go to the market and become porters rather than go
to school. It is because their parents share an idea of having similar results between the children who
go to school and those who do not. So, the children choose to directly become porters.” Provincial
MOEC in Jayapura - Papua
5. Limited school facilities
Facilities at schools located in rural areas could not support the teaching and
learning process. The Ministry of Education admitted that there were some schools

184
that were not appropriate for use since the floor was still made of soil, the walls
were of wooden boards, and toilets were unavailable. Furthermore, the classrooms
were still limited too. Some schools only had three classrooms. At the moment, the
Ministry of Education was trying to repair all those schools, whether they belonged
to a foundation or to the government.
The availability of books to support teaching learning was still questioned.
According to the Provincial Ministry of Education, besides the issue of lacking
learning books, the students‘ intention to read the books is still low and should be a
priority to improve the basic education situation.
6. Low competence of principals
The main duty and role of a principal was to manage the school. As a result of
his/her supervision, the principal was supposed to make a monthly report.
However, although the principal had received training on how to make such a
report, the principal had never made any. Therefore, in many cases, the District and
Provincial Ministry of Education could not monitor the provision of any facilities
that the school had requested. They did not know what problems the school was
facing either. According to the Ministry of Education, this issue was due to the fact
that the principal was about to retire or to move and s/he did not train his/her
replacement or his/her replacement did not want to learn.
Efforts to Deal with Issues in Basic Education
To deal with those issues in primary education, the Ministry of Education carried out these
following attempts:
1. Creating small classes
To deal with the low student capabilities in Calistung, the government created small
classes for Grades 1, 2, and 3.
“The quality of basic education in the villages was still low and thus, the department created small
classes for Grades 1, 2, and 3 to help students learn how to read and write.” District MOEC in
Manokwari - Papua

185
2. Recruiting part-time teachers
According to the Ministry of Education, to deal with the teacher availability, the
Ministry of Education recruited some part-time teachers. By the year of the study,
the Ministry of Education in the Biak District needed at least 260 part-time
teachers. Up to then, 60 teachers were still needed.
“We also got more or less 30 teachers from the central government. However, after we checked,
there were only 3 for primary school. Therefore, we still need 260 part-time teachers.” District
MOEC in Biak - Papua
3. Working together with international agencies like UNICEF for training
The lack of teachers also forced the government to do other efforts besides adding
to the quantity of teachers. It worked with UNICEF to provide training for teaching
early levels and teaching multiple classes. With the presence of such classes, the
Ministry of Education hoped that the teaching and learning process could still be
performed despite the fact that there were only 1-2 teachers around to teach.
4. Conducting surveys and approaching the communities when building a school
Other things that the Ministry of Education had done were conducting surveys and
approaching the communities when they were about to build a school. Through the
surveys and the approaches, the Department would know whether the
communities would like to have a school there or not.
Curriculum Implementation
In accordance with the instruction of the Minister of Education, the curricula to be
implemented in the Provinces of Papua and Papua Barat were the 2006 Curriculum (KTSP)
and 2013 Curriculum. Therefore, some schools used the KTSP, while some other schools
implemented the 2013 Curriculum. In the Sorong District, the KTSP was used by 114
primary schools, whereas the 2013 Curriculum was used by 4 primary schools. The
implementation of these curricula was regulated by the Central MOEC through the District
MOEC.

186
“The 2006 Curriculum is used in 114 primary schools, and the 2013 Curriculum is used in 4 primary schools.
It’s according to the new instruction of the Minister of Education.” District MOEC in Sorong – Papua
Although the 2006 KTSP had been implemented for quite some time in Indonesia‘s
education, in reality its implementation in Papua had faced some obstacles. Likewise, the
newly implemented 2013 Curriculum did too. The difficulty to find teaching materials, such
as textbooks and visual aids, was an obstacle faced by the schools. While the funds to buy
the materials were available, the materials could not be found in any bookstores. To deal
with the limited textbooks, the Ministry of Education contacted the Airlangga Publisher to
buy the textbooks for the 2006 Curriculum, using the BOSDA funds.
The Ministry of Education also provided training to implement the curriculum well. Likewise,
UNICEF also provided training for the teachers and the principals. Teacher training
programs were aimed at improving the teachers‘ quality, whereas the principal training
programs were aimed at improving the integration of the school organization and
management.
Roles of the Ministry of Education in Basic Education in Papua
According to the Ministry of Education at the provincial and district levels, in general, its
role was still limited. The roles can be seen in Figure 5.18.
Figure 5.18. Model of Roles of the Ministry of Education in Basic Education in Papua

187
1. Monitoring through the school supervisor
Actually, the main focus that the Ministry of Education had to carry out was
monitoring and the superintendents‘ qualifications. The Ministry of Education had to
be able to monitor all schools in its area. However, now the ministry could only
provide half of the total number of superintendents needed in each district.
Therefore, several schools were routinely visited and the others were rarely visited,
especially the schools that were located in remote and rural areas.
2. Repairing facilities and infrastructure
For this role, the Ministry of Education tried to include this agenda in the Dokumen
Pelaksanaan Anggaran (DPA or the Budget Planning Document) that would be
proposed to the district. It proposed and allocated the budget for renovation every
year, especially for schools with extremely grave conditions that needed renovating.
By the time of the study, the Ministry of Education was preparing the 2016 budget.
According to the Ministry, 80% of schools in several districts still had relatively
good buildings, while 20% of them still had minimum facilities. However, schools
were not really responsible for the maintenance, and thus each year renovations for
the school/classroom buildings were required.
3. Providing teacher training
The Ministry of Education had provided training for teachers in relation to the
curriculum during the meeting with Kelompok Kerja Guru (KKG or the Teacher
Work Group). Besides the Ministry of Education, some NGOs also helped to
provide training programs, like ones to enhance teacher quality. Other NGOs like
YPK and YPKK held an awareness program for teachers every year.
4. Teacher Recruitment
By the time of the study, the Ministry of Education of the district had recruited new
teachers through the K1 and K2 programs (Kategori 1 dan Kategori 2 or Category
1 and Category 2). In the Biak District, its Ministry of Education had recruited as
many as 226 contract teachers from various institutions with the qualifications of
B.A. in Education and teacher certification (Akta 4), to be placed in the rural and

188
remote areas. Let alone university graduates, those who taught in the primary
schools were only graduates of Diploma 2 in education so far. Thus, they could not
teach effectively or keep the students motivated.
5. Making core primary school policies
Another thing that the Ministry of Education was in charge of was making policies.
One of the proposed policies was to make one core primary school only for
Grades 4, 5, and 6 with good management. This core primary school would also be
accompanied with a dormitory and it would be fully funded by the government. The
development of the building had started in 2008, but by the time of the study it was
still not finished.
6. Hosting a meeting with the school committee and parents
As part of its monitoring obligation, the Ministry of Education organized a meeting
with the school committee and the parents in order to motivate them to give more
attention to the children‘s education.
7. Organizing cooperation with universities in charge of SM3T and UNICEF
To deal with the limited number of teachers, the Ministry of Education worked
together with universities that were in charge of SM3T. The Ministry of Education
assigned teachers to schools that needed them. Furthermore, the Ministry of
Education also collaborated with UNICEF to train contract teachers. These
teachers received training on how to teach in remote and rural schools.
Difficulties in Conducting the Roles
In conducting its roles, the Ministry of Education at the provincial and district levels faced
these following difficulties:
1. The lack of superintendents
By the time of the study, the Ministry of Education lacked superintendents to
monitor the issues faced by schools, especially the issue of teacher and principal
absenteeism. In the Biak District alone, the number of the superintendents was less
than 50% of what was really needed. Due to the lack of superintendents, some

189
schools received regular visits from the superintendents, while some others did not,
like the ones in Padaido, Numfor, or other rural and remote areas.
2. The lack of a safety guarantee for teachers working in rural and remote areas
The support from the communities to provide a sense of safety for the teachers
was also inadequate; therefore, some teachers refused to be placed in some
particular areas. Such an issue made what the Ministry of Education had done to
add to the number of teachers and to train them useless.
3. The official internal organizational structure that was still being adapted
For some districts that just had their district leaders changed, the Ministry of
Education still had to establish itself. For example, in the Biak District, the Ministry
of Education had to acclimate itself, since the new leader was appointed only in
February 2015, and ever since there were many changes in the administration,
including the head of the Ministry of Education, which was only appointed on March
15, 2015. There were many officers in the Ministry of Education whose original
backgrounds were not in education. Therefore, more adaptations were still needed.
4. The principals‘ lack of technical and managerial skills
The service training at school still had not prepared the principals. Many of them
were originally teachers and they were not trained in technical managerial skills.
Thus, they did not understand the school management and did not have the ability
to guide other teachers. It resulted in the mediocre educational service of the
school.
The principals‘ lack of technical and managerial skills could also affect the principals‘
attendance in the schools. Based on the Teachers‘ Absenteeism Study (2012), the
absence rate of the principals was about 50%.
5. The lack of funding to finance organizations for primary schools
There were no funds available to pay for an organization with the level of primary
education. The Kelompok Kerja Guru (KKG or the Teacher Work Group) did not

190
have any more budgets, and thus, the organizational function of every school
declined. Then, the lack of funds made the teachers lazy since their salaries were
low and incomparable with the rate of living in the city.
The Ministry of Education also encountered an issue with the operational funds. By
the time of the study, the operational funds between schools that had an easy-to-
reach geographical condition with good transportation and those that had
challenging a geographical condition were made the same. Therefore, the funds
were insufficient, and the schools would rather just return the funds. The principals
themselves considered the funds insufficient to pay for the expensive
transportation. Therefore, the local government provided a BOSDA fund to help
schools.
“The Department is also having an issue with a limited budget, since it’s not enough to use this
fund to deal with the expensive prices and the geographical locations.” District MOEC in
Manokwari – Papua Barat
6. The ineffective communication with the communities
There was not any good communication with the village heads, and thus the schools
did not know who led the village. At the end, the communities directly made
reports to the Ministry of Education about the teachers and the principals who did
not come to school.
7. The schools were built on traditional land
The issue started when the Ministry of Education wanted to build a new classroom
or a new building for the school on the land that belonged to certain families
according to the traditional customs. In the past, the parents of the families had
given the land to the Ministry of Education, but the children later asked for
compensation for that land.

191
Efforts to Deal with the Difficulties
What the Ministry of Education has done to deal with the difficulties is listed as follows:
1. Involve the communities in monitoring the schools
The Ministry of Education empowered the communities around the school to help
them control the school and its activities, as well as its staff. The Ministry provided
a program to involve the communities, i.e. the Program Serta Masyarakat (PSM or
the Society Participation Program). The Ministry of Education also invited the
community members that were part of the school committee to get involved and to
maintain the school assets through the MBS modification program from UNICEF.
“We involve the society in the PSM (Program Serta Masyarakat or Society Participation Program).”
District MOEC in Jayawijaya – Papua
“We invited the society (school committee) to actively participate in maintaining the school assets
and advance them through the MBS modification program from UNICEF.” District MOEC in
Biak - Papua
2. Freeze the funds and postpone the certification
To deal with the issue of teacher and principal absenteeism, the Ministry of
Education appointed a supervisor to carry out the control. However, because the
superintendents were still limited in number, since this year, the Ministry became
more selective in giving out the funds. The selection process was based on reports
from the teachers, the community members, and the superintendents. The Ministry
of Education would only give funds to schools in which the principals were active
and always present. In addition, the Ministry of Education also postponed
certification for teachers whose attendance rate was low.
3. Give Bantuan Operasional Sekolah (BOSDA)
To fulfill the needs of schools‘ operational funds and to support the national BOS,
the district government gave BOSDA through the district level Ministry of
Education. In Papua and Papua Barat Provinces, BOSDA was only given to the
Sorong District.

192
4. Build new classrooms
The Ministry of Education made a program to add part-time teachers in
collaboration with universities that ran S3MT, like Cendrawasih University that
placed teachers in remote and rural areas. With such a program, it could possibly
add to the number of classes in a school. According to the Ministry of Education, if
the classrooms were insufficient or if the school had too many students, it would
soon build a new classroom.
Educational Aid Programs
The government gave such aid programs in order to prevent the students from quitting
school due to a lack of money from the parents and to maintain the educational
development in each region. Besides that, such aid was given to make sure that the
minimum service standards from the central or local government were met. Moreover,
education was one of the basic needs. The minimum service standards were measured with
the APK, while the APM was based on each school. Figure 5.19 shows the target, kinds, and
sources of aid.
Figure 5.19. Model of Educational Aid Programs

193
Target of Aid
The aid given to each school was generally by the request of that school. The analysis and
the verification for the request were not optimal and incomplete, and thus the aid programs
oftentimes did not hit the right target.
Sources of Aid
The aid programs came from the central, the regional, and the provincial Ministry of
Education. The sources of the funds were from both the national and the regional budgets.
Kinds of Aid
The aid programs encompassed:
1. Training and awareness program for teachers
This included training for basic education, teaching multiple classes, KTSP for the
teachers, and lesson plan writing for teachers through the national budget. The Biak
District went back to the KTSP 2006 Curriculum, and its implementation saw no
issues as each school had received training. There was training provided by the
central and local government for the implementation of KTSP 2006. UNICEF
provided support through the MBS program that was also adopted by the Ministry
in a different program.
2. School buildings
According to the Ministry of Education, there were already plenty of aids. The local
primary schools had also received development, which were still running.
Nevertheless, there was not any that year. The development included the library
and the supporting facilities, like computers. Some schools received computers
from the central Ministry of Education, while, according to the district‘s
Department of Education, electricity was not installed yet in that village.
3. Aid funds for schools
In general, there was much aid available for schools, such as the BOS funds from the
central government, the BSM (Bantuan Siswa Miskin or Aid for Poor Students), the
Dana Alokasi Khusus (DAK or the Specially Allocated Funds), the Dana Otonomi

194
Khusus (OTSUS or the Special Autonomy Funds), and the Dana Pembangunan
Ruang Kelas Baru (RKB or the New Classroom Development Funds). There was
also the Dana Gratis (Free Funds) for as much as Rp. 10,000 / student from the
local government of Jayawijaya.
“Budget wise, there is already enough funding for the basic education in Biak District, and thus
students are not charged. Besides the regularly given BOS funds, there is this aid for non-BSM
students (students who do not receive any scholarship from the province) from the district/local
budget. Therefore, all students from the primary school up to the senior high school level have
received aids from the central and the district levels through the Dana Operasional Pendidikan
(DOP or the Educational Operational Fund).” District MOEC in Biak - Papua
4. Block grant activation
Another aid that the central government gave besides BOS and BSM was the Block
Grant. It was a physical model for an integrated school that included a primary
school, junior high school, and senior high school.
Availability of Educational Data at the District Level
The availability of educational data at the provincial level is sufficient. Provincial MOEC has
many kinds of data, for example reading ability data, basic education participation rate data,
educational aid program data, and other data that could support planning, monitoring, and
evaluation activities. Nevertheless, at the district level, the availability of educational data
varied. According to the district MOEC interviews, some districts already had enough data,
like Manokwari District and Jayawijaya District. However, in some other districts, like Biak
District, they only had around 50% of the total data needed to support planning, monitoring,
and evaluation activities.
In Manokwari District, the availability of the data was not an issue. The only weakness was
that teachers had to go to the city and leave the school in order to obtain the data. This was
due to the fact that the facilities were only available in the city. However, in Biak District,
the educational data was still being processed, and thus by the time of the study, the already
available data was not representative. The data was eventually finalized on March 24, 2015.
195
“The availability of the educational data in the district/province with the number of primary schools being 167,
and the private ones as much as 60%..” District MOEC in Biak – Papua
As mentioned above, the available data would then be used to do the planning, the
monitoring, and the evaluation. It would be very useful for the educational development and
for the other programs, as well as the aids that the Ministry of Education would plan for the
next 5 years. The data would be used as a reference to develop the Rencana Strategi
(RENSTRA or Strategic Plan), and the Rencana Kerja (RENJA or the Work Plan). Moreover,
this data would be useful to facilitate every activity. The section which created basic
education planning for rural and remote areas was the Provincial MOEC. However, the
implementation was still conducted by the District MOEC. Therefore, the data would be
evaluated in each district.
“The data will be used for all planning, for example, for using the funds, we can see which data is used as the
reference, which school has got one and which hasn’t.” District MOEC in Jayawijaya – Papua
“Yes, it’s used to do the evaluation monitoring of the school, like the number of buildings that need repairing,
the number of classes in every school, and whether the capacity of the class is enough or not.” District
MOEC in Jayapura - Papua
“This data is very useful since it makes the process very easy. We will have the Musyawarah Perencanaan
Pembangunan (MUSRENBANG or the Development Planning Forum) this March. Thus, we have data as a
reference to do the planning. Then, if the districts submit a proposal, we can confirm it with the data.”
District MOEC in Manokwari – Papua Barat
Policy Implementation
The government‘s policies that still worked well were those that dealt with the
improvement of students‘ potentials and talents to enable them to compete in Science,
Sports, and Arts Olympics, as well as policies that were supported, like the School Based
Management, the HIV control, and the provision of clean water. Other policies related to
basic education like the implementation of the 2013 Curriculum had been performed, but it
was not maximal yet, especially in the rural areas. It was due to the fact that the learning
process had started since January, but the textbooks were not available, and thus, the
teachers had to be creative.

196
The policies that did not work well at the primary school level were the Kelompok Kerja
Guru (KKG or the Teacher Work Group), the Musyawarah Guru Mata Pelajaran (MGMP or
the Subject Teacher Forum), the Kelompok Kerja Kepala Sekolah (KKKS or Principal Work
Group). The work groups only worked at the junior and senior high school levels. The
other policies that did not work well were the dormitory-based schools.
“The government’s policies that did not work well: KKG, MGMP, LKKS, MKKS (only worked at the
junior and senior high school levels, but for primary schools did not work).” MOEC in Biak – Papua
“The policies related to basic education have been implemented, but they are not working
maximally, like the curriculum. The Central Ministry of Education has instructed the implementation
of the 2013 Curriculum. It has only been implemented at the district level, but it encounters a
problem in the rural areas. It is due to the fact that the learning process has started since January,
but the textbooks are not available yet, so teachers just teach it as it is and try to be creative.
However, the policy that doesn’t work is the dormitory-based school.” MOEC in Sorong – Papua
Organizational Structure to Deal with the Problems in Primary Education
To solve the educational issues in the rural/remote areas, especially the eradication of
illiteracy, the Ministry of Education in the district proposed to reactivate the branch office.
All of this time, the branch office had existed as an extension of the District Ministry of
Education. However, since the branch office was only considered as an organization, it was
not included in the local regulations, and as a result, it did not receive any budget from the
district to carry out its tasks. Therefore, the performance of the branch office was
hampered due to its lack of funds. In fact, the branch office worked with the school
superintendents as the executors of its tasks. However, it was not legally approved by the
local regulations. In Sorong District, there was a special agency that was in charge of
illiteracy eradication, i.e. PAUDNI (Paud Non-Formal Informal). The reactivation of the
branch office by giving it a legal basis and providing it with a budget would really help the
improvement of the basic education quality in the rural areas.
Then, according to the Ministry of Education, the level of government in the communities
that was the most appropriate to work on the educational issues in the rural/remote areas
was the village head. Almost all villages had a primary school. The village head had an

197
important role to advance the basic education in his/her region. Later on, the village head
would work together with the branch office in every village.
The Ministry of Education in the Biak District proposed to split some of its authority,
functions, and duties with the village head to manage and develop the basic education in
his/her area. In the end, the district would handle the management and the service, like the
teachers‘ fee payments, and thus the teachers did not have to go to the Ministry. The
Ministry of Education in Biak District would also provide a public service; the services for
the city and the village were the same. Some recommendations received by the Ministry in
collecting the data on the field were related to the special service rate, especially the
management of basic education in the rural/remote areas. It should have changed the service
rate to be 60% for the rural/remote areas and 40% for the cities.
For the Badan Pemberdayaan Masyarakat Kampung (BPMK or the Village Society
Empowerment Agency), in every district and every village, there were some groups called
Prospek (previously RESPEK). Prospek did interventions for aid given to villagers in
education, health, and welfare sectors.
Unit Pelayanan Teknis (UPT) was in charge of shortening the control range in dealing with
schools that were located in the rural and remote areas. For example, UPT would deal with
absent teachers. UPT was expected to actively play its role. The superintendents could have
their home base at the UPT, so they could monitor the schools. By the time of the study,
the status of the UPT was almost the same with the branch office. According to the
Department of Education of the Biak District, the UPT for basic education only had to be
reactivated through the local regulations. Its effective functions and roles for the district‘s
education would reach every village. Like Biak District, Sorong District did not have the
UPT in its districts either, while it was actually very important. Nevertheless, the
reactivation of UPT would also demand more expenses.
198
Provincial and District Education Office’ s Recommendations
The Ministry of Education at the provincial and district levels gave the following
recommendations:
1. Fulfillment of teaching staff
As 250 teachers in Papua will retire in 2015, it is compulsory for the Ministry of
Education to add to the number of teachers. The recruitment should also consider
the study field of the teacher candidate. In fact, the improvement of the basic
education quality cannot be separated from the fulfillment of the teaching staff as
the central figures for an effective educational service in the rural/remote areas.
2. Legalization of basic educational local regulations for teachers
The programs that have been running since 2013 were developed from the draft of
the educational local regulations. By the time of the study, there was not any local
regulation for teachers. The draft has been registered in the local council, but when
it will be ratified is still unknown.
3. Focus on the improvement of reading competency
The Ministry of Education at the district/province level sees that students‘ reading
competency is the most important thing to improve.
5.7 Policy and Structure
Several policies and regulations about basic education in remote and rural areas across all
levels, including the national, the provincial, and the district levels, have been implemented
to eradicate illiteracy.
Policy on Providing Basic Education in Remote and Rural Areas
The first regulation on the provision of basic education for remote and rural areas is
regulation Number 23 Year 2003. Citizens in remote and rural areas, as well as indigenous
people in remote areas are all entitled to a special education service. The definition of the
special education service is provided in Chapter 32. A special education service is an
education dedicated for those who reside in remote and rural areas, and/or those who live

199
in an area afflicted with either a natural or a social disaster, as well as for those who cannot
afford an education.
A special education service covers 5 elements based on target condition. The first is a group
of students who live in a remote area and face a geographical barrier. The second is a group
of students who come from a minority or isolated ethnicity. The third is a group of students
or community who face a financial barrier. The fourth is a group of students or community
who live in a remote and rural area. The last is a group of students or community who face
a social problem. Besides the five groups of students, it also includes a group of children
who need special service education, and one of them is the group of children of isolated
indigenous people.
Specifically for Papua Province, there is an educational service policy for a remote traditional
community or Komunitas Adat Terpencil (KAT) written in PERDASUS Papua Number 3
Year 2013. According to Chapter 3 of the policy, the educational service for KAT functions
to enforce the constitutional rights of ‗original‘ Papuans who are now in the age of having
compulsory education. The KAT education service is the authority and obligation of the
provincial and district government. The education service itself consists of two types of
education. The first is a formal education in the form of a basic education. The second is a
non-formal education such as, skill course, education and treatment of HIV-AIDS and other
transmitted diseases, as well as literacy training in a village community.
Regulation Number 6 Year 2014 also encourages the use of education as one of the tools to
have a place in the community. Based on chapter 33, one of the community leader candidate
requirements is having a junior high school certificate at least. Chapter 50 also emphasizes
that one of the structural village committee requirements is that the candidate should at
least graduate from junior high school. Then, in chapter 57, the requirement of having at
least a junior high school certificate is stated again. It explains that a village deliberation
association candidate should have a junior high school certificate. In brief, it is clear enough
that formal education is strongly encouraged. Local, provincial, and district governments
empower the villagers by increasing their managerial quality through education, training, and
socialization, which is also stated in chapter 12.

200
Empowerment of the local community is a mandate for the provincial and district
government. This mandate is written in chapter 112 Regulation Number 6 Year 2014. It is
also stated that training and controlling can be delegated by the local government to the
local structural community. The local government and local structural community can give
training and socialization in order to improve the managerial quality in the village. Moreover,
the provincial and district governments have to empower the villagers by implementing
modern science and technology to improve the economic condition and agriculture sector.
The third regulation is Regulation Number 21 / 2001 about the special autonomy of Papua
Province. The regulation states that the general allocation fund is especially for education
and health funding. Based on chapter 34, the percentage is around 2% of the national general
fund allocation range. In chapter 36, it is mentioned that Perdasi determines changes and
calculations of income and expenditure of the provincial budget. Besides that, it is explained
that around 30% of the income is allocated for education funding, and 15% of the income is
for health and nutrition improvement funding. The provincial government, the Papua
Government, has an obligation to provide education for all grades, access, and type.
According to one of the community leaders, the regulation is not well-implemented. Every
year, the special autonomy fund accepted is around 30 trillion rupiah. However, the
effectiveness of the development result and the efficiencies of its use are not maximal.
Policy on Papua Education Funding
PERDASUS Papua Number 25 Year 2013 is about revenue sharing and the financial
management of special autonomy funds. Based on chapter 8, Papua province and its districts
will obtain a special autonomy fund, which has been deducted with PROSPEK and across
district strategic program funding. The proportion of the fund is 20% for Papua Province and
80% for districts in Papua Province. Then, in chapter 11 PERDASUS Papua Number 25 Year
2013, 30% of the special autonomy fund for the district will be allocated to the education
sector. The fund will support PAUD, 9 Years of Compulsory Education, Middle and Higher
Education.

201
Policy Related to Teacher Management
The teacher regulation in Papua is similar to other provinces. According to chapter 77
Regulation Number 14 Year 2005, teachers and lecturers who do not do their duties will be
penalized. The penalty can be in the form of giving a warning, both in a verbal and written
form, delaying the teachers‘ right for a grant, lowering their rank, as well as dismissing them
with or without a recommendation. Meanwhile, the part-time teachers and the teachers
hired by the education institution established by the community who do not do their duties
based on their working contract will be punished according to the agreement written in the
contract.
Then, based on chapter 63 section 2, any teachers who cannot fulfill their duty to have 24-
hours face-to-face of a learning activity and they do not get any exception from the minister
will lose their right to get professional, functional, and other additional incentives. The
regulation for leave for civil servant teachers and lecturers is written in government
Regulation Number 24 Year 1976. In Regulation Number 74 Year 2008 chapter 63, it states
that the teachers who cannot fulfill their academic and competency qualifications and have
been given certificates will lose their right to get professional, functional, and other
additional incentives after 10 years of opportunity.
Government Structure in Basic Education
In regards to the issue of eradicating illiteracy and other remote and rural area educational
issues, the local MOEC has its own specific education divisions at the provincial and district
levels. They are Direktorat PKLK DIKDAS, DITJEN PAUDNI, TNP2K, PBMK and UPTD.
Those divisions will be described below.
Direktorat Pembinaan Pendidikan Khusus dan Layanan Khusus
Pendidikan Dasar (Direktorat PKLK Dikdas)
Special Education and Special Service Education or Pendidikan Khusus dan
Pendidikan Layanan Khusus (PK-PLK) is an education service for children who
have special needs or anak-anak berkebutuhan khusus (ABK), including children
with or without physical disabilities. The children with or without physical
disabilities have been categorized in Sisdiknas Regulation Number20/2003
202
chapter 32 section 1 and 2. The children in Papua are categorized as ABK non-
physical disability, i.e., children with a geographical barrier. It is because the
Papuan children live in the 3T area.
The Direktorat Pembinaan Pendidikan Khusus dan Layanan Khusus (PL-LK)
formulates and coordinates the policy implementation, as well as facilitates
technical standard implementation in the special education sector. Providing a
high quality of education for the community in rural and remote areas is a must
for the directorate, so that the people can finish their middle education well.
DITJEN PAUDNI
Direktorat Jenderal Pendidikan Anak Usia Dini, Non-formal dan Informal
(PAUDNI) determines the policies and the educational programs for early
childhood (PAUD), community education, courses and training for the PAUD
educators, and also assessment, development, and the quality monitoring
program. The DITJEN PAUDNI policy in 2011 aims to fulfill the service quality
increment and to support the education service availability and access. To fulfill
their obligation, PAUDNI carries out several functions as follows:
Increases the availability and the accessibility of the PAUD service, which
fulfills the minimum standard of the PAUD service and encourages service
quality increment simultaneously, holistically, in an integrative way, and
sustainably in order to create creative, smart, healthy, cheerful, and good
mannered children.
Increases the availability and the accessibility of the literacy education
service for those who are above 15 years old. The education service is
based on empowerment, gender equality, and relevance with individual
and community needs in regards to the Literacy Initiative for
Empowerment /LIFE.
Increases the availability, quality, and professionalism of PAUDNI
educators through qualification and competency increments, appraisals,
and protection.

203
TNP2K (Tim Nasional Percepatan Penanggulangan Kemiskinan)
The government forms TNP2K as an organization that coordinates the
stakeholders across all sectors and in a central area in order to accelerate
poverty reduction. This organization is based on Presidential Decree Number 15
Year 2010 and the head of TNP2K is the President of Indonesia himself. This
organization has three main duties, namely: 1) to create policies and programs
for poverty reduction, 2) to create synergy through the synchronization,
harmonization, and integration of poverty reduction programs in the ministry or
other government institutions, and 3) to control and monitor the
implementation of poverty reduction programs. One priority of TNP2K‘s short
and middle term programs is to refine the implementation and the coverage
extent of Program Keluarga Harapan (PKH) that also exists in Papua.
PBMK (Badan Pemberdayaan Masyarakat Kampung dan
Kesejahteraan Keluarga)
PBMK‘s main duty is to conduct empowerment for villagers in order to increase
family welfare. Specifically, they have five functions, namely formulating a technical
empowerment policy, training the community in the economic and technological
sector, implementing an empowerment program, managing the UPT, and
managing the administration.
UPTD
UPTD (Unit Pelaksana Teknis Dinas) Pendidikan is the organization that carries
out the educational policies from the regency/municipal government, as an
extension of the Dinas Pendidikan Kabupaten or Kota in implementing the
educational regulations and the policies at the district level. UPTD Pendidikan is
also the executor of the education program at the district level. In this program,
the UPTD functions as the trainer, the developer, the supervisor, the
coordinator evaluator, and the advisor for the education provisions at schools,
for both formal and non-formal education, in order to realize the visions and the
missions of the regency government.

204
Based on the findings obtained from the in-depth interviews with key stakeholders of basic
education in Papuan provinces, it was revealed that despite the current policies and
regulations that have been implemented by the central and local governments, the illiteracy
problem among early grade students in rural and remote areas is still difficult to eradicate.
The core problems that might hinder the quality of basic education in the rural and remote
areas of Papuan provinces are summarized in Figure 5.20. This model confirmed and
supported the findings obtained from the EGRA and SSME surveys explained in Chapter 3
and 4 of this baseline report.
Figure 5.20. Factors Impacting the Basic Education Quality in Papuan Provinces

205

205
Overall, this baseline study revealed that the majority of early grade students in rural and
remote areas of Papuan provinces were readers with limited comprehension (38.55%) or
non-readers (48.47%). Less than 15% of them were categorized as readers: reading with
limited comprehension (5.35%) or reading with fluent comprehension (7.63%). However,
these results were not consistent across districts or categories of student demographics.
This reading performance, in fact, was an accumulation of structural problems the Ministry
of Education and Culture has been facing in managing the provision of basic education in
rural and remote areas of Indonesia in general and in Papuan provinces in particular. All
components that are related with the stakeholders of basic education in Papuan provinces,
be it students and their families, teachers, head teachers and schools, the communities, and
local education authorities, contributed to these structural problems.
Students faced several challenges to achieve a better reading performance. The challenges
included economic, geographic, and socio-cultural disadvantages. As students mainly came
from low income families and lived in rural and remote areas of Papuan provinces,
unfortunately at the same time they obtained limited support from their families, such as the
unavailability of parental support when they were studying at home, the necessity to help
their parents earn a living, the unavailability of any books at home other than the limited
textbooks provided by their schools, and in a few cases incidents of domestic physical abuse.
As a result, there was a very restricted learning and reading environment at home. The
condition was even worsened by the geographical and social disadvantages. This study found
that, apart from being ill, the main reason for a student‘s absence was due to geographical
and social disadvantages such as: the unavailability of transportation, the occurrences of bad
weather, and the danger of traveling to school due to local conflicts. This absenteeism had a
significant negative impact on the students‘ reading performance.
Parents were only involved and informed about their children's academic progress on a
limited basis. Also, they were never informed about the school plans or programs. Parents
were dissatisfied with the teachers‘ absences and their limited involvement, but on the other
hand, the teachers were also unhappy about parents‘ support. As a result, limited
communication and collaboration between parents and teachers/schools occurred.
6 CONCLUSIONS AND IMPLICATIONS

206
The teacher factor also contributed to students‘ disadvantages. There was a lack of teachers
for early grade classrooms, so that teachers were forced to teach multiple classrooms.
There were cases of mismatches between a teacher‘s academic background with a teacher's
subjects, for example: a religion teacher was requested to teach a math class or Bahasa
Indonesia class. Teachers‘ employment status, in which the majority of teachers were
honorary teachers, was also disadvantageous for students, not to mention the limited
supervision and control from the head teachers and Dinas. These all resulted in teachers'
low motivation and ultimately led to teachers‘ absenteeism and reduced quality of teaching
(as half of the teachers taught without lesson plans).
Head teachers had their own contributions to students‘ disadvantages. Head teachers had
relatively limited experience as head teachers, as 63% of them had only been in the position
for less than five years. They had limited manpower at the schools; while on the other hand,
they were required to handle administrative tasks from Dinas. Balancing these two
responsibilities made it difficult for them to manage the schools optimally. In addition, the
head teachers were also not fully supported by the community and the school
superintendents.
Schools and classroom facilities also hindered the students‘ potentials to learn and read
more. The majority of schools had very limited facilities and they were not clean and tidy.
The unavailability of proper toilets, clean water resources, electricity, libraries, and a
sufficient number of books in the libraries and classrooms, and even a sufficient number of
seats and desks in the classroom, have resulted in the low quality of teaching and learning
processes that could be provided to the students.
Those aforementioned factors lead to the students‘ unsatisfactory reading ability that was
measured jointly by oral reading fluency and reading comprehension. This baseline study
revealed that the reading ability of early grade students in rural and remote areas of Papuan
provinces was far below the average standard for students in Indonesia (from the EGRA
National Survey conducted by RTI International and USAID/Indonesia in 2014), and similarly,
far below other students in Maluku, Nusa Tenggara, and the Papua region. Furthermore, the
students‘ reading performance was inconsistent across the surveyed districts. Jayapura

207
students significantly outperformed their counterparts from the other five districts; while on
the other hand, Jayawijaya students obtained the lowest performance. This finding shows
that each district might need different treatments in order to improve the students‘ reading
performance.
Overall, it was found that the most consistent factors impacting reading performance were
district differences, student grade, parents‘ education and literacy, students‘ and parents‘
main language, parents‘ income, teacher academic qualification, classroom seating
arrangement, book availability and accessibility, students‘ displayed works, school type -
either public or private, school accreditation, as well as the availability and the usage of
library facilities. However, among these factors, some of them are ―policy relevant‖ but they
can unlikely be changed for individual students, such as district, wealth, school type and
accreditation, and teacher academic qualification. Meanwhile, some others are ―in-school
and student factors‖ and doing something about these factors would have a meaningful
impact on students‘ reading performance. For instance, changing students‘ seating
arrangement from the classical model to the U-shape or small group arrangement can have
a significant impact. Allocating enough funds to purchase attractive and interesting reading
books for early grade students, letting them have access to read comfortably, and to some
extent, letting them borrow the books, would also improve their reading performance. In
addition, creating a more academic but cheerful classroom environment by displaying the
students‘ works would also have a significant impact.
In addition to the aforementioned most consistent and impactful factors, there are also
some other ―in-school and student factors‖ that might be meaningful to be improved in
order to enhance students‘ reading performance. Utilizing a partial regression analysis, this
baseline study revealed that students' reading habits at home had a significant impact on
their reading performance. Therefore, the teachers might assign the students, as a part of
their homework, to read aloud at home to other family members. Furthermore, the
teachers might need to be encouraged to give written feedback on their students‘ exercise
books, as this factor significantly increased students‘ reading performance. In relation to the
exercise book, teachers and head teachers might need to pay attention to the students who

208
even do not have the book. Providing them with enough writing books, pencils, etc., from
any kind of budget that the school receives should be considered.
Homework frequency also might need to be increased. This study found that homework
had a significant impact on students‘ reading performance, but the frequency was found to
be still insufficient. Moreover, the students need to be appreciated by both teachers and
parents, while at the same time, proper- non-physical punishment is also required. The
balance of giving rewards and applying punishment was found to significantly increase the
students‘ reading performance.
This study also revealed that students‘ reading performance was not differentiated by the
teachers‘ training experiences and their academic qualifications. Students whose teachers did
or did not have pre-service training had a relatively similar level of reading performance.
Furthermore, students whose teachers said that they had attended training on how to teach
reading also had a similar level of reading performance as those whose teachers never did.
Interestingly, this study also found that teachers with Bachelor‘s Degree qualifications did
not necessarily have students with better reading performance than their fellow teachers
who only graduated from senior high school. Consequently, the education authority might
need to evaluate this phenomenon, as one of the programs of MOEC is to train and assign
Bachelor‘s Degree teachers in 3T areas of Indonesia.
The last factor of ―in-school and student factors‖ is the school's condition and facilities. As
this study found this factor had a significant impact on students‘ reading performance, the
education authority at the district level needs to pay close attention to this. From the book
research and in-depth interviews, it was found that there is a specific budget for school
facility improvement. However, the school observation results told a different story.
This study also recognized the other factors which had a significant contribution to the low
level of students‘ reading performance in rural and remote areas of Papuan provinces. From
the in-depth interviews with the community leaders and the MOEC officers at provincial and
district levels, it was found that the synergy among key stakeholders: head teachers, school
superintendents, community leaders, MOEC officers at the district level, and MOEC officers

209
at the provincial level was not optimally achieved. A lack of control and supervision of the
head teachers from the school superintendents and MOEC officers lowered the head
teachers‘ school management quality. It was not uncommon to find schools without the
presence of head teachers during the data collection. Meanwhile, the lack of school
superintendents to cover the large and remote geographical areas of Papua also contributes
to insufficient control and supervision. At the end side of the control is MOEC at the
district and provincial levels. These authorities were not without problems. Classical
problems such as a lack of personnel and a lack of manpower with enough and appropriate
competences to do the job were among the reasons frequently stated during the interviews.
Consequently, what was happening in the primary schools located in rural and remote areas
of the provinces was not fully understood by these authorities.
While no single solution is suggested for improving the conditions of basic education in rural
and remote areas of the Papuan provinces, this baseline study revealed ―in-school and
student factors‖ that might be more manageable and easier to be improved at the school
level by the head teachers and supported by parents and the community, in order to obtain
significant improvement on the reading ability of early grade students. Meanwhile, the
―policy relevant factors‖ which are unlikely to be changed immediately, need to be gradually
improved by provincial and district education authorities. To be able to do this, an adequate
capacity and commitment of the provincial and district education officers for strategic
planning and management of the school system is urgently needed. From this baseline study,
several tactical improvements that may be needed at each stakeholder level for basic
education in Papuan provinces are highlighted in Table 6.1.

210
Table 6.1: Tactical Improvements Needed at Each Stakeholder Level
At the Student
Level
At the Parent
Level
At the Teacher
Level
At the Head
Teacher Level
At the School
Level
At the
Community
Level
At the
Provincial/District
Level • Provide students
with enough
exercise books
• Assign students to
read aloud
regularly at home
• Assign students to
do their
homework
• Encourage
students to speak
Bahasa Indonesia
at home
• Encourage
students to go to
school regularly
• Encourage
students to spend
more time to learn
at home
• Encourage
students to use
the library (if any)
• Encourage parents
to support
students to read at
home
• Encourage
illiterate parents to
attend Kejar Paket
A to be literate
• Convince parents
to send their
children to pre-
school/TK
• Encourage parents
to speak Bahasa
Indonesia at home
• Persuade parents
to show more
appreciation for
their children‘s
achievements
• Push parents to
ask their children
to study at home
• Encourage parents
to have more
involvement in
their children‘s
education
• Ask teachers to
provide feedback on
students‘ works
• Ask teachers to
provide students with
homework regularly
• Convince teachers to
apply rewards and
non-physical
punishment to
students
• Motivate and provide
monetary or non-
monetary incentives
for teachers to reduce
their absenteeism
• Encourage teachers to
assign students to
read books
• Convince and prepare
teachers to apply U-
shaped or small group
seating arrangements
• Encourage teachers to
display students‘
works in the
classroom
• Motivate head
teachers to reduce
absenteeism
• Inspire and assign
head teachers to be
more focused on
their school daily
activities &
management
• Motivate and assign
head teachers to
provide enough
supervision and
control over teachers
• Convince head
teachers to involve
the community more
in school affairs
• Encourage head
teachers to be more
open on the budget
usage
• Encourage schools
to provide enough
exercise books for
children
• Convince schools
to minimize or
even eliminate
multi-grade
classrooms
• Encourage schools
to start thinking
about their
accreditation
• Sway schools to
provide libraries
with enough and
appropriate books
for early grade
students
• Persuade schools
to provide basic
utilities
(electricity, clean
water)
• Ask schools to
provide a reading
corner in the
classroom
• Convince schools
to work with the
community to
provide better
physical access to
schools
• Encourage the
community to
have more
involvement in
school affairs
• Educate the
community to
minimize negative
myths and gender
bias to increase
school
participation,
especially among
girls
• Increase
competencies of the
Dinas officers
• Increase the number
of teachers and
superintendents
• Speed up the
process of
appointing
honorarium
teachers to public
servant status
• Provide schools
with enough
teachers with
appropriate
educational
background
• Improve teachers‘
training quality
• Encourage
superintendents to
provide enough
management and
clinical supervisions
for schools
• Improve teachers‘
and head teachers‘
welfare

211

211
Badan Pusat Statistik (2014). Badan Pusat Statistik (BPS) open data (database). Retrieved
from http://www.bps.go.id.
Badan Pusat Statistik (2015). Badan Pusat Statistik (BPS) open data (database). Retrieved
from http://www.bps.go.id.
Carasco, J., Munene, J.C., Kasente, D., & Odada, M. (1996). Factors affecting achool
effectiveness in Uganda: a baseline study. Kampala: Uganda National Examinations Board.
Craig, H., & Heneveld, W.(1996). Schools count: World Bank project designs and the quality of
primary education in sub-Saharan Africa. World Bank Technical Paper Number 303 (Africa
Technical Department Series). Washington, DC: World Bank.
Directorate General of Higher Education (DIKTI), Ministry of Education and Culture
Republic of Indonesia (2014). Open data. Retrieved from http://dikti.go.id.
Elmslie (2010). West Papuan demographic transition and the 2010 Indonesian census: slow
motion genocide or not? Center for Peace and Conflict Studies, Sydney University.
Ministry of Education and Culture (2014). Centre for Education Data and Statistics open
data (database). Retrieved from http://www.kemdikbud.go.id.
Stern,J., & Nordstrum, L. (2014). Indonesia 2014: The National Early Grade Reading Assessment
(EGRA) and Snapshot of School Management Effectiveness (SSME) Survey. Research Report.
North Caroline: RTI International.
UNESCO and Ministry of Education and Culture Republic of Indonesia (2012). Literacy:
Empowerment, Development and Peace. Jakarta: Ministry of Education and Culture.
UNICEF, UNCEN, UNIPA, SMERU, & BPS (2012). A study on teacher absenteeism in Papua
and West Papua. Research Report. Jakarta: UNICEF.
UNICEF (2002). Children participating in research, monitoring and evaluation (M&E)- ethics and
your responsibilities as a manager. UNICEF Evaluation Technical Notes.
USAID Education Data Global (2014). Early Grade Reading. Retrieved from
http://www.eddataglobal.org.
REFERENCES

212
3 RESULTS AND FINDINGS:
SNAPSHOTS OF SCHOOL MANAGEMENT EFFECTIVENESS