basic physics of spectrometry - unesp
TRANSCRIPT
CHAPTER 1
BASIC PHYSICS OF SPECTROMETRY
Freek D. VAN DER MEER Delft University of Technology, Delft, The Netherlands International Institute for Aerospace Surveys and Earth Sciences (ITC), Enschede, the Netherlands
1 Introduction When light interacts with a mineral or rock, light of certain wavelengths is preferentially absorbed while at other wavelengths is transmitted in the substance. Reflectance, defined as the ratio of the intensity of light reflected from a sample to the intensity of the light incident on it, is measured by reflection spectrophotometers which are composed of a light source and a prism to separate light into different wavelengths. This light beam interacts with the sample and the intensity of reflected light at various wavelengths is measured by a detector relative to a reference standard of known reflectance. Thus a continuous reflectance spectrum of the sample is obtained in the wavelength region measured.
Reflectance spectra have been used for many years to obtain compositional information of the Earth surface. Similarly, it has been shown that spectral reflectance in visible and near-infrared offers a rapid and inexpensive technique for determining the mineralogy of samples and obtaining information on chemical composition. Electronic transition and charge transfer processes (e.g., changes in energy states of electrons bound to atoms or molecules) associated with transition metal ions such as Fe, Ti, Cr, etc., determine largely the position of diagnostic absorption features in the visible- and near-infrared wavelength region of the spectra of minerals (Burns, 1970; Adams, 1974; 1975). In addition, vibrational processes in H2O and OH- (e.g., small displacements of the atoms about their resting positions) produce fundamental overtone absorptions (Hunt, 1977; Hunt & Salisbury, 1970). Electronic transitions produce broad absorption features that require higher energy levels than do vibrational processes, and therefore take place at shorter wavelengths (Hunt, 1970; Goetz, 1991). The position, shape, depth, and width of these absorption features are controlled by the particular crystal structure in which the absorbing species is contained and by the chemical structure of the mineral. Thus, variables characterizing absorption features can be directly related to the mineralogy of the sample.

4 F.D. VAN DER MEER
2 Radiation principles The following discussion is based on Rees (1996). Thermal radiation is emitted by all objects at temperatures above absolute zero. Consider an area dA and radiation arriving at a direction θ to the normal of dA, but in the range of directions forming a solid angle of dΩ steradians. Radiance, L in Wm-2sr-1, is defined as
d LdAdΦ Ω= cosθ (1) The total power falling on dA from all directions is given by the integration over 2π steradians in case of no absorption nor scattering by
Φ Ω= =dA L d EdAcosθπ2
(2)
where E is called irradiance measured in Wm-2. In the reverse case when E measures the total radiance leaving dA we refer to exitance, M, and the total power emitted by the source is radiant intensity, I, defined as
Φ Ωtotal Id= (3) We can also express these quantities spectrally by introducing an interval of wavelength λ and integrating over dλ. Spectral radiance according to Planck’s relationship is given by
Lhc
ehc kTλ
λ
λ= − −2
12
51( )/ (4)
where h is Planck’s constant, k is Boltzmann’s constant (1.38 x 10⁻²³JK-1), c is the speed of light (in a vacuum) and T is the temperature. The total outgoing radiance of a black body of temperature T is given by
L L dk
c hT= =
∞
λ λπ2
15
4 4
2 34
0
(5)
where σπ
=215
4 4
2 3
kc h
is known as Stefan-Boltzmann’s constant (5.67 x 10⁻⁸Wm-2K-4).
Wien’s displacement law gives the relation between the wavelength at which the maximum radiation is reached, λmax, and the temperature of the black body as
λmax /= c Tw (6) where cw is a constant (Wien’s constant) of 2.898 x 10⁻³Km. 3 Surface scattering properties When radiation interacts with a surface, it is partly absorbed into the substance, and partly scattered or reflected by the object. Consider a collimated beam of radiation incident on a surface at an incidence angle θo. The irradiance E is given by Fcosθo and scattered into a solid angle dΩ in a direction θ1. The outgoing radiance of the surface as a result of this illumination is L1 in the direction (θ1,φ1) where φ1 is the azimuthal angle. The bidirectional reflectance distribution function (BRDF) R (in sr-1 ) is defined as
R L E= 1 / (7)

BASIC PHYSICS OF SPECTROMETRY 5
R is a function of the incident and scattered directions and can thus be noted as R(θo, φo, θ1, φ1). The reflectivity of the surface, r (also known as albedo), is the ratio of the total power scattered to the total power incident as
r R d do o( , ) cos sin/
Θ Φ Θ Θ ΘΘ
=== 1 1 1 1
0
2
0
2
φφ
ππ
(8)
Two extreme cases of scattering surface can be defined, the perfectly smooth surface (specular surface) and the perfectly rough surface (the Lambertian surface). A perfect Lambertian surface will scatter all the radiation incident upon it so that the radiant exitance M is equal to the irradiance E and the albedo is unity. A measure of roughness of a surface is given by the Rayleigh criterion. For a surface to be smooth according the Rayleigh criterion it should satisfy
∆ Θh ocos / /λ < 1 8 (9)
where ∆h is the surface irregularity of height and λ the wavelength considered. 4 Reflectance spectroscopy The following discussion is based on Schanda (1986). Radiation incident onto a material is preferentially absorbed by molecules forming the structure of the substance at wavelengths pre-determined by quantum mechanical principles. The total energy of a molecule Wt is the sum of the electronic energy We the vibrational energy Wv and the rotational energy Wr as
W W W Wt e v r= + + (10) Changes in energy states of molecules due to changes in rotational energy levels do not occur in solids and will not further be treated here, we restrict this discussion to changes in electronic states and vibrational processes. Harmonic vibration is described by
ωv
f m mm m
=+( )1 2
1 2
(11)
where f is the restoring force constant (spring constant), v the vibrational states v=0,1,2,… and m1 and m2 are the masses of the molecule. The possible energy states of the harmonic vibration are given by quantum mechanics as
W v hv v= +( )12
ω (12)
where h is Planck’s constant equal to 6.6 x 10⁻³⁴W s2. These define the spectral regions where absorption can occur as a result of vibrational processes.
Electrons in solid materials can occupy a discrete number of energy states q=1,2,… When photons are incident on a material they interact with the electrons and the absorption of a photon of a proper energy νh may cause the transition of the electron to a higher state. Absorption of energy into the medium results in absorption features in reflectance spectra. The velocity of an electron is given by

6 F.D. VAN DER MEER
vqhmL
=2
(13)
where m is the mass of the electron and L=Nl with l is the internuclear bond length and N the number of electrons. Thus the total energy of the electron is the sum of the
kinetic energy 2/2νm and the potential energy (often set to zero). Now the energy states of the electron can be described by the following formula
W mvq hmLq = =22 2
228
/ (14)
Each molecular orbital starting from the one with the lowest energy can accommodate only two electrons with antiparallel spin orientations (i.e., the Pauli exclusion principle). Therefore N electrons can maximally occupy q=N/2 states in the lowest energy state representing an energy of WN/2 and the lowest empty one has W(N/2)+1. We can now calculate that absorption of a photon of proper energy νh causes the transition of an electron from orbital q to q=1 corresponding to an energy difference of
∆W W WhmL
NN N= − = +=( / ) / ( )2 1 2
2
281 (15)
Acknowledging that λν /hch = where c is the speed of light (in a vacuum) and λ is the wavelength at which the absorption occurs we can find the longest wavelength λmax which can be absorbed by the molecule due to the first transition as
λmax =+
81
2 2mch
N lN
(16)
To be able to interpret or predict the wavelengths at which absorptions due electronic transitions occur it is useful to know the energy level schemes of the molecules involved in the transitions. Absorption in a spectrum have two components: continuum and individual features. The continuum or background is the overall albedo of the reflectance curve which for cross comparison is often removed by Hull subtraction or division (Clark & Roush, 1984).The depth of an absorption band, D, is usually defined relative to the continuum, Rc
DRR
b
c
= −1 (17)
where Rb is the reflectance at the band bottom, and Rc is the reflectance of the continuum at the same wavelength as Rb. 5 Reflectance properties of materials Isolated atoms and ions have discrete energy states. Absorption of photons of a specific wavelength causes a change from one energy state to a higher one. Emission of a photon occurs as a result of a change in an energy state to a lower one. When a photon is absorbed it is usually not emitted at the same wavelength, hence absorption features may occur at other wavelength than the frequency of the original state. Various processes take place under the umbrella of electronic processes crystal field effects, charge transfers, conduction bands and color centers. In general, electronic processes

BASIC PHYSICS OF SPECTROMETRY 7
cost relatively much energy hence give rise to broad absorption features at short (VIS-NIR) wavelength. In this Chapter, spectra of some basic earth materials will be discussed. The interested reader is also referred to the Chapter 8 on petroleum geological applications for crude oil spectra and to the Chapter 9 for spectra of materials characterizing the urban environment. 5.1 MINERALS AND ROCKS Reflectance spectra have been used for many years to obtain compositional information of the Earth surface. Spectral reflectance in visible and near-infrared offers a rapid and inexpensive technique for determining the mineralogy of samples and obtaining information on chemical composition. Electronic transition and charge transfer processes associated with transition metal ions determine largely the position of diagnostic absorption features in the visible- and near-infrared wavelength region of the spectra of minerals (Burns, 1970). In addition, vibrational processes in H2O and OH- produce fundamental overtone absorptions (Hunt, 1977). The position, shape, depth, width, and asymmetry of these absorption features are controlled by the particular crystal structure in which the absorbing species is contained and by the chemical structure of the mineral. Thus, variables characterizing absorption features can be directly related to the mineralogy of the sample.
Figure 1. Reflectance spectra of two minerals dominated by iron absorption features.

8 F.D. VAN DER MEER
The most common electronic process revealed in the spectra of minerals is the crystal field effect which is the result of unfilled electron shells of transition elements (e.g., Fe, Cr, Co, Ni; Figure 1). All transition elements have identical energies in an isolated ion, but the energy levels are split when the atom is located in a crystal field. This splitting of the orbital energy states enables an electron to be moved from a lower level into a higher one by absorption of a photon having an energy matching the energy difference between the states. Absorption bands can also be the result of charge transfers. An example is the charge transfer of Fe2+ to Fe3+. These absorption bands are diagnostic of mineralogy. Some minerals exhibit two energy levels in which electrons may reside: a higher level called the conduction band, where electrons move freely throughout the lattice, and a lower energy region called the valence band, where electrons are attached to individual atoms. Changes between these states result in absorption features in the visible portion of the electromagnetic wavelength spectrum. A few minerals show color due to absorption by color centers. Crystals have lattice defects that disturb the irradiation of the crystal. These defects can produce discrete energy levels to which electrons can be bound. This causes the color centers.
Figure 2. Reflectance spectra of minerals dominated by absorption features resulting from vibrational processes.
The bonds in a molecule or crystal lattice are like springs with attached weights:
the whole system can vibrate. The frequency of vibration depends on the strength of each spring (the bond in a molecule) and their masses (the mass of each element in a molecule). Each vibration can also occur at roughly multiples of the original fundamental frequency referred to as overtones and combination (tones) when they involve different modes of vibrations. The frequencies of fundamental vibrations are labeled with the greek letter nu (v) and a subscript. If a molecule has vibration
BASIC PHYSICS OF SPECTROMETRY 9
fundamentals v1, v2, v3, then it can have overtones at approximately 2v1, 3v1, 2v2 and combinations at approximately v1+v2, v2+v3, v1+v2+v3. Each higher overtone or combination is typically 30 to 100 times weaker than the last, hence the features will be more subtle and difficult to sense. Vibration costs relatively little energy and results in absorption features at high (SWIR-MIR) wavelengths with deep and narrow features. Reflectance spectra of minerals are dominated in the visible to near-infrared wavelength range by the presence or absence of transition metal ions (e.g., Fe, Cr, Co, Ni). The presence or absence of water and hydroxyl, carbonate and sulfate determine the absorption features in the SWIR region due to so-called vibrational processes (Figure 2). The hydroxyl is generally bound to Mg or Al. The water molecule (H2O) has N=3, so there are 3N-6=3 fundamental vibrations. In the isolated molecule (vapor phase) they occur at 2.738 µm (v1, symmetric OH stretch), 6.270 µm (v2, H-O-H bend), and 2.663 µm (v3, asymmetric OH stretch). In liquid water, the frequencies shift due to hydrogen bonding: v1=3.106 µm, v2=6.079 µm, and v3=2.903 µm. The overtones of water are seen in reflectance spectra of H2O-bearing minerals. The first overtones of the OH stretches occur at about 1.4 µm and the combinations of the H-O-H bend with the OH stretches are found near 1.9 µm. The hydroxyl ion has only one stretching mode and its wavelength position is dependent on the ion to which it is attached. In spectra of OH-bearing minerals, the absorption is typically near 2.7 to 2.8 µm, but can occur anywhere in the range from about 2.67 µm to 3.45 µm. The OH commonly occurs in multiple crystallographic sites of a specific mineral and is typically attached to metal ions. Thus, there may be more than one OH feature. The metal-OH bend occurs near 10 µm (usually superimposed on the stronger Si-O fundamental in silicates). The combination metal-OH bend plus OH stretch occurs near 2.2 to 2.3 µm and is very diagnostic of mineralogy. Carbonates also show diagnostic vibrational absorption bands due to the CO3
-2 ion. There are four vibrational modes in the free CO3
-2 ion: the symmetric stretch, v1: 1063 cm-1 (9.407 µm); the bend, v2: 879 cm-1 (11.4 µm); the stretch, v3: 1415 cm-1 (7.067 µm); and the, v4: 680 cm-1 (14.7 µm). The v1 band is not infrared active in minerals. There are actually six modes in the CO3
-2 ion, but 2 are degenerate with the v3 and 4 modes. In carbonate minerals, the v3 and v4 bands often appear as a doublet. Combination and overtone bands of the CO3 fundamentals occur in the near IR. The two strongest are v1 + 2v3 at 2.50-2.55µm (4000-3900 cm-1), and 3v3 at 2.30-2.35 µm (4350-4250 cm-1). Three weaker bands occur near 2.12-2.16 µm (v1 + 2v3 + v4 or 3v1 + 2v4; 4720-4630 cm-1), 1.97-2.00 µm (2v1 + 2v3; 5080-5000 cm-1), and 1.85-1.87 µm (v1 + 3v3; 5400-5350 cm-1).
In addition, the absorption band depth is related to the grain or particle size as the amount of light scattered and absorbed by a grain is dependent on grain size. A larger grain has a greater internal path where photons may be absorbed according to Beers Law. In a smaller grains there are proportionally more surface reflections compared to internal photon path lengths, if multiple scattering dominates, the reflectance decreases with increasing grain size.
The reflectance spectra of minerals are well known (Hunt, 1977; Hunt & Salisbury, 1970; 1971; Hunt et al., 1971a+b; 1972; 1973a; Clark et al., 1990; Crowley, 1991; Grove et al., 1992) and several studies have been conducted to determine reflectance spectra of rocks (Hunt et al., 1973b+c; 1974; 1975; 1976a+b). The reflectance characteristics of rocks can be simulated accurately by studying the compound effect of reflectance of minerals in a spectral mixture forming the rock. Reflectance spectra of minerals measured by different spectroradiometers with

10 F.D. VAN DER MEER
different spectral resolution are stored in spectral libraries that are available in digital format (e.g., Grove et al., 1992; Clark et al., 1990). 5.2 VEGETATION Reflectance studies of vegetation (e.g. Gates et al., 1965) generally restrict to the green leaf part of the plants giving little attention to the non-green dry vegetation components. Reflectance properties of vegetation in the visible part of the spectrum are dominated by the absorption properties of photosynthetic pigments of which chlorophyll, having absorptions at 0.66 and 0.68 µm for chlorophyll a and b respectively, is the most important (Figure 3).
Figure 3. Reflectance spectra of plant constituents. Changes in the chlorophyll concentration produce spectral shifts of the absorption edge near 0.7 µm : the red edge. This red edge shifts toward the blue part of the spectrum with loss of chlorophyll. The mid-infrared and short-wave infrared part of the vegetation spectrum is dominated by water and organic compounds of which cellulose, lignin, starch and protein (Elvidge, 1990). Absorption features due to bound and unbound water occur near 1.4 and 1.9 µm and at 0.97, 1.20 and 1.77 µm . Cellulose has absorptions at 1.22, 1.48, 1.93, 2.28, 2.34, and 2.48 µm while lignin has absorption features at 1.45, 1.68, 1.93, 2.05-2.14, 2.27, 2.33, 2,38, and 2.50 µm (Elvidge, 1990).

BASIC PHYSICS OF SPECTROMETRY 11
Starch has absorption features at 0.99, 1.22, 1.45, 1.56, 1.70, 1.77, 1.93, 2.10, 1.32, and 2.48 µm (Elvidge, 1990). The most abundant protein in leaves is a nitrogen bearing compound having absorption features at 1.50, 1.68, 1.74, 1.94, 2.05, 2.17, 2.29, 2.47 µm (Elvidge, 1990). Dry plant materials lack the chlorophyll absorptions and intense water absorptions that are characteristic for green leaves and thus lack the intense absorption wing produced by high blue and UV absorptions. Dry plant materials have diagnostic ligno-cellulose absorption features at 2.09 and in the 2.30 µm region (Elvidge 1990). Examples of some vegetation spectra are shown in Figure 4.
Figure 4. Reflectance spectra of some vegetation species.
In vegetation much variation in spectral properties result from the viewing geometry. Viewing geometry, includes the angle of incidence, angle of reflection, and the phase angle: the angle between the incident light and observer (the angle of reflection). These affect the intensity of light received. These effects are marginal for minerals, more pronounced for rocks and soils and of much importance in studying vegetation. The Bidirectional Reflectance Distribution Function (BRDF) should be constructed and analyzed. More details on reflectance properties of plant materials can be found in Elvidge (1990), Gates et al. (1965), and Wessman et al. (1988). 5.3 SOILS Spectral reflectance characteristics of soils are the result of their physical and chemical properties and are influenced largely by the compositional nature of soils in which main components are inorganic solids, organic matter, air and water. In the visible and

12 F.D. VAN DER MEER
near-infrared regions extending to 1.0 µm , electronic transitions related to iron are the main factor determining soil spectral reflectance.
Figure 5. Reflectance spectra of three soils.
The majority of absorption features diagnostic for mineral composition occur in the short-wave infrared (SWIR) portion of the wavelength spectrum ranging from 2.0 to 2.5 µm . A strong fundamental OH- vibration at 2.74 µm influences the spectral signature of hyrdoxyl-bearing minerals. Furthermore, diagnostic absorption features characteristic for layered silicates such as clays and micas and also of carbonates occur in the SWIR region. Organic matter has a very important influence on the spectral reflectance properties of soils because amounts exceeding 2% are known to have a masking effect on spectral reflectance thus reducing the overall reflectivity of the soil and reducing (and sometimes completely obscuring) the diagnostic absorption features. Thus soils with a high (>20%) amount amount of organics appear dark throughout the 0.4 to 2.5 µm range. In contrast, less decomposed soils have higher reflectance in the near-infrared region and enhanced absorption features. Prominent absorption features near 1.4 and 1.9 µm due to bound and unbound water are typical for soil reflectance. Less prominent water absorption features can be found at 0.97, 1.20 and 1.77 µm . Increasing moisture content generally decreases the overall reflectance of the soil. A similar effect results from increasing the particle size resulting in a decrease in reflectivity and contrast between absorption features. Some studies on the spectral reflectance characteristics of soils and attempts to make classifications can be found in Baumgarner et al. (1985), Condit (1970), Stoner & Baumgardner (1981), Irons et al. (1989) and Singh & Sirohi (1994). Examples of some soil spectra are shown in Figure 5.

BASIC PHYSICS OF SPECTROMETRY 13
5.4 WATER Another important material that can be observed in remote sensing imagery is water. Water bodies have a different response to EMR than water bound up in molecules: they do not exhibit discrete absorption features. Water has a high transmittance for all visible wavelengths, but the transmittance increases with decreasing wavelength. In deep and clear water nearly all radiation is absorbed, however suspended sediment, plankton and pigment cause increased reflectance in the visible portion of the spectrum. In the near infrared, almost all energy is absorbed by water as is also the case in the SWIR. I restrain from providing much details on the optical properties of water in the visible and near-infrared.
Figure 6. A series of reflectance spectra of melting snow. The top curve (a) is at 0o C and has only a small amount of liquid water, whereas the lowest spectrum (j) is of a puddle of about 3 cm of water on top of the snow. Note in the top spectrum, there is no 1.65-µm band as in the ice spectra in figure 22a because of the
higher temperature.. The 1.65-µm feature is temperature dependent and decreases in strength with increasing temperature (see Clark, 1981). Note the increasing absorption at about 0.75 µm and in the short side of the 1-µm ice band, as more liquid water forms. The liquid water becomes spectrally detectable at about spectrum e,
when the UV absorption increases (source: http://speclab.cr.usgs.gov/index.html:).

14 F.D. VAN DER MEER
The major water absorption features centered near 0.97µm, 1.2µm, 1.45µm, and 1.9µm result from vibrational transitions involving various overtones and combinations (Clark, 1981; Figure 6). The first overtone is a H-O-H symmetric stretch mode transition centered at 2.73µm. The second is a H-O-H bending mode transition centered at 6.27µm, the third is a H-O-H asymmetric stretch mode transition centered at 2.66µm. The absorption feature centered near 0.97µm is attributed to a 2V1 + V3 combination. That near 1.2µm to a V1 + V2 + V3 combination. The feature near 1.45µm is a V1 + V3 combination and the feature near 1.9µm is a V2 + V3 combination. 5.5 MAN-MADE AND OTHER MATERIALS It is impossible to provide a thorough review including an understanding of the physical nature of reflectance spectra of man-made structures (Figure 7 shows some examples) and other materials covering the Earth surface. There where these structures are designed of natural materials which can be mono- or multi-mineralic the spectroscopic properties are directly related to these basic materials. However for a large suite of chemical constituents no clear background information on spectral reflectance characteristics is available.
Figure 7. Reflectance spectra of some man-made materials.
5.6 THE EFFECT OF THE ATMOSPHERE The general appearance of the solar irradiance curve shows radiance decreasing towards longer wavelengths. Various absorption bands are seen in the solar irradiance

BASIC PHYSICS OF SPECTROMETRY 15
curve due to scattering and absorption by gasses in the atmosphere. The major atmospheric water vapor bands (H2O) are centered approximately at 0.94 µm, 1.14 µm, 1.38 µm and 1.88 µm, the oxygen (O2) band at 0.76 µm, and carbon dioxide (CO2) bands near 2.01 µm and 2.08 µm. Additionally, other gasses including ozone (O3), carbon monoxide (CO), nitrous oxide (N2O), and methane (CH4), produce noticeable absorption features in the 0.4-2.5 µm wavelength region (Figure 8).
Figure 8. Modtran modeled atmospheric transmittance, visible to near-infrared. Most of the absorptions are
due to water. Oxygen occurs at 0.76 µm, carbon dioxide at 2.0 and 2.06 µm. (source: http://speclab.cr.usgs.gov/index.html:).
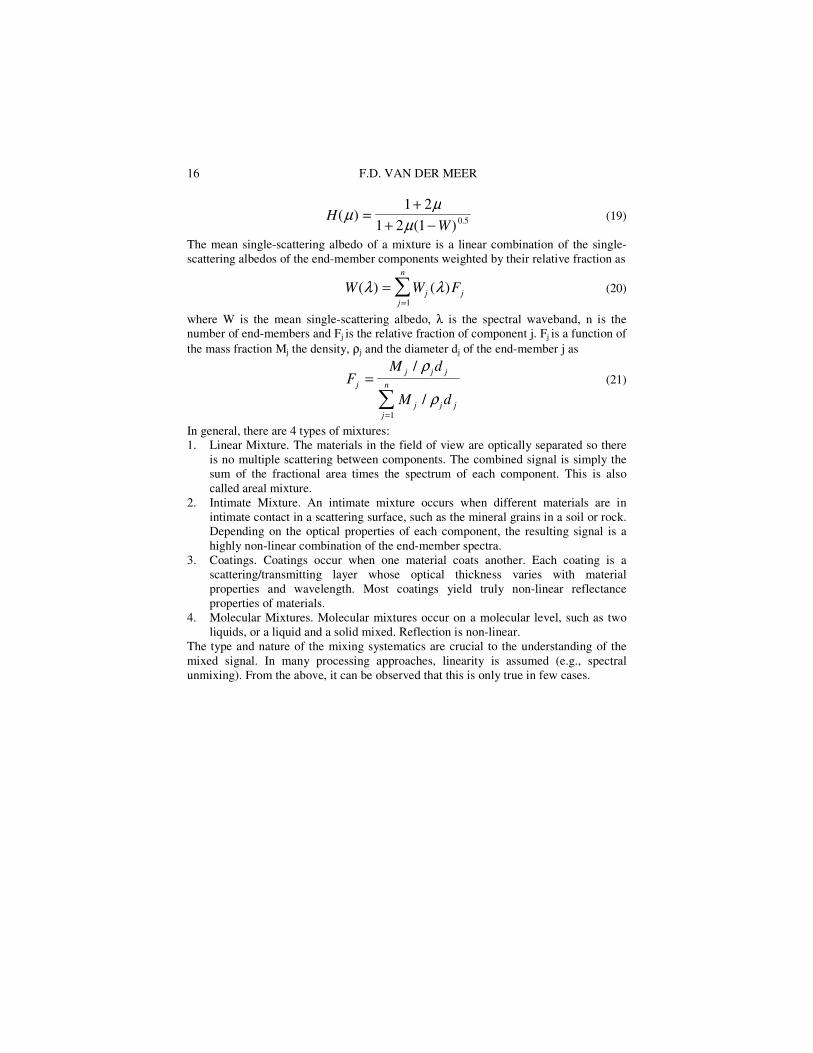
6 Mixing problematics Mixture modeling aims at finding the mixed reflectance from a set of pure end-member spectra. This is based on work by Hapke and Johnson et al. on the analysis of radiative transfer in particulate media at different albedos and reflectances by converting reflectance spectra to single-scattering albedos. Acknowledging the fact that in remote sensing spectra are measured in bidirectional reflectance, the following expression can be derived relating bidirectional reflectance R(i,e) defined as the radiant power received per unit area per solid angle viewed from a specific direction e=cos-1µ and a surface illuminated from a certain direction i=cos-1µo by collimated light to the mean single-scattering albedo W as
R i e w H Ho o( , ) / ( ) ( ) ( )= +4 µ µ µ µ (18) where e is the viewing angle, µo=cos(i), µ=sin(e) and H(µ) is a function describing multiple scattering between particles that can be approximated by
16 F.D. VAN DER MEER
HW
( )( ) .µ
µµ
=+
+ −1 2
1 2 1 0 5 (19)
The mean single-scattering albedo of a mixture is a linear combination of the single-scattering albedos of the end-member components weighted by their relative fraction as
W W Fj jj
n
( ) ( )λ λ==
1
(20)
where W is the mean single-scattering albedo, λ is the spectral waveband, n is the number of end-members and Fj is the relative fraction of component j. Fj is a function of the mass fraction Mj the density, ρj and the diameter dj of the end-member j as
FM d
M dj
j j j
j j jj
n=
=
/
/
ρ
ρ1
(21)
In general, there are 4 types of mixtures: 1. Linear Mixture. The materials in the field of view are optically separated so there
is no multiple scattering between components. The combined signal is simply the sum of the fractional area times the spectrum of each component. This is also called areal mixture.
2. Intimate Mixture. An intimate mixture occurs when different materials are in intimate contact in a scattering surface, such as the mineral grains in a soil or rock. Depending on the optical properties of each component, the resulting signal is a highly non-linear combination of the end-member spectra.
3. Coatings. Coatings occur when one material coats another. Each coating is a scattering/transmitting layer whose optical thickness varies with material properties and wavelength. Most coatings yield truly non-linear reflectance properties of materials.
4. Molecular Mixtures. Molecular mixtures occur on a molecular level, such as two liquids, or a liquid and a solid mixed. Reflection is non-linear.
The type and nature of the mixing systematics are crucial to the understanding of the mixed signal. In many processing approaches, linearity is assumed (e.g., spectral unmixing). From the above, it can be observed that this is only true in few cases.
