bba 1 be 1 u-3 consumer behavior and demand analysis
TRANSCRIPT

COURSE: BBASUBJECT: BUSINESS ECONOMICSUNIT: 3
Consumer Behavior and Demand Analysis


Consumer Behaviour
Consumer behavior is the study of individuals, groups, or organizations and the processes they use to select, secure, and dispose of products, services, experiences, or ideas to satisfy needs and the impacts that these processes have on the consumer and society
Utility
Utility is a measure of satisfaction, referring to the total satisfaction received by a consumer from consuming a good or service
Utility represents the advantage or fulfillment a person receives from consuming a good or service.
Utility, then, explains how individuals and economies aim to gain optimal satisfaction in dealing with scarcity.

Total Utility
The sum total of satisfaction which a consumer receives by consuming the various unity of the commodity.
(The more unit of a commodity he consumes, the greater will be his total utility)
The overall amount of satisfaction achieved by a consumer due to the purchase and use of a particular item or service.
Consumers theoretically wish to obtain the maximum degree of total utility for the amount of money that they expend on an item or service offered by a business.

Marginal Utility
The concept of marginal utility grew out of attempts by economists to explain the determination of price.
Marginal utility can be defined as a measure of relative satisfaction gained or lost from an increase or decrease in the consumption of that good or service.
An increase in an activity's overall benefit that is caused by a unit increase in the level of that activity, all other factors remaining constant.
Also called marginal benefit. Marginal utility= C hange in total utility
Change in quantity consumed

Utility is based on following Assumptions
1. Cardinal Measurability Utility can be measured in terms of money Unit is utils

2. Utilities from different goods are Independent from each other Individual utility for goods Sum of individual utility is total utility
3. Constancy of marginal utility of money Marginal utility of money is constant
4. Introspective MethodWe can inspect other’s mindGuesswork based on our own
experience

Law of Diminishing Marginal Utility
The law of diminishing marginal utility states that
‘as a consumer consumes more and more
units of a specific commodity,
utility from the successive units
goes on diminishing’. Mr. H. Gossen, a German economist, was
the first to explain this Law in 1854.

Law of Diminishing Marginal Utility
Law based upon following assumptions1. The units of the good, which are consumed, are
homogeneous2. The good is consumed within a short time without
any gaps3. The units of the good consumed are of a standard
size4. The consumer’s income does not change in the
period of observations5. There is no change in the tastes of the consumers.

12
EXAMPLE…..

13
DON’T TRY THIS AT HOME ;)
1 ICE CREAM = ECSTATIC

14
DON’T TRY THIS AT HOME ;)
2nd ICE CREAM = STILL ECSTATIC

15
DON’T TRY THIS AT HOME ;)
3rd ICE CREAM = VERY HAPPY

16
DON’T TRY THIS AT HOME ;)
4th ICE CREAM = HAPPY

17
DON’T TRY THIS AT HOME ;)
5th ICE CREAM = STILL HAPPY

18
DON’T TRY THIS AT HOME ;)
6th ICE CREAM = NOT SO HAPPY

19
DON’T TRY THIS AT HOME ;)
7th ICE CREAM = UNHAPPY

20
DON’T TRY THIS AT HOME ;)
8th ICE CREAM = SICK

21
Units Total Utility Marginal Utility
1st ice cream 20 20
2nd ice cream 32 12
3rd ice cream 40 8
4th ice cream 44 4
5th ice cream 45 1
6th ice cream 45 0
7TH ice cream 42 -3
8th ice cream 40 -5
The following table will make the law of diminishing marginal utility more clear.

1 2 3 4 5 6 7 80
10
20
30
40
50 Total utility
Total utility
The graph will make the law of diminishing marginal utility more clear
1 2 3 4 5 6 7 8
-15-10-505
10152025 Marginal utility
Marginal util-ity

23
* Limitations/Exceptions of Law of Diminishing Marginal Utility
(i) Case of intoxicants: The more a person drinks liquor, the more s/he likes it.
(ii) Rare collection: If there are only two diamonds in the
world, the possession of 2nd diamond will push up the marginal utility.
(iii) Application to money: It is true that more money the man has, the greedier he is to get additional units of it. However, the truth is that the marginal utility of money declines with richness but never falls to zero.
Conclusion*we can say that the law of diminishing utility, like other laws
of Economics, is simply a statement of tendency. It holds good, provided other factors remain constant.

24
The law of equi marginal utility explains as to how a consumer distributes his limited income for buying different goods and services
He will spend his income in such away that the last rupee spent on each of the commodity gives him the same marginal utility.
Therefore, this law is known as the Law of Equi-Marginal Utility
Law of Equi-Marginal Utility

25
To get maximum satisfaction out of his limited income, the consumer carefully weighs the satisfaction obtained from each rupee that he spends. If he thinks that a rupee spent on one good has greater utility than spending it on another good, he will go on spend his money on the former till the satisfaction derived from the last rupee spent in the two cases equal

26
* Assumptions of the Law:
1.The utility is cardinally measurable.2. The marginal utility of money remains constant.3. Consumer has a limited amount of income and he spends the entire amount.4. The wants and habits of the consumer remain constant.5. The consumer is rational. He tries to get maximum satisfaction.6. The consumer spends his income in small quantities while purchasing the commodities.
27
We assume that:1. The consumer has Rs.24 with
him.2. He has to spend his income on
two goods X and Y.3. The price of each good is Rs.2
and 3 per unit respectively
Explanation

28
Table…Units MU of X(Price
is Rs.2) MU of Y(Price is Rs. 3)
1 20 24
2 18 21
3 16 18
4 14 15
5 12 9
6 10 3

29
Units MUx/Px MUy/Py
1 10 8
2 9 7
3 8 6
4 7 5
5 6 3
6 5 1

30
Approach by R.G.D. Allen and J.R.Hicks Consumer can only rank or order the
utilities obtained from a good Provided Indifference curve
Ordinal Utility

The consumer’s preferences allow him to choose among different bundles of Pepsi and pizza. If you offer the consumer two different bundles, he chooses the bundle that best suits his tastes. If the two bundles suit his tastes equally well, we say that the consumer is indifferent between the two bundles.
Just as we have represented the consumer’s budget constraint graphically, we can also represent his preferences graphically. We do this with indifference curves.
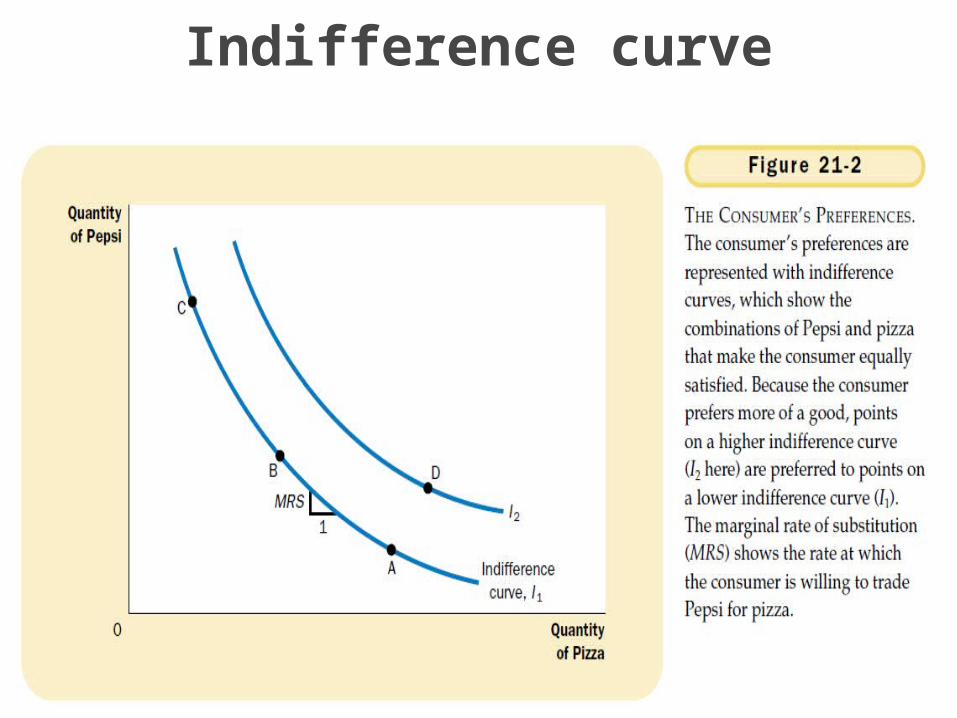
An indifference curve shows the bundles of consumption that make the consumer equally happy. In this case, the indifference curves show the combinations of Pepsi and pizza with which the consumer is equally satisfied.
REPRESENTING PREFERENCES WITHINDIFFERENCE CURVES
Indifference curve

Continue Figure 21-2 shows two of the consumer’s many
indifference curves. The consumer is indifferent among combinations A, B, and C, because they are all on the same curve.
Not surprisingly, if the consumer’s consumption of pizza is reduced, say from point A to point B, consumption of Pepsi must increase to keep him equally happy.
If consumption of pizza is reduced again, from point B to point C, the amount of Pepsi consumed must increase yet again.

A set of indifference curves represents an indifference map
Indifference Map

The slope at any point on an indifference curve equals the rate at which the consumer is willing to substitute one good for the other.
This rate is called the marginal rate of substitution (MRS). In this case, the marginal rate of substitution measures how much Pepsi the consumer requires in order to be compensated for a one-unit reduction in pizza consumption.
Notice that because the indifference curves are not straight lines, the marginal rate of substitution is not the same at all
points on a given indifference curve.
The rate at which a consumer is willing to trade one good for the other depends on the amounts of the goods he is already consuming.
That is, the rate at which a consumer is willing to trade pizza for Pepsi depends on whether he is more hungry or more thirsty, which in turn depends on how much pizza and Pepsi he has.
Indifference Marginal Rate of Substitution

Marginal Rate of Substitution (MRS) is the rate at which the consumer is prepared to exchange goods X and Y
Marginal Rate of Substitution
Combination of goods x and y
Quantity of good x(Qx)
Quantity of good y(Qy)
MRS
A 1 13
B 2 9 4
C 3 6 3
D 4 4 2
E 5 3 1

MRS formula
X
Y
MUYMRS
X MU

Indifference curves slope downward to the right
Indifference curves are always convex to the origin
Indifference curves can never intersect each other
A higher indifference curve represents a higher level of satisfaction than the lower indifference curve
Properties of Indifference Curves
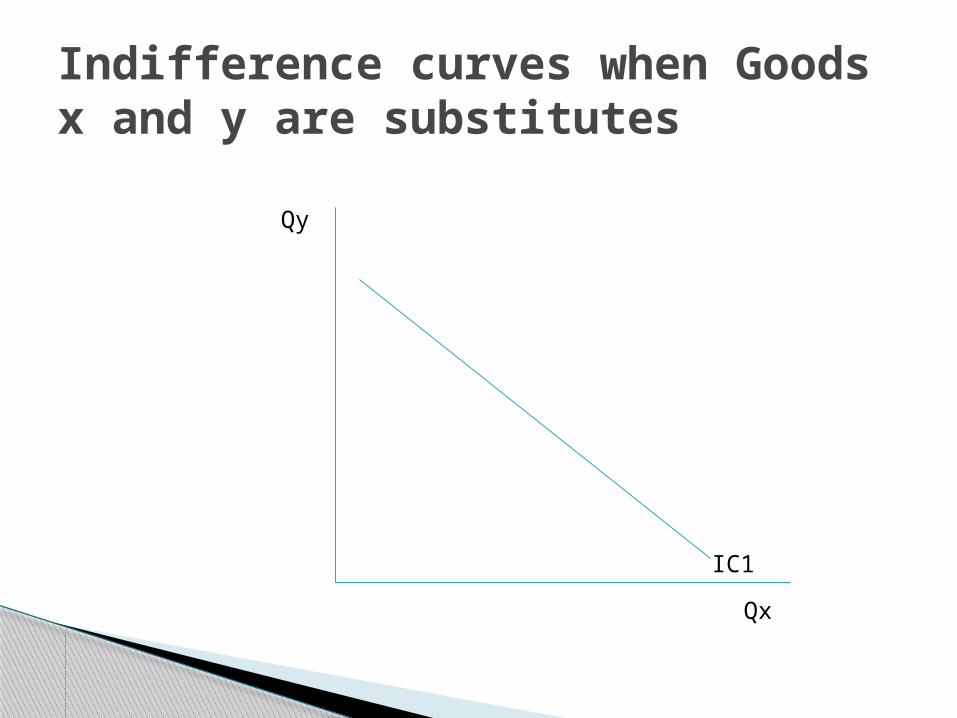
Indifference curves when Goods x and y are substitutes
Qx
Qy
IC1

Indifference Curve when Goods x and y are complements
Qx
Qy
IC1
IC2B
A

"The term consumer’s equilibrium refers to the amount of goods and services which the consumer may buy in the market given his income and given prices of goods in the market, that give maximum satisfaction to consumer".
The aim of the consumer is to get maximum satisfaction from his money income. Given the price line or budget line and the indifference map
Consumer’s Equilibrium or Maximization of Satisfaction
