behavior, ecology, and detection surveys of mammalian carnivores … · although mammalian...
TRANSCRIPT
BEHAVIOR, ECOLOGY, AND DETECTION SURVEYS OF MAMMALIAN CARNIVORES IN THE PRESIDIO Final Report
Prepared for: The Presidio Trust U.S. DEPARTMENT OF THE INTERIOR U.S. GEOLOGICAL SURVEY WESTERN ECOLOGICAL RESEARCH CENTER

1
BEHAVIOR, ECOLOGY, AND DETECTION SURVEYS OF MAMMALIAN CARNIVORES IN THE PRESIDIO
By Erin E. Boydston
U.S. GEOLOGICAL SURVEY WESTERN ECOLOGICAL RESEARCH CENTER
Final Report
Prepared for: The Presidio Trust Las Vegas Field Station USGS Western Ecological Research Center 160 N. Stephanie Street Henderson, NV 89074
Sacramento, California 2005

2
U.S. DEPARTMENT OF THE INTERIOR GALE A. NORTON, SECRETARY U.S. GEOLOGICAL SURVEY Charles G. Groat, Director Please cite as: Boydston, E. E. 2005. Behavior, ecology, and detection surveys of mammalian carnivores in the Presidio. Final Report. U. S. Geological Survey, Sacramento, CA. 80 pp.
The use of firm, trade, or brand names in this report is for identification purposes only and does not constitute endorsement by the U.S. Geological Survey.
For additional information, contact: Center Director Western Ecological Research Center U.S. Geological Survey 3020 State University Dr., East Modoc Hall, Room 3006 Sacramento, CA 95819

3
Table of Contents
Summary ..............................................................................................................4 Introduction ...........................................................................................................4 Methods ................................................................................................................6 Results................................................................................................................12 Discussion ..........................................................................................................20 Management Recommendations ........................................................................24 Acknowledgements.............................................................................................27 Literature Cited ...................................................................................................29 Tables…………………………………………………………………………………...33 Figures……………………..……………………………………………………………..48 Appendix A……………………………………………………………….………………..77
4
Behavior, Ecology, and Detection Surveys of Mammalian Carnivores in the Presidio
Summary
Many medium-sized mammalian carnivores or “mesocarnivores” are able to adapt to a wide range of environments, including human-altered landscapes. While some species have been well-studied in a variety of natural habitats, relatively little is known about these animals in areas where they co-occur with humans. From 2003-2004, we conducted the first study of terrestrial mammalian carnivores in the Presidio of San Francisco to understand how native and non-native species utilize this highly varied landscape and to identify effective methods for monitoring these species. The Presidio is a part of the Golden Gate National Recreation Area that has abundant cultural, historic, and natural resources with human residences, offices, and recreational opportunities. To observe the ecology of foxes, coyotes, raccoons, striped skunks, cats, and one non-carnivore species, the opossum, in this complex landscape, we used camera traps, track plates, trapping, and radio-tracking. We also attempted a dog-aided survey for fox scats. We compared results of all these detection methods to a database of opportunistic sightings to determine the utility of sightings records. Raccoons and skunks were the species detected most frequently and were found throughout the park. Red foxes and coyotes, but not gray foxes, were detected with camera surveys and trapping. Gray foxes, a native species that is generally sensitive to habitat fragmentation and urban edge effects, were confirmed present before and after the study but may have a tenuous presence in the Presidio. The future of wildlife in the Presidio will depend on factors operating within the Presidio and also on external factors that influence dispersal and source-sink dynamics.
Introduction
Although mammalian carnivores around the world are declining (Gittleman et al., 2001; Linnell et al., 2001; Woodroffe & Ginsberg, 2000; Wikramanayake et al., 1998), some species are able to adapt to a wide range of environments, including human-altered and fragmented landscapes (Crooks & Soule, 1999). Large carnivores, carnivores that have large home ranges, and carnivores that are specialists are more likely to disappear from fragmented areas and areas with higher human densities than medium-sized generalist carnivores (Parks & Harcourt, 2002; Woodroffe & Ginsberg, 1998; Crooks, 2002). Raccoons (Procyon lotor) are an example of a medium-sized carnivore, or “mesocarnivore,” that has adapted to agricultural and urban landscapes (Smith & Engeman, 2002; Judson et al., 1994). Coyotes (Canis latrans) are considered medium-sized or large carnivores. Although they are much smaller than species typically classified as large carnivores (Buskirk, 1999; Oftedal & Gittleman), they can hunt large prey

5
such as deer (Lingle, 2000); they can prey on smaller carnivores (Ralls & White, 1995); and they show sensitivity to habitat fragmentation characteristic of large carnivores (Crooks & Soule, 1999; Crooks, 2002). Coyotes are widespread in North America habitats and increasingly observed in urban environments (Gehrt, 2004; Quinn, 1997). Despite the presence of raccoons, coyotes, and other carnivores in North American towns and cities, relatively little is known about the behavior and ecology of these species in urban landscapes or at the interface between protected areas and areas of high human densities.
The Presidio of San Francisco is a unique protected area set in the highly urbanized landscape of northern San Francisco. Within the approximately 1500 acre (607 ha) area of the Presidio, abundant cultural, historic, and natural resources are tightly packed. Although the Presidio is a portion of the Golden Gate National Recreation Area (GGNRA), it is geographically separated from larger portions of the GGNRA by the Pacific Ocean to the northwest, the San Francisco Bay to the north, and urban San Francisco to the south and east (Fig. 1). In this location, however, the Presidio may still provide ecological connectivity between portions of the GGNRA and other open space protected areas for species that are able to disperse across the distances, and it may function as a habitat refuge for some plant and animal species. Both the National Park Service and the Presidio Trust are responsible for management of the Presidio, and one of the major challenges is restoring natural communities of plants and animals while also maintaining an environment that can accommodate human residents, office workers, and visitors.
Several medium-sized carnivore species have been observed in the Presidio, including raccoons (Procyon lotor), striped skunks (Mephitis mephitis), red foxes (Vulpes vulpes), gray foxes (Urocyon cinereoargenteus), and feral domestic cats (Felis silvestris catus). Coyotes (Canis latrans) were first documented in late 2002 when Presidio residents and employees reported coyotes sightings and took photographs. Of the two species of foxes, gray foxes are native to the area, but red foxes are not a native carnivore in this part of California (Lewis et al., 1999). Red foxes were first noticed in the Presidio around 1997 (B. Badzik, pers. comm.). After that time, sightings of red foxes appeared to be more frequent while sightings of gray foxes became rare (T. Thomas, pers. comm.), and it was unclear if gray foxes had declined or had been extirpated.
In this first study of the Presidio’s mammalian wildlife, we sought to provide information about the carnivore community by contributing a study on carnivore distributions, activity, and space utilization patterns. We also included opossums (Didelphis virginiana) in our study, a North American marsupial that has some ecological traits in common with generalist carnivores and that is a species that was introduced to California in the early 1900s (Jameson & Peeters, 1988). Our goals were to document the presence of carnivores and opossums in the Presidio, identify appropriate methods for their detection, and provide insight into their ecology.

6
Methods
Study site— The Presidio’s heterogeneous landscape was divided into seven landcover classes (Table 1; Fig. 2). This landcover map was based on digital coverages provided by the Presidio Trust, and on a landcover map that had been ground-truthed by S. Eda and W. Russell of USGS. Just over a third of the area (36%) was forested primarily with non-native eucalyptus stands (Table 1). About a quarter (23%) was classified as urban which included office buildings, residences, parking lots, historic structures, and roads. Traffic consists of commuters coming to work in the Presidio, residents leaving to jobs outside of the Presidio, residents commuting from the Presidio homes to offices, and visitors to the area. Additionally, because the south end of the Golden Gate Bridge connects to the Presidio, many people pass through en route to or from crossing the bridge on Highway 101. Another 16% of the Presidio was classified as landscaped; these areas were lawns, playing fields (including a golf course centered between the southeast and southwest corners of the Presidio), historic grounds, and a military cemetery. Native dune vegetation occupied 11% of the area along the waterfronts, and another 11% was primarily exotic shrub vegetation. Three percent of the area was native grasslands and wetlands, some of which have been or are being actively restored.
Terminology— Common names of focal species are used throughout this report and are clarified with their scientific names in the introductory section. The term “carnivore” is used taxonomically to refer to members of Order Carnivora and not to indicate diet. Raccoons, skunks, foxes, cats, and coyotes are all placental mammals in Order Carnivora, while opossums are marsupials in Order Didelphimorphia. Following Crooks (2002) and Hilty and Merenlender (2004), the term “domestic cat” was chosen as the common name for the feral cats included in this study to avoid any confusion that these cats were a wild species or subspecies. All cats referred to in this study were free-ranging domestic cats, and there was no evidence that such cats were personally-owned pets. The term “canid” is used occasionally to refer to non-domesticated members of Family Canidae, which here were red foxes, gray foxes, and coyotes.
Overview of methods— We divided the Presidio into seven grid cells (Fig. 3) of approximately equal area (86-91 ha each) and considered each of these seven zones as a sampling unit (Zielinski et al., 1995). To document the presence of mammalian carnivores and opossums within the Presidio, we conducted detection surveys using camera traps, track plates, box and snare traps, and scat surveys using a detection dog. These methods were similar in that we distributed our sampling effort across the seven zones. We compared the numbers of detections and numbers of species detected within and across zones, correcting for the amount of effort which was measured in sampling days termed “trapnights” here. To document variation among individuals in space use behavior and activity patterns, we conducted radio-tracking. Where means are presented, they include Standard Deviations in the text (Mean ± SD) or as error

7
bars in graphs. We had only limited or no access to the following areas in the Presidio: the Presidio Golf Course (in zone three), the San Francisco National Cemetary (in zone four), and the fenced construction site for the Letterman Digital Arts Center (in zone 2).
Camera traps— We utilized camera traps from May 2003 - May 2004. These were digital or 35 mm cameras wired with sensors so that an animal passing in front of the sensors would trigger the camera to take a photo that is automatically stamped with the date and time of day. Camera traps were placed on game trails, paved and unpaved foot paths, and other potential wildlife travel routes in each of the seven sampling units. Cameras were secured with locks and steel cables to reduce the risk of theft. Cameras were set for continuous day and night sampling with a minimum 3 to 5 minute delay between photos and were not baited with food or scent. Every 24 hour period that a camera was in place was considered one “trapnight” of sampling effort. The total number of trapnights for one camera that was deployed for a continuous period was the number of days between the date the camera was set in the field and the date that it was collected. If the camera had stopped functioning during that period due to exhausting its power supply or filling up its capacity to store photos, then the end date for determining the number of trapnights was the date of the last photo taken by that camera trap. Cameras were moved within zones after 4 to 8 weeks and placed in various habitats. Using a handheld GPS unit, UTM coordinates for all camera trap locations were recorded, along with characteristics of the particular location such as habitat type. We used the photographic results to determine presence of carnivore species within each of the seven sampling units and calculated the following detection index for cameras to compare across zones and species:
Camera Index = 100 X (# of photographic detections of a species/# of trapnights)
This camera index was a relative measure indicating the ease of detecting a species, and it can be roughly interpreted as the estimated number of detections expected to be obtained in 100 trapnights of sampling effort. We used the time-date stamp on photographs to assess activity patterns. We also used camera results to identify areas in which to target focal species for capture and radio-collaring.
Track plates— We added scent stations to our survey methods for a brief period during summer 2003 to see if this method could be useful in detecting elusive species. Based on experience conducting surveys using scent stations in Marin County, J. Shulzitski (pers. comm.) determined that sooted track plates were an effective scent station method under clear weather conditions but that rain or fog drip made plates unreadable. We took advantage of unusually clear weather during June-July 2003 in the Presidio to test the utility of scent stations using sooted track plates. At each station, a pair of sooted track plates was placed. Each plate was a 0.5 X 1 m piece of sheet metal coated with a fine layer

8
of soot that was applied using an acetylene torch. In the center of each plate, a punctured can of cat food was placed as a scent bait. After four nights, the sets were checked and all tracks examined. Each different species was recorded only once per set, regardless of the number of tracks on the plates. Sample tracks from the plates were removed using clear adhesive packing tape. A piece of tape pressed over the tracks lifted the soot and thus the pattern of the tracks, and then the tape was pressed onto a blank piece of paper for a more permanent record. Each pair of track plates in a zone for four nights was considered four trapnights of effort. If fog, rain, or water from sprinklers smeared the plates during the four nights, then the set was discounted and not included in the final dataset. For all track plates that were included, we calculated the following index of detection, patterned after the detection index described for camera traps:
Track Plate Index = 100 X (# of detections of a species/# of trapnights)
Similar to the camera detection index, this index can be interpreted as the estimated number of detections expected to be obtained after 100 trapnights of sampling effort.
Scat surveys— Scat surveys were conducted by Working Dogs for Conservation dog handlers. During an 8 day period from 13 - 20 July 2003, a professionally trained scat-detection dog was used to survey for scats of red fox and gray fox. The dog used during this survey was trained with a combination of detection dog training techniques, including modified cadaver, narcotic and search and rescue training methods (Smith et al., 2003). The particular dog used for this study had 5 years of previous wildlife detection work experience, with 3 years of experience in identifying scats of red and gray fox species prior to the start of the project (Smith et al., In Review). Scat-detection dog surveys were conducted in the cooler portions of the day, early mornings and evenings. The survey team consisted of a detection dog, a dog-handler, and an orienteer (both the dog-handler and orienteer were biologists with extensive experience in working with wild canid species). Survey times, routes, and activities were recorded by the orienteer.
Within each zone, four loop-shaped transects of 1 km each were covered by the survey team. For each 1 km transect, the dog was allowed to walk ahead of the handler/orienteer team, with the handler observing the dog and watching for any detection behavior the dog may exhibit (e.g. sitting next to a scat, hovering over a scat). The dog did not work on a leash. The dog typically moved from side to side across the transect, and in effect, covered an area approximately 25 m to each side of the transect. All scats and all indications of fox scent were recorded and mapped using a GPS unit.
Animal capture and radio-tracking— To study variation in space-use behavior among individuals, we radio-tracked individuals of several carnivore species. This study was designed with the expectation that we would radio-collar

9
a maximum of four red foxes and four gray foxes, and these fox species were the initial focal species motivating the research. During the study’s development, coyotes became an additional focal species, and we directed capture efforts towards radio-collaring a coyote (at that time only sightings of single coyotes had been reported and there was not sufficient evidence to suggest the presence of more than one coyote in the Presidio). Sample sizes were thus intentionally small, as all canids were expected to be few in number in the Presidio. Radio-tracking of the other species was intended primarily for the purpose of comparing space utilization by other species with space utilization by foxes.
We conducted live trapping from April 28 – October 31, 2003. We used primarily box traps (Tomahawk Live Trap Co., Tomahawk, WI), which were covered by surrounding brush and litter to provide cover and to decrease stressful stimuli. Box traps were used to target domestic cats, foxes, raccoons, skunks, and opossums for capture, and were placed in all zones. We selected trap sites where human interference was less likely, which made site selection difficult in the primarily urban areas. A few of the box traps that we used were large enough to potentially capture coyotes, but foot snares and neck snares were the main traps used in the Presidio to target coyotes. Because snare trapping was extremely labor intensive, particularly given the permitting logistics for working in the Presidio, locations for snares were selected based on areas where coyote capture seemed most likely at the time and interference from people and their pets was least likely; we did not attempt to conduct snare trapping throughout the Presidio. Foot snares were Fremont foot snares (Fremont Humane Traps, Beaumont, Alberta), modified with stop-locks, break-away locks, swivels, and shock springs to reduce non-target captures and minimize the potential for injury. Neck snares had stop-locks, swivels, and shock springs. Traps were opened just before dusk and closed at dawn. To meet NPS and Presidio Trust requirements, we did not conduct daytime or weekend trapping involving snares, except when we could be present to monitor such traps continuously during daylight hours.
Trapping effort was measured in trapnights, with a trapnight equaling one trap set for one night or for one continuous 24-hour period. Because snare traps were highly unlikely to capture the smaller species including cats, skunks, and opossums, and because most box traps were too small to capture coyotes, separate trapping detection indices were calculated for snares and box traps. As with other detection methods, the trap detection index for box traps or snare traps was:
Trap Index = 100 X (# of detections of a species/# of trapnights)
After presenting results separately for the different trapping methods, all capture results were combined for simplicity in the presentation of some of the results.

10
Captured individuals that were radio-collared were also weighed, measured, and sexed. We collected tissue and other samples, including blood, hair, and scat when possible. Canids were physically restrained for handling, while all other species were chemically immobilized. Opossums, feral domestic cats, and striped skunks were immobilized intramuscularly by hand injection, using Telazol concentrations prescribed by Kreeger (Kreeger et al., 2002). Raccoons were immobilized using Telazol or 5:1 ketamine/xylazine (Kreeger et al., 2002). Vital signs of all immobilized individuals were monitored (temperature, heart rate, and respiration). We recorded all trap injuries, which were rare and limited to scrapes on extremities such as foot pads in only two cases.
Blood samples were archived and frozen as whole blood, serum, and plasma, with serum samples prepared for California Department of Fish and Game’s Wildlife Investigations Laboratory (Rancho Cordova, CA). Blood from the coyote captured during this project was sent to the Wildlife Research Unit of the Veterinary Genetics Laboratory at UC Davis for genetic analyses. The genetics of this coyote were analyzed in the context of a statewide database and research on the population genetics of coyotes in California based on published and on-going work (Sacks et al., 2004), and these results are contained in an unpublished manuscript by Sacks, et al. (Appendix A).
Collared individuals were tracked by vehicle and on foot. Individuals were tracked up to four times per week, and we attempted to track during morning, daytime, evening, and night. Locations of individuals were determined through triangulation of three tracking bearings, visual confirmation, or localizing the signal to a small area such as part of a building or patch of trees. Locations obtained by triangulation had less than 20 minutes between bearings and were excluded if the three bearings did not intersect to form a triangle.
Radio-collars were equipped with activity sensors and mortality sensors that emitted different pulse rates (beeps per minute, bpm). The fastest pulse of 100 bpm indicated that the radio-collared animal had not moved for at least 4 hours; this was the “mortality” sensor, and we attempted to locate the collar as soon as a mortality signal was heard to determine if the animal had died or if the collar had fallen off of the animal. A pulse rate of 60 bpm indicated that the animal was moving or had moved within the previous minute; this was considered the “active” pulse rate. A rate of 40 bpm indicated that the animal had not moved for at least one minute (but that it had not been still longer than 4 hours) and was termed the “inactive” rate. The activity sensors were sensitive to small motions of the collar which we verified before deploying the collars on the animals. Thus a resting animal that lifted its head or shifted its position slightly after some period of being still would trigger the pulse rate to change from 40 bpm (inactive) to 60 bpm (active) as soon as the animal moved. The pulse rate would then remain at 60 bpm for 1 minute after the animal’s motion had ceased before returning to the inactive rate of 40 bpm.

11
We recorded the pulse rate with each radio-tracking bearing, but these activity data appeared too coarse to evaluate activity patterns. To obtain finer scale temporal data, we conducted Focal Animal Surveys (FAS) (Altmann, 1974) from October 2003 through May 2004 using the activity sensors. During each FAS, the pulse rate for a radio-collared individual was continuously recorded for 10 to 30 minutes. An FAS in which an animal’s signal had a rate of 60 bpm for 25% or less of the time was considered an “inactive” period. If an animal’s signal was 60 bpm for more than 25% of the time, the FAS was categorized as an “active” period. For activity data, we standardized all times according to the circadian clock by subtracting 1 hour from times recorded during Daylight Savings Time (April 6, 2003 – October 26, 2003), thus eliminating the sudden 1-hour shift induced by the transition to DST.
Home range estimates and habitat use— In a GIS database, we estimated individual home ranges from radio-tracked locations using ArcView 3.3 with the Animal Movement Extension (Hooge & Eichenlaub, 1997). To estimate home range sizes, we calculated minimum convex polygons ( MCP Mohr, 1947; Hayne, 1949). MCPs were calculated for all radio-collared individuals for which more than four locations were obtained and these results are presented in this report. However, only individuals for which at least 20 locations were available were included in analyses and summary statistics. Where home range sizes were graphically compared, we used log-transformed MCP data.
One of the advantages of calculating MCPs as home range estimators is that MCPs rely on the outermost points at which an individual is observed and therefore do not require independence among observations (Swihart & Slade, 1985). However, MCP calculations only utilize a small number of datapoints from a given dataset. For examination of habitat use, we calculated habitat selection indices based both on MCPs and on the locations of an individual. We used a simplified version of the Presidio landcover map (Fig. 4) in which we divided the landscape into four landcover classes, combining together four categories representing non-forest vegetation (dunescrub, native grasslands, exotic vegetation, and wetlands) that were each less than 11% of the landscape.
Within our GIS database, we overlayed animal home ranges and point locations with the GIS coverage depicting four landcover types in the Presidio to determine landscape characteristics associated with individual space-use patterns. We used the Manly-Chesson Standardized Index, which is an index of habitat selection that corrects for varying proportions of available habitat (Manly et al., 1993; Garshelis, 2000). Here, we considered our four landcover classes as habitat types, and calculated the Manly-Chesson Index as the proportional habitat use divided by the proportion of available habitat, standardized so that the values for all habitats added to one (Manly et al., 1993; Garshelis, 2000). We calculated the index in two ways for each radio-collared animal. First, we calculated proportional habitat use based on the proportion of an individual’s locations in each class of landcover. Second, we calculated proportional habitat
12
use based on the proportions of landcover classes that composed an individual’s MCP home range. Where means are presented in the text, they include Standard Deviations (Mean ± SD).
Opportunistic sightings— We collected incidental animal observations of wildlife in the Presidio from Presidio staff and residents. Animal observation cards were placed in Presidio Trust Natural Resource offices from October 2002 through October 2003. Employees who saw carnivores or opossums were asked to record locations, dates, and times of sightings of species on these observation cards. Additionally, we recorded incidental observations that were reported directly to us and we recorded our own sightings of animals made during field work. Finally, the Presidio Trust shared a database of coyote sightings compiled from reports made to Presidio staff by employees and residents.
Results
Camera traps— We set camera traps from April 2003 through May 2004 in the different zones (Fig. 5). We sampled the Presidio for 534 camera trapnights that yielded a total of 1,047 photos triggered by animals or people. There were nine detections (photos) of coyotes, nine of domestic cats, 10 of striped skunks, nine of red foxes, and 53 of raccoons (Table 2; Fig 6). Additional animal detections included a photo of a pair of roof rats and a photo of a killdeer. Raccoons were detected most often and in the most number of zones (Table 2). Although skunks were photographed in only two zones, the camera index for this species was similar to the index for three other species-- coyote, cat, and red fox-- that were each photographed in four or five zones. At least two different carnivore species were photographed in each zone, but no opossum or gray fox photos were obtained.
In contrast to the 90 photos of carnivores, there were 819 detections of people, pet dogs, or both (Fig. 6). Thus cameras frequently filled up with photographs of people and dogs which likely hindered further detection of carnivores. In many places, cameras detected both people and wildlife, indicating that both people and wildlife tended to use the same trails. Another 138 photos were taken in which either only a small portion of an animal or moving object could be seen but not identified, where lighting did not sufficiently illuminate the subject, or the triggering event was otherwise unclear. Some of these unknown photos were of birds in motion that could not be identified to species. During the study, two cameras were stolen and others malfunctioned on a few occasions; these cameras were not included in numbers of trapnights.
Examining all trapnights showed that raccoons were the first species detected with camera traps, with the first raccoon detection occurring after 18 consecutive trapnights in the Presidio. The next new detection was of a coyote after an additional 55 trapnights, then a domestic cat, and a striped skunk. A red fox was the fifth and final species detected after 201 trapnights, and no more new

13
carnivore species were photographed in the 318 trapnights after that point. If only the trapnights for zone six are considered, all five of these species were photographed within 34 trapnights. In contrast, a total of 92 trapnights in zone seven yielded detections of only two different species (Table 2). A logarithmic curve fitted to the data for the entire Presidio (Fig. 7) estimates at least 400 trapnights would be needed to detect five carnivore species.
Track plates— We tested track plates as a method that might yield detections of additional species or might prove more feasible for wildlife detections than camera traps that were yielding high numbers of detections of people. This was not a method that we originally proposed using but was one which we added to our surveys for a short trial period. Track plates were set during June and July 2003 (Fig. 8), when there was a period of unusually clear weather. Fog ruined some of the plates toward the end of this time period and was the primary reason for discontinuing use of track plates. Track plates were set in 15 locations for four days and nights each for a total of 60 trapnights, ranging from four to 12 trapnights per zone (additional trapnights were discarded due to water smearing the track plates). There were four detections of domestic cats, five of striped skunks, and two of raccoons (Table 3). No opossums or canid species were detected using track plates. One track that could not be identified to species appeared to belong to a species within Family Mustelidae, which includes skunks and weasels. This track may have been from a young striped skunk, but it was not a clear enough impression to exclude the possibility that it came from a different species. Although our track plate results yielded information on presence, the small number of trapnights and locations limits the utility of these data.
Scat surveys— Scat transects generally followed paved roads (along the edge), dirt trails, and sidewalks (Fig. 9). A total of 29 kilometers in 1 km loops were surveyed using a detection dog that was working off-leash covering at least a 50 m width. Four of the 1 km loops were in each sampling unit, with two exceptions. Restricted paths for crossing the golf course led to walking one 2 km loop instead of two loops of 1 km each. One additional transect was conducted in an area of habitat restoration at the request of the Presidio Trust. Only one possible fox scat was detected during the entire survey. The sample was desiccated and very degraded and thus was not sent for molecular testing to confirm species identification. The detection dog indicated that he detected fox scent on two other occasions along the transects but no other scats were located in these area (one indication was over a sewer drain where foxes had been seen at times). In addition to the transects, the survey team visited a site in the Presidio where red foxes had denned in May 2003. The detection dog located several scats here which were all old desiccated samples, but the effort showed that the dog was successfully detecting fox scent and scats.
Animal capture— We conducted trapping by box traps and snares in the Presidio on 69 days from April 2003 through October 2003 for a total of 364

14
trapnights. We set foot snares, neck snares, and box traps at 84 different locations (Fig. 10). Fewer trapsites were selected in zone two due to the potential for human interference in this largely urban area and because part of the area was contained in a construction zone. Most animals captured were skunks and raccoons, and these species made up 53 of the 61 captures. Capture rates for all other species were very low, and no gray foxes were captured (Table 4). Of the 61 captures of target species, we radio-collared four cats, one coyote, one opossum, one red fox, seven raccoons, and eight striped skunks. We immobilized and handled an additional two skunks, and we physically restrained and handled a juvenile red fox that was too young and small to radio-collar. One feral domestic cat was captured and released, because the cat showed no response to two doses of Telazol and could not be immobilized for safe handling. We generally tried to not handle more than two animals in a day to avoid leaving other animals in traps for long periods of time to reduce stress and prevent trap injuries. Additional raccoons and skunks were released without handling.
Snares were used to target a coyote for capture and were set in locations where coyote sightings had been reported, or where foot surveys and questioning of residents indicated current coyote activity. We did not attempt to place snares in areas throughout the Presidio, and snares were set in four zones for a total of 92 trapnights. One raccoon was captured and released without further handling. One red fox was captured in a snare and radio-collared. Snare trapping ended with the capture of a coyote, as no other coyotes were known to be present at that time and the number of labor hours required for snare trapping had exceeded expectations for the project.
Based on capture efforts using box traps, striped skunks had the highest trap index of 11 and were captured in six of seven zones (Table 5). Raccoons were captured in boxes in five of seven zones and also had a high trap index of 8. Domestic cats had the next highest trap index at 1.5 followed by even lower indices of 0.4 (opossum) and 0.4 (red fox). No gray foxes were captured in any traps, and it appears that a substantial additional effort would be required to potentially detect a seventh species using trapping (Fig. 11).
Raccoons and skunks exhibited variation in body weight but the body weights of four feral domestic cats varied little (Table 6). Skunks were sexually dimorphic in some body measurements but most strikingly in body weight. Three males weighed on average 3.6 kg ± 1.1 while six females averaged only 1.5 kg ± 0.4 (t-test: t = 4.399, p = 0.003, df = 7; Fig. 12). Thus males weighed about twice as much as females. This weight difference was not a result of capturing subadult females as four of the females were clearly reproductive adults (primiparous or multiparous). Other dimorphic characteristics were apparent in the pelage of male and female skunks. Males had broad white markings covering the tops of their heads and tended to have yellowish tinges to their white coloration. Females had more striking black and white patterns with narrower bands of white on their heads. Males were longer in body length than females,

15
but males and females had tails measuring similar lengths. Females thus had proportionately longer tails for their bodies, making the tail a particularly prominent feature of their appearance.
Ectoparasites were present on individuals of all species. Fleas were observed on all species captured with the exception of raccoons. A single tick was found on the opossum and on each of two raccoons. Multiple ticks were found on the adult male red fox and on three of the skunks, but no ticks were found on any of the four domestic cats.
Opportunistic sightings— Our sightings database included reports made directly by USGS field researchers and secondhand reports that we collected from Presidio residents, employees, and visitors. A few reports were accompanied by physical evidence such as a photograph or, very rarely, a road-killed specimen. Seven different carnivore species were reported through sightings (Table 7). Most sightings were of coyotes, in part because of attention that this larger carnivore attracted, as coyotes had not been officially documented in the Presidio (or San Francisco) prior to 2002 and because the Presidio Trust began assembling a database of coyote sightings. We actively solicited carnivore sightings from Presidio Trust staff from October 2002 to November 2003 (Table 7a, 7b), and we collected other sightings throughout the study. Table 7b covers the period of time when we were conducting capture work, and together Tables 7b and 7c cover the time period when we were conducting camera trap surveys. Domestic cats, opossums, raccoons, and striped skunks were seldom reported; of the reports of these species, most were sightings recorded by field researchers working on this project in the Presidio.
We were able to verify two gray fox sightings in 2004 (Table 7c). One of these gray fox sightings (in April 2004) was made by two USGS field research assistants who had a clear and extended view of the animal. Both of these people had previously photographed and accurately identified a red fox and a coyote on multiple occasions in the Presidio. Although they were unable to photograph this gray fox, they were familiar with the distinguishing characteristics of gray foxes, and they had a field guide book with them to verify the sighting at the time that they saw the fox. The other verified gray fox report (February 2004) was of a road-killed animal collected by a NPS employee. Two gray fox reports a year earlier were made by Presidio residents and in the absence of physical or photographic proof, were considered secondhand reports that seemed reasonable but could not be completely verified. We tried to ascertain the accuracy of secondhand reports of foxes and coyotes through brief interviews with the people reporting the sightings, especially when no distinguishing characteristic of a species were described in a report. In particular, we tried to make sure species were not being confused with one another (for example, someone might be familiar only with coyotes or with only one of the two fox species and mistakenly report an animal as one of these options, without knowing that another possibility existed). However, it was not possible to have

16
complete confidence in all sightings, and we did not attempt to assign a confidence level to secondhand reports. Coyotes were reported from throughout much of the Presidio but most sightings were clustered around residential areas in zone one (Fig. 13).
Comparison of detection methods— There were 958 trapnights total for cameras, snares, boxes, and track plates combined. Based on detections from all these methods, the overall detection index for raccoons was 8.1 and was the highest index among the focal species. The overall detection index was lowest for opossums at 0.1 (one detection in 958 trapnights). Skunks had the second highest detection index at 4.9, while the remaining species had indices of 1.8 (domestic cats), 1.1 (red foxes), and 1.0 (coyotes). Not all methods were appropriate for detecting all species, however, and a comparison of the detection indices for the different methods and species is shown in Fig. 14. Absolute numbers of detections are in Table 8a and numbers of trapnights are in Table 8b. Raccoons were the only species detected by all methods, but they were much less frequently detected using track plates and snare traps than they were with box and camera traps (Fig. 14). Despite high detection indices for raccoons with some methods, only one raccoon was captured in a snare. Raccoons are generally difficult to avoid in traps set to target canids, but in the Presidio where raccoons were much easier to detect than coyotes, raccoon capture was not an important factor limiting the success of snares for capturing canids.
Raccoons and striped skunks were detected by at least one method in all seven zones in the Presidio (Table 9). The only zone in which an opossum was detected was zone three, which was the zone that had the highest percent forest cover and lowest percent urban area in the Presidio (Table 10; see also Fig. 2 and Fig. 4). Zone two was the only zone for which we obtained no coyote detections, and this was the zone that had by far the highest percent urban area (Table 10). Domestic cats were detected by at least one method in all zones except zone four. Red foxes were detected in all zones except zone one. The two gray fox detections were in zones five and six.
For simple detection of species within sampling zones, opportunistic sightings often worked as well as, and sometimes better than, other detection methods (Table 9), although the accuracy of all sightings could not be verified. Also, the locations of sightings obtained in this study were likely to be biased towards areas where Presidio, NPS, and USGS staff were present and working, as many sightings came from people in these groups. As a method to determine presence of a species in the Presidio, opportunistic sightings worked well for the three canid species in particular. In zones four, six, and seven, at least one of the three canid species was reported through a sighting but was not detected through other survey methods. In zone five, both red and gray foxes were reportedly seen but were not detected through cameras, track plates, or traps. The opposite pattern was true for the more prevalent and more nocturnal (see “Activity Patterns” section) raccoons and skunks, which were more likely to be

17
detected through other survey methods than through opportunistic sightings. There were no sightings of skunks in zone four and none for either raccoons or skunks in zones five, six, and seven, although these species were detected through other methods in these areas.
Radio-tracking: home range estimates and habitat use— The single radio-collared coyote disappeared a week after we collared it. Because no one in the Presidio reported seeing a radio-collared coyote after that time, it is unlikely that this animal remained in the Presidio with a failed transmitter. It is also unlikely that the collar fell off, as we should have been able to find the collar from the signal. There were other reports and sightings of an uncollared coyote immediately after the collared animal disappeared, including photos taken by a Presidio resident the following week. Thus at least one other coyote was likely present at the same time as the individual that we captured. Genetic analyses of the blood sample from the single captured coyote showed that this animal may have originated from a population to the north of the Presidio (Appendix A). Genetic analyses of a coyote scat sample collected in summer 2004 in the Presidio may reveal whether this genetic result may hold true for a second coyote in the Presidio.
The home range of the red fox measured 279 ha (Table 11a) and was by far the largest home range among the animals for which sufficient tracking data were available. The next largest home range belonged to a domestic cat whose MCP measured 67 ha. The smallest home range was that of the opossum and was just under 8 ha. Among cats, raccoons, and skunks, there was overlap in the sizes of home ranges. Two cats (with more than 20 locations each) had an average home range size that was the largest among these three species, but they also had the largest standard deviation (Table 11b). Raccoons had an average home range size that was greater than the average home range size for skunks, but the difference was not statistically significant (t-test: t = 0.497, p = 0.63, df = 8). One male striped skunk, for which there were only 17 locations, had a particularly large home range among the radio-collared skunks of 52 ha. This large home range size may have been due to dispersal, as this skunk’s locations appeared to show uni-directional movements away from the general area where we first captured it and where we radio-tracked it for the first several locations. Home range sizes did not appear to be a function of the number of locations that we obtained within or across species (Fig. 15). Similarly, home range size appeared unrelated to an individual’s body weight within or among species (Fig. 16), although samples sizes of numbers of indiviudals were small.
Maps of individual home ranges for cats, raccoons, the red fox, and striped skunk are presented, respectively, in Figs. 17-20. Locations and home ranges of the three radio-collared cats and the one opossum are shown in Fig. 17. Home ranges of raccoons overlapped with one another (Fig. 18). One individual raccoon’s home range overlapped with those of four other radio-collared raccoons. It was unclear if such overlap existed but went undetected in

18
other species; radio-collared raccoons were in closer proximity to one another than the radio-collared skunks (Fig. 18, Fig. 20). Locations for the radio-collared red fox showed that this animal tended to be found in the eastern end of his home range (Fig. 19). Although some of the fox’s locations were clustered in space and time, during periods of time spanning less than 3 months, the fox was found at opposite ends of the entire home range (Fig. 19). We regularly listened for radio-collar signals throughout the Presidio and in the urban edges adjacent to the Presidio, but there was no evidence that any of the radio-collared animals left the Presidio for the adjacent San Francisco areas.
Habitat use of radio-collared animals was analyzed using a simplified version of the Presidio landcover map (Fig. 2) divided into four landcover or “habitat” classes (Fig. 4) that covered 16 to 36% of the Presidio landscape each (Table 12). If an animal selected habitats based on their proportional availability within the Presidio, then the Manly-Chesson Index would be equal across the four habitat types at 0.25 each for a total of one. Based on locations of radio-collared individuals, only two individuals appeared to select urban areas among the categories of landcover (Fig. 21a). One of these individuals was the red fox (“fre”). The other was a male striped skunk (“sin”), whose habitat selection differed from all other animals in that he was never tracked to a forested area and almost never found outside of urban or landscaped areas. Several individuals appeared to select for forested and “other” vegetation areas and to seldom use urban and landscaped areas. The opossum (“oli”) and a female raccoon (“rud”) showed the strongest selection for a single landcover type, with Manly-Chesson Indices for forest of 0.74 and 0.76, respectively. Whereas most species appeared to avoid landscaped areas, striped skunks selected for landscaped areas in proportion, or slightly greater than, the availability of this habitat type in the Presidio (Fig. 21b). This pattern was consistent across the three skunks included in this analysis.
Figure 22 shows the Manly-Chesson Indices based on the proportions of landcover types within the MCP home ranges relative to the proportion in the Presidio as a whole. The patterns here were more consistent across individuals (Fig. 22a) than for selection indices based on the locations (Fig. 21a). This was probably due to the Presidio’s highly mixed landscape and the size of carnivore home ranges; regardless of where a carnivore lived, the available habitats encompassed by its home range were generally similar. The habitat composition of home ranges thus resembled the proportional availability of the four habitat types in the Presidio. Most individuals had higher Manly-Chesson indices for both landscaped and urban areas when indices were based on proportions of habitat within home ranges (Fig. 22) than when the indices were based on proportions of locations (Fig. 21). Thus, although urban and landscaped habitat types were present within their home ranges, radio-collared individuals were not tracked to these habitat types as often as they were tracked to forested areas. The individual that had a home range containing only a small fraction of forest relative to the availability of forests in the Presidio (Manly-Chesson Index of 0.04) was

19
the male skunk (“sin”) who lived in the northeast portion of the Presidio (Fig.20) where the landscape was mostly urban and whose location data showed a similar selection pattern (Fig. 21a).
Radio-tracking: survivorship—No radio-collared skunks were alive or had functioning collars beyond April 2004. From November into March, radio-tracking results suggested that striped skunks in the Presidio entered a period of greatly decreased activity, or that they moved out of range of our radio receivers or moved to a location that blocked the signal’s transmission. Signals for three radio-collared skunks could not be found for continuous periods of 2.5 - 3.5 months between November 2003 and March 2004. After their emergence from an apparent extended period of inactivity, all three of these skunks disappeared within a couple weeks for a final time. Two other radio-collared skunks disappeared at the beginning of the inactive period in November 2003 and were never relocated. Only one radio-collared skunk could be located at all during January 2004, the “urban” male described above. This male skunk died by early February 2004. His collar was found inside a basement storage room with bones of several skunks. His signal had indicated that location for several weeks prior but the signal was not a mortality signal until the end of January. It is possible that the carcass or collar was moved on occasion by another animal or some activity that prevented the collar from changing into mortality mode. In some parts of their species’ range, striped skunks enter a period of winter dormancy and may den communally during this time (Godin, 1982), and this may also be true of skunks in the Presidio. The skunks whose signals disappeared in the early spring may have had transmitters that failed, as skunks wore collars that were smaller than those on raccoons, or there may have been a period of higher mortality for skunks in the early spring and at the beginning of winter. In contrast, four raccoons were alive with functioning collars through May 2004. One of these was found dead 1.5 months later, hit by a car, and another raccoon was found during the study, also hit by a car. Two other raccoons disappeared but it seemed likely that their transmitters failed, as their collars emitted intermittent signals for a period before we lost the signals entirely. The opossum was found dead in March 2004 with no apparent injuries and well within her forest-dominated home range; it seemed likely that she died of poor body condition.
Activity patterns— We characterized activity patterns from camera traps by comparing the frequency of photographs triggered during the day against the frequency at night (Table 13a). With few exceptions, most detections of carnivores occurred at night. Four of the nine cat photographs were taken during daylight hours. No coyote or skunk photographs were taken during daylight. Every hour of the night from 1800 to 0600 there were two or more photos of raccoons for a total of 52 photos during the nighttime hours. Only one of 53 raccoon detections occurred between the hours of 0600 and 1800 which was a photograph at 0620. Two of nine red fox detections occurred during daylight hours. Based on camera trap detections, coyotes, raccoons, and skunks appeared to exhibit nocturnal activity patterns. Feral domestic cats showed

20
activity throughout the 24-hour cycle, and red foxes appeared to be largely nocturnal but the small sample size did not yield a clear pattern.
In contrast to the camera trap survey that yielded only detections of coyotes during hours of darkness, almost half (45%) of the opportunistic sightings of coyotes were during daylight hours (Table 13b). While opportunistic sightings data can be heavily biased by human activity and space use patterns (Quinn, 1995), here it seems that camera traps failed to capture the daytime activity of coyotes in the Presidio. Sightings of other species confirmed the activity patterns derived through camera trap results (Table 13a). In cases where cameras detected both people, their pets, and wild carnivores, photographs of people were usually taken in daylight and photos of carnivores tended to be taken at night. For striped skunks and raccoons, the pattern of camera trap photos (Table 13a) was probably a result of their largely nocturnal habits (Fig. 23c, Fig. 23e). However the lack of more daylight camera trap photos of coyotes suggests that this species avoided trails during the times that people used trails most.
FAS data showed that the radio-collared cats were active throughout the day but particularly in the middle of the day and in the late evening (Fig. 23a). The radio-collared red fox also showed daytime activity (Fig. 23d) with periods of activity and inactivity at almost any given time of morning, day, and evening. No clear pattern of activity emerged from data on the radio-collared opossum (Fig. 23b), although opossums are generally nocturnal. Raccoons (Fig. 23c) and striped skunks (Fig. 23e) were largely inactive during the day and appeared to increase their activity after 1700.
Discussion
Raccoons, skunks, cats, and opossums—Raccoons were not difficult to detect in the Presidio. They had by far the highest camera detection index of all the focal species, which suggests they are more abundant than other carnivores. Given the small size of the home ranges of radio-collared raccoons, the amount of overlap among them, and the lack of strong habitat preferences, numerous raccoons can co-exist here and likely support a population regardless of immigration or emigration rates between the Presidio and other areas. With an average size of 26 ha, home ranges of raccoons in the Presidio were much smaller than other home ranges reported for raccoons, suggesting rich abundant food resources are available to raccoons in the Presidio. Home ranges of individual raccoons ranged from 2,300 ha to 4,950 ha in a rural prairie landscape (Fritzell, 1978b; Fritzell, 1978a), and in a forest preserve in Chicago, raccoon home range sizes, averaged by sex and by season, ranged from 77 to 128 ha (Gehrt, 2004). Overlapping home ranges appears common among raccoons in any setting and is not just a feature of urban areas (Ewer, 1973; Gehrt & Fritzell, 1998). Raccoons have a highly varied omnivorous diet (Gehrt, 2003) and forage on garbage in urban settings (Gehrt, 2003; Gehrt, 2004). Anthropogenic food

21
sources in the Presidio are thus likely enhancing the raccoon population, reducing foraging competition among individuals and the need to range more widely to meet basic resource requirements.
Striped skunks were more easily detected than most carnivore species in the Presidio, and were particularly easy to capture in box traps. Their camera detection index was much lower than the index for raccoons but was similar to the index for coyotes, cats, and red foxes. Striped skunks visited track plates more than other species and seemed particularly easy to detect with this method. Skunks had home ranges in the Presidio that were similar in size to those of the radio-collared raccoons in this study and that were smaller than home range sizes reported for striped skunks elsewhere (98-168 ha, Gehrt, 2004; 380-510 ha, Storm, 1972). Gehrt (2004) also found that striped skunks and raccoons in a Chicago forest preserve had home ranges of similar size, despite the difference in the weights of these species. Gehrt (2004) hypothesized this is due to food habits, with skunks spending more time foraging for live prey while raccoons can reach foods that are highly clumped and do not run away. Striped skunks have an omnivorous diet consisting largely of insects and other invertebrates, and they are able to capture and eat vertebrate prey such as small rodents but they rarely eat birds and eggs (Godin, 1982). They also eat plant materials, such as berries (Godin, 1982). Striped skunks do not seem to exploit garbage as a food resource as raccoons do (Gehrt, 2004), but one advantage of an urban setting for skunks may be the availability of sheltered den sites in buildings and other structures for winter dormancy and rearing offspring (Lariviere et al., 1999). The winter dormancy of skunks follows a latitudinal pattern; skunks in the southern portion of the species’ range do not enter this period of dormancy while those at more northern latitudes do (Godin, 1982). This latitudinal pattern may hold true in California. Striped skunks in Bakersfield do not enter winter dormancy (B. Cypher, unpubl. data) but radio-collared skunks in this study did, despite the Presidio’s mild winter climate.
Cats were the only domestic species included in the study. While cats detected here all appeared to be free-ranging feral cats, we do not know the extent to which they interacted with or depended on humans during or prior to our study. For example, one of the radio-collared cats in this study appeared to be a neutered male which would indicate prior handling. The degree of a cat’s dependence on humans may change during its lifetime, and can vary across a continuum from living wholly indoors and relying on people for all food to living outdoors and never receiving human care or handling (Clarke & Pacin, 2002; Kays & DeWan, 2004). We covered only a small part of this continuum and therefore our results do not address questions about the entire cat community in the Presidio. Potential effects on wildlife per cat may increase with a cat’s degree of independence from humans(Kays & DeWan, 2004). However, if subsidized outdoor cats and indoor/outdoor house cats are more numerous, they can have a collectively greater impact than fully independent and unsubsidized cats (Kays & DeWan, 2004).

22
For the Presidio as a whole, the camera detection index for domestic cats was similar to the index for coyotes, skunks, and foxes. Cats had higher detection indices than foxes based on box trapping and track plates. Kays and DeWan (2004) found that domestic cats were frequently detected at camera and scent stations that were placed in forests within 50 m of a suburban edge, but cats were seldom detected at stations in the forests that were more than 50 m away from the suburban edge. If cats behave similarly in the Presidio, then the placement of many of our traps and detection stations could have been outside of habitats that many cats were likely to visit.
Opossums were surprisingly rare in the Presidio. These omnivorous marsupials can occupy a variety of habitats, including urbanized areas (Gardner, 1982). They can easily be caught in box traps and attracted to scent stations (López González et al., 2000), and so given our low detection rate for this species (one capture and one sighting that were likely the same individual, and this animal died during the study), opossums did not seem to have a breeding population in the Presidio. The low occurrence of opossums could be a result of the abundance of other animals with a similar diet, namely competition with the larger and more agile raccoons (Ginger et al., 2003)
Scat surveys and canid detection— A survey for foxes scats using detection dogs failed to yield scats of foxes. Dogs have been successfully used in wildlife research and management to locate scats of target species such as black-footed ferrets (Dean, 1979; Winter, 1981), wolves, coyotes, black bears (Paquet, 1982-1989, University of Calgary, unpublished data), lynx (Breitenmoser and Breitenmoser-Wursten, 1984-1994, IUCN/SSC Cat Specialist Group, unpublished data), and grizzly bears (Wasser et al., 1999-2002, University of Washington, unpublished data). Additionally, previous studies have assessed the detection and accuracy rates of dogs trained to find scats of San Joaquin kit foxes (Vulpes macrotis mutica) and demonstrated the effectiveness of dogs in locating scats of target species (Smith et al., 2001; Smith et al., 2003). In field trials, detection dogs found 0.43 to 5.37 kit fox scats per km searched. Furthermore detection dogs were 100 % accurate (n = 1,298 scats) at distinguishing kit fox scats under field conditions and were significantly more effective at locating scats than were human observers. Prior research has demonstrated the effectiveness of scat-detection dog surveys for determining the presence of kit foxes over large areas of continuous habitat (Smith et al., In Press). Results showed that kit fox scat surveys were highly successful in both large and small population areas, and the detection dog/scat survey method was extremely reliable at detecting kit foxes when they are present. Finally, previous research successfully used a detection dog to locate scats of three sympatric foxes (red, gray, kit) along transect lines in eight counties (Smith et al., In Review).
If fox abundance in proposed survey areas is low, the effectiveness of monitoring methods dependent on animal density and detectability (e.g. spotlight

23
surveys, trapping) are reduced. The use of a non-invasive method, such as scat-detection dog surveys can eliminate the need to capture or visually observe individuals, and may be more appropriate for determining fox presence in specific areas. However, it is not clear why the scat-detection dog survey in the Presidio did not yield more scats of foxes. Potential reasons include high scat degradation rates and the possibility that small mammals could move or remove scats (Sanchez et al., 2004), low fox numbers and thus low scat deposition rates, and the complexity of the Presidio’s heterogeneous landscape compared to other field settings. Results from camera traps and trapping indicated that red foxes were present in the Presidio, although their densities were low. A conservative estimate of red fox numbers present during June-July 2003 based only on the number of individuals identified would be two adults and one juvenile. The radio-collared male fox had a home range that covered half the Presidio. Red foxes are territorial, live in monogamous pairs, and have home ranges from about 60 to over 500 ha (Ewer, 1973; Samuel & Nelson, 1982). Based on our radio-tracking results, two breeding pairs of red foxes occupying stable territories appears to be the maximum capacity for the Presidio.
No evidence of gray foxes was recorded with scat-detection dog surveys or the additional survey methods. The only evidence of gray foxes came from opportunistic sightings that were reported towards the end of the study. This indicates that numbers of these animals were very low in the Presidio, and may even have been absent during parts of the study, or that the methods were not well-suited for detecting gray fox presence in the Presidio.
Coyotes can occupy home ranges five times as large as the Presidio itself, but these home range estimates generally come from areas where human densities are low (Gehrt, 2004). In urban areas, coyotes home ranges tend to be smaller. Coyotes living in Tucson, Arizona, had home ranges from 170 to 5,970 ha in size (Grinder & Krausman, 2001). Coyotes radio-tracked in and around the Santa Monica National Recreation Area in Los Angeles and Ventura counties had mean home ranges of 125 to 324 ha (Tigas et al., 2002). If coyote home range sizes are similar in San Francisco, the Presidio may be large enough to accommodate up to two pairs of adult coyotes.
In addition to survival and reproduction, dispersal is a key component governing animal population dynamics (Lidicker, 1975; Greenwood, 1980). Although the Presidio may support breeding pairs of canid species at times, offspring will almost certainly need to disperse outside of the Presidio to establish breeding territories of their own. If reproduction rates and offspring survival are low in the Presidio, then emigration of canids might occur rarely. Potential dispersal of canids into the Presidio will depend on the demographics of these species beyond the Presidio’s boundaries. The apparently sporadic occurrence of gray foxes, and the appearance of red foxes and coyotes in recent years may have resulted from periods of immigrants seeking suitable and available habitat.

24
This suggests that these species are crossing the San Francisco landscape and have established breeding pairs within dispersal distance of the Presidio.
Management Recommendations
If long-term monitoring of carnivores in the Presidio is a priority for management agencies, a system for collecting and verifying opportunistic sightings might be the most cost-effective method for determining which species are present. Opportunistic sightings proved to be quite useful, and when interpreted cautiously in light of other results, these data provided important insights leading to further questions. Most significantly, they provided the only indication that gray foxes were present, at least at times, in the Presidio. If presence/absence patterns of some or all carnivore species are desired, then the Presidio could centralize and collect sightings for monitoring purposes.
Opportunistic sightings of the species with lowest detection rates here came mainly from USGS researchers driving through the Presidio at times between 1800 and 0600. Training a few employees or volunteers to conduct spotlight or driving surveys for wildlife observations during hours after sunset and before sunrise could be a low input method to monitor even rare carnivore species. A simple protocol for this monitoring method could be devised, and monthly or bi-weekly circuits driven for 2-4 hours at a time might be sufficient to detect several carnivore species over the course of a couple of months. The Presidio is uniquely poised to devise a low-cost system for collecting sightings from the public, given the number of residents and employees living and working in this portion of the GGNRA. There is the potential for small education programs and requests for information to quickly reach many of these people, and the ability to centralize the reporting of such data. Equipping particularly enthusiastic contributors with simple digital cameras would help verify sightings and provide a useful long-term dataset of animal photos. Photos with time and date stamps and background scenery could help fill in the details of time and location that can be forgotten or left off of wildlife reports. Such an effort would not only provide data but could also fulfill public outreach goals.
More detailed information on relative abundances and occurrences of species throughout the Presidio over time would require adopting a systematic detection method and sampling scheme, and thus much more time and effort. Because sampling unit size should be based on the home range size of target species (Zielinski & Kucera, 1995; Zielinski et al., 1995), smaller sampling zones than used here are recommended in light of the small size of home ranges of most species.
Camera traps can provide clear and objective information, but there were logistical problems with camera traps, and this method requires modification to better suit the Presidio. One of the primary problems was the prevalence of people and dogs in many areas during daylight hours which caused film to be

25
used up or digital memory to fill up. One possible solution would be to set cameras for nighttime captures only (Hilty & Merenlender, 2004), although this limits the information gained. Increasing the minimum amount of time between captures is unlikely to work, as people were common enough that they would still be photographed every time the camera trigger mechanism was reset, and a long delay time between captures would reduce the effectiveness of photographing animals at night. High quality digital camera traps that could retain very high numbers of photos would be technically feasible but could be cost-prohibitive.
Eucalyptus forests in the Presidio are not a native habitat type and are structurally very different from the other vegetation communities. We often radio-tracked animals to forested areas, which may offer secluded resting sites for carnivores; much of our radio-tracking was during the daytime for species that had primarily nocturnal and crepuscular activity patterns. The native vegetation classes of dunescrub, wetland, and native grass in our landcover map and the exotic vegetation represented only small proportions of the Presidio’s area. Furthermore, exotic, wetland, native grassland vegetation all had very patchy distributions. If the association of wildlife species with native vs. non-native habitats is desired information, then the design of future research should take into account the distribution properties of these habitats and the properties of animal home ranges found in this study.
Under any field conditions, physical capture (trapping) and radio-collaring are labor intensive methods that require specialized skills and equipment. Working in high profile national parks add additional time and logistical challenges, and this was further complicated in the Presidio due to the numbers of people present at all hours. It was not difficult to operate box traps discreetly, and non-target species were not a problem with box trapping. Non-targets also were not a problem in snare trapping but we took extraordinary precautions to avoid them and abided by extensive strict permitting requirements. Attempting to capture elusive and trap-wary canid species in areas where unleashed pets may be present is particularly difficult. The more flexibility that managers can allow field workers to chose sites and times for setting coyote traps, the more likely that capture success can come sooner. Thus there is an important trade-off for managers to consider if coyote capture is a priority: a protracted trapping period with traps set under heavy restrictions with lower probability of capturing an off-leash dog or a shortened trapping period with a greater risk of capturing an off-leash dog. Over time, the accumulated risk vs. capture probability may be the same. An alternative approach could be to have a Presidio employee who, in addition to other duties, is fully trained in canid capture techniques and ready to take advantage of good trapping conditions whenever they arise. This person would then be on-site and aware of the areas of highest human activity, current hotspots of canid activity, and be well-connected to other Presidio and NPS employees to be able to share necessary information and request other logistical support.

26
Radio-tracking is also labor-intensive but can yield rich and insightful datasets. Given the time and labor investment involved in capture and tracking, gps-telemetry collars are highly recommended if coyotes are studied in the future. GPS collars would also make it very difficult for a study animal to disappear. Further genetic analyses of tissue samples from animals in the Presidio could provide some of the greatest insights for the least amount of time investment, not only for coyotes but for other carnivore species as well in understanding how the Presidio’s wildlife link to populations outside of its boundaries. Such results help cast the Presidio’s wildlife dynamics into a larger regional context. Even if further genetic analyses are not a priority, archiving tissue samples would be a worthwhile activity. Given the difficulty of gathering information on canid species, any carcasses of these animals found dead in the Presidio should be examined, but at a minimum, tissue should be collected and stored. Tissue samples from a carcass can be a quick snip from an ear or tongue and do not have to be frozen; they can be stored with silica dessicant at room temperature. Employees most likely to encounter or handle dead animals could be equipped with a small collection kit consisting only of a few plastic baggies, a permanent marker for labeling, small scissors, and a few teaspoons of silica dessicant beads.
There is no shortage of literature on the environmental impacts of predation by feral domestic cats and indoor/outdoor house cats (Clarke & Pacin, 2002; Kays & DeWan, 2004; Crooks & Soule, 1999; Calhoon & Haspel, 1989). Decreased biodiversity, particularly of bird species, is also linked to increased populations of raccoons, gray foxes, red foxes, and other species of “mesopredators” but among these species, the relationship has been most clearly demonstrated for domestic cats and raccoons (Crooks & Soule, 1999; Rogers & Caro, 1998). The presence of a top predator such as coyote is associated with depressed populations of mesopredators and increased biodiversity (Crooks & Soule, 1999; Rogers & Caro, 1998). In the Presidio, however, the activity of one or two coyotes may not be sufficient to balance the system if mesopredators are maintained at unnaturally high densities through intentional or unintentional subsidization of their diets. Reducing access to anthropogenic food sources for free-living carnivores is probably one of the best avenues toward maintaining healthy wildlife dynamics in the Presidio. Anthropogenic food sources that can increase populations of skunks, raccoons, and feral domestic cats include garbage and cat feeding stations. Garbage may be utilized more by raccoons than skunks, due to the climbing dexterity of raccoons (Gehrt, 2003; Gehrt, 2004). Feral cat feeding stations are likely to enhance populations of all mesopredators in the Presidio beyond the ecological carrying capacity for this park, as cats and wildlife are attracted to these rich, easy-access, and often highly reliable sources of food (Calhoon & Haspel, 1989; Clarke & Pacin, 2002).

27
Acknowledgements
I thank the Presidio Trust and US Geological Survey Western Ecological Research Center for funding this project. In particular, I thank Terri Thomas of the Presidio Trust for encouraging and supporting this study. I am also grateful to Damien Raffa of the Presidio Trust for his enthusiasm and assistance on many logistical aspects. The National Park Service staff of the Golden Gate National Recreation Area provided logistical support.
USGS employee Jennifer Shulzinski provided critical input into the conception of the project, research methods, and background information. She had primary responsibility for organizing, initiating, and conducting field work, and she also entered and organized much of the data. Furthermore, she provided telemetry training to Presidio Trust staff volunteers. USGS employee Daniel Heffernan gave input into the research design and equipment and also conducted many hours of field work. Sayaka Eda and Stephanie Eckerle completed the field work in 2004, largely on their own. Valuable field assistance during summer 2003 came from Sarah Gudenkauf, and I thank Dr. Elizabeth Capaldi at Bucknell University for arranging Sarah's internship in the GGNRA. It was made possible by the Bucknell University Animal Behavior Fund for Undergraduate Research. I appreciate the participation of San Francisco State University undergraduates Diana Delacalzada and Jamie Nicoloff, who conducted radio-tracking during fall 2003 as volunteers. Other field assistance came from USGS volunteers Andrew Hawthorn, David Heller, Carlos Lopez Gonzalez, and Laine Schreiner.
The contributions of several Presidio Trust Natural Resource employees to the radio-tracking dataset is very much appreciated, and I wish I could recognize all their individual efforts and hours of service. Also, I appreciate the many Presidio employees and residents who took the time to note their wildlife sightings in the Presidio. I appreciate the cooperation of staff at the Presidio Golf Course for facilitated after-hours access for trapping, tracking. Dairen Simpson led the field component of snare trapping and gave tremendous guidance into identifying field sign of carnivores and understanding human-carnivore interactions. Ben Sacks and Holly Ernest of the Wildlife Research Unit of the Veterinary Genetics Laboratory in the UC Davis School of Veterinary Medicine analyzed coyote tissue samples and helped seek further samples for genetic analyses. Craig Scott from NPS provided GIS assistance and digital coverages of the Presidio. I wish to thank Karen Cantwell for here help. Bruce Badzik from NPS shared equipment, capture advice, and valuable observations on Presidio wildlife spanning more than a decade. Nancy Damar, Keith Halford, and Randy Laczniak of USGS Water Resource Discipline brought me out of the Dark Ages of word processing, and provided advice and training in formatting and converting maps and graphs for more elegant printing.

28
Scat detection surveys were designed and conducted by Working Dogs for Conservation (website: http://www.workingdogsforconservation.org/; contact information: Working Dogs for Conservation, 140 Shultz Lane, Bozeman, Montana 59718 . The dog handlers in the field were Deborah A. Smith and Alice Whitelaw, and the detection dog was Rio. They all helped show how to perceive the world through a carnivore’s senses.

29
Literature Cited
Altmann, J. 1974. Observational study of behavior: sampling methods. Behaviour, 49, 227-267. Buskirk, S. W. 1999. Mesocarnivores of Yellowstone. In: Carnivore in ecosystems: The
Yellowstone experience (Ed. by Clark, T. W., Curlee, A. P., Minta, S. C. & Kareiva, P.), pp. 165-188. New Haven: Yale University Press.
Calhoon, R. E. & Haspel, C. 1989. Urban cat populations compared by season, subhabitat and
supplemental feeding. Journal of Animal Ecology, 58, 321-328. Clarke, A. L. & Pacin, T. 2002. Domestic cat "colonies" in natural areas: a growing exotic species
threat. Natural Areas Journal, 22, 154-159. Crooks, K. R. 2002. Relative sensitivities of mammalian carnivores to habitat fragmentation.
Conservation Biology, 16, 488-502. Crooks, K. R. & Soule, M. 1999. Mesopredator release and avifaunal extinctions in a fragmented
system. Nature, 400, 563-566. Dean, E. E. 1979. Training of dogs to detect black-footed ferrets. Sante Fe, New Mexico:
Southwestern Research Institute. Ewer, R. F. 1973. The carnivores. Ithaca, New York: Cornell University Press. Fritzell, E. K. 1978a. Aspects of raccoon (Procyon lotor) social organization. Canadian Journal of
Zoology, 56, 260-271. Fritzell, E. K. 1978b. Habitat use by prairie raccoons during the waterfowl breeding season.
Journal of Wildlife Management, 42, 118-127. Gardner, A. L. 1982. Virginia opossum. In: Wild Mammals of North America: Biology,
Management, and Economics (Ed. by Chapman, J. A. & Feldhamer, G. A.), pp. 3-36. Baltimore, MD: Johns Hopkins University Press.
Garshelis, D. L. 2000. Delusions in habitat evaluation: measuring use, selection, and importance.
In: Research techniques in animal ecology: controversies and consequences (Ed. by Boitani, L. & Fuller, T. K.), pp. 111-164. New York: Columbia University Press.
Gehrt, S. D. 2003. Raccoons (Procyon lotor and Allies). In: Wild Mammals of North America:
Biology, Management and Conservation, 2nd Edition (Ed. by Feldhamer, G. A., Thompson, B. C. & Chapman, J. A.), pp. 611-634. Baltimore, MD: Johns Hopkins University Press.
Gehrt, S. D. 2004. Ecology and management of striped skunks, raccoons, and coyotes in urban
landscapes. In: People and predators: from conflict to coexistence (Ed. by Fascione, N., Delach, A. & Smith, M. E.), pp. 81-104. Washington, DC: Island Press.
Gehrt, S. D. & Fritzell, E. K. 1998. Resource distribution, female home range dispersion and male
spatial interactions: group structure in a solitary carnivore. Animal Behaviour, 55, 1211-1227.

30
Ginger, S. M., Hellgren, E. M., Kasparian, M. A., Levesque, L. P., Engle, D. M. & Leslie Jr., D. M. 2003. Niche shift by Virginia opossum following reduction of a putative competitor, the raccoon. Journal of Mammalogy, 84, 1279-1291.
Gittleman, J. L., Funk, S. M., Macdonald, D. W. & Wayne, R. K. 2001. Why 'carnivore
conservation'? In: Carnivore Conservation (Ed. by Gittleman, J. L., Funk, S. M., Macdonald, D. W. & Wayne, R. K.), pp. 1-7. Cambridge: Cambridge University Press.
Godin, A. J. 1982. Striped and hooded skunks. In: Wild Mammals of North America: Biology,
Management, and Economics (Ed. by Chapman, J. A. & Feldhamer, G. A.), pp. 674-687. Baltimore, MD: Johns Hopkins University Press.
Greenwood, P. J. 1980. Mating systems, philopatry and dispersal in birds and mammals. Animal
Behaviour, 28, 1140-1162. Grinder, M. I. & Krausman, P. R. 2001. Home range, habitat use, and nocturnal activity of coyotes
in an urban environment. Journal of Wildlife Management, 65, 887-898. Hayne, D. W. 1949. Calculation of size of home range. Journal of Mammalogy, 30, 1-18. Hilty, J. A. & Merenlender, A. M. 2004. Use of riparian corridors and vineyards by mammalian
predators in northern California. Conservation Biology, 18, 126-135. Hooge, P. N. & Eichenlaub, B. 1997. Animal movement extension to ArcView. ver. 1.1.
Anchorage, Alaska: U.S. Geological Survey. Jameson, E. W., Jr. & Peeters, H. J. 1988. California mammals. Berkeley: University of California
Press. Judson, J. J., Clark, W. R. & Andrews, R. D. 1994. Post-natal survival of raccoons in relation to
female age and denning behavior. Journal of Iowa Academy of Science, 101, 24-27. Kays, R. W. & DeWan, A. A. 2004. Ecological impact of inside/outside house cats around a
suburban nature preserve. Animal Conservation, 7, 273-283. Kreeger, T. J., Arnemo, J. M. & Raath, J. P. 2002. Handbook of wildlife chemical immobilization:
international edition. Fort Collins, CO: Wildlife Pharmaceuticals, Inc. Lariviere, S., Walton, L. R. & Messier, F. 1999. Selection by striped skunks (Mephitis mephitis) of
farmsteads and buildings as denning sites. American Midland Naturalist, 142, 96-101. Lewis, J. C., Sallee, K. L. & Golightly, R. T., Jr. 1999. Introduction and range expansion of
nonnative red foxes (Vulpes vulpes) in California. American Midland Naturalist, 142, 372-381.
Lidicker, W. Z. 1975. The role of dispersal in the demography of small mammals. In: Small
Mammals: Their Productivity and Population Dynamics (Ed. by Golley, F. B., Petrusewicz, K. & Ryszkowski, L.), pp. 103-128. London: Cambridge University Press.
Lingle, S. 2000. Seasonal variation in coyote feeding behaviour and mortality of white-tailed deer
and mule deer. Canadian Journal of Zoology, 78, 85-99. Linnell, J. D. C., Swenson, J. E. & Anderson, R. 2001. Predators and people: conservation of
large carnivores is possible at high human densities if management policy is favourable. Animal Conservation, 4, 345-349.

31
López González, C. A., Hidalgo-Mihart, M. G. & Cantu-Salazar, L. 2000. Management and conservation of the carnivore community of Chamela, Jalisco. Technical Report. In: Earthwatch Technical Report, pp. 36. Boston, MA: Earthwatch.
Manly, B. F. J., McDonald, L. L. & Thomas, D. L. 1993. Resource selection by animals: Statistical
design and analysis for field studies. London: Chapman & Hall. Mohr, C. O. 1947. Table of equivalent populations of North American small mammals. American
Midland Naturalist, 37, 223-249. Oftedal, O. T. & Gittleman, J. L. Patterns of energy output during reproduction in carnivores. In:
Carnivore behavior, ecology, and evolution, vol. 1 (Ed. by Gittleman, J. L.), pp. 355-378. Ithaca, New York: Cornell University.
Parks, S. A. & Harcourt, A. H. 2002. Reserve size, local human density, and mammalian
extinctions in U.S. protected areas. Conservation Biology, 16, 800-808. Quinn, T. 1995. Using public sighting information to investigate coyote use of urban habitat.
Journal of Wildlife Management, 59, 238-245. Quinn, T. W. 1997. Coyote (Canis latrans) habitat selection in urban areas of western
Washington via analysis of routine movement. Northwest Science, 71, 289-297. Ralls, K. & White, P. J. 1995. Predation on San Joaquin kit foxes by larger canids. Journal of
Mammalogy, 76, 723-729. Rogers, C. M. & Caro, M. J. 1998. Song sparrows, top carnivores and nest predation: a test of the
mesopredator release hypothesis. Oecologia, 116, 227-233. Sacks, B. N., Brown, S. K. & Ernest, H. B. 2004. Population structure of California coyotes
corresponds to habitat-specific breaks and illuminates species history. Molecular Ecology, 13, 1265-1275.
Samuel, D. E. & Nelson, B. B. 1982. Foxes. In: Wild Mammals of North America: Biology,
Management, and Economics (Ed. by Chapman, J. A. & Feldhamer, G. A.), pp. 475-490. Baltimore, MD: Johns Hopkins University Press.
Sanchez, D. M., Krausman, P. R., Livingston, T. R. & Gipson, P. S. 2004. Persistence of
carnivore scat in the Sonoran Desert. Wildlife Society Bulletin, 32, 366-372. Smith, D. A., Ralls, K., Cypher, B. L., Clark, H. O., Kelly, P. A., Williams, D. F. & Maldonado, J. E.
In Review. Distributon and relative abundance of San Joaquin kit foxes using scat-detection dog surveys.
Smith, D. A., Ralls, K., Cypher, B. L. & Maldonado, J. E. In Press. Assessment of scat detection
dog surveys to determine kit fox distribution. Wildlife Society Bulletin. Smith, D. A., Ralls, K., Davenport, B., Adams, B. & Maldonado, J. E. 2001. Canine assistants for
conservationists. Science, 291, 435. Smith, D. A., Ralls, K., Hurt, A., Parker, M., Davenport, B., Smith, M. C. & Maldonado, J. E. 2003.
Detection and accuracy rates of dogs trained to find scats of San Joaquin kit foxes (Vulpes macrotis mutica). Animal Conservation, 6, 339-346.
Smith, H. T. & Engeman, R. M. 2002. An extraordinary raccoon, Procyon lotor, density at an
urban park. Canadian Field-Naturalist, 116, 636-639.

32
Storm, G. L. 1972. Daytime retreats and movements of skunks on farmlands in Illinois. Journal of
Wildlife Management, 36, 31-45. Swihart, R. K. & Slade, N. A. 1985. Testing for independence of observations in animal
movements. Ecology, 66, 1176-1184. Tigas, L. A., Van Vuren, D. H. & Sauvajot, R. M. 2002. Behavioral responses of bobcats and
coyotes to habitat fragmentation and corridors in an urban environment. Biological Conservation, 108, 299-306.
Wikramanayake, E. D., Dinerstein, E., Robinson, J. G., Karanth, K. U., Rabinowitz, A., Olson, D.,
Mathew, T., Hedao, P., Conner, M., Hemley, G. & Bolze, D. 1998. An ecology-based method for defining priorities for large mammal conservation: The tiger as case study. Conservation Biology, 12, 865-878.
Winter, W. 1981. Black-footed ferret search dogs. Sante Fe, New Mexico: Southwestern
Research Institute. Woodroffe, R. & Ginsberg, J. R. 1998. Edge effects and the extinction of populations inside
protected areas. Science, 280, 2126-2128. Woodroffe, R. & Ginsberg, J. R. 2000. Ranging behaviour and vulnerability to extinction in
carnivores. In: Behaviour and Conservation (Ed. by Gosling, L. M. & Sutherland, W. J.), pp. 125-140. Cambridge, United Kingdom: Cambridge University Press.
Zielinski, W. J. & Kucera, T. E. 1995. Introduction to detection and survey methods. In: American
Marten, Fisher, Lynx, and Wolverine: Survey Methods for Their Detection (Ed. by Zielinski, W. J. & Kucera, T. E.), pp. 1-15. Albany, California: USDA Forest Service.
Zielinski, W. J., Kucera, T. E. & Halfpenny, J. C. 1995. Definition and distribution of sample units.
In: American Marten, Fisher, Lynx, and Wolverine: Survey Methods for Their Detection (Ed. by Zielinski, W. J. & Kucera, T. E.), pp. 17-24. Albany, California: USDA Forest Service.

33
Table 1. Area (ha) and percent area occupied by each of 7 landcover classes. "Exotic" was non-native, shrub vegetation and did not include forest, which was primarily eucalyptus. Landcover class area (ha) % total areadunescrub 66 11%exotic 63 11%forest 213 36%landscaped 98 16%native grass 6 1%urban 138 23%wetland 14 2%

34
Table 2. Photographic detections and indices for carnivore species in each of seven zones and for the Presidio as a whole. Totals at bottom are total number of detections for each species divided by the total number of trapnights. Numbers in parentheses tally the number of different zones in which a species was photographed. Zone # Trapnights Species detected # Detections Camera index
1 59 coyote 4 6.8 domestic cat 2 3.4 raccoon 2 3.4 2 61 raccoon 5 8.2 red fox 1 1.6 striped skunk 5 8.2 3 65 coyote 2 3.1 domestic cat 3 4.6 raccoon 4 6.2 red fox 3 4.6
4 52 raccoon 19 36.5 red fox 1 1.9 5 60 coyote 2 3.3 domestic cat 3 5.0
6 145 coyote 1 0.7 domestic cat 1 0.7 raccoon 20 13.8 red fox 3 2.1 striped skunk 5 3.5 7 92 raccoon 3 3.3 red fox 1 1.1
Total 534 coyote (4) 9 1.7 domestic cat (4) 9 1.7 gray fox (0) 0 - opossum (0) 0 - raccoon (6) 53 9.9 red fox (5) 9 1.7 striped skunk (2) 10 1.9
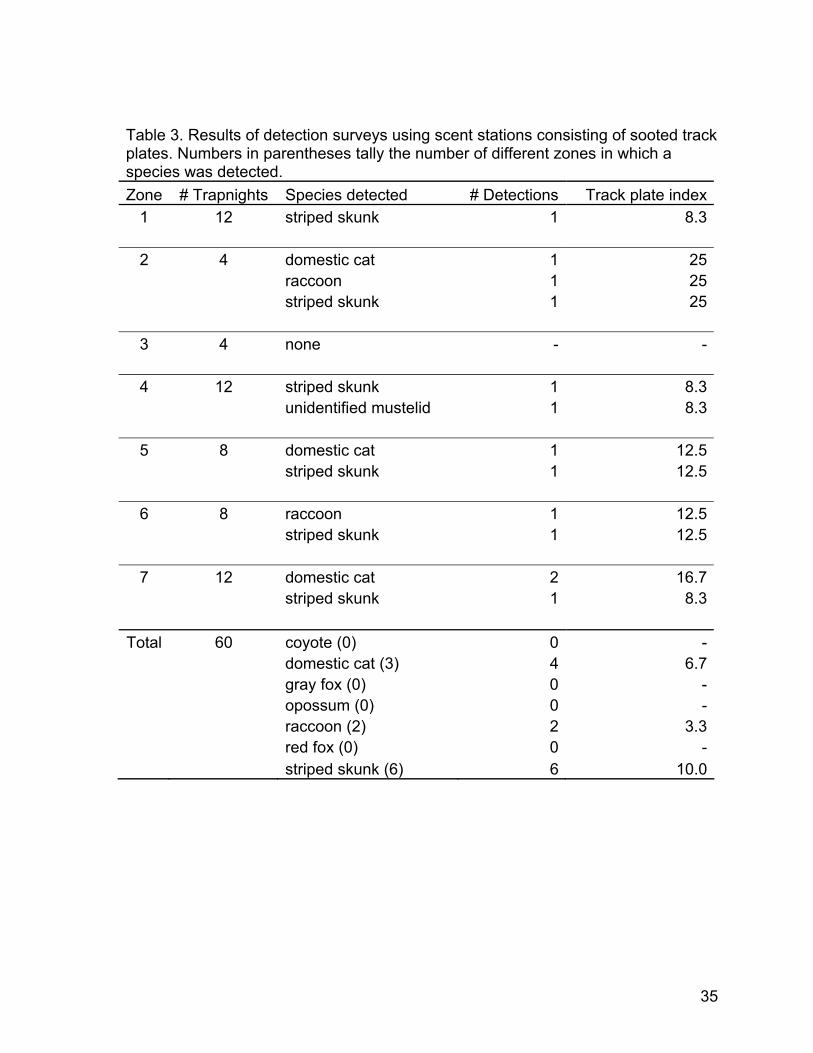
35
Table 3. Results of detection surveys using scent stations consisting of sooted track plates. Numbers in parentheses tally the number of different zones in which a species was detected. Zone # Trapnights Species detected # Detections Track plate index
1 12 striped skunk 1 8.3 2 4 domestic cat 1 25 raccoon 1 25 striped skunk 1 25 3 4 none - - 4 12 striped skunk 1 8.3 unidentified mustelid 1 8.3 5 8 domestic cat 1 12.5 striped skunk 1 12.5 6 8 raccoon 1 12.5 striped skunk 1 12.5 7 12 domestic cat 2 16.7 striped skunk 1 8.3
Total 60 coyote (0) 0 - domestic cat (3) 4 6.7 gray fox (0) 0 - opossum (0) 0 - raccoon (2) 2 3.3 red fox (0) 0 - striped skunk (6) 6 10.0

36
Table 4. Number of animals captured in the Presidio. One non-target was captured (a roof rat in a box trap) and released.
Trap Type
# trap sites
# trap-
nights coyote domestic
cat gray fox
rac- coon
red fox
striped skunk
opos- sum all
Box 57 272 0 4 0 22 1 30 1 58 Foot Snare 12 34 1 0 0 1 0 0 0 2
Neck Snare 15 58 0 0 0 0 1 0 0 1
Totals 84 364 1 4 0 23 2 30 1 61

37
Table 5. Capture numbers and trap indices for carnivore species in each of seven zones and for the Presidio as a whole. Numbers in parentheses tally the number of different zones in which a species was captured using box traps. Zone Trap type # Trapnights Species detected # Captures Trap index
1 box 37 raccoon 6 16.2
striped skunk 3 8.1
foot snare 32 coyote 1 3.1
raccoon 1 3.1
neck snare 30 none - -
2 box 6 striped skunk 2 33.3
3 box 17 domestic cat 1 5.9
raccoon 4 23.5
neck snare 14 none - -
4 box 98 opossum 1 1.0
raccoon 7 7.1
red fox 1 1.0
striped skunk 7 7.1
foot snare 2 red fox 1 50.0
neck snare 3 none - -
5 box 36 raccoon 3 8.3
rat 1 2.8
striped skunk 4 11.1
6 box 51 domestic cat 1 2.0
raccoon 2 3.9
striped skunk 10 19.6
neck snare 11 none - -
7 box 27 domestic cat 2 7.4
striped skunk 4 14.8
Total box 272 domestic cat (3) 4 1.5
opossum (1) 1 0.4
raccoon (5) 22 8.1
red fox (1) 1 0.4
striped skunk (6) 30 11.0
all snares 92 coyote 1 1.1
raccoon 1 1.1
red fox 1 1.1

38
Table 6. Body measurements (± SD) of animals captured in the Presidio. Total numbers of animals handled are presented in column "n". Samples sizes, when different from the total number of animals handled, are presented beneath measurements.
n Weight (kg)
Body length (cm)
Tail length (cm)
Hindfoot length (cm)
coyote 1 14.0 89 36 19
domestic cat 4 4.5 ± 0.2 58 ± 3 30 ± 3 13 ± 1
opossum 1 2.1 46 35 6
raccoon 7 7.3 ± 1.3 61 ± 4 (n = 6)
26 ± 7 11 ± 0.5
red fox (adult male)
1 5.4 69 39 16
red fox (juvenile female)
1 3.0 54 32 14
striped skunk 10 2.2 ± 1.2 (n = 9)
39 ± 7 (n = 9)
25 ± 2 6 ± 0.5

39
Table 7. Numbers of opportunistic sightings of carnivores and opossums in the Presidio for three 6-month time periods. Dates of gray fox reports are included underneath these sightings. a. October 2002 through April 2003. species zone 1 zone 2 zone 3 zone 4 zone 5 zone 6 zone 7 Total coyote 25 5 5 1 9 45domestic cat 1 2 2 4 9gray fox 1 1 2 3/4/03 2/28/03 raccoon 1 1 2red fox 1 1 3 2 2 9striped skunk 2 2
b. May 2003 through November 2003. species zone 1 zone 2 zone 3 zone 4 zone 5 zone 6 zone 7 Total coyote 18 2 3 4 1 3 31 domestic cat 2 2 1 1 6 gray fox 0 opossum 1 1 raccoon 3 3 6 red fox 1 2 1 4 striped skunk 2 2 4 8
c. December 2003 through May 2004. species zone 1 zone 2 zone 3 zone 4 zone 5 zone 6 zone 7 Total coyote 2 1 2 5domestic cat 2 2gray fox 1 1 2 2/2/04 4/15/04 raccoon 1 1 2 4red fox 2 1 2 2 7striped skunk 3 4 7

40
Table 8a. Numbers of detections in the Presidio for each species using camera traps, track plates, and trapping using box traps and snares.
Camera Box Snare Track plate Totalcoyote 9 0 1 0 10 domestic cat 9 4 0 4 17 gray fox 0 0 0 0 0 opossum 0 1 0 0 1 raccoon 53 22 1 2 78 red fox 9 1 1 0 11 striped skunk 10 30 0 6 46
Table 8b. Numbers of trapnights per zone for each method used in the Presidio.
Camera Box Snare Track plate Totalzone 1 59 37 62 12 170 zone 2 61 6 4 71 zone 3 65 17 14 4 100 zone 4 52 98 5 12 167 zone 5 60 36 8 104 zone 6 145 51 11 8 215 zone 7 92 27 12 131
Total 534 272 92 60 958

41
Table 9. Comparison of three survey methods and opportunistic sightings in the Presidio ("+" at least one detection or one sighting was reported; "-" no detections or sightings; "n/a" method could not have yielded a detection for that species). species cameras track plates traps sightings zone 1 coyote + - + + dom. cat + - - + gray fox - - - - opossum - - - - raccoon + - + + red fox - - - - str. skunk - + + + zone 2 coyote - - - - dom. cat - + - - gray fox - - - - opossum - - - - raccoon + + - + red fox + - - + str. skunk + + + + zone 3 coyote + - - + dom. cat + - + + gray fox - - - - opossum - - - - raccoon + - + + red fox + - - + str. skunk - - - + zone 4 coyote - - - + dom. cat - - - - gray fox - - - - opossum - - + + raccoon + - + + red fox + - + + str. skunk - + + - zone 5 coyote + - n/a + dom. cat + + - + gray fox - - - + opossum - - - - raccoon - - + - red fox - - - + str. skunk - + + -

42
Table 9. continued— zone 6 coyote + - - + dom. cat + - + - gray fox - - - + opossum - - - - raccoon + + + - red fox + - - + str. skunk + + + - zone 7 coyote - - n/a + dom. cat - + + + gray fox - - - - opossum - - - - raccoon + - - - red fox + - - - str. skunk - + + -

43
Table 10. The percent of landcover for each of seven landcover types within each of the seven zones in the Presidio. A small percent of each zone was not classified by landcover type.
Dunescrub Exotic ForestLand-
scaped Native grass Urban Wetland Total
zone 1 1 13 46 14 2 21 1 98% zone 2 12 6 7 17 0 50 7 99% zone 3 0 13 51 22 2 9 0 97% zone 4 9 11 31 24 0 24 0 99% zone 5 22 8 27 14 1 26 0 98% zone 6 21 10 46 8 1 13 0 99% zone 7 12 11 37 14 1 18 7 100%

44
Table 11a. Sizes of home ranges as measured by Minimum Convex Polygons (MCP) for radio-collared animals in the Presidio with more than five locations.
Species Individual ID
Sex # Months tracked
# Locations MCP size (ha)
coyote SID m 0.2 3 domestic cat CAP m 1.8 12 8.2 CAR f 8.7 37 14.5 CHE m 8.3 41 67.4
opossum OLI f 7 42 7.9
raccoon RIP m 3.8 14 9.7 REB f 8.2 31 14.7 RAP f 10.8 60 16.3 REN f 7.4 42 20.8 RUD f 6.8 39 24.2 ROS f 10.7 59 33.3 ROC m 10.8 57 39.6
red fox FRE m 13 118 278.7
striped skunk SCA f 0.2 4 SUM m 2.6 4 SIN m 6.4 23 8.4 SAG f 0.9 8 14.8 SKY f 2 8 20.5 SCU f 9 22 27.6 SEL f 9 33 28.7 SOC m 4.2 17 51.7 Table 11b. Species averages (± SD) for home range size and the number of locations per radio-collared individual in the Presidio. Only individuals with more than 20 locations were included.
n Average MCP size (ha) Average # Locations
domestic cat 2 41.0 ± 37.4 39 ± 3
opossum 1 7.9 42
raccoon 6 24.8 ± 9.8 48 ± 12 red fox 1 278.7 118 striped skunk 3 21.6 ± 11.4 26 ± 6

45
Table 12. Area (ha) and percent area occupied by each of four landcover classes in the Presidio. The class "other vegetation" consisted of exotic and native shrub (non-forest) vegetation. Landcover class area (ha) % total area forest 213 36% landscaped 98 16%
other vegetation (dunescrub, exotic, native grass, wetland) 149 25%
urban 138 23%
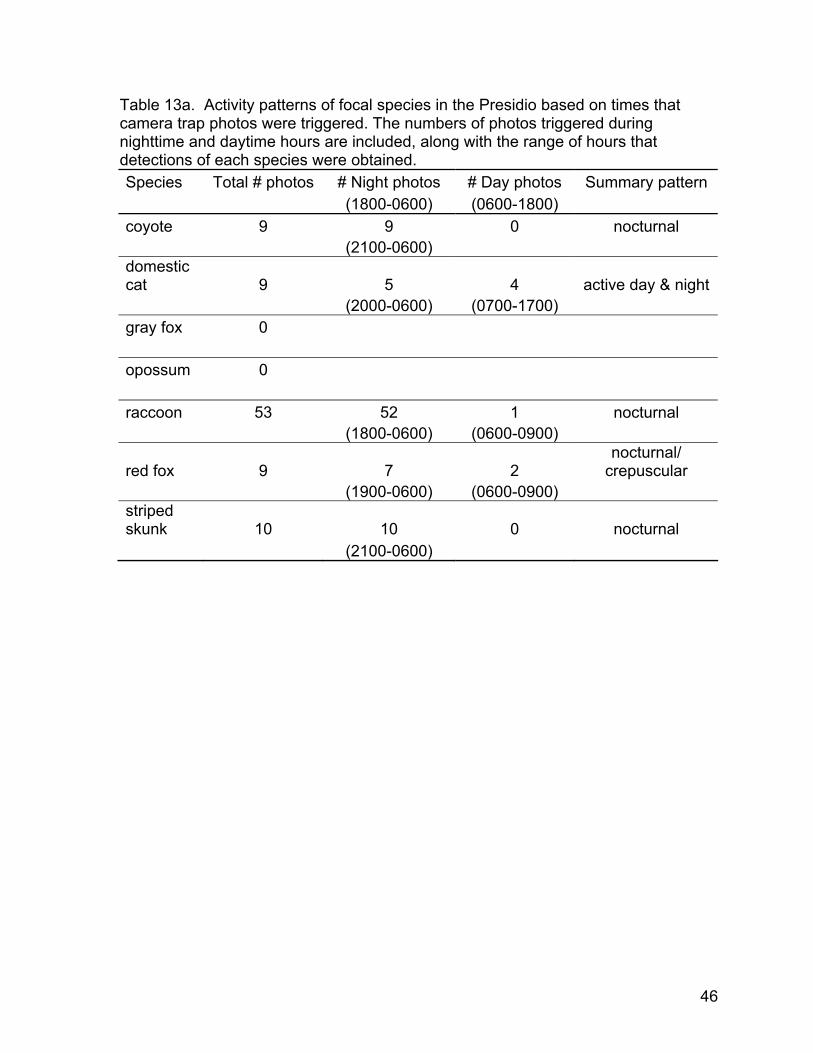
46
Table 13a. Activity patterns of focal species in the Presidio based on times that camera trap photos were triggered. The numbers of photos triggered during nighttime and daytime hours are included, along with the range of hours that detections of each species were obtained. Species Total # photos # Night photos # Day photos Summary pattern (1800-0600) (0600-1800) coyote 9 9 0 nocturnal (2100-0600) domestic cat 9 5 4 active day & night (2000-0600) (0700-1700) gray fox 0 opossum 0 raccoon 53 52 1 nocturnal (1800-0600) (0600-0900)
red fox 9 7 2 nocturnal/
crepuscular (1900-0600) (0600-0900) striped skunk 10 10 0 nocturnal (2100-0600)

47
Table 13b. Activity patterns of focal species in the Presidio assumed from sightings reports collected from October 2002 through May 2004. Only sightings for which time of day was recorded were included. Species Total # reports # Night reports # Day reports Summary pattern (1800-0600) (0600-1800) coyote 51 28 23 active day & night domestic cat 17 3 14 diurnal
(before 1900 & after 0500)
gray fox 2 2 opossum 1 1 raccoon 12 10 2 nocturnal (0600-0800)
red fox 16 10 6 nocturnal/
crepuscular
(before 0800 &
after 1700) striped skunk 16 12 4 nocturnal
(before 0800 &
after 1700)

48
Figure 1. Location of the Presidio in the San Francisco Bay Area. Lands shown in solid black are part of the Golden Gate National Recreation Area.

49
Figure 2. Presidio habitats and landscape features were classified into a single GIS landcover coverage with seven basic cover types.

50
Figure 3. The Presidio was divided into seven sampling units or zones, shown here with number labels. A large portion of zone 3 was a golf course. Zone 2 was mostly offices and a large construction site. Zones 1, 5, and 7 contained large residential areas. A military cemetery was centrally located in zone 4.

51
Figure 4. For analyses of habitat associations, Presidio habitats and landscape features were classified into a single GIS landcover coverage with four landcover types. Zones are shown for reference.
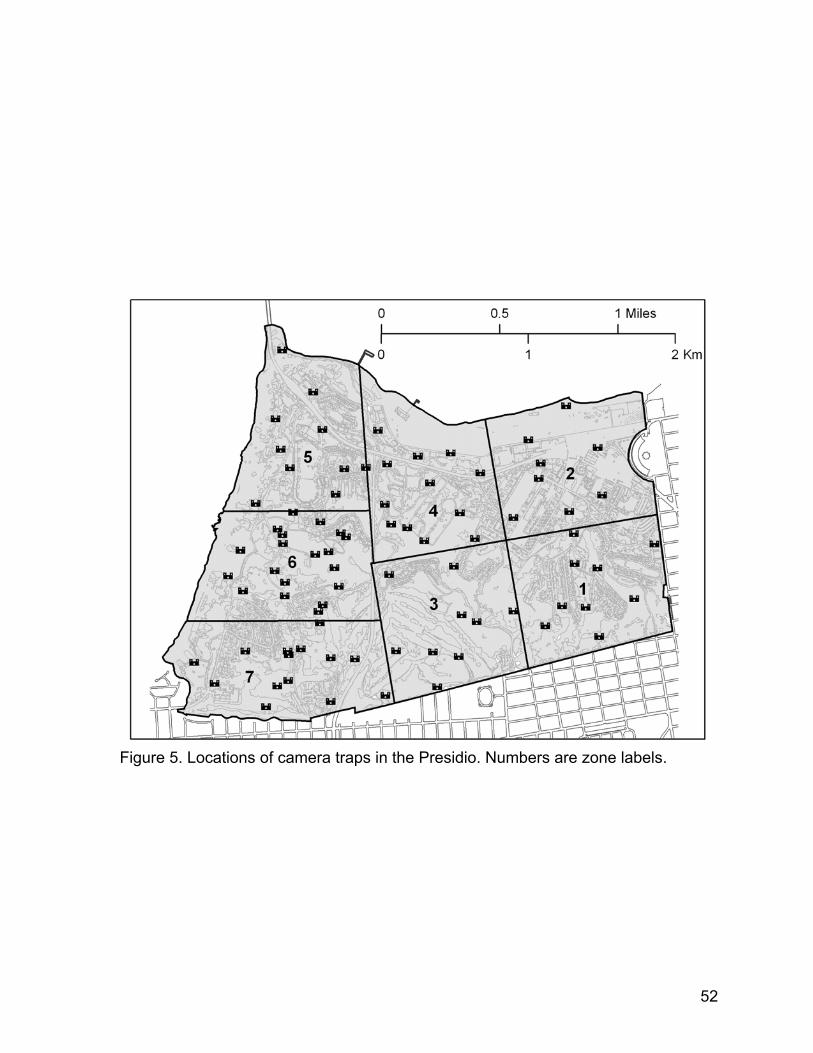
52
Figure 5. Locations of camera traps in the Presidio. Numbers are zone labels.

53
Figure 6. Sample photographs from camera trap photos in the Presidio, including a) a coyote b) a domestic cat c) a pair of raccoons d) a red fox e) a striped skunk. No opossums were photographed by camera traps; the picture here is of the radio-collared opossum just prior to releasing her. Camera trap photos g) of dogs and h) a cyclist show use of a trail by people and pets. The camera trap photo in (i) and (j) show i) a person walking dogs in the daytime on a trail that was used by j) a coyote at night.

54
Figure 6 continued—
a.
b.

55
Figure 6 continued—
c.
d.
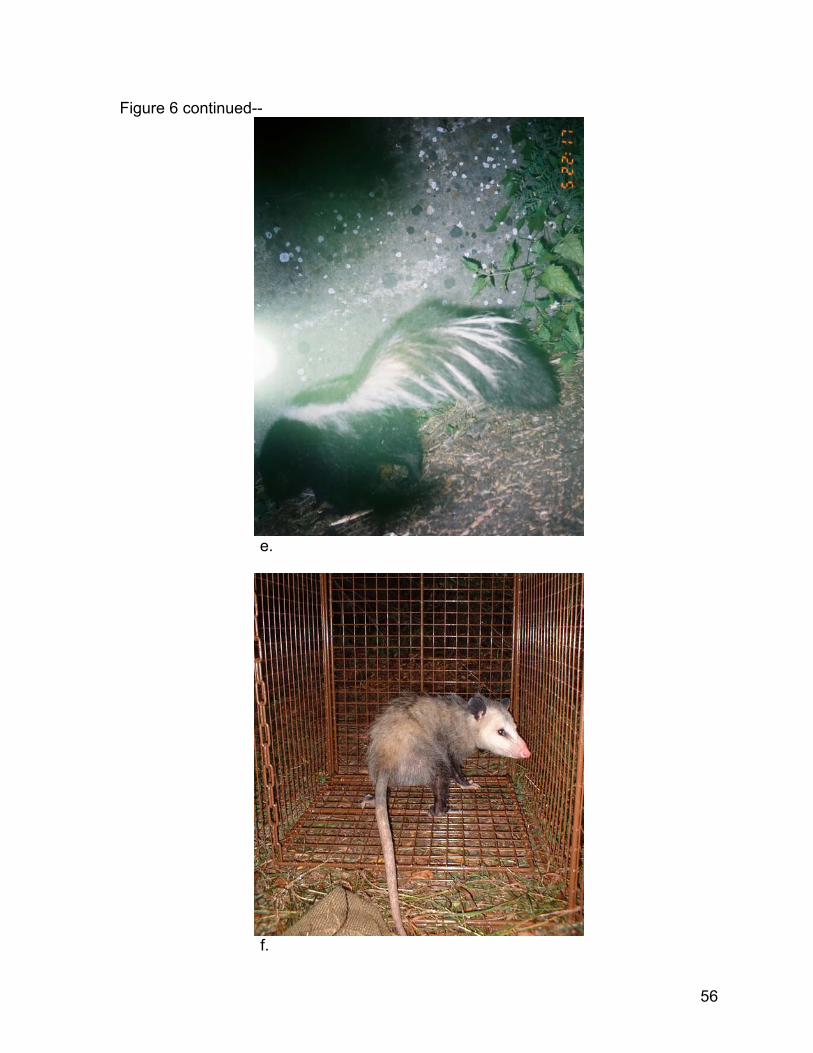
56
Figure 6 continued--
e.
f.

57
Figure 6 continued-- g. h.
i.
j.

58
0
1
2
3
4
5
6
0 100 200 300 400 500 600 700# Trapnights
Cum
ulat
ive
# sp
ecie
s de
tect
ed
Figure 7. The cumulative number of carnivore species detected over consecutive trapnights shows that five species were detected after 201 trapnights in the Presidio and no more were detected through the 534 trapnights total. From a logarithmic curve (dashed line) fitted to these data, it appears that a few hundred more trapnights would be necessary to detect a sixth species.

59
Figure 8. Locations of track plate stations in the Presidio. Numbers are zone labels.

60
Figure 9. Transects surveyed in the Presidio using a scat detection dog. Numbers are zone labels.

61
Figure 10. Locations of snares (filled circles) and box traps (open squares) in the Presidio. Numbers are zone labels.

62
0
1
2
3
4
5
6
7
0 100 200 300 400 500# Trapnights
Cum
ulat
ive
# sp
ecie
s
Figure 11. The cumulative number of carnivore species detected in the Presidio over consecutive trapnights with a logarithmic curve (dashed line) fitted to the data.

63
Figure 12. Striped skunks in the Presidio appeared sexually dimorphic in body weight but raccoons did not. Numbers over bars indicate sample sizes. Error bars are standard deviations.

64
Figure 13. Map of coyote sightings reported in the Presidio from October 2002 through May 2003 (solid circles) and locations of camera trap detections of coyotes (open squares). Numbers are zone labels.

65
0.0
2.0
4.0
6.0
8.0
10.0
12.0
coyote domestic cat opossum raccoon red fox striped skunk
Inde
x
Camera
Box
Snare
Track plate
Figure 14. Comparison of detection indices for each method used in the Presidio. No gray foxes were detected with these methods.

66
Figure 15. Relationship between the home range size (log MCP) and numbers of locations per radio-collared individual in the Presidio. Points are labeled by species: C = domestic cat, O = opossum, R = raccoon, RF = red fox, S = striped skunk. A vertical line at 20 locations separates MCP data for which fewer than 20 locations were obtained from those calculated based on more than 20 locations.

67
Figure 16. Relationship between body weights of radio-collared animals and home range size (log MCP) for animals for which more than 20 locations were obtained in the Presidio. Points are labeled by species: C = domestic cat, O = opossum, R = raccoon, RF = red fox, S = striped skunk.

68
Figure 17. Locations in the Presidio of radio-collared cats (solid symbols: female cat—solid circles, two males—solid squares) and an opossum (open circles) with MCP outlines. Numbers in parentheses inside of MCPs indicate the number of locations obtained for that individual.

69
Figure 18. Locations of radio-collared raccoons and MCP outlines for male (squares) and female raccoons (circles) in the Presidio. Numbers in parentheses inside of MCPs indicate the number of locations obtained for that individual.

70
Figure 19. Locations in the Presidio for a radio-collared male red fox, divided into time periods with 29-30 locations each. The size of the MCP was not simply a result of the large number of observations or the length of time that the fox was radio-tracked.

71
Figure 20. Locations of radio-collared striped skunks in the Presidio and MCP outlines for male (squares) and female raccoons (circles). Points outside of MCPs are for one male skunk and one female skunk for which fewer than five locations were obtained. Numbers in parentheses inside of MCPs indicate the number of locations obtained for that individual.

72
Figure 21. (a) Landcover associations based on locations of radio-collared individuals in the Presidio, measured using the Manly-Chesson Index, for domestic cats (car, che), a red fox (fre), an opossum (oli), 6 raccoons (rap, reb, ren, roc, ros, rud), and 3 striped skunks (scu, sel, sin). (b) Average landcover composition of MCP home ranges for each species. Numbers in parenthesis indicate sample sizes of radio-collared individuals per species. Error bars show standard deviation from the mean.

73
Figure 22. (a) Landcover composition of MCP home ranges of radio-collared individuals in the Presidio, measured using the Manly-Chesson Index, for 2 domestic cats (car, che), a red fox (fre), an opossum (oli), 6 raccoons (rap, reb, ren, roc, ros, rud), and 3 striped skunks (scu, sel, sin). (b) Average landcover composition of MCP home ranges for each species. Numbers in parenthesis indicate sample sizes of radio-collared individuals per species. Error bars show standard deviation from the mean.

74
a. Domestic cat
0.0
0.2
0.4
0.6
0.8
1.0
h040
0h0
500h0
600h0
700h0
800h0
900h1
000h1
100h1
200h1
300h1
400h1
500h1
600h1
700h1
800h1
900h2
000h2
100
Rel
ativ
e fre
quen
cy
night to dawn dusk to nightdaytime
b. Opossum
0.0
0.2
0.4
0.6
0.8
1.0
h040
0h0
500h0
600h0
700h08
00h09
00h10
00h1
100h1
200h1
300h1
400h1
500h1
600h1
700h1
800h1
900h2
000h2
100
Rel
ativ
e fre
quen
cy
night to dawn dusk to nightdaytime
Figure 23. For each hour during which FAS data were collected in the Presidio, the relative frequency of active (open bars) to inactive periods (solid bars) were compared for five species. FAS samples sizes were a total of (a) 38 FAS conducted on 3 different cats, (b) 17 FAS on the single radio-collared opossum, (c) 163 FAS on 7 raccoons, (d) 47 FAS on 1 red fox, and (e) 48 FAS on 6 raccoons.

75
Figure 23. continued--
c. Raccoon
0.0
0.2
0.4
0.6
0.8
1.0
h040
0h0
500h0
600h0
700h0
800h0
900h1
000h1
100h1
200h1
300h1
400h1
500h1
600h1
700h18
00h1
900h2
000h2
100
Rel
ativ
e fre
quen
cy
night to dawn dusk to nightdaytime
d. Red fox
0.0
0.2
0.4
0.6
0.8
1.0
h040
0h0
500
h060
0h0
700
h080
0h0
900
h1000
h1100
h120
0h1
300
h1400
h150
0h1
600
h170
0h1
800
h190
0h2
000
h210
0
Rel
ativ
e fre
quen
cy
night to daw n dusk to nightdaytime
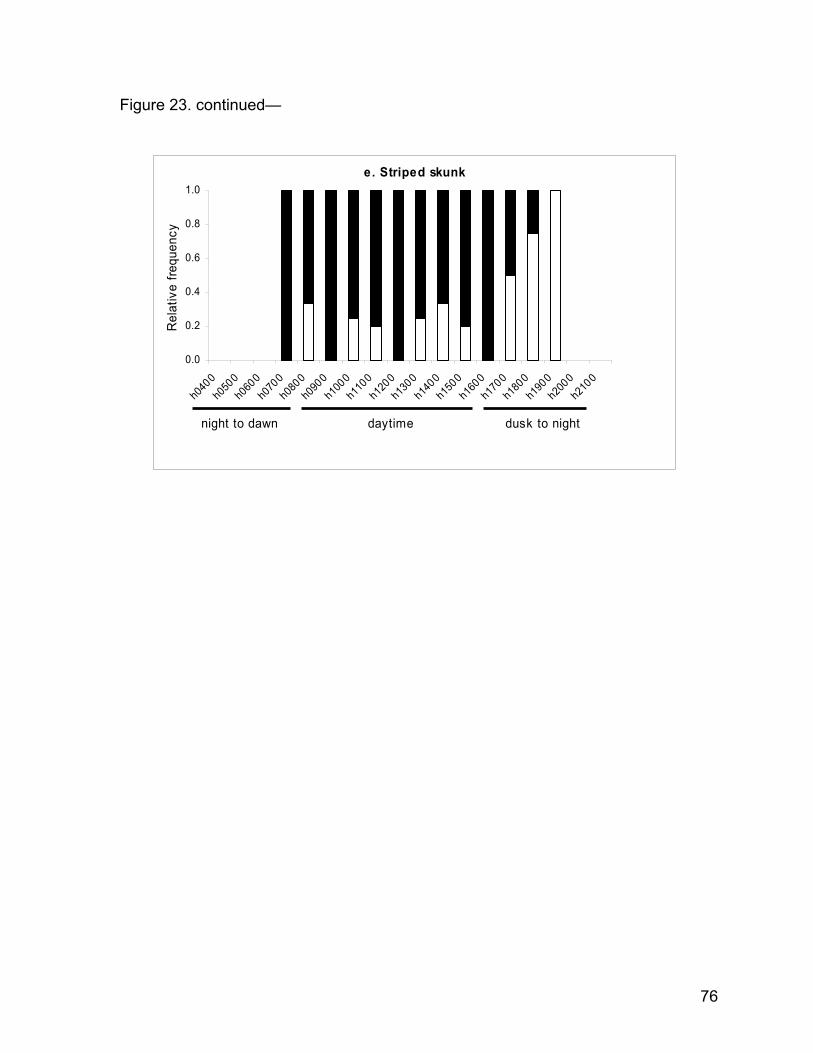
76
Figure 23. continued—
e. Striped skunk
0.0
0.2
0.4
0.6
0.8
1.0
h040
0h0
500h0
600h0
700h08
00h09
00h1
000h1
100h1
200h1
300h1
400h1
500h1
600h1
700h1
800h1
900h20
00h2
100
Rel
ativ
e fre
quen
cy
night to dawn dusk to nightdaytime

77
Appendix A. Unpublished manuscript by B. N. Sacks, H. B. Ernest, and E. E. Boydston describing results of genetic analyses of blood collected from a coyote in the Presidio.
Could San Francisco’s Golden Gate bridge historically distinct coyote populations?
Although coyotes (Canis latrans) are well-known for their adaptability to
human-modified landscapes1, as with any medium to large-sized carnivore, they
typically avoid highly urbanized areas2 preferring instead to use habitat
fragments linked by vegetated corridors3. However, recent observations of
coyotes in San Francisco indicate their willingness to traverse even the most
densely urbanized terrain4. Here, we use DNA to show, in an extreme example,
that an adult male coyote caught in the northern tip of the San Francisco
peninsula traversed the 2-km Golden Gate Bridge, potentially linking historically
distinct coyote populations.
We extracted DNA from the blood of a coyote that was captured, radio-
collared, and released in May 2003 in the Presidio of San Francisco, part of the
Golden Gate National Recreation Area located to the south of the Golden Gate
Bridge. This coyote apparently left the park within a week and was not
subsequently located. We genotyped this individual at 14 autosomal (non-sex-
linked) microsatellite loci that had previously been used to delimit four coyote
populations in central California5. By comparing this genotype to the two
adjacent populations, that beginning 20 km to the north of the bridge (North-
Coastal Mountains) and that 20 km south of the Bridge (just south of the city),

78
using a Bayesian model-based approach6, we assigned his origin to the northern
population with 97.5% probability. The population of origin was the same when
all four central California populations were used. Next, we genotyped this male
and the males in the two adjacent populations at two Y-chromosome loci
(MS41A, MS41B)7. The genotype of this male was present in 43 of 63 males
from the northern population and none of 18 males (conservatively assumed 1/18
for probability calculation) in the southern population, indicating a 92% probability
of origin in the northern population based on the Y-genotype. The combined
probability of assignment8 to the northern population based on both types of
marker was 99.5%, making it almost certain that this coyote came from north of
the Bridge.
Although it is conceivable that the coyote was transported by humans or
arrived in the Presidio without having traversed the Bridge, these scenarios seem
unlikely. First, the coyote had no apparent injuries and, based on tooth wear,
was several years old, making it unlikely that he had been in the recent custody
of a wildlife rehabilitator (a general inquiry to all known wildlife rehabilitators in
the area also turned up no information). Second, he was observed in the San
Francisco park at the south end of the Bridge, a likely destination for a coyote
that had walked across the Bridge but not a likely choice as a new release site
for a coyote. Finally, assuming his journey was unassisted, any other land route
would have required him to circumvent the San Francisco Bay-Delta Estuary
(>250 km) and traverse the full length of San Francisco, a far more unlikely
scenario than if he had crossed the 2-km Bridge.

79
Coyotes were most likely absent from the peninsula north of the Bridge
when the Bridge was built in 1933 and have only recently begun re-colonizing the
area9. The recent southern re-colonization of this area by coyotes, their apparent
willingness to cross the Bridge, and recent documentation of coyotes in more
central parts of San Francisco4 indicate the possibility of direct gene flow
between north-coastal and south-coastal coyote populations, which have been
historically distinct5. Although it has been widely recognized that human
fragmentation of the landscape can impede gene flow among parts of historically
continuous populations, our findings reflect an example where a human
modification to the landscape may have done the opposite—namely, facilitated
gene flow between historically distinct sections of a species range.
Benjamin N. Sacks*, Holly B. Ernest †*, & Erin E. Boydston ‡
*Wildlife and Ecology Unit, Veterinary Genetics Laboratory, School of Veterinary
Medicine, University of California, Davis, California 95616, USA
e-mail: [email protected]
† Department of Population Health and Reproduction, School of Veterinary
Medicine, University of California, Davis, CA 95616-8744, USA
‡ USGS Western Ecological Research Center, Las Vegas Field Station, 160 N
Stephanie, Henderson, NV 89014, USA
1. Riley, S. P. D. et al. Cons. Biol. 17, 566-576 (2003).
2. Crooks, K. R. Cons. Biol. 16, 488-502 (2002).
3. Tigas, L. A., Van Vuren, D. H., & Sauvajot, R. M. Biol. Cons. 108, 299-306
(2002).
4. Rubenstein, S. San Francisco Chronicle Nov. 14, 2003, p. A1

80
5. Sacks, B. N., Brown, S. K., & Ernest, H. E. Molec. Ecol. 13, 1265-1275
(2004).
6. Pritchard, J. K., Stevens, M., & Donnelly, P. Genetics 155, 945-959 (2000).
7. Sundqvist, A.-K., Ellegren, H., Olivier, M., & Vila, C Molec. Ecol. 10, 1959-
1966 (2001).
8. Sokal, R. R. & Rohlf, F. J. Biometry, 3rd. ed. Freeman & Co., New York, NY
(1995).
9. Hall, D. M. MS Thesis, Sonoma State University (2000)
Competing financial interests: declared none.