benchmarking air emissions - nrdc.org · nrg lp e d p n ye y st d t n l y r a l t p ct a ct e c r y...
TRANSCRIPT

Benchmarking Air Emissions of the 100 Largest Electric Power Producers in the United States
Full Report at: www.mjbradley.com
JUNE 2018
Benchmarking Air EmissionsOf the 100 Largest Electric Power Producers in the United States
June 2018
Presentation of ResultsData Downloads at: www.mjbradley.com
Report Authors:
Christopher Van Atten
Amlan Saha
Lauren Slawsky
Clement Russell
Luke Hellgren
Contributors:

Benchmarking Air Emissions of the 100 Largest Electric Power Producers in the United States
Full Report at: www.mjbradley.com
JUNE 2018
Preface
The 2018 Benchmarking report is the 14th collaborative effort highlighting environmental performance and progress in the nation’s
electric power sector. The Benchmarking series began in 1997 and uses publicly reported data to compare the emissions
performance of the 100 largest power producers in the United States. The current report is based on 2016 generation and
emissions data.
Data on U.S. power plant generation and air emissions are available to the public through several databases maintained by state
and federal agencies. Publicly- and privately-owned electric generating companies are required to report fuel and generation data
to the U.S. Energy Information Administration (EIA). Most power producers are also required to report air pollutant emissions data
to the U.S. Environmental Protection Agency (EPA). These data are reported and recorded at the boiler, generator, or plant level,
and must be combined and presented so that company-level comparisons can be made across the industry.
The Benchmarking report facilitates the comparison of emissions performance by combining generation and fuel consumption data
compiled by EIA with emissions data on sulfur dioxide (SO2), nitrogen oxides (NOx), carbon dioxide (CO2) and mercury (Hg)
compiled by EPA; error checking the data; and presenting emissions information for the nation’s 100 largest power producers in a
graphic format that aids in understanding and evaluating the data. The report is intended for a wide audience, including electric
industry executives, environmental advocates, financial analysts, investors, journalists, power plant managers, and public
policymakers.
Plant and company level data used in this report are available at www.mjbradley.com.
For questions or comments about this report, please contact:
Christopher Van Atten
M. J. Bradley & Associates LLC
47 Junction Square Drive
Concord, MA 01742, USA
Telephone: +1 978 369 5533
E-mail: [email protected]
2

Benchmarking Air Emissions of the 100 Largest Electric Power Producers in the United States
Full Report at: www.mjbradley.com
JUNE 2018
Key Findings
• In 2016, power plant SO2 and NOx emissions were 91
percent and 82 percent lower, respectively, than they
were in 1990 when Congress passed major
amendments to the Clean Air Act.
• In 2016, power plant CO2 emissions were nearly the
same as 1990 levels (1 percent higher). From 2005
through 2016, power plant CO2 emissions declined by
24 percent. Some of the factors driving this trend
include energy efficiency improvements and the
displacement of coal by natural gas and renewable
energy resources.
• Mercury air emissions from power plants have
decreased 86 percent since 2000. The first-ever
federal limits on mercury and other hazardous air
pollutants from coal-fired power plants went into effect
in 2015.
3
Download plant level data from the 2018
Benchmarking Air Emissions report at:
www.mjbradley.com
Benchmarking Air Emissions of the 100 Largest Electric Power Producers in the United States
Full Report at: www.mjbradley.com
JUNE 2018
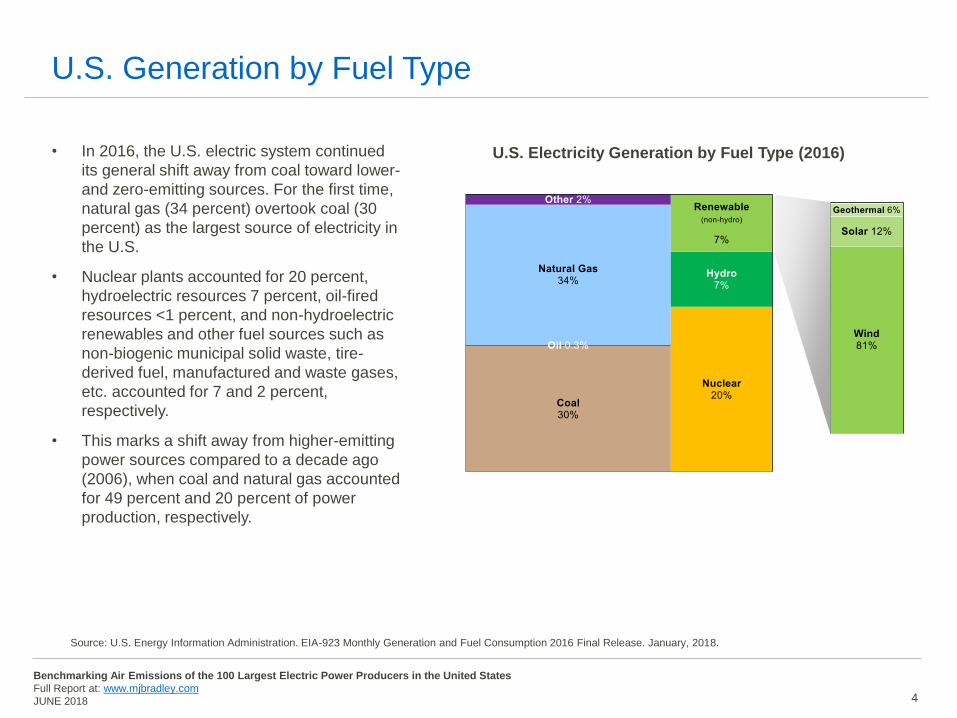
U.S. Generation by Fuel Type
• In 2016, the U.S. electric system continued
its general shift away from coal toward lower-
and zero-emitting sources. For the first time,
natural gas (34 percent) overtook coal (30
percent) as the largest source of electricity in
the U.S.
• Nuclear plants accounted for 20 percent,
hydroelectric resources 7 percent, oil-fired
resources <1 percent, and non-hydroelectric
renewables and other fuel sources such as
non-biogenic municipal solid waste, tire-
derived fuel, manufactured and waste gases,
etc. accounted for 7 and 2 percent,
respectively.
• This marks a shift away from higher-emitting
power sources compared to a decade ago
(2006), when coal and natural gas accounted
for 49 percent and 20 percent of power
production, respectively.
4
Source: U.S. Energy Information Administration. EIA-923 Monthly Generation and Fuel Consumption 2016 Final Release. January, 2018.
U.S. Electricity Generation by Fuel Type (2016)
Benchmarking Air Emissions of the 100 Largest Electric Power Producers in the United States
Full Report at: www.mjbradley.com
JUNE 2018
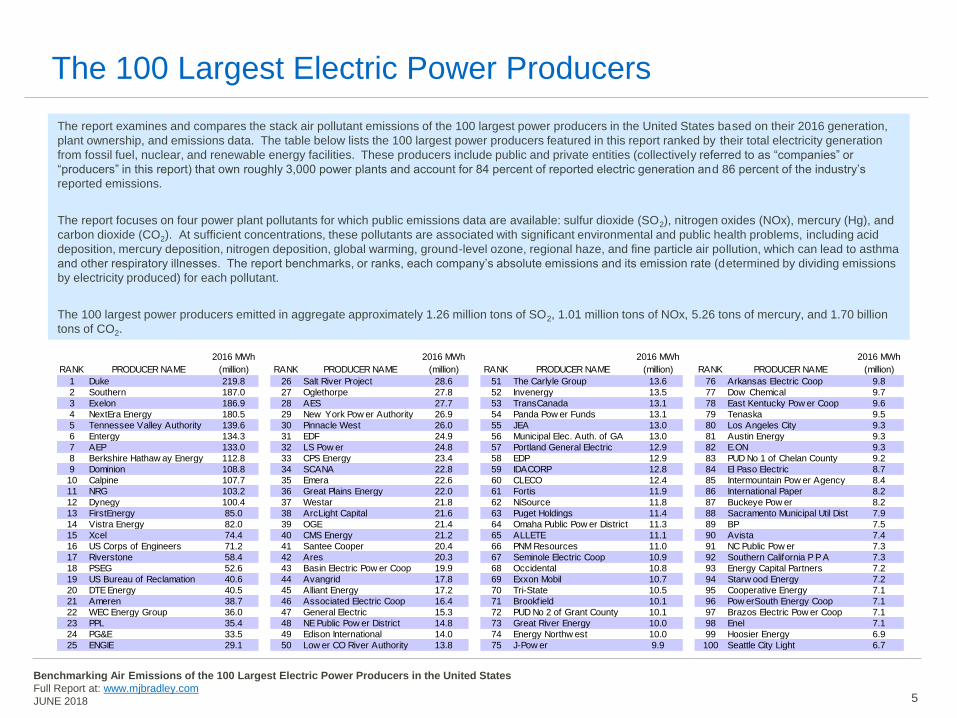
The 100 Largest Electric Power Producers
5
The report examines and compares the stack air pollutant emissions of the 100 largest power producers in the United States based on their 2016 generation,
plant ownership, and emissions data. The table below lists the 100 largest power producers featured in this report ranked by their total electricity generation
from fossil fuel, nuclear, and renewable energy facilities. These producers include public and private entities (collectively referred to as “companies” or
“producers” in this report) that own roughly 3,000 power plants and account for 84 percent of reported electric generation and 86 percent of the industry’s
reported emissions.
The report focuses on four power plant pollutants for which public emissions data are available: sulfur dioxide (SO2), nitrogen oxides (NOx), mercury (Hg), and
carbon dioxide (CO2). At sufficient concentrations, these pollutants are associated with significant environmental and public health problems, including acid
deposition, mercury deposition, nitrogen deposition, global warming, ground-level ozone, regional haze, and fine particle air pollution, which can lead to asthma
and other respiratory illnesses. The report benchmarks, or ranks, each company’s absolute emissions and its emission rate (determined by dividing emissions
by electricity produced) for each pollutant.
The 100 largest power producers emitted in aggregate approximately 1.26 million tons of SO2, 1.01 million tons of NOx, 5.26 tons of mercury, and 1.70 billion
tons of CO2.
RANK PRODUCER NAME
2016 MWh
(million) RANK PRODUCER NAME
2016 MWh
(million) RANK PRODUCER NAME
2016 MWh
(million) RANK PRODUCER NAME
2016 MWh
(million)
1 Duke 219.8 26 Salt River Project 28.6 51 The Carlyle Group 13.6 76 Arkansas Electric Coop 9.8
2 Southern 187.0 27 Oglethorpe 27.8 52 Invenergy 13.5 77 Dow Chemical 9.7
3 Exelon 186.9 28 AES 27.7 53 TransCanada 13.1 78 East Kentucky Pow er Coop 9.6
4 NextEra Energy 180.5 29 New York Pow er Authority 26.9 54 Panda Pow er Funds 13.1 79 Tenaska 9.5
5 Tennessee Valley Authority 139.6 30 Pinnacle West 26.0 55 JEA 13.0 80 Los Angeles City 9.3
6 Entergy 134.3 31 EDF 24.9 56 Municipal Elec. Auth. of GA 13.0 81 Austin Energy 9.3
7 AEP 133.0 32 LS Pow er 24.8 57 Portland General Electric 12.9 82 E.ON 9.3
8 Berkshire Hathaw ay Energy 112.8 33 CPS Energy 23.4 58 EDP 12.9 83 PUD No 1 of Chelan County 9.2
9 Dominion 108.8 34 SCANA 22.8 59 IDACORP 12.8 84 El Paso Electric 8.7
10 Calpine 107.7 35 Emera 22.6 60 CLECO 12.4 85 Intermountain Pow er Agency 8.4
11 NRG 103.2 36 Great Plains Energy 22.0 61 Fortis 11.9 86 International Paper 8.2
12 Dynegy 100.4 37 Westar 21.8 62 NiSource 11.8 87 Buckeye Pow er 8.2
13 FirstEnergy 85.0 38 ArcLight Capital 21.6 63 Puget Holdings 11.4 88 Sacramento Municipal Util Dist 7.9
14 Vistra Energy 82.0 39 OGE 21.4 64 Omaha Public Pow er District 11.3 89 BP 7.5
15 Xcel 74.4 40 CMS Energy 21.2 65 ALLETE 11.1 90 Avista 7.4
16 US Corps of Engineers 71.2 41 Santee Cooper 20.4 66 PNM Resources 11.0 91 NC Public Pow er 7.3
17 Riverstone 58.4 42 Ares 20.3 67 Seminole Electric Coop 10.9 92 Southern California P P A 7.3
18 PSEG 52.6 43 Basin Electric Pow er Coop 19.9 68 Occidental 10.8 93 Energy Capital Partners 7.2
19 US Bureau of Reclamation 40.6 44 Avangrid 17.8 69 Exxon Mobil 10.7 94 Starw ood Energy 7.2
20 DTE Energy 40.5 45 Alliant Energy 17.2 70 Tri-State 10.5 95 Cooperative Energy 7.1
21 Ameren 38.7 46 Associated Electric Coop 16.4 71 Brookfield 10.1 96 Pow erSouth Energy Coop 7.1
22 WEC Energy Group 36.0 47 General Electric 15.3 72 PUD No 2 of Grant County 10.1 97 Brazos Electric Pow er Coop 7.1
23 PPL 35.4 48 NE Public Pow er District 14.8 73 Great River Energy 10.0 98 Enel 7.1
24 PG&E 33.5 49 Edison International 14.0 74 Energy Northw est 10.0 99 Hoosier Energy 6.9
25 ENGIE 29.1 50 Low er CO River Authority 13.8 75 J-Pow er 9.9 100 Seattle City Light 6.7

Benchmarking Air Emissions of the 100 Largest Electric Power Producers in the United States
Full Report at: www.mjbradley.com
JUNE 2018
-50
0
50
100
150
200
250
Du
ke
Sou
the
rnE
xelo
nN
extE
ra E
ne
rgy
Te
nn
esse
e V
alley A
uth
ori
tyE
nte
rgy
AE
PB
erk
shir
e H
ath
aw
ay E
ne
rgy
Do
min
ion
Ca
lpin
eN
RG
Dyn
eg
yF
irstE
nerg
yV
istr
a E
nerg
yX
cel
US
Corp
s o
f E
ng
inee
rsR
ive
rsto
ne
PS
EG
US
Bu
reau
of
Re
cla
matio
nD
TE
En
erg
yA
me
ren
WE
C E
ne
rgy G
rou
pP
PL
PG
&E
EN
GIE
Salt R
ive
r P
roje
ct
Ogle
tho
rpe
AE
SN
ew
Yo
rk P
ow
er
Auth
ori
tyP
inn
acle
West
ED
FL
S P
ow
er
CP
S E
nerg
yS
CA
NA
Em
era
Gre
at
Pla
ins E
ne
rgy
We
sta
rA
rcL
igh
t C
ap
ital
OG
EC
MS
Ene
rgy
San
tee
Coo
pe
rA
res
Basin
Ele
ctr
ic P
ow
er
Coo
pA
van
gri
dA
llia
nt
Ene
rgy
Associa
ted
Ele
ctr
ic C
oo
pG
en
era
l E
lectr
icN
E P
ublic P
ow
er
Dis
tric
tE
dis
on
In
tern
atio
nal
Low
er
CO
Riv
er
Auth
ori
tyT
he C
arlyle
Gro
up
Inve
ne
rgy
Tra
nsC
an
ad
aP
an
da
Po
we
r F
un
ds
JE
AM
unic
ipa
l E
lec.
Auth
. o
f G
AP
ort
lan
d G
en
era
l E
lectr
icE
DP
IDA
CO
RP
CL
EC
OF
ort
isN
iSo
urc
eP
ug
et
Ho
ldin
gs
Om
aha
Pu
blic P
ow
er
Dis
tric
tA
LL
ET
EP
NM
Re
sou
rce
sS
em
ino
le E
lectr
ic C
oop
Occid
en
tal
Exxon
Mob
ilT
ri-S
tate
Bro
okfie
ldP
UD
No
2 o
f G
rant
Cou
nty
Gre
at
Riv
er
Ene
rgy
Ene
rgy N
ort
hw
est
J-P
ow
er
Ark
ansa
s E
lectr
ic C
oop
Do
w C
hem
ical
East
Ke
ntu
cky P
ow
er
Co
op
Te
na
ska
Los A
ng
ele
s C
ity
Austin
En
erg
yE
.ON
PU
D N
o 1
of
Ch
ela
n C
ou
nty
El P
aso E
lectr
icIn
term
oun
tain
Pow
er
Age
ncy
Inte
rnatio
na
l P
ap
er
Bucke
ye P
ow
er
Sacra
me
nto
Mu
nic
ipa
l U
til D
ist
BP
Avis
taN
C P
ub
lic P
ow
er
Sou
the
rn C
alifo
rnia
P P
AE
ne
rgy C
ap
ital P
art
ne
rsS
tarw
oo
d E
ne
rgy
Co
op
era
tive
En
erg
yP
ow
erS
outh
Ene
rgy C
oo
pB
razos E
lectr
ic P
ow
er
Coo
pE
ne
lH
oosie
r E
ne
rgy
Sea
ttle
City L
igh
t
Rankings by Generation
6
Generation of the 100 Largest Power Producers by Fuel Type (2016)(million MWh)
Renewable/Other
Hydro
Nuclear
Oil
Natural Gas
Coal
Breakdown of ownership categories provided on Endnotes slide: privately/investor owned public power cooperative

Benchmarking Air Emissions of the 100 Largest Electric Power Producers in the United States
Full Report at: www.mjbradley.com
JUNE 2018
-50
0
50
100
150
200
250
Exelo
nN
extE
ra E
ne
rgy
Du
ke
US
Corp
s o
f E
ng
inee
rsE
nte
rgy
Te
nn
esse
e V
alley A
uth
ori
tyD
om
inio
nS
ou
the
rnU
S B
ure
au
of
Re
cla
matio
nF
irstE
nerg
yB
erk
shir
e H
ath
aw
ay E
ne
rgy
PS
EG
PG
&E
ED
FN
ew
Yo
rk P
ow
er
Auth
ori
tyV
istr
a E
nerg
yN
RG
Xcel
AE
PR
ive
rsto
ne
Avan
gri
dE
DP
Am
ere
nD
TE
En
erg
yO
gle
tho
rpe
PU
D N
o 2
of
Gra
nt
Cou
nty
Ene
rgy N
ort
hw
est
Bro
okfie
ldP
inn
acle
West
E.O
NP
UD
No
1 o
f C
hela
n C
ou
nty
Edis
on
In
tern
atio
nal
Inve
ne
rgy
CP
S E
nerg
yN
C P
ub
lic P
ow
er
Mu
nic
ipa
l E
lec.
Auth
. o
f G
AE
ne
lS
ea
ttle
City L
igh
tID
AC
OR
PN
E P
ublic P
ow
er
Dis
tric
tS
CA
NA
Salt R
ive
r P
roje
ct
Ca
lpin
eE
l P
aso E
lectr
icW
esta
rG
reat
Pla
ins E
ne
rgy
BP
Arc
Lig
ht C
ap
ital
Avis
taA
LL
ET
EP
NM
Re
sou
rce
sP
ort
lan
d G
en
era
l E
lectr
icA
ustin
En
erg
yS
an
tee
Coo
pe
rE
ne
rgy C
ap
ital P
art
ne
rsP
ug
et
Ho
ldin
gs
Los A
ng
ele
s C
ity
Sacra
me
nto
Mu
nic
ipa
l U
til D
ist
Sou
the
rn C
alifo
rnia
P P
AA
ES
Alli
ant
Ene
rgy
WE
C E
ne
rgy G
rou
pT
ran
sC
an
ad
aO
GE
Sta
rwoo
d E
ne
rgy
CM
S E
ne
rgy
Basin
Ele
ctr
ic P
ow
er
Coo
pL
S P
ow
er
Gen
era
l E
lectr
icA
rka
nsa
s E
lectr
ic C
oop
Co
op
era
tive
En
erg
yT
ena
ska
PP
LL
ow
er
CO
Riv
er
Auth
ori
tyF
ort
isT
he C
arlyle
Gro
up
NiS
ourc
eA
res
Pow
erS
outh
Ene
rgy C
oo
pE
me
raIn
tern
atio
na
l P
ap
er
Associa
ted
Ele
ctr
ic C
oo
pB
razos E
lectr
ic P
ow
er
Coo
pB
ucke
ye P
ow
er
CL
EC
OD
ow
Ch
em
ical
Dyn
eg
yE
ast
Ke
ntu
cky P
ow
er
Co
op
EN
GIE
Exxon
Mob
ilG
reat
Riv
er
Ene
rgy
Ho
osie
r E
ne
rgy
Inte
rmo
un
tain
Pow
er
Age
ncy
JE
AJ-P
ow
er
Occid
en
tal
Om
aha
Pu
blic P
ow
er
Dis
tric
tP
an
da
Po
we
r F
un
ds
Sem
ino
le E
lectr
ic C
oop
Tri
-Sta
te
81 of the Top 100 power producers
generated power from zero-emitting
resources in 2016, accounting for 89% of
the national total generated from
resources including nuclear, hydro, and
renewables.
Rankings by Zero-Emitting Generation
7
Zero-Emitting Generation of the 100 Largest Power Producers (2016)(million MWh)
Breakdown of ownership categories provided on Endnotes slide: privately/investor owned public power cooperative

Benchmarking Air Emissions of the 100 Largest Electric Power Producers in the United States
Full Report at: www.mjbradley.com
JUNE 2018 8
Important Note on Emission Rankings
The Benchmarking Report presents generation and emissions information of power producers, not distribution utilities that deliver electricity to customers. In
order to apply a uniform methodology to all power producers, the Report assigns electricity generation and associated emissions to power producers according
to their known generating asset ownership as of December 31, 2016.
The above is true even when a producer’s generating facilities are part of one or more contractual agreements (e.g., power purchase contracts, etc.) with other
entities (often utilities). In other words, this Report attributes all generation and emissions to the owner of an asset, not to purchasers of the asset’s output or to
counterparties to the contracts. Publicly available data do not allow the accurate and exhaustive tracking of such agreements.
There are a host of reasons why a company’s generation profile may differ from that of the electricity it delivers to customers. For example, rural cooperatives,
which are non-profit entities and are thus generally unable to directly take advantage of renewable tax credits, tend to rely on power purchase agreements and
other non-asset owning mechanisms to deliver renewable electricity to their customers (see case study slide).
A vertically integrated utility that owns a large fossil generating fleet, but also delivers purchased renewable electricity to its customers, might have lower
average emission rates than the level attributed in this report to the power producer that owns the said fossil fleet, if the renewable energy purchases were
factored into the utility’s performance. By the same token, the utility’s emissions or emission rate would increase if it contracted with a higher emitting facility or
relied on market purchases with associated emissions.
The charts in the next few slides present both the total emissions by company as well as their average emission rates. The evaluation of emissions
performance by both emission levels and emission rates provides a more complete picture of relative emissions performance than viewing these measures in
isolation. Total emission levels are useful for understanding each producer’s contribution to overall emissions loading, while emission rates are useful for
assessing how electric power producers compare according to emissions per unit of energy produced when size is eliminated as a performance factor.
The charts illustrate significant differences in the total emission levels and emission rates of the 100 largest power producers. For example, the tons of CO2
emissions range from zero to nearly 108 million tons per year. The NOx emission rates range from zero to 2.6 pounds of emissions per megawatt hour of
generation. The total tons of emissions from any producer are influenced by the total amount of generation that a producer owns and by the fuels and
technologies used to generate electricity.
Emission Rankings

Benchmarking Air Emissions of the 100 Largest Electric Power Producers in the United States
Full Report at: www.mjbradley.com
JUNE 2018
SO2
(million ton)
NOx (million ton)
Mercury (Hg) (ton)
CO2
(billion ton)
100% 1.47 1.22 6.72 2.02
86% 83% 78% 84%
75% 28 45 44 48
50% 10 15 13 16
25% 3 5 3 5Perc
ent of in
dustr
y e
mis
sio
ns
100 largest producers
No. of producers
Emission Contributions
9
Air pollution emissions from power plants are highly concentrated among a small number of producers. For example,
nearly a quarter of the electric power industry’s SO2 and CO2 emissions are emitted by just three and five top 100
producers, respectively.

Benchmarking Air Emissions of the 100 Largest Electric Power Producers in the United States
Full Report at: www.mjbradley.com
JUNE 2018
0
1
2
3
0
20
40
60
80
Oil
Natural Gas
Coal
PN
M R
es
ou
rce
sA
ss
oci
ate
d E
lect
ric
Co
op
Inte
rmo
unta
in P
ow
er
Age
ncy
Inte
rna
tio
na
l P
ap
er
Tri-S
tate
US
Bu
rea
u o
f R
ecl
am
atio
nN
E P
ub
lic P
ow
er
Dis
tric
tA
rka
ns
as
Ele
ctric
Co
op
Pin
na
cle
We
st
Bas
in E
lec
tric
Po
wer
Coop
Gre
at R
ive
r E
ne
rgy
JE
AF
irstE
nerg
yO
ma
ha
Pu
blic
Po
we
r D
istric
tG
en
era
l E
lec
tric
AE
SE
ne
rgy
Ca
pita
l P
art
ne
rsF
ort
isS
alt R
iver
Pro
jec
tR
ive
rsto
ne
DT
E E
ne
rgy
El P
as
o E
lec
tric
IDA
CO
RP
Bu
ck
ey
e P
ow
er
Be
rks
hire
Ha
tha
wa
y E
ne
rgy
OG
EP
PL
En
terg
yA
rcLig
ht C
apital
Am
ere
nA
EP
Pow
erS
outh
Energ
y C
oop
AL
LE
TE
NiS
ou
rce
Xc
el
Te
nn
es
se
e V
alle
y A
uth
ority
Pu
ge
t H
old
ing
sW
es
tar
Du
ke
Alli
an
t E
ne
rgy
Gre
at P
lain
s E
ne
rgy
NR
GA
us
tin
En
erg
yV
istr
a E
ne
rgy
Av
ista
Ea
st K
en
tuck
y P
ow
er C
oo
pP
ort
lan
d G
en
era
l Ele
ctric
Munic
ipal E
lec.
Auth
. of G
AC
PS
En
erg
yW
EC
En
erg
y G
rou
pC
LE
CO
SC
AN
AL
ow
er
CO
Riv
er
Au
tho
rity
San
tee
Coop
er
PS
EG
Ho
os
ier
En
erg
yD
yne
gy
Ogle
thorp
eS
ou
the
rnS
em
ino
le E
lec
tric
Co
op
CM
S E
nerg
yD
om
inio
nC
oo
pe
rativ
e E
ne
rgy
Em
era
Are
sT
ran
sC
an
ad
aE
NG
IEN
ex
tEra
En
erg
yL
S P
ow
er
Bro
okf
ield
Ex
elo
nJ
-Po
we
rB
razo
s E
lec
tric
Pow
er
Coop
Inve
ne
rgy
Ca
lpin
eA
va
ng
rid
The C
arlyl
e G
roup
Oc
cid
en
tal
Ne
w Y
ork
Po
we
r A
uth
ority
Sta
rwood
Ene
rgy
Te
na
sk
aD
ow
Ch
em
ica
lE
xxon M
obil
BP
Lo
s A
ng
ele
s C
ityS
ou
the
rn C
alifo
rnia
P P
AP
an
da
Po
we
r F
un
ds
Ed
iso
n In
tern
atio
na
lP
G&
ES
ac
ram
en
to M
un
icip
al U
til D
ist
US
Co
rps
of E
ng
ine
ers
ED
FE
DP
PU
D N
o 2
of G
ran
t C
ou
nty
En
erg
y N
ort
hw
es
tE
.ON
PU
D N
o 1
of C
he
lan
Co
un
tyN
C P
ub
lic P
ow
er
Ene
lS
ea
ttle
City
Lig
ht
NOx: Total Emissions and Emission Rates
10
Breakdown of ownership categories provided on Endnotes slide: privately/investor owned public power cooperative
NO
x –
‘00
0 t
on
(fossil
fuel genera
ting f
acili
ties)
NO
x –
lb/M
Wh
(fossil
fuel genera
ting f
acili
ties)

Benchmarking Air Emissions of the 100 Largest Electric Power Producers in the United States
Full Report at: www.mjbradley.com
JUNE 2018
0
1
2
3
4
5
6
0
20
40
60
80
100
120
140
Oil
Natural Gas
Coal
NE
Pu
blic
Po
we
r D
istr
ict
Om
ah
a P
ub
lic P
ow
er D
istric
tA
mere
nV
istr
a E
ne
rgy
DT
E E
ne
rgy
Ark
an
sa
s E
lec
tric
Co
op
Gre
at R
ive
r E
nerg
yO
GE
Ge
ne
ral E
lec
tric
NR
GA
ss
oci
ate
d E
lect
ric
Co
op
En
erg
y C
ap
ita
l P
art
ne
rsA
ES
Te
nn
es
se
e V
alle
y A
uth
ority
Bu
ck
ey
e P
ow
er
Bas
in E
lec
tric
Po
wer
Coop
CL
EC
OA
EP
Alli
ant E
ne
rgy
Firs
tEn
erg
yX
ce
lID
AC
OR
PR
ive
rsto
ne
CM
S E
ne
rgy
Arc
Lig
ht C
ap
ita
lA
LL
ET
EP
PL
CP
S E
ne
rgy
Berk
shire H
ath
aw
ay
En
erg
yS
em
ino
le E
lec
tric
Co
op
Ea
st K
en
tuck
y P
ow
er C
oo
pT
ri-S
tate
Dyn
eg
yP
ort
lan
d G
en
era
l Ele
ctric
Ente
rgy
Ho
os
ier
En
erg
yG
rea
t P
lain
s E
ne
rgy
JE
AD
uk
eF
ort
isN
iSo
urc
eP
ug
et H
old
ing
sIn
term
ou
nta
in P
ow
er
Ag
en
cyW
EC
En
erg
y G
rou
pS
an
tee
Coop
er
EN
GIE
US
Bu
rea
u o
f R
ecl
am
atio
nA
vis
taE
me
raP
SE
GP
NM
Res
ourc
es
Pin
na
cle
We
st
Sa
lt R
ive
r P
roje
ct
Sou
the
rnP
ow
erS
ou
th E
ne
rgy
Co
op
Mu
nic
ipa
l E
lec.
Au
th. o
f G
AD
om
inio
nW
es
tar
SC
AN
AO
gle
tho
rpe
Are
sA
us
tin
En
erg
yL
ow
er
CO
Riv
er
Au
tho
rity
Bra
zos
Ele
ctr
ic P
ow
er
Coop
Ex
elo
nN
ex
tEra
En
erg
yC
oop
era
tive E
ne
rgy
J-P
ow
er
Tra
ns
Ca
na
da
Los
Ang
ele
s C
ityE
l P
as
o E
lec
tric
BP
The C
arlyl
e G
roup
Sta
rwo
od
En
erg
yC
alp
ine
LS
Po
we
rB
rookf
ield
Ne
w Y
ork
Po
we
r A
uth
ority
Av
an
gri
dIn
venerg
yT
en
as
ka
Ed
iso
n In
tern
atio
na
lS
ou
the
rn C
alifo
rnia
P P
AP
an
da
Po
we
r F
un
ds
PG
&E
Dow
Chem
ical
Ex
xo
n M
ob
ilS
ac
ram
en
to M
un
icip
al U
til D
ist
Oc
cid
enta
lU
S C
orp
s o
f E
ng
ine
ers
ED
FE
DP
PU
D N
o 2
of G
rant C
oun
tyE
ne
rgy
No
rth
we
st
E.O
NP
UD
No 1
of C
hela
n C
oun
tyIn
tern
atio
na
l P
ap
er
NC
Pu
blic
Po
we
rE
ne
lS
ea
ttle
City
Lig
ht
SO2: Total Emissions and Emission Rates
11
Breakdown of ownership categories provided on Endnotes slide: privately/investor owned public power cooperative
SO
2–
‘00
0 t
on
(fossil
fuel genera
ting f
acili
ties)
SO
2–
lb/M
Wh
(fossil
fuel genera
ting f
acili
ties)

Benchmarking Air Emissions of the 100 Largest Electric Power Producers in the United States
Full Report at: www.mjbradley.com
JUNE 2018
0
500
1,000
1,500
2,000
2,500
0
20
40
60
80
100
120
Other
Oil
Natural Gas
Coal
Tri-S
tate
Om
ah
a P
ub
lic P
ow
er D
istric
tB
as
in E
lec
tric
Po
wer
Coop
Gre
at R
ive
r E
ne
rgy
Bu
ck
ey
e P
ow
er
Inte
rmo
un
tain
Po
we
r A
ge
ncy
Eas
t K
entu
cky P
ow
er C
oop
Ho
os
ier
En
erg
yP
PL
AE
SN
iSo
urc
eW
es
tar
Fort
isW
EC
En
erg
y G
rou
pJ
EA
Gre
at P
lain
s E
ne
rgy
Ark
an
sa
s E
lec
tric
Co
op
Se
min
ole
Ele
ctric
Co
op
As
soci
ate
d E
lect
ric C
oo
pA
llia
nt E
ne
rgy
AE
PA
mere
nO
GE
CL
EC
OL
ow
er
CO
Riv
er
Au
tho
rity
San
tee
Coop
er
Dyn
eg
yV
istr
a E
ne
rgy
DT
E E
nerg
yA
LL
ET
EP
ow
erS
ou
th E
ne
rgy
Co
op
NR
GG
en
era
l E
lec
tric
CM
S E
ne
rgy
Em
era
Sa
lt R
ive
r P
roje
ct
Xc
el
PN
M R
es
ourc
es
Firs
tEn
erg
yA
rcL
igh
t C
ap
ita
lB
erk
sh
ire
Ha
tha
wa
y E
ne
rgy
Pug
et H
old
ing
sN
E P
ub
lic P
ow
er
Dis
tric
tA
us
tin
En
erg
yR
ive
rsto
ne
So
uth
ern
Bra
zos
Ele
ctr
ic P
ow
er
Co
op
SC
AN
AE
NG
IEC
PS
En
erg
yP
ort
lan
d G
ene
ral E
lect
ric
J-P
ow
er
Du
ke
Coop
era
tive E
ne
rgy
Te
nn
es
se
e V
alle
y A
uth
ority
IDA
CO
RP
Pin
na
cle
We
st
Tra
ns
Cana
da
Th
e C
arlyl
e G
rou
pO
gle
tho
rpe
LS
Pow
er
Are
sT
en
as
ka
Pan
da P
ow
er
Fu
nds
Ca
lpin
eD
ow
Ch
em
ica
lLos
Ang
ele
s C
ityD
om
inio
nM
un
icip
al E
lec.
Au
th. o
f G
AO
ccid
enta
lS
tarw
oo
d E
ne
rgy
Ex
xo
n M
ob
ilA
vis
taS
ou
the
rn C
alifo
rnia
P P
AE
nte
rgy
Sa
cra
me
nto
Mu
nic
ipa
l U
til D
ist
El P
as
o E
lec
tric
PS
EG
Ne
xtE
ra E
ne
rgy
BP
Ed
iso
n In
tern
atio
na
lIn
ven
erg
yE
ne
rgy C
apital P
art
ners
US
Bu
rea
u o
f R
ecl
am
atio
nIn
tern
atio
na
l P
ap
er
New
Yo
rk P
ow
er
Au
tho
rity
PG
&E
Av
an
gri
dE
xelo
nB
roo
kfie
ldN
C P
ub
lic P
ow
er
US
Co
rps
of E
ng
ine
ers
ED
FE
DP
PU
D N
o 2
of G
ran
t C
ou
nty
Ene
rgy N
ort
hw
es
tE
.ON
PU
D N
o 1
of C
he
lan
Co
un
tyE
ne
lS
ea
ttle
City
Lig
ht
CO2: Total Emissions and Emission Rates
12
Breakdown of ownership categories provided on Endnotes slide: privately/investor owned public power cooperative
CO
2–
mil
lio
n t
on
(all
genera
ting f
acili
ties)
CO
2–
lb/M
Wh
(all
genera
ting f
acili
ties)
Benchmarking Air Emissions of the 100 Largest Electric Power Producers in the United States
Full Report at: www.mjbradley.com
JUNE 2018
0.00
0.01
0.02
0.03
0.04
0.05
0
500
1,000
1,500
2,000
2,500V
istr
a E
nerg
yC
LE
CO
Gre
at R
ive
r E
ne
rgy
En
terg
yB
as
in E
lec
tric
Po
wer
Coop
NE
Pu
blic
Po
we
r D
istr
ict
CM
S E
ne
rgy
OG
EG
reat P
lain
s E
ne
rgy
Ark
an
sa
s E
lec
tric
Co
op
Om
ah
a P
ub
lic P
ow
er D
istric
tG
en
era
l E
lec
tric
Wes
tar
NR
GA
us
tin
En
erg
yL
ow
er
CO
Riv
er
Au
tho
rity
Am
ere
nC
oo
pe
rativ
e E
ne
rgy
NiS
ou
rce
Po
we
rSo
uth
En
erg
y C
oo
pA
ssoci
ate
d E
lect
ric C
oo
pB
razo
s E
lec
tric
Po
we
r C
oo
pP
ug
et H
old
ing
sA
vis
taP
inn
ac
le W
es
tD
TE
En
erg
yJ
EA
Riv
ers
ton
eE
NG
IEA
EP
So
uth
ern
US
Bu
rea
u o
f R
ecl
am
atio
nS
alt R
iver
Pro
jec
tX
cel
IDA
CO
RP
Mu
nic
ipa
l E
lec.
Au
th. o
f G
AO
gle
thorp
eP
SE
GC
PS
En
erg
yN
ex
tEra
En
erg
yA
rcLig
ht C
apital
Tri-S
tate
Po
rtla
nd
Ge
ne
ral E
lect
ric
En
erg
y C
ap
ita
l P
art
ne
rsF
irs
tEn
erg
yF
ort
isT
en
ne
ss
ee
Va
lley
Au
tho
rity
Be
rks
hire
Ha
tha
wa
y E
ne
rgy
Bu
ck
ey
e P
ow
er
PP
LD
om
inio
nS
an
tee
Co
op
er
AL
LE
TE
Alli
ant E
ne
rgy
Dyn
eg
yD
uk
eW
EC
En
erg
y G
rou
pA
ES
Em
era
Se
min
ole
Ele
ctric
Co
op
Ho
os
ier
En
erg
yE
as
t K
entu
cky P
ow
er C
oop
Are
sE
xe
lon
PN
M R
es
ou
rce
sS
CA
NA
Inte
rmo
un
tain
Po
we
r A
ge
ncy
J-P
ow
er
Ca
lpin
eU
S C
orp
s of E
ngin
eers
PG
&E
Ne
w Y
ork
Po
we
r A
uth
ority
ED
FLS
Pow
er
Av
ang
rid
Ed
iso
n In
tern
atio
na
lT
he
Ca
rlyl
e G
rou
pIn
venerg
yT
rans
Cana
da
Pa
nd
a P
ow
er
Fu
nd
sE
DP
Oc
cid
enta
lE
xxon M
obil
Bro
okf
ield
PU
D N
o 2
of G
ran
t C
ou
nty
En
erg
y N
ort
hw
es
tD
ow
Chem
ical
Te
na
sk
aL
os
An
ge
les
City
E.O
NP
UD
No 1
of C
hela
n C
oun
tyE
l P
as
o E
lec
tric
Inte
rna
tio
na
l P
ap
er
Sa
cra
me
nto
Mu
nic
ipa
l U
til D
ist
BP
NC
Pu
blic
Po
we
rS
ou
the
rn C
alifo
rnia
P P
AS
tarw
oo
d E
ne
rgy
Ene
lS
ea
ttle
City
Lig
ht
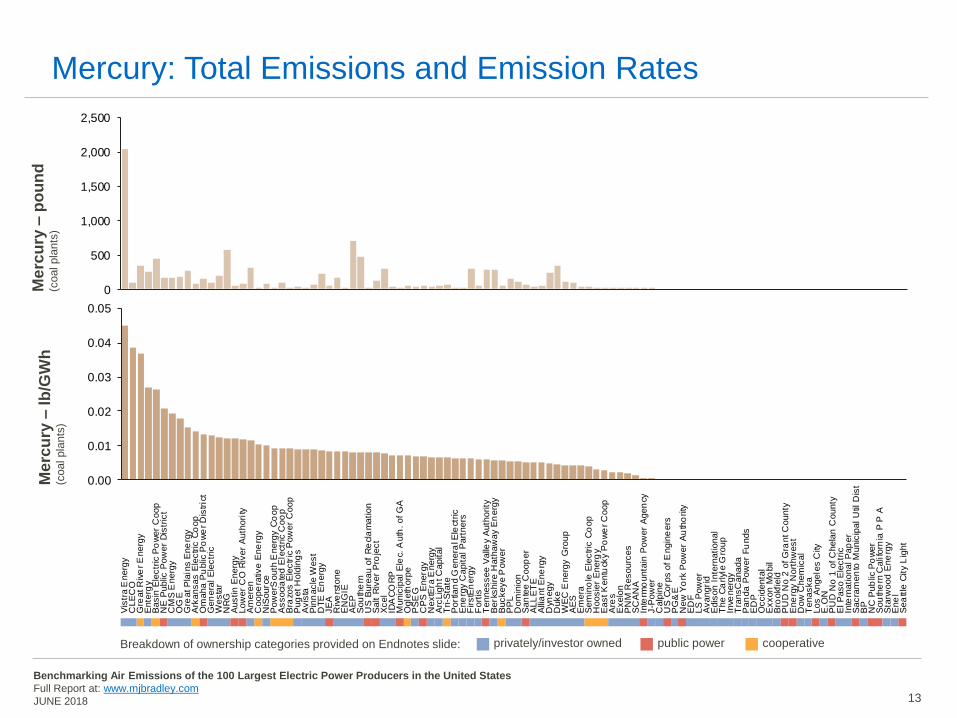
Mercury: Total Emissions and Emission Rates
13
Breakdown of ownership categories provided on Endnotes slide: privately/investor owned public power cooperative
Me
rcu
ry –
po
un
d(c
oal pla
nts
)M
erc
ury
–lb
/GW
h(c
oal pla
nts
)

Benchmarking Air Emissions of the 100 Largest Electric Power Producers in the United States
Full Report at: www.mjbradley.com
JUNE 2018
0
200
400
600
800
0 200 400 600 800
2016
2014
Mercury and Air Toxics Standards Impacts
14
Pre-MATS
MATSin effect
Emissions
Increase17% of facilities
Emissions
Decrease83% of facilities
Annual Mercury Emissions by Coal Facility(pounds)
• In 2012, EPA finalized the Mercury and Air Toxics
Standards (MATS), regulating emissions of mercury
and other hazardous air pollutants from coal- and oil-
fired electric generating units. The standards went
into effect on April 16, 2015, although many coal units
obtained a one-year extension to the initial compliance
date. Reported emissions have declined 69 percent
between 2014 and 2016.
• Coal mercury emissions from the top 100 power
producers in 2016 range from less than 1 pound to
2,040 pounds, and coal mercury emission rates range
from 0.0002 pound per gigawatt hour (a gigawatt hour
is 1,000 megawatt hours) to 0.045 pound per gigawatt
hour.
• Compared to 2014 levels mercury emissions declined
at 83 percent of coal facilities that were in operation as
of December 31, 2016 (see adjacent chart). Across
these facilities, emissions decreased by an average of
63 percent.
Benchmarking Air Emissions of the 100 Largest Electric Power Producers in the United States
Full Report at: www.mjbradley.com
JUNE 2018
2000 20172000 2017
0
40
80
120
160
200
240
2000 2017
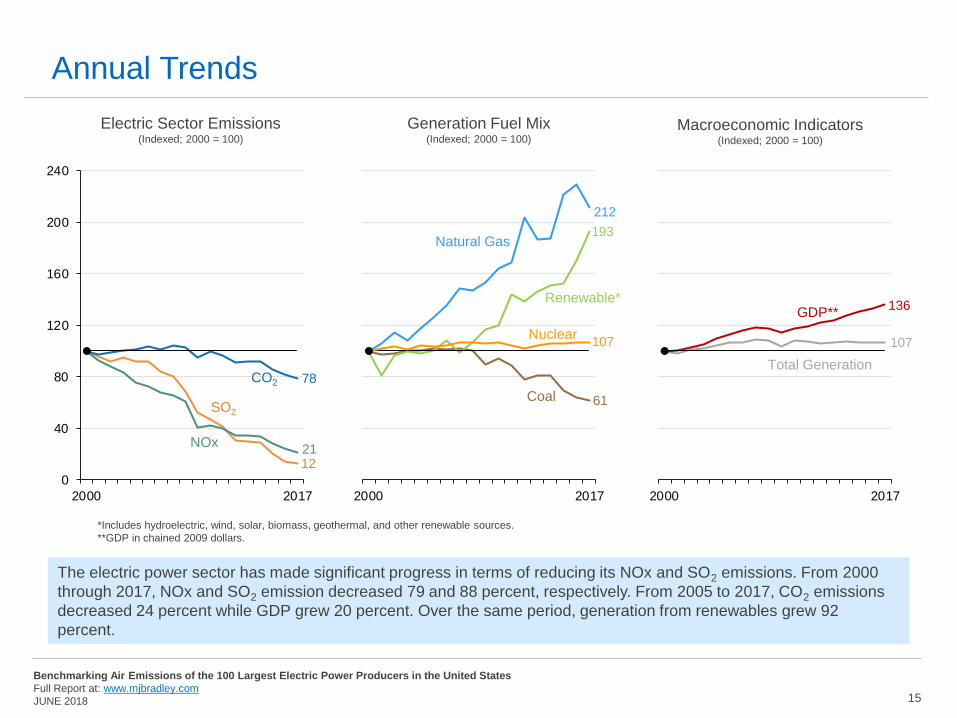
Annual Trends
15
The electric power sector has made significant progress in terms of reducing its NOx and SO2 emissions. From 2000
through 2017, NOx and SO2 emission decreased 79 and 88 percent, respectively. From 2005 to 2017, CO2 emissions
decreased 24 percent while GDP grew 20 percent. Over the same period, generation from renewables grew 92
percent.
Electric Sector Emissions(Indexed; 2000 = 100)
*Includes hydroelectric, wind, solar, biomass, geothermal, and other renewable sources.
**GDP in chained 2009 dollars.
Generation Fuel Mix(Indexed; 2000 = 100)
Macroeconomic Indicators(Indexed; 2000 = 100)
CO2
SO2
NOx
1221
78
Natural Gas
Renewable*
Coal
212
193
61
Total Generation
GDP**
107
136
107Nuclear
Benchmarking Air Emissions of the 100 Largest Electric Power Producers in the United States
Full Report at: www.mjbradley.com
JUNE 2018
2,326
2,306
2,266
2,237
2,187
904
900
889
874
868
0 1,000 2,000 3,000
Montana
North Dakota
Wyoming
Kansas
Nebraska
Rhode Island
California
Connecticut
Maine
Idaho
245%
220%
201%
185%
185%
72%
68%
62%
57%
57%
0 1 2 3
Wyoming
West Virginia
North Dakota
Montana
Vermont
Tennessee
Delaware
Idaho
Maryland
Massachusetts
1,985
1,974
1,973
1,784
1,741
279
272
184
183
7
0 1,000 2,000 3,000
Wyoming
West Virginia
Kentucky
Indiana
Missouri
Maine
New Hampshire
Washington
Idaho
Vermont
238.3
116.6
90.5
89.9
88.7
2.8
2.6
1.6
1.4
0.01
0 200 400
Texas
Florida
Pennsylvania
Indiana
Ohio
South Dakota
New Hampshire
Maine
Idaho
Vermont
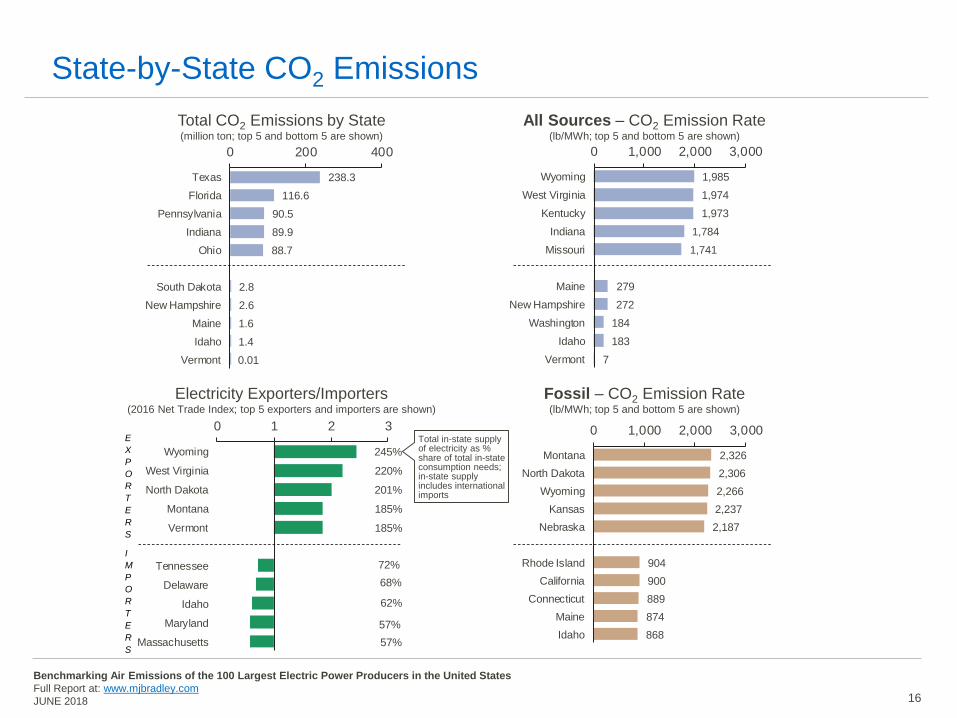
State-by-State CO2 Emissions
16
Total CO2 Emissions by State(million ton; top 5 and bottom 5 are shown)
All Sources – CO2 Emission Rate(lb/MWh; top 5 and bottom 5 are shown)
Electricity Exporters/Importers(2016 Net Trade Index; top 5 exporters and importers are shown)
Fossil – CO2 Emission Rate(lb/MWh; top 5 and bottom 5 are shown)
E
X
P
O
R
T
E
R
S
I
M
P
O
R
T
E
R
S
Total in-state supply of electricity as % share of total in-state consumption needs; in-state supply includes international imports

Benchmarking Air Emissions of the 100 Largest Electric Power Producers in the United States
Full Report at: www.mjbradley.com
JUNE 2018
105
479
499
567
738
805
968
1,094
1,110
1,248
1,280
1,386
1,429
1,498
1,503
1,534
1,620
1,622
1,778
1,925
0 400 800 1,200 1,600 2,000
Exelon (3)
NextEra Energy (4)
PSEG (18)
Entergy (6)
Dominion (9)
Calpine (10)
Duke (1)
Southern (2)
Riverstone (17)
Berkshire Hathaway Energy (8)
FirstEnergy (13)
Xcel (15)
NRG (11)
DTE Energy (20)
Vistra Energy (14)
Dynegy (12)
Ameren (21)
AEP (7)
WEC Energy Group (22)
PPL (23)
Rankings by CO2 Emission Rate(Top 20 Privately/Investor Owned Power Producers)
17
All Sources – CO2 Emission Rate(lb/MWh)
Ranking based on
2016 total generation
Note: “Privately/investor owned” power producers include investor owned, privately held, and foreign owned corporations. This chart does not show public power
producers (federal power authorities, state power authorities, municipalities, power districts), or cooperatives.

Benchmarking Air Emissions of the 100 Largest Electric Power Producers in the United States
Full Report at: www.mjbradley.com
JUNE 2018
0
10,000
20,000
30,000
40,000
50,000
60,000
70,000
80,000
194
0
194
2
194
4
194
6
194
8
195
0
195
2
195
4
195
6
195
8
196
0
196
2
196
4
196
6
196
8
197
0
197
2
197
4
197
6
197
8
198
0
198
2
198
4
198
6
198
8
199
0
199
2
199
4
199
6
199
8
200
0
200
2
200
4
200
6
200
8
201
0
201
2
201
4
201
6
Renewable/Other
Hydro
Nuclear
Oil
Gas
Coal
Existing Capacity
18
U.S. Electric Generating Capacity by In Service Year: 1940 – 2016(Nameplate Capacity; MW)
Source: U.S. Energy Information Administration. EIA-860 Annual Electric Generator Report. November 9, 2017.

Benchmarking Air Emissions of the 100 Largest Electric Power Producers in the United States
Full Report at: www.mjbradley.com
JUNE 2018
Ranking Utility Portfolios
• As described above, the Benchmarking Report presents generation and emissions information of power producers, not utility companies with obligations to deliver electricity to customers. In order to apply a uniform methodology to all power producers, the Report assigns electricity generation and associated emissions to power producers according to their known generating asset ownership as of December 31, 2016.
• If a power producer is also a distribution utility, the fuel mix and emissions associated with the utility’s total supply portfolio may differ substantially from its owned generation, depending on the nature and extent of any power purchase agreements and other contractual agreements to which the utility may be party. The distribution utility might also rely on market purchases to supply its customers (e.g., purchases from the PJM or MISO markets). A power producer might also sell excess supply to the market or to other utilities.
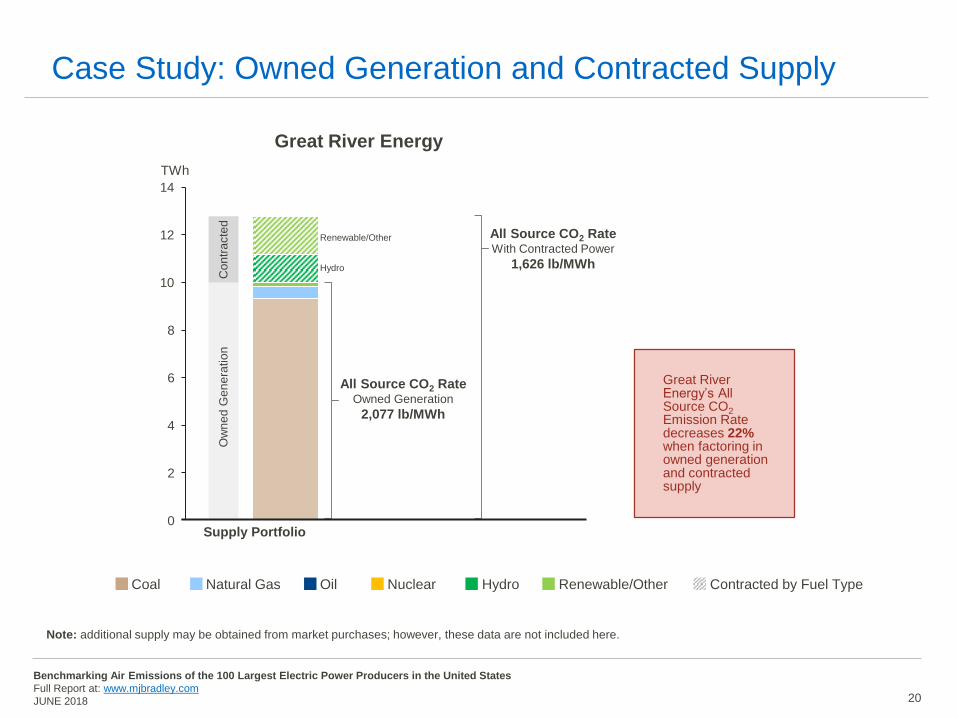
• To highlight the potential implications of these two different approaches, the following slide presents the generation mix and all source CO2 emission rate for a rural electric cooperative—Great River Energy. The graph also reports the CO2 emission rate associated with part of the company’s supply portfolio (owned generation and long-term contracts); the supply portfolio emission rate does not reflect the emissions associated with market purchases, which may be fossil-fired, renewables, or other sources.
• In the example shown, the CO2 emission rate associated with supply is lower because Great River Energy contracts for non-emitting, renewable resources rather than owning wind or solar projects. Rural cooperatives are non-profit entities that are generally unable to take advantage of renewable tax credits, so they will tend to purchase renewable energy under long-term contracts rather than owning the facilities.
• Both approaches—generation and supply—can be helpful in evaluating a company’s performance. Unfortunately, there is no publicly available source for the data that would be required to benchmark utility resource portfolios in the same way that we can benchmark owned-generation assets.
• The following slide illustrates the All Source CO2 emissions rates for Great River Energy. The company voluntarily supplied the information displayed. The charts include the emission rate for Owned Generation only (consistent with the focus and methodology of the Benchmarking report) as well as the All Source emission rate associated with the combination of owned generation and long-term contract purchases.
19
Benchmarking Air Emissions of the 100 Largest Electric Power Producers in the United States
Full Report at: www.mjbradley.com
JUNE 2018
Case Study: Owned Generation and Contracted Supply
20
0
2
4
6
8
10
12
14
Great River Energy
Ow
ne
d G
en
era
tio
nC
on
tra
cte
d
Supply Portfolio
All Source CO2 RateOwned Generation
2,077 lb/MWh
TWh
All Source CO2 RateWith Contracted Power
1,626 lb/MWh
Coal Natural Gas Oil Nuclear Hydro Renewable/Other Contracted by Fuel Type
Note: additional supply may be obtained from market purchases; however, these data are not included here.
Renewable/Other
Hydro
Great River Energy’s All Source CO2Emission Rate decreases 22% when factoring in owned generation and contracted supply

Benchmarking Air Emissions of the 100 Largest Electric Power Producers in the United States
Full Report at: www.mjbradley.com
JUNE 2018
Capacity factors measure the extent to which a power plant is utilized over the course of time. The technical definition is the ratio of the electrical energy
produced by a generating unit to the electrical energy that could have been produced assuming continuous full power operation.
Coal plant utilization has declined in recent years; the average annual capacity factor of coal plants in the U.S. dropped from 73 percent in 2008 to 55 percent in
2017, while over the same time period, natural gas combined-cycle capacity factors rose from 40 to 55 percent.
Nuclear plants have high utilization rates, consistently running at above 90 percent average capacity factor.
Hydropower and wind capacity factors are lower, but have also remained relatively constant over the past decade.
21
Annual Capacity Factors for Select Fuels and Technologies
Source: U.S. Energy Information Administration. Electric Power Monthly, Tables 6.7A and 6.7B. January 2018.
*Combined Cycle
Nuclear Coal Natural Gas* Hydro Wind
91% 92%
0%
25%
50%
75%
100%
2008 2017
73%
54%
2008 2017
40%
55%
2008 2017
37%
45%
2008 2017
32%37%
2008 2017
Average Capacity Factors

Benchmarking Air Emissions of the 100 Largest Electric Power Producers in the United States
Full Report at: www.mjbradley.com
JUNE 2018 22
To supplement the 2018 Benchmarking Report, MJB&A has developed two interactive maps to further visualize the emissions and electricity generation from
power producers in the United States. The primary map (“Main”) provides facility-level emissions and generation data and offers interactive features to filter
facilities by geography, fuel type, company ownership, and other metrics. An additional map (“Trends”) was developed with historical Benchmarking data
(2012-2016 data) to show how facility-level emissions and generation are changing through time.
These maps and accompanying user guide are available at www.mjbradley.com.
Main Map
Trends Map
Benchmarking Maps

Benchmarking Air Emissions of the 100 Largest Electric Power Producers in the United States
Full Report at: www.mjbradley.com
JUNE 2018
Appendix: Data Sources
The following public data sources were used to develop this report:
EPA AIR MARKETS PROGRAM DATA (AMP): EPA’s Air Markets Program Data account for almost all of the SO2 and NOx emissions, and
about 20 percent of the CO2 emissions analyzed in this report.
EPA TOXIC RELEASE INVENTORY (TRI): The 2016 mercury emissions used in this report are based on TRI reports submitted by facility
managers.
EIA FORMS 923 POWER PLANT DATABASES (2016): EIA Form 923 provides data on the electric generation and heat input by fuel type for
utility and non-utility power plants. The heat input data was used to calculate approximately 80 percent of the CO2 emissions analyzed in this
report.
EIA FORM 860 ANNUAL ELECTRIC GENERATOR REPORT (2016): EIA Form 860 is a generating unit level data source that includes
information about generators at electric power plants, including information about generator ownership.
EPA U.S. INVENTORY OF GREENHOUSE GAS EMISSIONS AND SINKS (2018): EPA’s U.S. Inventory of Greenhouse Gas Emissions and
Sinks report provides in Annex 2 heat contents and carbon content coefficients of various fuel types. This data was used in conjunction with EIA
Form 923 to calculate approximately 20 percent of the CO2 emissions analyzed in this report.
23

Benchmarking Air Emissions of the 100 Largest Electric Power Producers in the United States
Full Report at: www.mjbradley.com
JUNE 2018
Appendix: Methodology
Plant Ownership
This report aims to reflect power plant ownership as of December 31, 2016. Plant ownership data used in this report are primarily based on the EIA-860
database from the year 2016. EIA-860 includes ownership information on generators at electric power plants owned or operated by electric utilities and non-
utilities, which include independent power producers, combined heat and power producers, and other industrial organizations. It is published annually by EIA.
For the largest 100 power producers, plant ownership is further checked against self-reported data from the producer’s 10-K form filed with the SEC, listings on
their website, and other media sources. Ownership of plants is updated based on the most recent data available. Consequently, in a number of instances,
ultimate assignment of plant ownership in this report differs from EIA-860’s reported ownership. This primarily happens when the plant in question falls in one
or more of the categories listed below:
1. It is owned by a limited liability partnership of shareholders of which are among the 100 largest power producers.
2. The owner of the plant as listed in EIA-860 is a subsidiary of a company that is among the 100 largest power producers.
3. It was sold or bought during the year 2016. Because form 10-K for a particular year is usually filed by the producer in the first quarter of the
following year, this report assumes that ownership as reported in form 10-K is more accurate.
Publicly available data do not provide a straightforward means to accurately track lease arrangements and power purchase agreements. Therefore, in order to
apply a standardized methodology to all companies, this report allocates generation and any associated emissions according to reported asset ownership as of
December 31, 2016.
Identifying “who owns what” in the dynamic electricity generation industry is probably the single most difficult and complex part of this report. In addition to the
categories listed above, shares of power plants are regularly traded and producers merge, reorganize, or cease operations altogether. While considerable
effort was expended in ensuring the accuracy of ownership information reflected in this report, there may be inadvertent errors in the assignment of ownership
for some plants where public information was either not current or could not be verified.
Generation Data and Cogeneration Facilities
Plant generation data used in this report come from EIA Form 923.
Cogeneration facilities produce both electricity and steam or some other form of useful energy. Because electricity is only a partial output of these plants, their
reported emissions data generally overstate the emissions associated with electricity generation. Generation and emissions data included in this report for
cogeneration facilities have been adjusted to reflect only their electricity generation. For all such cogeneration facilities emissions data were calculated on the
basis of heat input of fuel associated with electricity generation only. Consequently, for all such facilities EIA Form 923, which report a plant’s total heat input as
well as that which is associated with electricity production only, was used to calculate their emissions.
24

Benchmarking Air Emissions of the 100 Largest Electric Power Producers in the United States
Full Report at: www.mjbradley.com
JUNE 2018
Appendix: Methodology (continued)
NOx and SO2 Emissions
The EPA AMP database collects and reports SO2 and NOx emissions data for nearly all major power plants in the U.S. Emissions information reported in the
AMP database is collected from continuous emission monitoring (CEM) systems. SO2 and NOx emissions data reported to the AMP account for all of the SO2
and NOx emissions assigned to the 100 largest power producers in this report.
The AMP database collects and reports SO2 and NOx emissions data by fuel type at the boiler level. This report consolidates this data at the generating unit
and plant levels. In the case of jointly owned plants, because joint ownership is determined by producer’s share of installed capacity, assignment of SO2 and
NOx emissions to the producers on this basis implicitly assumes that emission rates are uniform across the different units. This may cause producers to be
assigned emission figures that are slightly higher or lower than their actual shares.
The appointment of NOx emissions between coal and natural gas at boilers that can burn both fuels may in certain instances sl ightly overstate coal’s share of
the emissions. This situation is likely to arise when a dual-fuel boiler that is classified as “coal-fired” within AMP burns natural gas to produce electricity in
substantial amounts. In most years there would be very little economic reason to make this switch in a boiler that is not part of a combined cycle setup.
Continued low natural gas prices in 2016 led to a small number of boilers switching to natural gas for most or a large part of their electricity output. Because
AMP datasets do not make this distinction, apportioning emissions based on the fuel-type of the boiler would increase coal’s share of emissions.
SO2 and CO2 emissions are mostly not affected by this issue. Natural gas emits virtually no SO2. CO2 emissions can be calculated from the heat input data
reported in EIA Form 923, which allows for the correct apportionment of emissions between coal and natural gas.
CO2 Emissions
A majority of CO2 emissions used in this report were calculated using heat input data from EIA form 923 and carbon content coefficients of various fuel types
provided by EPA. The table on the following slide shows the carbon coefficients used in this procedure. Non-emitting fuel types, whose carbon coefficients are
zero, are not shown in the table. CO2 emissions reported through the EPA AMP account for a small share of the CO2 emissions used in this report.
The datasets report heat input and emissions data by fuel type at either the prime mover or boiler level. This report consolidates that data at the generating unit
and plant levels. In the case of jointly owned plants, because joint ownership is determined by producer’s share of installed capacity, assignment of CO2
emissions to the producers on this basis implicitly assumes that emission rates are uniform across the different units. This may cause producers to be assigned
emission figures that are slightly higher or lower than their actual shares.
Mercury Emissions
Mercury emissions data for coal power plants presented in this report were obtained from EPA’s Toxic Release Inventory (TRI). Mercury emissions reported to
the TRI are based on emission factors, mass balance calculations, or data monitoring. The TRI contains facility-level information on the use and environmental
release of chemicals classified as toxic under the Clean Air Act. The TRI contains information on all toxic releases from a facility; mercury emissions in this
report are based on air releases only. Because coal plants are the primary source of mercury emissions within the electric industry, the mercury emissions and
emission rates presented in this report reflect the emissions associated with each producer’s fleet of coal plants only.
25

Benchmarking Air Emissions of the 100 Largest Electric Power Producers in the United States
Full Report at: www.mjbradley.com
JUNE 2018
Appendix: Carbon Content Coefficients by Fuel Type
From Annex 2 of EPA GHG Inventory 2018
26
Fuel TypeCarbon Content Coefficients
(Tg Carbon/Qbtu)
Coal
Anthracite Coal 28.28
Bituminous Coal 25.44
Sub-bituminous Coal 26.50
Lignite Coal 26.65
Waste/Other Coal
(includes anthracite culm, bituminous gob, fine coal, lignite waste, waste coal)26.05
Coal-based Synfuel, including briquettes, pellets, or extrusions, which are formed by
binding materials or processes that recycle materials25.34
Coal-based Synthetic Gas 18.55
Oil
Distillate Fuel Oil
(Diesel, No. 1, No. 2, and No. 4 Fuel Oils)20.17
Jet Fuel 19.70
Kerosene 19.96
Residual Fuel Oil (No. 5, No. 6 Fuel Oils, and Bunker C Fuel Oil) 20.48
Waste/Other Oil
(including Crude Oil, Liquid Butane, Liquid Propane, Oil Waste, Re-Refined Motor Oil,
Sludge Oil, Tar Oil, or other petroleum-based liquid wastes)
20.55
Petroleum Coke 27.85
Gas
Natural Gas 14.46
Blast Furnace Gas 18.55
Other Gas 18.55
Gaseous Propane 14.46

Benchmarking Air Emissions of the 100 Largest Electric Power Producers in the United States
Full Report at: www.mjbradley.com
JUNE 2018
Appendix: Quality Assurance
This report examines the air pollutant emissions of the 100 largest electricity generating companies in the United States based on 2016 electricity generation,
emissions, and ownership data. The report relies on publicly-available information reported by the U.S. Energy Information Administration (EIA), U.S.
Environmental Protection Agency (EPA), Securities and Exchange Commission (SEC), state environmental agencies, company websites, and media articles.
Emission data may include revisions to 2016 data that companies were in the process of submitting or have already submitted to EPA at the time of publication
of this report.
This report relies almost entirely on publicly available information. Data sets published by EIA and EPA are the primary source of the generation and emissions
data used in this report. The organizations that fund this report believe maintaining public access to this information is essential to tracking the industry’s
performance and making accurate and informed analyses and policy decisions.
27
Benchmarking Air Emissions of the 100 Largest Electric Power Producers in the United States
Full Report at: www.mjbradley.com
JUNE 2018
Endnotes
1. Private entities include investor-owned and privately held utilities and non-utility power producers (e.g., independent power producers). Cooperative
electric utilities are owned by their members (i.e., the consumers they serve). Publicly-owned electric utilities are nonprofit government entities that are
organized at either the local or State level. There are also several Federal electric utilities in the United States, such as the Tennessee Valley Authority.
2. Power plant ownership in this report is divided into three categories: privately/investor owned (investor-owned corporations, privately held corporations,
foreign-owned corporations), public power (federal power authorities, state power authorities, municipalities, power districts), and cooperative.
3. Electric Sector Emissions data from EPA AMP database available at http:// http://ampd.epa.gov/ampd/
Generation data from EIA Monthly Energy Review Table 7.2a Electricity Generation Total for All Sectors available at
https://www.eia.gov/totalenergy/data/monthly/#electricity
Gross Domestic Product (GDP) data from the U.S. Bureau of Economic Analysis available at https://www.bea.gov/national/index.htm#gdp
The sources used in the Annual Trends figure have already made national-level 2017 data available, allowing the trends section to extend through 2017.
Detailed 2017 data used for the company-specific analysis of the top 100 electricity producers was not yet available at the time of report publication.
28