berrigan shire liveability & healthy aging appendix focus... · financial burden providing...
TRANSCRIPT
Berrigan Shire Liveability & Healthy Aging
Focus Group Outcomes
September 2014
2 | P a g e Berrigan Shire Liveability & Healthy Aging Focus Group Outcomes
September 2013
Table of Contents
Focus Group Program : Transport ................................................................................................ 3
Focus Group Program : Grandparents and Child Care ............................................................. 5
Focus Group Program : Living Longer, Living Stronger ............................................................... 7
Focus Group Program : Access to Medical Care ..................................................................... 10
Focus Group Program : MPS Service Providers Session ............................................................ 12

3 | P a g e Berrigan Shire Liveability & Healthy Aging Focus Group Outcomes
September 2013
Focus Group Program : Transport Where are we now Transport:
In Berrigan (A) (Local Government Areas), 37.8% of occupied private dwellings had one registered motor vehicle garaged or parked at their address, 35.7% had two registered motor vehicles and 15.9% had three or more registered motor vehicles. Registered vehicles (2 or more) over NSW and Aust average
Information re: Public Transport (Providers / Timetables)
Information re: Community Transport (Libby Quick)
Community Bus Trial
Modes of transport o Car (private) o Public (govt funded or commercial) o Community (car or bus – volunteer based) o Active
Walking Bike Mobility Aids
Based on this overview of transport for older people if you could no longer drive or no longer use family/friends for transport on a scale of 1 – 10 how would this impact on the liveability of the town / district in which you live.
(Rate toward a 10 if the impact would be severe and cause you to consider leaving town and rate toward a 1 if there
would be no impact on your current lifestyle and perception of the liveability of your town’)
Participants rated liveability at 10 / 8 = the access to transport having a major impact on liveability.
Comments of the impacts are ;
Reduce liveability and forced to relocate to a regional town (Cobram)
Loss of dignity and choice
Family not always available
If no family nearby we are more reliant on others and I don’t like to bother them
No internet access or limited knowledge of the internet to book public transport
Can’t buy a ticket from the bus driver, no shop front to buy a ticket and we must use a credit card
Impromptu taxi service as an alternate transport option
Promote public transport as an option
Impact of the online generation (goods purchased and delivered etc) and how this will effect liveability
Timing of public transport to and from Albury & Shepparton is limited, with a narrow window of time in the
day between drop off and pick up
Introduce community education on how to use MyKey Cards for Melbourne Public Transport system
Lobby V-Line to introduce MyKey on to regional public transport so that it integrates for Country travellers.
Sale of MyKey cards at regional outlets and country train stations

4 | P a g e Berrigan Shire Liveability & Healthy Aging Focus Group Outcomes
September 2013
Q How do you or your family move about the Shire or the region and how will this change as you age?
Challenges & barriers were ;
Taxi Service : Cross border issues between Victoria and NSW
Vic / NSW Taxi Licensing Regulations : Pick up in Vic and drive to NSW (but not the other way)
Question of commercial viability of private taxi and ownership of 2 state taxi licences
Qualifications for HACC and Community Transport : limitations on who can use the service
Need more volunteer drivers to participate in Community Transport service
Economic Circumstances : some cannot afford to own or run a car
Unable to drive due to medical diagnosis creates a barrier to attend appointments
Need for a good path system that is safe. Walking tracks aid lifestyle. Liveability is enhanced by walking
circuits that take in the natural elements of the township such as river & parklands.
Gofers : aid liveability, are a good alternative transport mode and provide accessibility to local shops
Mobility Scooters / Gofers can be dangerous to road users, going too fast, unlicensed and unaware of road
rules.
Lack of Services to fix scooters
Q If you were responsible for planning and funding public transport for older people what would you prioritise (Choose one only) Priority ranking from most to least
Publicly funded taxi service
Public funded transport / bus offering a daily service
Fuel vouchers for pensioners – to be used with family/friends / neighbours
Improvements to footpaths, installation of seats, shading and lighting so that people could walk, use scooters, and other mobility aids
Community transport – volunteer drivers for social outings
Community bus – volunteer driven community bus on a regular time table
User pay taxi service
Thinking about your priority for planning and funding of transport for older people, if this were to be implemented on a scale of 1 – 10 how would you then rate the liveability of the town / district in which you live.
Participants now rated liveability at 1 = with improved access to transport having a major impact on liveability.

5 | P a g e Berrigan Shire Liveability & Healthy Aging Focus Group Outcomes
September 2013
Focus Group Program : Grandparents and Child Care Where are we now Grandparents and Childcare Handout: ABS Report and Berrigan Shire Child Care Stats http://abs.gov.au/ausstats/[email protected]/Lookup/4211.0main+features3October%202012
Reasons why a grandparent provides care for a grandchild So that the parents can
Work / study Have a time out and a break Shop Play Sport, Social Activity /Recreation Participate in community life ie volunteering
Other Reasons
Relationship building between grandparent and the grandchild Special time and understanding between generations (intergenerational bonding) 3 generations of family support Enjoyment and family time Builds trust, love, respect and patience Personal Reasons Medical emergencies / sickness grandparents will look after the grandchild In place of child care access
Q Thinking about the town in which you live or how generations change what are the biggest barriers or challenges you experience as a grandparent in providing care for a grandchild
The biggest barriers or challenges grandparents face in providing care for a grandchild are;
Has to have a car and have money for petrol
An ability to drive. Many grandparent have no licence to drive due to medical conditions.
Agility, fitness and good health to keep up with young children
Duty of care by the grandparents (on farm child proofing is important for safety)
Relationship between the parent and the grandparent is important
Style of parenting and care (with common ground rules)
Financial burden providing grandchildren with food, nappies and play essentials
Balance between grandparent caring and their own time
Other ways to spend time as we age, travelling, learning new skills in retirement, hobbies and social outings
Not saying NO and missing other opportunities

6 | P a g e Berrigan Shire Liveability & Healthy Aging Focus Group Outcomes
September 2013
Q If you were responsible for planning and funding formal child care or facilities used by children & grandparents what would you prioritise (Choose one only) Priority ranking from most to least
Increase access to and availability of Child Care for working parents
Increase funding for After School Hours and Vacation Care programs
Increase funding and support for grandparents who find that they are full time / part time carers of grandchildren
Increase access to and availability of child care for ‘parent respite’
Improvements to footpaths, installation of seats, shading so grandparents can accompany children to parks
Thinking about your priority for planning and funding of child care / support for grandparents if this were to be implemented on a scale of 1 – 10 how would you then rate the liveability of the town / district in which you live.
With priority for planning and funding of child care support for grandparents implemented participants ranked
liveability as 1.

7 | P a g e Berrigan Shire Liveability & Healthy Aging Focus Group Outcomes
September 2013
Focus Group Program : Living Longer, Living Stronger Where are we now Active Ageing and Life Expectancy Wellbeing Profile
Based on this overview active ageing and life expectancy if you could no longer participate in your community / club /or activity of choice on a scale of 1 – 10 how would this impact on the liveability of the town / district in which you live. (Rate toward a 10 if the impact would be severe and cause you to consider leaving town and rate toward a 1 if there would be no impact on your current lifestyle and perception of the liveability of your town’)
Participants rated liveability at 8 = without participation in community life (hobby / club /or activity of choice), it
would have a major impact on liveability.
Comments attributed to this were ;
o Participation in community life is healthy
o My independence and if I could no longer walk to the shops
o My driver’s licence and access to a car will impact on this liveability
o Access to family, friends and good neighbours
The link between living longer and being stronger as we age and involvement in social / community activities and clubs is well established Q If you are a member and regular participant in a sports/social or service club or community activity – would you increase your involvement if you had: (in order of priority) ;
Friends / colleagues / team members etc If the club / community was more welcoming i.e.: reached out Opportunities for social engagements (ie red hatters / mens shed) More Time If weather allows More money Better Physical Health Interest in or a role in club activities / administration Transport

8 | P a g e Berrigan Shire Liveability & Healthy Aging Focus Group Outcomes
September 2013
What would you change so that as we all live longer you could be more independent within your home?
HACC assessment and look at alterations before they are needed, implement railings & ramps and wheel
chair access
I have a large home, so it would need to be cut in half and make home modifications
Down size to a unit
Choose a place to relocate to that has services, security and peace
Employ a gardener, handy man and cleaner
Keeping fit and active, with strong mental health
What challenges would you experience if you wanted to change your home so that you could be more
independent
Down size – getting rid of my junk.
Stress and emotional strain of relocation and moving
I have accumulated all this stuff that is too good to throw away.
Sentimental memories with this stuff. How do I down size ?
Cost involved in home modifications (ripping out the bath etc)
Cost involved in weekly outsourcing (cleaning, gardening etc)
Getting over the loss of independence (asking for help)
Trusting help and appreciating the assistance
Challenges of technology when seeking information
Choice of units close to town is limited
If circumstances changed and you required assistance at home… what would you need?
o Day care activities (Deniliquin & Barooga)
o Transport / Gofer Scooter
o Rails, ramps and specified carer
o Social support in the home (visitors making daily visits and companionship)
o House cleaning, handyman and gardener.
If your home allows you to be independent what makes it liveable (inside and outside) as you age?
Good maintenance, clean modern home that is warm in winter and cool in summer
Homes purpose built to accommodate a wheelchair
Purpose built facility (Amaroo / Noonameena)
Security, privacy and feel safe at home
Like my own space which is open and easy to live in
Sunny aspect and natural setting
Small or large garden that allows me to potter and be active
Neighbourly care : always someone there to help with cooking and shopping
Village life, popping down the street to socialise and do errands
Independent, freedom and care of neighbours
9 | P a g e Berrigan Shire Liveability & Healthy Aging Focus Group Outcomes
September 2013
What makes you live stronger?
Exercise, Walking every day and gentle exercise classes
Walking groups would encourage participation and motivation
Own a dog, he makes you walk every day
People : social interaction, conversations, care and purpose for the day
Mental exercise : crafts, reading, cross words
Every day activities : active gardening, cleaning, cooking & wine !
Keeping active at home
Diet and Healthy fresh food : no preservatives, no salt, no sugar
Doing things that give me quality of life
Connecting with family (locally or via technology)
Having a purpose every day (hobbies such as golf and bingo)
Regular checkups with the doctor
Q If you were responsible for planning and funding programs that promote living longer and well being in rural Australia what would it be (Choose one only) In order of priority ;
Increase accessibility (improve pedestrian access, parking, lighting, after hours transport) of local clubs, community facilities, retail centres
Including group and self exercise programs (walking groups & transport to heated pool)
Low cost commercial & community based health and physical recreation programs
More funding for in-home nursing support home modifications
More funding for self care units
Planning laws requiring that new homes, mobile home estates be accessible / adaptable
Subsidies and assistance for existing home owners who modify their homes and access to their home (before it is needed)
Thinking about your priority if this were to be implemented on a scale of 1 – 10 how would you rate the liveability of the town / district in which you live.
Participants now rated liveability as 1 with the implementation of priorities greatly improving the aging and
liveability of their town.
10 | P a g e Berrigan Shire Liveability & Healthy Aging Focus Group Outcomes
September 2013
Focus Group Program : Access to Medical Care
Based on this overview of medical service providers and waiting lists on a scale of 1 – 10 how does this impact on the liveability of the town / district in which you live. (Rate toward a 10 if the impact would be severe and cause you to consider leaving town and rate toward 1 if there would be no impact on your current lifestyle and perception of the liveability of your town’)
Participants rated liveability at 6 -7; stating that the Berrigan Shire is currently well placed with access to medical
services, dedication and commitment of GP’s and a range of hospital, aged care and nursing services to cater for the
elderly.
Thinking about access to medical services and health care in your town what would you like to see improved:
Key areas for improvement in the access to medical services focused on
Limited or no access to Physiotherapy
Limited or no access to Occupational Therapy
Opportunity for Hospital, Aged Care, Nursing Home, Doctors and Community Health to share a private
services in Physiotherapy and Occupational Therapy
Difficulty in recruiting a qualified Physiotherapist or Occupational Therapist to the region
Waiting times to see a GP was between 3-4 days which seemed reasonable to participants
Increasing role of triage nurses and practise nurses in GP’s
Difficulty accessing GP locum services to the region
Waiting times for Dentist was identified as an issue, due to part time nature of private dentists and irregular
town visitations. The dentist facilities are available but there is difficulty in recruiting a private dentist to the
region.
Response times for emergencies. Berrigan has 4 paramedics living in town, Finley has a good ambulance
service, however Tocumwal has a first responder service run by SES with support from Cobram Ambulance
and Finley Hospital.
Physical access for residents to medical services was viewed by participants as being good, with hospital or
MPS’s centrally located and well equipped.
Pharmacy services in Finley were identified as not meeting the needs of the local community, due to
business practises and customer service issues.
11 | P a g e Berrigan Shire Liveability & Healthy Aging Focus Group Outcomes
September 2013
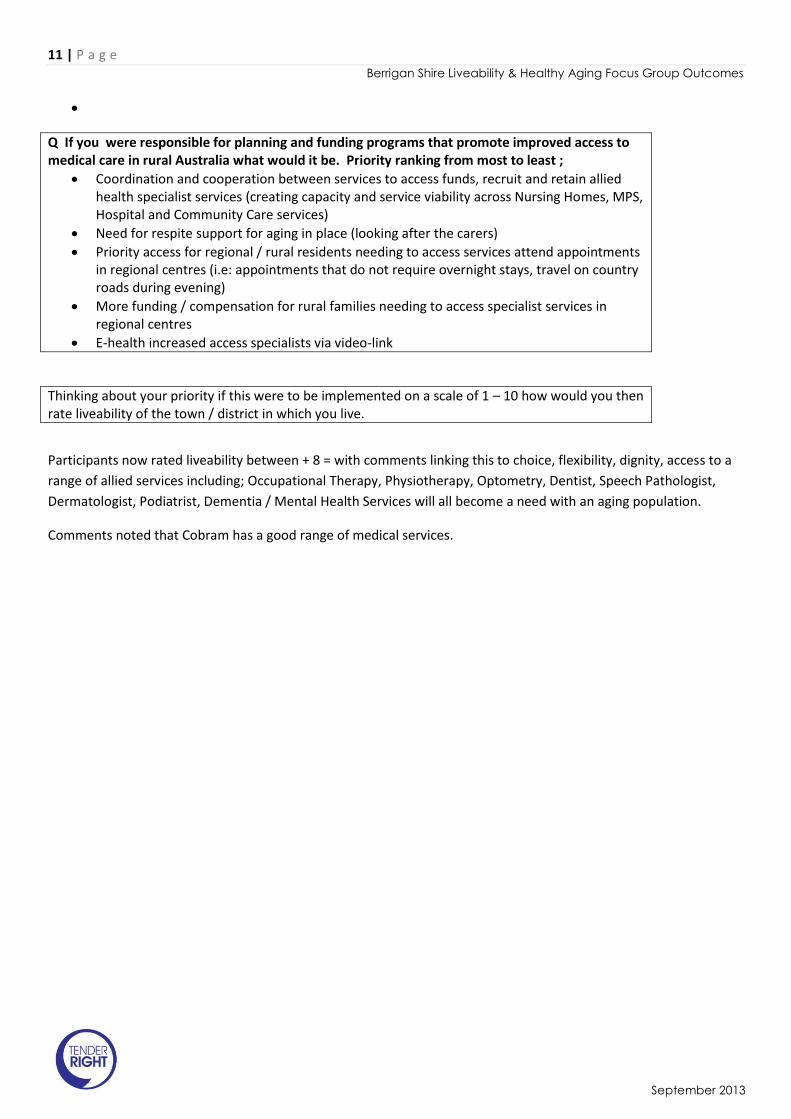
Q If you were responsible for planning and funding programs that promote improved access to medical care in rural Australia what would it be. Priority ranking from most to least ;
Coordination and cooperation between services to access funds, recruit and retain allied health specialist services (creating capacity and service viability across Nursing Homes, MPS, Hospital and Community Care services)
Need for respite support for aging in place (looking after the carers)
Priority access for regional / rural residents needing to access services attend appointments in regional centres (i.e: appointments that do not require overnight stays, travel on country roads during evening)
More funding / compensation for rural families needing to access specialist services in regional centres
E-health increased access specialists via video-link
Thinking about your priority if this were to be implemented on a scale of 1 – 10 how would you then rate liveability of the town / district in which you live.
Participants now rated liveability between + 8 = with comments linking this to choice, flexibility, dignity, access to a
range of allied services including; Occupational Therapy, Physiotherapy, Optometry, Dentist, Speech Pathologist,
Dermatologist, Podiatrist, Dementia / Mental Health Services will all become a need with an aging population.
Comments noted that Cobram has a good range of medical services.

12 | P a g e Berrigan Shire Liveability & Healthy Aging Focus Group Outcomes
September 2013
Focus Group Program : MPS Service Providers Session
Based on the overview of medical service providers and waiting lists on a scale of 1 – 10 how does this impact on the liveability of the town / district in which you live. (Rate toward a 10 if the impact would be severe and cause you to consider leaving town and rate toward 1 if there would be no impact on your current lifestyle and perception of the liveability of your town’)
Participants rated liveability at 6 -7; stating that the Berrigan Shire is currently well placed with access to medical
services, dedication and commitment of GP’s and a range of hospital, aged care and nursing services to cater for the
elderly.
It was noted that when there are gaps in the provision of allied health services the community is often able to
develop creative and innovative solutions to these problems, however Government funding does not always
accommodate community led solutions.
Thinking about access to medical services and health care in your town what would you like to see improved:
Key areas for improvement in the access to medical services focused on ;
Government funding of innovative, flexible and community drive solutions
Greater flexibility in the funding models for rural health provision
Need to attract medical practitioners in the areas of dentistry and physiotherapy
Greater utilisation of existing community health facilities ie dentist chair in Berrigan
Outstanding medical facilities that are sometimes under utilised
Create a model to underwrite the dentist by $80,0000 per year using government funding
Create a simple system for funding rural medical services, removing the complexity and its inflexible nature
Q If you were responsible for planning and funding programs that promote living longer and well being in rural
Australia what would it be
More Community Aging Packages (HACC $$) for aging at home
Minimal investment for aging at home vs the cost of institutional care
Home Care Programs (handyman, gardening)
Meals on Wheels
Social support of neighbours
Day Care and Day Activity Services
Community Social activities including Men’s Shed, Sewing Groups and Red Hatters
Building and design frameworks that take into account aging, mobility needs and HOBS
In order to keep people at home longer greater funding is needed through HACC for early intervention &
crisis prevention services.
An example of this sited was organising a supply of wood for heating in winter prevented an elderly woman
from a hospital stay due to contracting phenomena.

13 | P a g e Berrigan Shire Liveability & Healthy Aging Focus Group Outcomes
September 2013
Q Thinking about the town in which you live or how generations change what are the biggest barriers or challenges you experience as a grandparent in providing care for a grandchild
The biggest barriers or challenges grandparents face in providing care for a grandchild are;
Grandparents feeling the expectations and pressure to care for grandchildren
Increasing informal carer role of grandparents providing care for grandchildren
Grandparents age determines the level of care they can provide
Some don’t have the energy to care for young children
Grandparents are not always able to connect with or are picked up by Child Care Services
Expectations of parenting is transferred to the grandparents (intergenerational changes in parenting styles)
When the parents and grandchildren live away, grandparents spend time travelling between home and away
Parents high aspirations are transferred to Grandparents
Increasing standards of living and way of life induces both parents working
Lack of next generational leadership as Parents work, lack of volunteers (of 150 HACC volunteers in the Shire
only 2 are under 60 years
Volunteers do what interests them…
The social fabric is changing and will challenge our community
Women now want to work
Guilt = family priorities = time => stress
Compromising liveability = work life balance
Service providers will need a success plan to engage volunteers
Q If you were responsible for planning and funding public transport for older people what would you prioritise
(Choose one only)
Priority ranking from most to least
Publicly funded taxi service (using IPTAS funding structure & taxi vouchers)
Improvements to footpaths, installation of seats, shading and lighting so that people could walk, use
scooters, and other mobility aids
Community transport
User pay taxi service
Public funded transport / bus offering a daily service
Fuel vouchers for pensioners – to be used with family/friends / neighbours
Community bus – volunteer driven community bus on a regular time table
14 | P a g e Berrigan Shire Liveability & Healthy Aging Focus Group Outcomes
September 2013
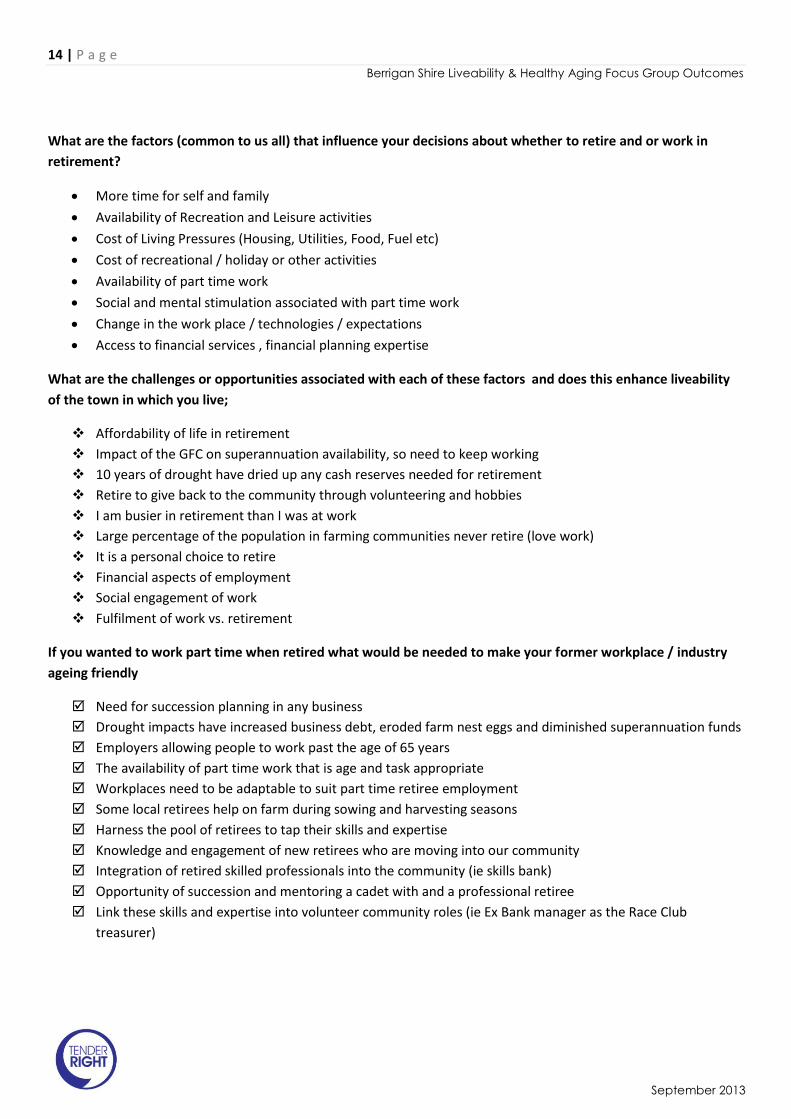
What are the factors (common to us all) that influence your decisions about whether to retire and or work in
retirement?
More time for self and family
Availability of Recreation and Leisure activities
Cost of Living Pressures (Housing, Utilities, Food, Fuel etc)
Cost of recreational / holiday or other activities
Availability of part time work
Social and mental stimulation associated with part time work
Change in the work place / technologies / expectations
Access to financial services , financial planning expertise
What are the challenges or opportunities associated with each of these factors and does this enhance liveability
of the town in which you live;
Affordability of life in retirement
Impact of the GFC on superannuation availability, so need to keep working
10 years of drought have dried up any cash reserves needed for retirement
Retire to give back to the community through volunteering and hobbies
I am busier in retirement than I was at work
Large percentage of the population in farming communities never retire (love work)
It is a personal choice to retire
Financial aspects of employment
Social engagement of work
Fulfilment of work vs. retirement
If you wanted to work part time when retired what would be needed to make your former workplace / industry
ageing friendly
Need for succession planning in any business
Drought impacts have increased business debt, eroded farm nest eggs and diminished superannuation funds
Employers allowing people to work past the age of 65 years
The availability of part time work that is age and task appropriate
Workplaces need to be adaptable to suit part time retiree employment
Some local retirees help on farm during sowing and harvesting seasons
Harness the pool of retirees to tap their skills and expertise
Knowledge and engagement of new retirees who are moving into our community
Integration of retired skilled professionals into the community (ie skills bank)
Opportunity of succession and mentoring a cadet with and a professional retiree
Link these skills and expertise into volunteer community roles (ie Ex Bank manager as the Race Club
treasurer)
Focus Group Program – Transport
Time Presenter
5 mins Introduction – Session Outline Jo
5 Mins Where are we now Transport:
In Berrigan (A) (Local Government Areas), 37.8% of occupied private dwellings had one registered motor vehicle garaged or parked at their address, 35.7% had two registered motor vehicles and 15.9% had three or more registered motor vehicles. Registered vehicles (2 or more) over NSW and Aust average
Information re: Public Transport (Providers / Timetables)
Information re: Community Transport (Libby Quick)
Community Bus Trial
Modes of transport o Car (private) o Public (govt funded or commercial) o Community (car or bus – volunteer based) o Active
Walking Bike Mobility Aids
Handout
Jo
5 mins Based on this overview of transport for older people if you could no longer drive or no longer use family/friends for transport on a scale of 1 – 10 how would this impact on the liveability of the town / district in which you live. (Rate toward a 10 if the impact would be severe and cause you to consider leaving town and rate toward a 1 if there would be no impact on your current lifestyle and perception of the liveability of your town’)
Katrina
20 mins Q How do you or your family move about the Shire or the region and how will this change as you age?
Challenges/ barriers due to age for each mode or form of transport
Note life course differences
Katrina
20 mins Q If you were responsible for planning and funding public transport for older people what would you prioritise (Choose one only)
Community transport – volunteer drivers for social outings
Katrina

Time Presenter
Community bus – volunteer driven community bus on a regular time table
User pay taxi service
Publicly funded taxi service
Public funded transport / bus offering a daily service
Fuel vouchers for pensioners – to be used with family/friends / neighbours
Improvements to footpaths, installation of seats, shading and lighting so that people could walk, use scooters, and other mobility aids
5 mins Thinking about your priority for planning and funding of transport for older people, if this were to be implemented on a scale of 1 – 10 how would you then rate the liveability of the town / district in which you live.
Katrina
5 mins Next Steps Invitation to Assessing Liveability Workshops
Jo
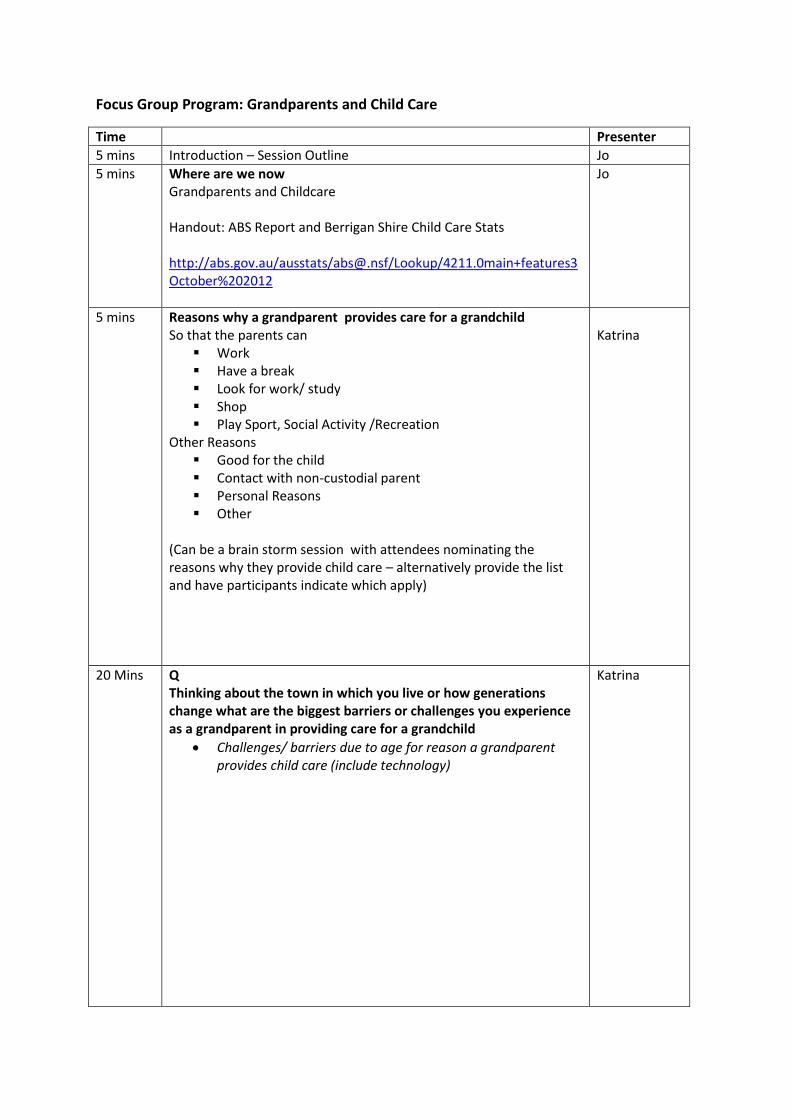
Focus Group Program: Grandparents and Child Care
Time Presenter
5 mins Introduction – Session Outline Jo
5 mins Where are we now Grandparents and Childcare Handout: ABS Report and Berrigan Shire Child Care Stats http://abs.gov.au/ausstats/[email protected]/Lookup/4211.0main+features3October%202012
Jo
5 mins Reasons why a grandparent provides care for a grandchild So that the parents can
Work Have a break Look for work/ study Shop Play Sport, Social Activity /Recreation
Other Reasons Good for the child Contact with non-custodial parent Personal Reasons Other
(Can be a brain storm session with attendees nominating the reasons why they provide child care – alternatively provide the list and have participants indicate which apply)
Katrina
20 Mins Q Thinking about the town in which you live or how generations change what are the biggest barriers or challenges you experience as a grandparent in providing care for a grandchild
Challenges/ barriers due to age for reason a grandparent provides child care (include technology)
Katrina

Time Presenter
20 mins Q If you were responsible for planning and funding formal child care or facilities used by children & grandparents what would you prioritise (Choose one only)
Improvements to footpaths, installation of seats, shading so grandparents can accompany children to parks
Increase funding and support for grandparents who find that they are full time / part time carers of grandchildren
Increase funding for After School Hours and Vacation Care programs
Increase access to and availability of Child Care for working parents
Increase access to and availability of child care for ‘parent respite’
Katrina
5 mins Thinking about your priority for planning and funding of child care / support for grandparents if this were to be implemented on a scale of 1 – 10 how would you then rate the liveability of the town / district in which you live.
Katrina
5 mins Next Steps Invitation to Assessing Community Facilities and Liveability Workshops
Jo
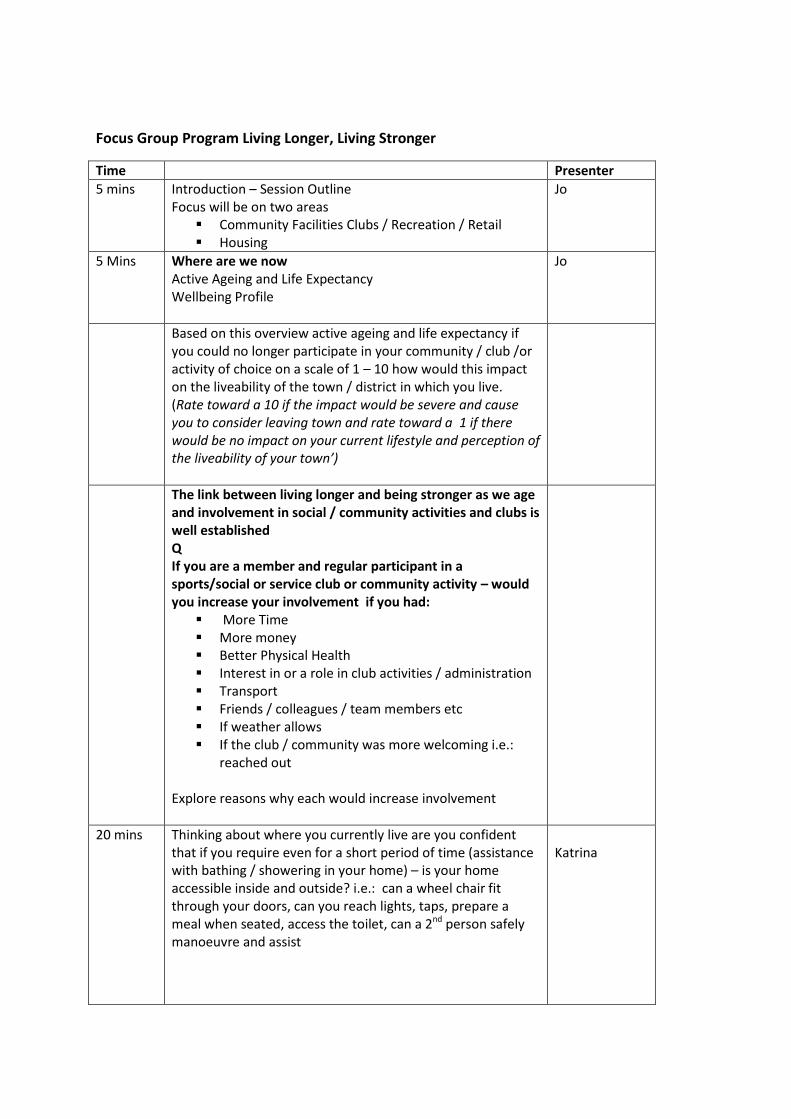
Focus Group Program Living Longer, Living Stronger
Time Presenter
5 mins Introduction – Session Outline Focus will be on two areas
Community Facilities Clubs / Recreation / Retail Housing
Jo
5 Mins Where are we now Active Ageing and Life Expectancy Wellbeing Profile
Jo
Based on this overview active ageing and life expectancy if you could no longer participate in your community / club /or activity of choice on a scale of 1 – 10 how would this impact on the liveability of the town / district in which you live. (Rate toward a 10 if the impact would be severe and cause you to consider leaving town and rate toward a 1 if there would be no impact on your current lifestyle and perception of the liveability of your town’)
The link between living longer and being stronger as we age and involvement in social / community activities and clubs is well established Q If you are a member and regular participant in a sports/social or service club or community activity – would you increase your involvement if you had:
More Time More money Better Physical Health Interest in or a role in club activities / administration Transport Friends / colleagues / team members etc If weather allows If the club / community was more welcoming i.e.:
reached out Explore reasons why each would increase involvement
20 mins Thinking about where you currently live are you confident that if you require even for a short period of time (assistance with bathing / showering in your home) – is your home accessible inside and outside? i.e.: can a wheel chair fit through your doors, can you reach lights, taps, prepare a meal when seated, access the toilet, can a 2nd person safely manoeuvre and assist
Katrina
Time Presenter
If not, what would you change so that as we all live longer you could be more independent within your home? What challenges would you experience if you wanted to change your home so that you could be more independent If your home allows you to be independent what makes it liveable (inside and outside) as you age?
20 mins Q If you were responsible for planning and funding programs that promote living longer and well being in rural Australia what would it be (Choose one only)
Low cost commercial and community based health and physical recreation / activity programs
Planning laws requiring that new homes, mobile home estates be accessible / adaptable
Subsidies and assistance for existing home owners who modify their homes and access to their home (before it is needed)
More funding for in-home nursing support home modifications
More funding for self care units
Increase accessibility (improve pedestrian access, parking, lighting, after hours transport) of local clubs, community facilities, retail centres
Katrina
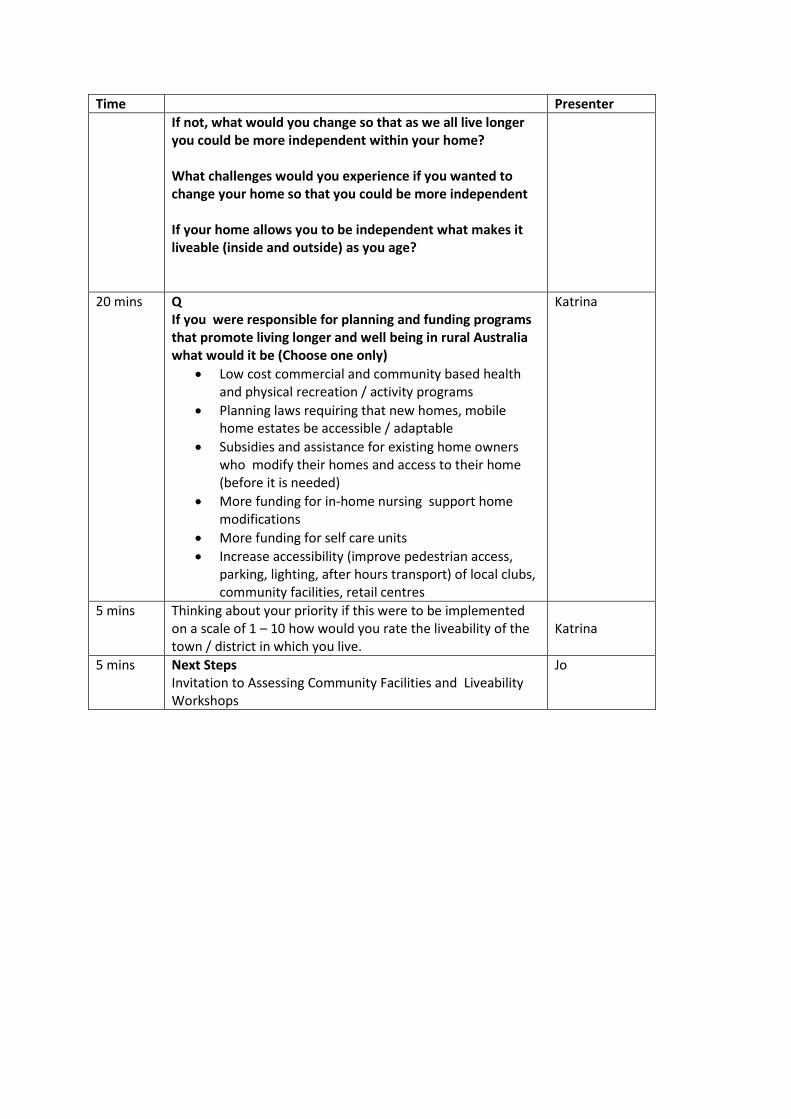
5 mins Thinking about your priority if this were to be implemented on a scale of 1 – 10 how would you rate the liveability of the town / district in which you live.
Katrina
5 mins Next Steps Invitation to Assessing Community Facilities and Liveability Workshops
Jo

Focus Group Access to Medical Care
Time Presenter
5 mins Introduction – Session Outline
Jo
5 Mins Where are we now Wellbeing Profile Practitioner Availability Liveability and what it means
Jo
5 mins Based on this overview of medical service providers and waiting lists on a scale of 1 – 10 how does this impact on the liveability of the town / district in which you live. (Rate toward a 10 if the impact would be severe and cause you to consider leaving town and rate toward 1 if there would be no impact on your current lifestyle and perception of the liveability of your town’)
20 mins Thinking about access to medical services and health care in your town what would you like to see improved:
Waiting times for GP appointments
Waiting times for Physio appointments
Waiting times for OT
Waiting times for Dentistry
Response times for emergencies
Choice re: health care service providers
Physical access to health care providers / facilities When thinking about this question – think about whether or not you expect an appointment on the same day or within a certain period of time as this may be different.
Katrina
Q If you were responsible for planning and funding programs that promote improved access to medical care in rural Australia what would it be (Choose one only)
More funding for specialist services in small towns
More funding / compensation for rural families needing to access specialist services in regional centres
Priority access for regional / rural residents needing to access services attend appointments in regional centres (i.e: appointments that do not require overnight stays, travel on country roads during evening)
E-health increased access specialists via video-link
Other
Katrina

Time Presenter
5 mins Thinking about your priority if this were to be implemented on a scale of 1 – 10 how would you then rate liveability of the town / district in which you live.
Katrina
5 mins Next Steps Invitation to Assessing Community Facilities and Liveability Workshops
Jo
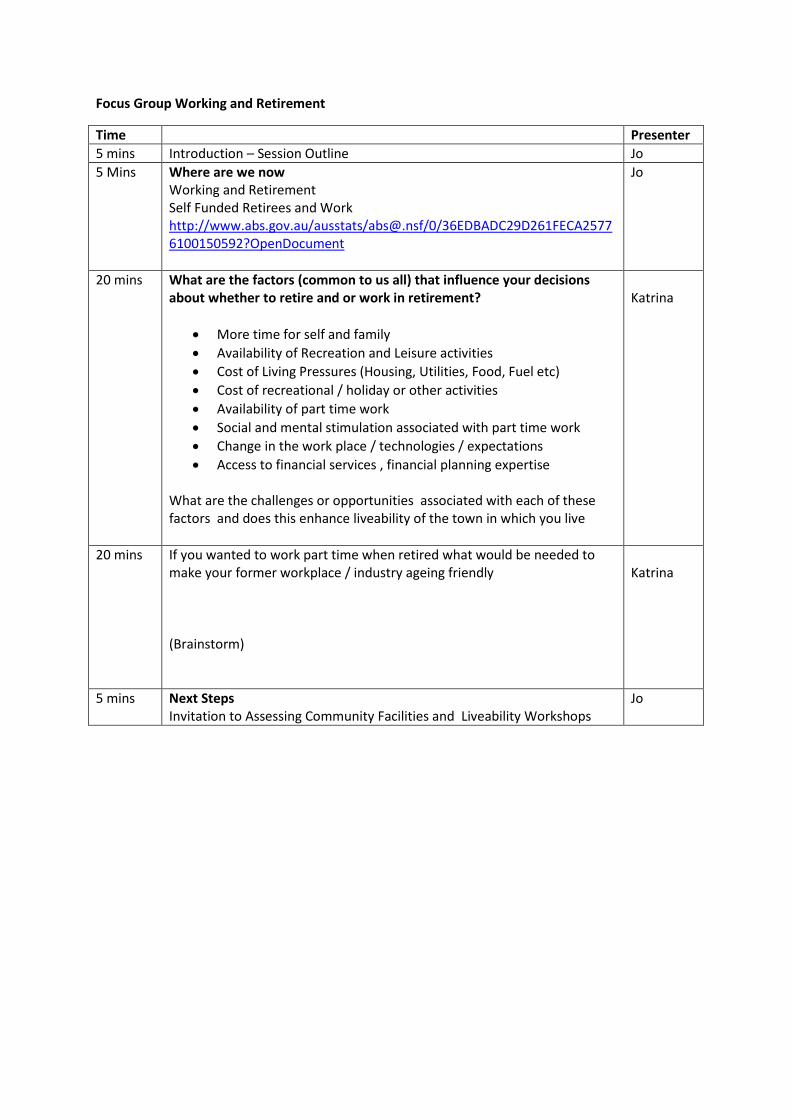
Focus Group Working and Retirement
Time Presenter
5 mins Introduction – Session Outline Jo
5 Mins Where are we now Working and Retirement Self Funded Retirees and Work http://www.abs.gov.au/ausstats/[email protected]/0/36EDBADC29D261FECA25776100150592?OpenDocument
Jo
20 mins What are the factors (common to us all) that influence your decisions about whether to retire and or work in retirement?
More time for self and family
Availability of Recreation and Leisure activities
Cost of Living Pressures (Housing, Utilities, Food, Fuel etc)
Cost of recreational / holiday or other activities
Availability of part time work
Social and mental stimulation associated with part time work
Change in the work place / technologies / expectations
Access to financial services , financial planning expertise What are the challenges or opportunities associated with each of these factors and does this enhance liveability of the town in which you live
Katrina
20 mins If you wanted to work part time when retired what would be needed to make your former workplace / industry ageing friendly (Brainstorm)
Katrina
5 mins Next Steps Invitation to Assessing Community Facilities and Liveability Workshops
Jo

Transport Focus Group
Background
According to ABS at a broad level transport
activity is the movement of people or goods
from one location to another
Modes of transport
o Car (private)
o Public (govt funded or
commercial)
o Community (car or bus –
volunteer based)
o Active
Walking
Bike
Mobility Aids
Council of Australian Governments Priorities
for Transport are:
Urban congestion
Carbon emission
Road pricing and
Health
In Australia (2013 Motor Vehicle Census)
There were 750 motor vehicles per 1,000 Estimated Resident.
This compares with 723 vehicles per 1,000 population in 2008, an increase of 27 vehicles per 1,000 population over this time.
In 2011 Population Census in the Berrigan (A)
(Local Government Area),
37.8% of occupied private dwellings had
one registered motor vehicle garaged or
parked at their address,
35.7% had two registered motor vehicles
and
15.9% had three or more registered
motor vehicles.
Registered vehicles (2 or more) over NSW
and Aust average
Public Transport Berrigan Shire:
Country Link & Vline
destinations/connections include:
Cobram, Melbourne, Sydney, Albury, Wagga
Wagga, Shepparton, Bendigo, Griffith,
Adelaide, Canberra, Brisbane
No commercially provided taxi services are
operated – Clubs do provide limited transport
Community Transport:
HACC
Conclusion:
Number of Motor vehicle registered use is
increasing and in the Berrigan Shire motor
vehicle registration (= use) is above Australian
and NSW average.
As we consider future options what does the
data tell us about what type of investment
would be attractive to private operators and
government in transport in our Shire. Is
‘forced car owner ship’ about a lack of options
or choice or would we prefer to travel by car
rather than use public or community
transport even if it were available?

Access to Medical Care Briefing Berrigan Shire Council Health and Wellbeing Profile has been compiled by Council to provide local
services, Council and residents with information about the health and wellbeing of Shire residents.
It can be used to provide information for grant applications in addition to providing over time a
record of the health and wellbeing of Shire residents. It is updated annually and or when new data
becomes available. Copies of the Profile are available on the Shire’s website, through Council
libraries or by Contacting Jo Ruffin, Strategic and Social Planning Coordinator Berrigan Shire Council.
Summary extract of health services
Numbers of GPs, GP Registrars, Practice nurses and practice managers in the HML in 2012
N GPs N GP Registrars N Practice nurses N Practice managers
Berrigan 7 0 7 4
Jerilderie 1 0 0 1
There are five aged care facilities in the Berrigan area. Service 1 has 23 low care beds. Service 2 has
10 high care beds. Service 3 has 41 high care beds and 14 secure beds. Service 4 has 20 low care
beds and 1 respite bed. The last service (5) has 31 low care beds and 1 respite bed.
There are three hospital/multi-purpose centres in the Berrigan area. All three have less than 50 beds
and provide accident and emergency services, admissions and outpatient services. Two centres
provide aged care, one provides geriatric assessment and two provide cancer treatments.
In 2010-11, in service 1, 254 medical emergency, and 77 medical other admissions were reported
with an average length of stay for acute of 3.8 days. Service 2 reported 136 medical emergency, 89
medical other and less than 10 surgical other admissions. Length of stay for acute care was 3.0 days.
Service 3 reported 155 medical emergency and 94 medical other admissions with an average length
of stay of 3.5 days.
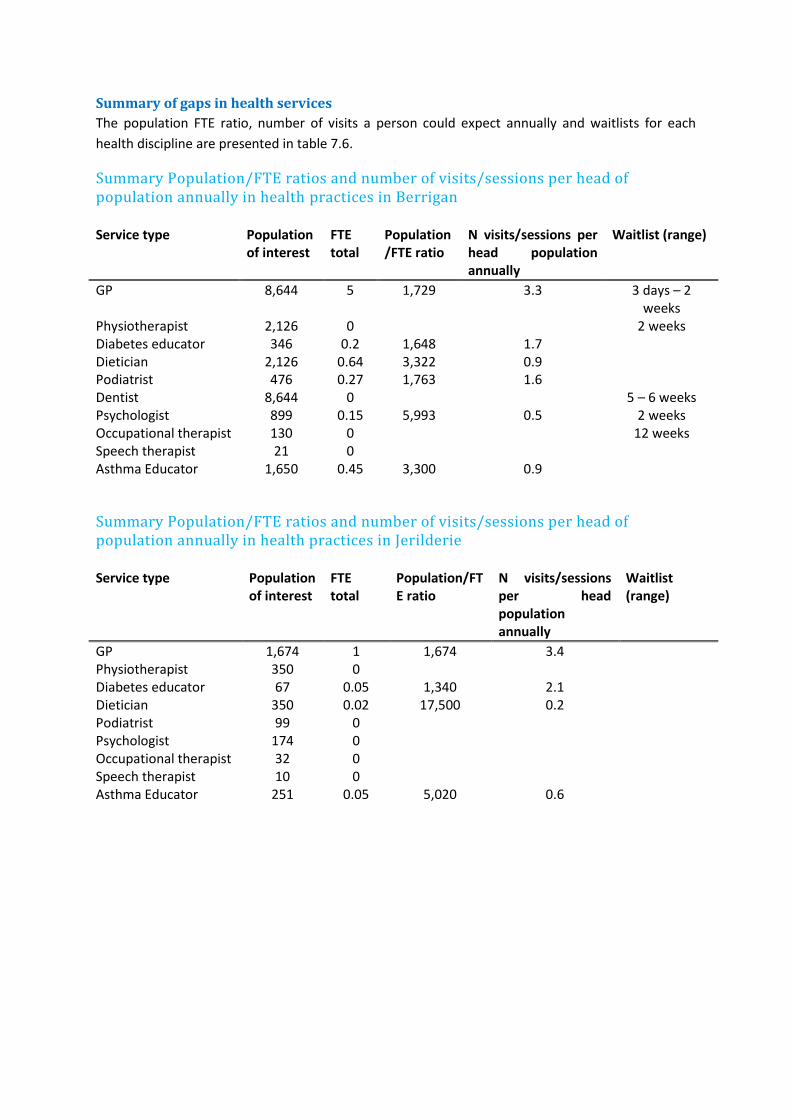
Summary of gaps in health services
The population FTE ratio, number of visits a person could expect annually and waitlists for each
health discipline are presented in table 7.6.
Summary Population/FTE ratios and number of visits/sessions per head of population annually in health practices in Berrigan
Service type Population of interest
FTE total
Population/FTE ratio
N visits/sessions per head population annually
Waitlist (range)
GP 8,644 5 1,729 3.3 3 days – 2 weeks
Physiotherapist 2,126 0 2 weeks Diabetes educator 346 0.2 1,648 1.7 Dietician 2,126 0.64 3,322 0.9 Podiatrist 476 0.27 1,763 1.6 Dentist 8,644 0 5 – 6 weeks Psychologist 899 0.15 5,993 0.5 2 weeks Occupational therapist 130 0 12 weeks Speech therapist 21 0 Asthma Educator 1,650 0.45 3,300 0.9
Summary Population/FTE ratios and number of visits/sessions per head of population annually in health practices in Jerilderie
Service type Population of interest
FTE total
Population/FTE ratio
N visits/sessions per head population annually
Waitlist (range)
GP 1,674 1 1,674 3.4 Physiotherapist 350 0 Diabetes educator 67 0.05 1,340 2.1 Dietician 350 0.02 17,500 0.2 Podiatrist 99 0 Psychologist 174 0 Occupational therapist 32 0 Speech therapist 10 0 Asthma Educator 251 0.05 5,020 0.6
Snapshot: Child Care by Grandparents
In 2011, 937,000 children received child care from a grandparent on a regular basis. This represented one-quarter (26%) of all children under the age of 12 or half (49%) of those children who regularly attended some type of child care.
Formal care is regulated child care away from the child’s home. It includes before and/or after school care, long day care, family day care and occasional care. Formal care is usually on a fee for service basis and may be subsidised through the Child Care Benefit and Child Care Rebate. Informal care is unregulated care arranged by a child’s parent/guardian, either in the child’s home or elsewhere. It comprises care by (step) brothers or sisters, grandparents, other relatives (including a parent living elsewhere), or by unrelated people, e.g. friends, nannies, baby-sitters. Informal child care may be paid, but is usually unpaid.
Parents use a combination of formal and informal care to meet their child care needs. Of young children (aged 0–4 years), 878,100 (60%) regularly attended some type of child care. One in two (50%) of this group were cared for by a grandparent and a similar proportion were in long day care (53%). There was a high degree of overlap between these two groups, about one-third of children who attended formal care also received regular care from a grandparent. Among older children (aged 5–12 years), 1,025,000 or a little under half (47%) regularly attended care. Of these children, almost half (49%) were looked after by a grandparent. In comparison about a quarter (27%) of these children attended before and after care.
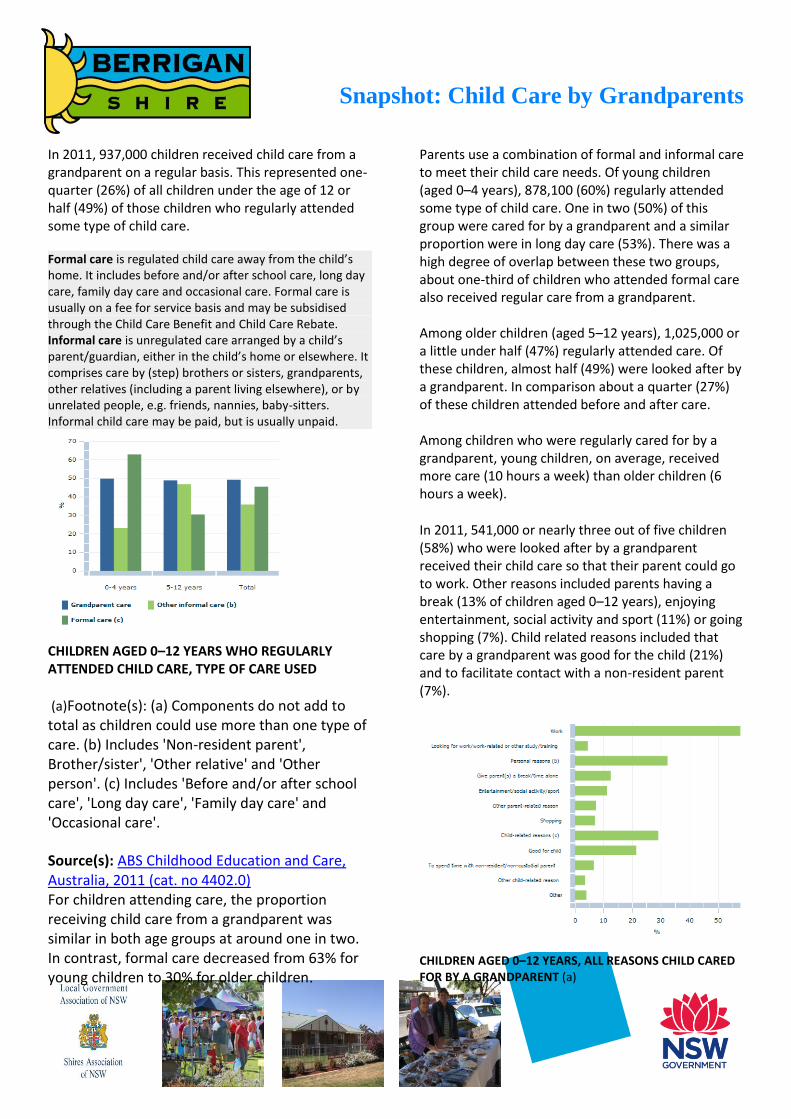
CHILDREN AGED 0–12 YEARS WHO REGULARLY ATTENDED CHILD CARE, TYPE OF CARE USED
(a)Footnote(s): (a) Components do not add to total as children could use more than one type of care. (b) Includes 'Non-resident parent', Brother/sister', 'Other relative' and 'Other person'. (c) Includes 'Before and/or after school care', 'Long day care', 'Family day care' and 'Occasional care'.
Source(s): ABS Childhood Education and Care, Australia, 2011 (cat. no 4402.0) For children attending care, the proportion receiving child care from a grandparent was similar in both age groups at around one in two. In contrast, formal care decreased from 63% for young children to 30% for older children.
Among children who were regularly cared for by a grandparent, young children, on average, received more care (10 hours a week) than older children (6 hours a week).
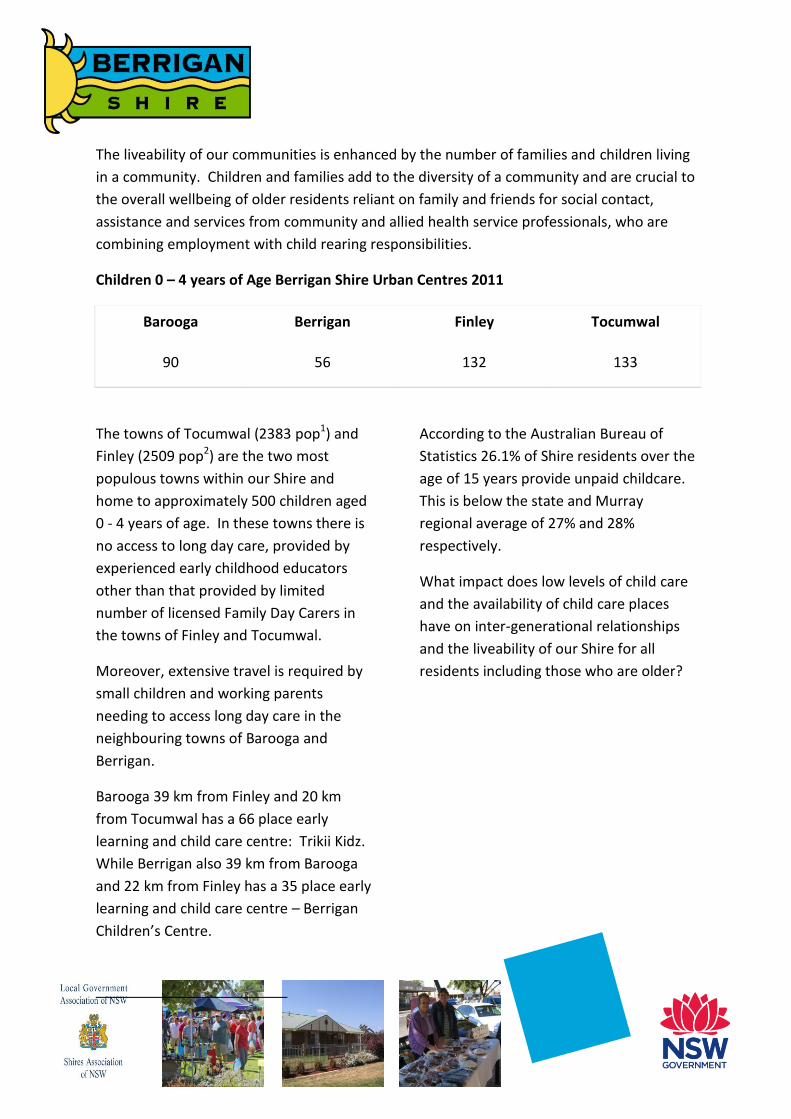
In 2011, 541,000 or nearly three out of five children (58%) who were looked after by a grandparent received their child care so that their parent could go to work. Other reasons included parents having a break (13% of children aged 0–12 years), enjoying entertainment, social activity and sport (11%) or going shopping (7%). Child related reasons included that care by a grandparent was good for the child (21%) and to facilitate contact with a non-resident parent (7%).
CHILDREN AGED 0–12 YEARS, ALL REASONS CHILD CARED FOR BY A GRANDPARENT (a)
The liveability of our communities is enhanced by the number of families and children living
in a community. Children and families add to the diversity of a community and are crucial to
the overall wellbeing of older residents reliant on family and friends for social contact,
assistance and services from community and allied health service professionals, who are
combining employment with child rearing responsibilities.
Children 0 – 4 years of Age Berrigan Shire Urban Centres 2011
Barooga Berrigan Finley Tocumwal
90 56 132 133
The towns of Tocumwal (2383 pop1) and
Finley (2509 pop2) are the two most
populous towns within our Shire and
home to approximately 500 children aged
0 - 4 years of age. In these towns there is
no access to long day care, provided by
experienced early childhood educators
other than that provided by limited
number of licensed Family Day Carers in
the towns of Finley and Tocumwal.
Moreover, extensive travel is required by
small children and working parents
needing to access long day care in the
neighbouring towns of Barooga and
Berrigan.
Barooga 39 km from Finley and 20 km
from Tocumwal has a 66 place early
learning and child care centre: Trikii Kidz.
While Berrigan also 39 km from Barooga
and 22 km from Finley has a 35 place early
learning and child care centre – Berrigan
Children’s Centre.
According to the Australian Bureau of
Statistics 26.1% of Shire residents over the
age of 15 years provide unpaid childcare.
This is below the state and Murray
regional average of 27% and 28%
respectively.
What impact does low levels of child care
and the availability of child care places
have on inter-generational relationships
and the liveability of our Shire for all
residents including those who are older?

Living Longer and Stronger Briefing According to the 2011 Census the median age of Berrigan Shire residents is 48 years of age: 10 years
older than the rest of Australia and people over the age of 60 years will increase from 31% of our
population to 38% in the next two decades.
Nationally we are living longer – the following table provides a summary of average life expectancy
for males and females
Average Life Expectancy
NSW Males Females Berrigan Shire Males Females
2011-16 80.9 yrs 85.1 yrs 2011-16 79.7 yrs 84.5 yrs
2036- 41 86.6 yrs 89.3 yrs 2036-41 85.4 yrs 88.7 yrs
Social Determinants of Health Socioeconomic disadvantage (poor housing, fixed & low income, limited access to transport, and
disability) is associated with a higher prevalence of health risk factors and higher rates of
hospitalisations, deaths and other adverse health outcomesi. Higher rates of volunteerism and
populations engaged in unpaid care are indicators of community strength / liveability and are a
platform for overcoming or mediating impact on communities of social and economic disadvantage.
Community Strength/Liveability
Voluntary work for an organisation or group (ABS Census data)
People aged 15 years and over who
participated in voluntary work
Population aged 15
years and over
% volunteers
Berrigan Shire 1,945 6,439 30.2
Murray Region 21,708 87,850 24.7
New South Wales 895,983 5,250,259 17.1
Unpaid Child Care People aged 15 years
and over providing child care
Population aged 15 years and over
% providing child care
Berrigan Shire 1,679 6,440 26.1
Murray Region 24,557 87,849 28.0
New South Wales 1,415,289 5,250,257 27.0

Life Style Behaviours and Health
Rate per 100 Berrigan (A) NSW
AUST Country NSW
Country Vic
Physical Inactivity person 15 years and over
38.7
34.3
36.4
33.8
Overweight (not obese) males 18 years and over
35.8
36.0
35.7
35.8
Obese males 18 years and over 23.9
19.6
23.8
20.7
Overweight (not obese) females 18 years and over
23.6 22.7
23.5
23.6
Obese females 18 years and over 18.8 16.4 17.9 17.4 Usual daily intake of two or more serves of fruit persons aged 18 years and over
49.0 50.2 48.7 48.9
People who had type 2 diabetes and were overweight/ obese 18 years and over
3.1
3.2 3.2
3.1
Mobility Impairment Berrigan NSW Country
NSW Higher/Lower State Average
Musculoskeletal Diseases 31.2 29.8 31.7 ++
Arthritis 14.9 14.9 16.1 __
Rheumatoid Arthritis 2.1 1.9 2.1 ++
Osteo Arthritis 10.4 7.4 8.9 ++
Potentially avoidable deaths at ages 0 to 74 years
Potentially avoidable deaths at ages 0 to 74 years: 2003 – 2007
Number Average
annual rate per 100,000
Significant
All causes Berrigan LGA 89 175.1
Murray Region 1,161 193.5 **
NSW 53,564 166.5
Lung cancer Berrigan LGA 15 26.9
Murray Region 149 23.8
NSW 6,853 21.3
Ischaemic heart disease Berrigan LGA 23 41.9 Murray Region 268 43.1 ** NSW 10,714 33.2 ** Cerebrovascular disease Berrigan LGA 7 12.6
Murray Region 75 12.0
NSW 3,479 10.8 **
Chronic obstructive pulmonary disease (45 to 74 years)
Berrigan LGA 6 30.3
Murray Region 68 31.7 *
NSW 2,660 24.6
Suicide and self-inflicted injuries Berrigan LGA 5 14.1
Murray Region 52 10.1
NSW 2,950 9.3 **
Public Health Information Development Unit (2011) Social Health Atlas NSWii
i NSW Government (2010) Report of the New South Wales Chief Health Officer accessed 7 January 2010 http://www.health.nsw.gov.au/publichealth/chorep/beh/beh_smoafdth_lgamap_full.asp#table i NSW Government (2010) Report of the New South Wales Chief Health Officer accessed 7 January 2010 http://www.health.nsw.gov.au/publichealth/chorep/beh/beh_smoafhos_lgamap.asp ii Public Health Information Development Unit (2011) Social Health Atlas NSW accessed 10 January 2013 http://www.publichealth.gov.au/data_online/aust_lga_online_2011/NSW_lga_data_2011.xls

Working and Retirement Briefing
OLDER WORKERS
The unemployment or under employment of older Australians in 2008 was costing Australia $10.8 billion a year This comprises: A loss of $8.7 billion a year for not
utilising the skills and experience of older Australians who want to work but were not looking for work as at September 2008 (161,800 in total)
A loss of $2.1 billion a year for not utilising the skills and experience of 39,331 who were unemployed and looking for full-time work as at March 2009;
It does not include the economic and social cost of not utilising the skills and experience of 17,073 unemployed older Australians looking for part-time work
Older workers also report the need for flexibility in their working hours or part-time arrangements so that they can fit in caring responsibilities or manage sickness or disability Working is a protective factor against physical ill-health and poor mental health as people staying in the workforce past retirement age tend to have better health status compared with those not working (Aust Human Rights Commission (2012) Working past our 60s: Reforming laws and policies) According to the ABS, ill health, disability, or caring responsibilities mean that some older people are unable to participate in the labour force even though they would like to remain in work
BARRIERS TO WORKING LONGER Nature of the work Workers Compensation caps,
restrictions on income protection insurance for workers over 60 and industry dependant licensing requirements
RETIREMENT
In 2007, there were 3.9 million employed people aged 45 years and over, of whom the majority (85%) intended to eventually retire from the labour force. About 15% (568,400) of employed people aged 45 years and over indicated that they did not intend to retire, and nearly two-thirds (64%) of these were men. Of the 3.3 million people who indicated that they did intend to retire at some stage:
24% intended to retire aged 70 years and over (30% of men, 17% of women);
40% intended to retire aged 65-69 years (45% of men, 34% of women);
24% intended to retire aged 60-64 years (18% of men, 31% of women);
9% intended to retire aged 55-59 years (5% of men, 13% of women);
1% intended to retire aged 45-54 years (0.3% of men, 2% of women); and
the remaining 2% did not know the age at which they would retire (2% of men, 2% of women)
DECISIONS ABOUT WHEN TO RETIRE
39% of people (45 years of age and
over) intend to retire at age 63
years of age when they believe
they will have achieved financial
security
19% of people (45 years of age and
over) intend to retire at 65 years of
age and that this will be due to
Personal health or physical abilities
Amongst the 1.8 million people
who retired between 1987 and
2007, and were over the age of 45
when they retired, the most
commonly reported main reason
for retirement was 'personal
health or physical abilities' (31%),
whereas 'financial security' was
only reported as the main reason
for retirement by 4% of retirees
EXPECTED SOURCE OF INCOME AT
RETIREMENT
3% reported that their expected
main source of income at
retirement would be income from
'superannuation, an annuity or
allocated pension'
24% of people (45 years of age and
over) expected main source of
income at retirement would be
income from government pension
or allowance
51% of the women who intended
to retire between the ages of 45
and 54 years, expected to have no
personal income source when they
retired
77% of currently employed people
aged 45 years and over who intend
to retire will rely on their spouse
or the government as their main
source of income at some point in
their retirement
(ABS: 6105.0 - Australian Labour
Market Statistics, Jan 2009)
GOVERNMENT PENSIONS BERRIGAN SHIRE
Berrigan Shire 2005 2006 2007 2008 2009 2010
Age Pension - Centrelink
No.
1200 1210 1242 1306 1368 1412
Age Pension - DVA
No.
0 0 0 5 4 4
Carers Payment
No. 31 39 46 55 64 85
Disability Support Pension
No.
300 309 307 330 349 359
1531 1558 1595 1696 1785 1860