beverage container sales analysis: california beverage container ... · pdf filebeverage...
TRANSCRIPT

Beverage Container Sales Analysis:
California Beverage Container
Recycling Program
For the Period of Jan. 1, 2010 through Dec. 31, 2010
California Department of Resources Recycling and Recovery March 6, 2014

S T A T E O F C A L I F O R N I A
Edmund G. Brown Jr.
Governor
Matt Rodriquez
Secretary, California Environmental Protection Agency
DEPARTMENT OF RESOURCES RECYCLING AND RECOVERY
Caroll Mortensen
Director
Department of Resources Recycling and Recovery (CalRecycle) Public Affairs Office
1001 I Street (MS 22-B) P.O. Box 4025
Sacramento, CA 95812-4025 www.calrecycle.ca.gov/Publications/
1-800-RECYCLE (California only) or (916) 341-6300
Publication # DRRR-2014-1488
To conserve resources and reduce waste, CalRecycle reports are produced in electronic format only. If
printing copies of this document, please consider use of recycled paper containing 100 percent postconsumer fiber and, where possible, please print on both sides of the paper.
Copyright © 2014 by the California Department of Resources Recycling and Recovery (CalRecycle). All rights reserved. This publication, or parts thereof, may not be reproduced in any form without permission.
This report was prepared by staff of the Department of Resources Recycling and Recovery (CalRecycle) to provide information or technical assistance. The statements and conclusions of this report are those of CalRecycle staff and not necessarily those of the department or the State of California. The state
makes no warranty, expressed or implied, and assumes no liability for the information contained in the succeeding text. Any mention of commercial products or processes shall not be construed
as an endorsement of such products or processes.
The California Department of Resources Recycling and Recovery (CalRecycle) does not discriminate on the basis of disability in access to its programs. CalRecycle publications are available in accessible formats upon request by calling the Public Affairs Office at (916) 341-6300. Persons with hearing
impairments can reach CalRecycle through the California Relay Service at 1-800-735-2929.
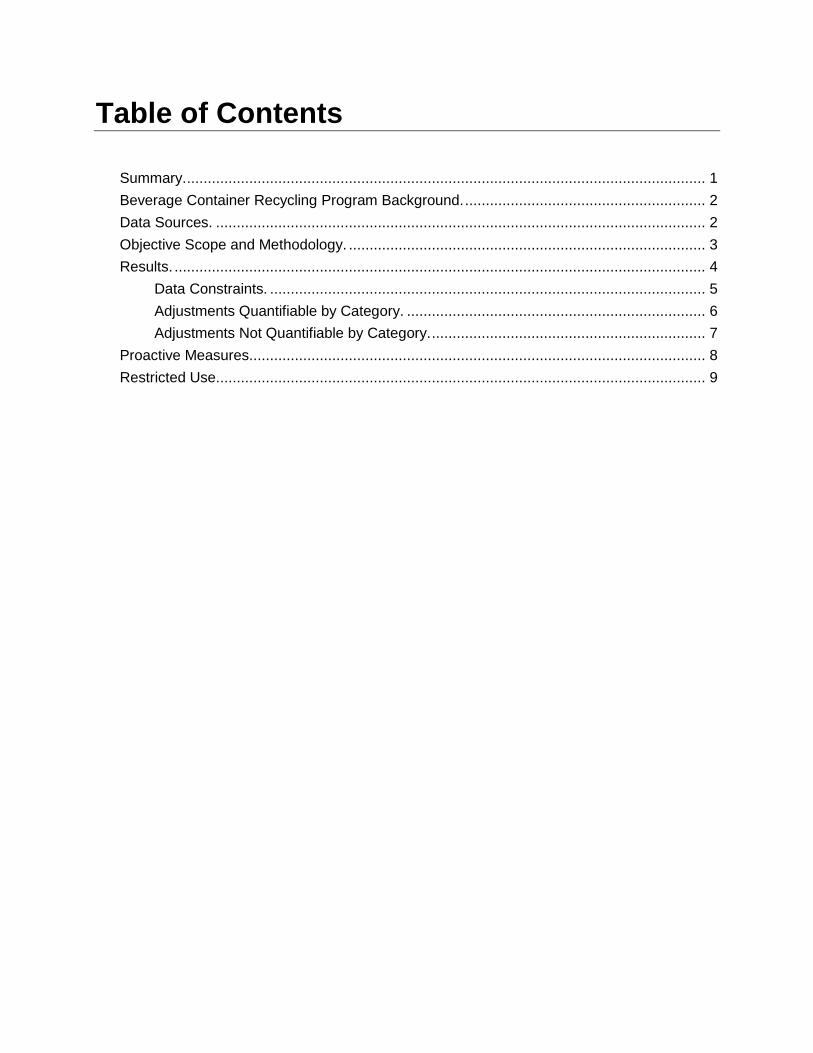
Table of Contents
Summary. ............................................................................................................................. 1
Beverage Container Recycling Program Background. .......................................................... 2
Data Sources. ...................................................................................................................... 2
Objective Scope and Methodology. ...................................................................................... 3
Results. ................................................................................................................................ 4
Data Constraints. ......................................................................................................... 5
Adjustments Quantifiable by Category. ........................................................................ 6
Adjustments Not Quantifiable by Category. .................................................................. 7
Proactive Measures.............................................................................................................. 8
Restricted Use. ..................................................................................................................... 9

Staff Report 1
Summary
The Knowledge Integration Section and the Office of Audits within the Department of Resources Recycling and Recovery (CalRecycle) conducted an analysis of the 2010 beverage container sales subject to California Redemption Value (CRV). The purpose of the analysis was to evaluate the revenue component of the beverage container recycling program where statutorily required expenditures exceed annual revenues, creating a structural financial deficit.
The analysis revealed that while there are always opportunities to improve, the risk associated with not identifying and collecting additional program revenue is low. Specifically, there is an estimated difference of approximately 850 million units that could not be quantified as being subject to CRV (Table No.1). Based on experience with the program and our understanding of available Beverage Marketing Corporation data, it is reasonable to conclude that the remaining difference of 850 million units may not result in additional revenue (see Adjustments Not Quantifiable by Category).
Table No. 1:
2010 - Total Beverage Containers (Billions of Units)
BMC Beverage Packaging Report 25.50
CalRecycle Biannual Report (20.20)
Adjustments Quantifiable by Category (4.45)
Adjustments Not Quantifiable by Category 0.85
In line with its statutory responsibilities, CalRecycle continuously evaluates risks associated with beverage distributors. In those instances where additional revenue opportunities exist, resource options are being explored.
The analysis was based on data compiled from four main sources:
1. Beverage Marketing Corporation—Recognized as a leading source for U.S. and global beverage data.
2. Container Recycling Institute—Provides beverage market data analysis, waste and recycling trends utilizing BMC data and data from various industry sources.
3. Information Resources, Inc.—A globally recognized market research company that provides consumer, shopper, and retail market intelligence and analysis focused on the consumer packaged goods industry.

Staff Report 2
4. CalRecycle—Mandated to manage California’s recycling and waste management programs and report biannually on the redemption and recycling rates for beverage containers.
In this analysis, BMC’s packaging data is used as a starting point to generate the total number of beverages sold in California. From there, additions to and deductions from BMC’s data, using CRI, CalRecycle and industry information were made to arrive at a projected number of beverage container sales subject to CRV.
It is important to point out that BMC’s projections and national sales are based on best available information compiled from a combination of sales data, surveys, studies, and projections. The data is useful for projecting trends in the beverage industry but the data cannot be used to determine actual California beverage sales or under reporting of redemption payments because the data are not limited to California beverage sales subject to CRV.
Another critical factor is that not all beverages sold in California are subject to CRV. There are specific statutory exclusions to what is subject to CRV. For example, a can of soda sold at a grocery store is subject to $0.05/$.10 in CRV, but a can of soda sold at a general store at Yosemite National Park is not subject to $0.05/$.10 in CRV because Yosemite has its own recycling program. Both sales are in California.
Beverage Container Recycling Program Background
The California Beverage Container Recycling and Litter Reduction Act was authorized with the passage of Chapter 1290 (AB 2020), Statutes of 1986. The program collects the California Redemption Value from beverage manufacturers and distributors and makes payments to consumers of five cents for containers that are less than 24 ounces and ten cents for containers that are equal to or greater than 24 ounces for specific beverages sold in California.
Over the past 25 years a recycling infrastructure and industry has evolved to make recycling convenient. Recycling is available through “buyback centers” as well as curbside programs and other community-based options. The Beverage Container Recycling Program has achieved significant success over the past several years and has met the Legislature’s goal of reducing litter through an 80 percent statewide recycling rate for beverage containers.
Some examples of how California’s recycling infrastructure has emerged and been supported include:
Policy programs ensured that the quality and cleanliness of recycled glass improved.
Incentives expanded the use of curbside recycling operations.
Grants and loan programs helped investments by plastic reclaimers and manufacturers to ensure that markets exist in California for recycled plastic.

Staff Report 3
Competitive grants support emerging recycling technologies and market development.
California’s success has been accompanied by significant challenges including a statutorily-driven structural deficit. In its early years, driven by the goal of achieving an 80 percent recycling rate, the program’s emphasis was on developing the infrastructure needed to make recycling convenient and economical and to encourage recycling.
That goal was met: California’s statewide beverage container recycling rate rose from 59 percent in 2004 to 82 percent each year from 2009 to 2012. . But that success has been tempered by the aforementioned structural deficit, where statutorily required expenditures exceed annual revenues.
Data Sources
CalRecycle Biannual Report
May 2013 CalRecycle Biannual Report—Public Resources Code Section 14551 requires CalRecycle to report biannually on the redemption and recycling rates for each six-month period. The biannual report also identifies beverage container sales for each calendar year based on the quantities reported by beverage distributors. We used the 2010 sales reported to CalRecycle to compare CalRecycle beverage container volumes to Beverage Marketing Corporation’s (BMC) data for the same period.
BMC Beverage Packaging Report
2011 Edition of the Beverage Packaging in the U.S. report published by the Beverage Marketing Corporation (BMC)—BMC is recognized as a leading source of U.S. and global beverage data. BMC compiles data on beverage packaging trends that provides projections of the trends in the beverage packaging market. According to BMC, this report compiled information and data from various industry sources, including published industry outlook reports, discussions with major industry players, and help from major trade associations.
2009 Editions of the Beverage Packaging in the U.S. report published by BMC for select segments - BMC compiles data on beverage packaging trends that provides estimates of regional market shares for select beverage categories. These beverage categories include carbonated soft drinks, energy drinks, tea, sports drinks and fruit drinks.
IRI Beverage Container Point of Sale Report
2010 Information Resources Incorporated (IRI) Beverage Container Point of Sale Report (customized report generated for CalRecycle’s Division of Recycling)—IRI is a globally recognized market research company that provides retail tracking data, convenience store tracking data, and consumer panel-based data. IRI’s predictive

Staff Report 4
1 Excludes bimetal, this container type represents 0.1% of all material types reported to CalRecycle.
analytical techniques guide clients to manage business for profitable growth.
CRI California Beverage Market Analysis
2010 California Beverage Market Data Analysis—The Container Recycling Institute (CRI) provides by-state beverage market data analysis, Recycling and Wasting, with data for most beverages and beverage packaging sold in the U.S. CRI looks at BMC packaging data reports and trend reports for packaging sales and applies research and industry knowledge to report on waste and recycling trends.
Objective, Scope, and Methodology
In an ongoing effort to manage the fund effectively, CalRecycle analyzed California beverage container sales subject to CRV1. The scope was limited to 2010 California beverage container volumes reported by BMC. The BMC data are intended to provide projections of trends in the beverage market industry; as such, the data do not represent actual California beverage sales subject to CRV.
This analysis is not intended to identify actual revenue and should only be used in the overall management of the beverage container program.
The methodology included, but was not limited to:
1. Reviewing BMC’s published Beverage Packaging in the U.S. report, 2011 Edition.
2. Reviewing CRI’s published 2010 projected beverage sales volumes for California.
3. Interviewing key personnel at BMC and CRI to gain an understanding of the processes and basis for the units reported in each respective report.
4. Reviewing CalRecycle’s May 2013 biannual report and audits of beverage manufacturers and distributors.
5. Interviewing key personnel at CalRecycle to gain an understanding of the beverage containers sales data pertaining to beverages subject to CRV, including the customized IRI Beverage Container Sales report.
6. Researching published reports on beverage consumption and sales to major industries that are exempt from CalRecycle’s statutory reporting requirements, such as airline industry, cruise line industry, and Yosemite National Park to

Staff Report 5
include in the estimate of exemptions.
7. Estimating California sales volumes starting with BMC national reports, adjusted by regional percentages provided by BMC, and further adjusted by using the U.S. Census reports to isolate CA sales volumes.
8. Adjusting California sales volumes by exempt sales using actual sales data and projections based on completed audits. Quantified exempt sales based on sales made in California that were then shipped or transferred out of the state, sold to the airline industry, cruise line industry and Yosemite National Park. Further adjustments included data gathered from CRI, and best available information taken from published industry reports.
9. Quantifying the difference between the BMC based numbers and
CalRecycle’s biannual report.
10. Identifying measures already taken by CalRecycle to collect potential moneys owed to the Beverage Container Recycling Fund as well as planned efforts.
Results
A comparison of the 2010 estimated California beverage sales (BMC based) subject to CRV to the CalRecycle biannual report for the same period, revealed that 4 percent (or 850 million of the 25.5 billion BMC units) are not quantifiable as being subject to CRV and may not represent any additional revenue. Approximately 79 percent, or 20.2 billion BMC units, agree with the biannual report. The remaining 17 percent difference, or 4.4 billion units, represent known container adjustments by category. However, as our analysis found, and our follow-up activity to date has demonstrated, we do not believe CalRecycle is failing to collect substantial amounts of CRV revenue. CalRecycle is pursuing additional revenue opportunities as noted in the Adjustments Quantifiable by Category and the Proactive Measures sections.

Staff Report 6
Graph No. 1
Data Constraints
In analyzing the data we encountered the following constraints and offer the following explanations to account for the differences.
1. BMC uses surveys, proprietary studies and projections to show trends in packaging. The data are useful for projecting trends in the beverage industry but the data do not represent actual California beverage sales subject to CRV.
2. The BMC data convert gallons to volume units (ounces) for some beverage types, using the average industry size for the particular beverage, e.g., 12 ounces. Within a particular industry, beverage sizes can vary from 16, 22, 24, and 33.8 ounces; therefore, using an average industry container size, BMC data may overstate the number of units.
3. A comparison of BMC data to independent third party data reveals that BMC’s numbers are higher by 14 percent. The California Board of Equalization’s (BOE) data for 2010 beer sales, which is based on a per-gallon excise tax collected on the sale, distribution, or importation of alcoholic beverages, when compared to 2010 beer data from BMC reveal the figures in Table No. 2.
17%4%
79%
Beverage Container Analysis:Comparison of BMC Packaging Data to DOR Biannual
Report
Adjustments - Quantifiableby Category 4.4 Billion
Adjustments - NotQuantifiable by Category850 Million
BMC's Figures Agree withCalRecycle's 20.2 Billion

Staff Report 7
Table No. 2: BMC to BOE Beer Data Comparison in Gallons
BMC (12% Census
Allocation)
BOE Difference Percentage
770,190,000 661,414,487 108,775,513 14%
4. BMC collected data from various proprietary sources which we could not obtain and therefore cannot assess the degree of reliability that should be placed on data obtained from BMC’s proprietary sources.
5. BMC data are based on national, wholesale (distributor) level sales. Regional figures are determined by using a percentage breakout based on data from Information Resources, Inc. (IRI), which is point of sale. However, point of sale data are limited to approximately 60 percent of actual sales and do not reflect all California beverage sales subject to CRV. In addition, state-specific figures are further estimated using U.S. Census data.
6. CalRecycle data may contain misallocated material types because some distributors may be reporting CRV under one material type even though a distributor sells the container as a different material type. This occurs when a distributor lacks the training or the willingness to properly report to CalRecycle. This practice may result in over reporting of aluminum and underreporting of other material types, since aluminum is the first line item on the distributor report, but ultimately results in no monetary impact to the fund.
Adjustments Quantifiable by Category
To isolate potential California beverage container sales from BMC’s national packaging data, we reviewed audits of companies that account for approximately 55 percent of the beverage containers reported to CalRecycle. We also reviewed information gathered from external data sources such as CRI to better estimate California sales. From these analyses, we identified approximately 4.4 billion units that should be adjusted as explained below and depicted in Graph No. 2.
Containers shipped out of state (2.6 billion units). BMC’s numbers are based on wholesale (distributor) level sales and surveys and did not adjust for containers sold to distributors in California but later sold out of state. California sales volumes from BMC data were adjusted by out-of-state sales obtained from audits and estimated on a proportional basis to remaining containers reported.
Container packaging adjustments (1.2 billion units). Beer, sparkling water, and tea were adjusted to correspond with CRI volumes; CRI made adjustments to

Staff Report 8
the BMC numbers that were specific to California.
Sales to common carriers (63 million units). BMC’s numbers do not adjust for containers sold to common carriers, such as airlines and cruise ships, which are not subject to CRV.
Sales to Yosemite National Park (16 million units). BMC’s numbers do not adjust for containers sold to Yosemite, which is exempt from the program because it runs its own bottle redemption program.
Audit Findings (140 million units). The beverage container sales included in the biannual report do not include revenue adjustments resulting from audit findings.
Resource Prioritization (410 million units). CalRecycle prioritizes audits each year by the highest-risk companies. Other companies that have not yet been audited may be sources of underpayments to the fund. CalRecycle is currently exploring options to include audits of these companies that may result in collection of additional revenue.
Unregistered Distributors (200,000 units). As of December 2013, the Division of Recycling had identified $10,000 in potential underpayments from six unregistered companies identified through IRI data research (see Proactive Measures).

Staff Report 9
Graph No. 2
Adjustments Not Quantifiable by Category
Although not quantifiable as being subject to CRV and may not represent any additional revenue, based on experience with the program and our understanding of BMC data, it is reasonable to conclude that the remaining difference of 850 million units may be due to the following:
Overstated sales data. BMC’s numbers may be overstated, as in the aforementioned comparison of 2010 beer data between BMC and data from the Board of Equalization (BOE), an independent third party, that reveal BMC’s numbers are 14 percent higher.
Estimated container allocations and regional percentages. BMC’s figures are estimates and, based on CRI’s analysis of those estimates, the figures for several beverage categories were adjusted when better information was available. For example, CRI found that beer estimates were more accurately allocated among states when The Beer Institute’s percentages were used for the breakout. The allocation of sparkling water was more appropriately reflected when using a

Staff Report 10
percentage from BMC’s New Age Beverage Regional Markets in the U.S., 2011 edition, as opposed to the 2009 Edition of the Bottled Water Packaging used by CalRecycle. Also, BMC’s report depicted all sales of ready-to-drink tea in glass containers, whereas CRI had information to more realistically allocate sales to glass, plastic, and aluminum container types. It is possible other categories will also need adjusting if/when better information is presented.
BMC conversion of containers to average industry size. Using an average industry size of 12 ounces for certain container types could result in overstating a one gallon CRV container by 9.6 containers. Since we do not know the number of gallon containers that were converted to 12 ounce containers, we cannot estimate the extent of the overstatement.
Containers remaining in inventory. Containers that were purchased by California distributors but not sold to a retailer or the public during 2010.
Damaged containers. Containers that were sold to warehouses in California but damaged prior to final sale and therefore not subject to CRV.
Proactive Measures
Proactive measures taken by CalRecycle to increase the collection of revenue due to the fund include, but are not limited to:
1. Effective September 2012, regulations were amended to require registered program participants to notify CalRecycle if another company has agreed to report and make payments on its behalf. This will provide CalRecycle with a tool to identify non-registered and non-reporting companies. After the passage of this regulation, CalRecycle conducted outreach to educate participants about the requirements. This additional tool has allowed CalRecycle to identify approximately 30 new participants that were not previously reporting.
2. Effective September 2012, regulations were amended to require newly registered beverage manufacturers to submit product labels to determine if products are in the program. After adoption of this regulation, CalRecycle conducted outreach to educate participants about the requirements. CalRecycle also is developing a system to track compliance of this requirement.
3. In 2010, audit procedures were modified to identify legally responsible parties for products sold or transferred in California during an audit. This approach allows for the identification of unregistered manufacturers and distributors and non-reporters doing business with the audited company. In addition, the legally responsible party is assessed the liability relating to transactions with the company under audit. Within the past 10 months, these efforts have identified $316,818 in
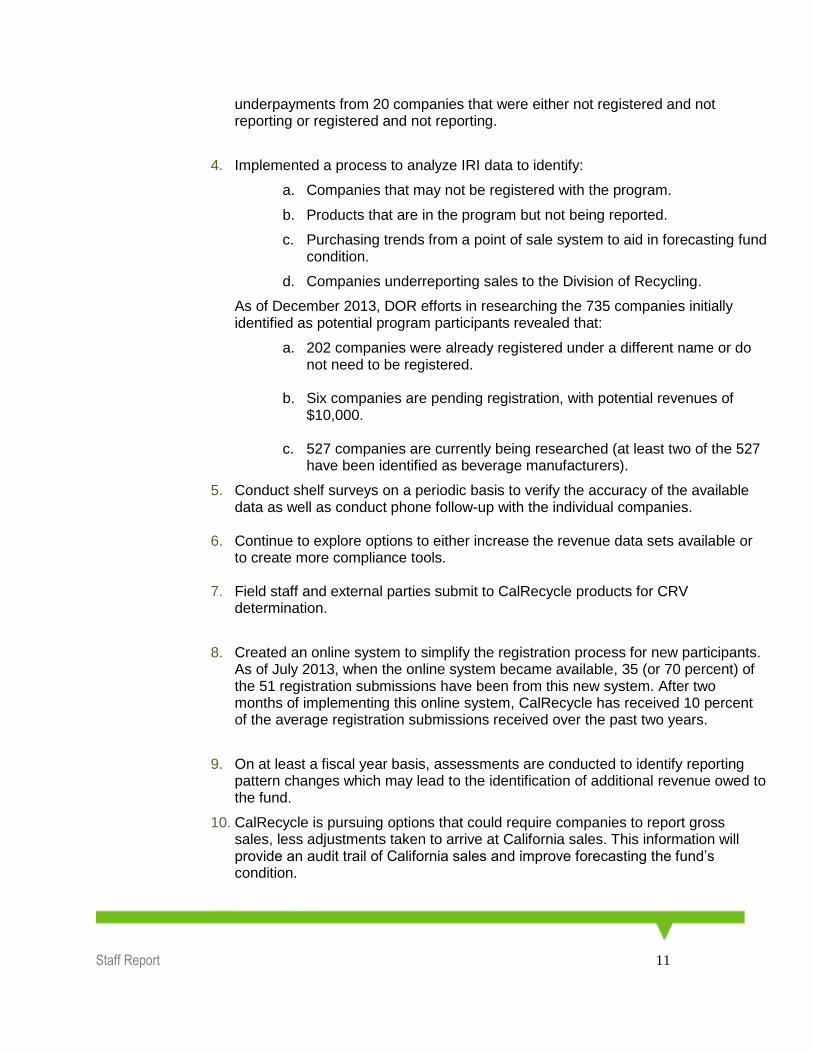
Staff Report 11
underpayments from 20 companies that were either not registered and not reporting or registered and not reporting.
4. Implemented a process to analyze IRI data to identify:
a. Companies that may not be registered with the program.
b. Products that are in the program but not being reported.
c. Purchasing trends from a point of sale system to aid in forecasting fund condition.
d. Companies underreporting sales to the Division of Recycling.
As of December 2013, DOR efforts in researching the 735 companies initially identified as potential program participants revealed that:
a. 202 companies were already registered under a different name or do not need to be registered.
b. Six companies are pending registration, with potential revenues of $10,000.
c. 527 companies are currently being researched (at least two of the 527 have been identified as beverage manufacturers).
5. Conduct shelf surveys on a periodic basis to verify the accuracy of the available data as well as conduct phone follow-up with the individual companies.
6. Continue to explore options to either increase the revenue data sets available or to create more compliance tools.
7. Field staff and external parties submit to CalRecycle products for CRV determination.
8. Created an online system to simplify the registration process for new participants. As of July 2013, when the online system became available, 35 (or 70 percent) of the 51 registration submissions have been from this new system. After two months of implementing this online system, CalRecycle has received 10 percent of the average registration submissions received over the past two years.
9. On at least a fiscal year basis, assessments are conducted to identify reporting pattern changes which may lead to the identification of additional revenue owed to the fund.
10. CalRecycle is pursuing options that could require companies to report gross sales, less adjustments taken to arrive at California sales. This information will provide an audit trail of California sales and improve forecasting the fund’s condition.

Staff Report 12
11. Currently working with the Beverage Marketing Corporation to develop customized reports of California beverage packaging. Although these reports will not identify unreported containers sales, we expect the reports will serve as another management tool (e.g., forecasting sales, managing beverage manufacture and distributor accounts, and in conducting audits).
12. Currently working toward placing the registration web link on other California department/agency websites such as on Secretary of State, ca.gov, Board of Equalization, etc., so that when a new beverage manufacturer or distributor starts doing business in California, they are prompted to contact CalRecycle for registration.
13. CalRecycle is exploring options to obtain additional resources to audit at-risk companies.