beyond krismon - unicef-irc.org
TRANSCRIPT

BEYOND
KRISMON
The Social Legacy of Indonesia’s
Financial Crisis
U N I C E F
I n n o c e n t i I n s i g h t
BEYOND KRISMON:THE SOCIAL LEGACY OF INDONESIA’S FINANCIAL CRISIS
Most of the countries caught up in the Asian financialcrisis appear to have weathered the storm. ButIndonesia’s prospects are far more uncertain. In thisInnnocenti Insight, development journalist and writerPeter Stalker describes how the financial turbulence ofthe Krisis Moneter, or Krismon, set off a dramatic socialand political chain reaction, with effects on childrenthat could reverberate for years to come. Beyond Krismonexamines the legacy of Soeharto’s New Order regime interms of child well-being, the impact of the financialcrisis on areas essential to their survival and develop-ment and the crippling burden of debt that may jeopar-dize the nation’s hopes for the future.
UNICEF Innocenti Research CentrePiazza SS. Annunziata, 1250122 Florence, Italy
Tel.: +39 055 203 30Fax: +39 055 244 817E-mail (general information): [email protected] (publication orders): [email protected]
Website: www.unicef-icdc.org
ISBN: 88-85401-72-4
Peter Stalker

UNICEFInnocenti Insight
BEYOND KRISMONThe Social Legacy of Indonesia’s
Financial Crisis
Peter Stalker
i
6abo
zza
– 15
ago
sto
2000

ACKNOWLEDGEMENTS
I would like to thank the many people in Indonesia and elsewhere who helped in the preparation of thisreport, but particularly Rolf Carriere, Alex Mackenzie and Selly Leila of the Unicef office in Jakarta, aswell as Friedhelm Betke, Santosh Mehrotra and John Micklewright of the UNICEF Innocenti ResearchCentre in Florence. Any errors in the text, however, are entirely my own work.
Peter Stalker is a writer who works as a consultant to a number of UN agencies. His most recent pub-lications are Workers Without Frontiers (2000), ILO/Lynne Rienner, and The Oxford Handbook of the World(2000), Oxford University Press. His website is at: www.pstalker.com.
Cover design: Miller, Craig & Cocking, Oxfordshire - UK
Layout and phototypesetting: Bernard & Co, Siena - Italy
Printed by: Arti Grafiche Ticci, Siena - Italy
ISBN 88-85401-72-4
December 2000
Front cover picture: “Indonesia and UNICEF - Learning and Growing in Partnership for Children”
ii
6abo
zza
– 15
ago
sto
2000

UNICEF INNOCENTI RESEARCH CENTRE
The UNICEF Innocenti Research Centre in Florence, Italy,was established in 1988 to strengthen the research capabili-ty of the United Nations Children's Fund (UNICEF) and tosupport its advocacy for children worldwide. The Centre(formally known as the International Child DevelopmentCentre) helps to identify and research current and futureareas of UNICEF's work. Its prime objectives are to improveinternational understanding of issues relating to children'srights and the economic and social policies that affect them.Through its research and capacity building work the Centrehelps to facilitate the full implementation of the UnitedNations Convention on the Rights of the Child in bothindustrialized and developing countries.
The Centre's publications are contributions to a globaldebate on child rights issues and include a wide range ofopinions. For that reason, the Centre may produce publica-tions that do not necessarily reflect UNICEF policies orapproaches on some topics. The views expressed are thoseof the authors and are published by the Centre in order tostimulate further dialogue on child rights.
The Centre collaborates with its host institution in Flo-rence, the Istituto degli Innocenti, in selected areas of work.Core funding for the Centre is provided by the Governmentof Italy, while financial support for specific projects is alsoprovided by other governments, international institutionsand private sources, including UNICEF National Commit-tees. In 1999/2000, the Centre received funding from theGovernments of Canada, Finland, Norway, Sweden, and theUnited Kingdom, as well as the World Bank and UNICEFNational Committees in Australia, Germany, Italy and Spain.
The opinions expressed in this publication are those ofthe author and do not necessarily reflect the policies orviews of UNICEF.
iii
6abo
zza
– 15
ago
sto
2000

6abo
zza
– 15
ago
sto
2000
ContentsFOREWORD Mehr Khan, Director, UNICEF Innocenti Research Centre
Rolf Carriere, Representative, UNICEF Indonesia vii
SUMMARY ix
1. BEYOND KRISMON 1The Social Legacy of Indonesia’s Financial Crisis 1The ‘New Order’ for Children 1Cascading Crises 2
2. HOW THE CRISIS HURT INDONESIANS 5Cushioning the Blows 5Monitoring the Crisis 5
3. DID THE SOCIAL SAFETY NET CATCH THE POOR? 9Food Subsidies 9Education Subsidies 10Health Subsidies 11Job Creation 11
4. QUESTIONING THE ‘NEW ORDER’ LEGACY 13The Poverty Legacy 13The Nutrition Legacy 15The Health Legacy 16The Education Legacy 18The Governance Legacy 20
5. THE THREAT OF DEBT 23
References 25
v

BEYOND KRISMON The Social Legacy of Indonesia’s Financial Crisis vii
6abo
zza
– 15
ago
sto
2000
FOREWORDUNICEF, the United Nations Children’s Fund, regularly monitors the impact of national and interna-tional economic and social policies on poor families, particularly on women and children. This moni-toring and related advocacy are rooted in the conviction that policies to protect the poor must be anintegral part of national planning even when the economy is in difficulty. Such policies are needed notonly to safeguard the rights of the poorest and most vulnerable members of society but also to ensurethat future economic recovery is more equitable and sustainable.
The UNICEF Innocenti Research Centre, in Florence, Italy, has established a reputation for mon-itoring the well-being of children during turbulent times, from those in the post-communist societies ofCentral and Eastern Europe and the Commonwealth of Independent States, to children in post-conflictsituations, as in Rwanda or Ethiopia. It has also focused on the East Asian financial crisis where millionsof people who had emerged from poverty in recent years have suddenly been pushed back under.
The magnitude of this crisis is most clearly seen in Indonesia. The country’s prosperity, built upover three decades, was swept away in the economic collapse rolling across East Asia. The Krisis Mon-eter or Krismon signalled the end of the New Order regime of President Soeharto, driven from office in1998 on a wave of popular protest. Indonesians have responded to Krismon with resilience and fortitudeas their country moves from autocratic single-party rule to multi-party democracy and from centralizedrule to decentralized control despite continued economic problems. At the same time, prospects arejeopardized by a government debt projected to remain at around 100 per cent of GDP for the next fewyears, with interest payments expected to peak in 2000 at about 35 per cent of government revenues.
In this Innocenti Insight, the respected development writer Peter Stalker provides a clear overviewof the crisis, putting a human face to a financial catastrophe. He examines the overall impact of Kris-mon, before discussing its effect on areas essential for child well-being, such as education, health ser-vices and nutrition. He discusses the legacy of the New Order regime in such areas and finds that,while there were many genuine achievements for children under Soeharto, other apparent successesmay have been built on shifting sands.
Of Indonesia’s 23 million children under the age of five, six million – more than one quarter – aremalnourished. More than half of them are affected by the ‘hidden hunger’ of micro-nutrient deficien-cy. Over six million children between the ages of six and 15 are not in school, and around 150,000 chil-dren live, homeless and unprotected, on the streets of Indonesia’s major cities.
Common sense tells us that such problems must have been exacerbated by Indonesia’s crisis. Butit would be wrong to assume that these problems will automatically recede as the monetary situationimproves. Macro-economic improvement has not trickled down to restore Indonesians to their pre-cri-sis standard of living. Even if it had, economic recovery alone would not be enough to tackle theunseen and under-estimated human vulnerability that existed long before the crisis. It is essential,therefore, to refine social safety nets to target them on the poor and on young children. It is UNICEF’sfirm belief that efforts to break the intergenerational cycle of poverty must start with the child.

viii BEYOND KRISMON The Social Legacy of Indonesia’s Financial Crisis
6abo
zza
– 15
ago
sto
2000
The social problems facing Indonesia today need to be addressed and various building blocks arealready in place, providing a foundation for progress. For example, 60,000 primary schools were builtin the 1970s. Enrolment stands at 95 per cent and at least two-thirds of the population have now hadat least primary education. Immunization more than doubled in the 1980s and no cases of polio havebeen registered for five years. In the 1990s, 50,000 midwives were trained and are now working at thevillage level. These accomplishments prove that Indonesia can be a powerhouse of progress for itsyoungest children and it is essential that they are maintained and expanded, and not allowed to slipfrom our grasp.
UNICEF Indonesia has identified specific priorities to further human progress in Indonesia. First,we must raise awareness of the social causes of, and solutions to, poverty, and promote the benefits ofinvesting in people at all levels with the central government supporting district level activities inhealth, family planning, nutrition and education. Effective targeting of resources – always essential – isof even more importance when resources are scarce. It is a matter of concern, for example, that the pub-lic health system in Indonesia now spends more on minor ailments than on life-saving activities suchas the eradication of TB, malaria and malnutrition. Resources for primary health care, basic educationand nutrition must be protected. Information is crucial and decentralization makes little sense withoutstatistics to measure and steer progress at the local level. The continued collection of district-level datais, therefore, vital.
Beyond Krismon draws upon three Innocenti Working Papers which examine specific aspects of theIndonesian crisis. Friedhelm Betke provides an examination of the ‘Family-in-Focus’ approach todata collection and analysis, while Lisa Cameron has contributed two papers: one on data gathered in100 villages since 1995, and the second on the role of Social Safety Net scholarships to prevent schooldrop-out.
UNICEF’s attempt to chronicle the effects of the East Asian financial crisis on the children ofIndonesia is being carried out in partnership between the UNICEF Innocenti Research Centre and theUNICEF Office in Indonesia, with funding from the Australian National Committee for UNICEF.
It is our hope that this work will expand our understanding of how a country thought to be on afast-track to prosperity can become ensnared in crisis, and what measures can be taken to protect chil-dren from the impact.
Mehr KhanDirector
UNICEF Innocenti Research CentreRolf Carriere
RepresentativeUNICEF Indonesia

BEYOND KRISMON The Social Legacy of Indonesia’s Financial Crisis ix
6abo
zza
– 15
ago
sto
2000
SUMMARYMost of the countries caught up in the Asian financial crisis appear to have weathered the storm.But Indonesia’s prospects are far more uncertain. Here the financial turbulence, the Krisis Moneteror Krismon, set off a dramatic social and political chain reaction whose effects could reverberate foryears to come.
The 32-year ‘New Order’ government of former President Soeharto made some strikingadvances—boosting economic growth, reducing poverty, and building an impressive network of schoolsand clinics. Over three decades Indonesians became richer, healthier and better educated, though theyalso had to endure an increasingly repressive and corrupt regime.
Many of the New Order’s positive achievements were jeopardized by the cascade of crises—cli-matic and financial, social and political—that swept across the country from 1997. Fortunately some ofthe most pessimistic predictions appear to have been confounded. First, because Indonesians’ tradi-tions of self-help through extended families cushioned the impact for the poor. Second, because thenew government also took decisive action—curbing inflation and establishing a social safety net thatoffered subsidized food and education.
Even so, millions of people were plunged further into poverty, particularly in Java and in the urbanareas. And social services too were weakened: although people were still sending their children toschool, they were losing faith in the public health services.
Now that economic growth has revived will human development resume an upward trend? Thereare reasons for doubt. One is that Indonesia’s former social achievements now seem less impressive—so the country will be building on weaker foundations. It appears, for example, that the reduction inpoverty, though substantial, had been exaggerated. There are similar reservations about nutrition:around 25 per cent of children under five are still malnourished. And while the infant mortality ratehas come down, it is still far higher than in neighbouring countries. The maternal mortality rate tooremains high.
These disturbing figures are due in part to weaknesses in Indonesia’s health services which,although extensive, are thinly spread. Even before the crisis, people had been deserting the public clin-ics and the posyandu, the maternal and child health posts that help protect children in their first yearsof life. They were deterred not just by fees but by the declining quality of services, a consequence part-ly of low investment.
The gains in education also seem shallower. Enrolment ratios are high but standards of teaching arepoor—a result of inadequate training and low salaries. Again, this is to some extent an issue of invest-ment: Indonesia spends far less on education than comparable countries.
But the problems go beyond funding. There are also many weaknesses in administration. Indone-sia’s health and education services have been based on a rigid command-and-control structure that hasstifled local initiative and encouraged corruption. Central authority is now weaker, but it is not clearwhat will take its place.

x BEYOND KRISMON The Social Legacy of Indonesia’s Financial Crisis
6abo
zza
– 15
ago
sto
2000
The New Order government also narrowed the space for political organization—and impededthe growth of independent community groups. The new government has now removed many ofthese restrictions, but a full range of vigorous alternative organizations is unlikely to appear for sometime.
Without democratic channels through which to resolve disputes, many local struggles over powerand resources have followed religious and ethnic lines. In 1999, faced with a rising tide of violence,and the threat of national disintegration, the new government presented a radical plan for decentral-ization. From mid-2001 it will transfer considerable powers from the centre to more than 300 districts.While the government’s resolve to decentralize has been welcomed, the chosen route has raised anumber of anxieties. Many people are alarmed at the speed of the changes and doubt that districtscan muster the personnel or the skills to fulfil their new responsibilities. Another risk is that localpolitical leaders may choose not to invest sufficiently in social development. Then there is theprospect of widening gaps between richer and poorer areas if the more prosperous districts can affordbetter services.
Another danger is that the central government may not be able to offer districts sufficient fundsfor social spending. In 1999 the government sold $72 billion in bonds to recapitalize the failing bank-ing system. Servicing this debt will absorb a large proportion of government revenue—one-third in2000 and around one-quarter in 2001—cutting deeply into the funds available for social services.Expenditure on health and education has already shrunk over the past few years. Unless Indonesiatakes immediate measures to protect social spending, its children could be paying for the folly ofbankers for years ahead.

THE SOCIAL LEGACY OF INDONESIA’S FINANCIAL CRISIS
An all-powerful political family. Two decadesof rapid economic growth. One of the world’ssteepest reductions in poverty. Then thecrises. Monetary implosion. Political collapse.The threats of mass impoverishment andnational disintegration.
Indonesia has generated some startlingheadlines in the last five years. And the dramaseems set to continue. Democracy has been re-established, but authority sits precariously—and is under threat from many directions. Acehand Irian Jaya agitate for independence.Maluku and other provinces are torn by reli-gious strife.
For the world’s fourth largest nation theseare dangerous and confusing times. Indonesiais undertaking a complex series of interwoventransitions: from a one-party state to a multi-party democracy; from corrupt crony capital-ism to a regulated market economy; and froma hierarchical and centralized administration toone where power is dispersed across hundredsof districts. But it sets out on this perilous jour-ney saddled with a huge burden of debt—ahandicap that could cripple human develop-ment for years ahead.
THE ‘NEW ORDER’ FOR CHILDREN
Modern-day Indonesia is still largely the cre-ation of ex-President Soeharto’s ‘New Order’government which took over in 1966. At thatpoint, the country was emerging from a periodof ferocious violence and was in a desperate
state. The economy was in ruins. Of the 100million population, two-thirds languishedbelow the poverty line.
By any standards what happened from the1970s to the 1990s was remarkable. Soehartosoon stabilized the economy and opened thecountry up to private foreign investment.Indonesia set off in a new direction, driveninitially by the oil industry; later by invest-ment in manufacturing. Annual economicgrowth regularly reached seven per cent andalthough it dipped in the 1980s it surged againin the 1990s. The country rapidly becamericher: between 1965 and 1995 per capitaincome quadrupled. Moreover, this growthwas shared relatively equitably. Indeed,between the mid-1960s and 1990, Indonesiasaw a greater levelling of incomes. As a resultthere was a fairly rapid decline in incomepoverty. In 1970 an estimated 60 per cent ofthe population had been living in poverty andmore than 20 per cent were destitute,1 but by1993 the official proportion living in povertywas down to 14 per cent.
At the same time, the New Order gov-ernment had launched some high-profilesocial development programmes. Between1973 and 1979 it built more than 61,000 pri-mary schools—one of the world’s most dra-matic expansions of primary education. Thegovernment also established a country-widenetwork of primary health-care centres, thepusat kesehatan masyarakat, or ‘puskesmas’, aswell as a quarter of a million health posts, theposyandu.
In addition, it launched a high-powered
1. BEYOND KRISMON
1
6abo
zza
– 15
ago
sto
2000
1 - Booth, 2000, p. 75.

drought, which cut back food productionand created the tinder for widespread for-est fires that sent a choking haze of smogacross neighbouring countries. Before thesmoke had cleared Indonesia was thenswept up in the Asian financial crisis andsuffered a devastating monetary collapse:the krisis moneter or krismon. BetweenNovember 1997 and July 1998, the rupiah(Rp.) sank to less than one-sixth of its pre-crisis value, inflation rocketed to 68 percent for 1998 and the economy shrank by14 per cent—effectively dropping thecountry to its 1994 level.5
The economic shock ignited furthersocial unrest. From early 1998 Jakartaand other cities were shaken by riots,looting and arson. Indonesians took tothe streets protesting not just againstgovernment policies, but also against one
of the more pernicious legacies of the author-itarian New Order area—the rot of corrup-tion, collusion, and nepotism: korupsi, kolusi,nepotisme, or KKN.
By May 1998 the political crisis had cometo a head. The New Order edifice started tocrack and the president resigned in favour ofhis vice-president. This resolved some imme-diate political questions in Jakarta but did lit-tle to defuse tensions elsewhere. In Aceh apopulation that had long suffered from militaryrepression continued to press for indepen-dence. In East Timor, despite months ofvicious intimidation, the population voted forindependence and in October 1999 control ofthe former Indonesian province passed to aninterim United Nations administration. Mean-while violence based on religion had beenerupting in Maluku and West Kalimantan.
By mid-2000 some of these crises had sub-sided, while others had mutated in new direc-tions. On the agricultural front, the droughthad broken and food production revived. Theeconomy also made a hesitant recovery: thegovernment had brought inflation under con-
family planning campaign. So although overthis 30-year period the population almost dou-bled—to 207 million by 1999—the fertilityrate was halved, and between 1971-80 and1990-99 the annual population growth rate fellfrom 2.3 to 1.6 per cent.2
This combination of economic growth andsocial investment paid dividends. As Figure 1illustrates, the infant mortality rate per thou-sand live births dropped steadily: between1967 and 1997 it fell from 124 to 47. And therewas a steeper fall in under-five mortality.
Indonesia also made correspondingadvances in education—enrolling many morechildren in primary school: between 1965 and1994 the gross enrolment ratio rose from 72 to115 per cent.3 This investment in education inturn helped to boost wages.4
By the mid-1990s Indonesia still clearlyhad a long way to go, and lagged behind neigh-bouring countries. But for such a huge coun-try—with 62 million children under 15 yearsold—it did seem to have made real inroadsinto poverty and deprivation.
CASCADING CRISES
All these achievements were jeopardized bythe cascade of crises that overtook the countryfrom 1997. The first was an El Niño-induced
2 BEYOND KRISMON The Social Legacy of Indonesia’s Financial Crisis
6abo
zza
– 15
ago
sto
2000
2 - Badan Pusat Statistik, 2000, p. 27.3 - World Bank, 2000. 4 - Dufflo, 2000. 5 - Hill, 1999, p. 19.
Rat
e pe
r tho
usan
d li
ve b
irths
Under-five mortality
Infant mortality
Figure 1 – Infant and under-five mortality 1967-97
Source: World Bank (2000)
1967 1972 1977 1982 1987 1992 19970
2040
6080
100
120140
160180
200

trol fairly quickly and—at vast expense—hadrecapitalized insolvent banks. By 1999 eco-nomic growth was again positive and in 2000 itcould reach four per cent.
The political settlement also held. TheJune 1999 elections produced a compromise
administration which, despite its confessedfailings, survived the August 2000 meeting ofthe People’s Consultative Assembly. However,the secessionist and religious violence contin-ues: by mid-2000 the Christian-Muslim clash-es had cost more than 2,500 lives.
BEYOND KRISMON The Social Legacy of Indonesia’s Financial Crisis 3
6abo
zza
– 15
ago
sto
2000

The Asian financial crisis had repercussions allover the world. But by common consentIndonesia was the country worst affected. Notonly did it suffer the steepest economicdecline, it was also the only country where themonetary crisis set off a social and politicalchain reaction that threatened the dissolutionof the state.
The international community was under-standably concerned. Decades of progressachieved under the New Order regime sud-denly seemed far less robust. National andinternational organizations made alarming pre-dictions. Some suggested that the sharp burstof inflation would plunge as much as 40 percent of the population into poverty: the poor-est would be unable to eat, or to afford healthcare, or to send their children to school.
CUSHIONING THE BLOWS
Fortunately some of the worst scenarios werenot realized. The monetary crisis certainly cutinto the social fabric but not as fatally as hadbeen feared. There seem to have been twomain reasons for this. First, Indonesians’ owntraditions of self-help, gotong-royong, helped tocushion the worst blows as people fell back onthe support of their extended families. Manyof those who lost their jobs in factories or con-struction returned, if only temporarily, to therelative stability of the countryside. BetweenFebruary 1997 and February 1998 employ-ment in manufacturing and construction fellby 10 per cent and 12 per cent respectively,while employment in agriculture increased by15 per cent.6
A second source of support was govern-
ment action. Probably the most crucial earlymeasure was to tighten macroeconomic man-agement so as to curb the spiralling inflationthat was threatening to wreck the lives of thepoor. Then the government made efforts toconstruct a ‘social safety net’. This includedsubsidies for food and education, support forkey health services, and the creation of labour-intensive employment. Did these officialdefensive measures work?
MONITORING THE CRISIS
Some of the answers are now emerging fromdata collected by Indonesia’s National Statis-tics Agency (Badan Pusat Statistik, BPS). Oneof its most important contributions is theNational Socio-Economic Survey (SurveiSosial Ekonomie Nasional, ‘Susenas’) whichcovers 202,000 households.7 BPS conducts theSusenas annually, though it is usually onlyevery third year that it collects the data need-ed to monitor changes in overall levels ofpoverty. BPS carried out the latter survey inFebruary 1996 and February 1999. In addition,at the end of 1998 it conducted a ‘Susenas-type’ survey which collected some of the samedata but from a smaller sample.
Given the urgency of the crisis, however,and the need to act quickly, the governmentand the international organizations wantedmore rapid feedback. Fortunately there were anumber of ongoing sample surveys they coulddraw on—and which also employed BPS enu-merators. One was the ‘Indonesia Family LifeSurvey’ (IFLS). This is a project of the US-
2. HOW THE CRISIS HURT INDONESIANS
5
6abo
zza
– 15
ago
sto
2000
6 - Economist Intelligence Unit, 2000, p. 297 - Betke, 2001.

greater agreement on methodology, a darkerpicture emerged. This indicated thatbetween February 1996 and February 1999the proportion of the population livingbelow the poverty line had increased sub-stantially—from 17.5 to 27.1 per cent.9
● Urban and rural – The people worst affectedwere those in urban areas. This was becausethe crisis started in the financial system,where the collapse of the currency, rocketinginterest rates, and the flight of foreign capi-tal brought much of the formal sector, partic-ularly manufacturing and construction, to ahalt. People in rural areas suffered theknock-on effects, through inflation and a fallin agricultural wages as more people com-peted for the same jobs. But, in general,rural areas were less directly affected, partic-ularly in the outer islands. The IFLS found,for example, that between 1997 and 1998per capita household expenditure fellnationally by 24 per cent. But this was com-posed of a 34 per cent fall in urban areas anda 13 per cent fall in rural areas.10 It should beborne in mind however that expenditureinformation can be misleading since peoplemay be sustaining expenditure by sellingassets. So the real drop in living standardscould actually have been much greater.
● Regional variations – Indonesia is a huge anddiverse country, so one might have expectedsome parts to have suffered more than oth-ers. These contrasts emerge from the Keca-matan Crisis Impact Survey. In each keca-matan the investigators interviewed threegovernment officials—the agriculture offi-cer, the school supervisor, and the healthofficer. They reported on the impact of thecrisis in their sub-district, indexing theiropinions along a five-point scale, from‘somewhat improved’ to ‘very much worse’.The issues they reported on included foodsecurity, employment, health, education,and the strategies that people adopted to
based Rand Corporation which monitors thesituation of 7,700 households across 13provinces. Although designed to be national-ly representative, it is thought to have a biastowards urban and middle-class households.The IFLS is a ‘panel’ survey that returns tothe same households each time and thus pro-vides ‘longitudinal’ data. There were fullIFLS surveys in 1993/94 and 1997/98. Inaddition there was a supplementary surveyfrom a 25 per cent sub-sample in August-December 1998.
A second source of rapid information wasthe ‘100 Village Survey’. This is an initiative,sponsored by UNICEF, which was designed tomonitor the situation of poorer families. It isnot strictly representative either since it focus-es disproportionately on rural and relativelypoor areas. Nor is it a true panel survey;although it tries to go back to the same peopleit does not make exhaustive (and expensive)efforts to find them and instead ‘tops up’ thesample with new respondents. Nevertheless itis quite extensive, covering 12,000 householdsin ten districts across eight provinces.
A third source of information was the‘Kecamatan Crisis Impact Survey’, which wasfinanced by the Ford Foundation. This is anopinion survey that tries to build up an overallpicture by talking to government officials ineach of the country’s 4,025 kecamatan (sub-dis-tricts). This survey can be considered repre-sentative, since it covers every sub-district, butsince it relies on individual opinions the resultis essentially qualitative. All these sourceswere used to monitor the impact on poor fam-ilies. They suggest the following picture:
● Poverty – There has clearly been an increasein the proportion of people living below thepoverty line. But the extent of the increasehas proved contentious. Early in the crisisboth the IFLS and the 100 Village Surveywere used to generate suggestive—and dis-puted—estimates. These concluded that theproportion of people living in poverty hadrisen from 14 per cent to around 19 per cent.8
Subsequently however, when the full Suse-nas data became available, and there was
6 BEYOND KRISMON The Social Legacy of Indonesia’s Financial Crisis
6abo
zza
– 15
ago
sto
2000
8 - Popple, Sumarto and Pritchett, 1998, p. 149 - Suryahadi et al., 2000. 10 - Frankenberg, Thomas and Beegle, 1999, p. 21,Table 2.1.

cope with the crisis, such as sell-ing assets. This survey con-firmed that urban areas had beenthe worst hit, but it also identi-fied rural areas that had suffered.The crisis was felt most deeplyin Java—even rural Java. Otherprovinces were less affected:large parts of Sumatra, Sulawese,and Maluku got off relativelylightly. Indeed those areas thatproduce cash crops or mineralsfor export would have benefitedfrom the crisis since the depreci-ation of the rupiah would haveboosted their incomes.11 Thecross-regional variation is illus-trated in Figure 2 for responsesconcerned with the forced sellingof assets. For each province thisshows the proportion of keca-matan where the situation wasworse than before the crisis. Itshould be emphasized, however,that these results indicatechanges. They do not reflectactual levels of poverty. Thusalthough West Java and Jakartawere strongly affected by the cri-sis these were, and remain,among the richest parts of thecountry, while Maluku thoughless affected was, and is, poorer.
● Education – It had been fearedthat the crisis would force par-ents to withdraw their childrenfrom school in large numbers. Inthe event, this does not seem tohave happened. Data from Suse-nas, the IFLS, and the 100 Vil-lage Survey indicate fewerdropouts than anticipated.Dropouts seem to have beenconcentrated at the lower sec-ondary level and even then were only tem-porary. This is illustrated in Figure 3 withdata from the 100 Village Survey.12 Thisshows the proportion of all children of therelevant age group who were actually attend-
BEYOND KRISMON The Social Legacy of Indonesia’s Financial Crisis 7
6abo
zza
– 15
ago
sto
2000
11 - Sumarto, Wetterburg and Pritchett, 1998. 12 - Cameron, 2000a.
0% 25% 50% 75% 100%
Bengkulu
North Sulawesi
South Sumatra
Central Sulawesi
Maluku
Jambi
East Kalimantan
Riau
South Sulawesi
East Timor
Lampung
North Sumatra
Southeast Sulawesi
West Sumatra
East Nusa Tenggara
Central Kalimantan
Bali
Dista Yogyakarta
Dista Aceh
South Kalimantan
East Kalimantan
West Nusa Tenggara
Central Java
East Java
West Java
DKI Jakarta
Figure 2 – Forced sales of assetsThis chart ranks the provinces according to the percentage ofkecamatan (sub-districts) that reported that the situation withrespect to asset sales had got ‘worse’ or ‘much worse’. Thus inJakarta the situation had deteriorated in 88% of kecamatan.
Source: Sumarto et al (1998)

clinics and traditional healers. More worry-ing still was a fall in the use of public healthfacilities by children. This is indicated inTable 1 which shows that the proportion ofchildren using health services dropped from26 to 20 per cent. Most of this fall is in visitsto the posyandu, the local clinics in rural andurban areas that are staffed by volunteerhealth workers and that are the main sourceof preventive care, including immunization,vitamin A distribution, and growth monitor-ing. The drop was especially alarming forchildren under five—from 47 to 28 per cent.Again this probably reflects a weakness inprovision. The posyandu rely on volunteerworkers who might be less willing to offertime when their households were understress. At the same time government supportto posyandu through the national women’sorganization, the Family Welfare Movement(Pembinaan Kesejahteraan Keluarga, PKK) willhave weakened.
ing school—it will therefore be somewhatlower than enrolment (the rise in primaryschool attendance in August reflects thebeginning of the school year). In any case, byMay 1999 school attendance at all three lev-els appeared to be marginally higher thanbefore the crisis.
● Health – The health story is less encourag-ing. As a result of the crisis, fewer peoplewere using government health facilities.The IFLS survey found that between 1997and 1998 the proportion of adults that hadused public health services in the monthprior to the survey fell from 7.4 to 5.6 percent.13 However this seems to have been notjust because people could not afford the feesbut also because they were dissatisfied witha deteriorating service that was running shortof drugs and other supplies. As a result theywere turning away from the public clinics,the puskesmas, and instead choosing private
8 BEYOND KRISMON The Social Legacy of Indonesia’s Financial Crisis
6abo
zza
– 15
ago
sto
2000
13 - Frankenberg, Thomas and Beegle, op cit., p. 65,Table 5.1.
Table 1 – Children’s use of health facilities
1997 1998
Using any health services 26% 20%Using puskesmas 7% 6%Using posyandu 15% 8%
Under five 47% 28%Using private services 8% 8%Using traditional 1% 1%
Note: Data refer to the proportion of childrenusing services in the four weeks prior to interview.Source: Frankenberg et al. (1999)
Prop
ortio
n of
age
gro
up a
ttend
ing
scho
ol
May-01 Aug-02 Dec-02 May-03
Primary - 6-12 yrs
Junior Secondary - 13-15 yrs
Senior secondary - 16-18 yrs
0%
20%
40%
60%
80%
100%
Figure 3 – School attendance 1997-99
Source: Cameron (2000a)

The crisis had clearly taken a toll, even if notat the catastrophic level initially feared. Thiswas partly thanks to individual and communi-ty resilience. But may also have been becauseof government action. As the scale of the crisisbecame evident in 1997 the government, alongwith international donors, moved quickly toinstall a ‘social safety net’ (Jaring PengamananSosial, JPS). The JPS was developed by theNational Development Planning Agency,BAPPENAS. It had four main components:subsidized food; scholarships for poor school-children; subsidies for health clinics and med-icines; and employment creation. Most of thefunds for the JPS programmes came as loansfrom the World Bank, the Asian DevelopmentBank, and bilateral donors.
FOOD SUBSIDIES
Of these components the special market oper-ation programme (Operasi Pasar Khusus, OPK)was probably the most significant, particularlyat the beginning of the crisis when there was adanger that food would suddenly be pricedbeyond the reach of many households.
The decisions as to who would get subsi-dized food were based on an ongoing monitor-ing system run by the National Family Plan-ning Coordinating Board (Badan KoordinasiKeluarga Berencana Nasional, BKKBN).BKKBN classifies households into four levelsof welfare status—on whether, for example,their house has an earth floor, or whether thefamily can afford certain consumer items. Thissystem is fairly rough and ready and not verysensitive to rapid changes in people’s circum-stances. Moreover there is some scepticism asto whether the enumerators actually visit all
households rather than simply making well-informed guesses. In the 100 Village Survey,for example, the majority of respondentsclaimed not to have been classified.14 Never-theless the BKKBN list did offer at least somebasis for targeting—and identified 17 millionpeople as in need of assistance.15
Based on the BKKBN list that had beencreated in January 1998, the OPK programmestarted in August 1998. Initially it entitledeach eligible household to purchase 10 kilo-grams of rice per month at Rp. 1,000 per kilo-gram—less than half the market price. Laterthe allocation was raised to 20 kilograms. TheNational Logistics Agency, Bulog, made theappropriate amount of rice available in eachdistrict.
The government may have wished to tar-get the cheap rice only at the poor, but localofficials, who were responsible for the actualdistribution, found themselves under pressureto share the food more equally. This may havedefused some social tension, but it meant thatthe poor got less than they should have done.Indeed surveys in some districts suggest thatthey actually received less than richer fami-lies.16 The poorest in urban areas may also havemissed out because, if they had settled thereunofficially, they would not have the valid IDcard required to qualify for official assistance.
The targeting may not have been that pre-cise, nevertheless the OPK programme offereda lifeline to millions of poor families. Itinvolved a substantial investment: the totalcost in 1999 was Rp. 3.7 trillion (US$460 mil-
3. DID THE SOCIAL SAFETY NET CATCH THE POOR?
9
6abo
zza
– 15
ago
sto
2000
14 - Cameron, 2000b.15 - Fane, 2000, p. 34.16 - Suryahadi, Suharso and Sumarto, 1999.
enrolment. To try to prevent a repeat of thisthe government started a supplementary edu-cation programme for the 1998/99 school year.This had two parts. The first consisted ofblock grants to schools in the poorest areas toenable them to maintain supplies and thequality of education. The second was a systemof monthly ‘scholarship’ payments for thepoorest children. These were given at threelevels: primary, Rp. 10,000 (US$1.20); lowersecondary, Rp. 20,000; and upper secondary,Rp. 30,000. Though these were called scholar-ships they were based not on academic testingbut on financial need.
The funds were allocated in the firstinstance to schools in such a way that the‘poorer’ schools received proportionally more.Then within each school the scholarships weredistributed by a committee that consisted ofthe head teacher, the chair of the parents’ asso-ciation, a teacher representative, a student rep-resentative, and the head of the village orurban community. These committees madedecisions based partly on the BKKBN data butthey also used other criteria, such as the dis-tance that the child lived from the school, orwhether he or she had a physical handicap orcame from a large or single-parent household.
The scholarships programme aimed toreach 6 per cent of primary-school students (itwas not given to children in the first threeclasses), 17 per cent of lower secondary stu-dents, and 10 per cent of upper secondary stu-dents. In the 1998/99 school year the pro-gramme distributed between 1.2 and 1.6million scholarships. In 1999 the total cost wasaround Rp. 1.1 trillion.
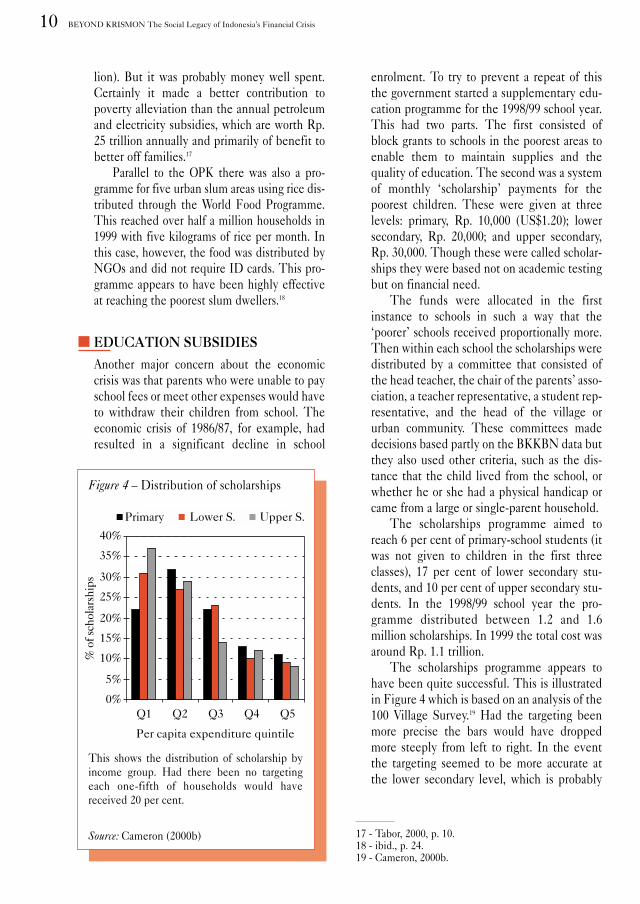
The scholarships programme appears tohave been quite successful. This is illustratedin Figure 4 which is based on an analysis of the100 Village Survey.19 Had the targeting beenmore precise the bars would have droppedmore steeply from left to right. In the eventthe targeting seemed to be more accurate atthe lower secondary level, which is probably
lion). But it was probably money well spent.Certainly it made a better contribution topoverty alleviation than the annual petroleumand electricity subsidies, which are worth Rp.25 trillion annually and primarily of benefit tobetter off families.17
Parallel to the OPK there was also a pro-gramme for five urban slum areas using rice dis-tributed through the World Food Programme.This reached over half a million households in1999 with five kilograms of rice per month. Inthis case, however, the food was distributed byNGOs and did not require ID cards. This pro-gramme appears to have been highly effectiveat reaching the poorest slum dwellers.18
EDUCATION SUBSIDIES
Another major concern about the economiccrisis was that parents who were unable to payschool fees or meet other expenses would haveto withdraw their children from school. Theeconomic crisis of 1986/87, for example, hadresulted in a significant decline in school
10 BEYOND KRISMON The Social Legacy of Indonesia’s Financial Crisis
6abo
zza
– 15
ago
sto
2000
Q1 Q2 Q3 Q4 Q5
Per capita expenditure quintile
% o
f sch
olar
ship
s
Primary Lower S. Upper S.
0%
5%
10%
15%
20%
25%
30%
35%
40%
Figure 4 – Distribution of scholarships
This shows the distribution of scholarship byincome group. Had there been no targetingeach one-fifth of households would havereceived 20 per cent.
Source: Cameron (2000b) 17 - Tabor, 2000, p. 10. 18 - ibid., p. 24. 19 - Cameron, 2000b.

where the money was most needed. At the pri-mary level, it seems not to have distinguishedwell between the poor and the very poor. Nev-ertheless, overall the poorest 40 per cent ofhouseholds received 55 per cent of the schol-arships. In addition there was a good genderdistribution: indeed at the secondary level girlsdid marginally better than boys.
Similar conclusions emerged from a small-er survey of households in northwest Java.Here the researchers found that the pro-gramme had been popular and well adminis-tered: very few families claimed that their chil-dren had been missed out in favour of richerneighbours. This was thought to have beenbecause the selection process was primarily inthe hands of teachers rather than of govern-ment officials.20
The scholarships programme delivered asubsidy to poor families. For this reason aloneit can be considered worthwhile. But did itstop parents withdrawing their children fromschool, or would they have kept their childrenat school anyway? The 100 Village Surveyallows for some monitoring of the behaviour ofindividual families. One analysis concludedthat the scholarships were most important atthe lower secondary level where they wereestimated to have reduced the drop-out ratefrom 9.7 to 7.3 per cent.21 On the other handthe scholarships had little or no effect on par-ents’ decisions at primary or upper secondarylevels. One possible reason is that children oflower secondary school age are the most vul-nerable to being withdrawn from school inorder to work.
Fortunately enrolment ratios seem tohave held up generally throughout the crisis.The scholarships programme made somecontribution, but so too did the block grantsto schools which helped prevent any furtherdecline in quality. Another important factorwas a more liberal attitude by schools. In the1986/87 crisis schools dismissed children whocould not pay the fees. This time theyallowed them to stay.
However the scholarships may also havemade indirect and less measurable contribu-tions to attendance. In some cases, for exam-
ple, the payments became more like the blockgrants because some schools intercepted thefunds in order to pay the fees of children whowere already in arrears. Thus they helpedmaintain quality standards for all, which wouldhelp overall attendance. Another possibility isthat the scholarships kept children at schoolwho might have dropped out eventually; someparents who were determined to keep theirchildren at school had borrowed money or soldassets to do so, but would not have been ableto sustain this for very long.
HEALTH SUBSIDIES
A third component of the JPS was a series ofadditional allocations to health and nutritionprogrammes. These included, for example,block grants to health centres to sustain ser-vices and to enable them to maintain supple-mentary feeding for pregnant and lactatingwomen. There were also grants to strengthenmaternal and child health care by village mid-wives, as well as subsidies for medicines andimported health equipment.
Unfortunately these allocations were at theexpense of other activities such as the controlof communicable diseases. Total public healthexpenditure did not increase; in fact it fellfrom the beginning of the crisis—by 7 per centduring 1997/98, and by a further 12 per cent in1998/99.22 Nor was the targeting very effective.Data from the 100 Village Survey indicate that,although there were considerable variations,the subsidized services related to the safetynet were used more or less equally by poor andnon-poor households.23
JOB CREATION
The fourth major component of the JPS wasjob creation. This involved a range of differentlabour-intensive activities. In some cases thegovernment simply redesigned existing pro-grammes to make them more labour intensive.
BEYOND KRISMON The Social Legacy of Indonesia’s Financial Crisis 11
6abo
zza
– 15
ago
sto
2000
20 - Hardjono, 1999. 21 - Cameron, 2000b. 22 - World Bank, 1999, p. 4. 23 - Suryahadi, Suharso and Sumarto. op. cit., p. 16.

wage rate, thus attracting workers from otheremployment.24 For this and other reasons,including favouritism in the allocation of work,these schemes do not seem to have beenspecifically beneficial to the poor.
Indonesia’s safety net programme thus hadan uneven record. It had a valuable, if notsharply targeted, food programme, and a bettertargeted education programme. But it had lesssuccess in maintaining health programmes orin creating new jobs. The JPS probably helpedpeople survive through traumatic times. Willthe country now be able to resume on anupward human development trend?
In other cases it gave block grants to commu-nities to enable them to undertake their ownpublic works activities. Individual ministriesalso embarked on special labour-intensiveworks. And official donors and NGOs intro-duced additional food-for-work programmes.
In theory the beneficiaries of these pro-grammes should be ‘self-selecting’ in that onlythe poorest should be prepared to work for thelow wages on offer. In practice this seems notto have happened since the wages were notparticularly low. Often the works were in thehands of contractors who made no specialefforts to attract the neediest workers. Indeedthey often paid wages higher than the local
12 BEYOND KRISMON The Social Legacy of Indonesia’s Financial Crisis
6abo
zza
– 15
ago
sto
2000
24 - Sumarto, Suryahadi and Pritchett, 2000.

There are two main causes for doubt. One isthat in retrospect, Indonesia’s former achieve-ments, while respectable, now seem shallower.So in some ways the country will be startingfrom further back and building on weakerfoundations. The second worry is that themonetary crisis and the debts it has createdmay have undermined the government’scapacity to invest in human development.
THE POVERTY LEGACY
One of the New Order administration’s proud-est boasts was to have dramatically reduced theproportion of the population living in poverty.This trajectory is reflected in Figure 5 in thelower line, labelled ‘BPS’, which shows a steadydrop from 40 per cent in 1976 to 14 per cent in1993. The rise in the BPS estimate for 1996 wasdue primarily to a change in methodology.25
Calculations of poverty rates everywhereare fraught with difficulty. There is generalagreement that the national poverty lineshould be sufficient to pay for a consumptionof 2,100 calories per day. And it is also conven-tional to assume that the cost of this will behigher in urban than in rural populations. Butbeyond this consensus lie greyer areas that aresusceptible to a wide range of interpretations.How much should people be expected tospend on non-food items, for example? Andhow much higher is the cost of living in urbanareas? Depending on the answers to suchquestions the poverty line can shift up ordown. Since in Indonesia a significant propor-tion of the population are clustered around theofficial poverty line the number judged to beliving in poverty can vary significantly.
The general consensus now is that previ-ously the poverty line as established by BPSwas set too low. The United Nations SupportFacility for Indonesian Recovery (UNSFIR),for example, argues that the poverty lineunderestimated both the cost of living in ruralareas and the proportion of expenditure thatpoor people typically devoted to non-fooditems—taking the latter to be around 15 percent when in reality it is nearer 30 per cent.Using its own assumptions on the rural cost ofliving and on non-food expenditure UNSFIRcalculates for 1993, for example, that thepoverty line would rise from the BPS figure ofRp. 21,000 to Rp. 28,000. This is a significantincrease, and since a large number of peoplewere living around the BPS poverty line manymore would thus be defined as poor. On thisbasis the poverty rate would rise from 14 to 34
4. QUESTIONINGTHE ‘NEW ORDER’ LEGACY
13
6abo
zza
– 15
ago
sto
2000
Hea
dcou
nt p
over
ty ra
te
0%
10%
20%
30%
40%
50%
60%
70%
80%
1976 1980 1984 1988 1992 1996
BPS
UNSFIR
Figure 5 – Income poverty 1976-96
Source: Dhanani and Islam (2000)
25 - Dhanani and Islam, 2000, Table 4.
are widening disparities within the poor—thatthe very poor are falling further behind thosewho are moderately poor. On both these mea-sures it seems that the crisis has exacerbatedpoverty: between February 1996 and February1999 there were increases in both the povertygap and in the severity of poverty.28
There are other ways in which a 25 percent rate might give an over-optimistic picture.One weakness of income poverty measures isthat they are based primarily on assessments ofcash expenditure. But a poor family might sus-tain expenditure temporarily by taking deci-sions against its long-term interests. Thus afamily that pulls a child out of school so that heor she might work might thereby inch itselfabove the poverty line—increasing householdexpenditure but at the expense of futureprospects. It is difficult to measure this kind of‘prospect poverty’. But one could consider, forexample, that any family that has at least onechild aged between 6 and 18 years who has notcompleted lower secondary education (to age15), and is not currently in school, is ‘prospectpoor’. On this basis in February 1999 it hasbeen estimated that when the income povertyrate was 27 per cent the addition of those whowere also prospect poor would bring the totalpoverty rate up to 34 per cent.29
Another way of looking at poverty is to con-sider not just those who are currently poor, butalso those who remain vulnerable, who mightsuddenly drop below the poverty line—if theysuffer a sudden shock: a bad harvest, say, or anillness. One estimate of the extent of vulnera-bility suggests that if the overall poverty ratewere 20 per cent the ‘vulnerability rate’ couldbe anywhere between 30 to 50 per cent.30
Even more people are likely to be consid-ered poor if the concept of poverty is broad-ened to encompass not just a shortage of cashbut a lack of basic capabilities that reflect poorstandards of health and education. UNDP hasattempted to measure this through the con-
per cent. Applying the same methodologythroughout the period gives the upperUNSFIR line in Figure 5.
This suggests that the New Order’sachievement had a less impressive result thanmight have appeared. Nevertheless the gradi-ent of the two lines is similar so there clearlywas a significant improvement. How much ofthis was due to government policy on povertyalleviation? Probably very little. During the1980s, thanks to the oil boom, the governmentwas able to increase its expenditure, but it didnot specifically target this at the poor. Eventhe grants it gave to the regions were devotedlargely to the development of infrastructure,and initially at least were not aimed at thepoorer areas.
The steady reduction in poverty was morea result of general economic growth that hadwidened employment opportunities for thepoor. Many were able to benefit from agricul-tural development, since in the 1980s this wasstill fairly labour-intensive. And the expansionof industry after 1981 also absorbed manyunskilled workers. At the same time foodprices had kept fairly stable, which also helpedthe poor. Nor did the structural adjustmentprogrammes of the 1980s do too much damagesince the cutbacks tended not to strike at thepoor directly. By the late 1980s and early1990s, however, the reduction in povertyseemed to taper off, which may have beenbecause growth was increasingly being con-centrated in the more capital-intensive indus-tries that required fewer, and more highlyskilled, workers.26
By late 1999, there seemed to be generalagreement that the level of income povertywas of the order of 25 to 30 per cent and thatthis represented a significant increase.27 Nev-ertheless even this may underestimate thetrue impact of the crisis on the very poorest.For example, even if the number of poor peo-ple had remained the same, their incomes as agroup might have fallen even further behindthose of the rest of the population. This wouldshow up in estimates of the ‘poverty gap’,which registers just how far the expenditure ofthe poor as a whole lies below the poverty line.At the same time it is also possible that there
14 BEYOND KRISMON The Social Legacy of Indonesia’s Financial Crisis
6abo
zza
– 15
ago
sto
2000
26 - Booth, op. cit. 27 - Sutanto, Irawan, and Said, 1999. 28 - Suryahadi et al., op. cit. p. 25.29 - Pradhan et al., 2000.30 - Pritchett., Suryahadi and Sumarto, 2000.

cept of ‘human poverty’ and has produced ahuman poverty index (HPI) that incorporatesdeprivation along three main dimensions:longevity, educational achievement, and stan-dard of living. These indicators do not neces-sarily overlap. An individual could be pooralong one dimension but not along another: itis possible, for example, to be an illiterate mil-lionaire. So the HPI does not give a ‘head-count’ of the proportion of people living inhuman poverty—one that could be comparedwith the proportion living in income poverty.Nevertheless it offers a useful guide. The 2000UNDP Human Development Report accordsIndonesia a HPI index for 1998 of 28 per cent,which compares with 19 per cent for China, 19for Thailand, 16 for the Philippines, and 14 percent for Malaysia.31
UNSFIR estimates that the HPI forIndonesia came down fairly steadily in the1990s: from 35 per cent in 1990 to around 22per cent in 1999 (the latter is lower than theUNDP estimate since it uses slightly differ-ent data).32 As the HPI reflects more funda-mental characteristics of a country it is lessvolatile than the income poverty rate whichcan change suddenly in response to a bout ofinflation.
Overall, therefore, Indonesia has had con-siderable success in reducing poverty, but noton the scale previously imagined. Millions ofpeople still live on the brink of survival. A sim-ilar fragility is evident in other areas—nutri-tion, health and education.
THE NUTRITION LEGACY
During the New Order period, Indonesiamade substantial progress in food production.One aim was to become self-sufficient in rice.This goal was fleetingly achieved in the mid-1980s, but in recent years production has gen-erally fallen about 10 per cent short of con-sumption, and as a result Indonesia hasbecome the world’s largest rice importer.Another aim has been to achieve low and sta-ble food prices. However the price cannot beset very low since Indonesia has around 14 mil-lion small paddy farmers who rely on rice salesfor income.33 In order to protect local farmers
there has usually been an import tariff on rice,which early in 2000 was 30 per cent.34
Using a combination of local produce andimports, total average daily food consumptionincreased between the 1960s and the early1990s from 2,000 to 2,700 calories. But this isnot evenly distributed, so many people will beconsuming less than their daily needs.
This is very evident for children, whosehealthy growth is sensitive to the quantity andquality of food that their parents provide. Hereagain there has been some success. For chil-dren under five years the proportion who wereunderweight fell over the period 1989-99, from36 to 25 percent. But there are considerableregional variations: lower rates in Java are off-set by rates above 40 per cent in West and EastNusa Tenggara and over 50 per cent in Aceh.It is also important to point out that most ofthe gains have been among the moderatelymalnourished. The proportion of severely mal-nourished children remains stubbornly high—around 8 per cent in 1999. This means that ofIndonesia’s 23 million children under fiveyears, 1.8 million are severely malnourished.35
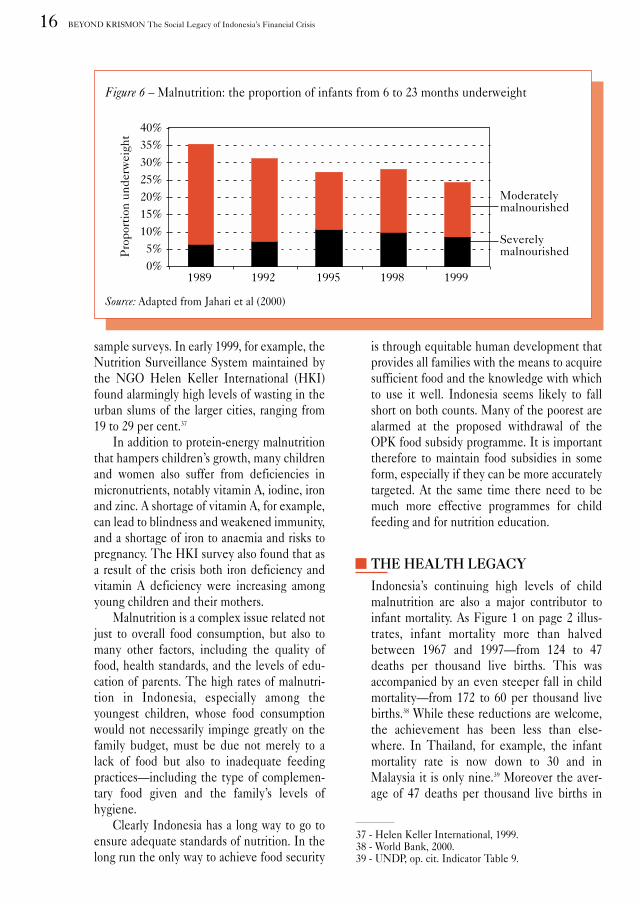
Of even greater concern is the plight ofchildren aged six months to two years—a criti-cal period of life when malnutrition does themost damage. As Figure 6 indicates, between1995 and 1998 malnutrition actually rose forthis group. And in terms of severe malnutritionthe level in 1999—8 per cent—is higher than itwas ten years earlier.36
These rates refer to children who weighless than they should for their age. Low weightfor age typically reflects an underlying prob-lem of chronic malnutrition. Another indicatorof malnutrition, is low weight for height, ‘wast-ing’, which often occurs at times of faminewhen children are suddenly deprived of suffi-cient food. The normal Susenas surveys do notcollect data on children’s height. Indications ofwasting must come therefore from smaller
BEYOND KRISMON The Social Legacy of Indonesia’s Financial Crisis 15
6abo
zza
– 15
ago
sto
2000
31 - UNDP Human Development Report. 2000, p. 157.32 - Dhanani and Islam, op. cit. 33 - Tabor and Soekirman, 2000. 34 - Tabor, op. cit. 35 - Jahari et al., 2000. 36 - ibid.
is through equitable human development thatprovides all families with the means to acquiresufficient food and the knowledge with whichto use it well. Indonesia seems likely to fallshort on both counts. Many of the poorest arealarmed at the proposed withdrawal of theOPK food subsidy programme. It is importanttherefore to maintain food subsidies in someform, especially if they can be more accuratelytargeted. At the same time there need to bemuch more effective programmes for childfeeding and for nutrition education.
THE HEALTH LEGACY
Indonesia’s continuing high levels of childmalnutrition are also a major contributor toinfant mortality. As Figure 1 on page 2 illus-trates, infant mortality more than halvedbetween 1967 and 1997—from 124 to 47deaths per thousand live births. This wasaccompanied by an even steeper fall in childmortality—from 172 to 60 per thousand livebirths.38 While these reductions are welcome,the achievement has been less than else-where. In Thailand, for example, the infantmortality rate is now down to 30 and inMalaysia it is only nine.39 Moreover the aver-age of 47 deaths per thousand live births in
sample surveys. In early 1999, for example, theNutrition Surveillance System maintained bythe NGO Helen Keller International (HKI)found alarmingly high levels of wasting in theurban slums of the larger cities, ranging from19 to 29 per cent.37
In addition to protein-energy malnutritionthat hampers children’s growth, many childrenand women also suffer from deficiencies inmicronutrients, notably vitamin A, iodine, ironand zinc. A shortage of vitamin A, for example,can lead to blindness and weakened immunity,and a shortage of iron to anaemia and risks topregnancy. The HKI survey also found that asa result of the crisis both iron deficiency andvitamin A deficiency were increasing amongyoung children and their mothers.
Malnutrition is a complex issue related notjust to overall food consumption, but also tomany other factors, including the quality offood, health standards, and the levels of edu-cation of parents. The high rates of malnutri-tion in Indonesia, especially among theyoungest children, whose food consumptionwould not necessarily impinge greatly on thefamily budget, must be due not merely to alack of food but also to inadequate feedingpractices—including the type of complemen-tary food given and the family’s levels ofhygiene.
Clearly Indonesia has a long way to go toensure adequate standards of nutrition. In thelong run the only way to achieve food security
16 BEYOND KRISMON The Social Legacy of Indonesia’s Financial Crisis
6abo
zza
– 15
ago
sto
2000
37 - Helen Keller International, 1999. 38 - World Bank, 2000. 39 - UNDP, op. cit. Indicator Table 9.
Pro
port
ion
unde
rwei
ght
Moderatelymalnourished
Severelymalnourished
0%5%
10%15%20%25%30%35%40%
1989 1992 1995 1998 1999
Figure 6 – Malnutrition: the proportion of infants from 6 to 23 months underweight
Source: Adapted from Jahari et al (2000)

Indonesia covers wide regional variations—only 28 in Jakarta, but 67 in South Kalimantanand 81 in West Nusa Tenggara. Indonesia’sachievement in immunization coverage hasalso been overstated: instead of the 80 percent widely reported in the 1990s it is proba-bly nearer 60 per cent.40 Around four millionchildren are born each year in Indonesia; ofthese 300,000 die before their fifth birthday—an average of 300 per day.
Mothers are also at grave risk. Thousandsof women die each year from causes related tochildbirth. The maternal mortality rate hascome down, from around 800 in 1980-8741 toaround 373 by 1995. Even so the rate remainsdisturbingly high, and shockingly so in someregions—around 800 in Maluku and over 1,000in Irian Jaya.42
When mortality rates come down this isusually the result of a combination of factors—typically rising levels of economic develop-ment combined with more effective healthservices. In Indonesia improvements in publichealth provision probably played a minor role,since the country has been investing relativelylittle in its public health services, certainly lessthan neighbouring countries. Over the period1996-98 public expenditure on health was only0.6 per cent of GDP, compared with 1.3 percent in Malaysia and 1.7 per cent in Thailand,and an average of 2.2 per cent for all develop-ing countries.43
Indonesia has a network of 7,100 healthcentres, the puskesmas, to which are linked23,000 sub-centres, over 4,000 mobile clinics,and 19,000 village maternity rooms. In addi-tion there are 240,000 posyandu, the monthlyhealth service posts run by volunteers whopromote maternal and child health.
Although the public network is extensiveand well distributed across the country it is notas effective or as well used by the poor as itshould be. One issue is charges. In 1998 eachvisit to a health centre or a sub-centre cost onaverage Rp. 2,300 (approximately the price ofa kilo of rice). These charges clearly detersome people. Susenas data for 1995 suggestthat the richest one-fifth of households were50 per cent more likely to use public outpa-tient health facilities than the poorest families,
and the imbalance was even greater in therural areas.44
However, other people may be deterred bythe quality of care on offer. Underfunding hasreduced the standards of equipment and thesupplies of drugs. There are similar problemswith the posyandu: far fewer people use themthan might have been expected. In 1997 morethan one-third of children under five did notgo to the posyandu.
Dissatisfaction with public services hasbeen driving more people to seek private care.Around half of total national expenditure onhealth takes place through the private sector.This includes treatment in private hospitalsand clinics, often by doctors employed by thepublic sector who are also allowed to offer pri-vate care during normal hours in public facili-ties. Such treatment is correspondingly moreexpensive: each consultation with a privatenurse costs on average Rp. 6,300, and with aprivate doctor Rp. 20,000. In addition manypeople also use traditional healers.
Even before the crisis people had beendeserting the public clinics. According to theWorld Bank the share of public providers hadfallen below 30 per cent by 1995 and by 1998had slipped below 20 per cent. Around 28 percent of people sought modern private carewhile most of the rest opted for traditionalhealers or self-treatment.45
The unpopularity of public health centresis partly a consequence of underfunding. AsFigure 7 illustrates, real public health expendi-ture had been rising up to the mid-1990s, but itstarted to fall off again when the crisis hit.46
Until relatively recently even the fees paid byusers did not necessarily support the clinicssince local governments were diverting muchof the income to finance non-health activities.47
Finance is not the only issue. The man-agement of health services also leaves much to
BEYOND KRISMON The Social Legacy of Indonesia’s Financial Crisis 17
6abo
zza
– 15
ago
sto
2000
40 - Betke, op. cit. 41 - UNICEF, 1989. 42 - UNICEF, 2000, p. 38.43 - UNDP, op. cit., Indicator Table 16.44 - Lieberman and Marzoeki, 1999. 45 - ibid. p. 4. 46 - ibid. p. 7, Table 2.47 - Achmad, 1999, p. 11.

expanded into every district in Indonesia theyhave not been very responsive to communityneeds and have lacked a stable base of volun-teers. Moreover, training of volunteers hasgenerally concentrated on technical ratherthan social issues.
The centralized nature of the New Orderbrought some advantages. The presidentcould ordain that health facilities be dispersedthroughout the country, even if these resourceswere often spread very thinly. Thus doctorswould find themselves posted to remote areas.So even if they devoted much of their energyto private practice they were at least availableon the spot. But the longer term legacy is moredoubtful. Now that the centrally controlledsystem has been weakened it is not clear whatwill take its place.
THE EDUCATION LEGACY
The situation is similar with education. TheNew Order government was determined toachieve universal primary education and wenta long way in this direction. Between 1973 and1991 the number of children increased byaround one-third, but the government morethan doubled the number of primary schools.49
From 1984 it made primary education compul-sory and by 1999 it had achieved a net primaryenrolment ratio of 93 per cent.50 A notable fea-ture is that the ratio for girls is the same as thatfor boys.
Since 1994 there has also been a policy toextend compulsory education to the threeyears of lower secondary school. In 1999 theenrolment ratio was 59 per cent for lower sec-ondary school, and 39 per cent for senior sec-ondary school. At the secondary level there aremarginally more girls than boys. As a resultIndonesians have become steadily better edu-cated. As Figure 8 illustrates, around two-thirds of the population now have at least pri-mary education.
However this massive expansion of schoolavailability has not been matched by improve-
be desired. As with other public services thishas been very much a hierarchical system. Thegovernment was concerned about the adminis-trative capabilities of those who might beworking in remote communities, so the Min-istry of Health has required health staff torigidly follow detailed handbooks and proce-dures and fill out many lengthy reports. Whilethis may have helped assure some basic stan-dards it has also discouraged initiative, leavingstaff little flexibility to adjust their budgets tolocal needs.
Of course some top-down health deliverysystems can work quite effectively if they arewell organized and have firm political support.President Soeharto took a strong interest infamily planning, for example, and he directlysupervised the National Family PlanningCoordinating Board (BKKBN). When hebecame concerned about maternal mortality in1996 he launched the Safe Motherhood pro-gramme. But more routine health matters wereless likely to be addressed. Indeed it has beenreported that President Soeharto never attend-ed cabinet meetings on health issues.48
In comparison with the command-and-control structure that drove the family plan-ning programme, the posyandu have had muchless support, administrative or financial. Norhave they put down strong community roots.Although these health posts have been
18 BEYOND KRISMON The Social Legacy of Indonesia’s Financial Crisis
6abo
zza
– 15
ago
sto
2000
48 - ibid. 49 - Prijono, 1999, p. 161. 50 - Badan Pusat Statistik, 2000, p. 53.
Fiscal year
Rp.
trill
ion
at 1
993/
94 p
rice
s
Government funds
Foreign aid
0.0
0.5
1.0
1.5
2.0
2.5
3.0
94/95 95/96 96/97 97/98 98/99
Figure 7 – Public expenditure on health
Source: Lieberman and Marzoeki (1999)

ments in quality. The standard of teaching ispoor—a result of inadequate training and lowsalaries, as well as a curriculum overburdenedwith state ideology. Most teachers need totake second jobs to survive. As a consequenceof low funding, many schools, particularly inthe rural areas, lack textbooks and basicequipment.
Education can also be expensive. In thepast most schools have charged an entrance feeand a ‘voluntary contribution’. Then parentshave to pay monthly tuition fees, as well asbuy school uniforms. These costs mount up,
particularly in the urban areas and for sec-ondary education.
The government has made efforts to abol-ish entrance and tuition fees at both primaryand junior secondary levels. However feesprobably represent only around 10 per cent ofthe total expense to parents since they stillhave to pay for uniforms, supplementary text-books and other necessities, and also makecontributions to parent-teacher associations.
These payments make up in part for gov-ernment underfunding. According to theWorld Bank, Indonesia’s central governmentspends only around 1.4 per cent of GNP oneducation, a far lower proportion than neigh-bouring countries. And, as Figure 9 shows, thisproportion is lower than in the 1970s.
Either because they never enrolled orbecause they subsequently dropped out, 20per cent of children still do not complete pri-mary education. At junior secondary level theenrolment ratio is lower, which, combinedwith dropout, means that the proportion of 13to 15 year olds not in school rises to 30 percent.51
Most children not at school will be work-ing. Estimates of the total number of child
BEYOND KRISMON The Social Legacy of Indonesia’s Financial Crisis 19
6abo
zza
– 15
ago
sto
2000
1971
1994
Pro
port
ion
of p
opul
atio
n Less thanprimary
Primaryonly
Lowersecondaryor above
0%
20%
40%
60%
80%
100%
1980
Figure 8 – Education levels, 1971-94
Source: UNICEF ( 2000)
51 - UNICEF, 2000, p. 100.
Pro
port
ion
of G
NP
0%
1%
2%
3%
4%
5%
6%
7%
8%
9%
1970 1972 1974 1976 1978 1980 1982 1984 1986 1988 1990 1992 1994 1996
Malaysia
Thailand
Indonesia
Figure 9 – Central government spending on education as a proportion of GNP – 1970-96
Source: World Bank (2000)

ment steadily reduced the scope for politicalorganization. In 1971 it had forced the mainopposition parties to merge, and it decreed thatbetween national elections there could be noparty activity below the district levels. Mean-while it vetted all candidates for local office, par-ticularly the bupati, the head of each kabupaten.
This system eroded many distinctionsbetween the administration and the ruling polit-ical party. It also allowed the bureaucracy tobecome a vehicle for patronage, enabling it tosiphon off vast amounts of money. Ultimatelythe New Order had little faith in the Indonesianpopulation, which it envisaged as an unreliableand unstable ‘floating mass’ that would need tobe controlled by the government or by the army.
The government also took charge of themain organizations of civil society. Rather thanallowing these to work independently it creat-ed a series of national ‘mass organizations’ torepresent different constituencies, such aswomen, youth, or workers. But their represen-tational functions were limited: essentiallythese organizations served as channels forpatronage and as a means of rallying supportfor government programmes and campaigns.
As well as creating its own organizationsthe government also tried to co-opt local élitesand existing traditional structures, notably theadat communities that influenced many cul-tural and social arrangements. On the onehand the government tried to restrict the areasin which adat communities could operate.Thus it effectively displaced mechanisms suchas the communal rice barns that acted as a formof social safety net. On the other hand it triedto co-opt their traditions of mutual self-help,known as gotong-royong—regularly tapping thisto recruit people for many labour-intensivedevelopment activities.54
The main alternative sources of authorityto that of the government were religious orga-nizations, predominantly Islamic, which notonly provided moral leadership but also under-took social development activities. In manyparts of the country these are based on Islamic
workers vary considerably. The August 1999Susenas survey, for example, concluded that tenper cent of children aged 10-14 were working.The rates were higher in rural (14 per cent) thanurban (4 per cent) areas. But a national rate of10 per cent seems unlikely since it is far lowerthan the proportion of children not in school.Estimates that combine labour and educationdata suggest that the proportion of child work-ers may be twice as high, and that about half ofworking children also go to school.52
Not all child work is harmful. The labourforce data suggest that three-quarters of childlabourers are unpaid family workers—carryingout small tasks on family farms for example.But many other children are engaged in farmore hazardous employment, working as scav-engers, for example, or on plantations exposedto pesticides, or on construction sites or intransportation. Nowadays child workers areincreasingly employed in urban areas wherethe work is likely to involve longer hours andto be more dangerous or exploitative.
THE GOVERNANCE LEGACY
The delivery of health and education servicesin Indonesia has been strongly conditioned bythe authoritarian style of government. Policyhas been set at the top, often in the office ofthe president, and then transmitted down-wards on the assumption that it would beenacted in the remotest villages.
The current pattern was set in 1974 withlegislation that divided the country intoprovinces of which there are currently 28. Theprovinces are subdivided into districts. In therural areas the districts are the kabupaten(regencies) which are also subdivided in keca-matan (sub-districts) and finally into desa (vil-lages). In urban areas the district-level unitsare the kota, which are also divided into keca-matan, and the equivalent of the villages arethe kelurahan. In 1979, this system was devel-oped in order to impose a uniform structure ofadministration on each village. Althoughostensibly to facilitate local government, inpractice the purpose was more to establish amilitary-style chain of command.
At the same time, the New Order govern-
20 BEYOND KRISMON The Social Legacy of Indonesia’s Financial Crisis
6abo
zza
– 15
ago
sto
2000
52 - Irawan, Hendriati and Hestyanti, 1999. 53 - Suharyo, 2000, p. 6. 54 - NR International, 1998, p. 27.

boarding schools called pesantren, at the headof which there is an influential spiritual leaderthe kyai. The current president was once ateacher at his father’s pesantren.
The New Order’s efforts to repress or toco-opt alternative forms of organizationworked well during the 1970s. The govern-ment was able to use oil money to impose itsauthority and the population seemed preparedto trade democracy for the benefits of rapideconomic development. As the oil revenuefell, however, and it became clear that growthwas not necessarily delivering development,new focuses of resistance started to emerge.Since the government had clamped down onpolitical activity many people channelled theirenergies instead into religious or social welfareorganizations. They also established manynew non-governmental organizations, many ofwhich focused on environmental protection.Because the term ‘non-governmental’ couldbe interpreted as ‘anti-governmental’ the pre-ferred designation became Lembaga SwadayaMasyarakat (institution for self-help).55
Since 1999 the new government has trans-formed the political possibilities and removedmany formal restrictions. But creating ademocracy that lives and breathes throughoutthe country will be a far slower process. Muchof the ethos of the New Order remains. Cor-ruption is widespread. And a generation ofgovernment officials have been instilled withthe idea that a superior’s decisions, howevermisguided, should never be questioned. At thesame time, community organizations remainstunted.
The absence of effective channels for polit-ical action has driven protests into moredestructive directions. Lacking ways of express-ing themselves politically many communitieshave resorted to religious or ethnic violence, orhave demanded greater independence or auton-omy from the central government.
Faced with the prospect of national disin-tegration the government in 1999 passeddecentralisation laws that would establish adramatically different form of administration.This scheme was remarkable in manyrespects. The first is that it effectively bypass-es the provincial layer of administration, giving
power straight to the districts, the kabupaten, inthe rural areas and the towns, the kota, in theurban areas. The provinces will be left with aminor residual role—coordinating variousactivities and undertaking some functions thatcannot be carried out at the district level. Thisdetermination to avoid concentrating power atthe provincial level reflects a long-standingwariness of anything that smacks of a federalstructure.
A second aspect of the process—alsodesigned to preserve national integrity—is anew form of revenue sharing. People in someparts of the country felt they had gained littlefrom the exploitation of their natural resourcessince the income had largely flowed to Jakarta.In future such revenue will be shared moreequally between central and local govern-ments. This means for example, that Aceh,Riau, East Kalimantan and Irian Jaya will havemore funds at their disposal, so some of thepoorer provinces will benefit.
Another striking aspect of the proposeddecentralization process is its speed. The lawspassed in 1999 envisaged that the new systemwould be launched in January 2001 and becompleted by June—an extremely demandingschedule.
While the determination to decentralizehas been widely welcomed, the process hasraised a number of anxieties. The most imme-diate worry is the speed of its introductionsince few of the necessary mechanisms will bein place before the process gets underway. Butthere are also longer-term worries particularlyfor services to women and children. One is thatthe districts are unlikely to have the personnelor the skills to administer such activities. Pre-sumably some administrators will have to betransferred from Jakarta to the districts but it isnot clear how or when. Another worry is thatwhen local political leaders gain control overdevelopment budgets they will feel lessinclined to invest in health or welfare services,and may be tempted to use the funds insteadfor higher-profile infrastructure projects. TheGovernment has made efforts to agree with
BEYOND KRISMON The Social Legacy of Indonesia’s Financial Crisis 21
6abo
zza
– 15
ago
sto
2000
55 - ibid, p. 32.

East Nusa Tenggara.56 In the past transfersfrom the central government have helpedequalize incomes and, until the mid-1990s atleast, regional disparities appear to have beennarrowing.57 However, in recent years the gapsmay have been widening again, and withgreater decentralization the more prosperousand the better organized districts will be in astronger position to attract staff and to pay forhigher levels of service.
the districts to sustain a minimum investmentfloor of 15 per cent of regional budgets forbasic health services, though it is not clear howthis will be carried through.
Finally there is a danger of widening thegaps between regions. Regional disparities inIndonesia are less than in other countries inSoutheast Asia, such as Thailand and thePhilippines. Even so, the per capita income inBali, for example, is more than twice that in
22 BEYOND KRISMON The Social Legacy of Indonesia’s Financial Crisis
6abo
zza
– 15
ago
sto
2000
56 - Badan Pusat Statistik, 2000, p 87. 57 - Islam, 1999, p. 4.

Most countries caught up in the Asian financialcrisis appear to have weathered the storm. Butprospects for Indonesia are far more uncertain,especially for the one-quarter of the popula-tion below the poverty line, who will strugglefor survival in a more difficult and ambiguousenvironment. They have lost the old certain-ties of the New Order but are unsure whathappens next.
The achievements of the previous admin-istration, whether in poverty or in the deliv-ery of social services, were substantial, butless impressive than they may have appeared.The government pushed through measuresby fiat rather than allowing them to be shapedby the demand from an educated andempowered population. And while it hadquantitative achievements in terms of head-line numbers—the total of children enrolledin school, for example, or clinics construct-ed—it was less successful in delivering realquality.
More alarming for the future, however, isthe threat to social funding. Indonesia wasalready lagging in terms of social spending.Now the situation is likely to get even worse.As a consequence of the monetary crisis thegovernment is now deep in debt. In 1999, inorder to recapitalize the banks it sold $72 bil-lion-worth of bonds. The IMF estimates thatservicing this debt will absorb one-third ofgovernment expenditure in 2000, and aroundone-quarter in 2001 and 2002.58
Meanwhile the international financialinstitutions are pressing the government tobalance its budget. This seems likely tosqueeze other priorities, particularly the socialsector. Indeed this has already happened.Since 1997/98 the government health budget
is reported to have shrunk by 20 per cent andthe education budget by 40 per cent.59
A crisis that erupted within the financialsector has thus had severe social conse-quences. Community and government action,with the help of international donors, mayhave absorbed some of the sharpest blows. Butmillions more people have been plunged intopoverty. The health service is deteriorating,and millions of children are malnourished. Inthe end, however, the greatest damage couldbe far more persistent and insidious. Unlessthere is a major effort to protect social spend-ing, Indonesia’s children could be paying forthe folly of bankers for years to come.
5. THE THREAT OF DEBT
23
6abo
zza
– 15
ago
sto
2000
58 - International Monetary Fund, 2000, press releaseNo. 00/4. 59 - Asiaweek, 7 July 2000.
6abo
zza
– 15
ago
sto
2000
Achmad, J., Hollow Development: The Politics of Health in Soeharto’s Indonesia. Jakarta: Gramedia (1999).Asiaweek, “The Buck Stops Here” Asiaweek, July 7 (2000).Badan Pusat Statistik, Republik Indonesia (Statistics Indonesia of The Republic of Indonesia). Welfare
Indicators 1999 (2000).Betke, F., The ‘Family in Focus’ Approach: Developing Policy-oriented Monitoring and Analysis of Human Devel-
opment in Indonesia. Innocenti Working Paper No. 83, UNICEF Innocenti Research Centre, Florence,Italy (2001).
Booth, A., “Poverty and Inequality in the Soeharto Era: An Assessment”, Bulletin of Indonesian EconomicStudies, Vol. 36, No. 1 (2001).
Cameron. L., The Impact of the Asian Financial Crisis on children: An Analysis Using the 100 Villages Data.UNICEF Innocenti Research Centre, Innocenti Working Paper No. 81, Florence, Italy (2000a).
Cameron, L., An Analysis of the Role of Social Safety Nets Scholarships in Reducing School Drop-out During theIndonesian Economic Crisis. UNICEF Innocenti Research Centre. Innocenti Working Paper No. 82,Florence, Italy (2000b).
Dhanani, S. and Islam, I., Poverty, Inequality and Social Protection: Lessons from the Indonesian Crisis.UNSFIR Working Paper 000/01. Jakarta: United Nations Support Facility for Indonesian Recovery(2000).
Dufflo, E., Schooling and Labor Market Consequences of School Construction in Indonesia: Evidence from anUnusual Policy Experiment, NBER Working Paper, No. 7860. Cambridge, Mass. National Bureau ofEconomic Research (2000).
Economist Intelligence Unit, Indonesia Country Report. London: Economist Intelligence Unit (2000). Fane, G., “Survey of Recent Developments”, Bulletin of Indonesian Economic Studies, vol. 36, No. 1
(2000). Frankenberg, E., Thomas, D. and Beegle, K., The Real Costs of Indonesia’s Economic Crisis: Preliminary
Findings from the Indonesia Family Life Surveys. Santa Monica: Rand Corporation (1999). Hardjono, J., The Micro Data Picture: Results of a SMERU Social Impact Survey in the Purwakarta-Cirebon
Corridor. SMERU Working Paper. Jakarta: Social Monitoring & Early Response Unit (1999).Helen Keller International, Indonesia’s Crisis: A Comparison of its Impact on Nutrition and Health in Urban
and Rural Populations. Jakarta: Helen Keller International (1999).Hill, H., The Indonesian Economy in Crisis. Singapore: Institute of Southeast Asian Studies (1999). International Monetary Fund, press release No. 00/4, http://www.imf.org/external/np/sec/pr/2000/
pr0004.htm (2000).Irawan, P., Hendriati, H. and Hestyanti, Y., Alternative Education Strategies for the Young Disadvantaged
Groups in Indonesia. Jakarta: UNESCO (1999).Islam, I., Regional Decentralization in Indonesia: Towards a Social Accord, UNSFIR Working Paper No.
99/01. Jakarta: United Nations Support Facility for Indonesian Recovery (1999).Jahari, A., Sandaja, Herman, S., Soekirman, Jus’at, I., Jalal, F. and Latief, D., Nutritional Status of Under-
fives in Indonesia During the Crisis. Paper presented at the 7th National Workshop on Food and Nutri-tion. Jakarta: LIPI. Indonesian Insitute of Sciences (2000).
Lieberman, S. and Marzoeki, P., Health Strategy in a Post-Crisis Decentralizing Indonesia. Jakarta: WorldBank (1999).
NR International, “Civil Society Organizations and Government in Indonesia: A Case Study of their
References
26 BEYOND KRISMON The Social Legacy of Indonesia’s Financial Crisis
6abo
zza
– 15
ago
sto
2000
Respective Strengths and Capacities”, Capacity Building in Community Development. Report for ADB.Jakarta: Asian Development Bank (1998).
Popple, J., Sumarto, S. and Pritchett, L., Social Impacts of the Indonesian Crisis: New Data and Policy Impli-cations. Social Monitoring & Early Response Unit, Jakarta (1998).
Pradhan, M., Suryahadi, A., Sumarto, S. and Pritchett, L., Measurements of Poverty in Indonesia: 1996, 1999,and Beyond. SMERU Working Paper. Jakarta: Social Monitoring & Early Response Unit (2000).
Prijono, O., “Education: Access, Quality, and Relevance”, in Indonesia: The Challenge of Change, Baker, R.,Soesastro, M., Kristiadi, J. and Ramage D. (eds). Singapore: Institute of Southeast Asian Studies(1999).
Pritchett. L., Suryahadi, A. and Sumarto, S., Quantifying Vulnerability to Poverty: A Proposed Measure, withApplication to Indonesia. SMERU Working Paper. Jakarta: Social Monitoring & Early Response Unit(2000).
Suharyo, W., Voices from the Regions: A Participatory Assessment of the New Decentralization Laws in Indonesia.UNSFIR Working Paper 00/02. Jakarta: United Nations Support Facility for Indonesian Recovery(2000).
Sumarto, S., Suryahadi, A., and Pritchett, L., Safety Nets and Safety Ropes: Comparing the Dynamic Benefit ofTwo Indonesian “JPS” Programs. SMERU Working Paper. Jakarta: Social Monitoring & EarlyResponse Unit (2000)
Sumarto, S., Wetterburg, A. and Pritchett, L., The Social Impact of the Crisis in Indonesia: Results from aNationwide Kecamatan Survey. Jakarta: Social Monitoring & Early Response Unit (1998)
Suryahadi, A., Sumarto, S., Suharso, Y. and Pritchett, L., The Evolution of Poverty during the Crisis in Indone-sia, 1996 to 1999. SMERU Working Paper. Jakarta: Social Monitoring & Early Response Unit (2000).
Suryahadi, A., Suharso, Y. and Sumarto, S., Coverage and Targeting in the Indonesian Social Safety Net Pro-grams, Social Monitoring & Early Response Unit, Jakarta (1999).
Sutanto, A., Irawan, P., and Said, A., Poverty Measurement: Problems and Development. Paper presented atthe International Conference on Methodologies of Poverty Calculation in Indonesia. Jakarta: BPS-Statistics Indonesia (1999).
Tabor S., Food Security: An Agenda for Action, Jakarta: World Food Programme (2000).Tabor, S. and Soekirman, Economic Crisis, Poverty, Food Security and Nutrition Status: Conceptual Linkages
and Policy Implications. Paper presented at the 7th National Workshop on Food and Nutrition. Jakarta:LIPI (2000).
UNICEF, State of the World’s Children. New York: UNICEF (1989).UNICEF, Challenges for a New Generation: The Situation of Children and Women in Indonesia, 2000. Jakarta
(2000).United Nations Development Programme (UNDP), Human Development Report. New York: United
Nations Development Programme (2000).World Bank, Indonesian Health Expenditures During the Crisis: Have They Been Protected? EAPR Watching
Brief, Issue 5, August 1999. Jakarta: World Bank (1999). World Bank, World Development Indicators, CDROM, Washington DC (2000).

BEYOND
KRISMON
The Social Legacy of Indonesia’s
Financial Crisis
U N I C E F
I n n o c e n t i I n s i g h t
BEYOND KRISMON:THE SOCIAL LEGACY OF INDONESIA’S FINANCIAL CRISIS
Most of the countries caught up in the Asian financialcrisis appear to have weathered the storm. ButIndonesia’s prospects are far more uncertain. In thisInnnocenti Insight, development journalist and writerPeter Stalker describes how the financial turbulence ofthe Krisis Moneter, or Krismon, set off a dramatic socialand political chain reaction, with effects on childrenthat could reverberate for years to come. Beyond Krismonexamines the legacy of Soeharto’s New Order regime interms of child well-being, the impact of the financialcrisis on areas essential to their survival and develop-ment and the crippling burden of debt that may jeopar-dize the nation’s hopes for the future.
UNICEF Innocenti Research CentrePiazza SS. Annunziata, 1250122 Florence, Italy
Tel.: +39 055 203 30Fax: +39 055 244 817E-mail (general information): [email protected] (publication orders): [email protected]
Website: www.unicef-icdc.org
ISBN: 88-85401-72-4
Peter Stalker