beyond pythagoras -
TRANSCRIPT
BEYOND PYTHAGORAS
Paulina Sundin Monty Adkins Adrian Gierakowski Music Department
University of Huddersfield Music Department
University of Huddersfield Electronic Engineering and
Computer Science Department Queen Mary University
ABSTRACT
This paper discusses the new harmonic possibilities enabled through the implementation of Sethares’ theory of the dissonance curve in Max/MSP and its use in a live electronic composition by two of the authors.
1. INTRODUCTION
Much of the research informing the authors’ composition Shards (2012) has been informed by the notions of consonance and dissonance outlined by William A. Sethares in his book ‘Tuning, Timbre, Spectrum, Scale’. Sethares writes that the notion of sensory consonance and dissonance has two implications. Firstly, individual complex tones will have an intrinsic or inherent dissonance:
Since dissonance is caused by interacting partials, any tone with more than one partial inevitably has some dissonance. This is a stark contrast to all the previous notions, in which consonance and dissonance were properties of relationship between tones. [1]
Secondly, that consonance and dissonance will depend not only on the interval between tones, but also on the spectrum of the tones used,
Since intervals are dissonant when the partials interact, the exact placement of these partials is crucial. [2]
The latter is something that Pierce was already aware of more than thirty years earlier in the 1960s when working with his arbitrary scales and correlating sounds [3]. Based on these experiments, our research examines how sounds with other kinds of spectral relationships work together to derive a new sense of harmonic consonance and dissonance in our electroacoustic compositional practice.
2. SETHARES DISSONANCE CURVES
Composer and theorist Harry Partch begins chapter nine of his ‘Genesis of a Music’ with the following,
According to Galileo, “agreeable consonances are pairs of tones which strikes the ear with a certain regularity; this irregularity consists in the fact that the pulses delivered by the two tones, in the same interval of time, shall be commensurable in number, so as not to keep the eardrum in perpetual torment, bending in two different directions in order to yield to the ever-discordant impulses.” The fairly “perpetual” torment which is our heritage in Equal Temperament has long obscured this aural axiom. [4]
Partch’s work and research is based on a tradition dating back to the ancient Greeks, the Pythagoreans and Ptolemy in particular, through music theorists and mathematicians such as Zarlino, Rameau, Galileo, Kepler, Helmholtz until the early 1900s. Partch was interested in creating music based on scales with more than 12 notes per octave. He built his own instruments, such as the Chromelodeon, a reed organ, in order to play the music he had composed with a scale with 43 scale steps per octave. He tuned his reed organ with “no other aid than the ability of the ear to distinguish pulsations ‘commensurable in number’ and those which bend its tympanum ‘in two different directions’” [5] in this 43 tone per octave scale with the focus on Just Intonation. By doing this he, as summarised by Sethares, “classified and categorised all the 43 intervals in terms of their comparative consonance”. [6]
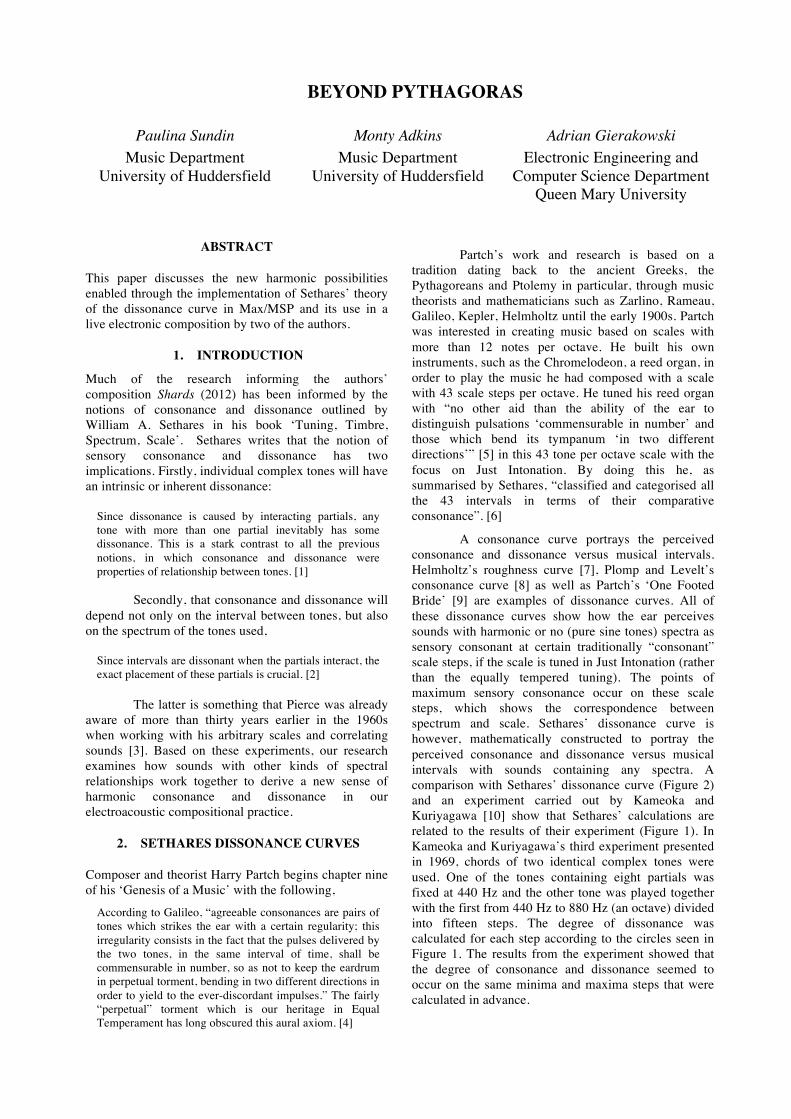
A consonance curve portrays the perceived consonance and dissonance versus musical intervals. Helmholtz’s roughness curve [7], Plomp and Levelt’s consonance curve [8] as well as Partch’s ‘One Footed Bride’ [9] are examples of dissonance curves. All of these dissonance curves show how the ear perceives sounds with harmonic or no (pure sine tones) spectra as sensory consonant at certain traditionally “consonant” scale steps, if the scale is tuned in Just Intonation (rather than the equally tempered tuning). The points of maximum sensory consonance occur on these scale steps, which shows the correspondence between spectrum and scale. Sethares’ dissonance curve is however, mathematically constructed to portray the perceived consonance and dissonance versus musical intervals with sounds containing any spectra. A comparison with Sethares’ dissonance curve (Figure 2) and an experiment carried out by Kameoka and Kuriyagawa [10] show that Sethares’ calculations are related to the results of their experiment (Figure 1). In Kameoka and Kuriyagawa’s third experiment presented in 1969, chords of two identical complex tones were used. One of the tones containing eight partials was fixed at 440 Hz and the other tone was played together with the first from 440 Hz to 880 Hz (an octave) divided into fifteen steps. The degree of dissonance was calculated for each step according to the circles seen in Figure 1. The results from the experiment showed that the degree of consonance and dissonance seemed to occur on the same minima and maxima steps that were calculated in advance.
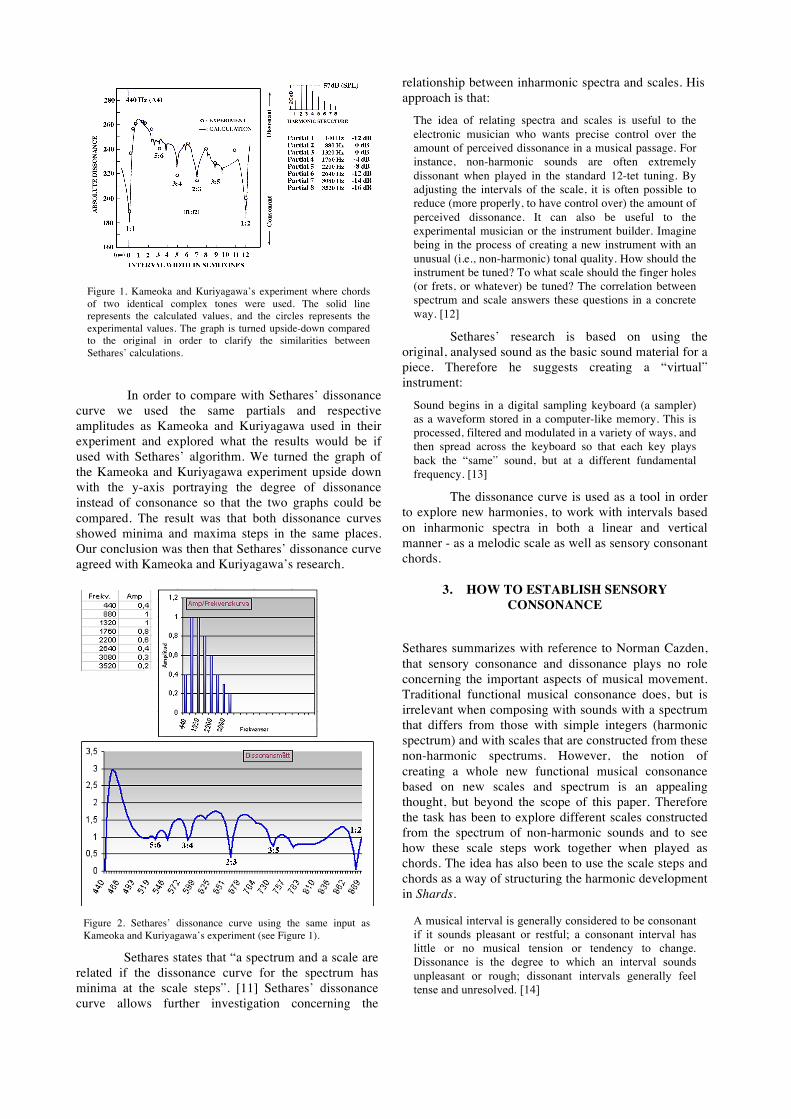
Figure 1. Kameoka and Kuriyagawa’s experiment where chords of two identical complex tones were used. The solid line represents the calculated values, and the circles represents the experimental values. The graph is turned upside-down compared to the original in order to clarify the similarities between Sethares’ calculations.
In order to compare with Sethares’ dissonance curve we used the same partials and respective amplitudes as Kameoka and Kuriyagawa used in their experiment and explored what the results would be if used with Sethares’ algorithm. We turned the graph of the Kameoka and Kuriyagawa experiment upside down with the y-axis portraying the degree of dissonance instead of consonance so that the two graphs could be compared. The result was that both dissonance curves showed minima and maxima steps in the same places. Our conclusion was then that Sethares’ dissonance curve agreed with Kameoka and Kuriyagawa’s research.
Figure 2. Sethares’ dissonance curve using the same input as Kameoka and Kuriyagawa’s experiment (see Figure 1).
Sethares states that “a spectrum and a scale are related if the dissonance curve for the spectrum has minima at the scale steps”. [11] Sethares’ dissonance curve allows further investigation concerning the
relationship between inharmonic spectra and scales. His approach is that:
The idea of relating spectra and scales is useful to the electronic musician who wants precise control over the amount of perceived dissonance in a musical passage. For instance, non-harmonic sounds are often extremely dissonant when played in the standard 12-tet tuning. By adjusting the intervals of the scale, it is often possible to reduce (more properly, to have control over) the amount of perceived dissonance. It can also be useful to the experimental musician or the instrument builder. Imagine being in the process of creating a new instrument with an unusual (i.e., non-harmonic) tonal quality. How should the instrument be tuned? To what scale should the finger holes (or frets, or whatever) be tuned? The correlation between spectrum and scale answers these questions in a concrete way. [12]
Sethares’ research is based on using the original, analysed sound as the basic sound material for a piece. Therefore he suggests creating a “virtual” instrument:
Sound begins in a digital sampling keyboard (a sampler) as a waveform stored in a computer-like memory. This is processed, filtered and modulated in a variety of ways, and then spread across the keyboard so that each key plays back the “same” sound, but at a different fundamental frequency. [13]
The dissonance curve is used as a tool in order to explore new harmonies, to work with intervals based on inharmonic spectra in both a linear and vertical manner - as a melodic scale as well as sensory consonant chords.
3. HOW TO ESTABLISH SENSORY CONSONANCE
Sethares summarizes with reference to Norman Cazden, that sensory consonance and dissonance plays no role concerning the important aspects of musical movement. Traditional functional musical consonance does, but is irrelevant when composing with sounds with a spectrum that differs from those with simple integers (harmonic spectrum) and with scales that are constructed from these non-harmonic spectrums. However, the notion of creating a whole new functional musical consonance based on new scales and spectrum is an appealing thought, but beyond the scope of this paper. Therefore the task has been to explore different scales constructed from the spectrum of non-harmonic sounds and to see how these scale steps work together when played as chords. The idea has also been to use the scale steps and chords as a way of structuring the harmonic development in Shards.
A musical interval is generally considered to be consonant if it sounds pleasant or restful; a consonant interval has little or no musical tension or tendency to change. Dissonance is the degree to which an interval sounds unpleasant or rough; dissonant intervals generally feel tense and unresolved. [14]
In order to create a harmony based on an inharmonic spectrum, the first step was to look into how to establish some kind of consonance. This was needed in order to structure the sound material on a vertical axis, as chords. In order to use chords, there needed to be a way of creating intervals so that when played at the same time they would interact in a sensory consonant manner. Creating sensory dissonant chords is no challenge but to create a chord based on two or more sounds with an inharmonic overtone spectrum that is not perceived as sensory dissonant is. It is here Sethares’ dissonance curve was a helpful tool to explore further the correlation between inharmonic spectra and sensory consonance. Sethares suggests in his research related to tuning and scales that one must do the following to get the most accurate results from the dissonance curve: [15]
1. Choose a sound; 2. Find the spectrum of the sound; 3. Simplify the spectrum; 4. Draw the dissonance curve and choose a set of
intervals (a scale) from the minima; 5. Create an instrument that can play the sound at the
appropriate scale steps; 6. Play music.
Elements A to D were the starting point for
Shards. The piece then further explores how to develop music using Sethares’ dissonance curve as part of the first stage of the compositional process and then at a more structural level using transposition and interpolations of the dissonance curves analysed.
4. SETHARES ‘PATCHES’
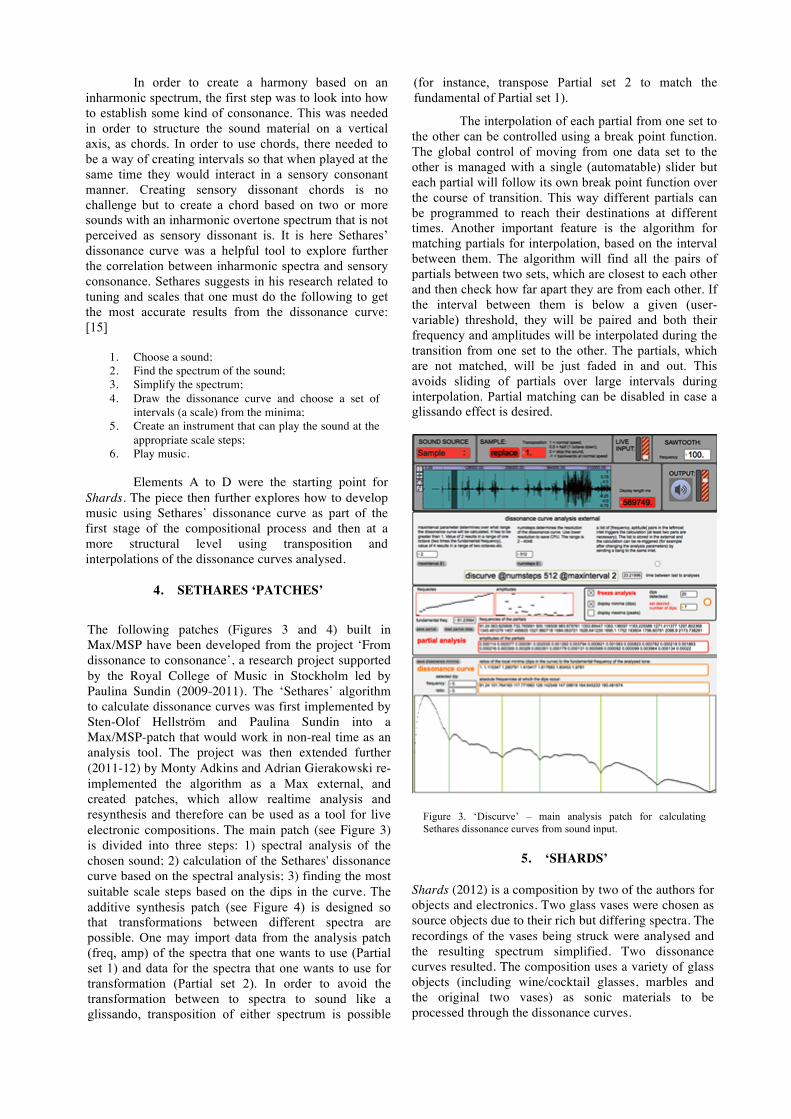
The following patches (Figures 3 and 4) built in Max/MSP have been developed from the project ‘From dissonance to consonance’, a research project supported by the Royal College of Music in Stockholm led by Paulina Sundin (2009-2011). The ‘Sethares’ algorithm to calculate dissonance curves was first implemented by Sten-Olof Hellström and Paulina Sundin into a Max/MSP-patch that would work in non-real time as an analysis tool. The project was then extended further (2011-12) by Monty Adkins and Adrian Gierakowski re-implemented the algorithm as a Max external, and created patches, which allow realtime analysis and resynthesis and therefore can be used as a tool for live electronic compositions. The main patch (see Figure 3) is divided into three steps: 1) spectral analysis of the chosen sound; 2) calculation of the Sethares' dissonance curve based on the spectral analysis; 3) finding the most suitable scale steps based on the dips in the curve. The additive synthesis patch (see Figure 4) is designed so that transformations between different spectra are possible. One may import data from the analysis patch (freq, amp) of the spectra that one wants to use (Partial set 1) and data for the spectra that one wants to use for transformation (Partial set 2). In order to avoid the transformation between to spectra to sound like a glissando, transposition of either spectrum is possible
(for instance, transpose Partial set 2 to match the fundamental of Partial set 1).
The interpolation of each partial from one set to the other can be controlled using a break point function. The global control of moving from one data set to the other is managed with a single (automatable) slider but each partial will follow its own break point function over the course of transition. This way different partials can be programmed to reach their destinations at different times. Another important feature is the algorithm for matching partials for interpolation, based on the interval between them. The algorithm will find all the pairs of partials between two sets, which are closest to each other and then check how far apart they are from each other. If the interval between them is below a given (user-variable) threshold, they will be paired and both their frequency and amplitudes will be interpolated during the transition from one set to the other. The partials, which are not matched, will be just faded in and out. This avoids sliding of partials over large intervals during interpolation. Partial matching can be disabled in case a glissando effect is desired.
Figure 3. ‘Discurve’ – main analysis patch for calculating Sethares dissonance curves from sound input.
5. ‘SHARDS’
Shards (2012) is a composition by two of the authors for objects and electronics. Two glass vases were chosen as source objects due to their rich but differing spectra. The recordings of the vases being struck were analysed and the resulting spectrum simplified. Two dissonance curves resulted. The composition uses a variety of glass objects (including wine/cocktail glasses, marbles and the original two vases) as sonic materials to be processed through the dissonance curves.
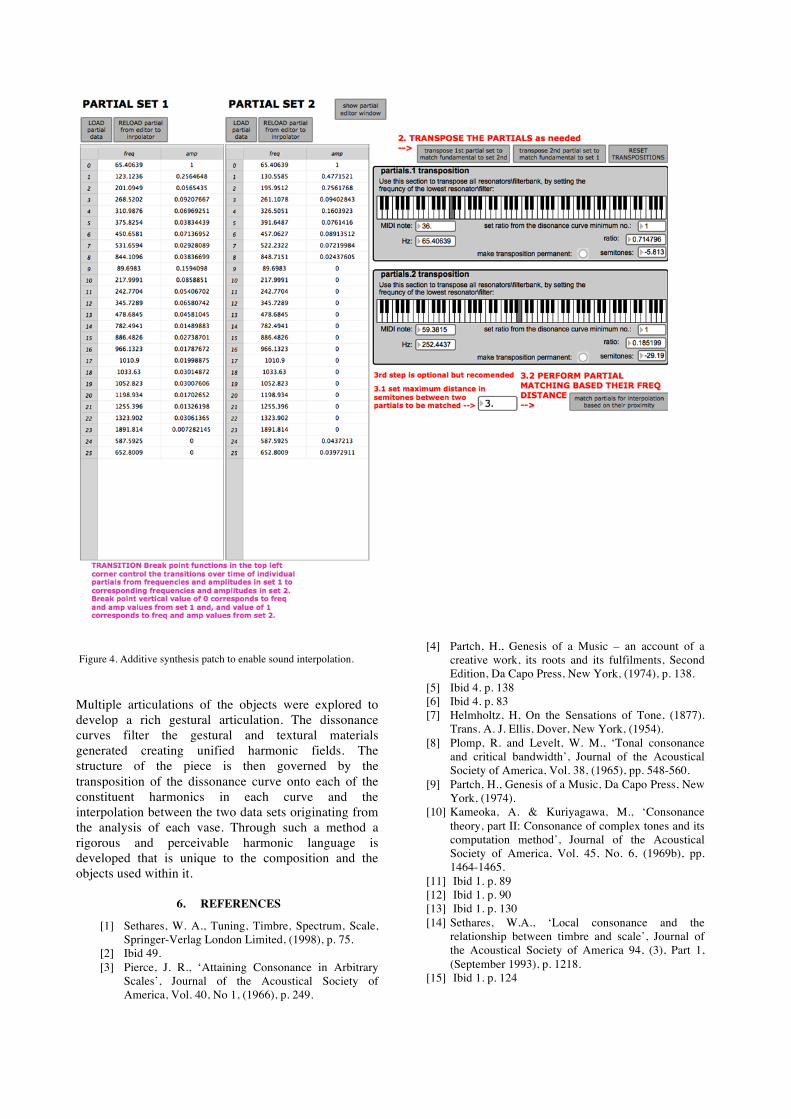
Figure 4. Additive synthesis patch to enable sound interpolation.
Multiple articulations of the objects were explored to develop a rich gestural articulation. The dissonance curves filter the gestural and textural materials generated creating unified harmonic fields. The structure of the piece is then governed by the transposition of the dissonance curve onto each of the constituent harmonics in each curve and the interpolation between the two data sets originating from the analysis of each vase. Through such a method a rigorous and perceivable harmonic language is developed that is unique to the composition and the objects used within it.
6. REFERENCES
[1] Sethares, W. A., Tuning, Timbre, Spectrum, Scale, Springer-Verlag London Limited, (1998), p. 75.
[2] Ibid 49. [3] Pierce, J. R., ‘Attaining Consonance in Arbitrary
Scales’, Journal of the Acoustical Society of America, Vol. 40, No 1, (1966), p. 249.
[4] Partch, H., Genesis of a Music – an account of a creative work, its roots and its fulfilments, Second Edition, Da Capo Press, New York, (1974), p. 138.
[5] Ibid 4. p. 138 [6] Ibid 4. p. 83 [7] Helmholtz, H, On the Sensations of Tone, (1877).
Trans. A. J. Ellis, Dover, New York, (1954). [8] Plomp, R. and Levelt, W. M., ‘Tonal consonance
and critical bandwidth’, Journal of the Acoustical Society of America, Vol. 38, (1965), pp. 548-560.
[9] Partch, H., Genesis of a Music, Da Capo Press, New York, (1974).
[10] Kameoka, A. & Kuriyagawa, M., ‘Consonance theory, part II: Consonance of complex tones and its computation method’, Journal of the Acoustical Society of America, Vol. 45, No. 6, (1969b), pp. 1464-1465.
[11] Ibid 1. p. 89 [12] Ibid 1. p. 90 [13] Ibid 1. p. 130 [14] Sethares, W.A., ‘Local consonance and the
relationship between timbre and scale’, Journal of the Acoustical Society of America 94, (3), Part 1, (September 1993), p. 1218.
[15] Ibid 1. p. 124