bi-monthly † july - august † 2012 issn: 0976-2108 barc
TRANSCRIPT

ISSN: 0976-2108Bi-monthly • July - August • 2012
BARCN E W S L E T T E R
IN THIS ISSUE
•
• Improved Locationof Earthquakes in Sumatra Regionusing Gauribidanur Seismic Array Data
• DNA Repair and Recombination Proteins (Dmc1 and Rad51)from Rice
• Recovery of Cesium from High Level Liquid Nuclear Waste byan Advanced Polymer Composite
• Performance Study of Indigenously Developed CsI-PhotodiodeLinear Array Detectors for X-Ray Baggage ScanningApplication
• Marx Generator and Reflex Triode based High Power Pulsed
Bioremediation: Discovery of a Novel Alkaline Phosphatasethrough X-ray Crystallography
( )Oryza Sativa
BHABHA ATOMIC RESEARCH CENTRE
Detector
Lead Box

B A R C N E W S L E T T E R
II I ISSUE NO. 327 I JULY - AUGUST 2012
In the Forthcoming Issue
1. Genetic Analysis of Type2 Diabetes
Suresh KG Shettigar et al.
2. Advanced Research on Master Curve for Integrity
Assessment of Reactor Pressure Vessel
J. Chattopadhyay et al.
3. Design, Development and Deployment of Special Sealing
Plug for 540 MWe PHWRs
G. Sharma et al.
4. Decontamination of Alpha Contaminated Metallic
Waste by Cerium IV Redox Process
J.G. Shah
5. Non-invasive Blood Pressure Monitor; Beat to Beat
Vineet Sinha et al.
6. Self Assembled Systems: Design and Drug Delivery
Perspectives
Gunjan Verma et al.
B A R C N E W S L E T T E R
ISSUE NO. 327 I JULY - AUGUST 2012 I I
CONTENTS
Editorial Note II
Brief Communication• Integrated Δ-E Silicon Detector Telescope III• Development of Continuous Rotary Dissolver IV• Design and Development of Metallic Face Seal for AHWR Fuelling Machine V• Meso-and B-substituted Pyrromethene Fluorophores as New Photo-stable Laser Dyes VI• Ultra High Precision Wave Length Scanning Mechanism VII• Evaluation of Tripodal / Calixarene Based Diglycolamides for Actinide Extraction VIII
Focus
• Discovery of Higgs Boson: The God Particle 1Ajit Kumar Mohanty
Research Articles
• Bioremediation: Discovery of a novel alkaline phosphatase through 6X-ray crystallographySubhash C. Bihani, Shree Kumar Apte, Jean-Luc Ferrer and Madhusoodan V. Hosur
• Improved Location of Earthquakes in Sumatra Region 15using Gauribidanur Seismic Array DataManoj Kumar and Falguni Roy
Technology Development Articles
• DNA Repair and Recombination Proteins (Dmc1 and Rad51) from Rice (Oryza sativa) 21Rajani Kant Chittela and Jayashree K. Sainis
• Recovery of Cesium from High Level Liquid Nuclear Waste by 26an Advanced Polymer CompositeLalit Varshney,V.Venugopal et al.
Feature Articles
• Performance Study of Indigenously Developed CsI-Photodiode Linear Array Detectors for 31
X-Ray Baggage Scanning Application
Anita Topkar, Arvind Singh, P.K.Mukhopadhyay, et al.
• Marx Generator and Reflex Triode based High Power Pulsed Microwave Source 37Archana Sharma, Amitava Roy, Sabyasachi Mitra, et al.
News and Events
• Technology Transfers from BARC 43
• BRNS-AEACI Third School on Analytical Chemistry (SAC-3): a Report 46
• Technology of Indigenous Digital Radiotherapy Simulator Transferred 48
• Graduation Day Function of the BARC Training School; a Report 49
• National Fire Service Week at BARC: a Report 50• Release of BARC Logo and Launching of an Enhanced Website for BARC: a Report 51
• Nuclear Energy and Development of Country (NEDC – 2012): a Report 52
BARC Scientists Honoured

B A R C N E W S L E T T E R
II I ISSUE NO. 327 I JULY - AUGUST 2012
Editorial Committee
Chairman
Dr. Tulsi Mukherjee,
Director, Chemistry Group
Vice Chairman
Dr. N. Ramamoorthy,
Senior Advisor to Director, BARC
Edited by
Dr. K. Bhanumurthy
Head, SIRD
Associate Editors for this issue
Dr. G. Rami Reddy, RSD
Dr. A. Vinod Kumar, EAD
Mr. Avaneesh Sharma, RED
Members
Dr. Tulsi Mukherjee
Dr. N. Ramamoorthy
Dr. D.N. Badodkar, DRHR
Dr. A.P. Tiwari, RCnD
Dr. Madangopal Krishnan, MSD
Dr. A.K. Tyagi, CD
Dr. P.V. Varde, RRSD
Dr. S.M. Yusuf, SSPD
Mr. Avaneesh Sharma, RED
Dr. C. Srinivas, PsDD
Dr. G. Rami Reddy, RSD
Dr. S.K. Mukherjee, FCD
Mr. G. Venugopala Rao, APPD
Dr. A. Vinod Kumar, EAD
Dr. Anand Ballal, MBD
Dr. K. Bhanumurthy, SIRD
Dr. S.C. Deokattey, SIRD
From the Editor’s Desk
Dr. K. BhanumurthyOn behalf of the Editorial Committee
This issue of the BARC Newsletter is special. For the first
time, the BARC Newsletter proudly carries the BARC logo
on the front cover. The BARC logo was officially released
on 10th August, 2012 by Shri Sekhar Basu, Director, BARC.
On the same day, he also launched the enhanced website
of BARC showcasing several new and attractive features.
We would like to thank all our Scientists and Engineers
for their response to the uploading of Award winning
articles for the Founder’s Day Special Issue of the BARC
Newsletter. This year we received a total of 64 papers
which will be released in the form of a CD on Founder’s
Day.
On 4th July 2012, the CMS and the ATLAS experimental
teams at CERN announced the discovery of the Higg’s
Boson, a landmark event in the field of Particle Physics.
We carry a special feature on this important event and
BARC’s contribution in this exciting area. Apart from this,
six articles on diverse areas of R&D in BARC are covered
in the issue.
We would like to inform you that the “Brief
Communications” Section, introduced this year, has
attracted the attention of several scientists and engineers.
In order to further strengthen the BARC Newsletter, it is
necessary that contributions come from various divisions
and it is our experience that feature articles written in
simplified format attract large readership.

B A R C N E W S L E T T E R BRIEF COMMUNICATION
ISSUE NO. 327 I JULY - AUGUST 2012 I III
Integrated ΔΔΔΔΔ-E Silicon Detector Telescope
(Electronics & Instrumentation Group)
Particle identification method using E–ΔE detector
telescope is extensively used in physics experiments.
For heavy ions and fission fragments, the ΔE detector
of the telescope needs to have a thickness of a
few microns which is difficult to attain using
conventional silicon machining process.
Conventional ΔE detectors are also very fragile, and
this puts serious limitation to their applications for
multi detector array system. To overcome these
limitations, a novel silicon detector telescope for
particle identification and measurement of their
energy has been developed. The thin ΔE and thick
E detectors are integrated on the same silicon chip.
ΔE is fabricated on the front side and E detector on
the back side of the wafer, with a common buried
contact. The detector is fabricated using a complex
process sequence involving double sided silicon
wafer processing (Fig. 1 & Fig. 2). These detectors
are rugged to handle and could be used in multi-
detector systems. Also, ΔE detectors with a thickness
of a few microns and larger area of 100mm2 or
more can be fabricated using this technology. Such
integrated E–ΔE detector telescopes are not
commercially available. The performance of this
detector has been investigated in collaboration
with NPD and demonstrated to be as good as
conventional telescope incorporating physically
separate ΔE and E imported silicon detectors.
Presently, detectors with ΔE thicknesses of 10 μm,
15 μm, and 25 μm, and E detector of thickness
300 μm have been developed. This integrated
detector telescope (Fig. 3) could also find interesting
applications in neutron spectrometry and medical
dosimetry with good n/g discrimination. The detector
design and technology can be adopted to fabricate
segmented detector telescopes which could also
identify the position of particles in addition to particle
identification and energy measurement.
Fig.1: Schematic cross section of the ΔE-E detector
Fig.2 : Front side ΔE and b) back side E detector
(a) (b)
Fig.3: A two dimensional spectrum obtained from
the integrated ΔE–E telescope. Different reaction
products are identified and labeled [1].
Ref:
[1] A. Topkar et al, “Development of integrated ΔE–
E silicon detector telescope using silicon planar
technology”, Nucl. Instr. and Meth, A 654 (2011)
330–335.

B A R C N E W S L E T T E RBRIEF COMMUNICATION
IV I ISSUE NO. 327 I JULY - AUGUST 2012
Development of Continuous Rotary Dissolver (CRD)
(Nuclear Recycle Group)
Development of continuous dissolution equipment
was initiated to meet the requirements of large
capacity reprocessing plants. In batch dissolution
process, which is presently employed in Indian
reprocessing plants, various steps such as charging
of chopped fuel, acid addition, dissolution, solution
cooling, product filtration cum transfer, hull rinsing
cum discharge, and repositioning of basket are
carried out sequentially. These sequential operations
limit the capacity of the system. In continuous mode
of dissolution, these steps are carried out
simultaneously and thereby, relatively higher
throughput can be achieved. The CRD being
developed is based on a bucket wheel assembly
with 12 perforated buckets under indexing motion
within a slab tank partially filled with nitric acid
(Figs. 1 and 2). The chopped fuel pieces are fed to
a bucket when it is in the loading position (position
1 in Fig. 1); the wheel is indexed every hour;
the fuel pellets dissolve in the acid bath while the
bucket is immersed in the acid bath (positions
1 - 4) and the hulls are discharged into the outlet
when bucket emerges out of acid and attains
unloading position (position 7). A plant scale CRD
which was fabricated and tested successfully is
undergoing experimental trials. A mathematical
model was developed for the dissolution of UO2
pellets. The model was subsequently used to identify
the best mode of operation of the CRD. Different
modes considered for the process simulation are:
cross current, co-current and counter current flows
of acid with respect to the pellet movement. The
model predictions show that counter current scheme
can process 67.5 kg/h of uranium metal equivalent
to a plant throughput of 400 tonnes per year. A
test loop is being set up for the performance
evaluation of the CRD.
Fig. 1 Conceptual scheme of CRD
Fig. 2 Plant scale CRD during installation

B A R C N E W S L E T T E R BRIEF COMMUNICATION
ISSUE NO. 327 I JULY - AUGUST 2012 I V
Design and Development of Metallic Face Seal for
AHWR Fuelling Machine
(Reactor Design & Development Group)
Advanced Heavy Water Reactor (AHWR) is a vertical
pressure tube type reactor. A shielded vertical Fuelling
Machine (FM) is employed for on/off power
refuelling. Coolant channel shall be frequently
approached by Fuelling Machine for refuelling
operation. A metallic face seal is required between
FM and End-Fitting butting faces to maintain leak
tightness during refuelling operation. It is an
important component as it acts as pressure boundary
and prevents the escape of water from the snout
cavity.
Efforts are made to develop the component
indigenously as an import substitute. Refuelling
Technology Division, BARC has developed and
qualified the seal for reactor use.
Metallic face seal is a critical component which has
been designed to meet the strength as well as
flexibility requirements. Basic design of seal was done
considering fatigue analysis based on strain cycling,
contact stress in the sealing face, self-energizing
philosophy and stress consideration. Inconel X-750
material has been chosen to satisfy the variety of
requirements like strength at high temperature,
good corrosion resistance, excellent spring back
characteristics etc.The seal is qualified as per ASME
Section III Div. 1 class NB code.
Considering the stringent requirements of seal
design, a prototype was manufactured to prove the
design. With the help of private firm, manufacturing
technology for metallic face seal was developed
indigenously. Surface finish of 0.1 micron at the
sealing face was achieved by lapping. Groove size
as indicated in the drawing was achieved with the
help of special diamond grinding wheel of thickness
0.4 mm.
The Metallic Face Seal was tested for the
performance in simulated conditions of reactor
temperature and pressure. Extensive test program
was carried out to qualify the component at high
pressure (85 bar) and high temperature (285°C)
condition. In order to measure minute leakage at
hot condition, a bubble monitoring system was
connected to the hydraulic circuit. No leakage was
observed throughout
the test. Performance
of the seal was found
to be satisfactory.
S/Shri G. Sharma, K.K.
Jha, K.K. Verma, P.
Halder and R.J. Patel
contributed in this
development work.
Metallic Face Seal in assembled condition
Stress Intensity plot of Metallic Face Seal Metallic Face Seal Test-setup
B A R C N E W S L E T T E RBRIEF COMMUNICATION
VI I ISSUE NO. 327 I JULY - AUGUST 2012
Meso-and B-Substituted Pyrromethene
Fluorophores as New Photo-stable Laser Dyes
(Chemistry Group)
Dye lasers are one of the most versatile laser sources
known today due to their significant contribution
to basic physics, chemistry, biology, laser
technology, isotope enrichment and other fields.
Compared to inorganic lasers the organic dye lasers
cover the entire visible and near IR region and have
far greater tunability. The pyrromethene (PM)
compounds have become the laser dyes of choice
to the laser scientists, due to their high fluorescence
yields, intense absorption profiles at the green
spectral region, low triplet-triplet extinction
coefficients over the entire fluorescence region, and
excellent lasing efficiency. But their use, particularly
in high-repetition-rate liquid dye lasers remains
limited owing to rapid photochemical degradation
under aerobic conditions. The degradation of the
PM dyes is primarily mediated by their in situ
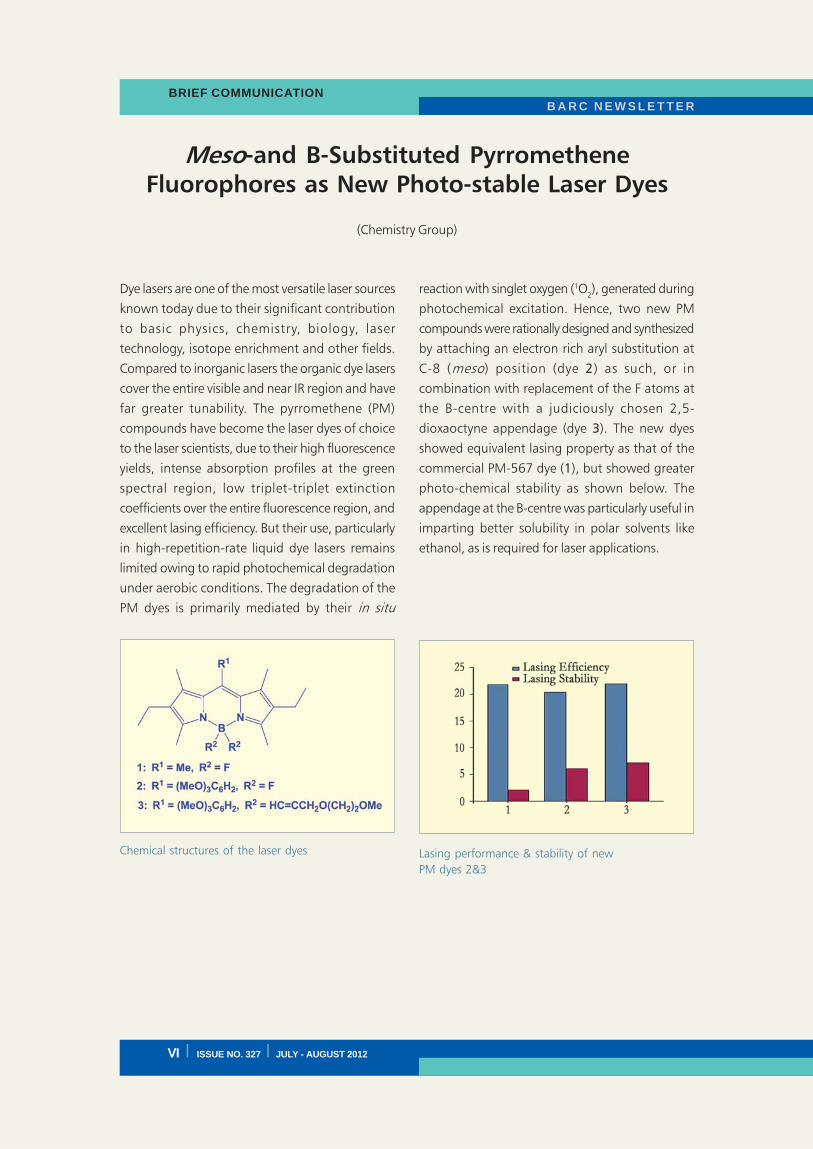
Chemical structures of the laser dyes Lasing performance & stability of new
PM dyes 2&3
reaction with singlet oxygen (1O2), generated during
photochemical excitation. Hence, two new PM
compounds were rationally designed and synthesized
by attaching an electron rich aryl substitution at
C-8 (meso) position (dye 2) as such, or in
combination with replacement of the F atoms at
the B-centre with a judiciously chosen 2,5-
dioxaoctyne appendage (dye 3). The new dyes
showed equivalent lasing property as that of the
commercial PM-567 dye (1), but showed greater
photo-chemical stability as shown below. The
appendage at the B-centre was particularly useful in
imparting better solubility in polar solvents like
ethanol, as is required for laser applications.

B A R C N E W S L E T T E R BRIEF COMMUNICATION
ISSUE NO. 327 I JULY - AUGUST 2012 I VII
Ultra High Precision Wave Length
Scanning Mechanism
(Design, Manufacturing and Automation Group)
BARC has developed a P.C. based “Ultra High
Precision Wavelength Scanning Mechanism” which
will be used for fine tuning the narrow bandwidth,
tunable SLM dye laser. Tuning range of wavelength
for the specified purpose is from 559.75556 nm to
559.74642 nm. Tuning in such a narrow bandwidth
requires rotational resolution in the range of 0.02
arc-second or better.
A standard rotary table available is driven by a worm
and worm gear and the absolute accuracy of the
angle is about 0.1 arc second. However in
synchrotron and laser beam instruments rotary stages
are required with a resolution of one hundredth of
a second or better.
In this design, required resolution has been achieved
by indirect drive. This rotary table has two stages of
drive (Fig. 1). In the first stage 50,000 micro-step
stepper motor is directly mounted, which gives 26
arc-second resolution. Second stage drive is a
indirect drive. In indirect drive rotary motion is
transferred to the rotary table by a set of higher and
lower pairs (Fig. 1) with respect to first stage. This
design has been adopted for design of ultra high
precision rotary mechanism. This high-resolution
rotary mechanism is used to rotate the optical
elements like grating, mirror, etc with a resolution
of 10-2 arc-second. The resolution can be increased
to 4 milliarcsecond by using piezotransducers
in the second stage
instead of cam
follower. The total
range of the
instrument is ±130.
Tuning range of the
instrument was
observed to be
556.4-568.5 nm.
The assembly is
very compact and is universally mountable. This
table consists of the following sub-assemblies :
1. First Stage (Coarse) Rotational Mechanism Sub-
assembly.
2. Fine Rotational
Mechanism Sub-
assembly.
3. Base Mount Sub-
assembly.
4. Optical Mount Sub-
assembly.
Mounting arrangement for optical elements were
also design and developed to match the accuracy
of rotary table (Fig.2). Here all mounting
arrangements are rigid with fine adjustment facility
(manually). Mounting arrangements are based on
flexural design with micro adjustment facility. Range
of angular adjustment is ±20 with a resolution of
10 arc sec. Each mount has two such types of unit
mounted in perpendicular direction for adjustments
in two directions.
Using this technique of rotational mechanism and
arrangement of tuning mirror, grating and end mirror
in a particular geometric fashion (Fig. 3), mode hop
free tuning over the wavelength range ~70 GHz
was achieved in a single hop mode dye laser.
Minimum frequency change for coarse and fine
tuning was 39 GHz and 3 MHz, respectively, which
was experimentally validated.
This mechanism can also be used as a goniometer
and for
metrological
requirements.
Fig. 1: Assembly with
optical mounts
Fig. 2: Arrangement of
tuning mirror grating,
etc.
Fig. 3: Schematic of SLM GIG dye laser

B A R C N E W S L E T T E RBRIEF COMMUNICATION
VIII I ISSUE NO. 327 I JULY - AUGUST 2012
Evaluation of Tripodal / Calixarene Based
Diglycolamides for Actinide Extraction
(Radiochemistry and Isotope Group)
Diglycolamides (DGA) have been found to be one
of the most efficient reagents for trivalent minor
actinide extraction from acidic feeds. They act as
tridentate ligands due to the presence of an
additional oxygen atom between the carbonyl
groups, and therefore display a very high affinity
toward actinides and lanthanides as compared to
other malonamides. In order to enhance their
extraction efficiency, several DGA grafted ligands
viz., tripodal diglycolamide (T-DGA, Fig. 1(a)) and
calix[4]arene DGA (calix-DGA, Fig. 1(c)) were
synthesized and evaluated for actinide extraction and
supported liquid membrane transport behaviour.
Extraction studies with T-DGA for actinide ions such
as UO2
2+, Np(IV), Pu(IV), and Am(III) and fission
product ions such as Cs+ and Sr2+ from acidic feed
solutions indicated exceptionally high D values with
Am(III) and Pu(IV) with about 30 times lower
concentration of T-DGA (as compared to TODGA
(Fig. 1(b)), a well known DGA based extractant being
proposed for ‘actinide partitioning’). Similar
observations were made for the calix-DGA
compounds appended with four DGA moieties
though the extraction efficiencies for the calix-DGAs
were even better than the T-DGA molecule. Typically,
for 1 mM extractant concentration and 3 M HNO3
as the feed acidity, the distribution ratios for Am(III)
were about <0.1, 40 and >300 for TODGA,
T-DGA and calix-DGA, respectively. The role of spacer
length and substituent effect in the calix-DGA were
also investigated and were found to be encouraging
for trivalent actinide extraction.
Room temperature ionic liquids containing
diglycolamide extractants have shown exceptionally
high distribution coefficients and the results indicate
possibility of selective recovery of Am from acidic
waste solutions. A solvent containing Calix-DGA in
room temperature ionic liquids gave exceptionally
high separation factor for Am(III) and U(VI). Task
specific ionic liquids containing DGA functional
groups (Fig. 1(d)) have also been evaluated for
actinide extraction under varying experimental
conditions and were found to be the most efficient
extractant for minor actinides from acidic feed
conditions, reported so far. The DAm
and DEu
values
were 2.2x10³ and 1.1x10⁴, respectively for 3 M
HNO3 as the feed with separation factor (D
Eu/D
Am)
values ~5. Stripping and significantly high radiation
stability make the DGA functionalized task specific
ionic liquids promising alternatives to solvent
containing molecular diluents.
Fig.1: Structures of DGA compounds: (a) T-DGA, (b) TODGA, (c) calix-DGA,
(d) Task specific ionic liquids with DGA functional groups

FOCUS
ISSUE NO. 327 I JULY - AUGUST 2012 I 1
B A R C N E W S L E T T E R
Discovery of Higgs Boson: The God Particle
The European Organization for Nuclear Research
(CERN) at Geneva, Switzerland came out with an
exciting announcement on 4th July 2012 that two
of its major experiments CMS (Compact Muon
Solenoid) and ATLAS (A Toroidal LHC Apparatus)
had found a new particle which behaves like Higgs
boson corresponding to a particle weighing about
125 Giga electron Volts (GeV) and about 133 times
heavier than the protons that lie at the heart of every
atom. The Higgs particle is the missing piece of the
standard model of physics which describes the basic
building blocks of the universe, such as protons,
electrons and atoms. The Higgs particle is named
after Peter Higgs, who was one of six researchers
who theorized about the existence of this particle in
1964. It is commonly called the “God Particle”, after
the title of the book written by Nobel prize winner
physicist Leon Lederman “The God Particle: If
the Universe Is the Answer, What Is the
Question?”. All elementary particles can be
classified either as fermions which follow Fermi-
Dirac statistics or bosons which follow Bose-Einstein
statistics depending on their intrinsic spin values.
The Higgs particle follows the Bose-Einstein statistics
and hence, is called a boson which remained elusive
for the last 48 years. Finding of the Higgs is vital to
the standard model, the theory that describes how
elementary particles got their mass and explains the
origin of the universe. People all over the world
have started congratulating the team of scientists
at the Large Hadron Collider (LHC) (which is about
100 meters underground) atom smashing machine
covering 27 kms in the Franco-Swiss border. It may
be recalled that when LHC machine was about to
be operational in 2008, a panic was created in public
mind due to the fear that this giant machine is so
powerful that it could create a black hole that would
eat up more and more Earth’s matter until we and
our planet are fully consumed. Contrary to this
expectation, nothing unusual has happened today
and every one is excited with the news that Higgs
like boson has been discovered. A confirmation
that this is the Higgs boson would be one of the
biggest scientific discoveries of the century. The hunt
for the Higgs has been compared by some physicists
to the Apollo programme that reached the
moon in 1969. In this article, we will briefly discuss
(a) What is this God particle-the Higgs boson
(b) Why is it important (c) Have we really discovered
it and (d) What is the contribution of India in general
and BARC in particular to this epoch making Higgs
search.
The God particle-the Higgs boson
The Higgs boson or the God particle is the last
particle of the standard model whose discovery is
yet to be confirmed. The standard model is the name
given in the 1970s to a theory of fundamental
particles and how they interact. As we know today,
the atom contains nucleus comprising of proton
God particle-the Higgs boson
Ajit Kumar Mohanty
Nuclear physics Division
(for BARC-CMS collaboration)

B A R C N E W S L E T T E RFOCUS
2 I ISSUE NO. 327 I JULY - AUGUST 2012
and neutron being surrounded by cloud of electrons.
The number of protons and electrons are equal so
that the atom as a whole is neutral. For example, a
helium atom is made up of a nucleus of two
protons, two neutrons (commonly known as alpha
particle) being surrounded by two electrons. We
also know that each proton carries one unit of
positive charge, neutron is neutral while electron is
having one unit of negative charge. In 1964, Murray
Gell-Mann and George Zweig proposed that
nucleons (proton and neutron) are not fundamental
as they are made up of sub-structure called quarks
which was finally supported by experimental
evidence in 1969. The so called standard model
emerged incorporating all that was known about
subatomic particles at the time and predicted the
existence of additional particles as well. There are
seventeen named particles in the standard model.
It can be divided into three groups: quarks, leptons
and force carriers. There are six types of quarks
known as up(u), down(d), charm(c), strange(s),
top(t) and bottom(b). The up and down quarks are
the lighter ones (having mass about few MeV) and
the top quark is the heaviest one (mass about
175 GeV) as heavy as a gold atom. The protons
and neutrons consist of only up and down quarks.
The proton contains two up quarks and one down
quark (uud). Each up quark carries a fractional
electric charge of 2/3 while a down quark carries
an electric charge of -1/3. Similarly, the neutron
consists of two down quarks and one up quark (ddu).
There are three types of leptons known as electron,
muon , tau and their corresponding neutrinos. The
quarks and leptons, which in turn are divided into
three generations, are members of a family of
particles called fermions (particles with half integer
spins). Both the quarks and leptons come in pairs.
For example, quarks are grouped up-down, charm-
strange, and top-bottom. The leptons also come in
pairs. The electron, muon and tau particles each
have an associated nearly zero mass, charge-less
neutrino. The electron is a stable particle and is
present in almost all matter. The muon and tau
particles are unstable and are found primarily in
decay processes. The intermediate vector bosons or
force carriers, make up the third group of the
standard model. They transmit three of the four
fundamental forces through which matter interacts.
The gluon (g) is responsible for the most powerful
force, the strong force, which binds quarks together
inside protons and neutrons. The photon is the
electromagnetic force carrier that governs electron
orbits and chemical processes. Lastly, the W and Z
bosons are attributed to the weak force, playing a
role in radioactive decay. The weak force is very
important in observing neutrino reactions. As we
know, electron was discovered by J. J. Thompson
in 1897. The last particles of the standard model
discovered were the W and Z bosons in 1983, the
top quark in 1995, the tau neutrino in 2000. Higgs
boson is the only missing particle of the standard
model until today. The recent reported discovery in
2012 is consistent with this Higgs boson.
Why is it important
The Higgs boson is a fundamental particle of the
standard model and is one of the building blocks of
the universe. There are other fundamental particles,
but this one is special in the sense when the
fundamental particles which make up matter
interact with the Higgs boson (more specifically with
Higgs filed), they acquire mass. Higgs also acquires
mass interacting with itself. Without this interaction,
these particles would have no mass, and would travel
at the speed of light, as does the photon. The
universe would have been different without mass.
For example, if the electron had no mass, there
would be no atoms. Hence there would be no
ordinary matter as we know it, no chemistry, no
biology and no people. The Higgs field fills the
universe like water fills a pool. As particles move
through the universe they acquire mass by interacting
with the Higgs field. One way to imagine the Higgs
field is to imagine trying to walk through a pool.
The water pushes against you making you feel
heavier, and making it harder for you to move. This

FOCUS
ISSUE NO. 327 I JULY - AUGUST 2012 I 3
B A R C N E W S L E T T E R
effectively generates inertia or mass. Of course, one
can climb out of the pool and walk normally. But
particles can never escape the Higgs field since it is
everywhere, including the vacuum of space. While
the above is a simple analogy, the actual Higgs
mechanism corresponds to a physical process known
as spontaneous symmetry breaking. Let us take an
example as to what happens when a magnet is heated
above the critical temperature Tc. At high enough
temperature, the magnetic property is lost as atomic
spins are randomly oriented having zero average
magnetization. However, when temperature is
lowered below Tc, magnetization is restored as all
the atomic spins are aligned in a particular direction
having non-zero average magnetization. At high
temperature, the average magnetization <φ> = 0
and the system is in a symmetric phase where as at
low temperature, <φ> = 0 and symmetry is broken.
Similar arguments can be extended to Higgs field as
well. All particles had no mass just after the
Big-Bang when the universe was created. The average
Higgs field or more precisely the vacuum expectation
value (vev) of the effective Higgs field was zero.
As the universe cooled and the temperature fell
below a critical value (about 100 GeV), the vev of
Higgs field became non zero. Thus, an invisible force
field was formed together with associated Higgs
bosons. This is what is called spontaneous symmetry
breaking which generates mass for Higgs itself and
also generates three massive gauge bosons W+, W-
and Z. The fermions like quarks and electrons
acquired mass through Yukawa coupling with the
vev of the Higgs field. While the W and Z bosons
were detected long back experimentally, the
associated Higgs boson has escaped detection for
the last many years.
Have we really discovered it
On 4th July, 2012 in a joint seminar at CERN, both
CMS and ATLAS presented their latest results on
the search for the standard model Higgs boson.
Both experiments observe a new particle in the mass
region around 125-126 GeV. This new particle could
be the elusive Higgs boson, which has been
searched for by high energy physicists all over the
world for several years.
Due to very short life time (about 10-25 sec), Higgs
boson, once produced prefers to transform or decay
into the heaviest particles it can. The five important
decay channels being investigated by CMS and
ATLAS experiments are (i) γγ channel (gamma-
gamma), (ii) ZZ (Z-boson which finally decays to
four leptons), (iii) WW (W boson finally decaying
to two leptons and two neutrinos), (iv) bb (bottom
and anti-bottom quarks) and (v) ττ (tau and anti-
tau leptons). Finally, what is being estimated by
experiments is the invariant mass M of the decaying
particle H which is defined as M2 =E2 – p2 where E
and p are the energy and momentum of the particle
H (in unit of velocity of light). Since H decays
immediately in to daughter products, in reality,
invariant mass of the H particle is estimated from
the relation (E1+E
2)2- (p
1+p
2)2 where E
i and p
i are
the energies and momentum of the decay products.
The CMS team claimed that they had seen a “bump”
in their data corresponding to a particle weighing
in about 125 GeV. The evidence is strongest in the
two-photon final state (gamma-gamma channel) as
well as in the final state with two pairs of charged
leptons (electrons or muons through ZZ decay). It
is interpreted that this could be due to the
production of a previously unobserved particle with
a mass of around 125 GeV. Within the statistical
and systematic uncertainties, results obtained in the
various search channels are consistent with the
expectations for the standard model Higgs boson.
Similar result has also been reported by ATLAS, the
other LHC experiment looking for Higgs. Both Higgs
decay channels (two photons or four leptons) show
statistically significant excess at about the same
place. ATLAS reports the mass of the new particle
to be 126.0 GeV.
However, more data is needed to establish whether
this new particle has all the properties of the standard
model Higgs boson or whether some do not match,
implying new physics beyond the standard model.

B A R C N E W S L E T T E RFOCUS
4 I ISSUE NO. 327 I JULY - AUGUST 2012
The preliminary results presented will be refined with
new LHC data taken this year. These are exciting
times for the particle physicist community and the
desire to validate the standard model with discovery
of Higgs particle is becoming a reality.
Indian contribution: BARC in particular
In this context, it is important to bring out the
significant contributions of Indian institutes to the
LHC program. We refer to a series of articles
published in Physics News Vol 28, October,
2008 describing in detail the Indian contributions
to the LHC programs which we mention briefly in
the following sections. Indian institutions took part
in two major collaborations at the LHC, CMS and
ALICE (A Large Ion Collider Experiment). ALICE is a
dedicated experiment to study quark gluon plasma
(QGP) that mimics the early universe while CMS is
an experiment looking for the Higgs boson as well
as QGP formation in heavy ion collision. The CMS
experiment consists of groups from BARC (Mumbai),
Delhi University (Delhi), IIT (Mumbai), Panjab
University (Chandigarh), SINP (Kolkata), TIFR
(Mumbai), Viswabharati University (Santiniketan).
The ALICE experiment has participation from Aligarh
Muslim University (Aligarh), IIT (Mumbai), IOP
(Bhubaneswar), Jammu University (Jammu), Panjab
University (Chandigarh), Rajasthan University
(Jaipur), SINP (Kolkata), VECC (Kolkata). Although
the Higgs search using proton beam is one of the
primary motivation of CMS experiment, it also
records the data when two heavy Lead ions (Pb)
collide at relativistic energies. This process creates a
soup of quark gluon plasma which mimics the
formation of early universe that would have existed
a few micro seconds after the big-bang. The BARC
group is strongly involved in the study of QGP using
CMS detector. Apart from physics interest, Indian
groups have contributed significantly in developing
software for detector simulations and physics analysis
and also have participated in making two major
detector components: the outer hadron calorimeter
and a part of the preshower detector for the forward
electromagnetic calorimeter. The silicon sensors
made for the preshower detector are the first of its
kind ever developed in India with active participation
by BARC and then given to Indian industries (BEL)
for large scale production.
Silicon strip detectors for the Preshower
Detector of CMS
BARC supplied about 1500 large area 32-strip silicon
strip detectors for the preshower detector of CMS.
These detectors are being used as preshower sensors
in the electromagnetic calorimeter of CMS for πo/γrejection and cover an area of ~40,000 cm2 in the
CMS. A specific research and development
programme was undertaken by BARC to develop
the indigenous technology for these 32-strip silicon
detectors. The detectors were fabricated using
silicon planar technology which is similar to
integrated circuit (IC) technology. Since more than
thousand detectors were to be supplied to CERN,
the technology development was carried out using
the facility of silicon foundry – Bharat Electronics
Limited, Bengaluru. Developing silicon detectors with
very stringent electrical specifications and uniformity
over a large area of ~ 40 cm2 was a challenging
task. Such technology did not exist in our country.
In view of expected radiation damage, the
technology development was targeted to produce
detectors with high breakdown voltage and low
leakage currents for ensuring ten years of operation
without failure in the high neutron and gamma
radiation environment of LHC.
Resistive Plate Chambers (RPC)
BARC along with Panjab University Chandigarh have
also taken part in making Resistive Plate Chamber
(RPC), a new type of large area gas detectors which
are crucial to signal the passage of a muon though
the CMS detector. In the present phase, the
experiment runs with three layers of RPCs in the
end-caps on either side. It is proposed to install the
fourth endcap consisting of RPCs for the CMS muon
endcap system during the long shutdown in 2013-
2014 in order to improve muon trigger efficiency.
Nuclear Physics Division, BARC and Panjab

FOCUS
ISSUE NO. 327 I JULY - AUGUST 2012 I 5
B A R C N E W S L E T T E R
University, Chandigarh, jointly, have been mandated
to built, assemble and characterize 50 RPCs for the
upgrade along with Cu cooling systems for the entire
200 chambers being built in collaboration with CERN
and University of Ghent, Belgium. NPD has already
supplied, ten such chambers to CMS in 2008 and
remaining supply is expected to start soon after the
arrival of gas-gaps from KODEL, Korea by end of
October 2012.
Other Contributions
The RRCAT and BARC have contributed significantly
in grid computing and supplying various
components of the LHC accelerator. The items that
were mass manufactured and delivered included
precision motion positioning system (PMPS) jacks,
super-conducting corrector magnets, heater
discharge power supplies, local protection units
etc. In addition to hardware, DAE has also provided
expert manpower for several tasks. Team of DAE
specialists worked at CERN for around five years
and performed complete tests and measurements
on full series of magnets. The positive experience
with regard to magnet evaluation work, prompted
CERN to seek and receive Indian help for
commissioning some LHC subsystems. These
included cryogenic systems as well as a variety of
electronic hardware. As a result of significant Indian
contributions to various LHC programs, India is
given the observer status at CERN.
Conclusion
The interested reader will find more about the
observation of a new boson at a mass of 125 GeV
with CMS experiment at LHC in a recent publication
in Physics Letters B, 717 (2012) 30-61. This is a
multi authored land mark publication having 12
authors from BARC. Quoting the conclusion from
this paper- An excess of events is observed above
the expected background with a local
significance of 5 sigma at a mass near 125 GeV,
signaling the production of a new particle
which is consistent within uncertainties with
expectations for the standard model Higgs
boson . The collection of further data will
enable a more rigorous test of this conclusion
and an investigation of whether the properties
of new particle imply physics beyond the
standard model. Similar conclusion has also been
drawn by the ATLAS collaboration.
Acknowledgements
We acknowledge the contributions of colleagues
from BARC who have been associated with
BARC-CMS program at various stages: (listed
alphabetically), Chatterjee A, Choudhury R K,
Dutta D, Ghodgaonkar M, Jha V, Kailas S, Kumar
Vineet, Mishra D, Netrakanti P, Pant L M , Shukla P,
Topkar A. We also pay special tribute to late
Dr. S. K. Kataria who was the first person to initiate
the BARC-CMS collaboration with CERN.

B A R C N E W S L E T T E RRESEARCH ARTICLE
6 I ISSUE NO. 327 I JULY - AUGUST 2012
B A R C N E W S L E T T E RRESEARCH ARTICLE
6 I ISSUE NO. 327 I JULY - AUGUST 2012
Bioremediation: Discovery of a Novel Alkaline
Phosphatase through X-Ray Crystallography
Subhash C. Bihani, Shree Kumar Apte, Jean-Luc Ferrer and Madhusoodan V. Hosur*
Solid State Physics Division and Molecular Biology Division
Abstract
Alkaline phosphatase (AP) is a bi-metalloenzyme with potential applications in biotechnology and bioremediation.
The enzyme hydrolyses nonspecifically phosphate monoesters under alkaline conditions to yield inorganic
phosphate. The AP isolated from the bacterium Sphingomonas sp. Strain BSAR-1 (SPAP) was shown to be
particularly useful for the recovery of uranium from alkaline radioactive waste. We report here the first X-ray
crystal structure of SPAP determined by using the Multi-wavelength Anomalous Diffraction method to solve the
phase problem. The crystal structure shows that the enzyme active site is similar to those in other APs with two
Zn2+ ions in the core, even when there is a large difference in the rest of the tertiary structure. Structural
differences observed are: 1) threonine as the catalytic residue instead of serine, 2) absence of third metal ion
binding pocket, 3) deletion of the arginine residue forming bidentate hydrogen bonding with the substrate
phosphoryl group, and 4) recruitment into the active site of lysine171 and aspargine110 residues to bind the
substrate phosphoryl group in a manner not observed before in any other AP. These structural differences
suggest that SPAP represents a new class of APs and also provides important insights into evolutionary
relationships between members of AP superfamily. Because of its direct contact with the substrate phosphoryl
group, lysine171 is proposed to play a significant role in catalysis.
Introduction
(a) Bioremediation
Nuclear materials are being used for a variety of
purposes ranging from electrical power generation,
to nuclear weapons development to disease
diagnosis and treatment. Various steps in the nuclear
fuel cycle generate, as intermediates, large amounts
of radioactive materials [1]. Environmental
contamination due to release of radionuclides during
storage is a major worry for the nuclear industry.
According to U.S. Environmental Protection Agency
(EPA), over 1,000 United States locations are
contaminated with highly energetic radionuclides
including 235U [2]. Currently available chemical
methods for cleanup are costly and often lack the
specificity required to properly decontaminate.
Bioremediation of heavy metal contamination using
radiation-resistant microbes provides an effective and
more economical alternative. Microbial precipitation
of uranium in the form of uranyl phosphate also
allows recovery of precious metal from very low
concentrations [3]. Recently, Kayzad et al. [4] have
cloned into Escherichia coli, the alkaline phosphatase
from Sphingomonas sp. strain BSAR-1, labeled here
as SPAP, and the recombinant E. coli strain over-
expressing SPAP was found to be very efficient in
bioprecipitation of uranium as uranyl phosphate.
SPAP exhibits several unique features, such as
constitutive expression, thermo-lability, extracellular
release and high specific activity [5], which make
SPAP an ideal reagent also for many biotechnological
applications. Atomic-level structure in three
dimensions, that can be determined using
crystallography, would provide critical input for
further improving the utility of SPAP in
bioremediation and biotechnology [6].
(b) The Crystallographic method
The basic principle of the crystallographic method
is the Fourier relationship between scattering density
distribution ρ (xyz) and its diffraction pattern F(hkl).
When the sample is in the form of a single crystal
of the molecule under study, the Fourier transform
is sampled at discrete points determined by the unit
cell parameters. Then the Fourier relationship can
be written as a series summation given below:*Corresponding author
B A R C N E W S L E T T E R RESEARCH ARTICLE
ISSUE NO. 327 I JULY - AUGUST 2012 I 7
B A R C N E W S L E T T E R RESEARCH ARTICLE
ISSUE NO. 327 I JULY - AUGUST 2012 I 7
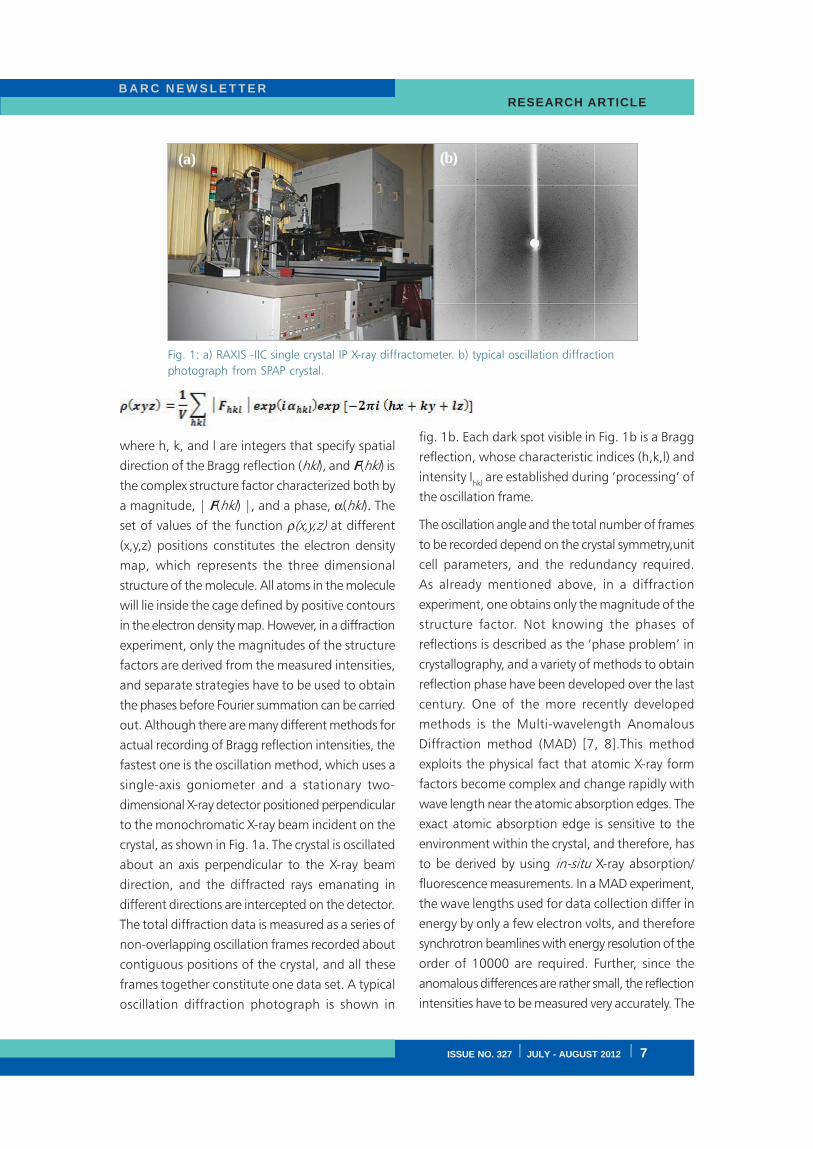
Fig. 1: a) RAXIS -IIC single crystal IP X-ray diffractometer. b) typical oscillation diffraction
photograph from SPAP crystal.
The oscillation angle and the total number of frames
to be recorded depend on the crystal symmetry,unit
cell parameters, and the redundancy required.
As already mentioned above, in a diffraction
experiment, one obtains only the magnitude of the
structure factor. Not knowing the phases of
reflections is described as the ‘phase problem’ in
crystallography, and a variety of methods to obtain
reflection phase have been developed over the last
century. One of the more recently developed
methods is the Multi-wavelength Anomalous
Diffraction method (MAD) [7, 8].This method
exploits the physical fact that atomic X-ray form
factors become complex and change rapidly with
wave length near the atomic absorption edges. The
exact atomic absorption edge is sensitive to the
environment within the crystal, and therefore, has
to be derived by using in-situ X-ray absorption/
fluorescence measurements. In a MAD experiment,
the wave lengths used for data collection differ in
energy by only a few electron volts, and therefore
synchrotron beamlines with energy resolution of the
order of 10000 are required. Further, since the
anomalous differences are rather small, the reflection
intensities have to be measured very accurately. The
(a) (b)
fig. 1b. Each dark spot visible in Fig. 1b is a Bragg
reflection, whose characteristic indices (h,k,l) and
intensity Ihkl
are established during ‘processing’ of
the oscillation frame.
where h, k, and l are integers that specify spatial
direction of the Bragg reflection (hkl), and F(hkl) is
the complex structure factor characterized both by
a magnitude, | F(hkl) |, and a phase, α(hkl). The
set of values of the function ρ(x,y,z) at different
(x,y,z) positions constitutes the electron density
map, which represents the three dimensional
structure of the molecule. All atoms in the molecule
will lie inside the cage defined by positive contours
in the electron density map. However, in a diffraction
experiment, only the magnitudes of the structure
factors are derived from the measured intensities,
and separate strategies have to be used to obtain
the phases before Fourier summation can be carried
out. Although there are many different methods for
actual recording of Bragg reflection intensities, the
fastest one is the oscillation method, which uses a
single-axis goniometer and a stationary two-
dimensional X-ray detector positioned perpendicular
to the monochromatic X-ray beam incident on the
crystal, as shown in Fig. 1a. The crystal is oscillated
about an axis perpendicular to the X-ray beam
direction, and the diffracted rays emanating in
different directions are intercepted on the detector.
The total diffraction data is measured as a series of
non-overlapping oscillation frames recorded about
contiguous positions of the crystal, and all these
frames together constitute one data set. A typical
oscillation diffraction photograph is shown in

B A R C N E W S L E T T E RRESEARCH ARTICLE
8 I ISSUE NO. 327 I JULY - AUGUST 2012
B A R C N E W S L E T T E RRESEARCH ARTICLE
8 I ISSUE NO. 327 I JULY - AUGUST 2012
Experimental
Overexpression, Purification and
Crystallization of SPAP protein
Gene for SPAP protein was cloned and protein was
over-expressed in E.coli as described [4].
Crystallization was performed at 298 K by sitting-
drop vapor diffusion method in 96-well
crystallization plates (Greiner, 3cup) using
Cy-Bio HTPC robot [5, 6]. Both native as well as
Seleno-MET(SM-SPAP) crystallized under several
conditions. Crystallization condition for SM-SPAP
was optimized manually by hanging-drop vapor
diffusion method [6].
X-ray Diffraction Data collection & Structure
Determination
X-ray diffraction data for both native and SM-SPAP
crystals were collected at 100 K by using the
oscillation method and the FIP beamline on the
European Synchrotron Radiation Facility (ESRF). A
fluorescence scan on SM-SPAP crystals enabled
Fig.2: Single crystals of SPAP grown by vapour
diffusion. The largest dimension of the biggest
crystal is about 0.1 mm. The crystals are well ordered
and diffract X-rays to high resolution. Crystals of
SM-SPAP also were similar in shape and size. Both
SPAP and SM-SPAP crystals belong to the space
group P412
12.
Fig. 3: Anomalous scattering factors for selenium
atoms in the crystal derived from the X-ray
flourescence spectrum recorded on the crystals.
Energies corresponding to anomalous peak and
inflection points are listed.
Fig. 4: The V=0.5 Harker section of anomalous
difference Patterson map showing good quality of
the measured anomalous signal. The maps are
contoured at intervals of 0.5 σ, starting from 1.0 σ.
Interpretation of the four Harker sections of the
space group yielded 12 Selenium sites.
phases derived using MAD method are generally
superior compared to other methods, and lead to
cleaner and easily interpretable electron density
maps. The structure of SPAP is one of the first
structures to be determined in India using the MAD
method.
(c) Alkaline phosphatase
Alkaline phosphatases (APs) are enzymes that
hydrolyze phosphate monoesters under alkaline
conditions to yield an alcohol and inorganic
phosphate. APs are metallo-enzymes, and crystal
structures show that their active sites contain the
bi-metallo-zinc core and a Mg2+ ion, which are
involved in a two stage catalytic mechanism [9,
10]. Multiple sequence alignment shows that there
is very little similarity in the amino acid sequences
of SPAP and other APs. Interestingly, SPAP has
highest sequence similarity with nucleotide pyro-
phosphatases (NPP), but does not have pyro-
phosphatase activity. The three dimensional structure
shows that SPAP is a unique alkaline phosphatase
representing a new class.

B A R C N E W S L E T T E R RESEARCH ARTICLE
ISSUE NO. 327 I JULY - AUGUST 2012 I 9
B A R C N E W S L E T T E R RESEARCH ARTICLE
ISSUE NO. 327 I JULY - AUGUST 2012 I 9
identification of the three wavelengths for a MAD
data collection. At each wavelength, 180 diffraction
images, each for an oscillation angle of 1o and an
exposure time of 60 seconds, were recorded. For
native crystals 180 diffraction images at a single
wave length were recorded, again for an oscillation
angle of 1o and an exposure time of 60 seconds.
Experimental phase determination and initial
molecular model building were carried out using
the AutoSol and AutoBuild tools in the software
suite PHENIX [11]. The fit of the atomic model to
the experimental electron density was improved
manually by using software package Coot [12]. The
software phenix-refine was used to execute standard
protocols of simulated annealing (SA) and TLS
refinement [13]. The native structure was later solved
by using the protein part of SM-SPAP structure as a
search model in Molecular Replacement calculations
[11]. The procedures used for refinement of the
native structure were same as described above.
Results and Discussion
The tetragonal crystals of SPAP are shown in Figure
2. Crystals of SM-SPAP also have similar
morphology, and both belong to the space group
P412
12, and contain one SPAP monomer
(559 residues) per asymmetric unit. High resolution
diffraction data from both SPAP and SM-SPAP crystals
were collected using the FIP beamline on ESRF at
Grenoble, France. Crystal parameters and data
collection statistics are given in Table 1. The crystal
structure was solved by using the MAD method to
determine reflection phases. The wavelengths for
MAD data collection were determined by analysing
the X-ray fluorescence spectrum (Fig. 3, Table 1).
Fig. 4 is one of the four Harker sections of the
anomalous difference Patterson map showing good
quality of measured anomalous signal that led to
Se-atom substructure. Refinement statistics for the
anomalous scatterers are given in Table 1. Fig. 5
shows the experimentally obtained electron density
cage contoured at 1.5 σ level for a short segment of
the protein chain. It is clear that all atoms of the
atomic model are very well contained within the
electron density cage, highlighting the accuracy of
the derived structure. The accuracy of the structure
is also evident from the low crystallographic R-
factors (Table 2), which are a measure of the
agreement between observed and model-derived
intensities of Bragg reflections. The final contents
of the asymmetric unit are: 526 protein residues
(31–556) comprising of 4022 non-
hydrogen atoms, two zinc ions of partial
occupancy (0.75), 278 water molecules,
Fig. 5: A region of the electron density map overlaid with the
corresponding backbone and side chain atoms of a seven
residue segment in SPAP. Atoms are drawn as coloured spheres
(carbon –green, nitrogen – blue and oxygen – red), and
interatomic bonds are drawn as sticks. Note that the atomic
model is completely inside the electron density cage. The amino
acid sequence of this protein-segment is VAL-PRO-ILE-LEU-PHE-
TRP-ARG in three letter code. The entire map is of similar quality.
Fig. 6: Space filling model overlaid with
the cartoon showing β- strand (magenta)
and α- helical (cyan) regions of SPAP. The
active site residues in the middle of the
figure are coloured brick red.
B A R C N E W S L E T T E RRESEARCH ARTICLE
10 I ISSUE NO. 327 I JULY - AUGUST 2012
B A R C N E W S L E T T E RRESEARCH ARTICLE
10 I ISSUE NO. 327 I JULY - AUGUST 2012
5 glycerol molecules, 1 Ca2+ ion and one molecule
of an organic phosphate in the active site. The
protein model has good stereochemistry with 98%
residues lying in the most favoured region of
Ramachandran map.
Molecular Conformation
The overall shape of the polymeric protein chain is
shown by a space filling diagram in which each
atom is drawn as a sphere of radius proportional to
the van der Waal radius of the atom (Fig. 6).
Segments of the protein backbone fold into α-helices
and β-strands, which are shown in fig. 6 as a
cartoon overlaid on the space filling diagram. These
secondary structure elements then associate to give
the protein a specific three dimensional shape. The
shape can be described as that of a shallow cup
with a thick base. The protein has two domains,
one large N- terminal domain forming the base and
most of the wall region of the cup, and a smaller
C-terminal domain (right extreme portion in Fig. 6)
forming the handle. N-terminal domain consists ofan eight-stranded mixed central beta sheet (shown
in magenta) surrounded by α-helices (shown in
cyan) while the smaller C-terminal domain primarily
consists of a single two-stranded antiparallel beta
hairpin covered by two α-helices on the surface.
The physical size of the protein molecule can be
estimated by noting that the alpha helix has a pitch
of 5.4 Å. The active site (shown in brick red), located
at the bottom of the wide and shallow opening of
the cup is exposed to the environment.
Active Site
Active site of SPAP is geometrically identical to that
in ECAP, and contains two metal ions (M1 and M2),
which were identified as Zn2+ through X-ray
fluorescence measurements. Distance between the
two metal ions is 4.1 Å. M1 coordinates directly to
the hydroxyl group of Thr89, confirming Thr89 to
be the catalytic residue in SPAP, as suggested by
sequence alignment. The other amino acid residues
coordinated by the zinc ions are identical to those
in ECAP.
Polar Lysine residue replacing the third metal
The third metal ion, mostly Mg2+, invoked in the
catalytic mechanism is bound at a site shown to be
conserved in crystal structures of ECAP-like APs.
However, in SPAP, there is no such third metal ion
coordination site because, structural superposition
shows that non-polar amino acids Ala174 and
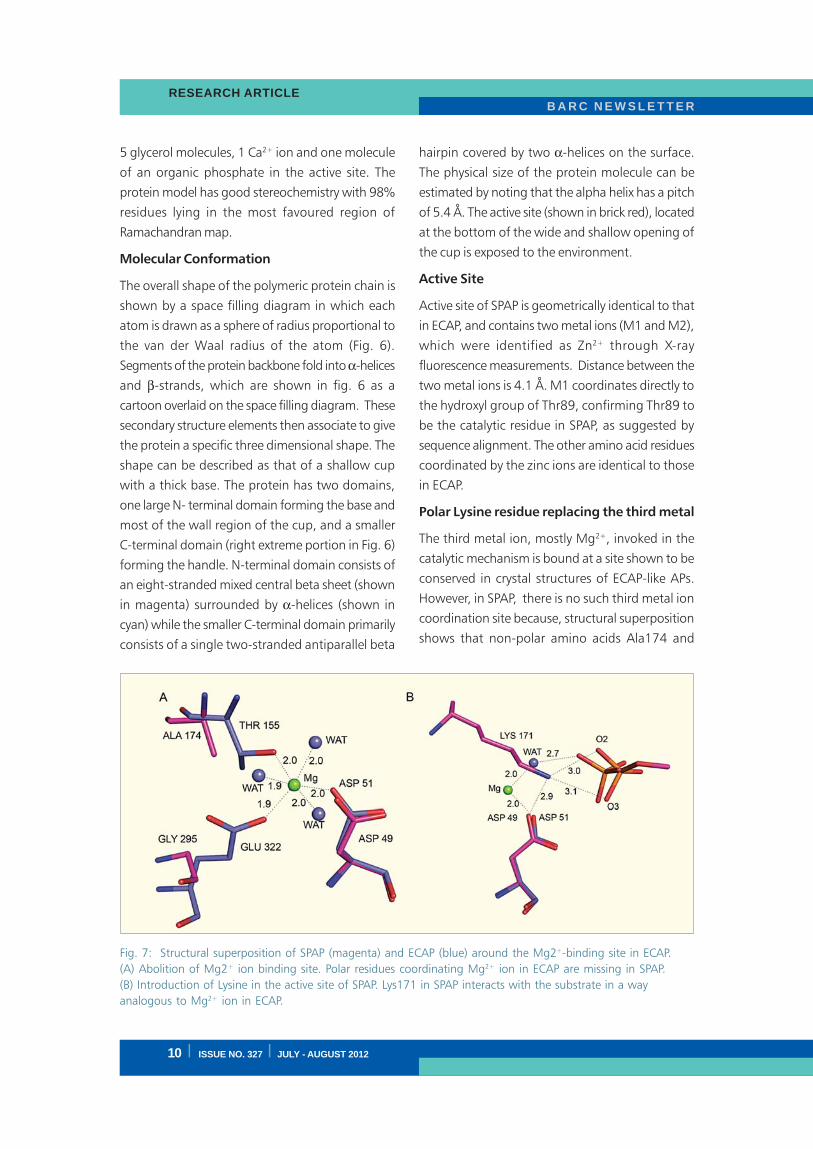
Fig. 7: Structural superposition of SPAP (magenta) and ECAP (blue) around the Mg2+-binding site in ECAP.
(A) Abolition of Mg2+ ion binding site. Polar residues coordinating Mg2+ ion in ECAP are missing in SPAP.
(B) Introduction of Lysine in the active site of SPAP. Lys171 in SPAP interacts with the substrate in a way
analogous to Mg2+ ion in ECAP.

B A R C N E W S L E T T E R RESEARCH ARTICLE
ISSUE NO. 327 I JULY - AUGUST 2012 I 11
B A R C N E W S L E T T E R RESEARCH ARTICLE
ISSUE NO. 327 I JULY - AUGUST 2012 I 11
Gly295 now occupy positions of amino acids
Thr155 and Glu322 that coordinate Mg2+ ion in
ECAP (Fig. 7A). Interestingly, the structure reveals
that a lysine residue, which has a positively charged
N atom at the end of the side chain, is positioned
exclusively in the active site of SPAP. This N atom is
involved in chemical interactions similar to those of
Mg2+ in ECAP-like enzymes (Fig. 7B). These
observations suggest that Lys171 in SPAP is
substituting for Mg2+ ion in ECAP.
SPAP – A novel AP representing a New Class
There are several features which make SPAP a novel
AP. First, the key catalytic residue in SPAP is Thr89
instead of serine found in all other APs. Second, the
conserved third metal ion binding pocket in the active
site in ECAP-like APs, is absent in SPAP (Fig. 7A and
7B). Third, the active site arginine residue conserved
in ECAP-like APs is absent in SPAP (Fig. 8A and 9).
Fourth, the sequence identity between SPAP and
ECAP-like APs ranges from 12% to 14.6%, which is
very low compared to the range of 30% - 50%
observed among ECAP-like APs (Fig. 9). Fifth, the
combined presence in the SPAP active site of key
amino acid residues Thr89, Asn110, Lys171 and
Arg173 (Fig. 8B and 9), observed only separately in
the active sites of members of the AP superfamily.
Interestingly, the relative positions and interactions
Fig. 8: Comparison of interactions between substrate phosphoryl group and the amino acid residues in the
active site: (A) NPP – yellow, BiPGM - green, ECAP – blue, and SPAP – magenta; (B) zinc ions in the active site of
SPAP. Hydrogen bond distances are also indicated.
of these residues with the substrate phosphoryl
group are maintained in the individual active sites
(Fig. 8A).
Implications toward Molecular Evolution
Proteins with related functions and similar structure
are combined into a larger group called as a
superfamily. APs are part of a superfamily, which
includes nucleotide pyro-phosphatases (NPP), co-
factor independent phosphoglycerate mutases
(iPGM), phosphonate monoester hydrolases (PMH)
and aryl sulfatases (AS) [14]. Amino acid sequence
similarity between different members of the
superfamily is often too low to reveal relatedness.
In such conditions, structural alignment method can
provide better understanding of molecular evolution.
Structural alignment, using the DALI server [15],
shows that SPAP has highest similarity with NPP (Z-
score 28.2) rather than with ECAP (Z-score 20.1) or
other ECAP like APs. Structural superposition also
shows that the substrate-interaction pattern observed
in SPAP is different from that seen in ECAP and other
APs. The two coplanar hydrogen bonds to the
substrate phosphoryl group from the conserved
active site arginine residue in all ECAP-like APs are
absent in SPAP. Instead, there are two non-coplanar
hydrogen bonds to the substrate phosphoryl group
from two separate amino acids in the active site

B A R C N E W S L E T T E RRESEARCH ARTICLE
12 I ISSUE NO. 327 I JULY - AUGUST 2012
B A R C N E W S L E T T E RRESEARCH ARTICLE
12 I ISSUE NO. 327 I JULY - AUGUST 2012
Fig. 9: Sequence alignment derived from structural
superposition of SPAP, ECAP and NPP. The amino acid
residues are described in single-letter-code.
Absolutely conserved residues are shown in red
background. Following four novel features of SPAP
are highlighted by arrows: 1) presence of Thr89 in
place of catalytic serine- blue arrow, 2) presence of
unique Lys 171 and Arg173-green arrows, 3)
presence of Asn110-blue filled arrow and 4)
deletion, in SPAP, of conserved arginine – yellow
arrow.
Fig. 10: Phylogenetic tree for alkaline phosphatases.

B A R C N E W S L E T T E R RESEARCH ARTICLE
ISSUE NO. 327 I JULY - AUGUST 2012 I 13
B A R C N E W S L E T T E R RESEARCH ARTICLE
ISSUE NO. 327 I JULY - AUGUST 2012 I 13
Engineering SPAP for higher activity
The alkaline phosphatase enzyme is widely used in
the fields of molecular biology and biotechnology.
Fig. 11: Hydrogen bonding interactions, near the active site, which may be modulated to increase flexibility of
ARG-173 and ASN-110: (A) positioning of ARG-173 and (B) positioning of ASN-110.
Acknowledgments
This work was carried out as part of an MOU between
BARC, India and CEA, France, for cooperation in
the field of life sciences. MVH is thankful to Drs. R.
Chidambaram and K. K. Kannan for scientific
discussions. We are thankful to the National Facility
for Macromolecular Crystallography, SSPD, BARC
for providing access to the equipment.
In fact there are three commercial preparations of
APs from different sources, and none of these has
totally satisfactory properties of thermolability and
Table 1: Crystal data, intensity data and anomalous phasing statistics for SM-SPAP.
*The numbers between parentheses indicate the value in the outer resolution shell

B A R C N E W S L E T T E RRESEARCH ARTICLE
14 I ISSUE NO. 327 I JULY - AUGUST 2012
B A R C N E W S L E T T E RRESEARCH ARTICLE
14 I ISSUE NO. 327 I JULY - AUGUST 2012
high activity. Therefore, there is a demand for an AP
which has high activity, can be purified in large
amounts, and can be easily and completely
inactivated by heating to milder temperatures. SPAP
has favourable properties in these respects. Since
greater flexibility in and around the active site is
correlated with higher activity, we have identified
Glu88, Tyr125 and Asp172 as residues that can be
mutated to impart flexibility to the active site residues
Arg173 and Asn110, which are binding the
phosphoryl moiety ( Fig. 11A and 11B).
Acknowledgments
This work was carried out as part of an MOU between
BARC, India and CEA, France, for cooperation
in the field of life sciences. MVH is thankful to
Drs. R. Chidambaram and K. K. Kannan for scientific
discussions. We are thankful to the National Facility
for Macromolecular Crystallography, SSPD, BARC
for providing access to the equipment.
References
1. Lloyd J R and Renshaw J C (2005) Curr Opin
Biotech 16:254–260.
2. http://www.epa.gov/radtown/clean-up.html.
3. Basnakova G, Stephens E R, Thaller M C,
Rossolini G M and Macaskie L E (1998)
Table 2: Diffraction data and refinement statistics for native SPAP.
*The numbers between parentheses indicate the value in the outer resolution shell. R.m.s= root mean square.
Appl Microbiol Biotechnol 50:266-272.
4. Nilgiriwala K S, Alahari A, Rao A S, Apte S K
(2008) Appl Environ Microbiol 74: 5516-5523.
5. Nilgiriwala K S, Bihani S C, Das A, Prashar V,
Kumar M, et al. (2009) Acta Cryst F65:
917-919.
6. Bihani S C, Das A, Nilgiriwala K S, Prashar V,
Pirocchi M et al (2011) PLoS One 6: e22767.
7. Ramaseshan S and Abrahams S C (1975)
Acta Cryst B24, 35 – 39.
8. Sikka S K (1969) Acta Cryst A25: 396-397.
9. Kim E E, Wyckoff H W (1991) J Mol Biol 218:
449-464.
10. Stec B, Holtz K M, Kantrowitz E R (2000)
J Mol Biol 299: 1303-1311.
11. Adams P D, Afonine P V, Bunkoczi G, Chen V
B, Davis I W, et al. (2010) Acta Cryst D66:
213-221.
12. Emsley P, Cowtan K (2004) Acta Cryst D58:
2126-2132.
13. Painter J, Merritt E A (2006) J Appl Cryst 19:
109-111.
14. Galperin M Y, Bairoch A, Koonin E V (1998)
Protein Sci 7: 1829-1835.
15. Holm L, Rosenström P (2010) Nucleic Acids
Res 38: 545-549.
B A R C N E W S L E T T E R RESEARCH ARTICLE
ISSUE NO. 327 I JULY - AUGUST 2012 I 15
Improved Location of Earthquakes
in Sumatra Region using
Gauribidanur Seismic Array Data
Manoj Kumar and Falguni Roy
Seismology Division
Abstract
The aim of this study has been to explore the applicability of an event location method based on PcP and various
depth phases, particularly for the earthquakes in Sumatra region with a reasonable degree of accuracy using
Gauribidanur short period seismic array data. The method utilizes PcP–P time based distance estimate along with
depth and azimuth of the source for locating events in this region. The task to Identify PcP and depth phases is
accomplished using array beaming technique that facilitates identification of these phases by virtue of their
slownesses across the array. Slowness measurements have been carried out using a software package named
SPIDER (Seismic Phase Identifier for Depth and Epicenter Reassessment), developed in Seismology Division, BARC.
It has been demonstrated that the arrival time information of PcP and various depth phases obtained from the
analyzed array seismogram, together with source azimuth, can be successfully used to reliably locate earthquakes
of magnitude ≥ 5.5 in Sumatra region.
Introduction
Seismic arrays play a significant role when it comes
to enhancement of weak signals, estimation of
apparent velocities of various seismic phases and
determination of azimuth to an event. Enhancement
of weak signals is achieved through a method
known as beam-forming. If the ambient noise is
completely incoherent and the signal is fully coherent
across the array, beam-forming or delay and sum
processing of the array data from N sensors would
provide a signal to noise gain of as compared
to a single seismometer. In view of this seismic arrays
have the potential to facilitate detection of weak
signals. Subsequent to detection of a signal, the
next important task, perhaps, is to find the location
of the source that generated the signal. In order to
locate an event from one point on the earth, e.g. a
seismic array, to another point where a seismic event
has taken place, we need to know the distance and
azimuth from the array to the source epicenter. The
azimuth to an event can be estimated at a two
dimensional seismic array from the observed signal
time delays across the array. The distance can be
estimated either from the arrival time difference
between P wave and other later phases such as S,
Lg or PcP waves or from the apparent velocity (Va)
of the P wave which is the inverse of the derivative
of travel time with respect to epicentral distance,
Δ. The accuracy of this method, however, depends
on the slope of dT/dΔ versus Δ curve. Besides this,
knowledge of regional and local travel time variations
also plays a significant role in accurate distance
estimation (Dahlman and Israelson, 1977). In view
of these limitations, former method of distance
estimation based on time differences of P and some
later phases such as S, Lg or PcP are of more practical
value. However, Lg waves are not observed after
approximately 100 km of propagation in the oceanic
crust, due to which they are not useful for locating
undersea earthquakes.
Figure 1 shows various seismic body wave phases
comprising depth phases and other surface
reflections used in the study.
PcP-P time can provide source distance with
reasonable accuracy for distances upto ~5000 km
which will be comparable to S-P time based
estimates provided S phase onset is picked up
accurately. However, S onsets upto a distance of

B A R C N E W S L E T T E RRESEARCH ARTICLE
16 I ISSUE NO. 327 I JULY - AUGUST 2012
~ 25 degrees is not satisfactorily readable in normal
earthquakes, but is very clear in deep ones (Jeffreys
and Bullen, 1958). On the other hand, though, PcP
may not be detected for small earthquakes, for
moderate to large magnitude earthquakes PcP phase
can be identified unambiguously based on its
slowness across an array and thereby onset of the
phase can be accurately picked using data from the
seismic array. Further, PcP- P time is less sensitive to
depth variation than S-P time.
In the present work, we have set our objective to
locate moderate to large magnitude earthquakes in
Sumatra region with reasonable accuracy using
Gauribidanur seismic array (GBA) data alone. In view
of this, we have explored the applicability of PcP–P
based distance estimation method together with
azimuth of the source for locating events in this
region. Attempt has also been made to estimate
source depth using depth phases by identifying them
based on their slownesses across the array. In general,
better estimates of source depth as well as epicentral
location of an event may be obtained using a
network of seismic stations in comparison to a
seismic array, however as mentioned earlier, our aim
in this study has been to locate undersea
earthquakes in Sumatra region using GBA data,
primarily, by exploiting the potential of the array to
facilitate identification of PcP and depth phases
through the measurement of their slownesses.
The Method of Phase Identification
At the core-mantle boundary, which is having a
sharp velocity discontinuity, body waves can
undergo reflection as well as refraction. The reflected
P waves are called PcP (see Fig. 1). The PcP signal as
observed at a seismic array will always have larger
apparent velocity as compared to the P signal from
the same event. Since both these signals arrive from
a fixed direction, the PcP phase can be easily
identified from its apparent velocity, which is
estimated by forming a large number of beams with
different apparent velocities, keeping station to
source azimuth constant, and choosing the one that
is consistent with the apparent velocity of the P
phase. Azimuth, however, can be estimated from
the observed P wave time delays across the two
arms of the array. Having identified the PcP signal,
the difference in travel times between PcP and the P
phase can be gainfully employed to estimate the
epicentral distance of the event with respect to the
array cross over point. This is primarily due to the
fact that PcP - P time increases rapidly as the
epicentral distance (Δ) reduces, especially for
distances below 50° (see Fig. 2). However, S-P time
may be used to estimate epicentral distance reliably
even for larger distances provided the source depth
is known.
Fig. 1: Various seismic body wave phases comprising
depth phases and other surface reflections used in
the study. Small red circle indicates the seismic
source. Continuous lines show P rays whereas
broken lines show S rays. PcP and ScP stands for P
and S phases getting reflected at the outer core
respectively and further travelling as P waves.
Fig. 2. Variation in PcP- P and S-P times with
epicentral distance for surface focus events

B A R C N E W S L E T T E R RESEARCH ARTICLE
ISSUE NO. 327 I JULY - AUGUST 2012 I 17
Depth phases, viz. pP and sP, that arrive at the receiver
as P waves are better identified using a network of
seismic stations with varying source station distances
(Roy, 1984). However, on short period vertical
component seismograms, sub oceanic earthquakes,
such as most earthquakes in Sumatra region, can
give rise to water surface reflections (pwP and swP)
with amplitudes comparable to pP and sP phases
(Mendiguren, 1971; Forsyth, 1982; Engdahl and
Billington, 1986). Thus, while analyzing
seismograms generated by sub oceanic events, care
has to be taken that water surface reflections are
not identified as pP phase. For unambiguous
estimation of source depth using the data from a
short period seismic array only, it is necessary that
the depth phases pP and sP which may occasionally
be obscured by the P coda are further identified
with the help of pPcP, sPcP or sScP phases if observed
in the seismogram. The phases pPcP and sScP, if
observed, can help to distinguish pP phase from
pwP phase. Various depth phases can be identified
by their apparent velocities. For example, pP and sP
will have apparent velocity comparable to P phase
where as pPcP and sPcP will have apparent velocity
comparable to PcP phase. Likewise sScP will have
apparent velocity comparable to ScP phase.
Phase Identification Software
Software named SPIDER (Seismic Phase Identifier
for Depth and Epicenter Reassessment) has been
developed at Seismology Division, BARC, using
Microsoft Visual Basic (6.0). This software helps user
to detect and identify various seismic phases using
Gauribidanur array data. It essentially works on the
array beaming technique and facilitates identification
of phases by virtue of their slownesses across the
array. The case studies that follow have been
generated using this software.
Case Studies
In order to demonstrate the efficacy of PcP, ScP
and various depth phases in locating a seismic event
we have presented here the analysis of GBA
seismograms pertaining to four events which
occurred in Sumatra region. The digital short period
data at GBA are sampled at a rate of 40 samples/s
for each of the 20 sensors. A schematic diagram of
the array is shown in Fig. 3. Various system details
and design characteristics of GBA are available
elsewhere (Birtill and Whiteway, 1965; Mowat, and
Burch, 1974; Roy and Nair, 2005). A comparison
between estimated locations and the locations
reported by the United States Geological Survey
(USGS) for the analyzed events is presented in
Table I.
Fig. 3: Layout of the Gauribidanur seismic array. Two
perpendicular arms, each comprising ten sensors, are
named as Red(R) and Blue (B) respectively.
Event 1
Fig. 4 shows the 20 channel seismogram of
event-1 that occurred in Southern Sumatra region.
Beginning with the P phase, the seismogram depicts
a number of later phases. Detailed analysis to identify
these phases is presented in Figs. 5 and 6.
Keeping azimuth fixed at 118.5°, which was
estimated from P wave move out across the array,
time average products (TAP; Weichert, 1975) were
computed using two beams corresponding to RED
and BLUE arm channels of GBA for each Va from
7 km/s to 55 km/s (indicated at the extreme left of

B A R C N E W S L E T T E RRESEARCH ARTICLE
18 I ISSUE NO. 327 I JULY - AUGUST 2012
the Fig.s 5 and 6). The depth phases pP and sP
showed high amplitudes on TAP waveforms at those
values of Va which were close to that of the P wave
(see Fig. 5). As the Va deviated from these values,
the amplitudes of the depth phases showed marked
reduction. Since the depth phases follow more or
less the same path as that of P phase, the values of
Va of these phases are also very similar to that of
the P phase. However, as the PcP phase arrives with
a larger value of Va than that of P wave, the amplitude
of this phase slowly builds up in the beamed signal
as Va is increased beyond that of P or depth phases,
and starts reducing after attaining the optimum value
(see Fig.s 5 and 6). Like PcP, ScP phase also arrives
with a larger Va as compared to P phase. Thus ScP
phase can be identified from its Va (see Fig. 6).
Having identified PcP or ScP phase, the distance to
the source is obtained from PcP – P time or ScP-P
time, which along with source azimuth and depth
(obtained from depth phases) may be used to obtain
the source location. Table 1 shows the estimated
parameters for event-1 as obtained using SPIDER
Event 2
Fig. 7 shows the TAP signals for various values of Va
corresponding to event-2 for constant event azimuth.
For this event several phases appeared with the
apparent velocity close to that of P wave.
Identification of depth phases was difficult from
these signals alone. However, when the seismograms
were beamed for Va close to that of ScP phase
(approximate time of the ScP phase was available
from Vaof P wave), prominent ScP and sScP phases
were observed (see Fig. 8). Based on sScP-ScP time,
it was possible to identify pP phase unambiguously
as indicated in Fig. 7. The event was relocated using
ScP – P time and azimuth to the event. PP phase,
with low Va value, was identified based on the
epicentral distance of the event.
Event 3
Fig. 9 shows the unprocessed seismograms of event
3 in which the later arrivals are not clear. Fig. 10
shows the TAPs for various values of Va on an
expanded scale which were obtained by keeping
azimuth constant. As Va is increased from 7 km/s
to 55 km/s, depth phases, pP and sP, start appearing
strongly around the Va values which are close to
that of the P phase (see Fig. 10).
Event 4
Fig. 11 shows the 20 channel seismogram of
event-4 as recorded at GBA. TAPs for various values
of Va in an expanded time scale are shown in
Fig. 4: Short period seismograms at Gauribidanur
array corresponding to an earthquake (event-1, table
I) in Southern Sumatra region. Plot duration is 360 s.
Sensor names are shown at the left.
Fig. 5: TAP signals for various apparent velocities
(indicated at the left) and fixed azimuth, 118.5°,
obtained from P wave move out pertaining to event-
1. Duration of the plot is 350s.
Fig. 6: TAP signals of PcP and ScP phases for Event-1.
Duration of the plot is 240s.

B A R C N E W S L E T T E R RESEARCH ARTICLE
ISSUE NO. 327 I JULY - AUGUST 2012 I 19
Fig. 12. Depth phase, pP, arriving with Va
comparable to P wave may be seen very clearly.
Though sP phase can be identified with reasonable
accuracy, it got merged apparently with the phases
reflected from water surface. PP phase is seen
emerging strongly in TAP signals for low Va.
Fig. 7: TAP signals of event-2 for various apparent
velocities (shown on the left).Depth phase pP is
identified with the help of sScP phase (see figure 8).
Plot duration is 65 s. prominent PP phase is also
seen.
Fig. 8: TAP signals of event-2 around ScP arrival time,
for various apparent velocities shown on the left. ScP
and sScP phases arriving with large apparent
velocities are clearly seen. Plot duration is 190 s.
Fig. 9: Seismograms of event-3. Depth phases cannot
be identified clearly. Plot duration is 260 s.
Fig. 10: TAP signals of event-3 for various apparent
velocities are shown in expanded time scale. Depth
phases pP and sP arriving with apparent velocity
comparable to P wave may be seen very clearly. Plot
duration is 90 s.
Fig. 11: Unprocessed seismograms of event-4 as
recorded at GBA. Plot duration is 320 s.
Fig. 12: TAP signals of event-4 for various apparent
velocities are shown in expanded time scale. Depth
phase pP arriving with apparent velocity comparable
to P wave may be seen very clearly. However, though
sP phase can be identified with reasonable accuracy,
it apparently got merged with phases reflected from
water surface. Plot duration is 45 s. PP phase is seen
emerging strongly for low apparent velocity TAP
signals.
Table I : Parameters of Sumatra events as reported by
the USGS and obtained from the present study using
SPIDER software.

B A R C N E W S L E T T E RRESEARCH ARTICLE
20 I ISSUE NO. 327 I JULY - AUGUST 2012
Conclusions
Seismic arrays play a significant role when it comes
to estimation of apparent velocities or slownesses
of various seismic phases and determination of
azimuth to an event. These characteristics of a
seismic array were used to demonstrate the efficacy
of PcP, ScP and various depth phases including
sScP phase in locating seismic events in Sumatra
region with reasonable accuracy. Analysis of GBA
short period seismograms pertaining to four events
which occurred in Sumatra region demonstrated that
estimated locations using the present method were
in good agreement with those reported by United
States Geological Survey keeping in view the fact
that only a single array station data were used in
the study.
Acknowledgements
We are thankful to our colleagues at Gauribidanur
array for providing the digital waveform data and
to the USGS for making available the event
parameters at their website. We also thank Shri K.
K. Bhuyan for helping us in preparing Fig. 1.
References
1. Birtill, J. W. and Whiteway, F. E. (1965). The
application of phased array to the analysis of
seismic body waves. Proc. R. Soc. London, Ser.
A, 258, 421-493.
2. Dahlman, O. and Israelson, H. (1977).
Monitoring underground nuclear explosions,
Elsevier Scientific Publishing Company,
Amsterdam, 440 pp.
3. Engdahl, E. R. and Selena Billington (1986).
Focal Depth Determination of Central Aleutian
Earthquakes, Bulletin of the Seismological
Society of America, Vol. 76, No. 1, pp. 77-93
4. Forsyth, D. W. (1982). Determinations of
focal depths of earthquakes associated with
the bending of oceanic plates at trenches,
Physics of the Earth and Planetary Interiors,
28, 141—160.
5. Jeffreys, Sir H. and Bullen, K.E. (1958).
Seismological Tables. British Assoc. for
Advancement of Science, Gray Milne Trust,
London.
6. Mendiguren, J. A. (1971). Focal mechanism of
a shock in the middle of the Nazca plate, J.
Geophys. Res.76, 3861-3879.
7. Mowat, W.M.H. and Burch, R.F. (1974).
Handbook for the stations which provide
seismograms to the Blacknest Seismological
Center, United Kingdom. Ref. No. AWRE/44/
47/29, AWRE, Aldermaston, Berks.
8. Roy, Falguni (1984). Source depth estimation
using multi-station waveform data, Bull. Seism.
Soc. Am., 74, 5, 1623-1643.
9. Roy, Falguni and Nair, G. J. (2005). A real time
seismic monitoring and tsunami alert system.
International workshop on external flooding
hazards at NPP sites, Organized by AERB, NPCIL
and IAEA, 29 August -02 September, 2005,
Kalpakkam, India.
10. Weichert, D. H. (1975) Role of medium
aperture arrays: The Yellowknife system, In: K.
G. Beauchamp (Editor), Exploitation of
seismograph networks, Nordhoff, Leiden, 167-
196.

ISSUE NO. 327 I JULY - AUGUST 2012 I 21ISSUE NO. 327 I JULY - AUGUST 2012 I 21ISSUE NO. 327 I JULY - AUGUST 2012 I 21ISSUE NO. 327 I JULY - AUGUST 2012 I 21
B A R C N E W S L E T T E RB A R C N E W S L E T T E RTECHNOLOGY DEVELOPMENT ARTICLE
DNA Repair and Recombination Proteins
(Dmc1 and Rad51) from Rice (Oryza Sativa)
Rajani Kant Chittela and Jayashree K. Sainis
Molecular Biology Division
Abstract
Homologous recombination is a process by which two DNA molecules interact physically and exchange the
genetic information for maintaining the genome integrity and genetic diversity. Different proteins are involved in
this process to carryout sequential biophysical and biochemical steps of this process. A special group of proteins
called “Recombinases” are the central and crucial for this process as they mediate important steps like homology
search, synapsis and strand exchange. In prokaryotes, RecA and in eukaryotes, RecA homologues, Rad51 and
Dmc1 are important for this process. In this article, we report a brief over view of the work on rice DNA recombinases
OsDmc1 (Oryza sativa Disrupted Meiotic cDNA1) and OsRad51 (Oryza sativa Radiation sensitive mutant 51).
Both the proteins showed the hallmark properties of bonafied “Recombinase”.
Introduction
DNA is the vital biomolecule, in which genetic
information is stored in almost all living organisms.
As living organisms are continuously exposed to
different genotoxic agents, the template DNA is
subjected to damage. DNA double-strand breaks
(DSBs) produced during normal developmental
stages due to the action of nucleases, errors in
replication and due to exposure to radiation or
genotoxic chemicals are repaired either by
Homologous Recombination (HR) and Non-
Homologous End Joining (NHEJ) (Symington,
2002). Though NHEJ is more predominant for DNA
repair in eukaryotes, it frequently results in mutations
as it is not error-free. Homologous recombination is
relatively error-free and is a crucial process in all the
living organisms including eukaryotes for
maintaining the genomic integrity and also for
generating genetic diversity, imperative for evolution.
The biochemical nature of homologous
recombination and the genes involved in this process
are well illustrated in the model prokaryotes such as
E. coli (Kowalczykowski et al., 1994). Homologous
recombination involves identification of double
strand breaks, generation of 3’ overhangs, homology
search in the undamaged partner, synapse formation
between damaged and undamaged DNA molecules,
strand exchange between the paired DNA partners
and resolution of Holliday junction to generate
repaired DNA molecules without loss of genetic
information. The DNA recombinases, implicated
in homology search, pairing and strand exchange
play a crucial role and are particularly interesting
from the point view of structural and functional
relationships. In E. coli, Recombinase-A (RecA)
protein is well characterized.
In eukayotes, homologous recombination is known
to occur, predominantly during meiosis.
Advancement of technologies for cloning and over-
expression of eukaryotic genes and proteins have
made it possible to investigate biochemistry of
homologous recombination in eukaryotes (Fig.1).
Two homologues of REC-A viz RAD51 (Shinohara
et al, 1992) and DMC1 (Bishop et al., 1992) were
identified first in yeast and later in mammals which
perform a role similar to E. coli RecA with a
significant help from other proteins belonging to
RAD52 epistasis group (Symington, 2002). The
Rad51 protein mediates homologous recombination
in mitosis and meiosis while Dmc1 is involved only
in meiosis. RAD51 orthologues have been identified
in mouse and humans. Mutations in Rad51 gene in
mice resulted in early embryonic lethality and
inability of cell lines to grow in vitro. ScRAD51, in

B A R C N E W S L E T T E RRESEARCH ARTICLE
B A R C N E W S L E T T E RTECHNOLOGY DEVELOPMENT ARTICLE
22 I ISSUE NO. 327 I JULY - AUGUST 201222 I ISSUE NO. 327 I JULY - AUGUST 201222 I ISSUE NO. 327 I JULY - AUGUST 201222 I ISSUE NO. 327 I JULY - AUGUST 2012
S. cerevisiae is involved in repair of radiation induced
DNA damage (Masson et al., 2001; Symington,
2002). Dmc1 protein from yeast and human systems
is also capable of mediating homologous pairing
between a single strand and double stranded DNA.
Dmc1 mutants are defective in reciprocal
recombinantion, unable to process double-strand
break (DSB) recombination intermediates and have
inability to form normal synaptonemal complex (SC)
which finally leads to arrest in meiotic prophase
(Bishop et al., 1992). The protein by itself was
shown to exhibit a limited capacity for strand
exchange (Hong et al., 2001; Sehorn et al., 2004).
As in other eukaryotes, homologous recombination
is also crucial for generation of the genetic variability
and also maintaining genomic integrity in plant
systems. Several studies have been initiated to isolate
the genes involved in homologous recombination
in plants, especially genes for recombinases.
Homologues of DMC1 have been identified in Lilium
longiflorum, Arabidopsis thaliana and Oryza sativa.
DMC1 mutants in arabidopsis showed random
segregation of chromosomes in both male and
female meiocytes. Recently it has been shown that
homozygous parental lines can be derived from
heterozygous arabidopsis plant using reverse
breeding approach by suppressing the DMC1
expression (Wijnker et al., 2012). Orthologues of
RAD51 gene have been identified in several plants
like Arabidopsis thaliana, Zea mays, Lycopersicon
esculentum, Psyscomitrella patens. After gamma
irradiation RAD51 transcription levels in arabidopsis
increased showing its involvement in double strand
break repair. It was also shown that in arabidopsis
RAD51 was dispensable for vegetative growth but
was required during meiotic recombination. RAD51
paralogs in arabidopsis like AtRAD51B, AtRAD51C
and AtXRCC2 are known to play role in DNA repair
and meiosis. In maize, Rad51 protein is involved in
meiotic chromosome synapsis and segregation,
supporting its involvement in meiotic homology
search (Blueyard et al., 2006). AtBrca2, a breast
cancer susceptibility protein mediates the proper
localization of AtRad51 and AtDmc1 during meiotic
synapsis (Seeliger et al., 2012).
The germline cells in plants are not predetermined
as in case of animals. Any somatic cells can become
a gametic cell. Plants are continuously exposed
variety of environmental stresses, some of which
may be genotoxic. DNA repair systems in higher
plants have to be efficient and, therefore, interesting
to investigate. Since DNA repair by non homologous
end joining pathway (NHEJ) is more prone to
mutations and genetic loss, homologous
recombination assumes importance in maintaining
genetic integrity in plants. Our investigation on
OsDmc1 and OsRad51 is an important milestone in
unraveling the biochemistry of homologous
recombination in plants.
Characterization of Recombination Proteins
Dmc1 and Rad51from Rice
Previously two types of OsDMC1 genes from
japonica (AY123338 and AF375982) and indica
(AY123340 and AY123339) cultivars of rice were
sequenced in our lab. OsDmc1 Type A protein
(~38.5 kDa) from Indica variety of rice was expressed
in E. coli (Metkar et al., 2004). Subsequently
Fig.1: Different biochemical steps and proteins
involved in DNA double strand break repair by
homologous recombination
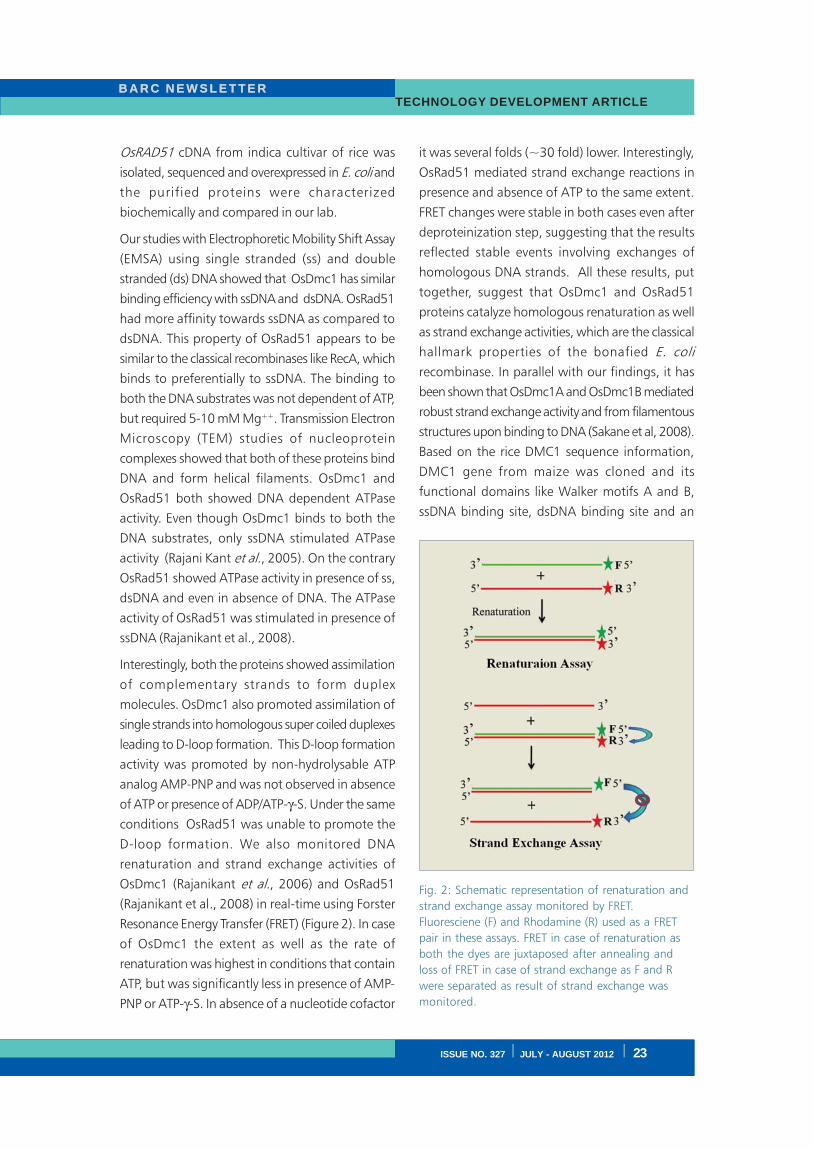
ISSUE NO. 327 I JULY - AUGUST 2012 I 23ISSUE NO. 327 I JULY - AUGUST 2012 I 23ISSUE NO. 327 I JULY - AUGUST 2012 I 23ISSUE NO. 327 I JULY - AUGUST 2012 I 23
B A R C N E W S L E T T E RB A R C N E W S L E T T E RTECHNOLOGY DEVELOPMENT ARTICLE
OsRAD51 cDNA from indica cultivar of rice was
isolated, sequenced and overexpressed in E. coli and
the purified proteins were characterized
biochemically and compared in our lab.
Our studies with Electrophoretic Mobility Shift Assay
(EMSA) using single stranded (ss) and double
stranded (ds) DNA showed that OsDmc1 has similar
binding efficiency with ssDNA and dsDNA. OsRad51
had more affinity towards ssDNA as compared to
dsDNA. This property of OsRad51 appears to be
similar to the classical recombinases like RecA, which
binds to preferentially to ssDNA. The binding to
both the DNA substrates was not dependent of ATP,
but required 5-10 mM Mg++. Transmission Electron
Microscopy (TEM) studies of nucleoprotein
complexes showed that both of these proteins bind
DNA and form helical filaments. OsDmc1 and
OsRad51 both showed DNA dependent ATPase
activity. Even though OsDmc1 binds to both the
DNA substrates, only ssDNA stimulated ATPase
activity (Rajani Kant et al., 2005). On the contrary
OsRad51 showed ATPase activity in presence of ss,
dsDNA and even in absence of DNA. The ATPase
activity of OsRad51 was stimulated in presence of
ssDNA (Rajanikant et al., 2008).
Interestingly, both the proteins showed assimilation
of complementary strands to form duplex
molecules. OsDmc1 also promoted assimilation of
single strands into homologous super coiled duplexes
leading to D-loop formation. This D-loop formation
activity was promoted by non-hydrolysable ATP
analog AMP-PNP and was not observed in absence
of ATP or presence of ADP/ATP-γ-S. Under the same
conditions OsRad51 was unable to promote the
D-loop formation. We also monitored DNA
renaturation and strand exchange activities of
OsDmc1 (Rajanikant et al., 2006) and OsRad51
(Rajanikant et al., 2008) in real-time using Forster
Resonance Energy Transfer (FRET) (Figure 2). In case
of OsDmc1 the extent as well as the rate of
renaturation was highest in conditions that contain
ATP, but was significantly less in presence of AMP-
PNP or ATP-γ-S. In absence of a nucleotide cofactor
it was several folds (~30 fold) lower. Interestingly,
OsRad51 mediated strand exchange reactions in
presence and absence of ATP to the same extent.
FRET changes were stable in both cases even after
deproteinization step, suggesting that the results
reflected stable events involving exchanges of
homologous DNA strands. All these results, put
together, suggest that OsDmc1 and OsRad51
proteins catalyze homologous renaturation as well
as strand exchange activities, which are the classical
hallmark properties of the bonafied E. coli
recombinase. In parallel with our findings, it has
been shown that OsDmc1A and OsDmc1B mediated
robust strand exchange activity and from filamentous
structures upon binding to DNA (Sakane et al, 2008).
Based on the rice DMC1 sequence information,
DMC1 gene from maize was cloned and its
functional domains like Walker motifs A and B,
ssDNA binding site, dsDNA binding site and an
Fig. 2: Schematic representation of renaturation and
strand exchange assay monitored by FRET.
Fluoresciene (F) and Rhodamine (R) used as a FRET
pair in these assays. FRET in case of renaturation as
both the dyes are juxtaposed after annealing and
loss of FRET in case of strand exchange as F and R
were separated as result of strand exchange was
monitored.

B A R C N E W S L E T T E RRESEARCH ARTICLE
B A R C N E W S L E T T E RTECHNOLOGY DEVELOPMENT ARTICLE
24 I ISSUE NO. 327 I JULY - AUGUST 201224 I ISSUE NO. 327 I JULY - AUGUST 201224 I ISSUE NO. 327 I JULY - AUGUST 201224 I ISSUE NO. 327 I JULY - AUGUST 2012
interface domain responsible for multimer formation
were mapped (Etdali et al., 2011).
Conclusion and Future Directions
Eukaryotic DNA is organized into higher order
structures called “chromatin” composed of histone
and non-histone proteins. It has been shown in yeast
and mammalian systems that upon DNA damage
chromatin remodeling has to occur for facilitating
the DNA repair and recombination. However, this
aspect is less explored in plant systems. Recently,
we have observed that exposure of wheat seedlings
to 60Co-γ radiation induced differential acetylation
and phosphorylation of Histones H3 and H4 which
would play important role in ATP independent events
of chromatin remodeling in post irradiation DNA
repair (Raut and Sainis, 2011). We also isolated and
characterized an ATP dependent chromatin
remodeling complex, which showed histone trans
transfer activity from wheat seedlings (Raut et al,
2011). All these studies open up new vistas in the
field of DNA repair and recombination in plants
(Chittela RK and Sainis JK, 2010). In future it would
be important to study proteins involved in DNA
repair recombination machinery of plants and
investigate their functions in vitro and in vivo.
These studies would unravel the newer possibilities
of targeting genes in transgenic plants and
understand their exact role in DNA repair and
recombination in plants. Apomixis is a process by
which plants produce embryos without going
through the routine fertilization and meiosis. Though
apomixis is known from decades, recently it has
gained a considerable importance as this process
would be able to maintain the hybrid vigour by
avoiding the sexual reproduction involving
recombination of parental traits. By suppressing the
genes like DMC1 during meiotic recombination and
over expression of genes responsible for apomixis,
seeds can be produced which would maintain
parental hybrid vigor. However, this calls for more
basic research at genetic and biochemical level to
understand the molecular mechanisms of DNA repair
and recombination in plants.
Acknowledgements
Our sincere thanks to Dr. S. K. Apte for support and
encouragement of this activity. Our thanks also due
to Dr. Michael Melzer, Head, Structural Biology
Group, IPK, Gatersleben, Germany and his research
team for their support during transmission electron
microscopy experiments.
References
1. Bishop, D.K., Park, D, Xu, L, and Kleckner, N.
(1992) DMC1: A meiosis-specific yeast homolog
of E. coli recA required for recombination,
synaptonemal complex formation, and cell cycle
progression. Cell 69, 439-456.
2. Bleuyard, J.Y., Maria, E., Gallego, B and White,
C.I. (2006) Recent advances in understanding
of the DNA double-strand break repair
machinery of plants DNA Repair 5, 1–12.
3. Chittela R.K and Sainis J.K. (2010) Plant DNA
Recombinases: A Long Way to Go. J Nucleic
Acids. 2010: 646109.
4. Etedali F, Baghban Kohnehrouz B, Valizadeh
M, Gholizadeh A, Malboobi M.A. (2011)
Genome wide cloning of maize meiotic
recombinase Dmc1 and its functional structure
through molecular phylogeny. Genet Mol Res.
10:1636-1649.
5. Hong, E.L., Shinohara, A. and Bishop, D.K.
(2001) Saccharomyces cerevisiae Dmc1 protein
promotes renaturation of single-strand DNA
(ssDNA) and assimilation of ssDNA into
homologous super-coiled duplex DNA. J Biol
Chem 276, 41906-41912.
6. Kowalczykowski, S. C., Dixon, D. A., Eggleston,
A. K., Lauder, S. D., and Rehrauer, W. M. (1994)
Biochemistry of homologous recombination E.
coli. Microbiol. Rev. 58, 401-465.
7. Masson, J. Y. and West, S. C. (2001) The Rad51
and Dmc1 recombinases: a non-identical twin
relationship. Trends Biochem. Sci. 26:131-136

ISSUE NO. 327 I JULY - AUGUST 2012 I 25ISSUE NO. 327 I JULY - AUGUST 2012 I 25ISSUE NO. 327 I JULY - AUGUST 2012 I 25ISSUE NO. 327 I JULY - AUGUST 2012 I 25
B A R C N E W S L E T T E RB A R C N E W S L E T T E RTECHNOLOGY DEVELOPMENT ARTICLE
8. Metkar, S.S., Sainis, J.K. and Mahajan, S.K.
(2004) Cloning and characterization of the
DMC1 genes in Oryza sativa. Curr.Sci. 87: 353–
357.
9. Rajani Kant C, Rao, B.J. and Sainis J. K. (2005)
“DNA binding and pairing activity of OsDmc1,
a recombinase from rice”. Plant Molecular
Biology 57, 1-11.
10. Rajanikant, C., Kumbhakar, M., Pal, ., Rao,
B.J and and Sainis, J.K. (2006) “DNA strand
exchange activity of rice recombinaseOsDmc1
monitored by fluorescence resonance energy
transfer and the role of ATP hydrolysis”. FEBS J
273: 1497-1506.
11. Rajanikant, C., Melzer, M., Rao, B.J and Sainis,
J.K. (2008) Homologous recombination
properties of OsRad51, a recombinase from rice.
Plant Molecular Biology, 68: 479-491.
12. Raut V.V and Sainis J.K. (2011) 60Co-ã radiation
induces differential acetylation and
phosphorylation of histones H3 and H4 in
wheat. Plant Biology, 14: 110-7.
13. Raut Vishal, Pandey Shashibhal and Sainis
Jayashree (2011) Histone Octamer Trans-transfer
-A Signature Mechanism of ATP Dependent
Chromatin Remodeling Unraveled in Wheat
Nuclear Extract. Annals of Botany, 108: 1235-
1246.
14. Sakane I, Kamataki C, Takizawa Y, Nakashima
M, Toki S, Ichikawa H, Ikawa S, Shibata T,
Kurumizaka H (2008) Filament formation and
robust strand exchange activities of the rice
DMC1A and DMC1B proteins. Nucleic Acids
Res. 13:4266-76.
15. Seeliger K, Dukowic-Schulze S, Wurz-Wildersinn
R, Pacher M, Puchta H (2012) BRCA2 is a
mediator of RAD51- and DMC1-facilitated
homologous recombination in Arabidopsis
thaliana. New Phytol. 193:364-375.
16. Sehorn, M.G., Sigurdsson, S., Bussen, W.,
Unger, V.M. and Sung, P. (2004) Human
meiotic recombinase Dmc1 promotes ATP-
dependent homologous DNA strand exchange.
Nature 429, 433-437.
17. Shinohara, A., Ogawa, H. and Ogawa, T. (1992)
Rad51 protein involved in repair and
recombination in Saccharomyces cerevisiae is
a RecA-like protein. CELL 69: 457-470
18. Symington, L. S. (2002) Role of RAD52 epistasis
group genes in homologous recombination and
double strand break repair. Microbiology and
Molecular Biology Reviews 66: 630-670.
19. Wijnker E, van Dun K, de Snoo CB, Lelivelt
CL, Keurentjes JJ, Naharudin NS, Ravi M,
Chan SW, de Jong H, Dirks R (2012) Reverse
breeding in Arabidopsis thaliana generates
homozygous parental lines from a
heterozygous plant. Nat Genet. 44:467-470.

B A R C N E W S L E T T E RRESEARCH ARTICLE
B A R C N E W S L E T T E RTECHNOLOGY DEVELOPMENT ARTICLE
26 I ISSUE NO. 327 I JULY - AUGUST 201226 I ISSUE NO. 327 I JULY - AUGUST 201226 I ISSUE NO. 327 I JULY - AUGUST 201226 I ISSUE NO. 327 I JULY - AUGUST 2012
Recovery of Cesium from
High Level Liquid Nuclear Waste by
an Advanced Polymer Composite
Lalit Varshney and V.Venugopal
Radiochemistry and Isotope Group
and
Amar Kumar, Tessy V. and S.D. Mishra
Nuclear Recycle Group
Abstract
Recovery of 137Cs is one of the important steps in safe and effective management of High Level Liquid Waste
(HLLW). Precipitation, solvent extraction and ion exchange are the prominent processes used for 137Cs separation.
Ion exchange processes, based on inorganic ion-exchangers, have several advantages like high radiation stability
of material, high selectivity of Cs over other constituent present in the waste, lower volume of secondary waste
generation, simple operational procedure etc. Ammonium molybdophosphate (AMP) is a well established inorganic
exchanger for selective separation of Cs from HLLW. However, it cannot be used as such for column operations
because of its microcrystalline nature. Use of other polymer based systems have known technical operational
problems. ALIX (Advanced Lyophilic Ion-exchanger), recently developed at BARC, is an engineered form of composite
ion-exchanger, observed to be useful in separation of Cs+ from highly acidic nuclear waste at demonstrable scale.
Introduction
137Cs (T1/2
= 30 years) is one of the principal
radionuclides produced during the fission of 235U
in nuclear reactors. It is a major source of radiation
in HLLW generated after the reprocessing of spent
nuclear fuel. Separation of Cs from HLLW, reduces
radiation exposure during the vitrification process
and prevents thermal deformation of conditioned
waste matrix during storage. Separation of 137Cs
would also markedly reduce it’s volatility during
vitrification, extent of migration from the vitrified
mass in repository, operational, transportation and
storage cost. In addition, 137Cs finds applications as
a radiation source for food preservation, sterilization
of medical products, brachytherapy, blood
irradiation, hygienization of sewage sludge etc. The
use of 137Cs in place of 60Co (T1/2
= 5.2 years) will
also reduce the shielding requirement, frequency of
source replenishment and ease the handling /
transportation of radioactive source(1-4). In the new
polymer composite , 80%AMP is blended with an
inert polymer substrate namely a polysulfone. The
inert polymer support is stable in 3-5 M Nitric acid
as well as in 1-3 M NaOH, has high thermal and
radiation stability and does not reduce the ion
exchange capacity of encapsulated AMP. Evaluation
of ALIX as an ion-exchanger for recovery of Cs from
simulated HLLW shows that 2.42Ci of 137Cs can be
loaded on one gram of ALIX without any operational
problem. Loaded Cs can be recovered from the
column by dissolving it in 1.0M NaOH solution. It
can be further purified by passing the dissolved AMP
solution through Resorcinol-Formaldehyde (RF) ion-
exchange column. On the basis of these experimental
results, which were carried out on an Engineering
Scale Experimental Facility, a conceptual process flow
sheet has been developed for recovery of Cs from
HLLW on demonstration scale. The polymer
composite has also given new directions for
development of various other encapsulated liquid/
solid extractants useful for extracting other radio
nuclides of interest and Rare Earths. The composite
has flexibility of modifications to meet various
requirements for successful implementation of the
separation process.

ISSUE NO. 327 I JULY - AUGUST 2012 I 27ISSUE NO. 327 I JULY - AUGUST 2012 I 27ISSUE NO. 327 I JULY - AUGUST 2012 I 27ISSUE NO. 327 I JULY - AUGUST 2012 I 27
B A R C N E W S L E T T E RB A R C N E W S L E T T E RTECHNOLOGY DEVELOPMENT ARTICLE
Characteristics and application of ALIX
ALIX is an engineered form of composite ion
exchanger in which AMP is blended with inert
polymer substrate which is stable in nitric acid as
well as NaOH and does not reduce the ion exchange
capacity of encapsulated AMP. ALIX has fibrous
internal structure containing AMP crystals,
surrounded by an outer layer of polymer and AMP
composite having thickness of 15-25um. The surface
pores on the layer have sizes of the order of 100-
300nm (Fig. 1). The morphological structure of the
composite is responsible for controlling exchange
kinetics. The results given here are for the optimum
bead structure having 45-49% void volume and
35-40 min. equilibrium time. In the bead structure,
AMP crystallites are not coated by the substrate and
are just embedded in the cavities, thus available for
faster Cs+ exchange as well as instant dissolution
by Alkali.
Fig. 1: Cross sectional view of ALIX spherical bead as
seen under SEM
Fig. 2: Distribution of AMP inside the ALIX
Table 1: Typical composition of HLLW
The formation process of ALIX is very simple,
environmentally safe and economical and is based
on nonsolvent induced phase separation technique.
The technology for the production of large quantity
of ALIX has been indigenously developed and
ingredients required for its preparation is locally
available.
Evaluation of ALIX in bench scale experimental
facility
ALIX was evaluated for recovery of Cs+ from typical
PHWR simulated HLLW, generated during the
reprocessing of spent fuel having burn up of 7000
MWD/Ton. Concentration of various constituents
in simulated waste is given in Table 1. It shows that
U, Na Fe and Cs are the major constituents present
in the waste. The simulated waste containing 134Cs
tracer was passed through a 1.5 litre stainless steel
column containing ALIX beads at a rate of 4.5 bed
vol/h. Concentration of 134Cs in the effluent was
determined by Gamma counter equipped with
NaI(Th) detector. 110 bed volumes of HLLW was
passed through the column to get complete
breakthrough. Exchange kinetics of Cs+ present in
simulated HLLW with ALIX was obtained by

B A R C N E W S L E T T E RRESEARCH ARTICLE
B A R C N E W S L E T T E RTECHNOLOGY DEVELOPMENT ARTICLE
28 I ISSUE NO. 327 I JULY - AUGUST 201228 I ISSUE NO. 327 I JULY - AUGUST 201228 I ISSUE NO. 327 I JULY - AUGUST 201228 I ISSUE NO. 327 I JULY - AUGUST 2012
determining the distribution coefficient Kd
Cs at
different interval of time. Kd
Cs is defined in equation
1. Fig. 3 shows that initially Kd
Cs increases with
increasing time of equilibration. Equilibrium was
achieved in 40 minutes.
gV
AfAfAiK Cs
d ⎟⎟⎠
⎞⎜⎜⎝
⎛ −= ————eq. 1
Where as Ai= Initial Cesium activity, Af= final
Cesium activity , V = volume of solution containing
Cesium, g = dry weight of polymer composite.
Dynamic exchange capacity of ALIX in this
experimental condition was found to be
0.34meq/g.
Selective dissolution of AMP from ALIX column
During the exchange Cs+ becomes a part of AMP
crystal. Regeneration of AMP is not energetically
favourable because this
exchange is accompanied by
phase transition that leads to
decrease in lattice energy. This
would lead to use of higher
conc. of NH4So
4 for
regeneration. Therefore, AMP
was selectively dissolved from
the ALIX in 1.0M NaOH.
Dissolution proceeds due to
following chemical reaction:
(NH4)3(MoO
3)12
.PO4 + 23NaOH = 11Na
2MoO
4 +
(NH4)2MoO
4 + NaNH
4HPO
4 + 11H
2O
Batch dissolution study shows that 4.156 moles of
NaOH is required to dissolve 0.180 moles of AMP
loaded in the ALIX column. 1.0M NaOH is the
threshold concentration required to achieve optimum
dissolution rate. Instantaneous dissolution takes
place at room temperature. The extent of dissolution
was measured by determining the concentration of
Cs+ and pH of dissolved solution. The process is
shown in Fig 4. The Pictorial view of dissolution
process of AMP from the ALIX is shown in Fig. 5.
Regeneration of ALIX column using 3 M NH4SO
4
was also explored. In this case, only 70 % of loaded
Cesium could be eluted. Moreover, separation of
Cesium from Ammonium sulphate solution is a
cumbersome process. Therefore, selective dissolution
of AMP from ALIX is more desirable.
Fig. 3: Sorption kinetics of Cs+ from Simulated HLLWFig. 4: Variation of [Cs+] in the effluent with
dissolution of AMP in the ALIX
Fig. 5; Dissolution process of AMP from ALIX.

ISSUE NO. 327 I JULY - AUGUST 2012 I 29ISSUE NO. 327 I JULY - AUGUST 2012 I 29ISSUE NO. 327 I JULY - AUGUST 2012 I 29ISSUE NO. 327 I JULY - AUGUST 2012 I 29
B A R C N E W S L E T T E RB A R C N E W S L E T T E RTECHNOLOGY DEVELOPMENT ARTICLE
Recovery of Cs from dissolved AMP solution
Resorcinol Formaldehyde Resin (RF) was employed
for selective separation of Cs+ from dissolve AMP
solution. The hydroxyl group attached to benzene
ring of the RF resin is a weak acid and dissociates at
higher PH. It is highly selective for Cs+ due to its
low hydrated ionic radius as compare to Na+. Fig.6
shows sorption isotherm of Cs+ on RF resin. This
isotherm was obtained by varying the Cs+
concentration in aqueous phase from 5 x 10⁻⁴ M to
5 x 10⁻² M at 12.5 pH. Isotherm indicates that
Cesium exchange capacity (CEC) of RF resin is
1.53 meq/g. RF resin is a regenerative types of
exchanger on which Cs+ was loaded at >12.5 pH.
Once column is saturated with Cs+, it can be
recovered by eluting with 0.5M HNO3 solution. Cs+
rich solution can be used as radiation source after
immobilizing in solid inert matrix
The results of the study on ALIX system indicate
that ALIX is a suitable polymer composite for
separation of Cs + from high level acidic liquid waste
from spent fuel.
Conclusions
The results of the present study indicate that it is
possible to separate 137 Cs on engineering scale from
HLLW using ALIX polymer composite.
Acknowledgement
The authors are grateful to Dr.P.K. Wattal , Dr. K.L.
Ramakumar, Dr. Gursharan Singh, for
encouragement and Dr. Dr. J.G. Shah for SEM
photographs and useful discussions.
References
1. Preparation of PAN based absorber for separation
of Cesium and Cobalt from radioactive wastes.
A Nilchi, H. Atashi, A.H. Javid, R. Saberi,
Applied Radiation and Isotopes 65(2007)482-
487.
2. Evaluation of ammonium molybdophosphate-
polyacrylonitrile (AMP-PAN) as a cesium
Fig. 6: Equilibrium sorption isotherm for Cs+
on RF resin
Fig.7: Schematic for separation of 137Cs from HLLW

B A R C N E W S L E T T E RRESEARCH ARTICLE
B A R C N E W S L E T T E RTECHNOLOGY DEVELOPMENT ARTICLE
30 I ISSUE NO. 327 I JULY - AUGUST 201230 I ISSUE NO. 327 I JULY - AUGUST 201230 I ISSUE NO. 327 I JULY - AUGUST 201230 I ISSUE NO. 327 I JULY - AUGUST 2012
Forthcoming Conference
1st National Conference on
Micro and Nano fabrication
(21 to 23) January, 2013
The micro and nano fabrication technology is an
import ant bridge to take findings of nano sciencesto the real world. The 1st National Conference on
Micro and Nona Fabrication Technologies, to be
organized by Central Manufacturing TechnologyInstitute aims to propagate micro and nano
fabrication activities by way of providing an
inspiring platform for exchange of researchadvances and findings. This conference will focus
on areas of micro and nanofabrication
technologies. The conference will be held in CMTI,Bengaluru, India during January 21-23, 2013.
Scope
The conference covers following broad areas /activities:
• Micro/Nano Machining
• Nano Finishing• Micro/Nano Patterning
• Micro/Nano Products
• FIB and e-beam based Machining• Laser based Micro Machining
• Surface Engineering and Tribo-coating
Technology• Nano Materials Characterization
• Nano Metrology
Important Dates
Abstract submission: 30 Sep, 2012
Notice of abstract acceptance : 5 Oct., 2012Full manuscript submission: 25 Oct. 2012
Notice of full manuscript acceptance: 5 Dec, 2012
Final manuscript submission: 15 Dec., 2012Last date of Registration for
Pre-Conference 20 Dec., 2012
Regist rat ion
Registration can be made by filling up the
registration form available at CMTI official websiteand sending the same to the organizing secretary.
Payment may be made in the form of DD/ Pay
Order, payable to CMTI at Bangalore. DD/ Payorder may kindly be Chairman: Mr. B.R.Satyan,
Director, CMTI posted to P.V. Shashikumar,
Joint Director, Central ManufacturingTechnology Institute (CMTI), Tumkur Road,
Bangalore - 560022
E-mail: [email protected].
Website : www.cmti-india.net
selective sorbent for the removal of 137Cs from
acidic nuclear waste solution T. J. Tranter, R. S.
Herbst, T. A. Todd, A. L. Olson, H. B. Eldredge.
Advances in Environmental Research, Volume
6, Issue 2, March 2002, Pages 107-121
3. Evaluation of polymer inclusion membranes
containing crown ethers for selective cesium
separation from nuclear waste solution. P.K.
Mohapatra, D.S. Lakshmi, A. Bhattacharyya,
V.K. Manchanda , Journal of Hazardous
Materials, Volume 169, Issues 1-3, 30 September
2009, Pages 472- 479.
4. Selective extraction of cesium ion with
calix[4]arene crown ether through thin sheet
supported liquid membranes. Journal of
Membrane Science, Volume 187, Issues 1-2,
15 June 2001, Pages 3-11J. K. Kim, J. S. Kim,
Y. G. Shul, K. W. Lee, W. Z. Oh.

B A R C N E W S L E T T E RB A R C N E W S L E T T E RFEATURE ARTICLE
ISSUE NO. 327 I JULY - AUGUST 2012 I 31ISSUE NO. 327 I JULY - AUGUST 2012 I 31
Performance Study of Indigenously Developed
CsI-Photodiode Linear Array Detectors for
X-Ray Baggage Scanning Application
Anita Topkar, Arvind Singh, P.K.Mukhopadhyay and C.K.Pithawa
Electronics Division
and
Umesh Kumar and Lakshminarayana Y.
Isotope Application Division
Abstract
Linear array detectors with 16-element PIN photodiode coupled to a 16 element CsI array of geometry matching
to the photodiode elements has been indigenously developed. These arrays have been characterized at various
X-ray intensities by varying the current and voltage setting of the X-ray source and by incorporating Cu, Al and
SS filters in the path of X-rays. The results of the performance tests confirm the suitability of the detectors for X-ray
baggage scanning applications.
Introduction
Silicon PIN photodiode coupled to scintillator are
used for several research applications involving
measurement of energy of high energy charged
particles and photons. Nowadays, these detectors
are being increasingly used for X-ray imaging
systems for security inspection, industrial
tomography, and medical applications. For example,
modern X-ray baggage scanning systems and
container scanning systems use linear array detectors
made of suitable scintillators coupled to a silicon
photodiode array. In a solid-state detector for X-ray
detection, a p–i–n (PIN) photodiode is used as a
photosensor of visible light from the scintillator.
Scintillator coupled photodiode detectors allow
compact detector systems operating at a much
lower voltage compared to their counterpart,
scintillator-PMT type of detectors. Commercially
available detectors used for such applications
incorporate segmented scintillators with dimensions
suitable with the corresponding photodiode
elements. It is possible to use scintillators of different
atomic number, density and element length, which
allows operation in the energy range from about
100 keV to 9MeV X-ray/LINAC based systems.
Cesium iodide (CsI) and cadmium tungstate (CdWO4)
are the most commonly used scintillators in these
detectors.
Electronics Division, BARC has developed the
technology for the fabrication of PIN photodiodes
using a 4" integrated circuit processing facility [1].
The performance of these photodiodes for γ-ray
spectroscopy was also demonstrated by coupling
to CsI scintillator [2]. As a next step, 16-element
linear array detectors suitable for X-ray baggage
scanning applications have been developed. In this
article, we present detailed experimental results of
the detector response to the incident X-rays for
different X-ray intensities.
Design and Fabrication Technology
The fabricated and packaged photodiode array is
shown in (Fig.1).
The design of photodiode has been carried out to
have geometries similar to those for commercially
available photodiode array detectors for baggage
scanning applications. The photodiode mask for
fabrication of silicon wafers was designed to
incorporate 16 elements with element geometry of
2.5 mm x 2.15 mm and element pitch of 2.5mm.
A four layer mask defining p+ implant, contact,

B A R C N E W S L E T T E RRESEARCH ARTICLE
B A R C N E W S L E T T E RFEATURE ARTICLE
32 I ISSUE NO. 327 I JULY - AUGUST 201232 I ISSUE NO. 327 I JULY - AUGUST 2012
metal and passivation layers has been used for
fabrication of these photodiodes. The 16 –element
photodiode arrays have been fabricated using a
custom technology derived from integrated circuit
technology. High purity silicon wafers (resistivity >
3 kΩm-cm) have been used as a starting material.
Processes used for integrated circuit fabrication such
as silicon oxidation, ion implantation, aluminum
metallization, lithography, etc, have been used for
fabrication of photodiodes. For the PIN photodiode,
it is important to make p-layer as shallow as possible.
In order to achieve shallow junction, the optimum
conditions of ion implantation such as dose and
energy, thickness of SiO2 screen oxide and implant
annealing conditions have been used. The fabrication
process was tuned to realize photodiodes with very
low dark currents of about 10 pA/element (with
element area – 5.375 mm2). The capacitance per
element was about 50 pF at 10 mV bias. Low dark
currents are essential to reduce the electronic noise
of the photodiodes. The fabrication process is
schematically shown in the flow chart in (Fig. 2.)
After completion of wafer processing, the wafers
are diced and the individual arrays are packaged on
ceramic substrates. The contact to each element is
provided by wire bonding using a 25 μm diameter
aluminum wire. Before coupling to scintillator, dark
current of each element of the photodiode array
has been measured to ensure that the dark currents
of all elements are low and are uniform. The
measurements with light were also carried out to
measure the responsivity and to check the uniformity
of optical response. The optical response was
observed to be uniform and showed a responsivity
of 0.41 A/W at 630 nm wavelength.The
photodiode array has been optically coupled to a
16-element CsI scintillator array. The thickness of
the scintillator array was chosen for 140 keV X-ray
Fig. 1: Fabricated and packaged 16-element
photodiode array
Fig. 2: Process flow for fabrication of photodiodes

B A R C N E W S L E T T E RB A R C N E W S L E T T E RFEATURE ARTICLE
ISSUE NO. 327 I JULY - AUGUST 2012 I 33ISSUE NO. 327 I JULY - AUGUST 2012 I 33
operation. (Fig. 3) shows the picture of 16-element
CsI coupled photodiode array. The overall dimension
of the packaged array is 4.8 cm x 2.0 cm. The pixel
size of CsI matches with the corresponding element
of photodiode (2.5 mm x 2.15 mm). The pixels of
CsI are separated by a separator to prevent cross
talk. The photodiodes have been tested for dark
current after coupling to scintillator to verify that
there is no significant degradation of electrical
performance during the process of gluing the CsI to
photodiodes. The typical dark currents of each pixel
before and after coupling to CsI at a reverse voltage
of 10 mV are as shown in (Fig. 4). The mean value
and spread of the per-coupling dark current and
post-coupling dark current are 8.2 pA 1.3 pA and
8.7 pA ± 1.5 pA respectively.
Experimental setup for measurement of
detector response with X-rays
The measurement of linear array detector response
has been obtained by using an X-ray beam impinging
on the scintillator. During the measurements, the
detector and the readout electronics were enclosed
in a lead box. (Fig. 5) shows the experimental
arrangement. Fig. 6 shows the detector along with
electronics for simultaneous measurement of current
in 16 channels. The lead box was designed to have
a collimator on the front face to expose only the 16
element scintillator. Two types of measurements
were performed:
a) An electrometer has been used to measure the
current generated in the photodiode elements. The
electrometer provides a voltage output proportional
to the current under measurement (10 mV/nA).
The electrometer was located at a close distance
with the photodiode array and the voltage output
was measured using a high end DMM outside the
X-ray source room.
b) Simultaneous measurement of response of all 16
elements using a 16-channel current to voltage
converter (Gain of 106 V/Amp or 1 mV/nA), S/H
and analog multiplexer. The analog multiplexer
provides serial output of all 16 channels after a
Fig. 3: CsI coupled photodiode linear array
Fig. 4: Dark current for 16 elements before and after
coupling CsI to photodiode
Fig. 6: Detector with electronics for simultaneous
measurement of current in 16 elements
Fig. 5: Experimental arrangement for testing the
detector with X-ray source

B A R C N E W S L E T T E RRESEARCH ARTICLE
B A R C N E W S L E T T E RFEATURE ARTICLE
34 I ISSUE NO. 327 I JULY - AUGUST 201234 I ISSUE NO. 327 I JULY - AUGUST 2012
trigger signal. The X-ray response has been studied
for 80 keV, 100 keV and 140 keV X-ray tube settings
and for currents of 4 mA, 6 mA and 8 mA.
Detector response with X-rays
The response of the CsI-photodiode array to X-rays
at three different energies (80 keV, 100 keV and
140 keV) and different current settings (4 mA,
6 mA and 8 mA) is as shown in (Fig.7) (a), (b) and
(c) respectively. The elements are numbered from
left to right in these figures and subsequent figures.
As expected, the current generated in the elements
and therefore the output voltage increases as the
energy and current of the X-ray tube is increased.
The last element (No 16) was not exposed completely
through the collimator and therefore shows reduced
response compared to other 15 elements. The X-ray
intensity increases linearly with current. Hence, it is
expected that the current generated in the
photodiodes would scale accordingly when the
current is increased from 4 mA to 6 mA or 8 mA at
a particular voltage setting. The actual output voltage
observed at 4 mA and 6 mA at 140 keV and the
expected output voltage calculated from the 8 mA/
140 keV data is plotted in (Fig.8). As can be seen
there is good agreement in the calculated and the
experimentally observed data.
The X-ray intensity varies as a square of X-ray tube
voltage. Hence if the tube voltage is changed from
80 keV to 100 keV, it is expected that the output
voltage will increase by a factor of 1.5625 (= (100/
80)2). Therefore the experimentally observed data
for 100 keV should show an increase by a factor of
1.5625 when compared to the data obtained at
80 keV. Similarly, it is expected that the measured
output voltages at 140 keV should scale by a factor
of 3.0625 compared to the output voltages at
80 keV.
Fig. 9 shows the comparison of the output voltages
for each element at 100 keV and 140 keV. The data
obtained at 80 keV is scaled by a factor of 1.5625
for 100 keV data and by a factor of 3.0625 for
140 keV data. As can be seen, the actually observed
element voltages are in close agreement with the
estimated element voltages. The element to element
variation of the output voltage for three different
current settings of X-ray tube (4 mA, 6 mA and
8 mA) is shown in Fig.10. As can be seen the output
response is quite uniform within elements. The
experimentally observed variation is within ~±7.5%,
which is acceptable.
Fig. 7: Typical Output voltage at
(a) 80 keV/4 mA, 8 mA,
(b) 100 keV/4 mA, 8 mA,
(c) 140 keV/4 mA, 6 mA, 8mA

B A R C N E W S L E T T E RB A R C N E W S L E T T E RFEATURE ARTICLE
ISSUE NO. 327 I JULY - AUGUST 2012 I 35ISSUE NO. 327 I JULY - AUGUST 2012 I 35
The linearity of the output response for a current
setting between 0.5 mA to 8 mA was verified by
measuring the individual element response. For this
purpose, the element was connected to an
electrometer and the output voltage proportional
to current was measured by setting the electrometer
at a fixed range. The output voltage of the
electrometer for the fixed gain was
10 mV/nA. The individual element voltages are
plotted at a X-ray tube setting of 0.5 mA to 8 mA at
140 keV (Fig. 11).
The plot shows that the measured variation of output
response is linear with the X-ray intensity in the
current range of 0.5 mA to 8 mA. The output voltage
vs current shows a linear behavior with coefficient
of determination (R2) between 0.9984-0.9999,
where R is coefficient of correlation. The elements
at the edges show higher output compared to other
elements as they also collect the charge in the guard
ring region.
The attenuation of X-rays and consequently detection
of transmitted photons has been studied by using
different filters. The measured output voltage in each
element for different filters in the path (Al, SS and
Cu) and without filters is as shown in Fig.12. The
mean value of the output voltage and the spread
are: (i) No filter, 1.1 V ± 0.2 V, (ii) Al filter, 0.86 V ±0.12 V, (iii) SS filter, 0.57 V ± 0.09 V and (iv) Cu
filter, 0.45 V ± 0.04 V
The X-ray tube settings for these measurements were
140keV, 8mA. As expected the attenuation is more
as the atomic number (Z) of the element is increased
and therefore the output voltage in each element
decreases as the filters are changed from Al to SS
and to Cu.
Fig. 8: Comparison of calculated and experimentally
obtained values of output voltage
Fig. 9: Experimentally obtained output voltages at
(i)100 keV,8 mA, (ii)140 keV, 8 mA and calculated
voltages from 80 keV, 8 mA data
Fig. 10: Output response variation from element to
element for 140V/4mA, 6mA, 8mA setting
Fig. 11: Variation of output voltage of each
element for different X-ray current settings at
140 keV

B A R C N E W S L E T T E RRESEARCH ARTICLE
B A R C N E W S L E T T E RFEATURE ARTICLE
36 I ISSUE NO. 327 I JULY - AUGUST 201236 I ISSUE NO. 327 I JULY - AUGUST 2012
Summary
16-element CsI coupled photodiode linear array
detectors suitable for X-ray baggage scanning
applications have been indigenously developed. The
X-ray performance of the CsI coupled photodiode
detector has been studied using an X-ray source at
BARC for different X-ray tube setting of 140 keV,
100 keV and 80 keV and for the current setting of
4 mA, 6 mA and 8 mA. The output voltage shows
an expected dependence on tube voltage and
current, i.e. linear dependence on current and square
dependence on voltage. The total observed variation
from element to element was within ±7.5%. This
variation includes several factors such variation in
photodiode, scintillator, optical coupling, etc. The
linearity of the response was checked over a current
range from 0.5 mA to 8 mA at 140 keV. All elements
show a linear dependence on current in this range.
The performance study of the CsI-photodiode linear
array detector with X-rays confirm the applicability
of these detectors for X-ray baggage scanning
applications. The technology developed for these
arrays will be suitable for developing detectors for
NDT applications such as X-ray tomography and
security inspection system applications.
Acknowledgements
The authors would like to thank Shri G P Srivastava,
Director, E&IG, Shri R K Patil, Associate Director
(C), E&IG, Dr Gursharan Singh, Associate Director
(I), RC&IG and Head, IAD for their support in carrying
out this work. The authors are also thankful to Mrs
Shruti Bhalekar, SA/E and Shri Bhavani P Singh,
SA/D for their help in carrying out the experiments.
References
1. “Indigenous Development of Silicon PIN
Photodiodes Using a 4” Integrated Circuit
Processing Facility”, Anita Topkar, Arvind Singh,
Bharti Aggarwal, C.K. Pithawa and A S Rawat,
BARC NewsLetter, Issue No. 318 Jan - Feb 2011,
p 34-38.
2. S.G. Singh, Arvind Singh, Anita Topkar and S.C.
Gadkari, “Performance of indigenously
developed CsI(Tl)-photodiode detector for
gamma-ray spectroscopy”, AIP Conference
Proceedings, 1349, (2011) p 481-482.
Fig. 12: Variation of output voltage of each element
for no filter and with different filters

B A R C N E W S L E T T E RB A R C N E W S L E T T E RFEATURE ARTICLE
ISSUE NO. 327 I JULY - AUGUST 2012 I 37ISSUE NO. 327 I JULY - AUGUST 2012 I 37
Marx Generator and Reflex Triode based
High Power Pulsed Microwave Source
Archana Sharma, Amitava Roy, Sabyasachi Mitra,
Vishnu Sharma, S. Singh, Senthil Kumar,
Ankur Patel, Rakhee Menon, Ritu Agrawal,
A.K. Ray and D.P. Chakravarthy
Accelerator and Pulse Power Division
Abstract
A compact repetitive Marx generator and a High Power Microwave (HPM) source based on a matched reflex triode
has been developed and tested. The Marx generator rated at 1 kJ, 300 kV, 12 kA, 10 Hz, is suitable to drive the
reflex triode directly. Bipolar charging of the Marx generator has been used to get lower system inductance and
consequently faster output rise time with relatively low charging voltage. Inductive charging of the Marx generator
capacitors using a capacitor charging power supply has been used to make the system repetitive and enhance the
system efficiency as compared to resistive charging. The Marx generator has been characterized using aqueous
resistive load and the reflex triode vircator. Experiments have been conducted using the Marx generator and reflex
triode system to generate intense relativistic electron beams and high power microwaves.
Introduction
High power pulsed sources have been employed
for applications such as high power microwave
(HPM) generation [1, 2], flash radiography [FXR]
[3], and ion implantation for material modifications
etc. Since 1970, BARC has indigenously developed
many pulsed power systems such as KALI-75,
KALI-200, KALI-1000, and KALI-5000 to generate
intense relativistic electron beams for plasma heating
and HPM generation experiments. (KALI is
abbreviation of “Kilo Ampere Linear Injector”). HPM
sources based on pulsed power systems are being
used for applications in plasma heating, particle
acceleration, high-power radar, and many other
industrial and defense related fields. All the above
mentioned ‘KALI’ systems are single shot systems.
Marx generators are the most commonly used pulsed
power sources. They are generally used in single
shot devices for generating high voltages. Presently,
there is a growing interest in the development of
compact, repetitive pulsed power systems based on
Marx generators for HPM generation. The
compactness of Marx generator with its ability to
operate in repetitive pulsed mode has enhanced its
appeal, when coupled directly to reflex triode, for
HPM generation. It can be operated in both, positive
and negative output polarities to drive reflex triode
as well as axial and coaxial vircators. The Marx
generator has the advantages of higher peak power
rating, repetitiveness, compactness, low cost and
reliability in comparison with the conventional pulse
power systems such as pulse-forming networks
(PFN), Tesla based systems and FCG generators.
The reflex triode is a member of the virtual cathode
oscillator (vircator) family of narrow band radiation
sources. Compared to other high power microwave
sources like relativistic magnetrons, klystrons and
Magnetically Insulated Line Oscillator (MILO), the
vircator has a number of advantages like simple
geometry, ease of operation and maintainence, does
not need external magnetic field and virtually has
no limit in power level of operation. A 1 kJ, 300 kV,
300 ns Marx generator and reflex triode have been
developed for the generation of high intensity, high
power electron beams and HPM.

B A R C N E W S L E T T E RRESEARCH ARTICLE
B A R C N E W S L E T T E RFEATURE ARTICLE
38 I ISSUE NO. 327 I JULY - AUGUST 201238 I ISSUE NO. 327 I JULY - AUGUST 2012
System Description
The block diagram of a typical High Power
Microwave system based on Marx generator is
shown in Fig.1.
It consists of a high voltage dual capacitor charging
power supply with negative and positive polarity
outputs rated ± 40kJ/s, Marx generator rated 1 kJ,
300 kV, 300 ns, 10 Hz, nitrogen gas supply system,
spark gap based fast closing switch (peaking switch),
reflex triode, vacuum system and control and trigger
circuits. The trigger circuit based on IGBT switch
and pulse transformer provides 10 kV pulse output
to the first sparkgap switch of Marx Generator. The
control circuit apart from setting charging voltage
and repetition rate also provides synchronization of
the charging and trigger circuit during repetitive
operation. Pulsed high voltages and currents are
measured using aqueous CuSO4 voltage divider
(3000:1) and a self integrating Rogowski coil
(10V/kA), respectively. High power microwave
diagnostic systems based on receiving horn antenna
and B dot probe are used to measure the radiated
power and frequency.
1 kJ Marx Generator
A typical Marx generator scheme is shown in Fig.
2. Depending on the output voltage requirement,
the Marx generator consists of a number of
capacitors (C0) charged in parallel to a voltage
V0, through the charging resistor ( R) and discharged
in series through the spark gaps (S). The discharge
Fig.1: Block Diagram of a typical HPM system based on Marx Generator
Fig.2: A typical Marx Generator scheme

B A R C N E W S L E T T E RB A R C N E W S L E T T E RFEATURE ARTICLE
ISSUE NO. 327 I JULY - AUGUST 2012 I 39ISSUE NO. 327 I JULY - AUGUST 2012 I 39
is generally initiated by triggering the first one or
more spark gaps by an external source. As a
consequence the remaining gaps get over volted
thus causing self breakdown. Such series discharge
is generally referred to as erection of the Marx
generator. The output closing switch (SC) is used
to isolate the load while charging the Marx, and to
ensure full Marx erection before energy is transferred
to the load.
Resistive charging results in a large charging time
and low repetition rate as compared to inductive
type of charging of the capacitors [4]. Therefore in
order to be able to operate at a repetition rate of
10Hz, the Marx generator was built with capacitor
stages isolated by inductors and not resistors. During
operation, as discussed above, the first switch (S1)
is triggered, resulting in increase in the voltage across
the remaining switches (S), causing a chain reaction
of self-triggering. The six stages Marx generator is
assembled from 12 capacitors (0.15μF, 50 kV each),
12 charging and isolating inductors (Lc+, Lc-, Lg:
100 μH each) and 6 SS spark gaps [5, 6]. Fig. 3
shows the circuit diagram of the bipolar- and
inductive-charging Marx generator.
The Marx generator configuration is based on bipolar
charging to reduce the number of spark gaps as
compared to unipolar charging, and also to have
minimum possible inductance per stage. In bipolar
Marx generator, half of the capacitors are connected
to positive charging terminal and rest half are
connected to the negative charging terminal through
inductors. Connections are made such that all the
capacitors get connected in series via spark gap
switches during erection and discharge.
A photograph of the internal assembly of Marx
generator is shown in Fig.4. Two stage prototypes
of the Marx assembly were fabricated initially and
experiments conducted to arrive at a layout which
would provide lesser erected inductance and faster
output voltage rise time. In the final assembly, the
capacitors were mounted on 50 mm thick perspex
sheets and sled into a SS chamber of 0.6 m inner
diameter and length of 2 m. The Marx chamber
was pressurized by nitrogen gas upto a maximum
pressure of 3kg/cm2. The assembled Marx generator
with the closing switch and reflex triode is shown
Fig.3: Circuit diagram of the bipolar charging Marx generator
Fig.4: Internal assembly of Marx generator

B A R C N E W S L E T T E RRESEARCH ARTICLE
B A R C N E W S L E T T E RFEATURE ARTICLE
40 I ISSUE NO. 327 I JULY - AUGUST 201240 I ISSUE NO. 327 I JULY - AUGUST 2012
in the Fig.5. A fast (charging time: about 25ms)
capacitor charging power supply was used to charge
the Marx generator to a maximum voltage of 40 kV
and at a maximum repetition of 10 Hz for burst
mode operation.
Reflex Triode and HPM diagnostics
The reflex triode is a vacuum diode to generate
intense electron beams by explosive electron
emission process [7, 8]. It is housed inside a
400 mm dia. four way SS vacuum cylindrical
chamber. An additional chamber is used to house
the aqueous voltage divider and the Rogowski coil
for measuring the diode voltage and current
respectively. A vacuum pump is connected at the
side port using a SS bellow and L-bend connection.
The vacuum pumping system (Hind High Vacuum
make Model: VS-250 D, capacity: 2000 ltrs/s)
consists of a diffusion pump with liquid nitrogen
trap backed by a rotary pump. A vacuum level of
around 2×10⁻⁵ mbar is maintained in the reflex triode
chamber during operation. Fig.6 shows the front
view of reflex triode with vacuum pumping system.
The vacuum seal on the top port is threaded to
enable easy adjustment of the anode-cathode (AK)
gap. The Marx output is connected to the anode of
the reflex triode. The anode consists of a SS mesh,
having 120 mm diameter and 70% transparency,
fitted into a SS torus. The graphite cathode of
77 mm diameter is grounded.
A receiving horn antenna system consisting of a
wideband ridged horn antenna, flexible ultra low
loss cable (attenuation: 0.21dB/m at 2GHz and
0.26dB/m at 3GHz, length: 25 m), attenuators
(40 dB), fast diode detector and an oscilloscope
(1 GHz, 10 GS/s) is used to measure the peak
radiated power signal. The HPM frequency and
electric field measurement setup consists of a
B-dot probe, flexible ultra low loss cable (25 m
length) and a high band width oscilloscope
(6 GHz,40 GS/s).
System Performance
The Marx generator was tested initially with a
matched 25 ohms aqueous CuSO4 resistive load. The
test results show a good agreement between
estimated and measured parameters. At 12 kV
charging, the measured peak output voltage is 100
kV. The system has been tested both in the negative
and positive output polarity mode in repetitive burst
mode operation and the overlapping waveforms of
the output voltage recorded with 25 ohms CuSO4
load at 10 Hz for 1 second, indicated an excellent
repeatability (Figs. 7a and 7b).
Relativistic intense electron beam and high power
microwave generation studies were conducted using
the Marx generator and reflex triode system [9]. The
AK gap was varied from 8 to 20 mm. It was found
that the microwave power density and E-field peaked
at 15 mm AK gap. Experiments on high power
Fig. 5: Photograph of 1kJ Marx generator with
reflex triode
Fig.6: Front view of reflex triode with vacuum
pumping system
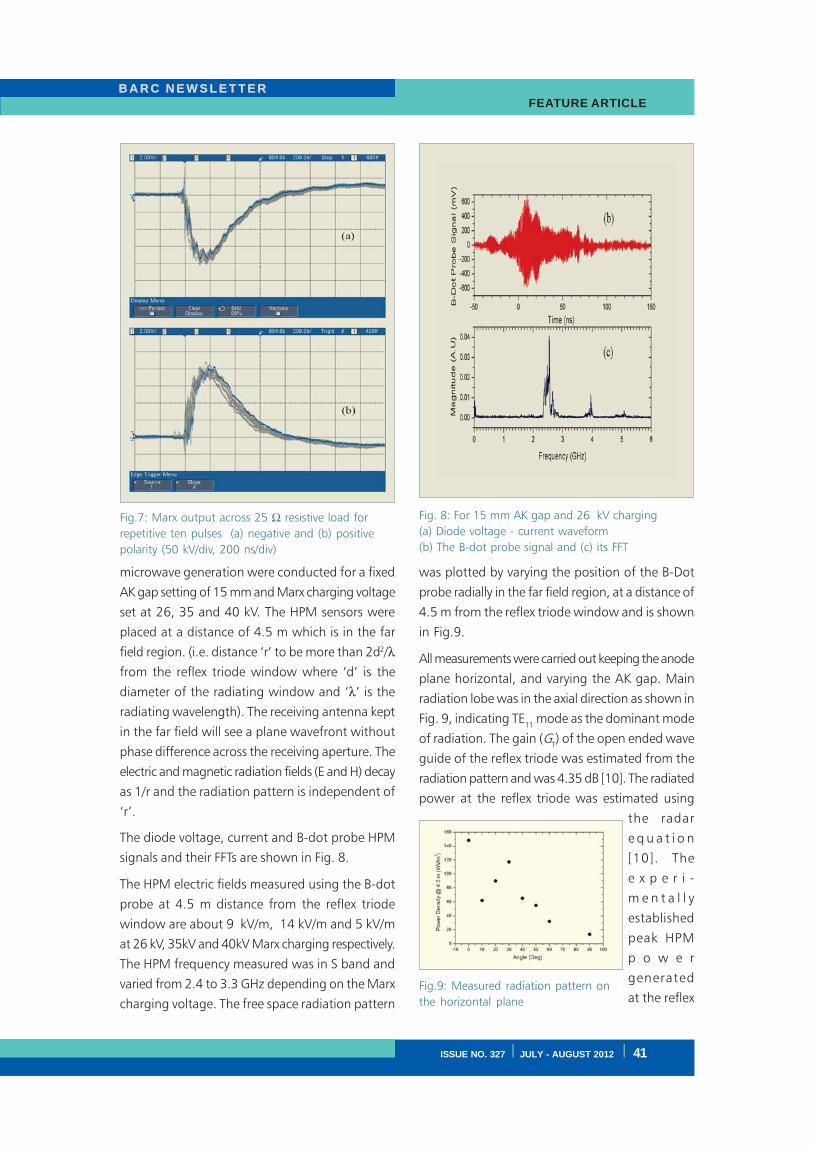
B A R C N E W S L E T T E RB A R C N E W S L E T T E RFEATURE ARTICLE
ISSUE NO. 327 I JULY - AUGUST 2012 I 41ISSUE NO. 327 I JULY - AUGUST 2012 I 41
microwave generation were conducted for a fixed
AK gap setting of 15 mm and Marx charging voltage
set at 26, 35 and 40 kV. The HPM sensors were
placed at a distance of 4.5 m which is in the far
field region. (i.e. distance ‘r’ to be more than 2d2/λfrom the reflex triode window where ‘d’ is the
diameter of the radiating window and ‘λ’ is the
radiating wavelength). The receiving antenna kept
in the far field will see a plane wavefront without
phase difference across the receiving aperture. The
electric and magnetic radiation fields (E and H) decay
as 1/r and the radiation pattern is independent of
‘r’.
The diode voltage, current and B-dot probe HPM
signals and their FFTs are shown in Fig. 8.
The HPM electric fields measured using the B-dot
probe at 4.5 m distance from the reflex triode
window are about 9 kV/m, 14 kV/m and 5 kV/m
at 26 kV, 35kV and 40kV Marx charging respectively.
The HPM frequency measured was in S band and
varied from 2.4 to 3.3 GHz depending on the Marx
charging voltage. The free space radiation pattern
was plotted by varying the position of the B-Dot
probe radially in the far field region, at a distance of
4.5 m from the reflex triode window and is shown
in Fig.9.
All measurements were carried out keeping the anode
plane horizontal, and varying the AK gap. Main
radiation lobe was in the axial direction as shown in
Fig. 9, indicating TE11
mode as the dominant mode
of radiation. The gain (GT) of the open ended wave
guide of the reflex triode was estimated from the
radiation pattern and was 4.35 dB [10]. The radiated
power at the reflex triode was estimated using
the radar
e q u a t i o n
[10]. The
e x p e r i -
m e n t a l l y
established
peak HPM
p o w e r
generated
at the reflex
Fig.7: Marx output across 25 Ω resistive load for
repetitive ten pulses (a) negative and (b) positive
polarity (50 kV/div, 200 ns/div)
Fig. 8: For 15 mm AK gap and 26 kV charging
(a) Diode voltage - current waveform
(b) The B-dot probe signal and (c) its FFT
Fig.9: Measured radiation pattern on
the horizontal plane

B A R C N E W S L E T T E RRESEARCH ARTICLE
B A R C N E W S L E T T E RFEATURE ARTICLE
42 I ISSUE NO. 327 I JULY - AUGUST 201242 I ISSUE NO. 327 I JULY - AUGUST 2012
triode was found to be 20 MW, 48 MW and
6.4 MW for charging voltages of 26 kV, 35 kV and
40 kV respectively at a fixed AK gap of 15 mm. The
sudden drop in the microwave power at 40 kV
charging voltage is attributed to the impedance
mismatch between the Marx generator and the
electron beam diode.
Conclusions
A compact repetitive high power pulsed microwave
source based on a 1 kJ Marx generator and a reflex
triode has been designed, developed and tested.
The Marx generator has been tested in the repetitive
mode with a matched resistive load and shows good
repeatability. Subsequently, it has been used to drive
a reflex triode for HPM generation. HPM has been
generated by varying the anode-cathode gap of the
reflex triode from 8 to 20 mm and charging voltages
from 26 to 40 kV. The radiated HPM peak powers
and electric fields have been measured using a
diagnostic setup based on receiving horn antenna
and B-dot probe. A maximum estimated peak
power of 48 MW has been obtained at the reflex
triode for 15 mm AK gap spacing and charging
voltage of 35 kV. The radiated frequency was in the
S band ranging from 2.4 GHz to 3.3 GHz. The
radiation pattern indicated TE11
as the dominant
mode of radiation.
Acknowledgement
The authors thank Dr. L. M. Gantayet, Director,
Beam Technology Development Group, BARC for
his constant encouragement and support. The
authors would also like to thank Shri N.Lawangare,
Shri S.P.Vaity and Shri S.G.Patil of APPD for their
technical support.
References
1. E. H. Choi et al., “High-power microwave
generation from an axially extracted virtual
cathode oscillator,” IEEE Trans. Plasma Sci. 28,
(2000): 2128-2134.
2. S. H. Gold and G. S. Nusinovich, “Review of
high-power microwave source research,
Rev. Sci. Instrum. 68, (1997): 3945-3974.
3. Rakhee Menon, Amitava Roy, S. Mitra, A.
Sharma, J. Mondal, K. C. Mittal, K. V. Nagesh,
and D. P. Chakravarthy, “Generation and dose
distribution measurement of flash x-ray in KALI-
5000 system,” Rev. Sci. Instrum. 79, (2008):
103301.
4. J. Lehr and C. Baum, “Charging of Marx
Generators”, Circuit and Electromagnetic
System Design Notes, Note 43, Air Force
Research Laboratory, Directed Energy
Directorate, 29 June 2000.
5. A. Sharma, V. Sharma, D. D. P. Kumar, S. Mitra,
K. Senthil, K. V. Nagesh, D. P. Chakravarthy,
and A. K. Ray, “Experimental results on design
aspects of a compact repetitive Marx generator,”
in Proc. IEEE Pulse Power Conference, Jun. 28,
2009.
6. Archana Sharma, Senthil Kumar, Sabyasachi
Mitra, Vishnu Sharma, Ankur Patel, Amitava
Roy, Rakhee Menon, K. V. Nagesh, and D. P.
Chakravarthy, “Development and
Characterization of Repetitive 1-kJ Marx-
Generator-Driven Reflex Triode System for High-
Power Microwave Generation,” IEEE Trans.
Plasma Sci. 39, (2011): 1262- 1267.
7. J. Benford, J. A. Swegle, and E. Schamiloglu,
High Power Microwaves, Second Edition, Taylor
& Francis, 2007. ISBN 0-750-30706-4.
8. G.A. Mesyats, Pulsed Power (Kluwer Academic/
Plenum Publishers, New York, 2005), ISBN
0-306-48653-9.
9. Amitava Roy, Archana Sharma, Sabyasachi
Mitra, Rakhee Menon, Vishnu Sharma, K. V.
Nagesh, and D. P. Chakravarthy, “Oscillation
Frequency of a Reflex-Triode Virtual Cathode
Oscillator,” IEEE Trans. Electron Devices 58,
(2011): 553 – 561.
10. Limin Li, Lie Liu, Guoxin Cheng, Qifu Xu, Hong
Wan, Lei Chang, and Jianchun Wen, “The
dependence of vircator oscillation mode on
cathode material,” J. Appl. Phys. 105, (2009):
123301.

ISSUE NO. 327 I JULY - AUGUST 2012 I 43ISSUE NO. 327 I JULY - AUGUST 2012 I 43
B A R C N E W S L E T T E RB A R C N E W S L E T T E R NEWS & EVENTS
The technology of “LASCAN DIA-GAUGE” has been
developed by Laser & Plasma Technology Division,
BARC. This technology use optical technique which
is simple, cost effective and accurate. It is based on
the beam scanning principle. It uses low power Laser
diode as light source. The beam intensity and
collimation properties of Laser are useful in design
of the system while its wavelength (670nm) is useful
during alignment. The instrument can measure the
diameters of transparent as well as opaque object
in the range of 1mm to 25mm with an accuracy of
±5 micron. No warm up time required. The software
offers facility for selection of samples by setting
diameter range of user’s interest. Its microcontoller
based circuit calculates and displays diameter upto
3rd decimal place in mm on LCD.
The know-how has been transferred to M/s Kraft
Engineers, Mumbai on 22nd March, 2012.
“Lascan Dia Gauge” technology
Technology Transfers from BARC
Photograph after signing the agreement with M/s Kraft Engineers, Mumbai, seen from left to right
Smt. S. S. Murudkar, TT&CD, Shri V. K. Upadhyay, TT&CD, Dr. S. P. Kale, Head, TT&CD, Smt. Varsha Mehta &
Shri Hasit Mehta, Director “Rollotech Systems Pvt Ltd”, Dr. A. K. Das, Head, L&PTD, Dr. A. S. Rawat, L&PTD,
Dr. S. S. Thattey, Head, LE&AS, L&PTD, Shri. N. O. Kawade, L&PTD.
The know-how of the following three water related technologies were transferred toM/s Mahavir Pumps Manufacturing Pvt. Ltd., Kolkata on 28th March, 2012.
i) On-line domestic water purifier based on
ultrafiltration polysulfone membrane”
technology.
The technology of “On-line domestic water purifier”
has been developed by Desalination Division, BARC.
This device is based on polysulfone type of
ultrafiltration membrane, which coated on a unique
cylindrical configuration. This device on connecting
to domestic tap purifies the domestic water with
respect to microorganism, colour, odour, suspended

B A R C N E W S L E T T E RRESEARCH ARTICLE
B A R C N E W S L E T T E RNEWS & EVENTS
44 I ISSUE NO. 327 I JULY - AUGUST 201244 I ISSUE NO. 327 I JULY - AUGUST 2012
solids and organics. It is very effective as it removes
bacteria to the extent of > 99.99% (4 log scale) &
removes complete turbidity and produces crystal
clear water. This device does not need electricity or
addition of any chemical. It is almost maintenance
free except occasional cleaning of suspended solids
which deposit on membrane surface and this does
not take more than few minutes.
It produces about 40 liters of pure water per day at
about 5 psig head and works from 5 psig to 35
psig. The device filters out bacteria, no dead bacteria
in the final filtered water. (All the raw materials
required are produced within the country and are
available locally).
ii) “Membrane Assisted Defluoridation Process
for Safe Drinking Water” technology:
The technology of “Membrane Assisted
Defluoridation Process for Safe Drinking Water” has
been developed by Desalination Division. The
ultrafiltration membrane assisted sorption process
for removal of fluoride from ground/surface water
provide safe drinking water and solves the serious
problem of aluminium contamination in the product
water coming after defluoridation unit, which is more
harmful than fluoride. The process provides safe
drinking water not only free from fluoride but also
free from secondary contaminants like aluminium
and microorganisms. It can be adopted at both
domestic and community level with/without the use
of electricity.
iii) “UF Membrane Assisted Device for removal
of Iron from contaminated water for drinking
purposes” technology:
The technology of “UF Membrane Assisted Device
for removal of Iron from contaminated water for
drinking purposes” has been developed by
Desalination Division. Iron is not considered
hazardous to human health in moderate levels. In
fact, iron is essential for good health because it
facilitates transportation of oxygen in blood.
However, when the level of iron in water exceeds
0.3 mg/l (ppm) limit, people experience red, brown,
or yellow staining of laundry, glassware, dishes and
household fixtures such as bathtubs and sinks. The
water may also have a metallic taste and an offensive
odour. Consumption of water with excess iron
Photograph after signing the agreement with M/s Mahavir Pumps Manufacturing Pvt. Ltd., Kolkata,
seen from left to right Shri B. K. Pathak, Head, IPMS, TT&CD, Shri Susil Teewari, MTS, DD, Dr. P. K. Teewari, Head,
DD, Dr. S. P. Kale, Head, TT&CD, Shri Praveen Kumar Poddar, Director, M/s Mahavir Pumps Manufacturing Pvt.
Ltd., Kolkata, Shri D. Goswami, Head, MTS, DD, Dr. R. C. Bindal, Head, MDS, DD, Shri Soumitra Kar, MDS, DD,
Shri V. K. Upadhyay, TT&CD.
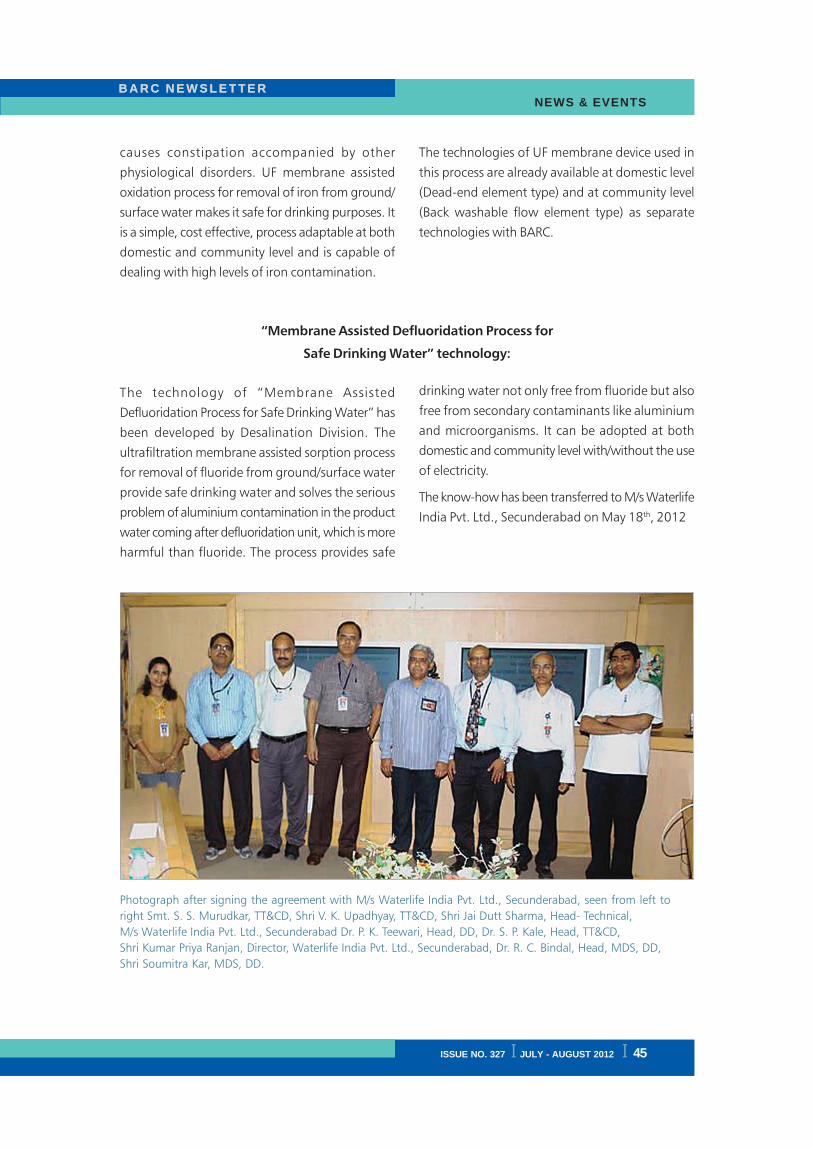
ISSUE NO. 327 I JULY - AUGUST 2012 I 45ISSUE NO. 327 I JULY - AUGUST 2012 I 45
B A R C N E W S L E T T E RB A R C N E W S L E T T E R NEWS & EVENTS
causes constipation accompanied by other
physiological disorders. UF membrane assisted
oxidation process for removal of iron from ground/
surface water makes it safe for drinking purposes. It
is a simple, cost effective, process adaptable at both
domestic and community level and is capable of
dealing with high levels of iron contamination.
The technologies of UF membrane device used in
this process are already available at domestic level
(Dead-end element type) and at community level
(Back washable flow element type) as separate
technologies with BARC.
“Membrane Assisted Defluoridation Process for
Safe Drinking Water” technology:
Photograph after signing the agreement with M/s Waterlife India Pvt. Ltd., Secunderabad, seen from left to
right Smt. S. S. Murudkar, TT&CD, Shri V. K. Upadhyay, TT&CD, Shri Jai Dutt Sharma, Head- Technical,
M/s Waterlife India Pvt. Ltd., Secunderabad Dr. P. K. Teewari, Head, DD, Dr. S. P. Kale, Head, TT&CD,
Shri Kumar Priya Ranjan, Director, Waterlife India Pvt. Ltd., Secunderabad, Dr. R. C. Bindal, Head, MDS, DD,
Shri Soumitra Kar, MDS, DD.
The technology of “Membrane Assisted
Defluoridation Process for Safe Drinking Water” has
been developed by Desalination Division. The
ultrafiltration membrane assisted sorption process
for removal of fluoride from ground/surface water
provide safe drinking water and solves the serious
problem of aluminium contamination in the product
water coming after defluoridation unit, which is more
harmful than fluoride. The process provides safe
drinking water not only free from fluoride but also
free from secondary contaminants like aluminium
and microorganisms. It can be adopted at both
domestic and community level with/without the use
of electricity.
The know-how has been transferred to M/s Waterlife
India Pvt. Ltd., Secunderabad on May 18th, 2012

B A R C N E W S L E T T E RRESEARCH ARTICLE
B A R C N E W S L E T T E RNEWS & EVENTS
46 I ISSUE NO. 327 I JULY - AUGUST 201246 I ISSUE NO. 327 I JULY - AUGUST 2012
BRNS-AEACI Third School on Analytical Chemistry
(SAC-3): a Report
Third School on Analytical Chemistry (SAC-3)
sponsored by the Board of Research in Nuclear
Sciences (BRNS) was jointly organized by Association
of Environmental Analytical Chemistry of India
(AEACI) and Department of Chemistry,
Sri Krisnadevaraya University (SKU) at, SKU,
Anantapur, Andhra Pradesh during February
24 – March 01, 2012. A total of 60 young
academics, research scholars form Universities and
budding scientists from different DAE units
participated in this school. The inaugural function
was held at Phule Bhavan, S.K. University on 24th
February 2012 and Prof. Buddanna, Principal, SKU
presided over the inaugural function. Prof. K.
Ramakrishna Reddy, Vice Chancellor, S.K. University
inaugurated the school. Dr. T. Mukherjee, Director,
Chemistry Group, BARC and Chairman, National
Advisory Committee, SAC delivered the key note
address. Prof. T. Sreenivasulu Reddy, Convenor, Local
Organising Committee, SAC-3 welcomed the guests
and the participants. Dr. A.V.R. Reddy, Chairman,
Technical Committee, SAC and Head, Analytical
Chemistry Division, BARC explained the theme of
the school and spoke on the importance of practical
training and continuous education that SAC aims
to provide. He stressed that the SAC’s provide a
good opportunity for both the participants and the
resource persons to learn from each others’
experience and expertise thus facilitating collective
growth of the analytical chemistry fraternity.
Prof. Ramakrishna Reddy, Vice Chancellor in his
presidential address expressed his happiness to be
associated with SAC-3 and spoke on the importance
of Chemistry, and particularly analytical chemistry.
Later, he released a practical book entitled
“Experiments in Analytical Chemistry” authored by
A.V.R. Reddy, K.K. Swain and K. Venkatesh.
Dr. Mukherjee in his keynote address emphasised
the importance of Good Laboratory Practices in
generating high quality and reliable analytical data.
(L-R) Prof. Buddanna, Dr. A.V.R. Reddy, Dr. T. Mukherjee, Prof. K. Ramakrishna Reddy, Prof. T. Sreenivasulu Reddy
and Prof. L.K. Ravindranath at the book release event

ISSUE NO. 327 I JULY - AUGUST 2012 I 47ISSUE NO. 327 I JULY - AUGUST 2012 I 47
B A R C N E W S L E T T E RB A R C N E W S L E T T E R NEWS & EVENTS
He stressed that due attention must be paid to safety
and safe practices while carrying out laboratory work.
Prof. L.K. Ravindranath, Secretary, Local Organising
Committee proposed a vote of thanks.
The school schedule consisted of lectures in the
morning sessions and laboratory experiments in the
post-lunch sessions. The morning lecture sessions
provided the participants a platform to listen to
lectures delivered by eminent people in the field of
analytical chemistry. The topics covered were QA/
QC, accreditation, neutron activation analysis,
environmental monitoring & remediation,
chromatographic techniques, thermal analysis,
spectrophotometric techniques like ICP-OES & AAS,
Electroanalytical techniques and elemental
speciation in analytical chemistry. Lectures were
delivered on statistical treatment of data and use of
spreadsheets in analytical chemistry. Additionally,
three special lectures on; ‘Mass Spectrometry and
Applications’ by Prof.(retd.) C.D. Reddy, S. V.
University, Tirupati, ‘Exploration Techniques for
Atomic Minerals and Future Strategies’ by Dr. P.S.
Parihar, Director, AMD and ‘Transition from
Laboratory reactions to Industrial Production’ by Shri
S.K. Ghosh, Director, Chemical Engineering Group,
BARC were arranged.
The participants had hands-on training on five
experiments that were carried out in five batches on
rotation basis. The experiments were (1) Multi
element determination using absorption
spectrometry, (2) Thermal studies of oxalates,
(3) Determination of toxic elements by cyclic
voltammetry, (4) Analysis of gaseous samples and
particulate matter for environmental monitoring and
(5) Analysis of COD, BOD & fluoride in waters and
waste water sample. Besides demonstration
experiments on HPLC, IR spectroscopy and Bomb
calorimeter, the laboratory experiments generated a
lot of interest among the participants, S.K. University
scholars and also the local press.
On the penultimate day of the school, seminar
presentations by each of the five experimental groups
were held. ‘Frontiers in analytical chemistry’ was
the general theme for seminar presentations and a
topic was assigned to each group three days earlier.
The seminar gave a unique opportunity to the
participants to work collectively in groups with
diverse knowledge and experience which was a
mutually benefiting experience. One member from
each group delivered the seminar and the remaining
members participated in the lively Q & A session
after the seminar presentation. On the final day of
the school an objective type written examination
on the topics covered during the school was held
for the participants and all the participants have done
reasonably well. In an interactive feedback session,
participants expressed their views and most of them
felt that the lectures were excellent and the
laboratory experiments were arranged thoughtfully.
They also felt that smaller groups for laboratory
experiments would have been better.
Valedictory function held on March 01, 2012
and Prof. Rajarami Reddy, Vice Chancellor,
V. S. University, Nellore was the chief guest and
was chaired by Prof. P.L.N. Reddy, Coordinator, Sai
Baba College, Anantapur and former EC member,
S.K. University. Prof. T.S. Reddy welcomed all to the
valedictory function. Dr. A.V.R. Reddy gave the gist
of the technical feedback and thanked the organizers
for conducting the School. Prof. Ramakrishna Reddy
in his presidential address appreciated the efforts of
local organisers and profusely thanked AEACI, BRNS
and BARC for conducting the School in S.K.
University. Prof. Rajarami Reddy explained the
importance of Analytical Chemistry and the possible
impact of such a School. Prof L.K. Ravindranath
gave a gist of the feedback. Awards were given to
the best group seminar presentation and to the top
five rankers in the written examination by Shri P.L.N.
Reddy. He also distributed participation certificates.
Shri K. Venkatesh, BARC proposed a vote of thanks.
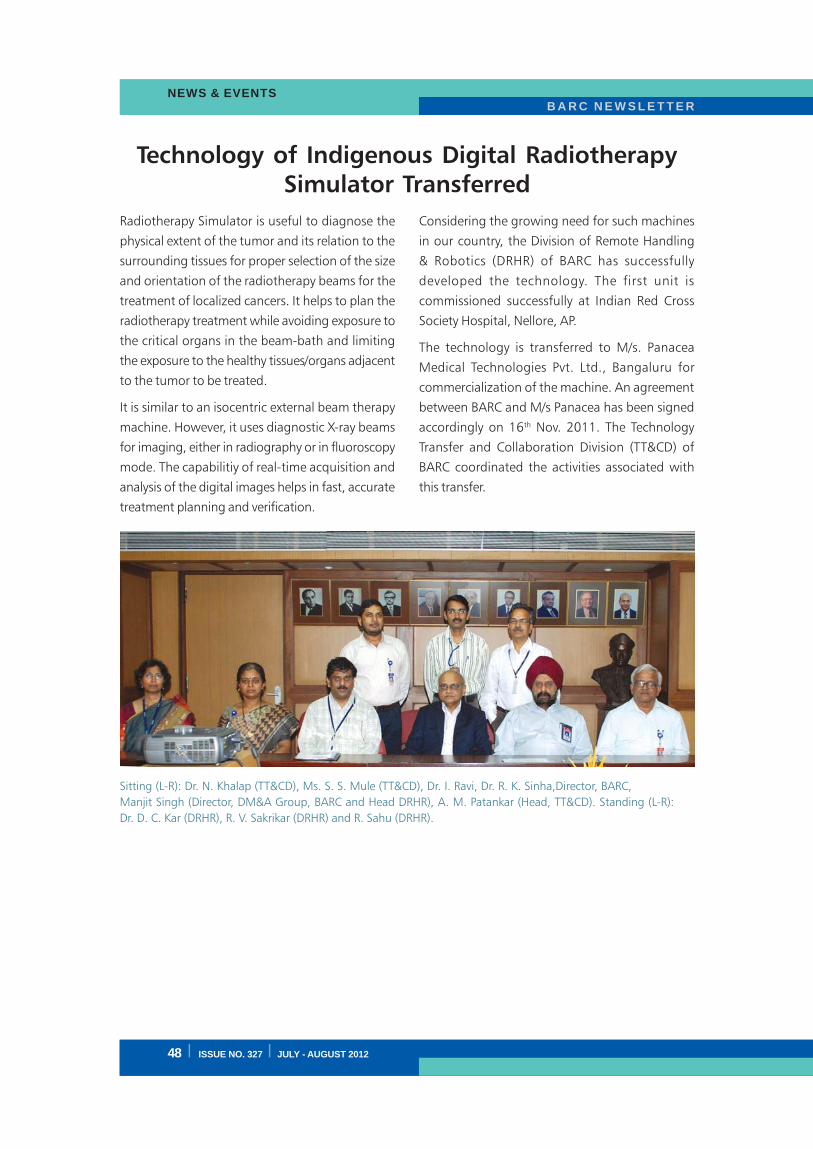
B A R C N E W S L E T T E RRESEARCH ARTICLE
B A R C N E W S L E T T E RNEWS & EVENTS
48 I ISSUE NO. 327 I JULY - AUGUST 201248 I ISSUE NO. 327 I JULY - AUGUST 2012
Technology of Indigenous Digital Radiotherapy
Simulator Transferred
Radiotherapy Simulator is useful to diagnose the
physical extent of the tumor and its relation to the
surrounding tissues for proper selection of the size
and orientation of the radiotherapy beams for the
treatment of localized cancers. It helps to plan the
radiotherapy treatment while avoiding exposure to
the critical organs in the beam-bath and limiting
the exposure to the healthy tissues/organs adjacent
to the tumor to be treated.
It is similar to an isocentric external beam therapy
machine. However, it uses diagnostic X-ray beams
for imaging, either in radiography or in fluoroscopy
mode. The capabilitiy of real-time acquisition and
analysis of the digital images helps in fast, accurate
treatment planning and verification.
Sitting (L-R): Dr. N. Khalap (TT&CD), Ms. S. S. Mule (TT&CD), Dr. I. Ravi, Dr. R. K. Sinha,Director, BARC,
Manjit Singh (Director, DM&A Group, BARC and Head DRHR), A. M. Patankar (Head, TT&CD). Standing (L-R):
Dr. D. C. Kar (DRHR), R. V. Sakrikar (DRHR) and R. Sahu (DRHR).
Considering the growing need for such machines
in our country, the Division of Remote Handling
& Robotics (DRHR) of BARC has successfully
developed the technology. The first unit is
commissioned successfully at Indian Red Cross
Society Hospital, Nellore, AP.
The technology is transferred to M/s. Panacea
Medical Technologies Pvt. Ltd., Bangaluru for
commercialization of the machine. An agreement
between BARC and M/s Panacea has been signed
accordingly on 16th Nov. 2011. The Technology
Transfer and Collaboration Division (TT&CD) of
BARC coordinated the activities associated with
this transfer.

ISSUE NO. 327 I JULY - AUGUST 2012 I 49ISSUE NO. 327 I JULY - AUGUST 2012 I 49
B A R C N E W S L E T T E RB A R C N E W S L E T T E R NEWS & EVENTS
Graduation Day Function of the BARC Training
School; a Report
The Graduation Day function of OCES 2011 and
OCDF 2011 batches of the BARC Training School,
Mumbai, was held on 30th July, 2012 at the Central
Complex Auditorium, BARC. 115 Graduates from
12 science and engineering disciplines received the
OCES certificates along with 18 graduates of the
OCDF stream.
The Chief Guest for the function was His Excellency
Shri M.K.Narayanan, Hon’ble Governor of West
Bengal. The function was presided over by Dr
R.K.Sinha, Secretary DAE and Chairman AEC.
Shri Sekhar Basu, Director BARC delivered the
welcome address in which he reminded the trainees
about the great training school legacy going back
55 years and asked them to put in their best effort
in the years to come. Dr R.K.Sinha, in his presidential
address brought out the challenges and opportunities
that the Department provides for these young trainees
and wished them success in their future endeavours.
Shri M.K. Narayanan in his address traced the journey
of DAE and the important role it has to play in the
years to come- both in the energy and strategic
sectors.
The first rankers in each of the 13 disciplines were
conferred the prestigious Homi Bhabha Prize, which
comprises a Homi Bhabha Medal, a certificate and
a cash prize. The medals and certificates were
received by the proud recipients at the hands of the
Chief Guest. All OCES and OCDF trainees went on
to receive the Graduation Certificates at the hands
of Director, BARC.
Mementoes were presented to the Chief Guest by
Chairman. AEC and Director, BARC.
Dr. R.R.Puri, Head HRDD and Dean, HBNI delivered
the vote of thanks in which he emphasised upon
the stellar role of the training school faculty in
carrying forward the great tradition of the BARC
training school. He took the opportunity to thank
all wings of the BARC administration whose support
is invaluable in carrying out the programs of the
BARC Training School.
The National Anthem was rendered by the gathering
to bring the event to an end.
His Excellency Shri M.K.Narayanan, Hon’ble Governor
of West Bengal. addressing at the function
First rankers in each of the 13 disciplines with the Chief Guest His Excellency Shri M.K.Narayanan, Hon’ble
Governor of West Bengal. To his right: Shri Sekhar Basu, Director BARC, left: Dr R.K.Sinha, Secretary DAE and
Chairman AEC, Dr. R.R.Puri, Head HRDD and Dean, HBNI.
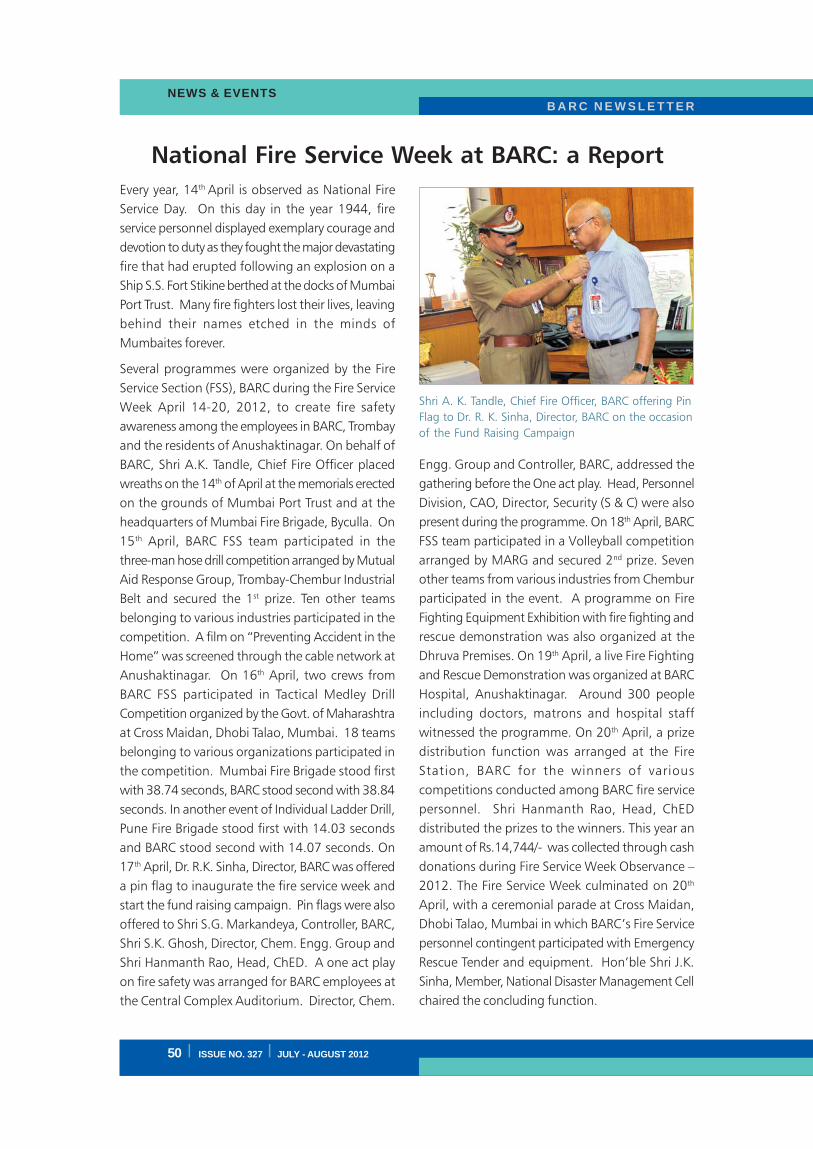
B A R C N E W S L E T T E RRESEARCH ARTICLE
B A R C N E W S L E T T E RNEWS & EVENTS
50 I ISSUE NO. 327 I JULY - AUGUST 201250 I ISSUE NO. 327 I JULY - AUGUST 2012
National Fire Service Week at BARC: a Report
Every year, 14th April is observed as National Fire
Service Day. On this day in the year 1944, fire
service personnel displayed exemplary courage and
devotion to duty as they fought the major devastating
fire that had erupted following an explosion on a
Ship S.S. Fort Stikine berthed at the docks of Mumbai
Port Trust. Many fire fighters lost their lives, leaving
behind their names etched in the minds of
Mumbaites forever.
Several programmes were organized by the Fire
Service Section (FSS), BARC during the Fire Service
Week April 14-20, 2012, to create fire safety
awareness among the employees in BARC, Trombay
and the residents of Anushaktinagar. On behalf of
BARC, Shri A.K. Tandle, Chief Fire Officer placed
wreaths on the 14th of April at the memorials erected
on the grounds of Mumbai Port Trust and at the
headquarters of Mumbai Fire Brigade, Byculla. On
15th April, BARC FSS team participated in the
three-man hose drill competition arranged by Mutual
Aid Response Group, Trombay-Chembur Industrial
Belt and secured the 1st prize. Ten other teams
belonging to various industries participated in the
competition. A film on “Preventing Accident in the
Home” was screened through the cable network at
Anushaktinagar. On 16th April, two crews from
BARC FSS participated in Tactical Medley Drill
Competition organized by the Govt. of Maharashtra
at Cross Maidan, Dhobi Talao, Mumbai. 18 teams
belonging to various organizations participated in
the competition. Mumbai Fire Brigade stood first
with 38.74 seconds, BARC stood second with 38.84
seconds. In another event of Individual Ladder Drill,
Pune Fire Brigade stood first with 14.03 seconds
and BARC stood second with 14.07 seconds. On
17th April, Dr. R.K. Sinha, Director, BARC was offered
a pin flag to inaugurate the fire service week and
start the fund raising campaign. Pin flags were also
offered to Shri S.G. Markandeya, Controller, BARC,
Shri S.K. Ghosh, Director, Chem. Engg. Group and
Shri Hanmanth Rao, Head, ChED. A one act play
on fire safety was arranged for BARC employees at
the Central Complex Auditorium. Director, Chem.
Engg. Group and Controller, BARC, addressed the
gathering before the One act play. Head, Personnel
Division, CAO, Director, Security (S & C) were also
present during the programme. On 18th April, BARC
FSS team participated in a Volleyball competition
arranged by MARG and secured 2nd prize. Seven
other teams from various industries from Chembur
participated in the event. A programme on Fire
Fighting Equipment Exhibition with fire fighting and
rescue demonstration was also organized at the
Dhruva Premises. On 19th April, a live Fire Fighting
and Rescue Demonstration was organized at BARC
Hospital, Anushaktinagar. Around 300 people
including doctors, matrons and hospital staff
witnessed the programme. On 20th April, a prize
distribution function was arranged at the Fire
Station, BARC for the winners of various
competitions conducted among BARC fire service
personnel. Shri Hanmanth Rao, Head, ChED
distributed the prizes to the winners. This year an
amount of Rs.14,744/- was collected through cash
donations during Fire Service Week Observance –
2012. The Fire Service Week culminated on 20th
April, with a ceremonial parade at Cross Maidan,
Dhobi Talao, Mumbai in which BARC’s Fire Service
personnel contingent participated with Emergency
Rescue Tender and equipment. Hon’ble Shri J.K.
Sinha, Member, National Disaster Management Cell
chaired the concluding function.
Shri A. K. Tandle, Chief Fire Officer, BARC offering Pin
Flag to Dr. R. K. Sinha, Director, BARC on the occasion
of the Fund Raising Campaign

ISSUE NO. 327 I JULY - AUGUST 2012 I 51ISSUE NO. 327 I JULY - AUGUST 2012 I 51
B A R C N E W S L E T T E RB A R C N E W S L E T T E R NEWS & EVENTS
Release of BARC Logo and Launching of an
Enhanced Website for BARC: a Report
On 10th August, 2012, Shri Sekhar Basu, Director,
BARC released a logo for BARC and also launched
the BARC website in its new, enhanced version. The
event was organized by the Scientific Information
Resource Division, (SIRD), BARC. Speaking on the
occasion, the Director said, that the release of
‘BARC Logo’ was a historic moment for all of us in
BARC. He also that it was a matter of great pride to
have a unique identity for BARC which symbolizes
the whole spectrum of it’s R & D activities, it’s
mandate and objectives. He acknowledged the
contribution of Dr. R. K. Sinha, Chairman, AEC who
was closely associated with the development of the
logo through various stages. He described the
significance of every component of the logo.
He also felicitated the faculty of the Industrial
Design Centre, IIT Bombay, Mumbai for designing
the BARC logo. He thanked everyone who was
involved in making the logo a reality, including SIRD,
which coordinated the entire activity. He called
upon all the scientific community to extensively
use the logo in
their presentations
in National and
International fora.
Shri G. P. Srivastava,
Director, E & I Group,
BARC welcomed the
gathering. In his
welcome address, he
said that a logo creates
a long lasting
impression on people,
expresses the aims and
objectives of the
organization and
provides a point of
recognition to all the
people working in the
organization. He concluded by saying that releasing
of the BARC logo was a moment to be cherished in
the history of BARC.
Shri S. G. Markandeya, Controller, BARC made a
presentation on how the logo could be used on
letterheads, visiting cards, identity cards, Power Point
presentations, vehicles, stationary items etc. He also
presented certificates to the three shortlisted finalists
of the BARC logo design competition which was
organized by SIRD.
Dr. K. Bhanumurthy, Head, SIRD, gave an overview
of the enhanced BARC Website with various special
features such as the AHWR Critical Facility, R&D
activities, Public Awareness Programmes, Visitors
Corner, Students Corner, Career opportunities in
BARC etc. Shri Manoj Singh, SIRD proposed the
vote of thanks.
Shri Sekhar Basu, Director, BARC, speaking on the occasion of the BARC logo
release and launching of enhanced BARC website

B A R C N E W S L E T T E RRESEARCH ARTICLE
B A R C N E W S L E T T E RNEWS & EVENTS
52 I ISSUE NO. 327 I JULY - AUGUST 201252 I ISSUE NO. 327 I JULY - AUGUST 2012
A two-day symposium on “Nuclear Energy and
Development of Country (NEDC – 2012)” was
organized by the BARC Employee’s Association,
Tarapur (BARCEAT) in association with the Board of
Research in Nuclear Sciences (BRNS), Mumbai on
25th and 26th of August, 2012. The aim was to
spread awareness about Nuclear energy and its
applications with an objective to enlighten the
people at Tarapur, with the different areas in which
nuclear energy is being used for the benefit of
society. BARCEAT has already taken a lead in
involving Heads of local villages (Sarpanch),
Principals and educationists from local schools and
colleges apart from senior employees of the DAE
family to further this aim. Shri. S. Basu, Director
BARC inaugurated the symposium in the presence
of Dr. G.J. Prasad, Director, Nuclear Fuels Group,
Shri Ravindranath, Site Director, Tarapur Maharashtra
Site, Md. Afzal, Director GSO and Head, AFFF, Shri
H.T. Raut, President BARCEAT, and Shri J.H. Raul,
General Secretary BARCEAT. Director BARC
appreciated the efforts of BARCEAT in educating
the villagers / society about the usefulness of nuclear
energy for societal benefits and the safety precautions
being taken during all operations. About 600
delegates participated in the deliberations.
Invited talks from experts in different areas of nuclear
energy were arranged during the symposium.
Considering the participation of villagers, Principals
and educationists from local schools and colleges
almost all the talks were in local language Marathi
as well as in Hindi. Dr. S.K. Malhotra, Head, Public
Awareness Division, DAE, BARC, Mumbai described
the need for nuclear energy for social benefits as
well as for national progress. Dr. Gursharan Singh,
Associate Director, RC & IG elaborated on the
“Societal Applications of Isotope / Radiation
Technology in Industry and Hydrology”. Dr. S.G.
Bhagwat, NABTD, BARC, Mumbai spoke on
Nuclear Energy and Development of Country
(NEDC – 2012): a Report
“Nuclear Techniques in Agriculture”. He briefly
described about the various high yielding and high
insect resistant species of food grains and emerging
utilization of food irradiation technology to increase
the shelf life of various food items like onion and
potato. Dr S.P. Kale, TTCD, BARC, Mumbai spoke
on the various agricultural problems.
Shri V.K. Savarkar, GM, NRB briefed about the energy
security for the country. Dr. S.V. Thakre,
Radiopharmaceuticals Division, discussed about the
production of various radioisotopes required for
nuclear medicine. Dr. Puroshottam Kand, RMC
explained in a very simple language about how
nuclear medicines are good diagnostic tools and
the use of various nuclear medicine for treatment
of certain diseases. Dr. M.S. Daniel, TAPS Hospital
explained about the misconceptions associated with
radiation in a talk on “Health Profile of Employees
of NPCIL – A Retrospective Analysis (1995 – 2010)”.
Shri D.D. Akre and Chandrakant Salunke from TAPS
1 – 4 briefly gave an introduction to application of
nuclear energy for power generation and described
about the safety of the Nuclear power plants at
Tarapur. Shri P.G. Behere, Plant Superintendent, AFFF
described the MOX fuel fabrication at Advanced
Fuel Fabrication Facility, Tarapur. Shri Saurabh Garg
elaborated about IERMON for environmental
radiation monitoring. Dr. N.L. Sonar, TWMP, NRB
explained about various waste management practices
being followed for different types of radioactive
wastes at Tarapur. Dr. Amrit Prakash Superintendent,
Quality control section of AFFF briefly outlined about
Nuclear Energy and Radiation. Shri U.V. Deokar,
Radiation Safety Officer, TWMP described the basic
concepts of Radiation and its measurement /
monitoring.
The symposium concluded with a feedback session
from participants of nearby villages.

B A R C N E W S L E T T E R
ISSUE NO. 327 I JULY - AUGUST 2012 I 1
BARC Scientists Honoured
Name of the Scientist : Sudhakar Srivastava
Nuclear Agriculture & Biotechnology Division,
For his research work in the field of Biological Sciences
Award : NASI Young Scientist Platinum Jubilee Award
Presented at : The National Academy of Sciences, India (NASI) at Allahabad on
Nov. 26, 2011
Name of the Scientists : Sudha Premachandran; Nazir M.Khan, Vikas S.Thakur,
Jyoti Shukla and T.B.Poduval.
Radiation Biology & Health Sciences Division
Title of the paper : Differential immunotoxic effects of ethanol on murine EL-4
lymphoma and normal lymphocytes is mediated through increased
ROS production and activation of p38MAPK.
Award : ABAP Young Scientist Award.
Presented at : International Symposium on Innovations in Free Radical Research
and Experimental Therapeutics (IFRRET-2011) and 5th Annual
Convention of Association of Biotechnology and Pharmacy (ABAP)
held at Coimbatore from December 7-9, 2011
Name of the Scientists : Rohit Shukla, Surender Kumar Sharma, Partha Bannerjee,
Pankaj Deb, T. Prabaharan, Rashmita Das, Basanta Das,
Biswajit Adhikary, Rishi Verma and Anurag Shyam
Energetics & Electromagnetics Division
Title of the paper : Microwave Emission from a AXIAL-Virtual Cathode Oscillation Driven
by Compact Pulsed Power Source
Award : Best Poster Award and a Cash Prize of Rs. 5000/-
Presented at : International Symposium on Vacuum Science & Technology and its
Application for Accelerators -2012, VECC Kolkata, during
15-17 February, 2012.

Edited & Published by:Dr. K. Bhanumurthy,
Head, Scientific Information Resource Division,Bhabha Atomic Research Centre, Trombay, Mumbai 400 085, India
Computer Graphics & Layout: N. Kanagaraj, SIRD, BARCBARC Newsletter is also available at URL:http:www.barc.gov.in
V. R. Chavan
Wooden Art Work