bi survey 14 he - mondoesa emilia · bi survey 14 the world´s largest ... business benefits...
TRANSCRIPT

BI SURVEY 14
The world´s largest survey of business intelligence software users
This document is a specially produced summary
by BARC of the headline results for
QLIK
This document is not to be shared, distributed or reproduced in any way without prior permission of BARC
TH
E

Qlik in THE BI Survey 14
Page 2
Table of contents
THE BI Survey 14 Qlik results overview ......................................................................................... 3
Qlik in THE BI Survey 14................................................................................................................ 5
Introduction ................................................................................................................................ 5
Qlik overview .............................................................................................................................. 5
Qlik customer responses ............................................................................................................ 5
User and use case demographics ............................................................................................... 6
Peer Groups .................................................................................................................................. 8
The KPIs ........................................................................................................................................ 8
Summary ..................................................................................................................................... 56

Qlik in THE BI Survey 14
Page 3
THE BI Survey 14 Qlik results overview
Large international BI vendor
Top ranked Leading
Considered for purchase
Performance satisfaction
Product satisfaction
Customer satisfaction
Business benefits
Project success
Big data analytics
Competitiveness
Recommendation
Cloud BI
Collaboration
Data discovery/visualization
Mobile BI
Operational BI
Visual design standards
Innovation
Query performance
Performance
Vendor support
Implementer support
Project length
Flexibility for the user
Agility
Ease of use
Dashboard vendor
Top ranked Leading
Considered for purchase
Competitiveness
Business benefits
Investment per seat
Investment
Big data analytics
Cloud BI
Data discovery/visualization
Operational BI
Visual design standards
Innovation
Query performance
Performance satisfaction
Performance
Product satisfaction
Project length
Flexibility for the user
Qlik in THE BI Survey 14
Page 4
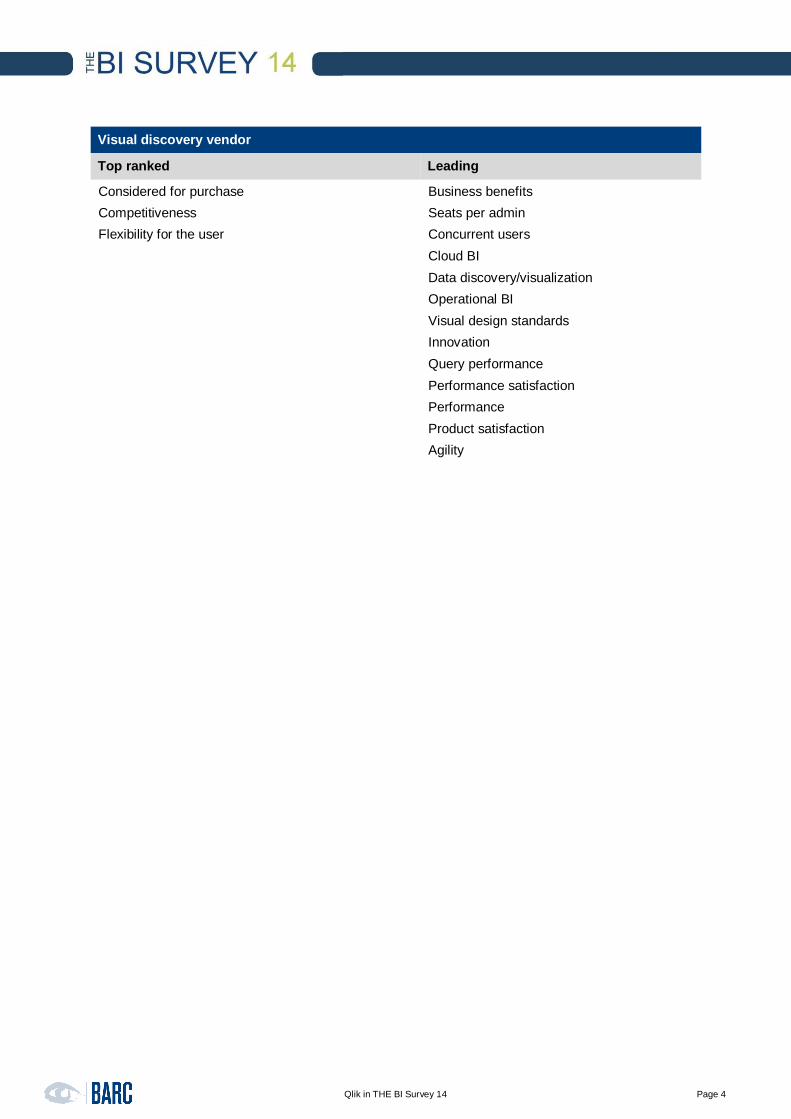
Visual discovery vendor
Top ranked Leading
Considered for purchase
Competitiveness
Flexibility for the user
Business benefits
Seats per admin
Concurrent users
Cloud BI
Data discovery/visualization
Operational BI
Visual design standards
Innovation
Query performance
Performance satisfaction
Performance
Product satisfaction
Agility
Qlik in THE BI Survey 14
Page 5
Qlik in THE BI Survey 14
Introduction
The BI Survey 14 is based on findings from the world's largest and most comprehensive survey of
business intelligence end-users, conducted earlier this year. In total, 3,224 people responded to The
Survey with 2,348 answering a series of detailed questions about their usage of a named product.
Altogether, 34 products (or groups of products) are analyzed in detail.
The BI Survey 14 examines BI product selection and usage among users in areas including business
benefits, costs, proportion of employees using the product, competitiveness, recommendation,
innovation, performance, customer satisfaction and agility.
We asked several questions that helped us measure the business benefits derived from respondents’
deployments. The combined results were then used as a calibration tool – The Business Benefits
Index (BBI) - which is widely used throughout The Survey to assess the correlation between various
factors and the achievement of benefits.
Qlik overview
Founded in 1993, Qlik Technology’s flagship product is the QlikView Business Discovery platform
(QlikView), a solution that delivers what the vendor calls “user-driven business intelligence”—making
data associative, and creating easily-understandable visual relationships across multiple and complex
data sources. The vendor, originally founded in Sweden and now based in the United States, has
been expanding its reach beyond Europe to the rest of the world.
Qlik continues to grow very quickly. The company added 5,000 customers over the past year, and
says it has more than 31,000 customers in 100 countries and $470.5m in revenue in 2013, up 21
percent from the previous year’s $388m and $320m in 2011. Qlik is commonly cited as a competitor
by other vendors covered in The BI Survey.
QlikView is designed to help people bring data sources together to create dynamic visual applications
that can be navigated and searched intuitively, without the need for complex SQL queries. The
solution employs what Qlik refers to as “Natural Analytics” to reflect the way human curiosity searches
and processes information, all within an enterprise context. In July 2014, Qlik, introduced Qlik Sense
Desktop, a free version of its data visualization application, the first commercially available release
from the QlikView.Next project, scheduled to ship in September 2014. Qlik Sense Desktop supports
multiple data sources, including Excel spreadsheets.
Throughout this year’s BI Survey, customers consistently give QlikView high marks for its
dashboarding and visual discovery capabilities. Qlik consistently leads the list, or is rated above
average, in a range of KPIs, including investment value, purchasing considerations, cloud BI,
operational BI, visualization and performance. The vendor also receives high ratings for aggregated
KPIs such as innovation and agility.
Qlik customer responses
This is the sixth year that Qlik features in The BI Survey. It appeared this year with a substantial
sample of 189 users.
Around 88 percent of participants said they were using QlikView 11, with 9 percent on version 10.

Qlik in THE BI Survey 14
Page 6
User and use case demographics
Product usage (n= 189)
Company size (number of employees) (n=188)
Percentage of employees
using Qlik
Qlik 14%
Average of all products
15%
Number of users using Qlik
Median 82
Mean 357
88%
79%
76%
75%
71%
42%
32%
29%
27%
25%
22%
10%
12%
17%
15%
15%
26%
23%
16%
34%
29%
36%
Dashboards
Standard/Enterprise reporting
Ad hoc query
Operational analytics
Visual analysis/Data discovery
Scorecards
Financial consolidation
OLAP analysis
Predictive analytics/Data mining
Budgeting/Planning
Big data analytics
In use Planned
© BARC THE BI Survey 14
9%
57%
34%
Less than 100 100 - 2500 More than2500

Qlik in THE BI Survey 14
Page 7
Type of license model used (n=167)
Proportion of casual and power users (n=189))
QlikView is a dashboard and analysis platform based on in-memory technology which is particularly
suitable for set analysis. The solution offers simplicity, performance and agility and is well positioned
for the self-service BI market.
Customers seem to use the solution for a broad range of applications. The analysis results produced
in QlikView are used in dashboard and reporting applications. More than one-third of BI managers and
professionals also plan to employ QlikView for big data analytics, and about a third indicate they will
likely use the product for predictive data analytics and data mining,
QlikView is most commonly seen in both mid-market and large enterprises, with a majority of users in
companies with 100 to 2,500 employees. The average QlikView site has about 350 users, who are
primarily casual or business users.
75%
13%
11%
2%
0%
Purchased licensesup-front
Part of a bundle
Yearly software fee(on-premise)
Open source
Yearly software fee(cloud solution)
© BARC THE BI Survey 14
75%
25%
Power user
Casual user
Qlik in THE BI Survey 14
Page 8
Peer Groups
The BI Survey features a range of different types of BI tools so we use peer groups to ensure similar
products are compared against each other. The groups are essential to allow fair and useful
comparisons of products that are likely to compete.
The peer groups are primarily data-driven and based on how customers say they use the product.
Qlik features in the following peer groups:
- Large international BI vendors
- Dashboard
- Visual discovery
The KPIs
The BI Survey 14 provides the reader with well-designed KPI dashboards packed with concise
information, which can be absorbed at a glance. The KPIs all follow these simple rules:
- Only measures that have a clear good/bad trend are used as the basis for KPIs
- KPIs may be based on one or more measures from The BI Survey
- Only products with samples of at least 20 - 30 (depending on the KPI) for each of the
questions that feeds into the KPI are included
- Each KPI is normalized so that the overall sample always has a value of 1.0
- The KPIs are calculated so that better-than-average products always have scores of
greater than 1.0, while less good products score less than 1.0. When viewing the peer
group KPI charts, note that the average for each peer group will usually be either higher or
lower than 1.0 because the peer groups are all subsets of the overall sample.
The products are sorted by value: the better the product the higher the value. The average is
displayed as a green bar and separates the products into two groups, those that performed better than
average and those that performed worse than aver-age.
For more details on the KPIs, see our ‘KPIs and Dashboards’ document.

Qlik in THE BI Survey 14
Page 9
Leading large international BI vendor in business benefits
Based on the achievement level of a variety of business benefits
Improving large international BI vendor in business benefits in the past three years
1.22
1.11
1.10
1.08
1.08
1.05
1.03
1.00
0.96
0.96
0.93
0.92
0.82
0.80
0.79
0.77
0.74
Information Builders (1)
Qlik (2)
Oracle Essbase (3)
Microsoft SSAS (4)
Tableau (5)
Tibco (6)
Infor (7)
MicroStrategy (8)
Average
IBM Cognos TM1 (9)
Microsoft SSRS (10)
MS Excel & Power products (11)
Oracle BI Found. Suite (12)
SAP BO WebI (13)
SAP BW (14)
IBM Cognos BI (15)
SAS (16)
Average large international BI vendors peer group
© BARC THE BI Survey 14
1.
2.
3.
4.
5.
6.
7.
8.
9.
10.
11.
12.
13.
14.
15.
16.
2012 2013 2014
Pla
cin
g in
th
e l
arg
e in
tern
ati
on
al B
I ven
do
rs
Information Builders Qlik Oracle EssbaseMicrosoft SSAS Tableau TibcoInfor MicroStrategy IBM Cognos TM1Microsoft SSRS MS Excel & Power Products Oracle BI Found. SuiteSAP BO WebI SAP BW IBM Cognos BISAS
© BARC THE BI Survey 14

Qlik in THE BI Survey 14
Page 10
Leading dashboard vendor in business benefits
Based on the achievement level of a variety of business benefits
Leading visual discovery vendor in business benefits
Based on the achievement level of a variety of business benefits
1.22
1.21
1.16
1.11
1.10
1.10
1.08
1.07
1.05
1.04
1.01
1.00
0.97
0.93
0.82
0.77
Information Builders (1)
Dimensional Insight (2)
arcplan (3)
Qlik (4)
Yellowfin (5)
BOARD (6)
Tableau (7)
Entrinsik (8)
Tibco (9)
Average
Evidanza (10)
MicroStrategy (11)
Pyramid Analytics (12)
Dundas (13)
Oracle BI Found. Suite (14)
IBM Cognos BI (15)
Average dashboard peer group
© BARC THE BI Survey 14
1.12
1.11
1.08
1.08
1.07
1.06
1.05
0.97
Phocas (1)
Qlik (2)
TARGIT (3)
Tableau (4)
Average
Cyberscience (5)
Tibco (6)
Pyramid Analytics (7)
Average visual discovery peer group
© BARC THE BI Survey 14

Qlik in THE BI Survey 14
Page 11
Improving visual discovery vendor in business benefits in the past three years
Qlik is ranked near to top in all of the peer groups in the business benefits KPI, making the vendor and
its product set a leading driver of business value. The ability to employ the solution to enable fast and
intuitive insights into data is clearly a strength that the product brings to decision-makers across
customers’ organizations. Qlik has made significant gains in this area since the last two surveys –
overall, its rank as the international vendor delivering business benefits has jumped from sixth place a
year ago to second place today. It has also vaulted from sixth place to second as a provider of data
discovery tools in a business benefits context.
1.
2.
3.
4.
5.
6.
7.
2012 2013 2014
Pla
cin
g in
th
e v
isu
al d
isco
very
peer
gro
up
Phocas Qlik TARGIT
Tableau Cyberscience Tibco
Pyramid Analytics
© BARC THE BI Survey 14

Qlik in THE BI Survey 14
Page 12
Leading large international BI vendor in project success
Based on the implementation satisfaction level and the frequency of projects completed on time and
on budget
As customers rank Qlik highly in its ability to deliver business benefits, the vendor also ranks above
average in terms of the rate of project success.
1.10
1.10
1.08
1.05
1.03
0.99
0.98
0.96
0.95
0.95
0.94
0.91
0.88
0.83
0.81
0.79
0.75
Information Builders (1)
Tableau (2)
Oracle Essbase (3)
Qlik (4)
Infor (5)
IBM Cognos TM1 (6)
Microsoft SSAS (7)
MicroStrategy (8)
Tibco (9)
Average
Microsoft SSRS (10)
MS Excel & Power products (11)
SAS (12)
IBM Cognos BI (13)
SAP BW (14)
Oracle BI Found. Suite (15)
SAP BO WebI (16)
Average large international BI vendors peer group
© BARC THE BI Survey 14

Qlik in THE BI Survey 14
Page 13
Leading dashboard vendor in investment per seat
Based on median license fees, annual fees and external implementation fees, adjusted by the number
of users
Leading visual discovery vendor in seats per admin
Based on the number of full-time administrators per user
2.17
1.53
1.27
1.15
0.96
0.95
0.70
0.46
Dimensional Insight (1)
MicroStrategy (2)
Qlik (3)
Average
Tableau (4)
arcplan (5)
IBM Cognos BI (6)
BOARD (7)
Average dashboard peer group
© BARC THE BI Survey 14
2.42
1.11
0.91
0.80
0.67
0.56
0.42
0.38
Tibco (1)
Qlik (2)
Average
Cyberscience (3)
TARGIT (4)
Phocas (5)
Tableau (6)
Pyramid Analytics (7)
Average visual discovery peer group
© BARC THE BI Survey 14

Qlik in THE BI Survey 14
Page 14
Leading dashboard vendor in investment
Based on a combination of the ‘Investment per seat’, ‘Seats per administrator’ and 'Price-performance
perception' KPIs
Customers also see QlikView’s ease of use and versatility delivering solid return on investment for
their BI and analytics expenditures. The vendor’s product is seen as an investment that delivers
above-average value.
1.74
1.20
1.10
1.10
1.07
0.92
0.88
0.77
Dimensional Insight (1)
MicroStrategy (2)
Qlik (3)
Average
arcplan (4)
IBM Cognos BI (5)
Tableau (6)
BOARD (7)
Average dashboard peer group
© BARC THE BI Survey 14

Qlik in THE BI Survey 14
Page 15
Leading visual discovery vendor in concurrent users
Based on the average number of concurrent users using the BI tool
While QlikView is usually employed within small to medium-size enterprises, and typically has a
smaller user base (averaging 250 users), customers still give the product high marks in its ability to
support larger numbers of concurrent users.
2.70
1.19
1.05
0.96
0.69
0.69
0.55
0.55
Tibco (1)
Qlik (2)
Average
Pyramid Analytics (3)
TARGIT (4)
Phocas (5)
Cyberscience (6)
Tableau (7)
Average visual discovery peer group
© BARC THE BI Survey 14
Qlik in THE BI Survey 14
Page 16
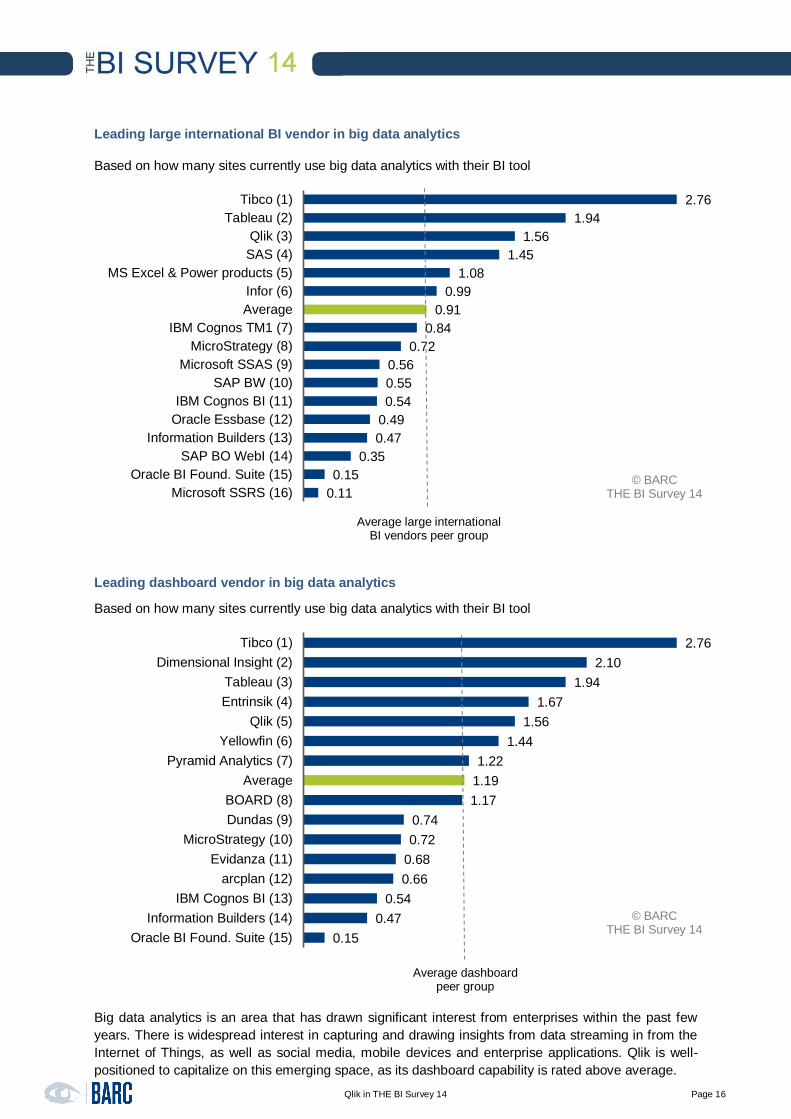
Leading large international BI vendor in big data analytics
Based on how many sites currently use big data analytics with their BI tool
Leading dashboard vendor in big data analytics
Based on how many sites currently use big data analytics with their BI tool
Big data analytics is an area that has drawn significant interest from enterprises within the past few
years. There is widespread interest in capturing and drawing insights from data streaming in from the
Internet of Things, as well as social media, mobile devices and enterprise applications. Qlik is well-
positioned to capitalize on this emerging space, as its dashboard capability is rated above average.
2.76
1.94
1.56
1.45
1.08
0.99
0.91
0.84
0.72
0.56
0.55
0.54
0.49
0.47
0.35
0.15
0.11
Tibco (1)
Tableau (2)
Qlik (3)
SAS (4)
MS Excel & Power products (5)
Infor (6)
Average
IBM Cognos TM1 (7)
MicroStrategy (8)
Microsoft SSAS (9)
SAP BW (10)
IBM Cognos BI (11)
Oracle Essbase (12)
Information Builders (13)
SAP BO WebI (14)
Oracle BI Found. Suite (15)
Microsoft SSRS (16)
Average large international BI vendors peer group
© BARC THE BI Survey 14
2.76
2.10
1.94
1.67
1.56
1.44
1.22
1.19
1.17
0.74
0.72
0.68
0.66
0.54
0.47
0.15
Tibco (1)
Dimensional Insight (2)
Tableau (3)
Entrinsik (4)
Qlik (5)
Yellowfin (6)
Pyramid Analytics (7)
Average
BOARD (8)
Dundas (9)
MicroStrategy (10)
Evidanza (11)
arcplan (12)
IBM Cognos BI (13)
Information Builders (14)
Oracle BI Found. Suite (15)
Average dashboard peer group
© BARC THE BI Survey 14

Qlik in THE BI Survey 14
Page 17
Top ranked large international BI vendor in considered for purchase
Based on whether respondents considered purchasing the product
Top ranked dashboard vendor in considered for purchase
Based on whether respondents considered purchasing the product
3.30
3.17
2.57
2.34
2.34
2.22
1.65
1.64
1.45
1.32
1.29
1.12
1.11
0.83
0.56
0.49
0.49
Qlik (1)
MS Excel & Power products (2)
Microsoft SSAS (3)
Microsoft SSRS (4)
SAP BW (5)
IBM Cognos BI (6)
Tableau (7)
Average
MicroStrategy (8)
SAP BO WebI (9)
IBM Cognos TM1 (10)
Oracle Essbase (11)
Oracle BI Found. Suite (12)
SAS (13)
Infor (14)
Tibco (15)
Information Builders (16)
Average large international BI vendors peer group
© BARC THE BI Survey 14
3.30
2.22
1.65
1.45
1.11
0.91
0.82
0.75
0.49
0.49
0.28
0.26
0.26
0.26
0.23
0.15
Qlik (1)
IBM Cognos BI (2)
Tableau (3)
MicroStrategy (4)
Oracle BI Found. Suite (5)
Average
arcplan (6)
BOARD (7)
Tibco (8)
Information Builders (9)
Pyramid Analytics (10)
Dundas (11)
Yellowfin (11)
Evidanza (13)
Dimensional Insight (14)
Entrinsik (15)
Average dashboard peer group
© BARC THE BI Survey 14

Qlik in THE BI Survey 14
Page 18
Top ranked visual discovery vendor in considered for purchase
Based on whether respondents considered purchasing the product
Qlik is ranked number one at the top of customers’ purchasing intentions. The company pursues a
non-technical marketing and sales strategy that has worked very well and therefore made the vendor
popular in the BI market. As a result, Qlik is the top ranked vendor in the Visual Analysis & Data
Discovery Vendor and Dashboard Vendor peer groups. It is also the leading vendor in the Large
International Vendor peer group for the ‘Considered for purchase’ KPI.
This is an achievement for a considerably smaller vendor operating at the same level as other, very
large vendors and reflects the company’s huge investment in marketing and sales.
3.30
1.65
0.92
0.49
0.28
0.26
0.24
0.23
Qlik (1)
Tableau (2)
Average
Tibco (3)
Pyramid Analytics (4)
Phocas (5)
Cyberscience (6)
TARGIT (7)
Average visual discovery peer group
© BARC THE BI Survey 14

Qlik in THE BI Survey 14
Page 19
Leading large international BI vendor in competitiveness
Combines the ‘Considered for purchase’, ‘Competitive win rate’ and ‘Chosen as standard’ KPIs
Improving large international BI vendor in competitiveness in the past three years
1.78
1.68
1.63
1.52
1.47
1.34
1.21
1.21
1.11
1.10
1.06
1.05
1.04
0.95
0.85
0.83
0.72
MS Excel & Power products (1)
Qlik (2)
Microsoft SSAS (3)
SAP BW (4)
Microsoft SSRS (5)
IBM Cognos BI (6)
Average
SAP BO WebI (7)
Tableau (8)
MicroStrategy (9)
IBM Cognos TM1 (10)
Oracle Essbase (11)
SAS (12)
Oracle BI Found. Suite (13)
Information Builders (14)
Infor (15)
Tibco (16)
Average large international BI vendors peer group
© BARC THE BI Survey 14
1.
2.
3.
4.
5.
6.
7.
8.
9.
10.
11.
12.
13.
14.
15.
16.
2012 2013 2014
Pla
cin
g in
th
e l
arg
e in
tern
ati
on
al B
I ven
do
rs
MS Excel & Power Products Qlik Microsoft SSASSAP BW Microsoft SSRS IBM Cognos BISAP BO WebI Tableau MicroStrategyIBM Cognos TM1 Oracle Essbase SASOracle BI Found. Suite Information Builders InforTibco
© BARC THE BI Survey 14

Qlik in THE BI Survey 14
Page 20
Top ranked dashboard vendor in competitiveness
Combines the ‘Considered for purchase’, ‘Competitive win rate’ and ‘Chosen as standard’ KPIs
Improved dashboard vendor in competitiveness in the past three years
1.68
1.34
1.11
1.10
1.05
0.98
0.95
0.92
0.91
0.86
0.85
0.78
0.75
0.73
0.72
Qlik (1)
IBM Cognos BI (2)
Tableau (3)
MicroStrategy (4)
arcplan (5)
Average
Oracle BI Found. Suite (6)
Pyramid Analytics (7)
Dimensional Insight (8)
BOARD (9)
Information Builders (10)
Dundas (11)
Yellowfin (12)
Evidanza (13)
Tibco (14)
Average dashboard peer group
© BARC THE BI Survey 14
1.
2.
3.
4.
5.
6.
7.
8.
9.
10.
11.
12.
13.
14.
2012 2013 2014
Pla
cin
g in
th
e d
ash
bo
ard
peer
gro
up
Qlik IBM Cognos BI Tableau
MicroStrategy arcplan Oracle BI Found. Suite
Pyramid Analytics Dimensional Insight BOARD
Information Builders Dundas Yellowfin
Evidanza Tibco
© BARC THE BI Survey 14

Qlik in THE BI Survey 14
Page 21
Top ranked visual discovery vendor in competitiveness
Combines the ‘Considered for purchase’, ‘Competitive win rate’ and ‘Chosen as standard’ KPIs
Improving visual discovery vendor in competitiveness in the past three years
Qlik ranks as one of the most competitive vendors in the BI space this year.
For purposes of this survey, Competitiveness is an aggregate of the ‘Considered for purchase’,
‘Competitive win rate’ and ‘Chosen as standard’ KPIs. Here, Qlik scores very highly, either in first or
second place among vendors in this survey. Among dashboard products in particular it has risen
significantly in its regard by customers, from eighth place in 2012 to first place today.
1.68
1.11
1.04
0.99
0.92
0.80
0.72
Qlik (1)
Tableau (2)
Average
Phocas (3)
Pyramid Analytics (4)
TARGIT (5)
Tibco (6)
Average visual discovery peer group
© BARC THE BI Survey 14
1.
2.
3.
4.
5.
6.
7.
2012 2013 2014
Pla
cin
g in
th
e v
isu
al d
isco
very
peer
gro
up
Qlik Tableau Phocas
Pyramid Analytics TARGIT Tibco
© BARC THE BI Survey 14

Qlik in THE BI Survey 14
Page 22
Qlik is competitive in this area due to its agility in sales situations. The sales process is targeted
towards a short proof of concept and can show rapid benefits to the customer. The vendor also uses a
large partner network efficiently, which is an excellent asset for the vendor.
Leading large international BI vendor in recommendation
Based on how many users would recommend the product to others
QlikView benefits from word-of-mouth advertising. It follows closely behind Tableau as the second-
leading BI product most likely to be recommended to others.
1.41
1.37
1.28
1.21
1.08
1.01
0.93
0.86
0.86
0.84
0.76
0.73
0.56
0.47
0.46
0.40
0.32
Tableau (1)
Qlik (2)
Information Builders (3)
Microsoft SSAS (4)
Oracle Essbase (5)
Tibco (6)
IBM Cognos TM1 (7)
MicroStrategy (8)
Average
MS Excel & Power products (9)
SAS (10)
Microsoft SSRS (11)
Infor (12)
IBM Cognos BI (13)
SAP BO WebI (14)
Oracle BI Found. Suite (15)
SAP BW (16)
Average large international BI vendors peer group
© BARC THE BI Survey 14

Qlik in THE BI Survey 14
Page 23
Leading large international BI vendor in cloud BI
Based on how many sites currently use the product in a cloud environment
Leading dashboard vendor in cloud BI
Based on how many sites currently use the product in a cloud environment
1.62
1.45
1.39
1.28
1.00
0.92
0.84
0.82
0.64
0.62
0.61
0.60
0.58
0.50
0.49
0.39
0.23
MS Excel & Power products (1)
Tableau (2)
Qlik (3)
Tibco (4)
SAP BW (5)
Oracle BI Found. Suite (6)
Infor (7)
Average
Microsoft SSRS (8)
SAS (9)
Microsoft SSAS (10)
MicroStrategy (11)
IBM Cognos BI (12)
IBM Cognos TM1 (13)
Oracle Essbase (14)
SAP BO WebI (15)
Information Builders (16)
Average large international BI vendors peer group
© BARC THE BI Survey 14
4.32
1.45
1.39
1.34
1.29
1.28
1.17
1.11
1.02
0.92
0.75
0.69
0.60
0.58
0.55
0.23
Yellowfin (1)
Tableau (2)
Qlik (3)
Dimensional Insight (4)
arcplan (5)
Tibco (6)
Average
Entrinsik (7)
Evidanza (8)
Oracle BI Found. Suite (9)
BOARD (10)
Pyramid Analytics (11)
MicroStrategy (12)
IBM Cognos BI (13)
Dundas (14)
Information Builders (15)
Average dashboard peer group
© BARC THE BI Survey 14

Qlik in THE BI Survey 14
Page 24
Improving dashboard vendor in cloud BI in the past three years
Leading visual discovery vendor in cloud BI
Based on how many sites currently use the product in a cloud environment
1.
2.
3.
4.
5.
6.
7.
8.
9.
10.
11.
12.
13.
14.
15.
2012 2013 2014
Pla
cin
g in
th
e d
ash
bo
ard
peer
gro
up
Yellowfin Tableau Qlik
Dimensional Insight arcplan Tibco
Entrinsik Evidanza Oracle BI Found. Suite
BOARD Pyramid Analytics MicroStrategy
IBM Cognos BI Dundas Information Builders
© BARC THE BI Survey 14 © BARC THE BI Survey 14
1.81
1.45
1.39
1.28
1.14
0.74
0.69
0.64
Phocas (1)
Tableau (2)
Qlik (3)
Tibco (4)
Average
Cyberscience (5)
Pyramid Analytics (6)
TARGIT (7)
Average visual discovery peer group
© BARC THE BI Survey 14
Qlik in THE BI Survey 14
Page 25
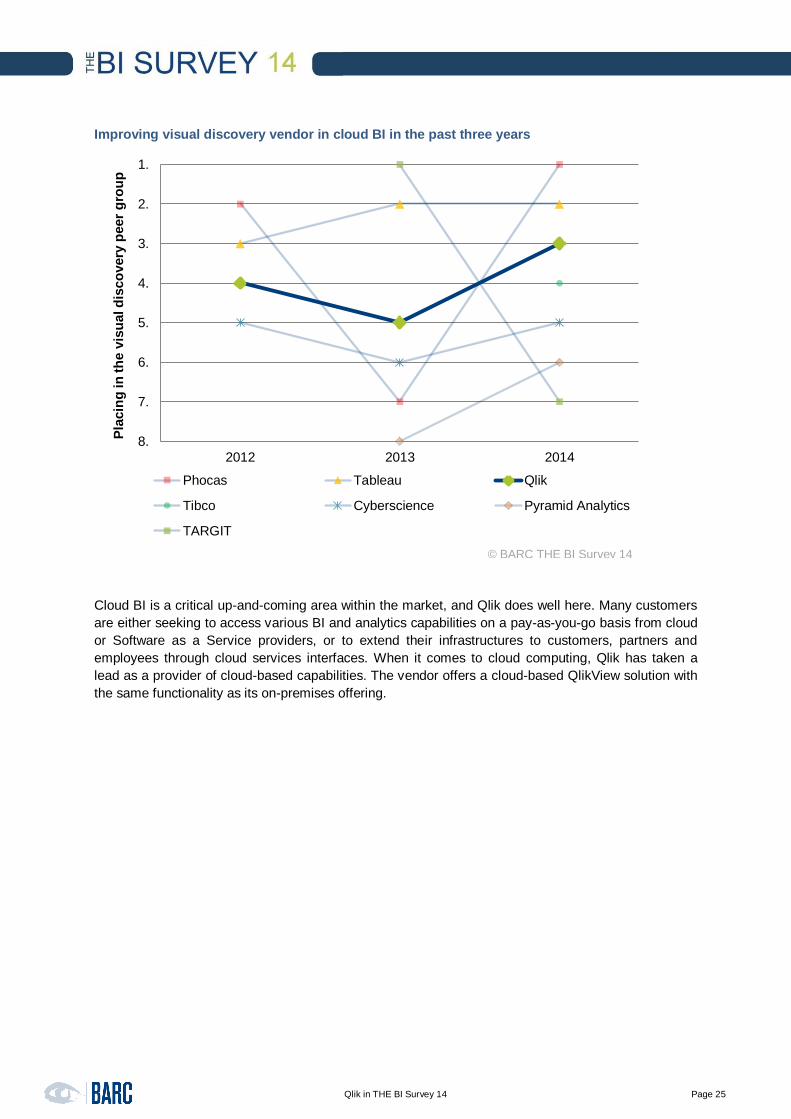
Improving visual discovery vendor in cloud BI in the past three years
Cloud BI is a critical up-and-coming area within the market, and Qlik does well here. Many customers
are either seeking to access various BI and analytics capabilities on a pay-as-you-go basis from cloud
or Software as a Service providers, or to extend their infrastructures to customers, partners and
employees through cloud services interfaces. When it comes to cloud computing, Qlik has taken a
lead as a provider of cloud-based capabilities. The vendor offers a cloud-based QlikView solution with
the same functionality as its on-premises offering.
1.
2.
3.
4.
5.
6.
7.
8.
2012 2013 2014
Pla
cin
g in
th
e v
isu
al d
isco
very
peer
gro
up
Phocas Tableau Qlik
Tibco Cyberscience Pyramid Analytics
TARGIT
© BARC THE BI Survey 14

Qlik in THE BI Survey 14
Page 26
Leading large international BI vendor in collaboration
Based on how many sites currently use collaboration features with their BI tool
When it comes to collaboration, QlikView offers good commenting features, now including workspaces
and collaborative features. Users can use text field or bookmarks to annotate published content.
Customers can also make threaded, chat-like comments
1.74
1.52
1.23
1.22
1.19
1.10
0.95
0.93
0.90
0.82
0.80
0.79
0.74
0.63
0.58
0.37
0.29
Tableau (1)
IBM Cognos TM1 (2)
Tibco (3)
MS Excel & Power products (4)
Qlik (5)
Oracle Essbase (6)
Microsoft SSAS (7)
Average
Information Builders (8)
Microsoft SSRS (9)
MicroStrategy (10)
SAS (11)
Infor (12)
IBM Cognos BI (13)
SAP BW (14)
Oracle BI Found. Suite (15)
SAP BO WebI (16)
Average large international BI vendors peer group
© BARC THE BI Survey 14

Qlik in THE BI Survey 14
Page 27
Leading large international BI vendor in data discovery/visualization
Based on how many sites currently use data discovery/visualization with their BI tool
Leading dashboard vendor in data discovery/visualization
Based on how many sites currently use data discovery/visualization with their BI tool
1.99
1.68
1.62
1.04
0.92
0.91
0.84
0.83
0.75
0.73
0.69
0.66
0.60
0.57
0.57
0.56
0.51
Tableau (1)
Tibco (2)
Qlik (3)
Microsoft SSAS (4)
MS Excel & Power products (5)
Average
Oracle BI Found. Suite (6)
MicroStrategy (7)
Microsoft SSRS (8)
IBM Cognos BI (9)
SAS (10)
SAP BO WebI (11)
Oracle Essbase (12)
SAP BW (13)
Information Builders (14)
IBM Cognos TM1 (15)
Infor (16)
Average large international BI vendors peer group
© BARC THE BI Survey 14
1.99
1.68
1.62
1.58
1.58
1.54
1.32
1.21
1.18
0.97
0.95
0.84
0.83
0.76
0.73
0.57
Tableau (1)
Tibco (2)
Qlik (3)
Pyramid Analytics (4)
Dundas (5)
Yellowfin (6)
Dimensional Insight (7)
Average
Entrinsik (8)
BOARD (9)
arcplan (10)
Oracle BI Found. Suite (11)
MicroStrategy (12)
Evidanza (13)
IBM Cognos BI (14)
Information Builders (15)
Average dashboard peer group
© BARC THE BI Survey 14

Qlik in THE BI Survey 14
Page 28
Leading visual discovery vendor in data discovery/visualization
Based on how many sites currently use data discovery/visualization with their BI tool
Data discovery is one of the strongest aspects of QlikView, and this helps the vendor stand out in
customer ratings. Qlik is highly rated overall as an international vendor in this space, and its
dashboarding and visual discovery features make it one of the top three vendors in this survey.
1.99
1.68
1.62
1.58
1.56
1.55
1.39
1.07
Tableau (1)
Tibco (2)
Qlik (3)
Pyramid Analytics (4)
TARGIT (5)
Average
Cyberscience (6)
Phocas (7)
Average visual discovery peer group
© BARC THE BI Survey 14

Qlik in THE BI Survey 14
Page 29
Leading large international BI vendor in mobile BI
Based on how many sites currently use mobile BI with their BI tool
When it comes to mobile, Qlik continues to invest in its mobile clients. The vendor has also invested in
HTML5 technology for displaying interactive content to users. As a result the mobile device experience
and user interfaces have dictated the way future GUI interfaces will be developed in Qlik. The vendor
also released QlikView for iOS iPad and iPhone app, available in the Apple App Store, which provides
a native user experience for the QlikView AccessPoint portal, while extending and enhancing
QlikView’s HTML5 capabilities for analytics applications.
2.25
1.76
1.35
1.00
0.87
0.86
0.86
0.84
0.83
0.76
0.74
0.57
0.50
0.40
0.28
0.26
0.17
MicroStrategy (1)
Tableau (2)
Qlik (3)
IBM Cognos BI (4)
MS Excel & Power products (5)
Microsoft SSAS (6)
Tibco (7)
Average
SAP BW (8)
Information Builders (9)
Oracle BI Found. Suite (10)
Infor (11)
SAS (12)
IBM Cognos TM1 (13)
SAP BO WebI (14)
Oracle Essbase (15)
Microsoft SSRS (16)
Average large international BI vendors peer group
© BARC THE BI Survey 14

Qlik in THE BI Survey 14
Page 30
Leading large international BI vendor in operational BI
Based on how many sites currently use operational BI with their BI tool
Leading dashboard vendor in operational BI
Based on how many sites currently use operational BI with their BI tool
1.31
1.22
1.21
1.21
1.19
1.16
1.08
1.06
0.99
0.98
0.96
0.86
0.82
0.79
0.68
0.64
0.63
Information Builders (1)
SAP BO WebI (2)
Qlik (3)
Microsoft SSAS (4)
Microsoft SSRS (5)
MicroStrategy (6)
Tableau (7)
IBM Cognos BI (8)
Average
IBM Cognos TM1 (9)
Oracle Essbase (10)
Oracle BI Found. Suite (11)
SAP BW (12)
MS Excel & Power products (13)
Infor (14)
Tibco (15)
SAS (16)
Average large international BI vendors peer group
© BARC THE BI Survey 14
1.31
1.29
1.28
1.21
1.21
1.19
1.16
1.08
1.06
1.06
1.04
1.04
0.86
0.86
0.71
0.64
Information Builders (1)
Dimensional Insight (2)
Pyramid Analytics (3)
Evidanza (4)
Qlik (5)
Yellowfin (6)
MicroStrategy (7)
Tableau (8)
Average
IBM Cognos BI (9)
BOARD (10)
Entrinsik (11)
arcplan (12)
Oracle BI Found. Suite (13)
Dundas (14)
Tibco (15)
Average dashboard peer group
© BARC THE BI Survey 14

Qlik in THE BI Survey 14
Page 31
Leading visual discovery vendor in operational BI
Based on how many sites currently use operational BI with their BI tool
Customers deploy Qlik’s dashboard and visual discovery tools in support of operational BI – in which
insights are derived from data coming directly out of production systems. Many enterprises are looking
for ways to blend archived analytical data within operational data to be able to gain situational
awareness of opportunities or issues impacting their businesses.
1.28
1.25
1.21
1.16
1.08
1.05
0.75
0.64
Pyramid Analytics (1)
TARGIT (2)
Qlik (3)
Cyberscience (4)
Tableau (5)
Average
Phocas (6)
Tibco (7)
Average visual discovery peer group
© BARC THE BI Survey 14

Qlik in THE BI Survey 14
Page 32
Leading large international BI vendor in visual design standards
Based on how many sites currently use visual design standards with their BI tool
Leading dashboard vendor in visual design standards
Based on how many sites currently use visual design standards with their BI tool
1.98
1.61
1.15
1.08
1.00
0.97
0.86
0.80
0.79
0.75
0.75
0.68
0.65
0.50
0.49
0.38
0.24
Infor (1)
Tableau (2)
MS Excel & Power products (3)
Qlik (4)
SAP BW (5)
IBM Cognos BI (6)
Average
Microsoft SSAS (7)
IBM Cognos TM1 (8)
Microsoft SSRS (9)
MicroStrategy (9)
SAP BO WebI (11)
SAS (12)
Tibco (13)
Information Builders (14)
Oracle Essbase (15)
Oracle BI Found. Suite (16)
Average large international BI vendors peer group
© BARC THE BI Survey 14
2.31
1.61
1.35
1.08
0.97
0.78
0.75
0.66
0.60
0.58
0.50
0.49
0.42
0.24
0.12
0.00
Evidanza (1)
Tableau (2)
arcplan (3)
Qlik (4)
IBM Cognos BI (5)
Average
MicroStrategy (6)
BOARD (7)
Pyramid Analytics (8)
Dundas (9)
Tibco (10)
Information Builders (11)
Yellowfin (12)
Oracle BI Found. Suite (13)
Dimensional Insight (14)
Entrinsik (15)
Average dashboard peer group
© BARC THE BI Survey 14
Qlik in THE BI Survey 14
Page 33
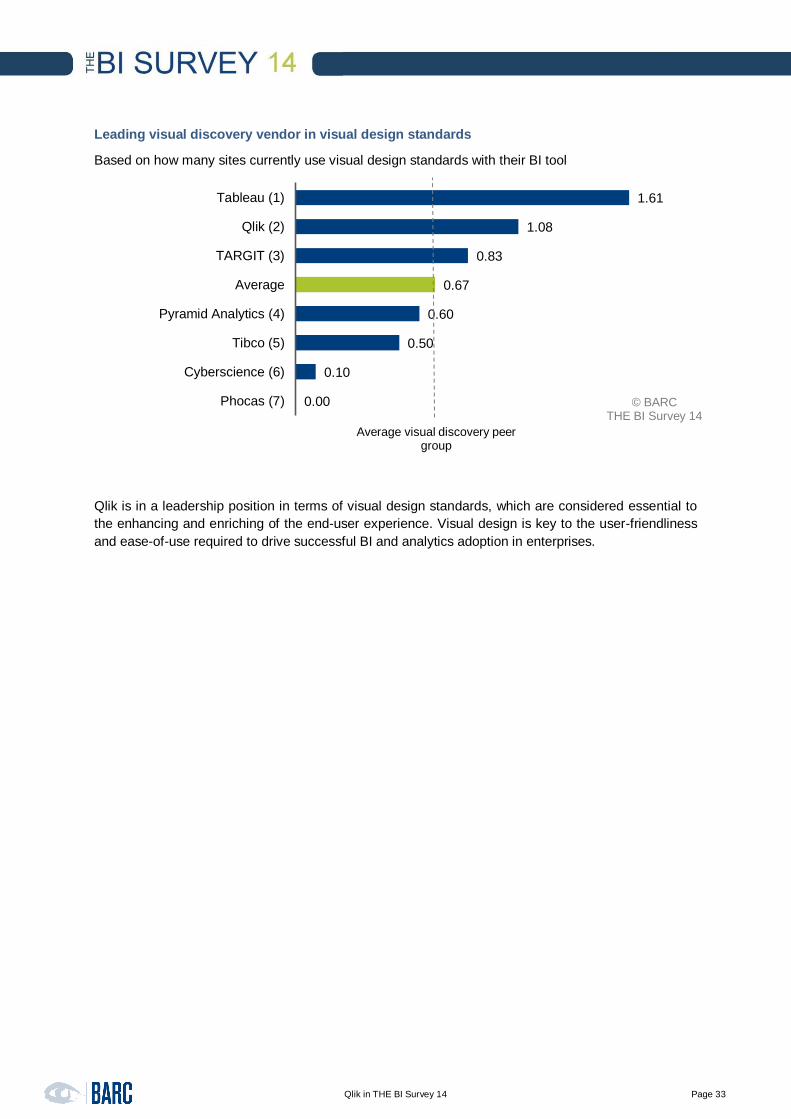
Leading visual discovery vendor in visual design standards
Based on how many sites currently use visual design standards with their BI tool
Qlik is in a leadership position in terms of visual design standards, which are considered essential to
the enhancing and enriching of the end-user experience. Visual design is key to the user-friendliness
and ease-of-use required to drive successful BI and analytics adoption in enterprises.
1.61
1.08
0.83
0.67
0.60
0.50
0.10
0.00
Tableau (1)
Qlik (2)
TARGIT (3)
Average
Pyramid Analytics (4)
Tibco (5)
Cyberscience (6)
Phocas (7)
Average visual discovery peer group
© BARC THE BI Survey 14

Qlik in THE BI Survey 14
Page 34
Leading large international BI vendor in innovation
Combines the ‘Cloud BI’, ‘Collaboration’, 'Data discovery/visualization', ‘Mobile BI’, 'Operational BI' and
‘Visual design standards’ KPIs to measure the product’s level of innovation
Leading dashboard vendor in innovation
Combines the ‘Cloud BI’, ‘Collaboration’, 'Data discovery/visualization', ‘Mobile BI’, 'Operational BI' and
‘Visual design standards’ KPIs to measure the product’s level of innovation
1.61
1.30
1.11
1.10
1.07
0.90
0.88
0.87
0.79
0.78
0.75
0.74
0.74
0.72
0.69
0.66
0.60
Tableau (1)
Qlik (2)
MS Excel & Power products (3)
Tibco (4)
MicroStrategy (5)
Average
Infor (6)
Microsoft SSAS (7)
IBM Cognos TM1 (8)
SAS (9)
SAP BW (10)
Information Builders (11)
IBM Cognos BI (12)
Oracle Essbase (13)
Microsoft SSRS (14)
Oracle BI Found. Suite (15)
SAP BO WebI (16)
Average large international BI vendors peer group
© BARC THE BI Survey 14
1.98
1.61
1.30
1.26
1.24
1.13
1.13
1.11
1.10
1.10
1.07
0.98
0.88
0.74
0.74
0.66
Yellowfin (1)
Tableau (2)
Qlik (3)
Evidanza (4)
Pyramid Analytics (5)
Dundas (6)
Average
arcplan (7)
Tibco (8)
Dimensional Insight (9)
MicroStrategy (10)
Entrinsik (11)
BOARD (12)
Information Builders (13)
IBM Cognos BI (14)
Oracle BI Found. Suite (15)
Average dashboard peer group
© BARC THE BI Survey 14

Qlik in THE BI Survey 14
Page 35
Leading visual discovery vendor in innovation
Combines the ‘Cloud BI’, ‘Collaboration’, 'Data discovery/visualization', ‘Mobile BI’, 'Operational BI' and
‘Visual design standards’ KPIs to measure the product’s level of innovation
For purposes of this survey report, innovation is an aggregate KPI comprised of the following root
KPIs: Cloud BI, Collaboration, Data discovery/visualization, Mobile BI, Operational BI and Visual
design standards. Customers are watching vendors such as Qlik to assess how well its products
evolve and adapt to enterprise requirements and today’s changing business environment. Qlik keeps
moving forward in product redesign, and with the imminent release of Qlik Sense, may make
impressive strides in enabling server-side development from any device, flexible mobile use,
collaboration and sharing, custom development and data integration.
1.61
1.30
1.24
1.24
1.22
1.18
1.10
0.88
Tableau (1)
Qlik (2)
TARGIT (3)
Pyramid Analytics (4)
Average
Phocas (5)
Tibco (6)
Cyberscience (7)
Average visual discovery peer group
© BARC THE BI Survey 14

Qlik in THE BI Survey 14
Page 36
Leading large international BI vendor in query performance
How quickly queries respond, adjusted by data volume
Leading dashboard vendor in query performance
How quickly queries respond, adjusted by data volume
1.81
1.33
1.26
1.25
1.23
1.11
1.06
1.03
1.02
0.95
0.89
0.83
0.83
0.74
0.74
0.71
0.59
Information Builders (1)
Oracle Essbase (2)
Oracle BI Found. Suite (3)
Qlik (4)
IBM Cognos TM1 (5)
Tableau (6)
Microsoft SSAS (7)
Tibco (8)
Average
MicroStrategy (9)
Infor (10)
IBM Cognos BI (11)
SAP BW (12)
SAS (13)
Microsoft SSRS (14)
MS Excel & Power products (15)
SAP BO WebI (16)
Average large international BI vendors peer group
© BARC THE BI Survey 14
1.81
1.38
1.27
1.26
1.25
1.21
1.11
1.09
1.09
1.03
0.97
0.95
0.91
0.91
0.83
0.38
Information Builders (1)
Dimensional Insight (2)
Pyramid Analytics (3)
Oracle BI Found. Suite (4)
Qlik (5)
Evidanza (6)
Tableau (7)
Average
arcplan (8)
Tibco (9)
BOARD (10)
MicroStrategy (11)
Dundas (12)
Yellowfin (13)
IBM Cognos BI (14)
Entrinsik (15)
Average dashboard peer group
© BARC THE BI Survey 14

Qlik in THE BI Survey 14
Page 37
Leading visual discovery vendor in query performance
How quickly queries respond, adjusted by data volume
When it comes to query performance, QlikView gets high marks due to its own in-memory database
that supports very well the tool’s associative query/analysis logic.
1.27
1.25
1.11
1.07
1.04
1.03
0.79
0.73
Pyramid Analytics (1)
Qlik (2)
Tableau (3)
Phocas (4)
Average
Tibco (5)
TARGIT (6)
Cyberscience (7)
Average visual discovery peer group
© BARC THE BI Survey 14

Qlik in THE BI Survey 14
Page 38
Top ranked large international BI vendor in performance satisfaction
Measures the frequency of complaints about the system’s performance
1.12
1.11
1.10
1.09
1.09
1.08
1.05
1.04
1.02
0.99
0.99
0.98
0.95
0.94
0.93
0.82
0.57
Qlik (1)
Oracle Essbase (2)
IBM Cognos TM1 (3)
Tableau (4)
Microsoft SSRS (5)
Information Builders (6)
MicroStrategy (7)
SAS (8)
Infor (9)
Average
Microsoft SSAS (10)
MS Excel & Power products (11)
Oracle BI Found. Suite (12)
Tibco (13)
SAP BO WebI (14)
IBM Cognos BI (15)
SAP BW (16)
Average large international BI vendors peer group
© BARC THE BI Survey 14

Qlik in THE BI Survey 14
Page 39
Consistently outstanding large international BI vendor in performance satisfaction in the past
three years
1.
2.
3.
4.
5.
6.
7.
8.
9.
10.
11.
12.
13.
14.
15.
16.
2012 2013 2014
Pla
cin
g in
th
e l
arg
e in
tern
ati
on
al B
I ven
do
rs
Qlik Oracle Essbase IBM Cognos TM1
Tableau Microsoft SSRS Information Builders
MicroStrategy SAS Infor
Microsoft SSAS MS Excel & Power Products Oracle BI Found. Suite
Tibco SAP BO WebI IBM Cognos BI
SAP BW
© BARC THE BI Survey 14 © BARC THE BI Survey 14

Qlik in THE BI Survey 14
Page 40
Leading dashboard vendor in performance satisfaction
Measures the frequency of complaints about the system’s performance
Consistently outstanding dashboard vendor in performance satisfaction
1.14
1.12
1.11
1.09
1.09
1.08
1.06
1.06
1.05
1.05
1.03
0.95
0.94
0.93
0.90
0.82
Pyramid Analytics (1)
Qlik (2)
Dimensional Insight (3)
Yellowfin (4)
Tableau (5)
Information Builders (6)
BOARD (7)
Evidanza (8)
MicroStrategy (9)
arcplan (10)
Average
Oracle BI Found. Suite (11)
Tibco (12)
Entrinsik (13)
Dundas (14)
IBM Cognos BI (15)
Average dashboard peer group
© BARC THE BI Survey 14
1.
2.
3.
4.
5.
6.
7.
8.
9.
10.
11.
12.
13.
14.
15.
2012 2013 2014
Pla
cin
g in
th
e d
ash
bo
ard
peer
gro
up
Pyramid Analytics Qlik Dimensional Insight
Yellowfin Tableau Information Builders
BOARD Evidanza MicroStrategy
arcplan Oracle BI Found. Suite Tibco
Entrinsik Dundas IBM Cognos BI
© BARC THE BI Survey 14 © BARC THE BI Survey 14 © BARC THE BI Survey 14 © BARC THE BI Survey 14 © BARC THE BI Survey 14
Qlik in THE BI Survey 14
Page 41
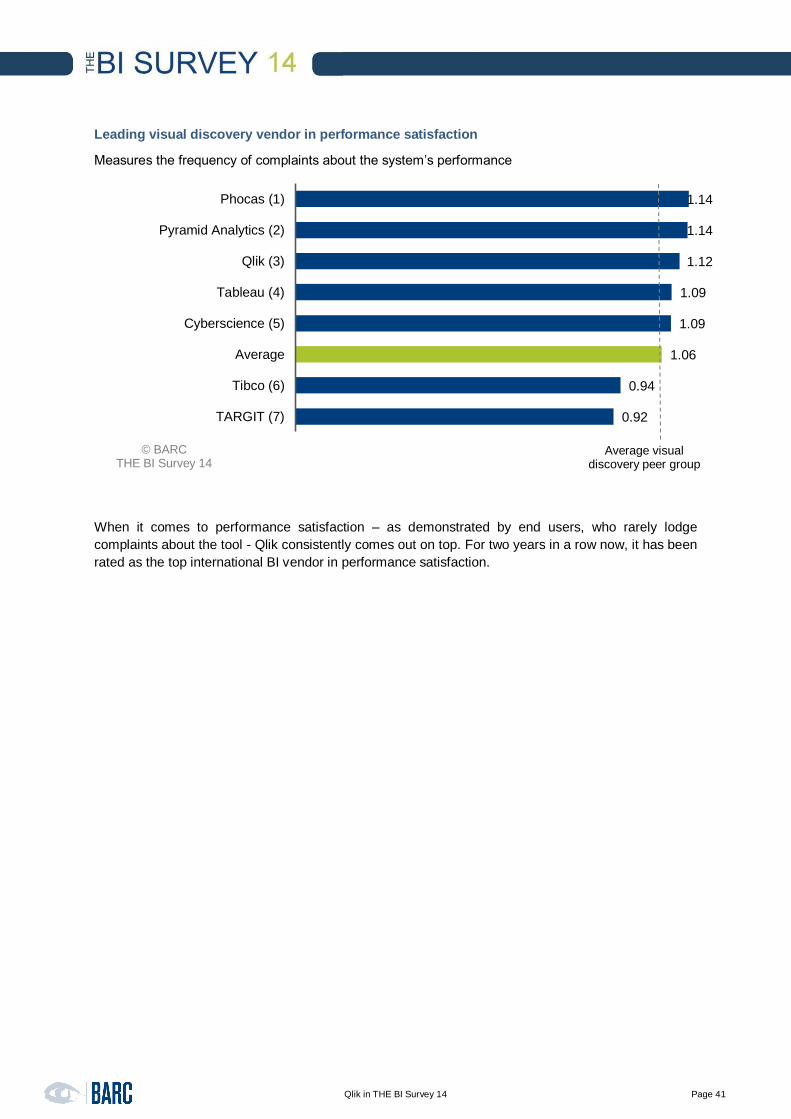
Leading visual discovery vendor in performance satisfaction
Measures the frequency of complaints about the system’s performance
When it comes to performance satisfaction – as demonstrated by end users, who rarely lodge
complaints about the tool - Qlik consistently comes out on top. For two years in a row now, it has been
rated as the top international BI vendor in performance satisfaction.
1.14
1.14
1.12
1.09
1.09
1.06
0.94
0.92
Phocas (1)
Pyramid Analytics (2)
Qlik (3)
Tableau (4)
Cyberscience (5)
Average
Tibco (6)
TARGIT (7)
Average visual discovery peer group
© BARC THE BI Survey 14

Qlik in THE BI Survey 14
Page 42
Leading large international BI vendor in performance
A combination of the ‘Query performance’ and ‘Performance satisfaction’ KPIs
Leading dashboard vendor in performance
A combination of the ‘Query performance’ and ‘Performance satisfaction’ KPIs
1.44
1.22
1.18
1.16
1.10
1.10
1.02
1.01
1.00
0.99
0.96
0.91
0.89
0.84
0.83
0.76
0.70
Information Builders (1)
Oracle Essbase (2)
Qlik (3)
IBM Cognos TM1 (4)
Tableau (5)
Oracle BI Found. Suite (6)
Microsoft SSAS (7)
Average
MicroStrategy (8)
Tibco (9)
Infor (10)
Microsoft SSRS (11)
SAS (12)
MS Excel & Power products (13)
IBM Cognos BI (14)
SAP BO WebI (15)
SAP BW (16)
Average large international BI vendors peer group
© BARC THE BI Survey 14
1.44
1.25
1.21
1.18
1.13
1.10
1.10
1.07
1.06
1.02
1.00
1.00
0.99
0.91
0.83
0.66
Information Builders (1)
Dimensional Insight (2)
Pyramid Analytics (3)
Qlik (4)
Evidanza (5)
Tableau (6)
Oracle BI Found. Suite (7)
arcplan (8)
Average
BOARD (9)
Yellowfin (10)
MicroStrategy (11)
Tibco (12)
Dundas (13)
IBM Cognos BI (14)
Entrinsik (15)
Average dashboard peer group
© BARC THE BI Survey 14

Qlik in THE BI Survey 14
Page 43
Leading visual discovery vendor in performance
A combination of the ‘Query performance’ and ‘Performance satisfaction’ KPIs
As in last year’s BI Survey, QlikView continues to get high ratings from customers for its performance.
The good results for query performance and system performance are due to Qlik’s inbuilt, in-memory
database which offers very fast response times and good overall performance.
1.21
1.18
1.11
1.10
1.05
0.99
0.91
0.86
Pyramid Analytics (1)
Qlik (2)
Phocas (3)
Tableau (4)
Average
Tibco (5)
Cyberscience (6)
TARGIT (7)
Average visual discovery peer group
© BARC THE BI Survey 14

Qlik in THE BI Survey 14
Page 44
Top ranked large international BI vendor in product satisfaction
Based on the frequency of problems encountered with the product
Leading dashboard vendor in product satisfaction
Based on the frequency of problems encountered with the product
1.75
1.70
1.41
1.41
1.39
1.28
1.16
1.03
1.02
0.88
0.80
0.67
0.64
0.62
0.59
0.56
0.43
Qlik (1)
Oracle Essbase (2)
Infor (3)
Information Builders (4)
IBM Cognos TM1 (5)
Tableau (6)
MicroStrategy (7)
Microsoft SSAS (8)
Average
Tibco (9)
Microsoft SSRS (10)
SAS (11)
Oracle BI Found. Suite (12)
IBM Cognos BI (13)
MS Excel & Power products (14)
SAP BO WebI (15)
SAP BW (16)
Average large international BI vendors peer group
© BARC THE BI Survey 14
3.99
2.49
1.75
1.62
1.62
1.47
1.41
1.33
1.28
1.22
1.16
1.12
0.90
0.88
0.64
0.62
Dimensional Insight (1)
Pyramid Analytics (2)
Qlik (3)
Evidanza (4)
arcplan (5)
Average
Information Builders (6)
Entrinsik (7)
Tableau (8)
Yellowfin (9)
MicroStrategy (10)
BOARD (11)
Dundas (12)
Tibco (13)
Oracle BI Found. Suite (14)
IBM Cognos BI (15)
Average dashboard peer group
© BARC THE BI Survey 14

Qlik in THE BI Survey 14
Page 45
Leading visual discovery vendor in product satisfaction
Based on the frequency of problems encountered with the product
Product satisfaction is an important KPI, as it relates to the number of problems typically incurred with
the use of a BI or analytics product. Here, customers had relatively few issues with QlikView, placing
the product well above average. In terms of international BI vendors overall, QlikView customers have
the fewest reported problems.
2.49
2.11
1.75
1.55
1.47
1.28
0.88
0.85
Pyramid Analytics (1)
Phocas (2)
Qlik (3)
Average
Cyberscience (4)
Tableau (5)
Tibco (6)
TARGIT (7)
Average visual discovery peer group
© BARC THE BI Survey 14

Qlik in THE BI Survey 14
Page 46
Leading large international BI vendor in vendor support
Measures user satisfaction with the level of vendor support provided for the product
While Qlik has been undergoing rapid growth in recent years, it still maintains a strong standing in
terms of vendor support.
.
1.29
1.19
1.05
1.04
1.03
0.86
0.79
0.77
0.76
0.71
0.70
0.65
0.64
0.64
0.57
0.38
0.01
Information Builders (1)
Tableau (2)
Qlik (3)
Infor (4)
MicroStrategy (5)
Tibco (6)
IBM Cognos TM1 (7)
Average
Microsoft SSAS (8)
Microsoft SSRS (9)
SAS (10)
Oracle Essbase (11)
IBM Cognos BI (12)
MS Excel & Power products (13)
SAP BW (14)
Oracle BI Found. Suite (15)
SAP BO WebI (16)
Average large international BI vendors peer group
© BARC THE BI Survey 14

Qlik in THE BI Survey 14
Page 47
Leading large international BI vendor in implementer support
Measures user satisfaction with the level of the implementer’s support for the product
1.12
1.04
1.01
1.00
1.00
0.96
0.88
0.88
0.87
0.86
0.84
0.80
0.79
0.71
0.67
0.61
0.60
IBM Cognos TM1 (1)
Information Builders (2)
Qlik (3)
Microsoft SSAS (4)
Oracle Essbase (5)
Infor (6)
SAS (7)
Microsoft SSRS (8)
SAP BW (9)
Average
Tibco (10)
Tableau (11)
MicroStrategy (12)
MS Excel & Power products (13)
IBM Cognos BI (14)
Oracle BI Found. Suite (15)
SAP BO WebI (16)
Average large international BI vendors peer group
© BARC THE BI Survey 14
Qlik in THE BI Survey 14
Page 48
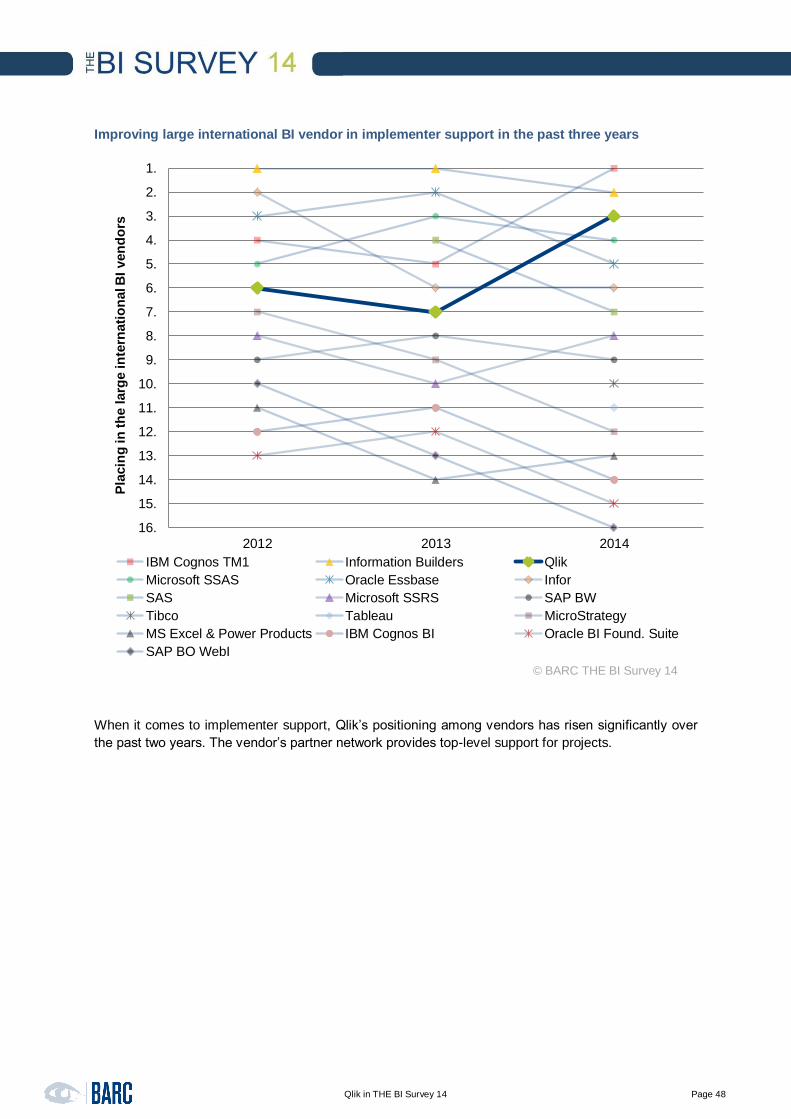
Improving large international BI vendor in implementer support in the past three years
When it comes to implementer support, Qlik’s positioning among vendors has risen significantly over
the past two years. The vendor’s partner network provides top-level support for projects.
1.
2.
3.
4.
5.
6.
7.
8.
9.
10.
11.
12.
13.
14.
15.
16.
2012 2013 2014
Pla
cin
g in
th
e l
arg
e in
tern
ati
on
al B
I ven
do
rs
IBM Cognos TM1 Information Builders Qlik
Microsoft SSAS Oracle Essbase Infor
SAS Microsoft SSRS SAP BW
Tibco Tableau MicroStrategy
MS Excel & Power Products IBM Cognos BI Oracle BI Found. Suite
SAP BO WebI
© BARC THE BI Survey 14

Qlik in THE BI Survey 14
Page 49
Top ranked large international BI vendor in customer satisfaction
Combines the ‘Product satisfaction’, ‘Vendor support’ and ‘Implementer support’ KPIs
Satisfaction is an aggregate of several KPIs, including the ‘Product satisfaction’, ‘Vendor support’ and
‘Implementer support’ KPIs. Customers report Qlik provides the highest levels of product and
performance satisfaction of all the international BI vendors covered in this survey.
1.27
1.25
1.14
1.12
1.10
1.09
0.99
0.93
0.88
0.86
0.80
0.75
0.65
0.65
0.62
0.54
0.39
Qlik (1)
Information Builders (2)
Infor (3)
Oracle Essbase (4)
IBM Cognos TM1 (5)
Tableau (6)
MicroStrategy (7)
Microsoft SSAS (8)
Average
Tibco (9)
Microsoft SSRS (10)
SAS (11)
MS Excel & Power products (12)
IBM Cognos BI (13)
SAP BW (14)
Oracle BI Found. Suite (15)
SAP BO WebI (16)
Average large international BI vendors peer group
© BARC THE BI Survey 14

Qlik in THE BI Survey 14
Page 50
Leading large international BI vendor in project length
Based on how quickly the product is implemented
Leading dashboard vendor in project length
Based on how quickly the product is implemented
Qlik’s approach of offering a flexible development environment enables skilled consultants and users
to build up applications quickly. Projects often use local data integration and analysis of data directly
so that time-consuming tasks such as data integration or data modelling are bypassed. This leads to
an above-average ranking for Qlik.
1.60
1.39
1.30
1.29
1.24
1.16
1.04
1.02
0.96
0.96
0.94
0.77
0.65
0.55
0.53
0.52
0.46
SAS (1)
MicroStrategy (2)
MS Excel & Power products (3)
Tableau (4)
Qlik (5)
Tibco (6)
SAP BO WebI (7)
Information Builders (8)
Average
IBM Cognos BI (9)
Infor (10)
Oracle Essbase (11)
Microsoft SSRS (12)
IBM Cognos TM1 (13)
Microsoft SSAS (14)
SAP BW (15)
Oracle BI Found. Suite (16)
Average large international BI vendors peer group
© BARC THE BI Survey 14
1.58
1.39
1.36
1.29
1.24
1.22
1.16
1.15
1.14
1.06
1.02
0.96
0.71
0.67
0.52
0.46
Entrinsik (1)
MicroStrategy (2)
Yellowfin (3)
Tableau (4)
Qlik (5)
Pyramid Analytics (6)
Tibco (7)
Dimensional Insight (8)
Dundas (9)
Average
Information Builders (10)
IBM Cognos BI (11)
BOARD (12)
Evidanza (13)
arcplan (14)
Oracle BI Found. Suite (15)
Average dashboard peer group
© BARC THE BI Survey 14

Qlik in THE BI Survey 14
Page 51
Leading large international BI vendor in flexibility for the user
Based on how often the product was chosen for its flexibility and the frequency of complaints about
user flexibility post-implementation
Leading dashboard vendor in flexibility for the user
Based on how often the product was chosen for its flexibility and the frequency of complaints about
user flexibility post-implementation
1.21
1.21
1.17
1.09
1.02
1.02
1.02
1.01
1.01
0.91
0.84
0.81
0.71
0.65
0.64
0.58
0.56
Information Builders (1)
Infor (2)
Qlik (3)
Tableau (4)
MS Excel & Power products (5)
SAS (6)
Oracle Essbase (7)
Tibco (8)
IBM Cognos TM1 (9)
Average
MicroStrategy (10)
Microsoft SSAS (11)
IBM Cognos BI (12)
Microsoft SSRS (13)
SAP BO WebI (14)
Oracle BI Found. Suite (15)
SAP BW (16)
Average large international BI vendors peer group
© BARC THE BI Survey 14
1.34
1.29
1.21
1.21
1.17
1.16
1.09
1.09
1.04
1.02
1.01
0.98
0.84
0.80
0.71
0.58
BOARD (1)
arcplan (2)
Information Builders (3)
Dimensional Insight (4)
Qlik (5)
Evidanza (6)
Tableau (7)
Dundas (8)
Average
Pyramid Analytics (9)
Tibco (10)
Yellowfin (11)
MicroStrategy (12)
Entrinsik (13)
IBM Cognos BI (14)
Oracle BI Found. Suite (15)
Average dashboard peer group
© BARC THE BI Survey 14
Qlik in THE BI Survey 14
Page 52
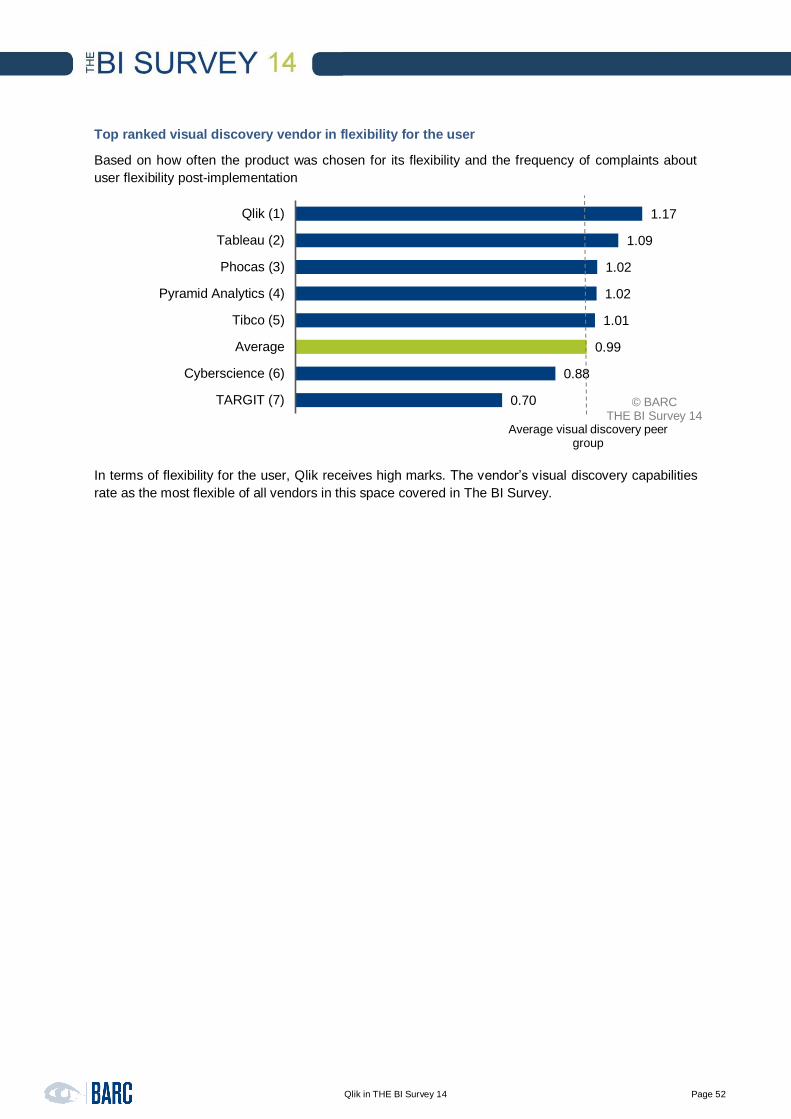
Top ranked visual discovery vendor in flexibility for the user
Based on how often the product was chosen for its flexibility and the frequency of complaints about
user flexibility post-implementation
In terms of flexibility for the user, Qlik receives high marks. The vendor’s visual discovery capabilities
rate as the most flexible of all vendors in this space covered in The BI Survey.
1.17
1.09
1.02
1.02
1.01
0.99
0.88
0.70
Qlik (1)
Tableau (2)
Phocas (3)
Pyramid Analytics (4)
Tibco (5)
Average
Cyberscience (6)
TARGIT (7)
Average visual discovery peer group
© BARC THE BI Survey 14

Qlik in THE BI Survey 14
Page 53
Leading large international BI vendor in agility
Combines the ‘Project length’, ‘Self-service’ and 'Flexibility for users' KPIs
Leading visual discovery vendor in agility
Combines the ‘Project length’, ‘Self-service’ and 'Flexibility for users' KPIs
1.19
1.19
1.14
1.13
1.10
1.07
1.04
1.03
0.97
0.96
0.92
0.91
0.87
0.85
0.70
0.69
0.63
SAS (1)
Information Builders (2)
Qlik (3)
Tableau (4)
MicroStrategy (5)
MS Excel & Power products (6)
Infor (7)
Tibco (8)
IBM Cognos BI (9)
Average
SAP BO WebI (10)
IBM Cognos TM1 (11)
Oracle Essbase (12)
Microsoft SSAS (13)
Oracle BI Found. Suite (14)
Microsoft SSRS (15)
SAP BW (16)
Average large international BI vendors peer group
© BARC THE BI Survey 14
1.19
1.17
1.14
1.13
1.09
1.06
1.03
0.94
Pyramid Analytics (1)
Phocas (2)
Qlik (3)
Tableau (4)
Average
Cyberscience (5)
Tibco (6)
TARGIT (7)
Average visual discovery peer group
© BARC THE BI Survey 14

Qlik in THE BI Survey 14
Page 54
Improving visual discovery vendor in agility in the past three years
Short project length and QlikView’s flexibility in building and changing applications leads to good
results in the ‘Agility’ KPI. This aggregated KPI combines the ‘Project length’, ‘Self-service’ and
'Flexibility for users' KPIs. Business users find the tool usable and the technology satisfies the
demands of self-service BI, so changes can be implemented quite quickly either by the business user
or the consultant.
1.
2.
3.
4.
5.
6.
7.
2012 2013 2014
Pla
cin
g in
th
e v
isu
al d
isco
very
peer
gro
up
Pyramid Analytics Phocas Qlik
Tableau Cyberscience Tibco
TARGIT
© BARC THE BI Survey 14

Qlik in THE BI Survey 14
Page 55
Leading large international BI vendor in ease of use
Based on how often the product was chosen for ease of use and the level of complaints about ease of
use post-implementation
QlikView receives high marks in terms of ease of use, with a second-place ranking among the large
international BI vendors.
1.58
1.20
1.09
1.05
0.99
0.99
0.90
0.90
0.86
0.85
0.84
0.83
0.79
0.72
0.68
0.59
0.38
Tableau (1)
Qlik (2)
Tibco (3)
MS Excel & Power products (4)
Oracle Essbase (5)
MicroStrategy (6)
SAP BO WebI (7)
Average
IBM Cognos TM1 (8)
Information Builders (9)
Oracle BI Found. Suite (10)
Microsoft SSRS (11)
Infor (12)
IBM Cognos BI (13)
Microsoft SSAS (14)
SAS (15)
SAP BW (16)
Average large international BI vendors peer group
© BARC THE BI Survey 14

Qlik in THE BI Survey 14
Page 56
Summary
Qlik’s strength is that it has successfully fulfilled business end-users’ needs for an intuitive, easy-to-
use discovery tool. Qlik, which was an early entrant in the data discovery space, is a company that
has grown very quickly, and the results shown here illustrate that a well-thought-out and executed go-
to-market strategy can deliver real value to customers.
The vendor’s offering, QlikView, is highly rated by its customers across a number of important KPIs,
including cloud BI, performance, collaboration and innovation. The solution offers simplicity,
performance and agility and is well positioned for the self-service BI market.
Qlik Sense, scheduled for release in September 2014, will offer more enterprise features and a
redesigned interface, which will enhance the product’s appeal to line–of-business decision makers. Its
sales process is targeted towards a short proof of concept and can show rapid benefits to the
customer.
Qlik also continues to use a large partner network efficiently. As a result of this strong combination of
assets, the vendor is at the very top of customers’ purchasing plans.

Copyright © BARC GmbH 2014. All rights reserved.
Business Application Research Center –
Central Europe
Berliner Platz 7
97080 Würzburg
Germany
+49 931 880651-0
www.barc.de
Rest of the World
+44 1536 772 451
www.barc-research.com