bimetallic nanoparticles: a single step synthesis, stabilization
TRANSCRIPT
dates
and stabi-een usedr a surfacere charac-rocatalysts
Bimetallic nanoparticles: A single step synthesis, stabilization, ancharacterization of Au–Ag, Au–Pd, and Au–Pt in sol–gel derived silic
Supriya Devarajana, Parthasarathi Berab, S. Sampatha,∗
a Department of Inorganic and Physical Chemistry, Indian Institute of Science, Bangalore 560 012, Indiab Solid State and Structural Chemistry Unit, Indian Institute of Science, Bangalore 560 012, India
Abstract
Nanobimetallic particles consisting of Au–Pd, Au–Ag, and Au–Pt have been synthesized in a single step by a sol–gel processlized in liquid and solid matrices. Organically modified silicates (Ormosils) that play a dual role of a matrix and of a stabilizer have bto obtain very stable dispersions in the form of sols, gels, and monoliths. The simultaneous reduction of metal ions leads to eitheenriched with one component or an alloy type of structure depending on the bimetal combination. The nanometallic dispersions aterized by absorbance, TEM, XRD, IR, XPS, and CO adsorption studies. The stabilized nanoparticles are found to be good electand the preliminary results on the electrochemical reduction of oxygen are reported.
Keywords:Bimetallic nanoparticles; Sol–gel; Au; Ag; Pd; Pt; Aminosilane
eymi-t in
ytic
re-as
bi-andashell
on-
nstion,vere-inghas
tallictedveresno-co-ch-tionedul-
ing
1. Introduction
Bimetallic nanoparticles are of wide interest since thlead to many interesting size-dependent electrical, checal, and optical properties. They are particularly importanthe field of catalysis since they often exhibit better catalproperties than their monometallic counterparts[1–5]. Goldis very useful as an alloying metal due to its relatively lowactivity. It has been used in conjunction with metals suchpalladium[2,3,6–18]and platinum[5,9,14,19–23]for var-ious catalytic reactions. The structure of bimetallic comnations depends mainly on the preparation conditionsthe miscibility of the two components. Combinations suchAu–Pd and Au–Pt have been reported to exhibit a core–sstructure while Au–Ag forms either a core–shell[24–26]oran alloy[23,27–39]phase depending on the preparation cditions.
* Corresponding author.E-mail address:[email protected](S. Sampath).
Among the bimetallics, Au–Pd is one of the combinatiothat has been extensively studied in terms of preparastabilization, and catalytic activity. Turkevich and Kim hastudied the morphology of Au–Pd bimetallic particles, ppared by using hydroxylamine hydrochloride as a reducagent[6]. Preparation of core–shell type nanostructuresbeen demonstrated by the successive formation of bimeAu–Pd colloids in which a core of one metal is encapsulaby a shell of another[9,11,12]. In certain cases, successireductions yielded a cluster-in-cluster structure or mixtuof monometallic components[13]. Simultaneous reductioof the metal ions[14–16]using polymers as stabilizers prduced Au core–Pd shell structured particles. Liu andworkers have reported the formation of Au-core–Pd-rishell type structures by a simultaneous alcohol reducmethod[17]. Guczi and co-workers prepared 4–7 nm sizAu–Pd bimetallic particles in aqueous media by the simtaneous addition of a mixture of trisodium citrate (reduc
agent) and tannin (stabilizing agent) to the metal ions. Thishydrosol deposited on a TiO2 support has been shown to becatalytically very active toward CO oxidation[18].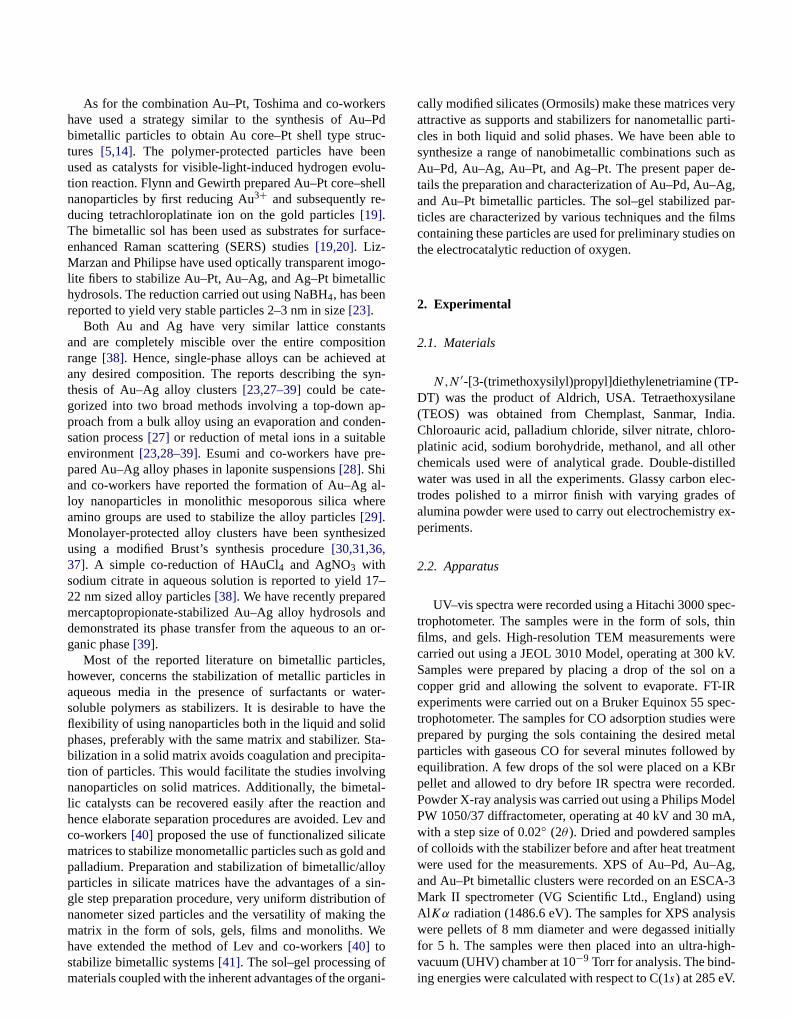
ers–Pduc-en
olu-hell-
face
go-lic
tstiond atsyn-
p-en-lee-
al-ere
ized
17–dnd
n or
s,in
aterthe
lidSta-ta-g
tal-andv anteandloysin-of
thee
eryarti-le toh asde-Ag,ar-
filmss on
-nedia.ro-herlledlec-ofex-
ec-thinerekV.n a-IRec-ere
etalby
Bred.delA,sentAg,A-3ngsisially
As for the combination Au–Pt, Toshima and co-workhave used a strategy similar to the synthesis of Aubimetallic particles to obtain Au core–Pt shell type strtures [5,14]. The polymer-protected particles have beused as catalysts for visible-light-induced hydrogen evtion reaction. Flynn and Gewirth prepared Au–Pt core–snanoparticles by first reducing Au3+ and subsequently reducing tetrachloroplatinate ion on the gold particles[19].The bimetallic sol has been used as substrates for surenhanced Raman scattering (SERS) studies[19,20]. Liz-Marzan and Philipse have used optically transparent imolite fibers to stabilize Au–Pt, Au–Ag, and Ag–Pt bimetalhydrosols. The reduction carried out using NaBH4, has beenreported to yield very stable particles 2–3 nm in size[23].
Both Au and Ag have very similar lattice constanand are completely miscible over the entire composirange[38]. Hence, single-phase alloys can be achieveany desired composition. The reports describing thethesis of Au–Ag alloy clusters[23,27–39]could be cate-gorized into two broad methods involving a top-down aproach from a bulk alloy using an evaporation and condsation process[27] or reduction of metal ions in a suitabenvironment[23,28–39]. Esumi and co-workers have prpared Au–Ag alloy phases in laponite suspensions[28]. Shiand co-workers have reported the formation of Au–Agloy nanoparticles in monolithic mesoporous silica whamino groups are used to stabilize the alloy particles[29].Monolayer-protected alloy clusters have been synthesusing a modified Brust’s synthesis procedure[30,31,36,37]. A simple co-reduction of HAuCl4 and AgNO3 withsodium citrate in aqueous solution is reported to yield22 nm sized alloy particles[38]. We have recently preparemercaptopropionate-stabilized Au–Ag alloy hydrosols ademonstrated its phase transfer from the aqueous to aganic phase[39].
Most of the reported literature on bimetallic particlehowever, concerns the stabilization of metallic particlesaqueous media in the presence of surfactants or wsoluble polymers as stabilizers. It is desirable to haveflexibility of using nanoparticles both in the liquid and sophases, preferably with the same matrix and stabilizer.bilization in a solid matrix avoids coagulation and precipition of particles. This would facilitate the studies involvinnanoparticles on solid matrices. Additionally, the bimelic catalysts can be recovered easily after the reactionhence elaborate separation procedures are avoided. Leco-workers[40] proposed the use of functionalized silicamatrices to stabilize monometallic particles such as goldpalladium. Preparation and stabilization of bimetallic/alparticles in silicate matrices have the advantages of agle step preparation procedure, very uniform distributionnanometer sized particles and the versatility of makingmatrix in the form of sols, gels, films and monoliths. W
have extended the method of Lev and co-workers[40] tostabilize bimetallic systems[41]. The sol–gel processing ofmaterials coupled with the inherent advantages of the organi--
-
-
d
cally modified silicates (Ormosils) make these matrices vattractive as supports and stabilizers for nanometallic pcles in both liquid and solid phases. We have been absynthesize a range of nanobimetallic combinations sucAu–Pd, Au–Ag, Au–Pt, and Ag–Pt. The present papertails the preparation and characterization of Au–Pd, Au–and Au–Pt bimetallic particles. The sol–gel stabilized pticles are characterized by various techniques and thecontaining these particles are used for preliminary studiethe electrocatalytic reduction of oxygen.
2. Experimental
2.1. Materials
N,N ′-[3-(trimethoxysilyl)propyl]diethylenetriamine (TPDT) was the product of Aldrich, USA. Tetraethoxysila(TEOS) was obtained from Chemplast, Sanmar, InChloroauric acid, palladium chloride, silver nitrate, chloplatinic acid, sodium borohydride, methanol, and all otchemicals used were of analytical grade. Double-distiwater was used in all the experiments. Glassy carbon etrodes polished to a mirror finish with varying gradesalumina powder were used to carry out electrochemistryperiments.
2.2. Apparatus
UV–vis spectra were recorded using a Hitachi 3000 sptrophotometer. The samples were in the form of sols,films, and gels. High-resolution TEM measurements wcarried out using a JEOL 3010 Model, operating at 300Samples were prepared by placing a drop of the sol ocopper grid and allowing the solvent to evaporate. FTexperiments were carried out on a Bruker Equinox 55 sptrophotometer. The samples for CO adsorption studies wprepared by purging the sols containing the desired mparticles with gaseous CO for several minutes followedequilibration. A few drops of the sol were placed on a Kpellet and allowed to dry before IR spectra were recordPowder X-ray analysis was carried out using a Philips MoPW 1050/37 diffractometer, operating at 40 kV and 30 mwith a step size of 0.02◦ (2θ ). Dried and powdered sampleof colloids with the stabilizer before and after heat treatmwere used for the measurements. XPS of Au–Pd, Au–and Au–Pt bimetallic clusters were recorded on an ESCMark II spectrometer (VG Scientific Ltd., England) usiAlKα radiation (1486.6 eV). The samples for XPS analywere pellets of 8 mm diameter and were degassed init
for 5 h. The samples were then placed into an ultra-high-vacuum (UHV) chamber at 10−9 Torr for analysis. The bind-ing energies were calculated with respect to C(1s) at 285 eV.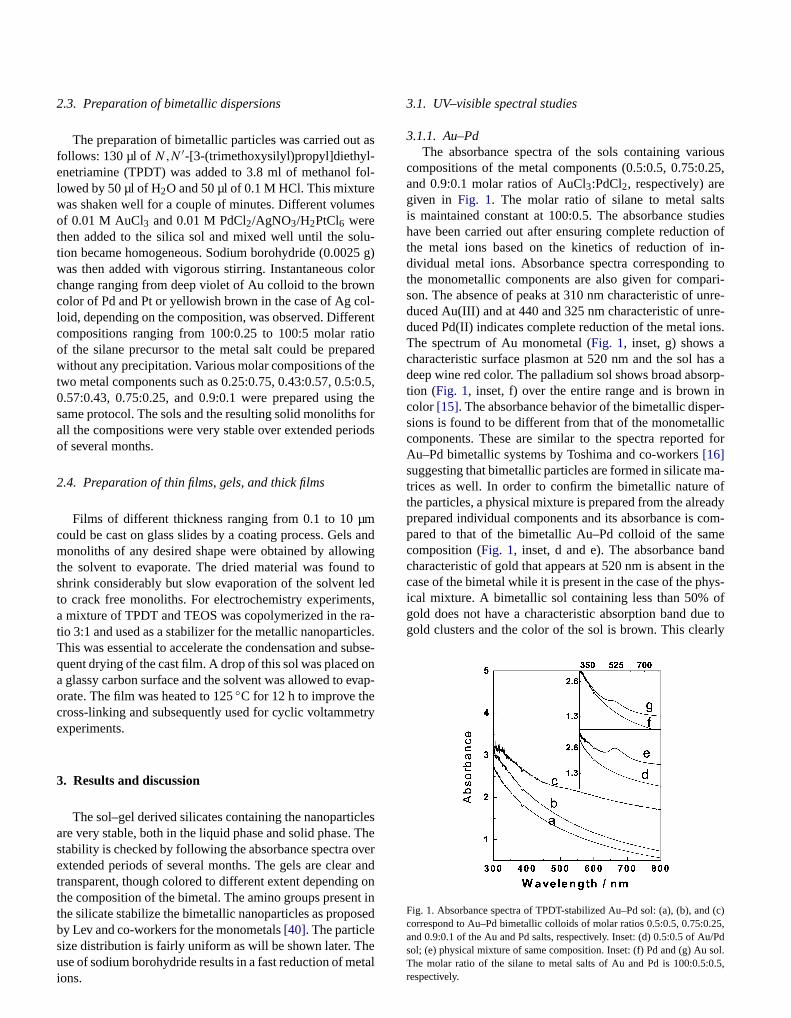
t as
fol-
es
lu-5 g)olorwnol-renttio
aredhe:0.5thefor
iods
man
ingd tolednts,ra-les.ubseonvap
try
clesThever
r andg ont insed
ious.25,
tsdiesn ofin-
g toari-nre-re-ns.
as aorp-iner-llic
for
ma-ofadyom-
mendthe
hys-ofe torly
d (c).25,u/Pd
2.3. Preparation of bimetallic dispersions
The preparation of bimetallic particles was carried oufollows: 130 µl ofN,N ′-[3-(trimethoxysilyl)propyl]diethyl-enetriamine (TPDT) was added to 3.8 ml of methanollowed by 50 µl of H2O and 50 µl of 0.1 M HCl. This mixturewas shaken well for a couple of minutes. Different volumof 0.01 M AuCl3 and 0.01 M PdCl2/AgNO3/H2PtCl6 werethen added to the silica sol and mixed well until the sotion became homogeneous. Sodium borohydride (0.002was then added with vigorous stirring. Instantaneous cchange ranging from deep violet of Au colloid to the brocolor of Pd and Pt or yellowish brown in the case of Ag cloid, depending on the composition, was observed. Diffecompositions ranging from 100:0.25 to 100:5 molar raof the silane precursor to the metal salt could be prepwithout any precipitation. Various molar compositions of ttwo metal components such as 0.25:0.75, 0.43:0.57, 0.50.57:0.43, 0.75:0.25, and 0.9:0.1 were prepared usingsame protocol. The sols and the resulting solid monolithsall the compositions were very stable over extended perof several months.
2.4. Preparation of thin films, gels, and thick films
Films of different thickness ranging from 0.1 to 10 µcould be cast on glass slides by a coating process. Gelsmonoliths of any desired shape were obtained by allowthe solvent to evaporate. The dried material was founshrink considerably but slow evaporation of the solventto crack free monoliths. For electrochemistry experimea mixture of TPDT and TEOS was copolymerized in thetio 3:1 and used as a stabilizer for the metallic nanoparticThis was essential to accelerate the condensation and squent drying of the cast film. A drop of this sol was placeda glassy carbon surface and the solvent was allowed to eorate. The film was heated to 125◦C for 12 h to improve thecross-linking and subsequently used for cyclic voltammeexperiments.
3. Results and discussion
The sol–gel derived silicates containing the nanopartiare very stable, both in the liquid phase and solid phase.stability is checked by following the absorbance spectra oextended periods of several months. The gels are cleatransparent, though colored to different extent dependinthe composition of the bimetal. The amino groups presenthe silicate stabilize the bimetallic nanoparticles as propoby Lev and co-workers for the monometals[40]. The particle
size distribution is fairly uniform as will be shown later. Theuse of sodium borohydride results in a fast reduction of metalions.,
d
-
-
3.1. UV–visible spectral studies
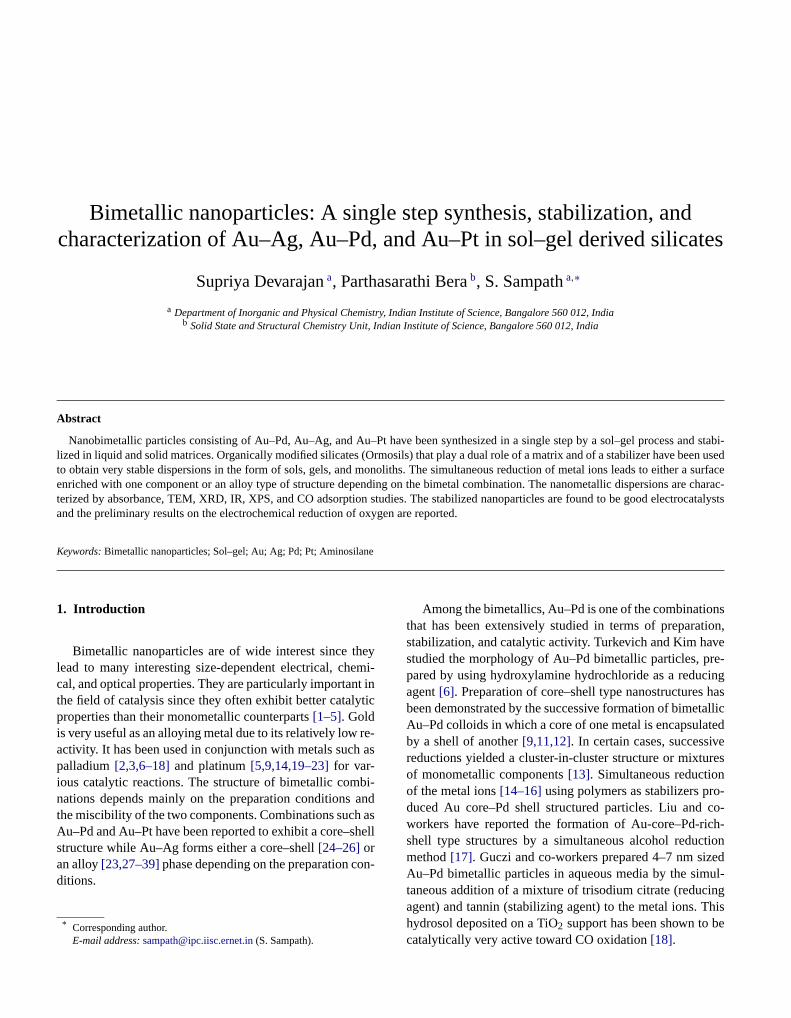
3.1.1. Au–PdThe absorbance spectra of the sols containing var
compositions of the metal components (0.5:0.5, 0.75:0and 0.9:0.1 molar ratios of AuCl3:PdCl2, respectively) aregiven in Fig. 1. The molar ratio of silane to metal salis maintained constant at 100:0.5. The absorbance stuhave been carried out after ensuring complete reductiothe metal ions based on the kinetics of reduction ofdividual metal ions. Absorbance spectra correspondinthe monometallic components are also given for compson. The absence of peaks at 310 nm characteristic of uduced Au(III) and at 440 and 325 nm characteristic of unduced Pd(II) indicates complete reduction of the metal ioThe spectrum of Au monometal (Fig. 1, inset, g) shows acharacteristic surface plasmon at 520 nm and the sol hdeep wine red color. The palladium sol shows broad abstion (Fig. 1, inset, f) over the entire range and is browncolor[15]. The absorbance behavior of the bimetallic dispsions is found to be different from that of the monometacomponents. These are similar to the spectra reportedAu–Pd bimetallic systems by Toshima and co-workers[16]suggesting that bimetallic particles are formed in silicatetrices as well. In order to confirm the bimetallic naturethe particles, a physical mixture is prepared from the alreprepared individual components and its absorbance is cpared to that of the bimetallic Au–Pd colloid of the sacomposition (Fig. 1, inset, d and e). The absorbance bacharacteristic of gold that appears at 520 nm is absent incase of the bimetal while it is present in the case of the pical mixture. A bimetallic sol containing less than 50%gold does not have a characteristic absorption band dugold clusters and the color of the sol is brown. This clea
Fig. 1. Absorbance spectra of TPDT-stabilized Au–Pd sol: (a), (b), ancorrespond to Au–Pd bimetallic colloids of molar ratios 0.5:0.5, 0.75:0and 0.9:0.1 of the Au and Pd salts, respectively. Inset: (d) 0.5:0.5 of A
sol; (e) physical mixture of same composition. Inset: (f) Pd and (g) Au sol.The molar ratio of the silane to metal salts of Au and Pd is 100:0.5:0.5,respectively.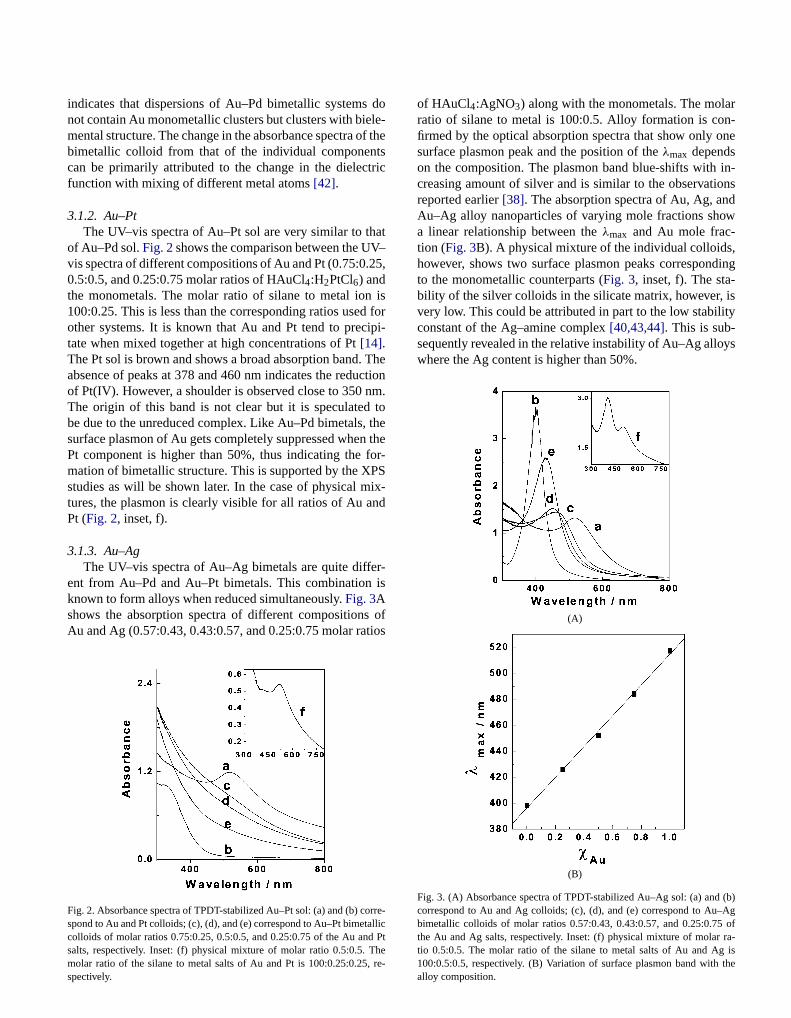
dole-
of thtstric
atV–25,
isd foripi-
Thectionm.
tothe
n thefor-PSix-
nd
r-is
s oftios
orre-allicd Pt
arn-one
in-onsdw
,ding
isity
ys
(b)–Ag5 ofra-
indicates that dispersions of Au–Pd bimetallic systemsnot contain Au monometallic clusters but clusters with biemental structure. The change in the absorbance spectrabimetallic colloid from that of the individual componencan be primarily attributed to the change in the dielecfunction with mixing of different metal atoms[42].
3.1.2. Au–PtThe UV–vis spectra of Au–Pt sol are very similar to th
of Au–Pd sol.Fig. 2shows the comparison between the Uvis spectra of different compositions of Au and Pt (0.75:0.0.5:0.5, and 0.25:0.75 molar ratios of HAuCl4:H2PtCl6) andthe monometals. The molar ratio of silane to metal ion100:0.25. This is less than the corresponding ratios useother systems. It is known that Au and Pt tend to prectate when mixed together at high concentrations of Pt[14].The Pt sol is brown and shows a broad absorption band.absence of peaks at 378 and 460 nm indicates the reduof Pt(IV). However, a shoulder is observed close to 350The origin of this band is not clear but it is speculatedbe due to the unreduced complex. Like Au–Pd bimetals,surface plasmon of Au gets completely suppressed whePt component is higher than 50%, thus indicating themation of bimetallic structure. This is supported by the Xstudies as will be shown later. In the case of physical mtures, the plasmon is clearly visible for all ratios of Au aPt (Fig. 2, inset, f).
3.1.3. Au–AgThe UV–vis spectra of Au–Ag bimetals are quite diffe
ent from Au–Pd and Au–Pt bimetals. This combinationknown to form alloys when reduced simultaneously.Fig. 3Ashows the absorption spectra of different compositionAu and Ag (0.57:0.43, 0.43:0.57, and 0.25:0.75 molar ra
Fig. 2. Absorbance spectra of TPDT-stabilized Au–Pt sol: (a) and (b) cspond to Au and Pt colloids; (c), (d), and (e) correspond to Au–Pt bimetcolloids of molar ratios 0.75:0.25, 0.5:0.5, and 0.25:0.75 of the Au an
salts, respectively. Inset: (f) physical mixture of molar ratio 0.5:0.5. Themolar ratio of the silane to metal salts of Au and Pt is 100:0.25:0.25, re-spectively.e
n
of HAuCl4:AgNO3) along with the monometals. The molratio of silane to metal is 100:0.5. Alloy formation is cofirmed by the optical absorption spectra that show onlysurface plasmon peak and the position of theλmax dependson the composition. The plasmon band blue-shifts withcreasing amount of silver and is similar to the observatireported earlier[38]. The absorption spectra of Au, Ag, anAu–Ag alloy nanoparticles of varying mole fractions shoa linear relationship between theλmax and Au mole frac-tion (Fig. 3B). A physical mixture of the individual colloidshowever, shows two surface plasmon peaks corresponto the monometallic counterparts (Fig. 3, inset, f). The sta-bility of the silver colloids in the silicate matrix, however,very low. This could be attributed in part to the low stabilconstant of the Ag–amine complex[40,43,44]. This is sub-sequently revealed in the relative instability of Au–Ag allowhere the Ag content is higher than 50%.
(A)
(B)
Fig. 3. (A) Absorbance spectra of TPDT-stabilized Au–Ag sol: (a) andcorrespond to Au and Ag colloids; (c), (d), and (e) correspond to Aubimetallic colloids of molar ratios 0.57:0.43, 0.43:0.57, and 0.25:0.7the Au and Ag salts, respectively. Inset: (f) physical mixture of molar
tio 0.5:0.5. The molar ratio of the silane to metal salts of Au and Ag is100:0.5:0.5, respectively. (B) Variation of surface plasmon band with thealloy composition.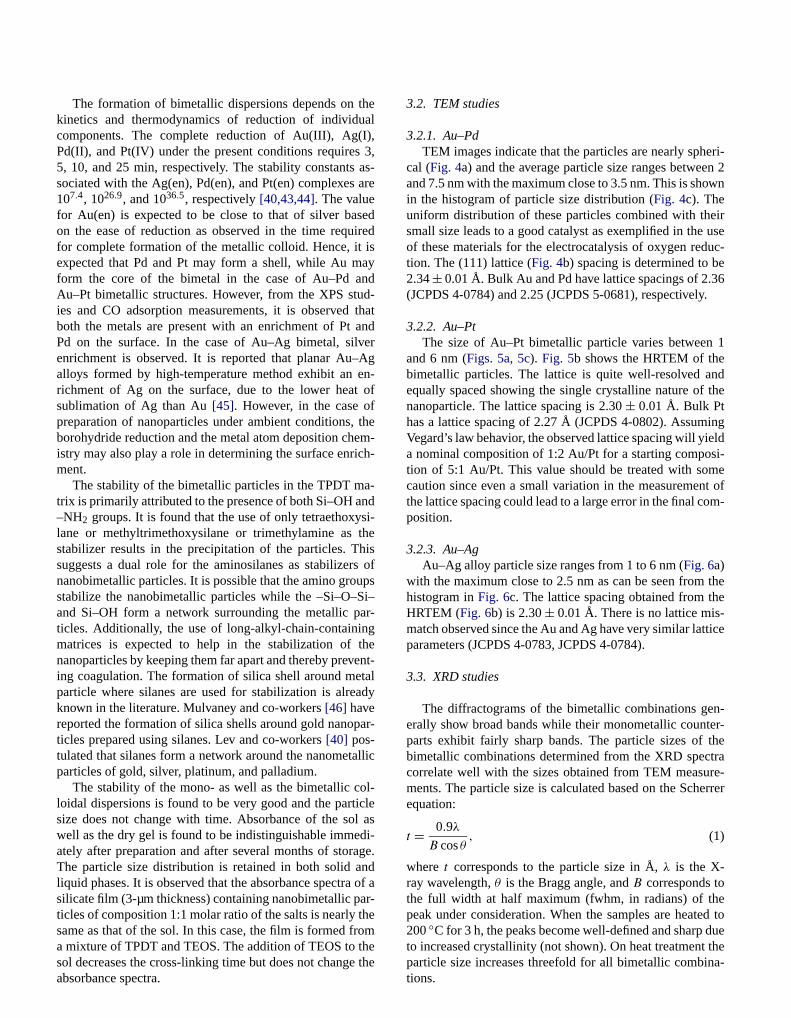
theal
I),3,
as-are
sediredisaynd
ud-thaandverAgen-of
fthe
em-ich-
a-ndsi-thehisrs ofupsSi–ar-g
theent-talady
ar-
allic
ol-iclel asdi-agendof
ar-therom
eri-en 2wn
eiruseuc-e36.
1
ndthe
ingeldsi-met of
om-
thee
-tice
n-ter-thetrare-errer
eed todue
The formation of bimetallic dispersions depends onkinetics and thermodynamics of reduction of individucomponents. The complete reduction of Au(III), Ag(Pd(II), and Pt(IV) under the present conditions requires5, 10, and 25 min, respectively. The stability constantssociated with the Ag(en), Pd(en), and Pt(en) complexes107.4, 1026.9, and 1036.5, respectively[40,43,44]. The valuefor Au(en) is expected to be close to that of silver baon the ease of reduction as observed in the time requfor complete formation of the metallic colloid. Hence, itexpected that Pd and Pt may form a shell, while Au mform the core of the bimetal in the case of Au–Pd aAu–Pt bimetallic structures. However, from the XPS sties and CO adsorption measurements, it is observedboth the metals are present with an enrichment of PtPd on the surface. In the case of Au–Ag bimetal, silenrichment is observed. It is reported that planar Au–alloys formed by high-temperature method exhibit anrichment of Ag on the surface, due to the lower heatsublimation of Ag than Au[45]. However, in the case opreparation of nanoparticles under ambient conditions,borohydride reduction and the metal atom deposition chistry may also play a role in determining the surface enrment.
The stability of the bimetallic particles in the TPDT mtrix is primarily attributed to the presence of both Si–OH a–NH2 groups. It is found that the use of only tetraethoxylane or methyltrimethoxysilane or trimethylamine asstabilizer results in the precipitation of the particles. Tsuggests a dual role for the aminosilanes as stabilizenanobimetallic particles. It is possible that the amino grostabilize the nanobimetallic particles while the –Si–O–and Si–OH form a network surrounding the metallic pticles. Additionally, the use of long-alkyl-chain-containinmatrices is expected to help in the stabilization ofnanoparticles by keeping them far apart and thereby preving coagulation. The formation of silica shell around meparticle where silanes are used for stabilization is alreknown in the literature. Mulvaney and co-workers[46] havereported the formation of silica shells around gold nanopticles prepared using silanes. Lev and co-workers[40] pos-tulated that silanes form a network around the nanometparticles of gold, silver, platinum, and palladium.
The stability of the mono- as well as the bimetallic cloidal dispersions is found to be very good and the partsize does not change with time. Absorbance of the sowell as the dry gel is found to be indistinguishable immeately after preparation and after several months of storThe particle size distribution is retained in both solid aliquid phases. It is observed that the absorbance spectrasilicate film (3-µm thickness) containing nanobimetallic pticles of composition 1:1 molar ratio of the salts is nearlysame as that of the sol. In this case, the film is formed f
a mixture of TPDT and TEOS. The addition of TEOS to thesol decreases the cross-linking time but does not change theabsorbance spectra.t
.
a
3.2. TEM studies
3.2.1. Au–PdTEM images indicate that the particles are nearly sph
cal (Fig. 4a) and the average particle size ranges betweand 7.5 nm with the maximum close to 3.5 nm. This is shoin the histogram of particle size distribution (Fig. 4c). Theuniform distribution of these particles combined with thsmall size leads to a good catalyst as exemplified in theof these materials for the electrocatalysis of oxygen redtion. The (111) lattice (Fig. 4b) spacing is determined to b2.34± 0.01 Å. Bulk Au and Pd have lattice spacings of 2.(JCPDS 4-0784) and 2.25 (JCPDS 5-0681), respectively
3.2.2. Au–PtThe size of Au–Pt bimetallic particle varies between
and 6 nm (Figs. 5a, 5c). Fig. 5b shows the HRTEM of thebimetallic particles. The lattice is quite well-resolved aequally spaced showing the single crystalline nature ofnanoparticle. The lattice spacing is 2.30± 0.01 Å. Bulk Pthas a lattice spacing of 2.27 Å (JCPDS 4-0802). AssumVegard’s law behavior, the observed lattice spacing will yia nominal composition of 1:2 Au/Pt for a starting compotion of 5:1 Au/Pt. This value should be treated with socaution since even a small variation in the measurementhe lattice spacing could lead to a large error in the final cposition.
3.2.3. Au–AgAu–Ag alloy particle size ranges from 1 to 6 nm (Fig. 6a)
with the maximum close to 2.5 nm as can be seen fromhistogram inFig. 6c. The lattice spacing obtained from thHRTEM (Fig. 6b) is 2.30± 0.01 Å. There is no lattice mismatch observed since the Au and Ag have very similar latparameters (JCPDS 4-0783, JCPDS 4-0784).
3.3. XRD studies
The diffractograms of the bimetallic combinations geerally show broad bands while their monometallic counparts exhibit fairly sharp bands. The particle sizes ofbimetallic combinations determined from the XRD speccorrelate well with the sizes obtained from TEM measuments. The particle size is calculated based on the Schequation:
(1)t = 0.9λ
B cosθ,
where t corresponds to the particle size in Å,λ is the X-ray wavelength,θ is the Bragg angle, andB corresponds tothe full width at half maximum (fwhm, in radians) of thpeak under consideration. When the samples are heat200◦C for 3 h, the peaks become well-defined and sharp
to increased crystallinity (not shown). On heat treatment theparticle size increases threefold for all bimetallic combina-tions.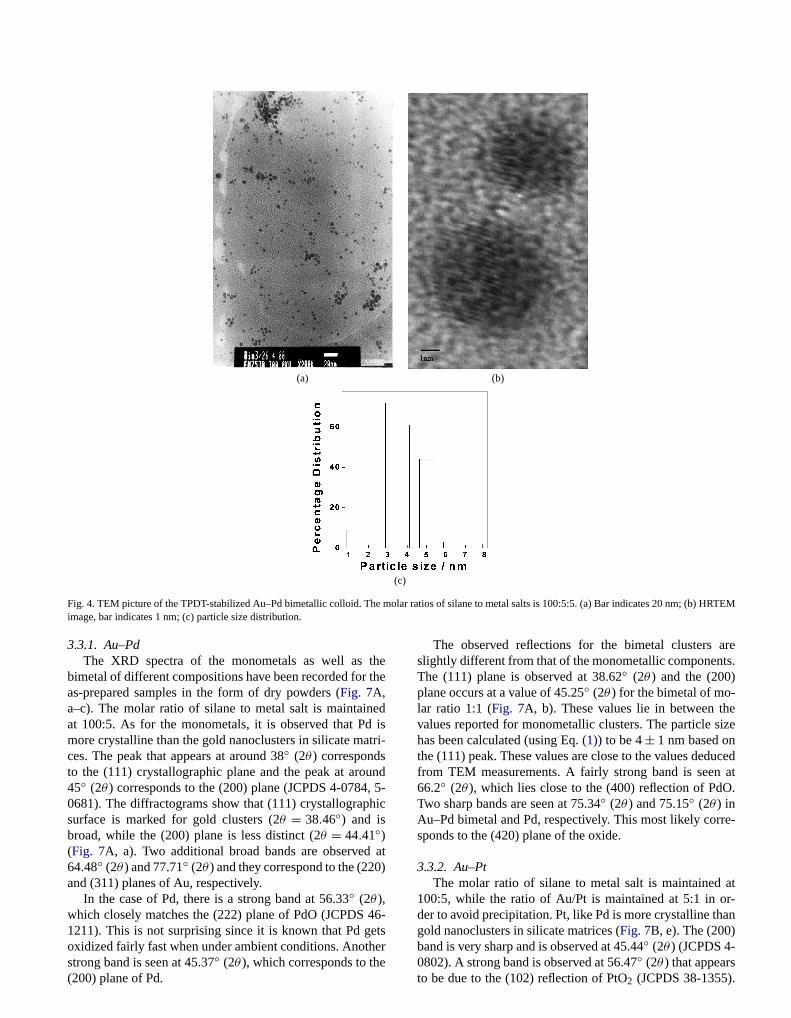
(a) (b)
(c)
e mo H
thethe
edd istri-
und, 5-hic
at0)
46-ets
arets.
esize
ucedat
O.
re-
atr-an
Fig. 4. TEM picture of the TPDT-stabilized Au–Pd bimetallic colloid. Thimage, bar indicates 1 nm; (c) particle size distribution.
3.3.1. Au–PdThe XRD spectra of the monometals as well as
bimetal of different compositions have been recorded foras-prepared samples in the form of dry powders (Fig. 7A,a–c). The molar ratio of silane to metal salt is maintainat 100:5. As for the monometals, it is observed that Pmore crystalline than the gold nanoclusters in silicate maces. The peak that appears at around 38◦ (2θ ) correspondsto the (111) crystallographic plane and the peak at aro45◦ (2θ ) corresponds to the (200) plane (JCPDS 4-07840681). The diffractograms show that (111) crystallograpsurface is marked for gold clusters (2θ = 38.46◦) and isbroad, while the (200) plane is less distinct (2θ = 44.41◦)(Fig. 7A, a). Two additional broad bands are observed64.48◦ (2θ ) and 77.71◦ (2θ ) and they correspond to the (22and (311) planes of Au, respectively.
In the case of Pd, there is a strong band at 56.33◦ (2θ ),which closely matches the (222) plane of PdO (JCPDS1211). This is not surprising since it is known that Pd g
oxidized fairly fast when under ambient conditions. Anotherstrong band is seen at 45.37◦ (2θ ), which corresponds to the(200) plane of Pd.lar ratios of silane to metal salts is 100:5:5. (a) Bar indicates 20 nm; (b)RTEM
The observed reflections for the bimetal clustersslightly different from that of the monometallic componenThe (111) plane is observed at 38.62◦ (2θ ) and the (200)plane occurs at a value of 45.25◦ (2θ ) for the bimetal of mo-lar ratio 1:1 (Fig. 7A, b). These values lie in between thvalues reported for monometallic clusters. The particlehas been calculated (using Eq.(1)) to be 4± 1 nm based onthe (111) peak. These values are close to the values dedfrom TEM measurements. A fairly strong band is seen66.2◦ (2θ ), which lies close to the (400) reflection of PdTwo sharp bands are seen at 75.34◦ (2θ ) and 75.15◦ (2θ ) inAu–Pd bimetal and Pd, respectively. This most likely corsponds to the (420) plane of the oxide.
3.3.2. Au–PtThe molar ratio of silane to metal salt is maintained
100:5, while the ratio of Au/Pt is maintained at 5:1 in oder to avoid precipitation. Pt, like Pd is more crystalline thgold nanoclusters in silicate matrices (Fig. 7B, e). The (200)
◦
band is very sharp and is observed at 45.44(2θ ) (JCPDS 4-0802). A strong band is observed at 56.47◦ (2θ ) that appearsto be due to the (102) reflection of PtO2 (JCPDS 38-1355).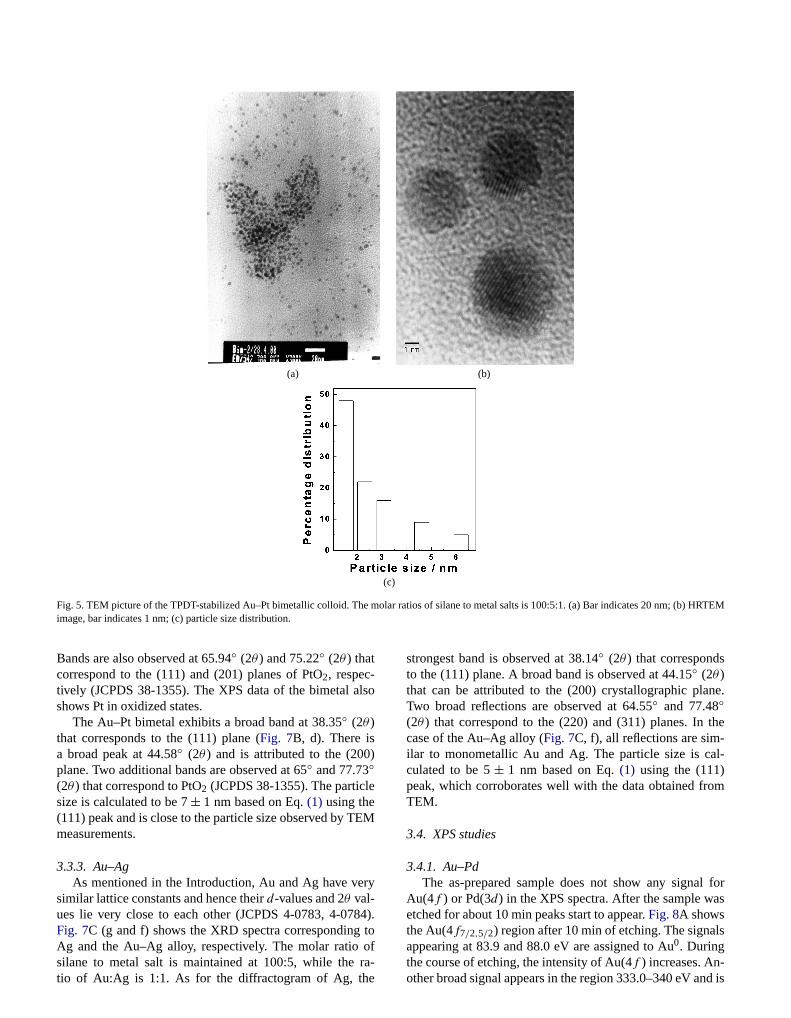
(a) (b)
(c)
e mol H
lso
)
le
EM
ry
84).to
s
ne.
the-al-
om
l foras
ls
Fig. 5. TEM picture of the TPDT-stabilized Au–Pt bimetallic colloid. Thimage, bar indicates 1 nm; (c) particle size distribution.
Bands are also observed at 65.94◦ (2θ ) and 75.22◦ (2θ ) thatcorrespond to the (111) and (201) planes of PtO2, respec-tively (JCPDS 38-1355). The XPS data of the bimetal ashows Pt in oxidized states.
The Au–Pt bimetal exhibits a broad band at 38.35◦ (2θ )that corresponds to the (111) plane (Fig. 7B, d). There isa broad peak at 44.58◦ (2θ ) and is attributed to the (200plane. Two additional bands are observed at 65◦ and 77.73◦(2θ ) that correspond to PtO2 (JCPDS 38-1355). The particsize is calculated to be 7± 1 nm based on Eq.(1) using the(111) peak and is close to the particle size observed by Tmeasurements.
3.3.3. Au–AgAs mentioned in the Introduction, Au and Ag have ve
similar lattice constants and hence theird-values and 2θ val-ues lie very close to each other (JCPDS 4-0783, 4-07Fig. 7C (g and f) shows the XRD spectra corresponding
Ag and the Au–Ag alloy, respectively. The molar ratio ofsilane to metal salt is maintained at 100:5, while the ra-tio of Au:Ag is 1:1. As for the diffractogram of Ag, thear ratios of silane to metal salts is 100:5:1. (a) Bar indicates 20 nm; (b)RTEM
strongest band is observed at 38.14◦ (2θ ) that correspondto the (111) plane. A broad band is observed at 44.15◦ (2θ )that can be attributed to the (200) crystallographic plaTwo broad reflections are observed at 64.55◦ and 77.48◦(2θ ) that correspond to the (220) and (311) planes. Incase of the Au–Ag alloy (Fig. 7C, f), all reflections are similar to monometallic Au and Ag. The particle size is cculated to be 5± 1 nm based on Eq.(1) using the (111)peak, which corroborates well with the data obtained frTEM.
3.4. XPS studies
3.4.1. Au–PdThe as-prepared sample does not show any signa
Au(4f ) or Pd(3d) in the XPS spectra. After the sample wetched for about 10 min peaks start to appear.Fig. 8A showsthe Au(4f7/2,5/2) region after 10 min of etching. The signa
0
appearing at 83.9 and 88.0 eV are assigned to Au. Duringthe course of etching, the intensity of Au(4f ) increases. An-other broad signal appears in the region 333.0–340 eV and is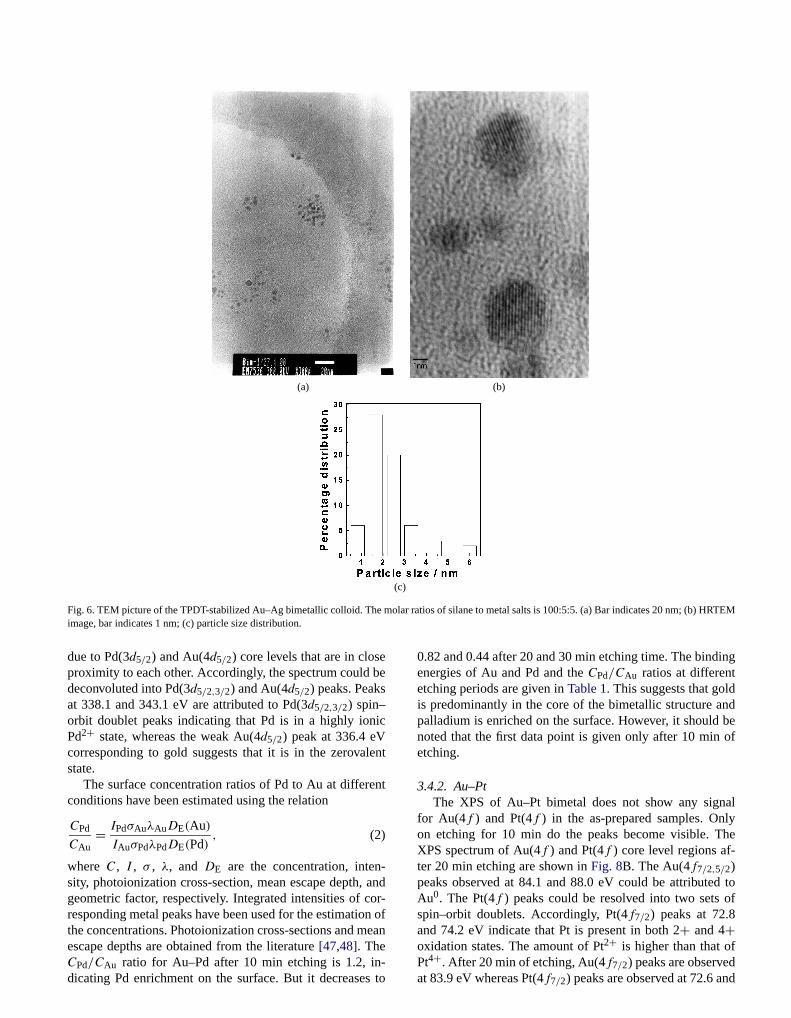
(a) (b)
(c)
e mo H
ebe
s
ic
lent
ent
-, andor-
on oea
ing
dndbeof
nallyhe
-
d toof
Fig. 6. TEM picture of the TPDT-stabilized Au–Ag bimetallic colloid. Thimage, bar indicates 1 nm; (c) particle size distribution.
due to Pd(3d5/2) and Au(4d5/2) core levels that are in closproximity to each other. Accordingly, the spectrum coulddeconvoluted into Pd(3d5/2,3/2) and Au(4d5/2) peaks. Peakat 338.1 and 343.1 eV are attributed to Pd(3d5/2,3/2) spin–orbit doublet peaks indicating that Pd is in a highly ionPd2+ state, whereas the weak Au(4d5/2) peak at 336.4 eVcorresponding to gold suggests that it is in the zerovastate.
The surface concentration ratios of Pd to Au at differconditions have been estimated using the relation
(2)CPd
CAu= IPdσAuλAuDE(Au)
IAuσPdλPdDE(Pd),
where C, I , σ , λ, and DE are the concentration, intensity, photoionization cross-section, mean escape depthgeometric factor, respectively. Integrated intensities of cresponding metal peaks have been used for the estimatithe concentrations. Photoionization cross-sections and m
escape depths are obtained from the literature[47,48]. TheCPd/CAu ratio for Au–Pd after 10 min etching is 1.2, in-dicating Pd enrichment on the surface. But it decreases tolar ratios of silane to metal salts is 100:5:5. (a) Bar indicates 20 nm; (b)RTEM
fn
0.82 and 0.44 after 20 and 30 min etching time. The bindenergies of Au and Pd and theCPd/CAu ratios at differentetching periods are given inTable 1. This suggests that golis predominantly in the core of the bimetallic structure apalladium is enriched on the surface. However, it shouldnoted that the first data point is given only after 10 minetching.
3.4.2. Au–PtThe XPS of Au–Pt bimetal does not show any sig
for Au(4f ) and Pt(4f ) in the as-prepared samples. Onon etching for 10 min do the peaks become visible. TXPS spectrum of Au(4f ) and Pt(4f ) core level regions after 20 min etching are shown inFig. 8B. The Au(4f7/2,5/2)peaks observed at 84.1 and 88.0 eV could be attributeAu0. The Pt(4f ) peaks could be resolved into two setsspin–orbit doublets. Accordingly, Pt(4f7/2) peaks at 72.8and 74.2 eV indicate that Pt is present in both 2+ and 4+
2+
oxidation states. The amount of Ptis higher than that ofPt4+. After 20 min of etching, Au(4f7/2) peaks are observedat 83.9 eV whereas Pt(4f7/2) peaks are observed at 72.6 and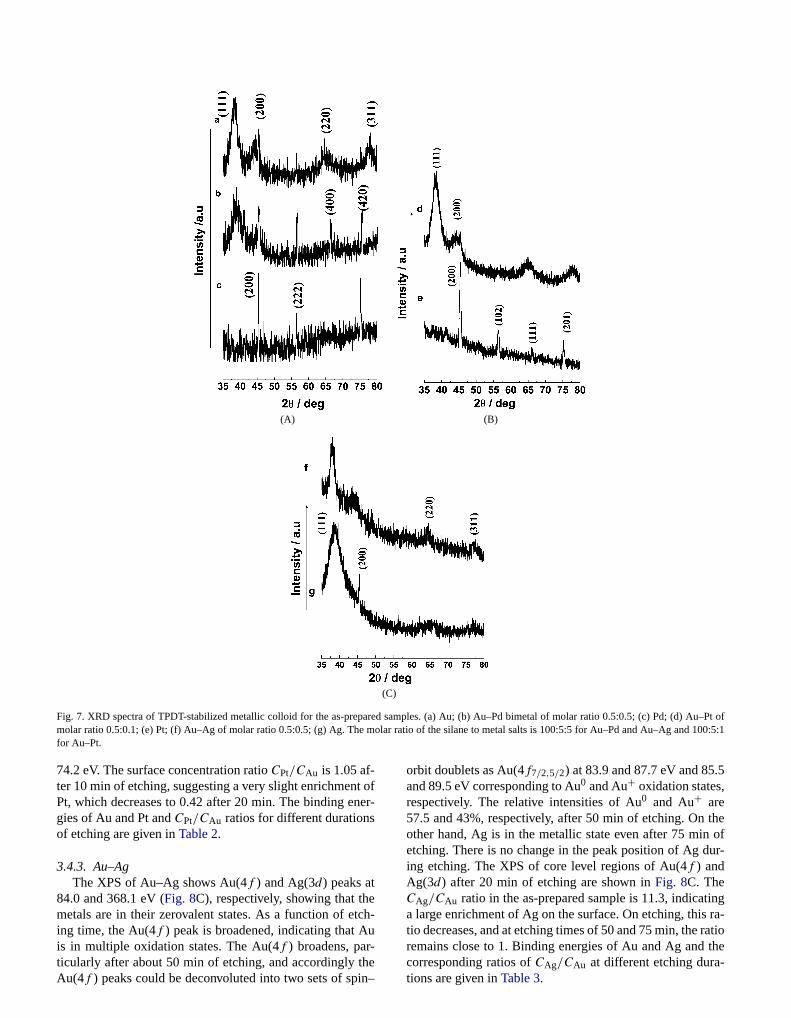
(A) (B)
(C)
ared Au–Pmlar ra :5
t ofner-
etch-u
.5,
theofur-
ingra-
ratio
Fig. 7. XRD spectra of TPDT-stabilized metallic colloid for the as-prepmolar ratio 0.5:0.1; (e) Pt; (f) Au–Ag of molar ratio 0.5:0.5; (g) Ag. Theofor Au–Pt.
74.2 eV. The surface concentration ratioCPt/CAu is 1.05 af-ter 10 min of etching, suggesting a very slight enrichmenPt, which decreases to 0.42 after 20 min. The binding egies of Au and Pt andCPt/CAu ratios for different durationsof etching are given inTable 2.
3.4.3. Au–AgThe XPS of Au–Ag shows Au(4f ) and Ag(3d) peaks at
84.0 and 368.1 eV (Fig. 8C), respectively, showing that thmetals are in their zerovalent states. As a function of eing time, the Au(4f ) peak is broadened, indicating that A
is in multiple oxidation states. The Au(4f ) broadens, par-ticularly after about 50 min of etching, and accordingly theAu(4f ) peaks could be deconvoluted into two sets of spin–samples. (a) Au; (b) Au–Pd bimetal of molar ratio 0.5:0.5; (c) Pd; (d)t oftio of the silane to metal salts is 100:5:5 for Au–Pd and Au–Ag and 100:1
orbit doublets as Au(4f7/2,5/2) at 83.9 and 87.7 eV and 85and 89.5 eV corresponding to Au0 and Au+ oxidation statesrespectively. The relative intensities of Au0 and Au+ are57.5 and 43%, respectively, after 50 min of etching. Onother hand, Ag is in the metallic state even after 75 minetching. There is no change in the peak position of Ag ding etching. The XPS of core level regions of Au(4f ) andAg(3d) after 20 min of etching are shown inFig. 8C. TheCAg/CAu ratio in the as-prepared sample is 11.3, indicata large enrichment of Ag on the surface. On etching, thistio decreases, and at etching times of 50 and 75 min, the
remains close to 1. Binding energies of Au and Ag and thecorresponding ratios ofCAg/CAu at different etching dura-tions are given inTable 3.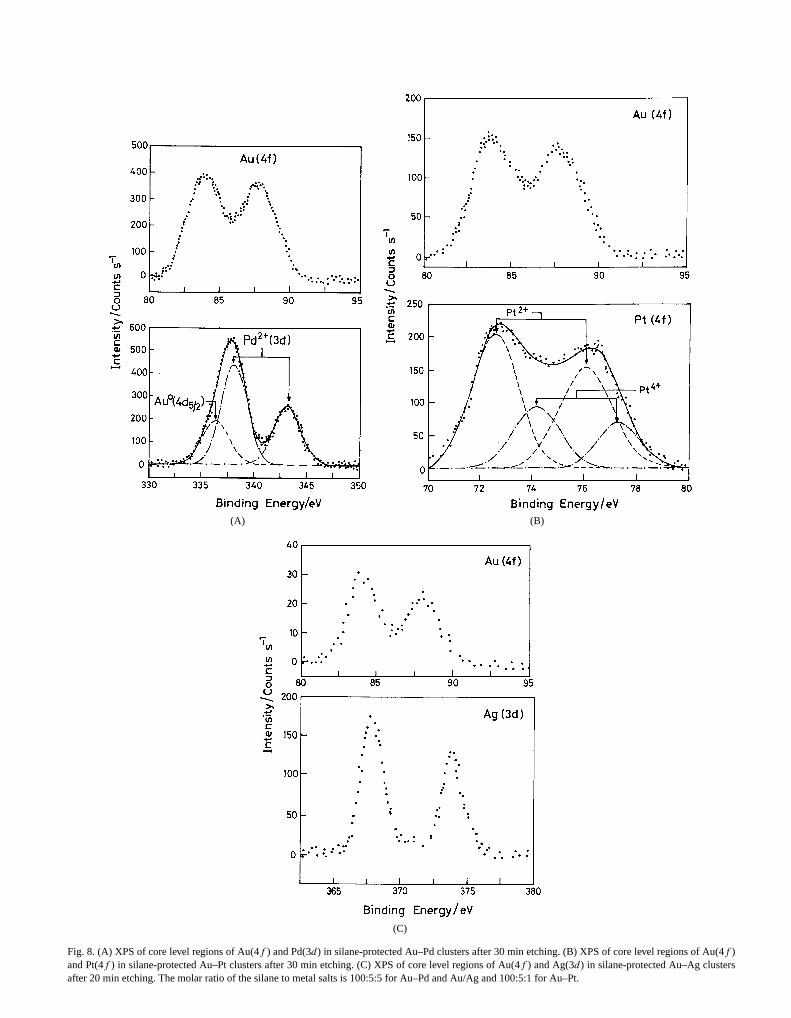
(A) (B)
(C)
Fig. 8. (A) XPS of core level regions of Au(4f ) and Pd(3d) in silane-protected Au–Pd clusters after 30 min etching. (B) XPS of core level regions of Au(4f )and Pt(4f ) in silane-protected Au–Pt clusters after 30 min etching. (C) XPS of core level regions of Au(4f ) and Ag(3d) in silane-protected Au–Ag clustersafter 20 min etching. The molar ratio of the silane to metal salts is 100:5:5 for Au–Pd and Au/Ag and 100:5:1 for Au–Pt.
s at
t dif-
s at
lu-licateate
wn).al-
laneander-d tothe
ithpec-lesthewn
era-
i-a-sil-
he
O-
co-
1:1
-
at thead-
re-
ed-ed
an
bi-outrti-atents.se ofteseryex-e in
-des.
orepo-
Table 1Binding energies (eV) and concentration ratios of Au and Pd speciedifferent etching durations (min)
Durationof etching
Binding energyof Au(4f7/2)
Binding energyof Pd(3d5/2)
CPd/CAu
As prepared – – –10 83.9 338.1 1.220 84.0 338.1 0.8230 83.9 338.0 0.44
Table 2Binding energies (eV) and concentration ratios of Au and Pt species aferent etching durations (min)
Durationof etching
Binding energyof Au(4f7/2)
Binding energyof Pt(4f7/2)
CPt/CAu
As prepared – – –10 84.1 72.8 (46%) 1.05
74.2 (54%)
20 83.9 72.6 (70%) 0.4274.2 (30%)
Table 3Binding energies (eV) and concentration ratios of Au and Ag speciedifferent etching durations (min)
Durationof etching
Binding energyof Au(4f7/2)
Binding energyof Ag(3d5/2)
CAg/CAu
As prepared 84.0 368.1 11.310 84.1 367.9 8.520 83.9 368.0 6.735 84.0 367.9 4.350 83.9 (57%) 368.0 1.2
85.5 (43%)
75 83.9 (56%) 368.1 1.185.5 (44%)
3.5. FT-IR studies
FT-IR studies have been carried out to follow the evotion of silicate matrix during the stabilization of the metalparticles. The spectra have been taken for the dried mrial and they represent the completely polymerized silicnetwork encapsulating the nanoparticles (figure not shoThe IR peaks agree well with the reported literature vues[40] for silicate matrices. The band at 1117 cm−1 con-firms the presence of siloxane groups [γ (Si–O–Si)] in thepolymerized material while the band at around 1659 cm−1
corresponds to the primary amine [δ(NH2)] of the silane.The position of this band shifts to higher values as the siis cross-linked and polymerized. The N–H stretching baround 3500 cm−1 is broadened in the cross-linked matial as compared to that of neat silane. This is attributethe complexation of the amine groups of the silicate withmetal particles[40].
3.6. Carbon monoxide adsorption studies
Infrared spectroscopy has been widely used to study thesurface chemistry of small, adsorbed molecules[49–55].
-
The vibrational frequency of adsorbed CO changes wthe metal substrate and binding structure. Hence, IR stroscopy of CO on the surface of bimetallic nanoparticis expected to give information about the surface ofnanoparticle. On gold nanoparticles, however, CO is knoto be very weakly and reversibly adsorbed[53,54]. Theadsorbed CO is generally observed only at low temptures[53,54]. Gold and silver have fully occupiedd-orbitals(5d106s1, 4d105s1, respectively) and exhibit weak coordnation ability toward CO. It is reported that only weak Rman and IR bands are observed for CO on gold andver surfaces[53,54]. The IR spectra corresponding to tCO stretching region are given inFig. 9 for Au–Pd andAu–Pt bimetallic systems. We have earlier reported the CIR spectra for monometallic Pd and Pt particles[41,56].This is similar to the spectra reported by Toshima andworkers[52].
3.6.1. Au–PdThe IR spectra of CO adsorbed on nanobimetallic
Au–Pd stabilized in TPDT matrix is shown inFig. 9a.A broad peak is seen at 2032 cm−1 and another strong absorption band is observed at 1911 cm−1. The former bandcan be assigned to the CO adsorbed on the Pd surfaceterminal site (linear adsorption site) and the latter to COsorbed at the bridging site (bridging adsorption site)[52].The relative intensities of these two peaks have beenported to vary depending on the particle size[49].
3.6.2. Au–PtThe IR spectrum of CO adsorbed on TPDT-stabiliz
Au–Pt particles is shown inFig. 9b. A strong band is observed at 2030 cm−1 and is assigned to the linearly adsorbCO on the Pt surface[55].
Hence, in both Au–Pd and Au–Pt bimetallic particles,enrichment of Pd and Pt is observed on the surface.
3.7. Electrocatalysis studies
The electrocatalytic activity of the nanoparticles stalized in silicate matrices has been followed by carryingpreliminary studies on Au–Pd and Au–Ag alloy nanopacles. A glassy carbon electrode is coated with the silicstabilized nanoparticles and used for further experimeOxygen reduction is taken as the demonstrative case. UTEOS along with TPDT to stabilize the particles facilitacross-linking and the resulting films are found to be vsturdy and adherent to the substrate. Cyclic voltammetricperiments have been performed on the modified electrodphosphate buffer pH 7.2.Fig. 10shows the cyclic voltammograms on the bare as well as nanometal modified electroIt is clear that the oxygen reduction potential shifts to mpositive values in presence of the metallic particles. A
tential shift of about 200 mV in the case of Au–Pd modifiedclassy carbon electrode (Fig. 10a) shows the catalytic natureof the immobilized metallic particles. Similarly, the catalytic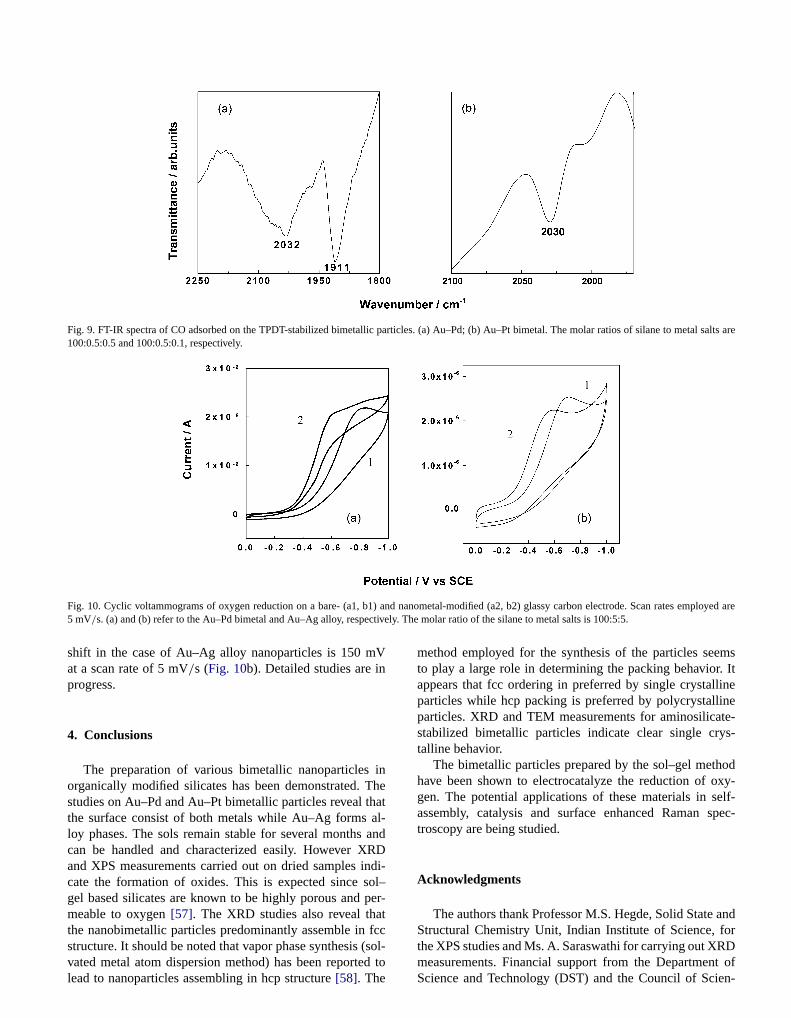
l sal
Fig. 9. FT-IR spectra of CO adsorbed on the TPDT-stabilized bimetallic particles. (a) Au–Pd; (b) Au–Pt bimetal. The molar ratios of silane to metats are100:0.5:0.5 and 100:0.5:0.1, respectively.1) an mployed arectivel
Vn
inThethatal-andRDindiol–per-atfcc
emsr. Itlineinete-
ys-
hodxy-elf-spec-
andfor
Fig. 10. Cyclic voltammograms of oxygen reduction on a bare- (a1, b5 mV/s. (a) and (b) refer to the Au–Pd bimetal and Au–Ag alloy, respe
shift in the case of Au–Ag alloy nanoparticles is 150 mat a scan rate of 5 mV/s (Fig. 10b). Detailed studies are iprogress.
4. Conclusions
The preparation of various bimetallic nanoparticlesorganically modified silicates has been demonstrated.studies on Au–Pd and Au–Pt bimetallic particles revealthe surface consist of both metals while Au–Ag formsloy phases. The sols remain stable for several monthscan be handled and characterized easily. However Xand XPS measurements carried out on dried samplescate the formation of oxides. This is expected since sgel based silicates are known to be highly porous andmeable to oxygen[57]. The XRD studies also reveal ththe nanobimetallic particles predominantly assemble in
structure. It should be noted that vapor phase synthesis (solvated metal atom dispersion method) has been reported tolead to nanoparticles assembling in hcp structure[58]. Thed nanometal-modified (a2, b2) glassy carbon electrode. Scan rates ey. The molar ratio of the silane to metal salts is 100:5:5.
-
method employed for the synthesis of the particles seto play a large role in determining the packing behavioappears that fcc ordering in preferred by single crystalparticles while hcp packing is preferred by polycrystallparticles. XRD and TEM measurements for aminosilicastabilized bimetallic particles indicate clear single crtalline behavior.
The bimetallic particles prepared by the sol–gel methave been shown to electrocatalyze the reduction of ogen. The potential applications of these materials in sassembly, catalysis and surface enhanced Ramantroscopy are being studied.
Acknowledgments
The authors thank Professor M.S. Hegde, Solid StateStructural Chemistry Unit, Indian Institute of Science,
-the XPS studies and Ms. A. Saraswathi for carrying out XRDmeasurements. Financial support from the Department ofScience and Technology (DST) and the Council of Scien-
is
. 96
ert,
ra,
a,
ys.
nt.
ay-272
nn,rg.
03.995)
. 96
y,03)
ra,
02)
61..J.
ng-
ss,98)
3)
94.
m.
c.
99)
278
991)
s,.2,
97
9..
il,
il,
in-
103
316
.
02)
hem-
tific and Industrial Research (CSIR), New Delhi, India,gratefully acknowledged.
References
[1] N. Toshima, Y. Wang, Chem. Lett. (1993) 1611.[2] N. Toshima, M. Harada, Y. Yamazaki, K. Asakura, J. Phys. Chem
(1992) 9927.[3] A.F. Lee, C.J. Baddeley, C. Hardacre, R.M. Ormerod, R.M. Lamb
G. Schmid, H. West, J. Phys. Chem. 99 (1995) 6096.[4] N. Toshima, M. Harada, T. Yonezawa, K. Kushihashi, K. Asaku
J. Phys. Chem. 95 (1991) 7448.[5] T. Yonezawa, N. Toshima, J. Mol. Catal. 83 (1993) 167.[6] J. Turkevich, G. Kim, Science 169 (1970) 873.[7] Y. Mizukoshi, K. Okitsu, Y. Maeda, T.A. Yamamoto, R. Oshim
Y. Nagata, J. Phys. Chem. 101 (1997) 7033.[8] Y. Mizukoshi, T. Fujimoto, Y. Nagata, R. Oshima, Y. Maeda, J. Ph
Chem. B 104 (2000) 6028.[9] G. Schmid, A. Lehnert, J.-O. Malm, J.-O. Bovin, Angew. Chem. I
Ed. Engl. 30 (1991) 874.[10] C.J. Baddeley, D.A. Jefferson, R.M. Lambert, R.M. Ormerod, T. R
ment, G. Schmid, A.P. Walker, Mater. Res. Soc. Symp. Proc.(1992) 85.
[11] R.J. Davis, M. Boudart, J. Phys. Chem. 98 (1994) 5471.[12] B. Helmut, U. Endruschat, B. Tesche, A. Rufinska, C.W. Lehma
F.E. Wagner, G. Filoti, V. Parvulescu, V.I. Parvulescu, Eur. J. InoChem. 5 (2000) 819.
[13] M. Harada, K. Asakura, N. Toshima, J. Phys. Chem. 97 (1993) 51[14] T. Yonezawa, N. Toshima, J. Chem. Soc. Faraday Trans. 91 (1
4111.[15] N. Toshima, T. Yonezawa, New J. Chem. 22 (1998) 1179.[16] N. Toshima, M. Harada, Y. Yamazaki, K. Asakura, J. Phys. Chem
(1992) 9927.[17] H. Liu, G. Mao, M. Meng, J. Mol. Catal. 74 (1992) 2775.[18] L. Guczi, A. Beck, A. Horvath, Zs. Koppany, G. Stefler, K. Fre
I. Sajo, D. Bazin, J. Lynch, J. Mol. Catal. A Chem. 204–205 (20545.
[19] N.T. Flynn, A.A. Gewirth, J. Raman Spectrosc. 33 (2002) 243.[20] T. Takenaka, K. Eda, J. Colloid Interface Sci. 105 (1985) 342.[21] H. Tada, F. Suzuki, S. Ito, T. Akita, K. Tanaka, T. Kawaha
H. Kobayashi, J. Phys. Chem. B 106 (2002) 8714.[22] C. Mihut, C. Descorme, D. Duprez, M.D. Amirdis, J. Catal. 212 (20
125.[23] L.M. Liz-Marzan, A.P. Philipse, J. Phys. Chem. 99 (1995) 15,120.[24] P. Mulvaney, M. Giersig, A. Henglein, J. Phys. Chem. 97 (1993) 70[25] R.G. Freeman, M.B. Hommer, K.C. Grabar, M.A. Jackson, M
Natan, J. Phys. Chem. 100 (1996) 718.[26] I. Srnova-Sloufova, F. Lednicky, A. Gemperle, J. Gemperlova, La
muir 16 (2000) 9928.[27] G.C. Papavassiliou, J. Phys. F Met. Phys. 6 (1976) L103.
[28] N. Aihara, K. Torigoe, K. Esumi, Langmuir 14 (1998) 4945.[29] H.Z. Shi, L.D. Zhang, W.P. Cai, J. Appl. Phys. 87 (2000) 1572.[30] M.J. Hostetler, C.J. Zhong, B.K. Yen, J.H. Anderegg, S.M. Gro
N.D. Evans, M. Porter, R.W. Murray, J. Am. Chem. Soc. 120 (199396.
[31] N. Sandhyarani, T. Pradeep, Chem. Mater. 12 (2000) 1755.[32] J. Sinzig, U. Radtke, M. Quinten, U. Kreibig, Z. Phys. D 26 (199
242.[33] B.K. Teo, K. Keating, Y.H. Kao, J. Am. Chem. Soc. 109 (1987) 34[34] D.-H. Chen, C.-J. Chen, J. Mater. Chem. 12 (2002) 1557.[35] M.P. Mallin, C.J. Murphy, Nano Lett. 2 (2002) 1235.[36] M. Brust, M. Walker, D. Bethell, D.J. Schiffrin, R. Whyman, J. Che
Soc. Chem. Commun. (1994) 801.[37] M. Brust, J. Fink, D. Bethell, D.J. Schiffrin, C. Kiely, J. Chem. So
Chem. Commun. (1995) 1655.[38] S. Link, Z.L. Wang, M.A. El-Sayed, J. Phys. Chem. B 103 (19
3529.[39] S. Devarajan, B. Vimalan, S. Sampath, J. Colloid Interface Sci.
(2004) 126.[40] S. Bharathi, N. Fishelson, O. Lev, Langmuir 15 (1999) 1929.[41] L. D’Souza, S. Sampath, Langmuir 16 (2000) 8510.[42] J.A. Creighton, D.G. Eadon, J. Chem. Soc. Faraday Trans. 87 (1
3881.[43] L.G. Sillen, A.E. Martell, Stability Constants of Metal-Ion Complexe
Special Publication No. 17, The Chemical Society, London, 1964[44] R.M. Smith, A.E. Martell, Critical Stability Constants: Amines, vol.
Plenum, New York, 1975.[45] N. Toreis, X.E. Verykios, S.M. Khalid, G.B. Bunker, Surf. Sci. 1
(1988) 415.[46] L.M. Liz-Marzan, M. Giersig, P. Mulvaney, Langmuir 12 (1996) 432[47] J.H. Scofield, J. Electron Spectrosc. Relat. Phenom. 8 (1976) 129[48] D.R. Penn, J. Electron Spectrosc. Relat. Phenom. 9 (1976) 29.[49] J.S. Bradley, E.W. Hill, S. Behal, C. Klein, B. Chaudret, A. Dute
Chem. Mater. 4 (1992) 1234.[50] J.S. Bradley, J.M. Millar, E.W. Hill, S. Behal, B. Chaudret, A. Dute
Faraday Discuss. Chem. Soc. 92 (1991) 255.[51] J.S. Bradley, in: G. Schmid (Ed.), Clusters and Colloids, VCH, We
heim, 1994, pp. 459–544.[52] Y. Wang, N. Toshima, J. Phys. Chem. B 101 (1997) 5301.[53] S.-G. Sun, W.-B. Cai, L.-J. Wan, M. Osawa, J. Phys. Chem. B
(1999) 2460.[54] A.M. Bradshaw, J. Pritchard, Proc. Roy. Soc. London Ser. A
(1970) 169.[55] K.A. Friedrich, F. Henglein, U. Stimming, W. Unkauf, Electrochim
Acta 47 (2001) 689.[56] L. D’Souza, P. Bera, S. Sampath, J. Colloid Interface Sci. 246 (20
92.[57] C.J. Brinker, G.W. Scherer, Sol–Gel Science—The Physics and C
istry of Sol–Gel Processing, Academic Press, New York, 1990.
[58] S.I. Stoeva, B.L.V. Prasad, S. Uma, P.K. Stoimenov, V. Zaikovski,C. Sorensen, K.J. Klabunde, J. Phys. Chem. B 107 (2003) 7441.