bioinformatics - sonnhammer · 2006. 3. 28. · protein sequences and protein structures. however,...
TRANSCRIPT
A comparison of sequence and structure proteindomain families as a basis for structuralgenomics
$!� ��"�%%"!� �!� �$�� �� �� �"!!�� �$�
��#�$& �!& "� ��"��� �%&$)� �&"���"� �!�'�$%�&)� �� �� �&"���"� � �(���!
�������� �� ���� �� ��� ����� ������� �� ���� ��� ����� �������� �� ���� ��� ����
AbstractMotivation: Protein families can be defined based onstructure or sequence similarity. We wanted to compare twoprotein family databases, one based on structural and one onsequence similarity, to investigate to what extent theyoverlap, the similarity in definition of corresponding fam-ilies, and to create a list of large protein families withunknown structure as a resource for structural genomics. Wealso wanted to increase the sensitivity of fold assignment byexploiting protein family HMMs.Results: We compared Pfam, a protein family databasebased on sequence similarity, to Scop, which is based onstructural similarity. We found that 70% of the Scop familiesexist in Pfam while 57% of the Pfam families exist in Scop.Most families that occur in both databases correspond wellto each other, but in some cases they are different. Such caseshighlight situations in which structure and sequence ap-proaches differ significantly. The comparison enabled us tocompile a list of the largest families that do not occur in Scop;these are suitable targets for structure prediction anddetermination, and may be useful to guide projects instructural genomics. It can be noted that 13 out of the 20largest protein families without a known structure are likelytransmembrane proteins. We also exploited Pfam to increasethe sensitivity of detecting homologs of proteins with knownstructure, by comparing query sequences to Pfam HMMsthat correspond to Scop families. For SWIS-SPROT+TREMBL, this yielded an increase in fold assign-ment from 31% to 42% compared to using FASTA only. Thismethod assigned a structure to 22% of the proteins inSaccharomyces cerevisiae, 24% in Escherichia coli, and16% in Methanococcus jannaschii.
*To whom correspondence should be addressed. 1Present Address:Center for Genomics Research, Karolinska Institutet, S-171 77Stockholm, Sweden.Abbreviations: SW+TREMBL, swissprot-35 + trembl 5; Scop, astructural classification of proteins database; HMM, hidden Markovmodel; Pfam, the Pfam-A 3.3 database; Pfam-3D, the part of Pfam-A 3.3that is related to a protein of known structure.
Contact: [email protected]; [email protected] information: http://www.biokemi.su.se/∼arne/pfam-scop/
Introduction
The number of protein sequences in SWISSPROT (Bairoch andApweiler, 1996) and PIR (George et al., 1996) grows at an in-creasing rate as the genome projects proceed, while at the sametime the number of known protein structures in PDB (Abola etal., 1987; Bernstein et al., 1977) increases at a slower rate (Holmand Sander, 1996). This is widening the gap between knownprotein sequences and protein structures. However, a large por-tion of newly determined protein sequences and structures arehomologous to previously known proteins, resulting in theaccumulation of redundancy in protein databases (Brenner etal., 1995; Casari et al., 1996; Tatusov et al., 1996).
To manage and exploit this redundancy, efforts have beenmade to classify protein databases into clusters or families ofproteins that share certain features, such as sequence similar-ity, function, structure, or evolutionary origin. Both SWIS-SPROT and PIR contain family classification, and recentlythis has also been done systematically based on sequencesimilarity (Sonnhammer and Kahn, 1994; Wu et al., 1996;Linial et al., 1997; Sonnhammer et al., 1998a). A number ofstructure-based classification schemes of protein structuresin PDB are also available (Murzin et al., 1995; Orengo et al.,1997; Holm and Sander, 1997). For proteins of known 3Dstructure, it has proved feasible and advantageous to performthe classification on several hierarchical levels, ranging fromnearly identical structures, with high sequence similarity, to‘common fold’, with virtually no sequence similarity butshared topology of secondary structure elements. In contrast,most sequence-based classification schemes tend to be non-hierarchical, mainly because of the difficulty to define usefullevels of similarity for different hierarchical steps, and be-cause of the much larger amount of data to process. Anotherimportant issue in all protein classifications is how to definedomain boundaries, since each domain in a multi-domainprotein may belong to a different family.
�"�� � !"� ����
����% ������
480 � Oxford University Press 1999
BIOINFORMATICS
Comparison of sequence and structure protein domain families
481
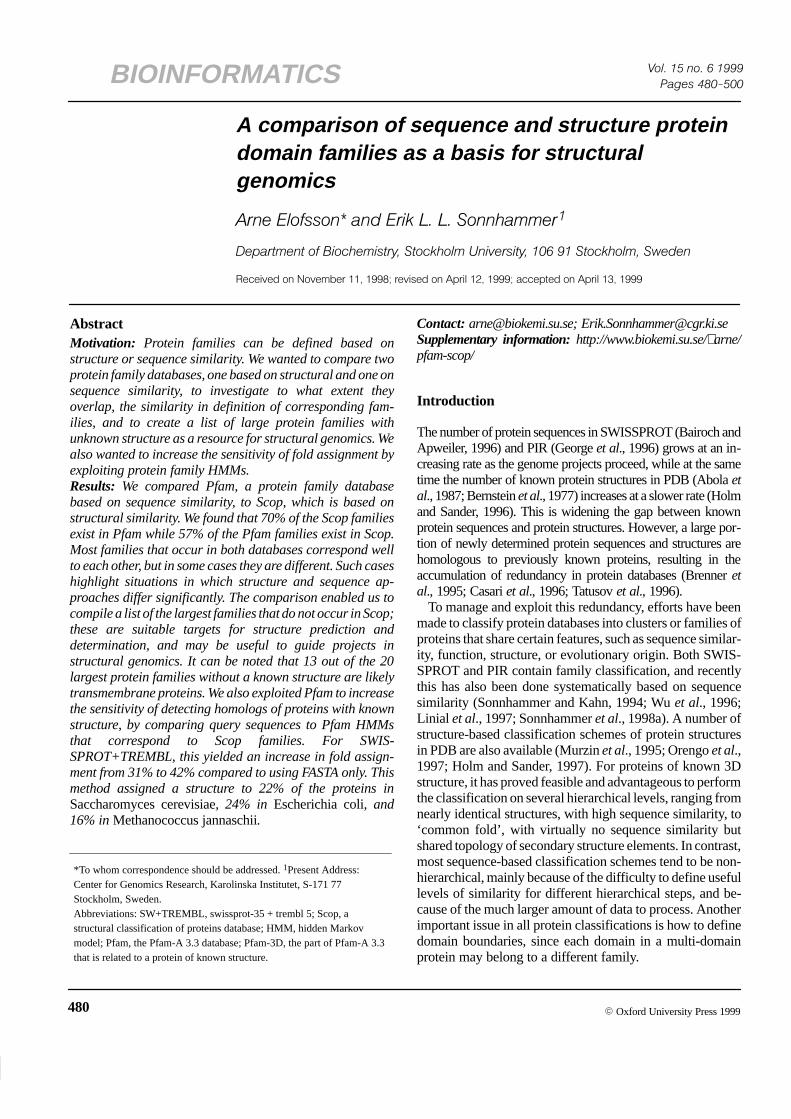
Table 1. Correspondence between databases
Fig. 1. Overall levels of correspondence between the Scop and Pfamprotein domain family databases. The percentages at the arrowsindicate the fraction of entries in one database that significantlymatches the database the arrow points to.
Most comparisons between classification schemes con-centrate on comparing sequence-based approaches to eachother or structure-based ones to each other. We wanted in-stead to compare sequence-based to structure-based classi-fications, in order to answer a number of questions. First, towhat extent do family definitions in sequence- and structure-based classifications overlap? In many cases, the familieswill overlap perfectly, but frequently they will overlap partlyor not at all. Partially overlapping families may reflect differ-ences in philosophy or techniques of the classificationschemes, whereas the total absence of a family in one classi-fication may indicate a difference in the underlying source ofdata. We here exploit the comparison for extracting largeprotein sequence families that are currently absent from
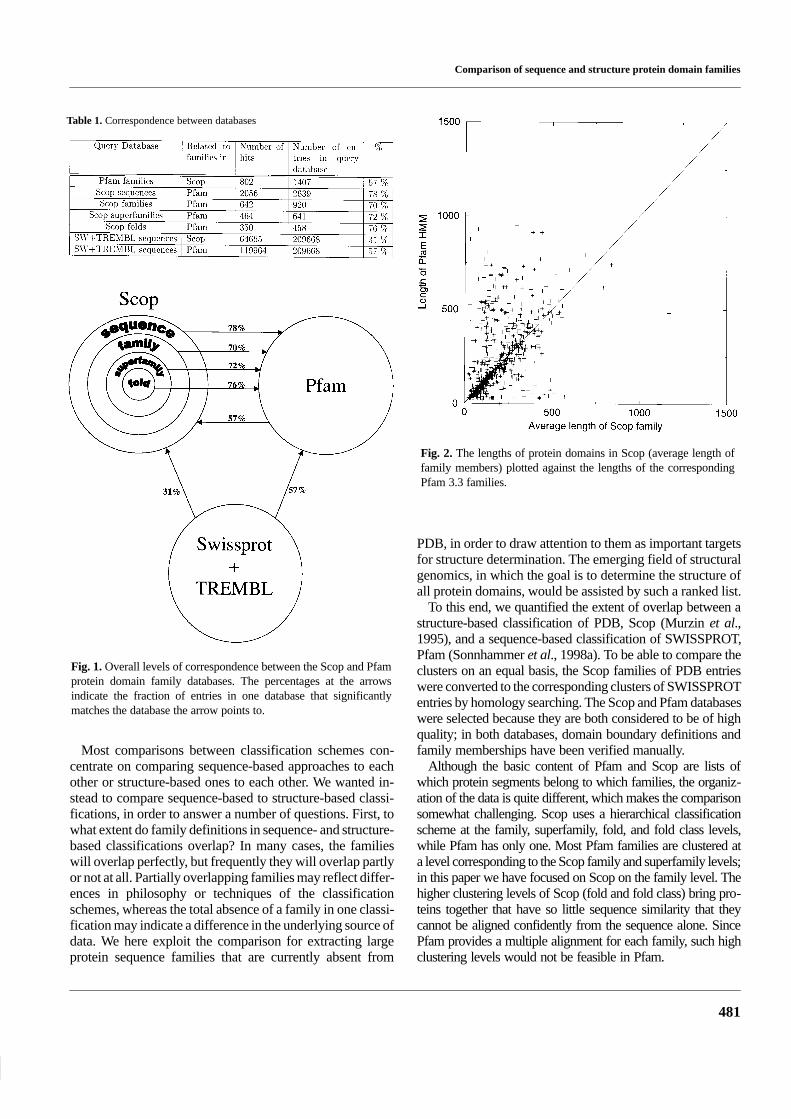
Fig. 2. The lengths of protein domains in Scop (average length offamily members) plotted against the lengths of the correspondingPfam 3.3 families.
PDB, in order to draw attention to them as important targetsfor structure determination. The emerging field of structuralgenomics, in which the goal is to determine the structure ofall protein domains, would be assisted by such a ranked list.
To this end, we quantified the extent of overlap between astructure-based classification of PDB, Scop (Murzin et al.,1995), and a sequence-based classification of SWISSPROT,Pfam (Sonnhammer et al., 1998a). To be able to compare theclusters on an equal basis, the Scop families of PDB entrieswere converted to the corresponding clusters of SWISSPROTentries by homology searching. The Scop and Pfam databaseswere selected because they are both considered to be of highquality; in both databases, domain boundary definitions andfamily memberships have been verified manually.
Although the basic content of Pfam and Scop are lists ofwhich protein segments belong to which families, the organiz-ation of the data is quite different, which makes the comparisonsomewhat challenging. Scop uses a hierarchical classificationscheme at the family, superfamily, fold, and fold class levels,while Pfam has only one. Most Pfam families are clustered ata level corresponding to the Scop family and superfamily levels;in this paper we have focused on Scop on the family level. Thehigher clustering levels of Scop (fold and fold class) bring pro-teins together that have so little sequence similarity that theycannot be aligned confidently from the sequence alone. SincePfam provides a multiple alignment for each family, such highclustering levels would not be feasible in Pfam.

A.Elofsson and E.L.L.Sonnhammer
482
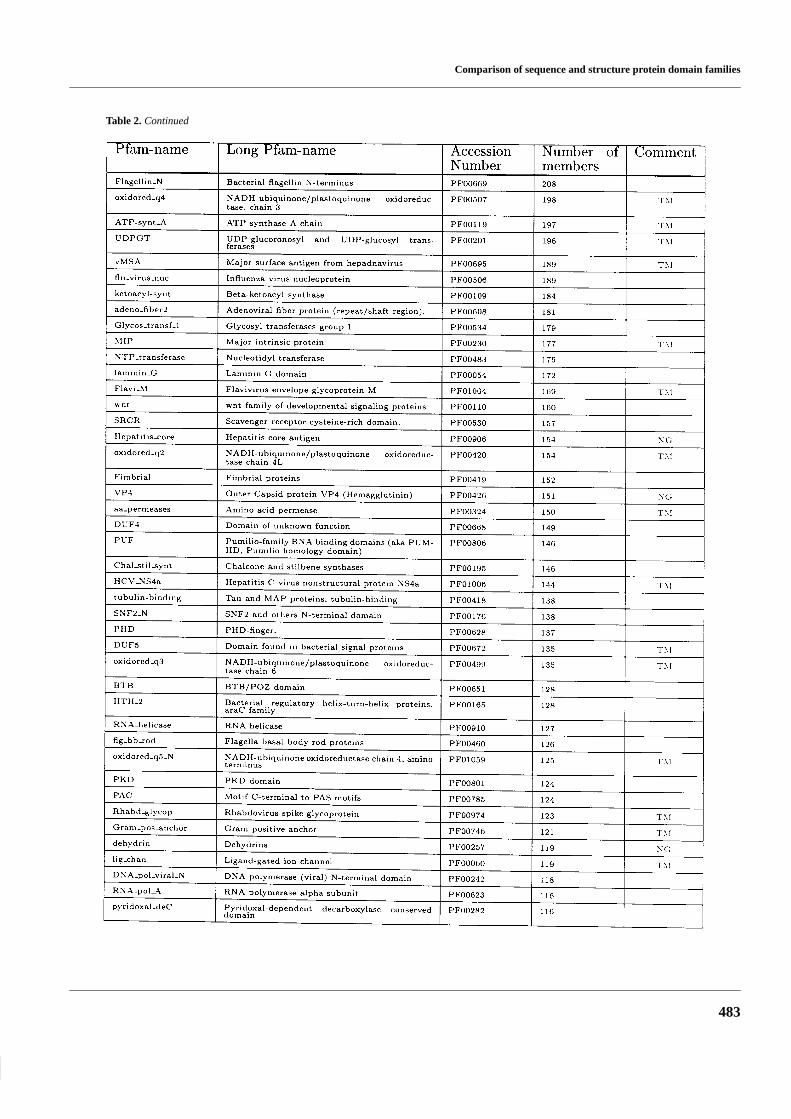
Table 2. List of the largest Pfam families without a match to a Scop family
The Pfam multiple alignments are used to generate hiddenMarkov model profiles (HMMs), which are used for sensitivedetection of family members (Krogh et al., 1994; Eddy, 1997).
We show that this can be exploited to find more members offamilies with a known structure than by pairwise methods suchas FASTA. We have further used this method to survey the frac-
Comparison of sequence and structure protein domain families
483
Table 2. Continued

A.Elofsson and E.L.L.Sonnhammer
484
Table 2. Continued
tion of proteins in three complete genomes, representing Euka-rya, Eubacteria and Archaea, that can be assigned a structure byhomology, and the fraction that matches a Pfam family.
Materials and methods
Pfam 3.3 (Sonnhammer et al., 1997; Bateman et al., 1999),containing 1407 families and corresponding HMMs, wasused with the HMMER package, version 2.1 (Eddy, 1997).The pdb95d set of Scop version 1.39 was used. In this setonly proteins that have less than 95% similarity to any otherprotein in Scop was included.
It should be mentioned that release 1.39 of Scop (filepdb95d_1.39) was later retracted by the Scop authors due toerrors. The current Scop release is thus 1.37, but since manysequences are missing from this release we favored using1.39 as the existing error did not seem to affect our results.
Each sequence from Scop was matched against the 1407HMMs of Pfam 3.3, using the family specific GA cutoff de-fined in Pfam. In some cases, significant similarities betweena Scop sequence and a Pfam family was not detected becausethe Scop entry corresponded to a subdomain while the Pfamfamily spanned the entire protein. To overcome this problem,we additionally matched all Scop sequences against a set ofHMMs that allowed fragmentary matches, using an E-valuecutoff of 1.e-5, and used the union of the global and fragmentmatches for further studies.
To predict if a Pfam family consists of membrane proteins,all sequences in the full Pfam alignment of that family weresubjected to two tests: transmembrane helix prediction by
TMHMM (Sonnhammer et al., 1998b), and scanning for theword ‘TRANSMEMBRANE’ in the keyword field of theswissprot entry. If more than 25% of the proteins containedat least one predicted transmembrane segment or the‘TRANSMEMBRANE’ keyword, the family was annotatedas ‘probably transmembrane’ in Table 2.
The ‘non-globular’ assignments of families in Table 2were generated with the program PSEG (Wootton, 1994) asfollows. Each sequence segment in the full Pfam alignmentswere subjected to PSEG complexity analysis in periodicities1 through 12 with threshold parameters (window = 60;trigger threshold = 3.15; extension threshold = 3.15). Theseparameters were found optimal in the following test: we re-quired a set of known non-globular domains to be found(myosin, kinesin, tropomyosin, proteoglycan core protein,histone H1, antifreeze protein A, collagen) while detectingas few segments as possible in Scop, assuming PDB to beessentially void of non-globular domains. Pfam families inwhich more than 5% of the members contained such non-globular segments were annotated as non-globular. In a fewcases we noticed that this method assigned transmembraneregions with low compositional complexity as non-globular;these conflicts were resolved manually.
To estimate the ‘real’ number of members in Scop familieswe counted the number of significantly (E-value < 1/data-base size) matching sequences in SWISSPROT 35 +TREMBL 5 (Bairoch and Apweiler, 1996) found by FASTA(Pearson and Lipman, 1988). This is the sequence databaseused for Pfam 3.3; it was also used for Figure 5 and is referredto in the text as SW+TREMBL.

Comparison of sequence and structure protein domain families
485
Fig. 3. Illustration of four types of discrepancy between family definitions in Scop and Pfam. The number of occurrences of each type in thisstudy is listed within brackets. (A) One Pfam family corresponds to multiple Scop families because it corresponds to Scop on the superfamilylevel. (B) One Pfam family corresponds to multiple Scop families because the proteins were split into multiple domains in Scop. (C) One Scopfamily corresponds to multiple Pfam families because in was split into subfamilies in Pfam. (D) One Scop family corresponds to multiple Pfamfamilies because the proteins were split into multiple domains in Pfam.
Three complete genomes from, Saccharomyces cerevisiae(Clayton et al., 1997), Escherichia coli (Blattner et al., 1997)and Methanococcus jannaschii (Bult et al., 1996) were down-loaded from http://www.sanger.ac.uk/Projects/C_elegans/Science98/protein_sets/ (sc and ec), http://www.ncbi.nlm.
nih.gov/cgi-bin/Entrez/ (mj) and matched to Pfam 3.3 HMMsusing the method described above for Scop. We also exploitedthe possibility to use the subset of Pfam that contains all familieswith a known structure, Pfam-3D, for fold recognition. A querysequence with a significant match to a Pfam-3D HMM was
A.Elofsson and E.L.L.Sonnhammer
486
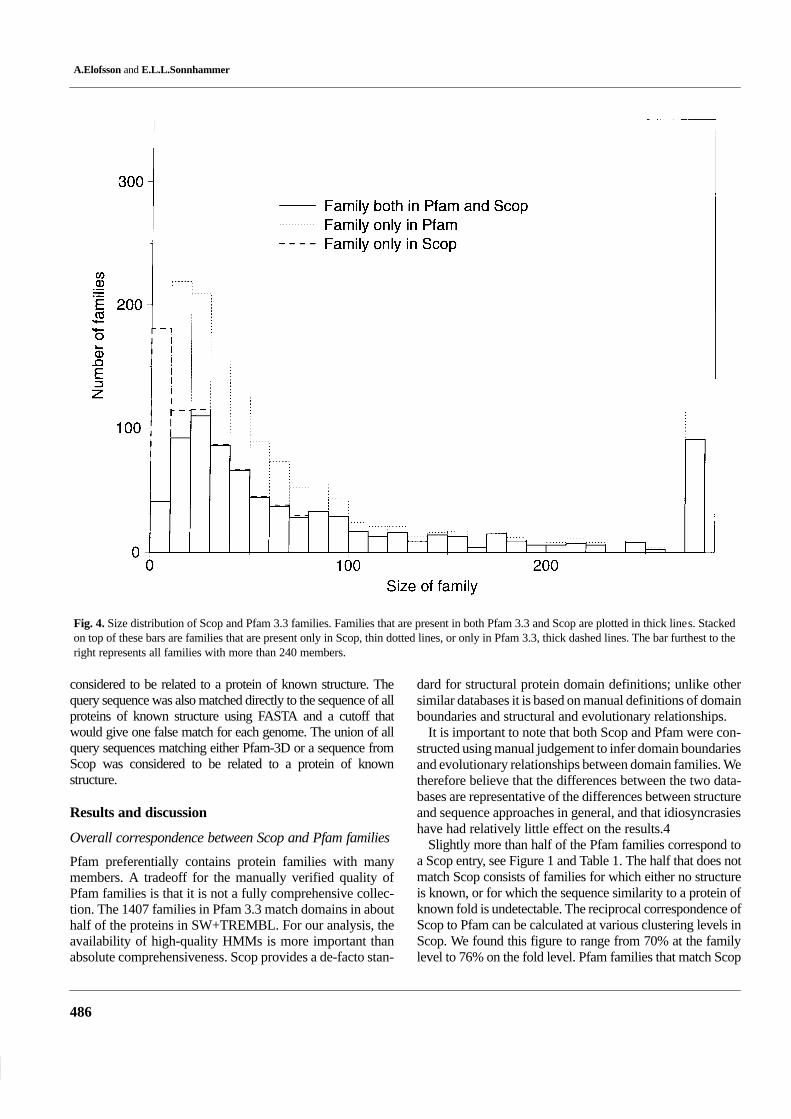
Fig. 4. Size distribution of Scop and Pfam 3.3 families. Families that are present in both Pfam 3.3 and Scop are plotted in thick lines. Stackedon top of these bars are families that are present only in Scop, thin dotted lines, or only in Pfam 3.3, thick dashed lines. The bar furthest to theright represents all families with more than 240 members.
considered to be related to a protein of known structure. Thequery sequence was also matched directly to the sequence of allproteins of known structure using FASTA and a cutoff thatwould give one false match for each genome. The union of allquery sequences matching either Pfam-3D or a sequence fromScop was considered to be related to a protein of knownstructure.
Results and discussion
Overall correspondence between Scop and Pfam families
Pfam preferentially contains protein families with manymembers. A tradeoff for the manually verified quality ofPfam families is that it is not a fully comprehensive collec-tion. The 1407 families in Pfam 3.3 match domains in abouthalf of the proteins in SW+TREMBL. For our analysis, theavailability of high-quality HMMs is more important thanabsolute comprehensiveness. Scop provides a de-facto stan-
dard for structural protein domain definitions; unlike othersimilar databases it is based on manual definitions of domainboundaries and structural and evolutionary relationships.
It is important to note that both Scop and Pfam were con-structed using manual judgement to infer domain boundariesand evolutionary relationships between domain families. Wetherefore believe that the differences between the two data-bases are representative of the differences between structureand sequence approaches in general, and that idiosyncrasieshave had relatively little effect on the results.4
Slightly more than half of the Pfam families correspond toa Scop entry, see Figure 1 and Table 1. The half that does notmatch Scop consists of families for which either no structureis known, or for which the sequence similarity to a protein ofknown fold is undetectable. The reciprocal correspondence ofScop to Pfam can be calculated at various clustering levels inScop. We found this figure to range from 70% at the familylevel to 76% on the fold level. Pfam families that match Scop
Comparison of sequence and structure protein domain families
487
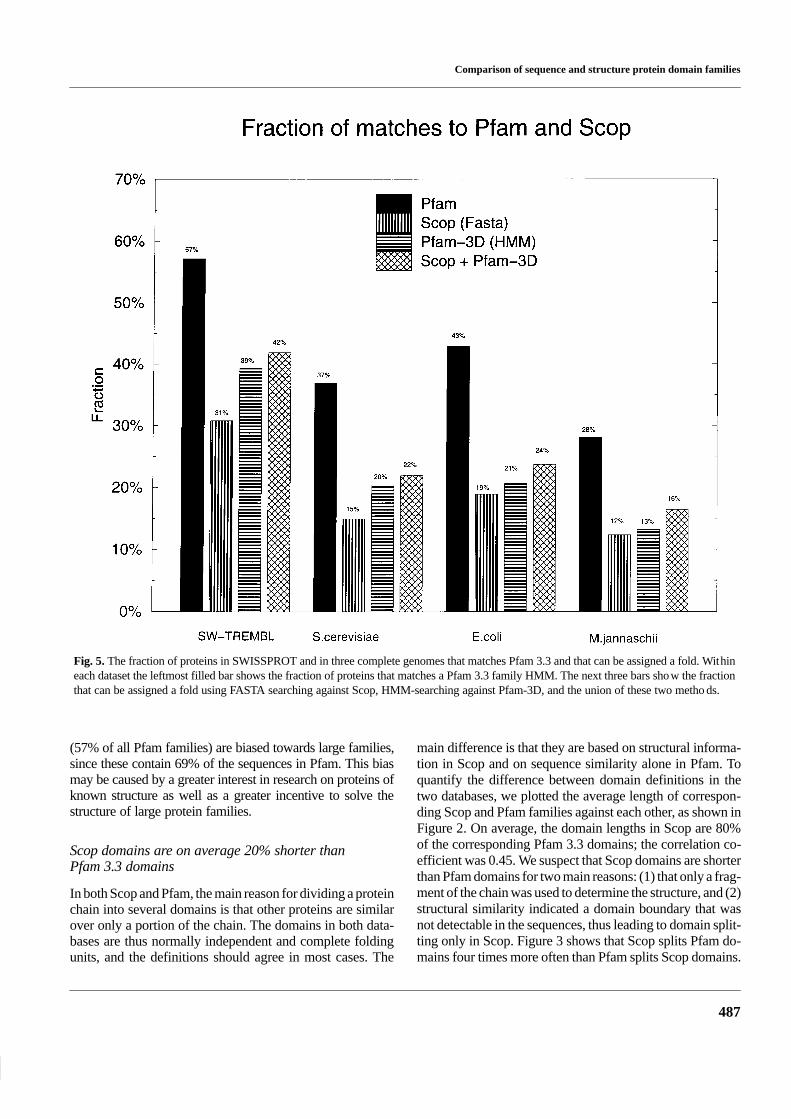
Fig. 5. The fraction of proteins in SWISSPROT and in three complete genomes that matches Pfam 3.3 and that can be assigned a fold. Withineach dataset the leftmost filled bar shows the fraction of proteins that matches a Pfam 3.3 family HMM. The next three bars show the fractionthat can be assigned a fold using FASTA searching against Scop, HMM-searching against Pfam-3D, and the union of these two methods.
(57% of all Pfam families) are biased towards large families,since these contain 69% of the sequences in Pfam. This biasmay be caused by a greater interest in research on proteins ofknown structure as well as a greater incentive to solve thestructure of large protein families.
Scop domains are on average 20% shorter thanPfam 3.3 domains
In both Scop and Pfam, the main reason for dividing a proteinchain into several domains is that other proteins are similarover only a portion of the chain. The domains in both data-bases are thus normally independent and complete foldingunits, and the definitions should agree in most cases. The
main difference is that they are based on structural informa-tion in Scop and on sequence similarity alone in Pfam. Toquantify the difference between domain definitions in thetwo databases, we plotted the average length of correspon-ding Scop and Pfam families against each other, as shown inFigure 2. On average, the domain lengths in Scop are 80%of the corresponding Pfam 3.3 domains; the correlation co-efficient was 0.45. We suspect that Scop domains are shorterthan Pfam domains for two main reasons: (1) that only a frag-ment of the chain was used to determine the structure, and (2)structural similarity indicated a domain boundary that wasnot detectable in the sequences, thus leading to domain split-ting only in Scop. Figure 3 shows that Scop splits Pfam do-mains four times more often than Pfam splits Scop domains.
A.Elofsson and E.L.L.Sonnhammer
488
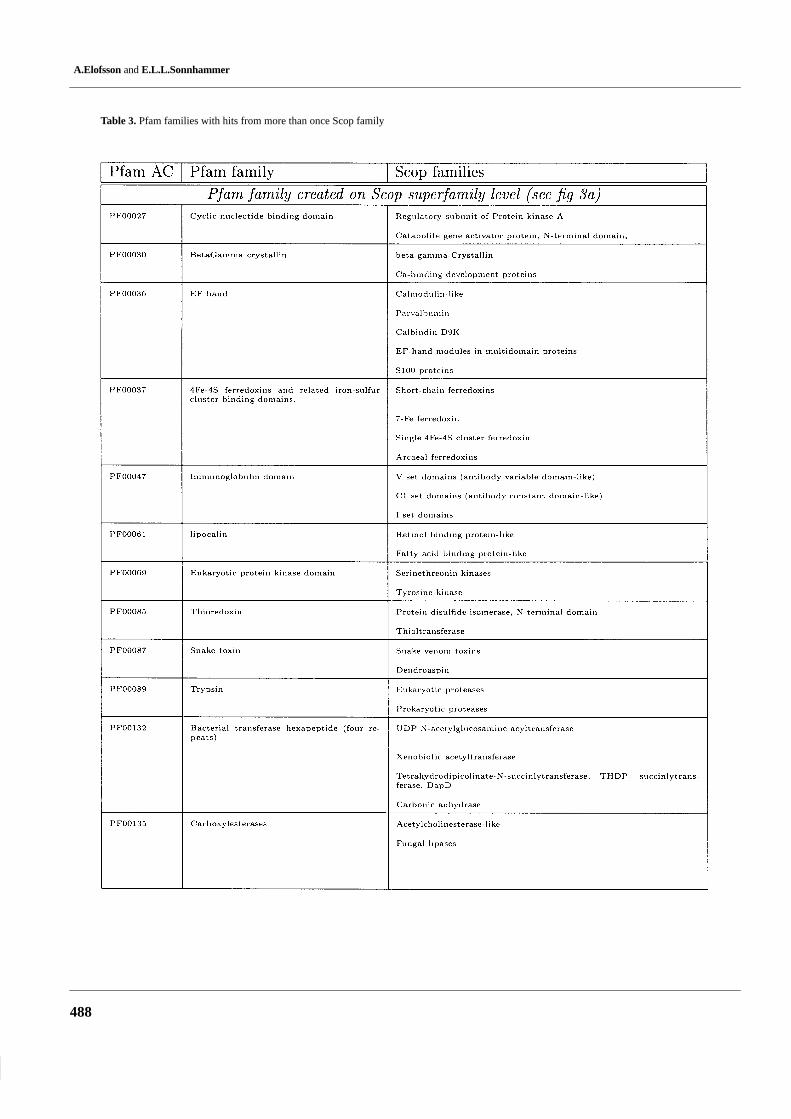
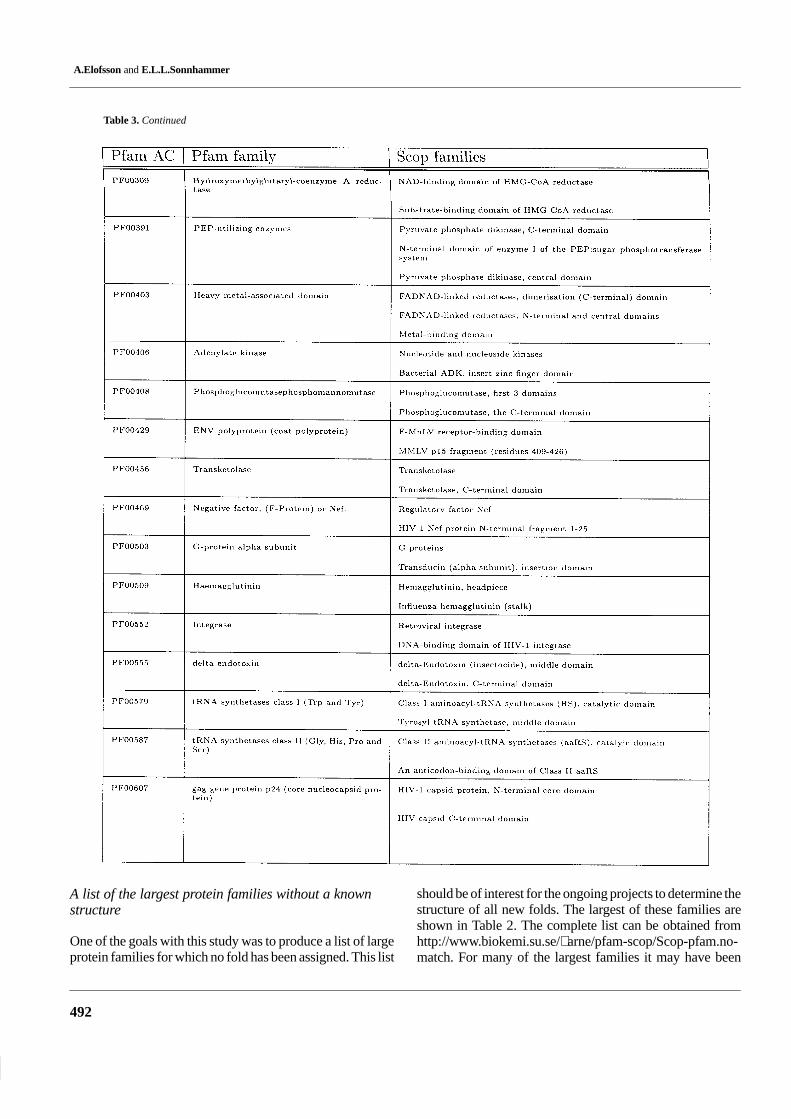
Table 3. Pfam families with hits from more than once Scop family
Comparison of sequence and structure protein domain families
489
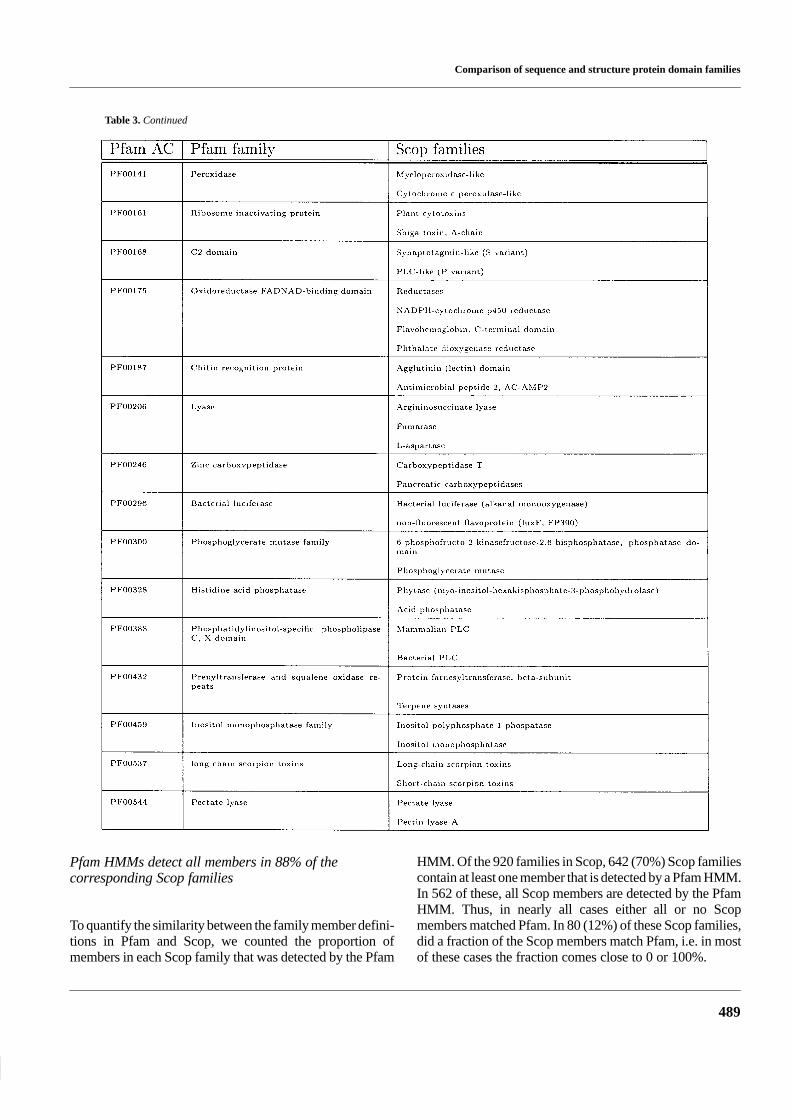
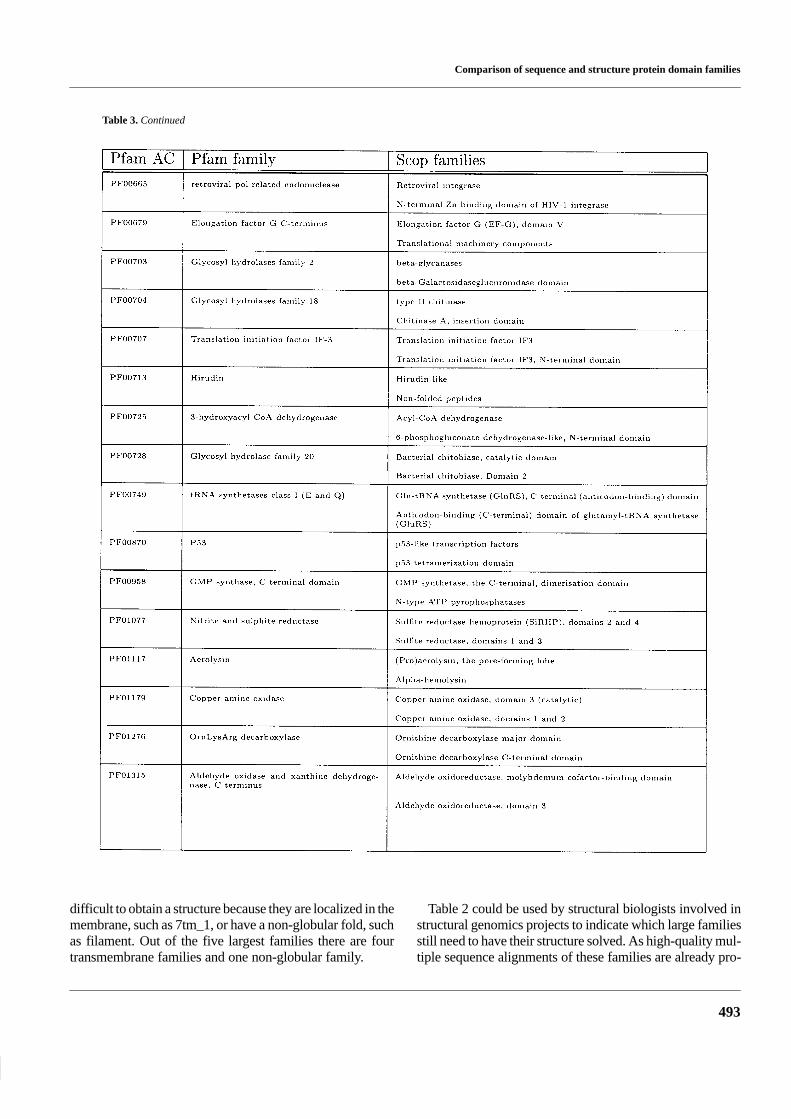
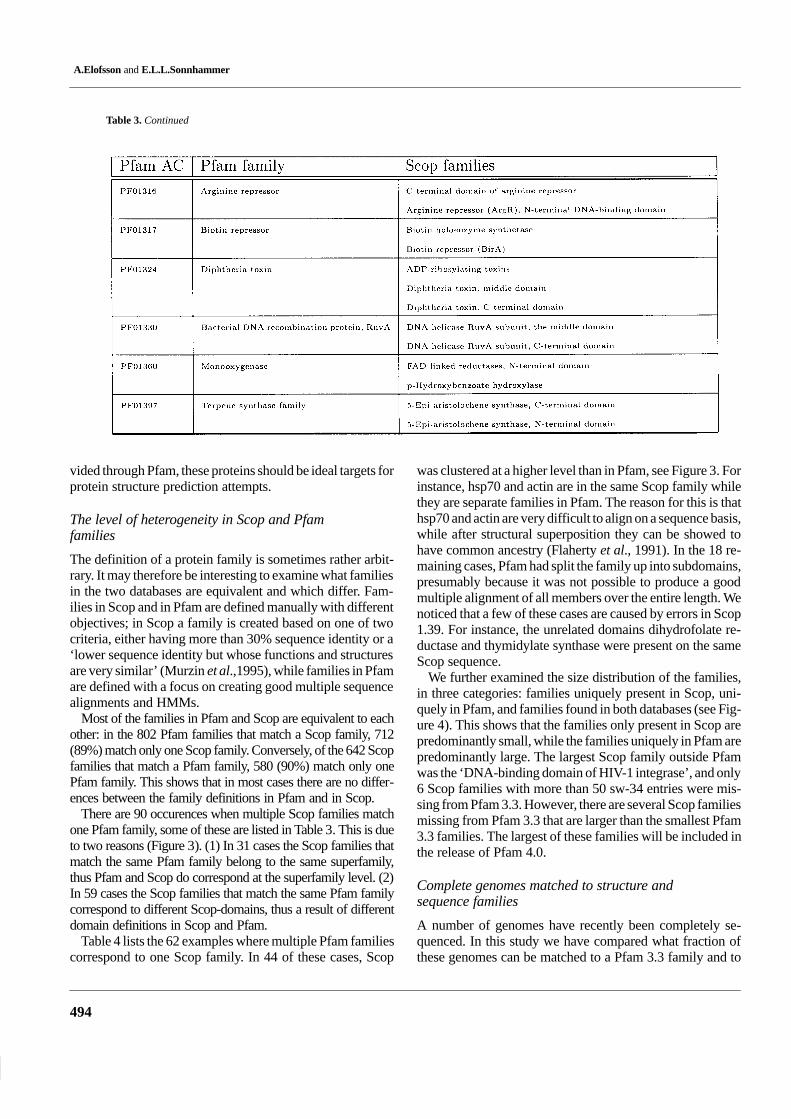
Table 3. Continued
Pfam HMMs detect all members in 88% of thecorresponding Scop families
To quantify the similarity between the family member defini-tions in Pfam and Scop, we counted the proportion ofmembers in each Scop family that was detected by the Pfam
HMM. Of the 920 families in Scop, 642 (70%) Scop familiescontain at least one member that is detected by a Pfam HMM.In 562 of these, all Scop members are detected by the PfamHMM. Thus, in nearly all cases either all or no Scopmembers matched Pfam. In 80 (12%) of these Scop families,did a fraction of the Scop members match Pfam, i.e. in mostof these cases the fraction comes close to 0 or 100%.

A.Elofsson and E.L.L.Sonnhammer
490
Table 3. Continued
There can be several reasons that one or more sequencesin the same Scop family are not detected by the Pfam HMM.(1) The protein missed is not closely related to all the othermembers of the family, i.e. according to Scop the proteinsbelong to the same family but the sequence identitity is too
low for automatic methods to detect this. (2) The Pfam HMMis defined over a smaller region in Pfam than in Scop. (3)Errors in Scop or in Pfam. By studying a few of these casesit seems as if (1) is the most common explanation to why asequence is missed.
Comparison of sequence and structure protein domain families
491
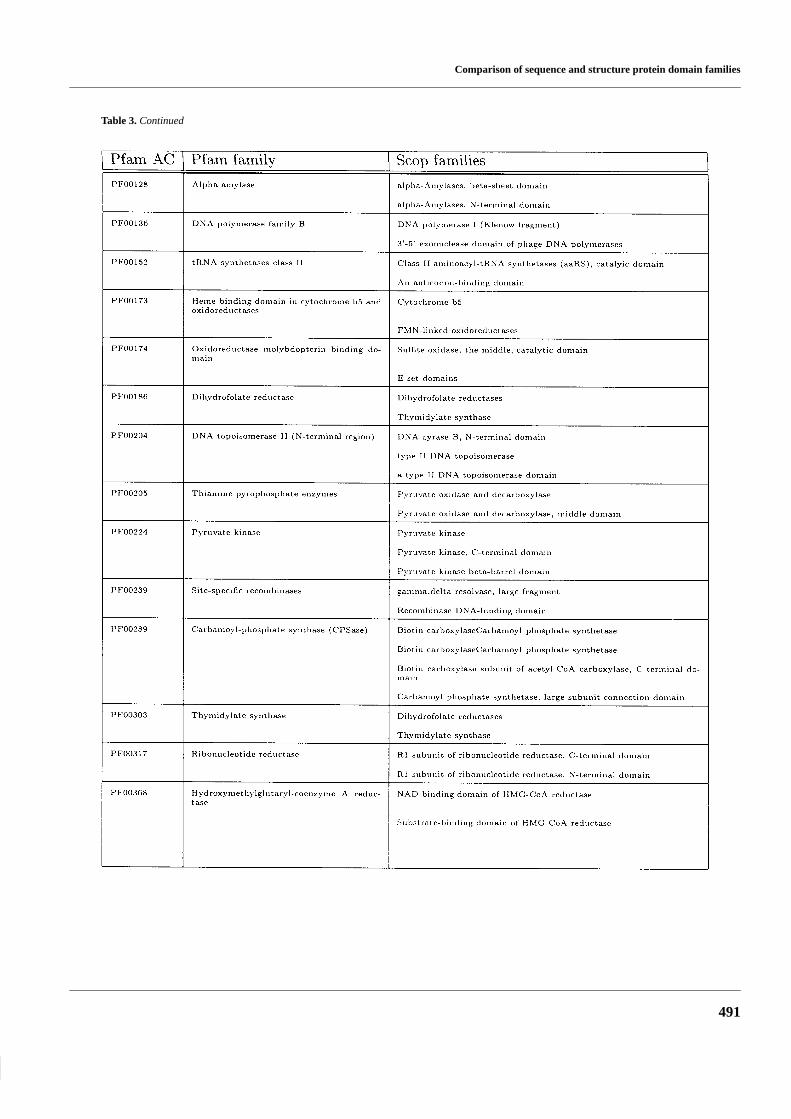
Table 3. Continued
A.Elofsson and E.L.L.Sonnhammer
492
Table 3. Continued
A list of the largest protein families without a knownstructure
One of the goals with this study was to produce a list of largeprotein families for which no fold has been assigned. This list
should be of interest for the ongoing projects to determine thestructure of all new folds. The largest of these families areshown in Table 2. The complete list can be obtained fromhttp://www.biokemi.su.se/∼arne/pfam-scop/Scop-pfam.no-match. For many of the largest families it may have been
Comparison of sequence and structure protein domain families
493
Table 3. Continued
difficult to obtain a structure because they are localized in themembrane, such as 7tm_1, or have a non-globular fold, suchas filament. Out of the five largest families there are fourtransmembrane families and one non-globular family.
Table 2 could be used by structural biologists involved instructural genomics projects to indicate which large familiesstill need to have their structure solved. As high-quality mul-tiple sequence alignments of these families are already pro-
A.Elofsson and E.L.L.Sonnhammer
494
Table 3. Continued
vided through Pfam, these proteins should be ideal targets forprotein structure prediction attempts.
The level of heterogeneity in Scop and Pfamfamilies
The definition of a protein family is sometimes rather arbit-rary. It may therefore be interesting to examine what familiesin the two databases are equivalent and which differ. Fam-ilies in Scop and in Pfam are defined manually with differentobjectives; in Scop a family is created based on one of twocriteria, either having more than 30% sequence identity or a‘lower sequence identity but whose functions and structuresare very similar’ (Murzin et al.,1995), while families in Pfamare defined with a focus on creating good multiple sequencealignments and HMMs.
Most of the families in Pfam and Scop are equivalent to eachother: in the 802 Pfam families that match a Scop family, 712(89%) match only one Scop family. Conversely, of the 642 Scopfamilies that match a Pfam family, 580 (90%) match only onePfam family. This shows that in most cases there are no differ-ences between the family definitions in Pfam and in Scop.
There are 90 occurences when multiple Scop families matchone Pfam family, some of these are listed in Table 3. This is dueto two reasons (Figure 3). (1) In 31 cases the Scop families thatmatch the same Pfam family belong to the same superfamily,thus Pfam and Scop do correspond at the superfamily level. (2)In 59 cases the Scop families that match the same Pfam familycorrespond to different Scop-domains, thus a result of differentdomain definitions in Scop and Pfam.
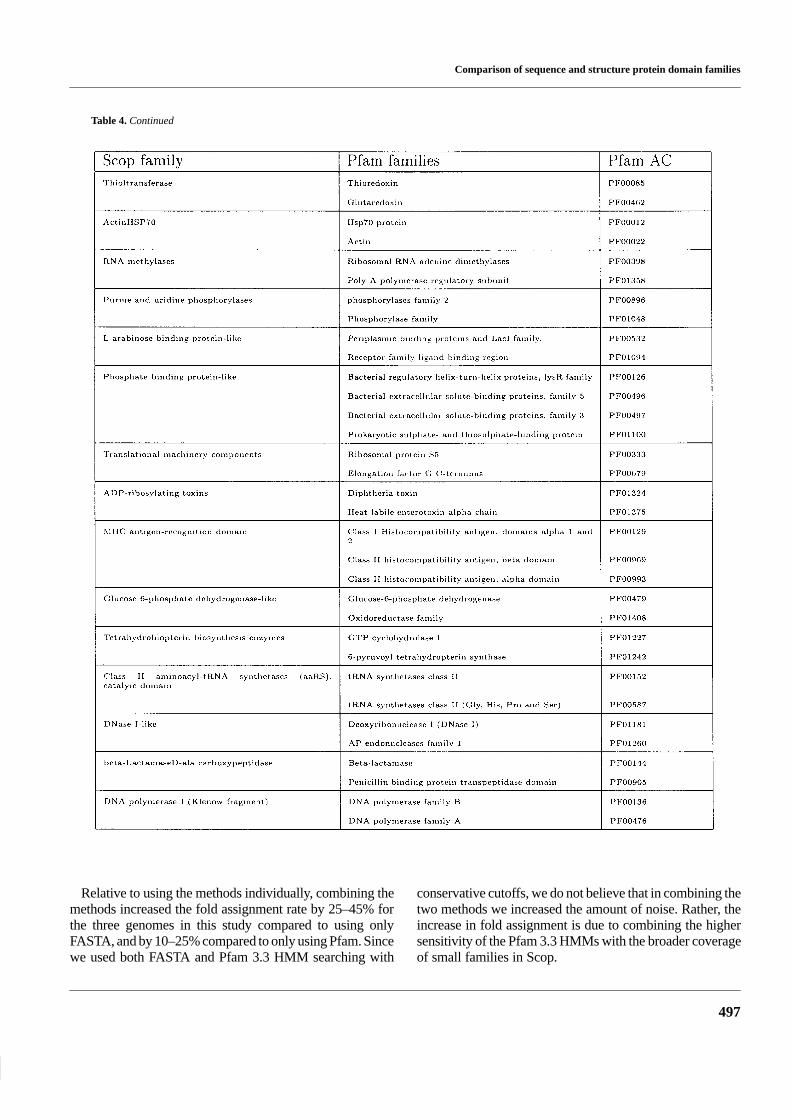
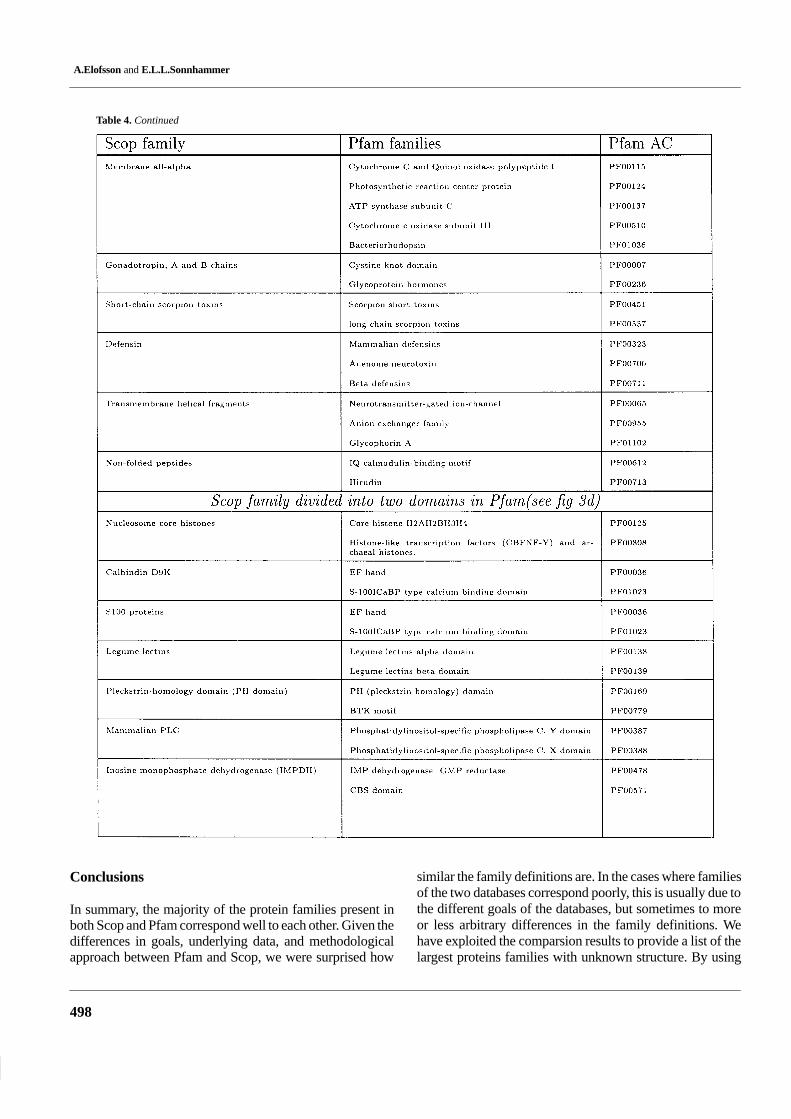
Table 4 lists the 62 examples where multiple Pfam familiescorrespond to one Scop family. In 44 of these cases, Scop
was clustered at a higher level than in Pfam, see Figure 3. Forinstance, hsp70 and actin are in the same Scop family whilethey are separate families in Pfam. The reason for this is thathsp70 and actin are very difficult to align on a sequence basis,while after structural superposition they can be showed tohave common ancestry (Flaherty et al., 1991). In the 18 re-maining cases, Pfam had split the family up into subdomains,presumably because it was not possible to produce a goodmultiple alignment of all members over the entire length. Wenoticed that a few of these cases are caused by errors in Scop1.39. For instance, the unrelated domains dihydrofolate re-ductase and thymidylate synthase were present on the sameScop sequence.
We further examined the size distribution of the families,in three categories: families uniquely present in Scop, uni-quely in Pfam, and families found in both databases (see Fig-ure 4). This shows that the families only present in Scop arepredominantly small, while the families uniquely in Pfam arepredominantly large. The largest Scop family outside Pfamwas the ‘DNA-binding domain of HIV-1 integrase’, and only6 Scop families with more than 50 sw-34 entries were mis-sing from Pfam 3.3. However, there are several Scop familiesmissing from Pfam 3.3 that are larger than the smallest Pfam3.3 families. The largest of these families will be included inthe release of Pfam 4.0.
Complete genomes matched to structure andsequence families
A number of genomes have recently been completely se-quenced. In this study we have compared what fraction ofthese genomes can be matched to a Pfam 3.3 family and to

Comparison of sequence and structure protein domain families
495
Table 4. Scop families with members that match more than one Pfam family
a protein of known structure, see Figure 5. Pfam 3.3 matches57% of the proteins in SW+TREMBL, while 37% of the pro-teins in Saccharomyces cerevisiae, 43% of the proteins inEscherichia coli, and 28% in Methanococcus jannaschiimatch Pfam 3.3. All assignments are available fromhttp://www.biokemi.su.se/∼arne/pfam-scop/pfam_scop_foldassignments.{swtrembl,ec,sc,mj}.gz. Asexpected, the figures for the complete genomes are lower
than for SW+TREMBL, since Pfam 3.3 is biased towards thelargest families in SW+TREMBL.
To determine the proportion of the proteins in these ge-nomes that can be assigned a fold, we used three differentmethods (see Materials and methods). First, a FASTA searchagainst Scop sequences was carried out for each protein se-quence. Second, the sequences were compared to the HMMsof ‘Pfam-3D’, the Pfam 3.3 families that significantly match

A.Elofsson and E.L.L.Sonnhammer
496
Table 4. Continued
a protein of known structure. Third, if either of the two previ-ous methods matched a sequence to a known structure, it wascounted as ‘structure known’, i.e. the union of the two previ-ous methods.
As seen in Figure 5, 31% of SW+TREMBL matched asequence of known 3D structure in PDB, and 39% matchedPfam-3D. The two methods combined could however assign
42% of SW+TREMBL to a known structure. Applied to pro-teins from completely sequenced genomes, the methodscombined could assign a structure to 22% of the proteins inS. cerevisiae and 24% in E. coli, and to 16% in M. jannaschii.These fold assignment rates are 25% higher than has beenreported in another study using FASTA only (Frishman andMewes, 1997).
Comparison of sequence and structure protein domain families
497
Table 4. Continued
Relative to using the methods individually, combining themethods increased the fold assignment rate by 25–45% forthe three genomes in this study compared to using onlyFASTA, and by 10–25% compared to only using Pfam. Sincewe used both FASTA and Pfam 3.3 HMM searching with
conservative cutoffs, we do not believe that in combining thetwo methods we increased the amount of noise. Rather, theincrease in fold assignment is due to combining the highersensitivity of the Pfam 3.3 HMMs with the broader coverageof small families in Scop.
A.Elofsson and E.L.L.Sonnhammer
498
Table 4. Continued
Conclusions
In summary, the majority of the protein families present inboth Scop and Pfam correspond well to each other. Given thedifferences in goals, underlying data, and methodologicalapproach between Pfam and Scop, we were surprised how
similar the family definitions are. In the cases where familiesof the two databases correspond poorly, this is usually due tothe different goals of the databases, but sometimes to moreor less arbitrary differences in the family definitions. Wehave exploited the comparsion results to provide a list of thelargest proteins families with unknown structure. By using

Comparison of sequence and structure protein domain families
499
Table 4. Continued
Pfam-3D in combination with Scop, the fraction of proteinsfor which a fold can be assigned was increased significantly.For proteins in complete genomes, this fraction was marked-ly lower in Methanococcus jannaschii than in Saccharo-myces cerevisiae and Escherichia coli.
Acknowledgments
We thank Gunnar von Heijne and Erik Wallin for valuablediscussions. AE was supported through grants from theSwedish natural science research council, the Swedish re-search council for engineering sciences and the Magnus Berg-vall foundation.
References
Abola,E., Bernstein,F.C., Bryant,S.H., Koetzle,T.F. and Weng,J.(1987) Data Commission of the international union of crystallo-graphy. In Allen,F.H., Bergerhoff,G. and Sievers,R. (eds), Data-bases-Information Content, Software Systems, Scientific Applica-tions, Protein Data Bank. Data Commission of the InternationalUnion of Crystallography, Bonn/Cambridge/Chester, pp. 107–132.
Bairoch,A. and Apweiler,R. (1996) The SWISS-PROT proteinsequence data bank and its new supplement TREMBL. NucleicAcids Res., 24, 17–21.
Bateman,A., Birney,E., Durbin,R., Eddy,S.R., Finn,R.D. and Sonn-hammer,E.L. (1999) Pfam 3.1: 1313 multiple alignments and profileHMMs match the majority of proteins. Nucleic Acids Res., 27,260–262.
A.Elofsson and E.L.L.Sonnhammer
500
Bernstein,F.C., Koetzle,T.F., Williams,G.J.B., Meyer Jr,E.F.,Brice,M.D., Rodgers,J.R., Kennard,O., Shimanouchi,T. and Tasu-mi,M. (1977) The Protein Data Bank: a computer-based archival filefor macromolecular structures. J. Mol. Biol., 112, 535–542.
Blattner,F.R., Plunkett,G.r., Bloch,C.A., Perna,N.T., Burland,V.,Riley,M., Collado-Vides,J., Glasner,J.D., Rode,C.K., Mayhew,G.F.,Gregor,J., Davis,N.W., Kirkpatrick,H.A., Goeden,M.A., Rose,D.J.,Mau,B. and Shao,Y. (1997) The complete genome sequence ofEscherichia coli K-12. Science, 277, 1453–1474.
Brenner,S., Hubbard,T., Murzin,A. and Chothia,C. (1995) Geneduplications in H. influenzae. Nature, 378, 140.
Bult,C.J., White,O., Olsen,G.J., Zhou,L., Fleischmann,R.D., Sut-ton,G.G., Blake,J.A., FitzGerald,L.M., Clayton,R.A., Gocayne,J.D.,Kerlavage,A.R., Dougherty,B.A., Tomb,J.F., Adams,M.D.,Reich,C.I., Overbeek,R., Kirkness,E.F., Weinstock,K.G., Mer-rick,J.M., Glodek,A., Scott,J.L., Geoghagen,N.S.M. and Venter,J.C.(1996) Complete genome sequence of the methanogenic archaeon,Methanococcus jannaschii. Science, 273, 1058–1073.
Casari,G., De Daruvar,A., Sander,C. and Schneider,R. (1996) Bioin-formatics and the discovery of gene function. Trends Genet., 12,244–245.
Clayton,R.A., White,O., Ketchum,K.A. and Venter,J.C. (1997) Thefirst genome from the third domain of life. Nature, 387, 459–462.
Downing,K.H. and Nogales,E. (1998) New insights into microtubulestructure and function from the atomic model of tubulin. Eur.Biophys. J., 27, 431–436.
Eddy,S.R. (1997) HMMER – Hidden Markov model software. URL:http://genome.wustl.edu/eddy/hmmer.html.
Flaherty,K., McKay,D., Kabsch,W. and Holmes,K. (1991) Similarityof the three-dimensional structures of actin and the atpase fragmentof a 70-kda heat shock cognate protein. Proc. Natl Acad. Sci. USA,88, 5041–5045.
Frishman,D. and Mewes,H.W. (1997) Protein structural classes in fivecomplete genomes. Nature Struct. Biol., 4, 626–628.
George,D.G., Barker,W.C., Mewes,H.-W., Pfeiffer,F. and Tsugita,A.(1996) The PIR-International Protein Sequence Database. NucleicAcids Res., 24, 17–21.
Holm,L. and Sander,C. (1996) Mapping the protein universe. Science,273, 595–603.
Holm,L. and Sander,C. (1997) Dali/FSSP classification of three-di-mensional protein folds. Nucleic Acids Res., 25, 231–234.
Krogh,A., Brown,M., Mian,I.S., Sjölander,K. and Haussler,D. (1994)Hidden Markov models in computational biology. J. Mol. Biol., 235,1501–1531.
Linial,M., Linial,N., Tishby,N. and Yona,G. (1997) Global self-organ-ization of all known protein sequences reveals inherent biologicalsignatures. J. Mol. Biol., 268, 539–556.
Miller,M.H. and Scheraga,H.A. (1976) Calculation of the structures ofcollagen models role of interchain interactions in determining thetriple-helical coiled-coil conformation. I. J. Polym. Sci., 54, 171.
Murzin,A.G., Brenner,S.E., Hubbard,T. and Chothia,C. (1995) SCOP:a structural classification of proteins database for the investigation ofsequences and structures. J. Mol. Biol., 247, 536–540.
Orengo,C.A., Michie,A.D., Jones,S., Jones,D., Swindells,M. andThornton,J.M. (1997) CATH – a hierarchic classification of proteindomain structures. Structure, 5, 1093–1108.
Pearson,W.R. and Lipman,D.J. (1988) Improved tools for biologicalsequence analysis. Proc. Natl Acad. Sci. USA, 85, 2444–2448.
Sonnhammer,E.L. and Kahn,D. (1994) Modular arrangement ofproteins as inferred from analysis of homology. Protein Sci., 3,482–492.
Sonnhammer,E.L., Eddy,S.R. and Durbin,R. (1997) Pfam: a com-prehensive database of protein domain families based on seedalignments. Proteins, Structure Function and Genetics, 28,405–420.
Sonnhammer,E.L., Eddy,S.R., Birney,E., Bateman,A. and Durbin,R.(1998a) Pfam: multiple sequence alignments and HMM-profiles ofprotein domains. Nucleic Acids Res., 26, 322–325.
Sonnhammer,E.L., von Heijne,G. and Krogh,A. (1998b) A hiddenMarkov model for predicting transmembrane helices in proteinsequences. In Proc. of Sixth Int. Conf. on Intelligent Systems forMolecular Biology. AAAI Press, Menlo Park.
Tatusov,R.L., Mushegian,A.R., Bork,P., Brown,N.P., Hayes,W.S.,Borodovsky,M. and Rudd,K.E. (1996) Metabolism and evolution ofHaemophilus influenzae deduced from a whole-genome compari-son with Escherichia coli. Curr. Biol., 6, 279–291.
Wootton,J.C. (1994) Non-globular domains in protein sequences:automated segmentation using complexity measures. ComputChem., 18, 268–285.
Wu,C.H., Zhao,S., Chen,H.L., Lo,C.J. and McLarty,J. (1996) Motifidentification neural design for rapid and sensitive protein familysearch. Comput. Applic. Biosci., 12, 109–118.