biology of the normal breast
TRANSCRIPT

Biology of the normal breast:
Relation to mammographic density and risk of breast cancer
Vilde D Haakensen
Department of Genetics Institute for Cancer Research
Oslo University Hospital Radiumhospitalet

© Vilde D. Haakensen, 2011 Series of dissertations submitted to the Faculty of Medicine, University of Oslo No. 1137 ISBN 978-82-8264-155-5 All rights reserved. No part of this publication may be reproduced or transmitted, in any form or by any means, without permission. Cover: Inger Sandved Anfinsen. Printed in Norway: AIT Oslo AS. Produced in co-operation with Unipub. The thesis is produced by Unipub merely in connection with the thesis defence. Kindly direct all inquiries regarding the thesis to the copyright holder or the unit which grants the doctorate.

Table of contents Acknowledgements Aims List of papers 1. Introduction……………………………………………………………………. 1 2. Development and physiology of the normal breast……………………………. 3
2.1. Breast development……………………………………………………. 3 2.2. Anatomy of the breast…………………………………………………. 7 2.3. Physiology of the breast……………………………………………….. 9
3. Molecular characterization of normal breast tissue…………………….…….. 13 3.1. Gene expression ……………………………………………….……... 13 3.2. Genomic alterations……………………………………...…….……... 15
4. Breast cancer risk……………………………………………………….…….. 17 4.1. Epidemiologic and hormonal risk factors……………………….……. 17 4.2. Mammographic density……..………………………………….…….. 21 4.3. Molecular alterations associated with breast cancer risk………….….. 27 4.4. Risk prediction tools……………………………………………....….. 29
5. Breast cancer development and progression…………………………….……. 31 5.1. Cancer stem cell or clonal evolution?.................................................... 31 5.2. The role of the microenvironment……………………………………. 32 5.3. Myoepithelial cells……………………………………………………. 33 5.4. Epithelial-mesenchymal transition…………………………………..... 34
6. Material and methods…………………………………………………………. 35 6.1. Subjects……………………………………………………………….. 35 6.2. Core biopsies………………………………………………………….. 36 6.3. Whole genome expression analysis…………………………………… 37 6.4. RNA data processing………………………………………………….. 38 6.5. Mammograms…………………………………………………………. 40 6.6. Exploratory data analysis……………………………………………… 42 6.7. Statistical testing………………………………………………………. 43 6.8. Bioinformatic analyses………………………………………………... 46
7. Brief summary of results……………………………………………………… 47 8. Discussion……………………………………………………………………... 51
8.1. Sample collection and methodological considerations…………………… 51 8.2. Biological considerations………………………………………………… 57
9. Main conclusions and future perspectives…………………………………….. 65 Reference list……………………………………………………………………… 70 Original papers……………………………………………………………………. 87 Abbreviations

Acknowledgements As a medical student I new that I wanted to work with cancer, and contacted Anne-Lise Børresen-Dale to hear if I could to my master thesis with her. Ever since my first meeting with her in Trondheim in 1998, her scientific enthusiasm has strengthened my determination to work with cancer –not only in the clinical world, but also within the research community. In the same period, Gunnar Kvalheim and Jahn Nesland were the skilful and encouraging supervisors of my first scientific publication.
Stein Kvalheim gave me trust and responsibility, under skilful guidance, from day one when I started as a registrar at the Norwegian Hospital. I truly enjoyed the clinical work with my colleagues and with patients facing one of the greatest existential challenges in their lives.
These two worlds that I encountered early in my career are both important to me and to the cancer patients and I hope I can combine the two during the rest of my career.
Åslaug Helland has been my supervisor and closest co-worker during the work that has lead to this thesis. I’m grateful for her presence, involvement, realism and ability to see possibilities in the project. She also a model in the way she combines a clinical and scientific career with a family life and still keeps a calm and positive attitude.
I would like to thank Anne-Lise for accepting me as a PhD-student and for being my supervisor. Her ability to grasp a complex situation and see new aspects of it is impressive and has contributed to my learning as well as to the projects.
This project is a collaboration with many and I would like to thank all those who have been involved.
A special acknowledgement goes to Giske Ursin for the overall contribution to the project, for epidemiologic input and for receiving me at University of Southern California Keck School of Medicine.
I would like to thank Ole Christian Lingjærde for commitment to the project and invaluable statistical contributions. I have truly enjoyed his exceptional ability to make statistics understandable and interesting.
Radiologists at six different hospitals in the country have taken time in a hectic clinical day to include women to this study. I would like to thank them all for their contributions and Marit Holmen in particular for her involvement in the project from the start – and in the future.
I have collaborated with and received help from many of my colleagues at the Department of Genetics. I would particularly like to thank Hilde, Caroline and Phoung for their contribution to the MDG study, to Silje and Ole Christian for endless R support, to Vessela and Margarethe for introducing me to the world of SNPs, to Therese for feedback on my writing and to many of my colleagues for answering questions and lending an ear when I needed it. I have greatly appreciated the scientific, social and athletic environment in the lab. Thank you all!
This study would never have been if it were not for the women who participated. I am immensely grateful to, impressed by and ever indebted to all the women who participated

in the project. They gave their time, tissue and information in order to prevent breast cancer deaths in future generations.
I gratefully acknowledge the University of Oslo for admitting me into the PhD program and the Norwegian Research Counsel of Norway and to the South-Eastern Norway Regional Health Authority for the grants and financial support of the project. I would also like to thank the opponents for taking the time to read, evaluate and discuss my thesis.
I would like to thank my friends and my family. My friends and colleagues in Acem give me an interesting and rewarding extracurricular time – which yields important experience to the benefit of both work and personal life. I am particularly grateful to my parents and Elsa and Haaken: Thank you for loving our girls and for helping us out when time is scarce! Thank you, Ole, for being an excellent academic role model.
Last, but not least, I would like to try to express how much my little family means to me. Thank you, Baard, for being my best friend, my partner and the parents our daughters and for being there also in tough times! You have given me time when you’ve had little to give. You are my anchor and give me my needed sense of belonging. And to the most beautiful two girls in the world: Iben and Tindra. You give me joy, diversion, frustration and affection. You are what really matter!
Oslo, January, 2011


Aims
The main aim of these studies was to explore the biology of normal breast tissue. This is
important in order to contribute to the creation of methods to identify women with high
risk of breast cancer and early stages of the disease.
To achieve this overall aim, we decided to focus on three main topics:
1. The variation in gene expression in normal breast tissue
2. The biology underlying mammographic density, one of the strongest breast cancer
risk factors.
3. The biology associated with high levels of serum estrogen.
The specific questions addressed to reach these aims were
1. Can the variation of gene expression patterns in breast tissue from healthy women
be used to identify subgroups of women with different breast biology?
2. If so, what are the biological differences between such subgroups?
3. Which genes have expression levels in normal breast tissue that are associated
with mammographic density?
4. Which genes have expression levels in normal breast tissue that are associated
with high levels of serum estradiol?
5. Which single nucleotide polymorphisms (SNPs) are associated with
mammographic density and/or serum estradiol levels?
6. Which mRNA transcripts mediate the genetic variation identified in pt 5?
7. Are the genes and SNPs identified in pt 3, 4 and 5 associated with risk for breast
cancer?


List of papers
Paper I Gene expression profiles of breast biopsies from healthy women identify a group with claudin-low featuresVilde D Haakensen, Ole Christian Lingjærde, Aleix Prat, Melissa A Troester, Marit Muri Holmen, Jan Ole Frantzen, Linda Romundstad, Dina Navjord, Torben Lüders, Margit Riis, Ida K Bukholm, Charles M Perou, Vessela N Kristensen, Giske Ursin, Anne-Lise Børresen-Dale, Åslaug Helland. Under review in Cancer Prevention Research.
Paper II Expression levels of uridine 5�-diphosphoglucuronosyltransferase genes in breast tissue from healthy women are associated with mammographic density Vilde D Haakensen, Margarethe Biong, Ole Christian Lingjærde, Marit Muri Holmen, Jan Ole Frantzen , Ying Chen, Dina Navjord, Linda Romundstad, Torben Lüders, Ida K Bukholm, Hiroko K Solvang, Vessela N Kristensen , Giske Ursin, Anne-Lise Børresen-Dale, Åslaug Helland. Br Ca Res, 2010, Aug.
Paper III Serum estradiol levels associated with specific gene expression patterns in normal breast tissue and in breast carcinomas Vilde D Haakensen, Trine Bjøro, Torben Lüders, Margit Riis, Ida K Bukholm, Vessela N Kristensen, Melissa Troester, Marit Muri Homen, Giske Ursin, Anne-Lise Børresen-Dale, Åslaug Helland. Submitted to Breast Cancer Research. Paper IV Identification of SNP markers with putative influence on mammographic density and breast cancer risk Biong M., Suderman M, Haakensen VD, Kulle B, Berg P, Gram IT, Dumeaux V, Ursin G, Helland Å, Børresen-Dale AL, Hallett M, Kristensen VN Manuscript


1. Introduction
The breast cancer survival rates have improved greatly over the past decades (1969: 65%,
2008: 88%, (1)). This is partly due to earlier diagnosis and better treatment. Still, this
disease is a major killer of women worldwide, with an age-standardized mortality-rate of
13% in Norway. The improvement seen on survival rates is not seen for breast cancer
prevention. The breast cancer incidence continues to increase in most countries. The main
reason is the poor understanding of the very first steps of breast carcinogenesis, including
the complex interactions of the different risk factors for the disease (2). We use
information about family history and BRCA-mutations to identify high-risk women, but
most women developing breast cancer are not in the high-risk groups. Better
identification of high-risk women will enable early diagnosis and possibly even
prevention of the disease.
Breast cancer is a disease where early diagnosis improves the prognosis. Mammographic
screening is used to detect the tumors early, but not all breast cancers are detected at
screening. Interval cancers are diagnosed between two screening sessions. These are
more often aggressive cancers with rapid growth (3) and do often occur in areas of
mammographic density (MD) due to masking (the tumor is radiologically dense and a
small tumor may not be visible in the dense areas) (4). Blood tests aimed at detecting
breast cancer are available (5), but there is today no reliable method of detecting the very
first steps of breast carcinogenesis and there is need for better tools for early detection
(6).
MD is a strong risk factor for breast cancer and may be used as an intermediate to inform
about breast cancer risk. The number of factors influencing such an intermediate may be
fewer, producing more powerful studies (7).
The anatomy and physiology of the normal, adult breast are well described. The last
decade there have been some publications focusing on the molecular biology and gene
expression of the healthy breast, but much is still unknown. A better understanding of the
molecular biology of the normal breast will make it easier to identify breasts that deviate
from the normal on the path towards malignancy. Finding molecular subgroups of
healthy breasts may help us identify high-risk groups and hence understand the molecular
1

mechanism involved in the development of the different breast cancer diseases.
2

2. Development and physiology of the normal breast
2.1 Breast development The breast originates in ectodermal tissue forming a ridge on either side of the ventral
aspect of the body from the groin to the axilla. The ridge regresses after 6 weeks of
gestation, except for the areas that develop into the breasts. Accessory nipples are
remnants of this ectodermal ridge that has not regressed fully. From 7 to 32 weeks of
gestation, the breast develops with invasion of mammary parenchyma in the stroma,
formation of epithelial buds, branching, acquisition of smooth muscle cells and formation
of ducts and the nipple. During these first months, estrogen receptor (ER) is not
detectable and the development occurs independently of estrogen. During the last
trimester, ER is expressed and the breast tissue is estrogen sensitive (8). In this period,
the level of pro-lactating hormones is high in maternal and fetal circulation, resulting in
the secretion of colostrum from the breasts of some newborn infants. The breasts regress
shortly after birth. Throughout childhood, the breasts remain immature and the growth is
isometric (9-11).
During puberty, maturation of the breasts occurs under influence of growth hormone and
estrogen. The ducts are elongated from the nipple and into the fat pads through the
terminal end buds which give rise to new branches of ducts. The stroma also contributes
to branching of the mammary ducts and there is a marked increase of adipose tissue in the
breast. A type 1 lobule is formed and consists of alveolar buds clustered around a
terminal duct (Figure 1). This is the most common lobule in nulliparous women. (10,11).
As number of alveolar buds in each lobule increases, type 2 and 3 lobules will form
(Figure 1), but only to a limited extent in a nulliparous breast.
The adult breast goes through cyclic changes during the menstrual cycle. In the luteal
phase there is high mitotic activity and development of the lobules. In the follicular
phase, the lobules are small and there is low mitotic activity.
3

Figure 1 The lobular structures of the normal human breast. Type 1 lobules are present from birth and are most prominent in the breasts of nulliparous and postmenopausal women. A limited number of type 2 lobules forms during puberty. Type 3 lobules are formed during the last trimester. Type 4 lobules are milk-secreting. After menopause, most type 3 lobules will regress to type 1 and 2 lobules. AB: Alveolar bud. TED: Terminal end bud. A) From http://www.abortionbreastcancer.com/maturity.htm B) From Russo and Russo, 2004 (11).
During pregnancy, further elongation and branching of the ductal system and growth of
the lobules is driven by female hormones and growth factors (9). As the ductal system
grows, the ductules mature into acini and type 4 lobules are formed. (11). The joint action
of estrogen, progesterone and prolactin are necessary for the final differentiation of the
mammary gland that leads to the reduced risk for breast cancer seen after the first full-
term pregnancy (12). After lactation, involution occurs, where the alveoli stop milk
production and decrease in number and the ducts collapse. Until menopause, breasts of
parous women still have more glandular tissue, with type 2 and 3 lobules, compared to
the breasts of nulliparous women (11).
The post-lactational involution is further enhanced by menopause when the levels of
estrogen and progesterone are dramatically reduced (9). During the menopausal
involution, a large proportion of the type 3 lobules will regress to type 1 and 2 lobules. In
4

postmenopausal women, type 1 lobules are most common, both in parous and nulliparous
women (11).
Interestingly, the proliferative activity (measured by Ki67-staining) is significantly higher
in type 1 than in type 2 and 3 lobules (which are the most common lobules in parous
women) (11). This is also the type of lobule where most breast cancers are believed to
arise (13). The difference in activity between the different types of lobules is greater in
nulliparous women; parity reduces the proliferative activity of the mammary epithelium.
For both groups of women, breast epithelial proliferation is greatly reduced by
menopause, but even for postmenopausal women, nulliparous women have a higher
proliferative rate. This may explain why, in postmenopausal women, nulliparous women
still have a higher risk of developing breast cancer despite the fact that both groups of
women have predominantly type 1 lobules (11).
Mammary stem cell
The origin of the luminal and myoeptihelial cells has been suggested to be mammary
stem cells (MaSC) (Figure 2). Stem cells divide asymmetrically and give rise to one cell
identical to itself (with infinite replicative potential) and to a progenitor differentiating
into the myoepithlial or luminal lineage in a hierarchical fashion (14). MaSC are able to
express telomerase (15), and have an infinite replicative potential and remain in the body
as active, replicating cells from embryogenesis into adult life, and do therefore have a
higher risk of accumulating oncogenic alterations than other cell types (8).
The MaSc is thought to reside in the basal compartment of the epithelium in the ducts
(Figure 2). Recent research has however suggested that the precursor of the two breast
epithelial cell types resides in the luminal lineage (for review, see (16)). Luminal
epithelial cells can, under specific conditions; become immortal and acquire
myoepithelial/basal-like characteristics (17) (18). The hypothesis that MaSCs reside in
the luminal lineage is supported by recent studies of breast cancer showing that luminal
epithelial cells invade more intensely than basal cells and that metastatic tumors often
have a luminal phenotype (CD24+) even when the primary tumor is enriched in basal-
like cells (CD44+) (16,19).
5

MaSC are ER and PR negative (20) and two recent studies indicate that they are
regulated by estrogen and progesterone through paracrine mechanisms from receptor
positive neighboring cells (21,22). High levels of endogenous or exogenous estradiol
and/or progesterone increased the pool of stem cells (characterized as CD49+/CD24-)
and that deprivation of these hormones dramatically reduced the amount of cells counted.
Figure 2 A) A hypothetical and simplistic illustration of the relation between the mammary stem cell (MaSC) and its progeny. B) An illustration of the normal terminal duct lobular unit. Hypothetical location of different cell types (colored as in A). The gray line is the basement membrane. CK14: cytokeratin 14; MUC1: mucin 1. From Polyak et al (23)
6

2.2 Anatomy of the breast The anatomy of the adult female breast was first described by Cooper in 1840 (24) and
depicted in Figure 3. The adult breast consists of 15-20 lobes each branched into lobules
with 10-100 milk producing alveoli called terminal ductal lobular units (TDLUs) (Figure
1). The ducts lead the milk from the lobules to the nipple. Most breast cancers arise in the
ductal epithelium. The epithelium of human breasts consists of two main cell types,
present from 14 weeks of gestation and described by the staining of different keratins:
Luminal epithelial cells facing the lumen of the ducts and lobules and basal/myoepithelial
cells lining the basal membrane(16). In the ducts, myoepithelial cells form a continuous
layer in close contact with the basement membrane and most of the communication with
the stroma is mediated by these cells. In the alveoli on the other hand, the luminal
epithelial cells are in direct contact with the basement membrane (25). Surface markers
specific for luminal and myoepithelial cells are listed in Table 1.
Figure 3A) Anatomy of the human breast. From http://radonc.ucsd.edu/patientinformation/programs/breastCancer.aspB) A cross section of the mammary duct. From Adriance et al (26).
7

Table 1 Gene expression markers suggested to identify different mammary cell types
Cell�type� Surface�marker� Gene�symbol� Reference�Mucin�1� MUC1/EMA� O'Hare�et�al,�1991�(27)��3�integrin� ITGB3/CD61� Asselin�Labat�et�al,�2007�(28)�
Luminal�epithelial�cells� Cytokeratins�7,�8,�18�and�19� K7,�K8,�K18,�K19� Clayton�et�al,�2004�(29)�
���smooth�muscle�actin� SMA� Gugliotta�et�al,�1988�(30)�
Common�acute�lymphoblastic�leukaemia�antigen� CALLA/CD10/MME� O'Hare�et�al,�1991�(27)�
Myo�epithelial�cells� �6-integrin� ITGA6/CD49f� Clayton�et�al,�2004�(29)�� Cytokeratins�5�and�14� K5,�K14� Clayton�et�al,�2004�(29)��� Vimentin�� VIM� Clayton�et�al,�2004�(29)�
Cytokeratins�14�and�19�� K19�and�K14�1) Villadsen�et�al,�2007�(14)�Mammary�stem�cells� Cluster�of�differentiation�24� CD24�2) Shackleton�et�al,�2006�(31)�
� �6-integrin� ITGA6/CD49f�3) Shackleton�et�al,�2006�(31)�� �1�integrin� ITGB1/CD29�3) Shackleton�et�al,�2006�(31)�� Aldehyde�dehydrogenase�1� ALDH1� Ginestier�et�al,�2007�(32)�
�B�lymphoma�Mo�MLV�insertion�region�1�� BMI1� Liu�et�al,�2005�(33)�
��Epithelial�cell�adhesion�molecule/epithelial�specific�antigen�
EPCAM/ESA/TACSTD1� Stingl�et�al,�1998�(34)�
1)�Co�expression�of�K19�and�K14� �2)�Co�expressed�with�CD29�or�ITGA6/CD49�3)�Co�expressed�with�CD24� �
8

2.3 Physiology of the breast
Female steroid hormones and receptors
Estrogen and progesterone are steroid hormones produced in the ovaries. Both hormones
are needed for normal breast development and function (11,35). Their receptors are
localized in the nucleus and the activated receptor complexes bind to the promoter region
of target genes and act as transcription factors (Figure 4). The receptor complexes also
activate cytoplasmic signaling cascades.
Figure 4 Estrogen binds to the estrogen receptor in the cytoplasm and cause dimerization of the receptor and translocation to the nucleus. In the nucleus the receptor complex binds to estrogen responsive elements of the DNA to induce transcription of target genes. The activated receptor complex may also induce cytoplasmic signaling cascades.
Estrogen receptor (ER) (isoforms � and �), coded by two different genes, is expressed in
several tissues, including breast, endometrium, prostate and brain. The two isoforms are
expressed in different cells; they regulate different genes and do sometimes oppose each
other in function. The expression of ER� (but not ER�) is down-regulated as estrogen
levels increase. High expression of mammary epithelial ER� is common
postmenopausally, as a response to reduced estrogen levels, and indicate non-
proliferative cells (36). The two receptors are also affected differently by treatment. In
breast cancer cells tamoxifen treatment increase the levels of ESR� whereas aromatase
inhibitors increase the levels of ER�(37).
Progesterone receptors (PR) (isoforms � and �) exist in several tissues, including the
breast, endometrium and brain. PR is mostly induced by estrogen receptor (ER)-activated
transcription in presence of epithelial growth factor (EGF), although some ER-
9

independent expression of PR also occurs (38). Progesterone and PR are necess
development and differentiation of the lobules and alveoli (TDLUs) (39). Progesterone
reduce proliferation and increase apoptosis in normal breast epithelial cells and oppose
the proliferative action of estrogen (12). Expression of PR� is reduced in pregnant and
parous women and low levels of this receptor is suggested as a marker of reduced risk fo
BC (40).
Epithelial c
ary for the
r
ell proliferation
epithelial cells express ER and PR, ER is expressed to a
e
is
by
ng epithelial cells are PR� positive and the effect of progesterone on the
d
Only 7-10% of normal breast
higher degree in lobules than in ducts (41). Both receptor types are also expressed in th
stromal cells (36). ER� is restricted to the nuclei of some luminal epithelial cells, but
ER� is expressed more widely (at all developmental stages of the breast) and staining
seen in the nuclei of luminal and basal epithelial cells as well as in stromal cells (both
fibroblasts and endothelial cells) (42,43). The proliferating epithelial cells are not found
to express ER� (44) and most often these are negative to both ER isoforms (43). In
normal tissue, the estrogen-induced epithelial proliferation is, at least partly, caused
paracrine signals such as stroma-derived hepatocyte growth factor (HGF) from ER+
fibroblasts (45)
Some proliferati
mammary epithelium can be both direct and paracrine through PR positive stromal cells
(46). In the menstrual cycle, proliferation of the epithelial cells in the TDLU increases
along with the dramatic increase in serum progesterone level in the luteal phase. The
proliferative role of progesterone is also supported by animal studies showing increase
proliferation of epithelial cells when estrogen and progesterone are given in combination
compared with estrogen alone (38,46).
10

Endocrinology of menopause
Menopause is the permanent loss of ovarian function leading to cessation of menstruation
(for review see (47)). Menopause is recognized one year after the last menstruation.
Women are born with a fixed number of ovarian follicles that mature one for every
ovulation. From the late 30s, the number of remaining follicles decline rapidly. When
only about 10follicles remain, irregular menstruation will start, and at menopause few
follicles are left (48). The ovarian follicles produce both estrogen and the hormone
inhibin B, which inhibits secretion of follicle stimulating hormone (FSH) as part of a
negative feedback-system (see Figure 5). As the number of follicles is reduced, less
inhibin B is produced, which in turn leads to an increase in FSH-secretion. These
alterations occur while regular menstruation is still taking place. The elevated levels of
FHS ensure stable estradiol levels despite reduced number of follicles. Eventually, there
is loss of ovarian function, decline in production of estradiol and progesterone and
increase in both pituitary hormones FSH and luteinizing hormone (LH). In the
menopausal transition, the serum levels of FSH and estradiol are varying, and diagnosing
menopause on these to parameters alone is not possible (47).
Figure 5 The hypothalamic regulation of gonadal sex hormones. Gonadotropin increases release of FSH and LH which stimulate ovarian secretion of sex hormones (estradiol and progesterone) and inhibins. The sex hormones and inhibins subsequently reduce the secretion of gonadotropin. The Anti-Mullerian hormone (AMH) is not involved in the feedback-loop. GnRH = gonadotropin-releasing hormone; LH =luteinizing hormone; FSH = follicle stimulating hormone; AMH=Anti-Mullerian hormone. From Burger (47).
11

12

3. Molecular characterization of normal breast tissue
3.1 Gene expression
There is extensive literature about the molecular biology of breast cancer, but a limited
number of studies focusing on the molecular patterns in breasts of healthy women.
There are, a growing number of studies characterizing the gene expression patterns of
normal mammary epithelium, and partly other cells in the normal breast. Studies of
protein expression from single genes by immunohistochemistry, gene expression by
polymerase chain reaction (PCR) or blotting in non-cancer tissues are frequent (49-51).
Whole genome expression profiling of normal breast tissue is less frequent, but the last
years, several studies have been performed. Most studies compare different normal breast
cell types from breasts with cancerous lesions or compare normal and malignant breast
tissue/cells (52-54). Some studies relate gene expression profiles of normal breast
tissue/cells to other clinical features (55) or to treatment response (56).
Cell type specific gene expression profiles
The first whole genome expression profiling of different cell types from normal breast
tissue and breast cancers was published by Polyaks group in 2004 (57). They isolated
epithelial cells, myoepithelial cells, infiltrating lymphocytes, endothelial cells and
fibroblast-enriched stroma from two mammoplasty reductions, two ductal carcinoma in
situ (DCIS), 13 invasive carcinomas, a fibroadenoma and a phyllodes tumor. They used
antibodies against EpCAM/ESA (epithelial cells), CD45 (lymphocytes), P1H12
(endothelial cells), CD10/CALLA/MME (myoepithelial cells) to separate the cell types.
Lymphocytes were removed before isolation of myoepithelial cells to avoid
contamination due to lymphocytic expression of CD10. Serial analysis of gene expression
(SAGE) was used to generate cell-specific SAGE libraries and Monte Carlo analysis used
to identify differentially expressed genes. They also demonstrated large differences in
molecular profiles between normal and malignant cells in all cell types.
Another group has performed two studies(58,59) providing gene expression profiles
characteristic of normal luminal and myoepithelial cells. Both studies used
13

immunomagnetically sorting of primary cultures from mammoplasty reductions to
separate the two cell types with MUC1/EMA as a luminal marker and
CD10/CALLA/MME as a myoepithelial marker followed by negative selection using
EpCAM/ESA (epithelial cells) and integrin �4 (ITGB4) (myoepithelial cells). Their
profiles were partly overlapping, and established myepithelial (LGALS7, S100A2,
SPARC and CAV1) and luminal (CD24, LCN2, CLDN4, MUC1 and SEMA3B) markers
were identified in both studies. These studies did not remove lymphocytes prior to
isolation of myoepithelial cells. Gene ontology-terms enriched in the myoepithelial-
specific gene lists do not, however, include lymphocyte-related terms, and significant
lymphocyte contamination is therefore unlikely.
Two groups studied epithelial and stromal cells from mammplasty reductions and breast
cancer patients after laser capture microdissection and published stromal-related gene
expression profiles (60,61). Their studies provided gene expression profiles characteristic
for the stromal cells compared with epithelial cells. The profiles of normal stromal cells
compared with normal epithelial cells published in the two papers, overlapped with about
40%.
Polyaks group has analyzed cells from mammoplasty reductions comparing stem-like
cells (CD44+) suggested to be progenitor cells compared with luminal epithelial cells
(CD24+) (19). Gene expression profiles of putative progenitor cells are also published by
Eaves group. They isolated and cultured primitive bipotent and luminal restricted
progenitor cells and generated gene expression profiles compared to mature luminal and
myoepithelial cells (62).
Such cell-specific gene expression profiles give important information about the biology
of the respective cell. They also serve an important role as a comparison with gene lists
generated from other studies of different cells/tissues. This study uses several of these
gene lists to explore the nature of a subgroup of our normal tissue biopsies.
Subtypes of normal breast tissue
Variation in gene expression of normal breast tissue is not studied. More than a decade
ago, study of variation in gene expression of breast tumors resulted in the first
identification of breast cancer subtypes (63,64). Analyses of whole biopsies of breast
14

cancer tissue allowed an overall profile of biological features from all cell types
combined. Similar to the clinical relevance of breast cancer subtypes, subtypes of normal
breast tissue may be related to clinically important variables such as breast cancer risk.
Source of normal material
Mammoplasty reduction is the most widely accepted normal human breast tissue used for
research. Several groups have used histologically normal tumor adjacent tissue as control
in cancer-studies. The impact of the source of normal tissue has been addressed in two
different studies. Finak and colleagues compared normal tissue from mammplasty
reductions and from breasts with malignant disease (>2 cm away from the tumor) and
found no difference (60). Different gene expression profiles between normal epithelium
from mammoplasty reductions and from breasts with malignancy is, however, found in
two other studies by Rosenbergs group (65,66). Graham and colleagues examined the
profiles of breast tissue from prophylactically removed breasts. They found that, based on
gene expression, normal epithelium from breast cancer patients and from high risk
women (undergoing prophylactic mastectomy) clustered together and separate from the
epithelium from mammoplasty reductions. They concluded that the shared characteristics
between the cancer patients and the high-risk women cannot be a cancer-induced field
effect and suggest that this is a high-risk profile (66). The method used by these two
groups is similar, and is not likely to cause the divergent results. Both groups used fresh
frozen samples, although the Finaks study soaked the tissue in TissueTek OCT
(Somagen, Edmonton, Alberta, Canada) before storage on liquid nitrogen. Laser capture
microdissection was used to isolate epithelial cells. For tumor adjacent normal samples,
more than 2 cm distance to the tumor was a requirement by both groups. The controversy
between these two studies indicates that further studies are needed.
3.2 Genomic alterations
Early studies of histologically normal breast tissue from cancerous breasts and of
epithelial hyperplasias without atypia revealed genomic alterations interpreted to
represent the initiation or early progression of breast cancer (67,68). The existence of
genomic alterations in normal tissue has been confirmed in various studies.
15

Rosenberg’s group has performed several studies comparing genomic events in normal
breast tissue from reduction mammoplasties, BRCA-mutations carriers and breast cancer
patients. They found genetic abnormalities in all groups of women (69). Studying the
DNA of non-cancerous epithelial cells from TDLUs, there was considerably less allelic
imbalance in the reduction mammoplasties (5%) compared with the breast cancer patients
and BRCA-mutation carriers (15% and 16% respectively) (70). They also showed that the
location of allelic imbalance in tumor adjacent tissue was different from that of the
carcinoma and do not represent precursors of the existing cancer, but rather separate
clones with possibility of future cancer development (71).
Rennstam and colleagues used high-resolution array comparative genomic hybridization
(aCGH) to compare genomic alterations in prophylactic mastectomies and reduction
mammoplasties and confirmed the observation of more frequent alterations in tissue from
breasts of high-risk women (72). Both tissues had alterations even after removing the
copy number variations (CNVs) from the analysis. The alterations found in reduction
mammoplasties were generally small and represented both known polymorphic sites and
regions without previously known common variants. In prophylactic mastectomies, there
were more frequent alterations, and the alterations were larger in amplitude than those
found in non-familial cases, and smaller than those found in carcinomas. The variation of
alterations between different samples was large, both between and within individuals.
16

4. Breast cancer risk The last decade has made it increasingly evident that breast cancer is a heterogeneous
disease with different clinical and biological features. The division of breast cancer into
estrogen receptor positive and negative tumors has been refined and the disease is now
further subdivided into subtypes defined by shared gene expression patterns (63,64).
Since the underlying biology and origin differ between the different breast cancer
subtypes, the risk factors may also differ (73). Most studies identifying risk factors do,
however, not take the different subtypes into account. Future stratification on subtypes in
breast cancer risk studies may reveal new risk factors and patterns of breast cancer risk.
4.1 Epidemiologic and hormonal risk factors
Already in the 1890ies, the proliferative role of functional ovaries on the mammary gland
was suggested when Beatson observed that the course of the breast cancer disease was
affected by oophorectomy (74). By the 1960ies it was well established that prolonged
administration of large doses of estrogens induced cancer in the breasts and other organs
(75). Later, it has become clear that high serum estrogen levels are associated with
increased breast cancer risk for postmenopausal women (76,77). The results are less clear
for premenopausal women. Dorgan and colleagues recently found that premenopausal
serum testosterone, but not estradiol, was associated with breast cancer risk (78). The
hormonal influence on the mammary gland is reflected in the many hormone-related risk
factors associated with breast cancer (79)(Table 2)
Early menopause and late menarche reduce the total estrogen exposure of the breast and
hence the breast cancer risk (80). Pregnancy with its high levels of female hormones
increases the womans risk of developing breast cancer for up to five years (81,82)
possibly due to a hormonally induced increase in the number of mammary stem cells
(22). During these first five years after a full term pregnancy, there is also a worse
prognosis of the disease compared to breast cancer diagnosed more distant to the last
pregnancy (83,84).
17

Table 2 Breast cancer risk factors. Strength indicates the association between the risk factor and breast cancer in terms of relative risk. From Trichopoulos et al, 2008 (79).
Risk factor Category/change Strength1)
Gender Women vs men ++++Age Increase ++++ Ethnic group Caucasion vs Asian +++Family history Yes vs no +++Specific genes Yes vs no ++++Cancer in other breast Yes vs no +++Height Increase ++Postmenopausal obesity Increase ++Brith weight Increase +Having been breastfed No vs yes 0Growth in early life Increase +Atypical hyperplasia Present vs absent +++Mammographic density High vs low density +++Age at menarche EarlierAge at menopause LaterType of menopause Natural vs artificial ++Age at 1st full term pregnancy Later +++Age at other pregnancies Later +Parity overall Lower ++Pregnancy timing Proximal vs distant +Lactation No vs yes +Abortion No vs yes 0
Oral contraceptive use (recent) Increase +Hormone replacement Increase +Plant foods and olive oil Reduced intake +Saturated fat Increased intake +Physical activity Reduced +Ethanol intake Increase +Ionizing radiation Increased +Magnetic fields Increased 0Organochlorines Increased 0
1) Associations: ++++ very strong, +++ strong, ++modest, + weak, 0 null.
Despite the initial increase in risk, higher parity is protective, the protection starting from
1years after giving birth. The protection lasts throughout the women’s lifetime, with the
18

greatest effect going from zero to one full term pregnancy (85). Early age at first full term
pregnancy and breast feeding also protect against breast cancer (80,86,87). Early age at
first full term pregnancy is particularly preventive for ER+/PR+ breast cancers (88).
Despite the protective effect of parity, several studies have concluded that high age at
first or last full term pregnancy confers a higher risk for breast cancer than nulliparity
(89,90).
The biological mechanisms underlying the different effects of pregnancies on breast
cancer risk are largely unknown, but the role of female hormones is essential in all
hypotheses. Several groups are even trying to develop preventive treatments trying to
mimic pregnancies (85).
Hormone therapy after menopause is associated with increased risk for breast cancer,
especially seen for combined estrogen-progesterone regimens (91,92). This is true for
receptor positive, but not receptor negative breast cancers (88) and for both ductal and
lobular hitologies (88). Anti-estrogen treatment (Tamoxifen) is associated with reduced
risk of breast cancer (93,94). The association with ER+ cancers is consistent with
findings that current hormone therapy use at time of diagnosis is associated with good
prognosis of the breast tumor and hormone use is therefore suggested to induce breast
cancers with a less aggressive phenotype (95,96). Progesterone therapy is associated with
an increase in MD (97-99), increased apoptotic rate, differentiation and proliferation of
epithelial cells. The effects do, however, vary between different progestins (100).
Other hormones have also been related to breast cancer risk. A recent meta-analysis
found that high serum IGF1 levels increase the risk for ER+ breast cancer. There are
indications that the GH/IGF1-axis contributes to hyperplasia and carcinogenesis
(101,102). Reduction of IGF1-production by growth hormone antagonists reduced breast
cancer development in mice and the protein has been proposed a target for prophylactic
treatment (103).
Body mass index (BMI) has been found to be associated with breast cancer inversely in
premenopausal women and positively in postmenopausal women (104). The association
between BMI and breast cancer also varies with race and hormone receptor status such
19

that high recent BMI increases the risk of receptor-positive breast tumors especially in
postmenopausal African-American women (73,105). BMI is a result of both genetic and
environmental factors. Although there are consistent findings on the association between
BMI and breast cancer risk, there are more uncertainties regarding diet.
A large meta-analysis recently confirmed that diet has a small, but significant effect on
breast cancer risk. A prudent diet decreases the risk and high alcohol intake increases the
risk. In this meta-analysis, a prudent diet generally consisted of large amounts of plant
foods and low amounts of red and processed meat. They do, however, point out the
evident error of misclassification of diets as detailed information of individual foods
could not be included in the pooled analysis. The slight effect of diet could therefore be
due to classification errors (106).
Physical activity reduces the risk for breast cancer, especially for postmenopausal
women. A recent review found a risk reduction raging from 20-80% in different studies
and a trend analysis indicating a 6% reduction in breast cancer risk pr weekly hour
exercise (107). Reduced risk for breast cancer by physical activity is also shown
experimentally in animal models (108). The underlying mechanisms are unknown.
Suggested mechanisms are reduced levels of sex hormones and IGF1 and prevention of
overweight. A recent study found that aerobic exercise reduced the non-dense breast
tissue relative to the reduction BMI, but the MD was not significantly altered. They
suggested that the mechanisms for the protective effect of exercise go through other
mechanisms than MD (109). Alteration in serum-levels of several biomarkers from
physical activity is shown. Amongst the alterations seen were reduced levels of IGF1,
growth hormone (GH), tumor necrosis factor alpha (TNF�), leptin and estrogen. This
was interpreted as an alteration in glucose homeostasis and metabolism (108).
There is evidence that environmental factors affect breast cancer risk already from the
fetal life on. The role of birth weight in breast cancer etiology is reviewed by Michels and
Xue (110). They concluded that high birth weight was associated with premenopausal,
but not postmenopausal breast cancer. This is thought to be caused, at least partly, by
elevated levels of growth factors leading to an increased number of mammary stem cells
(110). This is supported by recent findings that women with a birth weight above 4 kg
20

had a 3 fold risk of developing high MD compared to women weighing 3-3.5 kg at birth
(111). Large initial weight loss after birth, rapid growth in early life as well as growth
patterns during adolescence are also associated with increased risk of breast cancer
(112,113).
The group of Trichopoulos has proposed a model explaining the mechanisms underlying
breast cancer development grouping the different risk factors according to their etiologic
explanations. They outline four main mechanisms contributing to breast carcinogenensis,
each associated with specific risk factors, see Table 3 (79). This gives a broad overview
of underlying physiology, but does not include molecular mechanisms which will be
reviewed in a separate chapter.
Table 3 Four main mechanisms contributing to breast carcinogenesis and associated specific risk factors. From Trichopoulos, 2008 (79).
General principles of carcinogenesis
Number of mammary stem cells
Growth enhancing mammotropic hormones
Terminal differentiation of the ductal tree
AgeIonizing radiation Family history Specific genes
Mammographic density Atypical hyperplasia GenderBirth weight Growth in early life HeightEthnic group
GenderAge incidence pattern Age at menarche Age at menopause Oral contraceptives Hormone replacement Pregnancy timing Postmenopausal obesity Ethanol intake Physical activity Adult life diet
Age at 1st full term pregnancy
Age at other pregnancies Parity overall (Lactation)
4.2 Mammographic density
Mammograms are x-ray images where fat is represented as dark/lucent areas and
epithelial and stromal tissues are represented as light/dense areas (114)(see Figure 7).
Methods of determining mammographic density
Several methods of estimating breast cancer risk from mammographic features have been
introduced. In 1976, Wolfe presented a classification of breast parenchymal patterns into
21

four classes (115). The low-risk group, N1, was described as primarily fatty tissue. Two
medium-risk groups, P1 and P2, had <25% or >25% prominent ducts respectively. The
high-risk group, DY, had mammograms consisting of dense fibroglandular tissue and was
estimated to have 37 times higher risk of future breast cancer development, an estimate
that would later be proven too strong (116). An alternative classification of breast
parenchymal patterns was introduced by Tabar (117). A combination of anatomical and
mammographic features was used to subdivide the women into 5 groups. Patterns I to III
were low-risk groups and patterns IV and V consisted of dense tissue of different
character and were considered high-risk groups.
Quantitative estimation of percent density was first introduced by Wolfe (118). The
American College of Radiology has, as part of its Breast Imaging Reporting and Data
System (BI-RADS), developed a quantitative classification system of breast tissue
densities that is included in clinical practice together with qualitative, descriptive
methods (119). Semi-computerized quantitative methods have been developed (120,121).
The qualitative methods add little information to the quantitative, and the introduction of
digital mammography has made the semi-computerized method suitable for clinical use
and screening programs (122). The inter-observer agreement in quantitative methods has
been higher than that of qualitative method (123). During the last years, the use of MRI to
measure water content of the breast as a marker of fibroglandular tissue (124) and
volumetric breast density (125) have increased. The correlation between glandular tissue
as measured by MRI and percent mammographic density is low, particularly for breasts
with high density (126).
There is no consensus as to which estimate for mammographic density should be used.
The use of qualitative techniques is still widespread; particularly the use of BI-RADS in
the US both for diagnostic and research purposes. In the recent literature, many studies
use both absolute and percent density, while others use only percent mammographic
density. A recent study concluded that absolute density predicts breast cancer risk better
than percent mammographic density (127).
High MD is a well established risk factor for breast cancer, with an increased risk of 4-6
even after correcting for other known risk factors (128-130) and regardless of breast
22
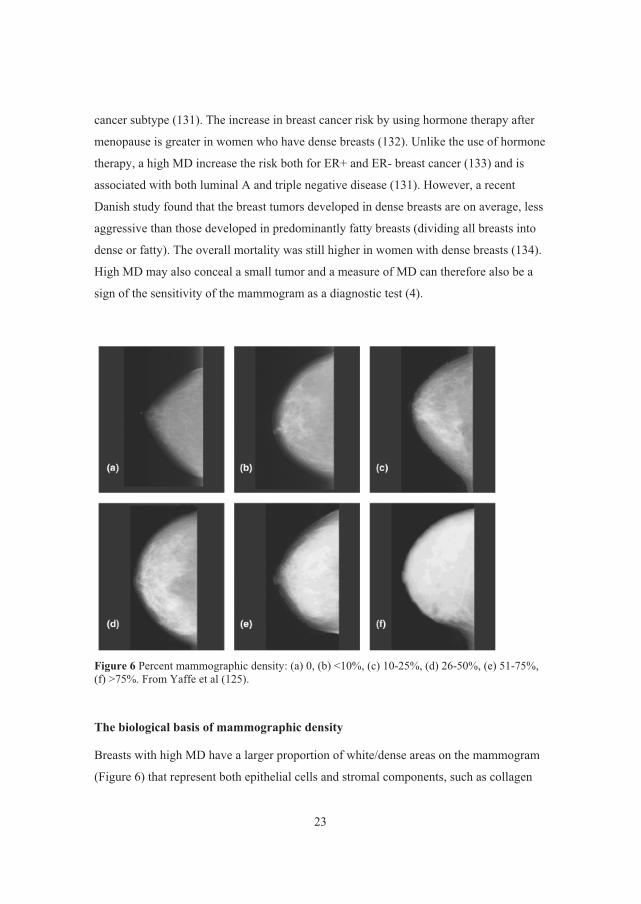
cancer subtype (131). The increase in breast cancer risk by using hormone therapy after
menopause is greater in women who have dense breasts (132). Unlike the use of hormone
therapy, a high MD increase the risk both for ER+ and ER- breast cancer (133) and is
associated with both luminal A and triple negative disease (131). However, a recent
Danish study found that the breast tumors developed in dense breasts are on average, less
aggressive than those developed in predominantly fatty breasts (dividing all breasts into
dense or fatty). The overall mortality was still higher in women with dense breasts (134).
High MD may also conceal a small tumor and a measure of MD can therefore also be a
sign of the sensitivity of the mammogram as a diagnostic test (4).
Figure 6 Percent mammographic density: (a) 0, (b) <10%, (c) 10-25%, (d) 26-50%, (e) 51-75%, (f) >75%. From Yaffe et al (125).
The biological basis of mammographic density
Breasts with high MD have a larger proportion of white/dense areas on the mammogram
(Figure 6) that represent both epithelial cells and stromal components, such as collagen
23

and fibrosis (135-137). MD is associated with the relative area occupied by collagen,
glandular structures and nuclei (of both epithelial and non-epithelial cells) (137). One
group found the number of epithelial cells to be greatly increased in areas of high MD,
but found no increase in proliferation as measured by the proliferation marker mindbomb
homolog 1 (MIB1) (138). High MD is heterogeneous at the histopathologic level and
may reflect both tissue with few cells but rich in collagen and fibroglandular tissue with
high cellular activity. There may be different biological processes underlying high MD in
these varying situations (139). To approach this problem, visual inspection of the
mammogram can be used to distinguish between glandular and sheetlike structures of the
densities. MRI may also allow specification of which type of dense tissue to measure, as
demonstrated by Klifa and others (126).
Some possible mechanisms for the influence of high MD on breast cancer risk are
suggested. Firstly, abundant and aberrantly activated fibroblasts may influence epithelial
cells through secretion of growth factors and chemokines. Vachon and colleagues found
increased aromatase in stroma and epithelium of dense areas of the breast compared with
non-dense areas of healthy women. This may lead to higher estrogen-stimulation of
proliferation and contribute to the carcinogenic process (140). Secondly, increased
collagen deposition due to excessive fibroblast activity results in a stiffer extracellular
matrix which has been associated with altered cell signaling and increased epithelial cell
proliferation. Evidence supporting this view has come from two different groups using
different approaches. Provenzano and colleagues found that increased collagen promoted
proliferation and invasion of epithelial cells in the absence of fibroblasts (141) and that
increased stromal collagen increased tumor formation and invasion significantly (142).
Similarly Weavers group induced collagen-crosslinking which was accompanied by
increased focal adhesion and invasion by oncogenic epithelium (143).
Still, much is unclear regarding the regulation of mammographic density and its role in
breast carcinogenesis. In a recent interview, Valerie Weaver said that “my belief is that
all folks who claim that they are modeling breast density when they study the effect of
increased collagen concentration on cell behavior ex vivo are overinterpreting and
extending data that are not yet conclusive.”(144) Studies on human tissue from a relevant
24

study population would help interpret in vitro studies and generate more relevant and
specific hypotheses.
Epidemiologic factors and mammographic density
The regulators of MD and the impact of MD on breast carcinogenesis was recently
reviewed by Martin et al (129). The genetic component of MD is substantial, and
probably account for more than 50% of the variation (145) (146), but environmental
factors are also important (145). MD is inversely associated with age, BMI and smoking.
Menopause reduces the proliferative stimulation of the breast and hence MD. High BMI
with a high fatty component of the breast is associated with reduced MD as adipose tissue
is radiolucent. Smoking is suggested to have an anti-estrogen effect on the breast tissue
(147,148). As mentioned previously, it was recently found that high birth weight is also
associated with high MD in later life (111). This study does, however, not address
whether birth weight is predominantly genetically or environmentally determined.
Hormones and mammographic density
Although exposure to endogenous female hormones is associated with proliferation of
breast epithelial cells and with an increase in breast cancer risk (149), there is some
controversy as to weather such exposure increases MD (150,151). Hormone therapy does,
however, increase MD while anti-estrogen substances reduce MD (152)(for review, see
Martin et al (129)). There is evidence that sex hormones and MD both independently
increase the risk for breast cancer and that the underlying mechanisms are unrelated
(153). Boyd and colleagues(154) have proposed a model for the relation between the
mechanisms underlying MD and how they relate to breast cancer (Figure 7).
25

Figure 7 Mechanisms underlying mammographic density and its relation to breast cancer risk depicted by Norman Boyd and colleagues (154). Risk factors and genetic variants influence the two suggested mechanisms; mutagenesis and mitogenesis. Increased oxidative stress with lipid peroxidation increases the risk for mutations and accumulation of events that increase proliferation, stromal activity and carcinogenic drive. Hormones and growth factors stimulate stromal production of collagen and cell proliferation important both in MD and carcinogenesis. A) Scematic summary of suggested mechanisms. B) The biological hypotheses where each cell in the breast influence its neighbors. Fibroblasts produce collagen, paracrine factors influencing epithelial cells and may differentiate into adipocytes. Epithelial cells and fibroblasts proliferate upon hormonal stimuli and could initiate the carcinogenic process.
26

Genetic variation and mammographic density
Single nucleotide polymorphisms (SNPs) associated with MD have been identified in
several genes, including COMT, a gene coding for an enzyme inactivating estrogens, in
ESR1 (reviewed in Kelemen et al (7)) and in and HSD3B1, also involved in the sex
steroid metabolism. Some of these and other SNPs in the estrogen pathway were tested in
a recent study, but the association with MD could not be confirmed (155). In the same
year, Yong and colleagues found SNPs in the sex hormone metabolizing genes SULT1A1
and UGT1A to be associated with MD. SNPs in IGF1 and its related genes have also been
linked to MD and to the serum levels of IGF1 which is in itself related to MD (153,156).
Since MD is a strong risk factor for breast cancer, it was expected that SNPs associated
with breast cancer risk might be associated with MD. This is so far not found (157).
Molecular variation according to mammographic density
The molecular background for MD has been explored in several studies, and gene
expression alterations associated with high MD have been described (55,136). Yang et al
analyzed histologically normal tissue from breasts harboring breast cancer sampled
during surgery. Women were divided into high or low MD by BI-RADS. They found 73
genes differentially expressed between women with high and low MD, with a decreased
transforming growth factor beta (TGF�)-signaling in breasts with high MD (55).
Looking at regional differences within the breast, the expression of the proteoglycans
lumican and decorin were found increased in regions of the breasts with high MD
compared with low-MD regions, evaluated by immunohistochemistry. These
proteoglycans are expressed in the stroma and have previously been reported
differentially expressed between tumor and normal breast tissue (158). The expression of
matrix metalloproteinases (MMPs) and their inhibitors (TIMPs) in breasts have been
analyzed for association with MD, but no significance was found (159).
In summary, it is well known that MD confers an increased risk of breast cancer, but the
underlying mechanisms are still unclear. Specifically, it is not known whether the
increased risk for breast cancer due to high MD is caused by the increased amount of
cells at risk of developing cancer or due to altered biological processes. MD seems to
represent presence of both stroma and epithelium, but is not influenced by the
27

proliferation rate per se. The histologically heterogeneous nature of high MD supports a
hypothesis that different biological mechanisms lead to MD. Epidemiologic factors
associated with MD have been identified, but how they are linked with MD at the
cellular/molecular level is not known. The first evidence of SNPs and transcripts with
putative association with MD has emerged, but much is still to be elucidated before we
can identify the mechanisms underlying high MD and its association with breast cancer
which may eventually allow identification of high-risk individuals in order to introduce
preventive strategies. This was the main reasons for initiating the current study.
4.3 Molecular alterations associated with breast cancer risk
Genetic
The strongest genetic factors affecting the risk of developing breast cancer are mutations
in the DNA-repair genes BRCA1 and BRCA2 (160,161). The inheritance of one mutated
allele confers a life-time risk of up to 80% of developing breast cancer (162). Inactivation
of the wild-type allele leads to defect repair of DNA and increased genetic instability and
risk for cancer development. Other tumor suppressor genes were inherited mutations lead
to increased risk of breast cancer are known, such as FANCJ and FANCN (Fanconi
anemia), TP53 (Li Fraumeni syndrome), PTEN (Cowden syndrome), STK11 (Peutz-
Jeughers syndrome) and CDH1.
Most breast cancer cases are not due to a known germ line mutation. Acquired genetic
and epigenetic alterations are thought to be caused by complex interactions of genetic
predispositions and environmental factors. There is a familial clustering of the disease
independent of epidemiologic factors, supporting the hypothesis of a genetic component
in the development for sporadic cases. Most women with first degree relatives with breast
cancer will never get the disease (163).
A multigene model including common gene variants with lower penetrance most likely
explains familial relative risk observed and several genome-wide association studies have
been performed to identify such polymorphisms (for review, see (164) and (165)). Where
previous studies focused on genes known to be involved in cancer-related biological
processes (candidate gene studies) the genome-wide association studies (GWAS)
28

examines the whole genome to identify genetic variants and combinations of such that
are associated with the disease. ATM and CHEK2 are examples of genes where medium
penetrance polymorphisms have been identified. It is estimated that twelve candidate
susceptibility SNPs identified explain 5-8% of the familial clustering of breast cancer,
indicating that much of the underlying biology is still unknown (164,165).
The Breast Cancer Association Consortium (BCAC) is a forum created to investigate the
heritability of breast cancer. In this forum, researchers from all over the world combine
studies from different groups to get reliable data to evaluate the contribution to breast
cancer risk from SNPs. Their meta-analyses have identified novel SNPs (166) and have
confirmed some (167), but not all SNPs previously suggested (168). Some of the SNPs
identified were associated with specific histopathologic subtypes (169).
Recently, pathway analysis has been introduced as a means of identifying genetic
associations to breast cancer risk with the underlying assumption that different genes may
affect the same pathway and result the same biological consequences for the cell (170).
The pathway approach identified a significant association between the estradiol metabolic
pathway (including CYP19A1 and UGT2B4) and breast cancer risk (171).
The search for mediators of the identified genetic variants is also ongoing. One approach
as been to use SNPs identified to be associated with breast cancer and look for difference
in association between the SNP and breast cancer development according to established
risk factors for the disease. Recently, two studies used this approach, one with a negative
result (172) and one found an association between a SNP in MAP3K1 and height (173).
This indicates that the mediation of the risk conferred by the SNPs identified is complex.
Gene expression
Little is known about gene expression profiles in normal breast tissue with increased risk
for breast cancer. Partly, this is because true normal breast biopsies are not easily
obtained.
One breast cancer gene expression risk signature is published (174). Chen and coworkers
used histologically normal tissue and tumor tissue from the same breasts . The basic
assumption was that normal tissue with tumor-like gene expression has higher risk of
29

developing breast caner. The genes from the histologically normal tissue whose
expression was correlated with that in the tumor were included in the malignancy risk
signature. This gene list was dominated by proliferative genes.
4.4 Risk prediction tools
Estimation of the breast cancer risk of individual women is important to determine who
should have more frequent examinations and who should receive preventive measures.
Several models assess the risk of breast cancer or the likelihood of finding a BRCA
mutation or both (111) (for review, see Amir et al (175)). While some models mainly
focus on family history, others take hormonal factors into account. They find that
although some of the models are well calibrated to their target populations, all models
have only moderate accuracy and most only include a small subset of known risk factors
(175,176). I the review by Amir et al, none of the models evaluated included MD despite
the strong correlation with risk and the high reproducibility (177). MD has, however,
been incorporated in a few risk prediction models (including the Gail model) with a
modest increase in discriminatory power (178-181).
The heterogeneous nature of breast cancer is probably reflected in different carcinogenic
processes and different importance of risk factors. An example is how BRCA1 mutations
tend to give basal-like breast cancers, whereas BRCA2 mutations tend to give luminal
breast cancer. Risk assessment studies stratifying for subtype may reveal new knowledge
of the interplay of different risk factors in the carcinogenic process (182). In the mean
time, commercial genetic risk tests including breast cancer risk are being offered to
consumers over internet (eg: 23andme, Navigenics and deCODE Genetics) and to
clinicians (Intergenetics). These kits are considered medical devices, and the producers
have recently received information that they require approval by the US Food and Drug
Administration for marketing (183). Most risk prediction tools are better at a population
level and the use of the tests currently available for individuals is controversial (184).
30

5. Breast cancer development and progression Breast cancer is thought to originate in one cell that is transformed from a normal
epithelial cell to a breast cancer cell. Carcinogenesis is a multistep process affecting the
cells genome. In order for a cell to become malignant, it must acquire the characteristics
nicely described by Hanahan and Weinberg in 2000 as the hallmarks of cancer (185). The
present study does not focus on breast carcinogenesis in itself, but aims at understanding
the normal biology in order to be able to identify the first deviating steps in the
carcinogenic path. In paper I, we have identified a group of samples that share certain
features with stem cells, stromal cells and partly with myoepithelial and mesenchymal
cell. The role of these cell types in carcinogenesis will therefore be briefly reviewed.
5.1 Cancer stem cells or clonal evolution?
One characteristic feature of most cancers is the cellular heterogeneity within each tumor.
This heterogeneity makes it hard to hit all cancer cells by the same treatment. Studies of
the difference between the cells of a tumor may reveal its history. The mechanisms
behind this heterogeneity are debated. The two main theories are the clonal evolution
model and the cancer stem cell hypothesis (for reviews, see (186-188)).
The cancer stem cell hypothesis (hierarchical model) suggest that the cancer arise in stem
cells that acquire malignant potential through a multistep carcinogenic process and that
cancer stem cells further differentiate to form the different cancer cells constituting the
heterogeneity of the tumor. There is a hierarchical nature where the pluripotent cancer
stem cells differentiate into lineage restricted non-tumorigenic cancer cells populating the
tumor. These lineage restricted cells have a limited life span, and are replaced by the
cancer stem cells other progeny. The cancer stem cells are thought to be responsible for
invasion and metastasis (186) and they are believed to be resistant towards chemotherapy
(189).
The origin of cancer stem cells is debated. This debate is partly fueled by results
indicating that other cells may acquire stem cell-like characteristics (190), in the breast
illustrated by epithelial cells acquiring stem cell traits after epithelial-mesenchymal
31

transition (191). Initiation of tumor development has also been attributed to cancer cells
lacking stem cell characteristics, raising concerns about the validity of the stem cell
hypothesis (192). And there is evidence for separate evolution of CD24+ and CD44+
cells existing in the same tumor (193). The uncertain origin is reflected in the multitude
of names given to the cells; Cancer stem cells, stem-like cancer cells and tumor initiating
cells.
The model of clonal evolution (stochastic model) closely resembles the model of
evolution of species and was first proposed by Nowell in 1976 (194). This model
suggests that cancer arises in a normal cell through a multistep carcinogenic process. The
cancer cell will continue to divide. The carcinogenic process has rendered the genome
unstable and new genetic alterations will occur that mark the start of a new clone. The
tumor cell population is the result of an evolutionary process with selection of the fittest
cell clones (186,187,195).
5.2 The role of the microenvironment
The microenvironment of the breast is generally thought of as all breast components
other than the epithelial cells or tumor cells, the most important being the stromal cells
(mainly fibroblasts, endothelial cells and immune cells), blood and lymph vessels and
extracellular matrix. Already in 1973, there was a publication showing how stromal
tissues influenced proliferation of the mammary gland in a mouse model (196). The
importance of the microenvironment in cancer was suggested from the early 1980s by the
Bissell lab (197) and by Dvorak who compared cancer with wounds that do not heal
(198). The central role in initiation and progression of the disease has only been widely
accepted the last decade (for reviews, see (199-201)). Even Dvorak’s comparison with
wound healing has gained support in recent years by a study showing activation of host
wound responses in the microenvironment of breast cancers (202).
Parallel with the malignant transformation of the luminal epithelial cells, the stroma
undergoes morphological changes such as increased number of fibroblasts and
lymphocytes, angiogenesis and remodeling of the extracellular matrix. It has become
evident that the stroma not only responds to epithelial changes in breast cancer
32

progression, but have an active role in promoting cancer development and even have
initial genetic alterations and that the communication between the epithelial cells and the
stroma is bidirectional (200,203-206).
Several mechanisms by which the stroma can initiate malignant transformation have been
proposed. Alterations in the stroma leading to a phenotype promoting a malignant
transformation can be induced by carcinogens, altered expression of matrix
metalloproteinases, immune cells and viruses (206). Transdifferentiation of other cell
types has been suggested as a possible mechanism, with possible cells of origin being
circulating fibrocytes, bone-marrow derived mesenchymal stem cells and endothelial
cells going through mesenchymal transition (201). The importance of the stroma in
epithelial carcinogenesis corresponds well with the role of stromal cells in regulating
epithelial cell proliferation as discussed in section 2.3.
The stroma also defines the stem cell niche which regulates the stem cells. According to
the cancer stem cell hypothesis, the first malignant cell is a stem cell. This is supported
by evidence that dormant stem cells may be activated by changes in the local
microenvironment, leading to cell fusion and cancer initiation (207) and by studies
indicating that the extracellular matrix has a role in regulating tumor evolution through
the stem cell niche (188).
5.3 Myoepithelial cells
Myoepithlial cells are localized between the luminal epithelial cells and the stroma and
form a barrier for the cancer cells during carcinogenesis (Figure 3) (208-210). Their role
as natural tumor suppressors with importance in the early stages of tumorigenesis has
been confirmed in molecular studies. The extensive molecular characterization of breast
cells performed by Allinen and colleagues showed that the cell type with the largest and
most consistent alterations between normal tissue and both DCIS and invasive cancer was
the myoepithelial cells (57). Further loss of function of these cells is suggested as the
initiating event in the transition from in situ to invasive cancer (211).
33

5.4 Epithelial-mesenchymal transition
Epithelial-mesenchymal transition (EMT) describes a process where differentiated
epithelial cells loose epithelial characteristics such as polarity and adherence to
neighboring cells and tissues and gain immature, mesenchymal characterstics such as a
loss of polarity and migratory and invasive properties. These properties are also
important in cancer progression and metastasis. The process is regulated by and can be
induced by TGF� (212).
Several groups have shown that induction of EMT results in the gain of stem cell-like
characteristics indicating a role of EMT in carcinogenesis (191,213,214). The combined
features of EMT and stem-like characteristics are also seen in residual breast cancers
after conventional chemotherapy and in the claudin-low subtype and is associated with
bad prognosis (215,216).
34

6. Material and methods
6.1 Subjects
Women participating tin the present study were included from 2002 to 2007. The
inclusion was done by radiologists at breast diagnostic centers. Breast diagnostic centres
in six hospitals in Norway included patients to the study. The six hospitals are Oslo
University Hospital Radiumhospitalet, University Hospital of North Norway, Vestfold
Hospital, Innlandet Hospital, Buskerud Hospital and Sørlandet Hospital. Two groups of
women were eligible: 1) Women with mammographically normal breasts (with no signs
of malignancy) and at least one area with some of mammographic density (healthy
women) and 2) Newly diagnosed breast cancer patients before any treatment. In total,
186 women were included, 120 healthy and 66 breast cancer patients. All women were
above the age of 20 and signed informed consent. Exclusion criteria were breast implants,
anticoagulant therapy, current pregnancy or lactation. Women with a history of breast
cancer and no suspicion of malignancy could be included in the group of healthy women
with a biopsy of the contralateral breast. The study was approved by the ethical
committee (S-02036).
Table 4 Referral to the breast diagnostic centre of women included in the study Referral Total Healthy women Breast cancer patients
n (%) n (%) n (%)
Screening 69 (37) 50 (42) 19 (29)
Findings/risk 1) 83 (45) 41 (34) 42 (64)
Unknown 34 (18) 29 (24) 5 (7)
186 (100) 120 (100) 66 (100)
1) Palpable lump/clinical findings/increased risk of breast cancer (family history or previous benign breast lesion or breast cancer).
The women were referred to the breast diagnostic center in various ways (see Table 4 and
Figure 9). Most women were referred from their doctor due to a palpable lump, clinical
finding or high risk (family history or previous breast cancer or benign breast lesion). A
35

total of 69 women were referred from the National Breast Cancer Screening Program
(217) due to irregular findings. Each woman provided two breast biopsies, blood
samples, mammograms and filled in a questionnaire about parity, hormone use and
family history of breast cancer.
6.2 Core biopsies
From each woman two biopsies were collected by use of a 14 gauge needle. Biopsies
from Oslo University Hospital Radiumhospitalet were snap frozen in liquid nitrogen and
stored at -80�C. In the other hospitals one biopsy from each woman was soaked in
RNAlater (for RNA-extraction) and another on 70% ethanol (for DNA-extraction). These
biopsies were transported to Oslo University Hospital Radiumhospitalet, Deptartment of
Genetics, and stored at -20�C until extraction.
Figure 8 Unsupervised hierarchical clustering of gene expression from 79 healthy women (9767 probes). Biopsies taken from lesions do not consistently cluster together, and are not significantly enriched in any of the main clusters. Source of referral is significantly different in the two main clusters. P-values from ANOVA-tests.
The biopsies from the breasts of healthy women were taken from an area with some
mammographic density in order to avoid purely fatty biopsies. One hospital (including 17
healthy women) sampled biopsies from the benign lesion/suspect area and not from
normal tissue with some density. These included 5 fibroadenomas, 8 fibroadnomatous
breasts, one microcalcification and three without mammographic lesions (biopsy was
taken from a palpable structure not found on mammography). These 17 samples did,
36
however, not consistently cluster together in unsupervised, hierarchical clustering and
there is no significant difference in biopsies taken from a lesion as opposed to from
healthy tissue in the two main clusters observed (see Figure 8). In breast cancer patients,
the biopsies were taken from the tumor itself.
6.3 Whole genome expression analysis
DNA microarrays are developed to perform whole-genome analyses of DNA-level or
mRNA-expression. Several different types of microarrays are used. We have used two-
colour olignucleotide microarrays with printed 60-mer probes. On each array, nucleotide
sequences of 6base pairs are printed on separate spots. A common reference is used for
all experiments. We used a commercially available reference prepared from 10 different
cell lines to obtain a general background for our test samples. Separate labelling is used
for the test and reference RNA before they are mixed into one solution and dispensed
onto the slide.
RNA from the test and reference samples will hybridize competitively to the printed
nucleotide sequences and the relative expression of each mRNA transcript can be
determined from the scanned ratio of signalling from the two dyes. The array will not
give information about the exact level of expression of the particular probe, but rather the
expression level in the sample compared with the control for each probe. The protocol
used in these studies is described in more detail in the following, and is illustrated in
Figure 9. For more detailed description of the experiments in this study, see paper II.
37

Figure 9 Fluorescent cRNA Synthesis Procedure illustrated in the Agilent Low RNA Input Fluorescent Linear Amplification Kit Protocol, Version 2.0. August 2003.
6.4 RNA data processing
Normalization
After hybridization, the microarray slide is scanned and the colour intensities are
converted into numbers. In a two-channel RNA-microarray experiment, the output value
for each spot is typically the log2-ratio of red (test-sample) over green (control) signal
intensity. There may be differences in signal intensity between probes on one array
leading to technical bias in the experiment. Both labelling efficiency and scanning
38

properties may influence the relative intensity of each dye. Within-array normalization is
a set of techniques to correct for these technical biases. A typical technical bias is
different hybridization intensity for the two dyes used in the experiment. This will lead to
a non-linear relationship between spots dominated by each colour. This can be illustrated
by an MA-plot. A standard, normalized measure for the intensity in a spot is given by
M=log2R-log2G, where R=red intensity and G=Green intensity in a spot. A measure of
the overall brightness of a spot is given by A=(log2R+log2G)/2. These two measures, A
and M, are used to visualize the distributions of the intensities on an array and in a dataset
in the MA-plot. In Figure 10A), we see an MA plot representing a non-normalized
microarray experiment. The banana-shape of the distribution of intensities indicates a
non-linearity. After normalization, the same data has become linear and the distribution
of red and green intensities is more equally represented on the array B)(218,219).
Figure 10 MA-plot with A) non-normalized data and B) normalized data. From Yang Y H et al, 2002 (218).
Locally weighted scatterplot smoothing (Lowess) is a linear regression method that is
commonly used for normalization of two-channel microarray data (220). The method
adjusts for dye-biases within one array. This occurs because the dyes do not fluoresce at
the same intensity at different levels. Lowess-normalization ensures that the log2-ratio-
intensities achieved from all spots in one array are comparable. The normalized log2-
ratios are calculated by subtracting a constant c(A) from the original log2-ratios. This
constant is found by estimating a local weighted linear regression and calculating the
best-fitting average log2-value from the log2-ratios observed in each data point (219).
MA-plot of a normalized sample is shown in Figure 11.
39

Figure 11 MvsA plot for lowess normalized log2-ratios for MDG011 in this study.
6.5 Mammograms
Mammograms were collected with routine description of the mammograms by the local
radiologist. Craniocaudal mammograms were digitized using a high resolution Kodak
Lumisys 85 scanner (Kodak, Rochester, New York). We obtained successfully scanned
mammograms from 176 women (115 healthy women and 61 breast cancer patients). MD
was estimated using the well established, semi-digital University of Southern California
Madena assessment method (121). A reader, trained by Giske Ursin, outlined the total
breast area using a computerized tool. Giske Ursin then defined the region of interest,
being the areas of the breast containing densities except those representing the pectoralis
muscle or scanning artifacts. The computer then colors yellow all pixels within the region
of interest and above a specified threshold. The colors pixels then represent the area of
absolute density. Percent MD is the absolute density area divided by the total breast area
(see Figure 12). We use the average percent density for both breasts, whenever an
estimate was available from both sides or from the one side we had images if only one
side was available. Test-retest reliability was 0.99 for absolute density.
40

Figure 12 A) The total breast area is delineated. B) The region of interest is defined as the region containing densites, excluding artifacts and the pectoralis muscle. C) The computer colors areas within the region of interest with density above a user-set threshold. Percent area is this dense, colored area divided by the total breast area.
41

6.6 Exploratory data analysis
Visualization of high dimensional data
Visualization of microarray data in the initial phase may identify outliers and give a
broad view of the distribution of the samples included in the study. Principle component
analysis (PCA) is a commonly used method of reducing the dimensions of high
dimensional data for visualization. The variation in the data is reduced to a few
independent components that can be plotted two at a time in a graph. Singular value
decomposition (SVD) is a general method for decomposition of a complex matrix into
multiple, independent factors. It resembles PCA in that the data can be displayed in a
graph representing the contribution of two separate factors at a time in explaining the
total variation in the data. In many cases, the two methods will be identical.
Multidimensional scaling (MDS) is a method of visualizing similarities and
dissimilarities between objects represented as n-dimensional vectors (n>2). The vectors
are mapped to points in a low-dimensional space IRm (where m=2 or 3) suitable for
visualization. Points located close to each other represent vectors with a similar shape
(egarrays with a similar gene expression pattern).
In this study, the dataset was checked for date- and batch-effect and samples with a
questionable quality were re-run. We used MDS and SVD to look for unexpected
clustering that could be due to technical issues. By visual inspection, these methods could
identify a possible effect of batch, but not of other parameters (egstorage medium),
exemplified by multidimensional scaling.
Clustering is another way of visualizing high dimensional data. During this process, the
samples are assigned to subgroups/clusters with a similar expression profile. In
hierarchical clustering, the output is a hierarchy of clusters depicted in a tree.
Hierarchical clustering (Figure 13) is an example of unsupervised learning and can be
used for description and visualization of the variation in the data. In agglomerative
algorithms, the dendrogram is built from the bottom up, starting with each sample as a
separate cluster, joining those with the most similar distribution as the tree grows. In
divisive algorithms, the whole set is treated as one cluster splitting it into clusters as the
dendrogram builds, but these are more computationally complicated and are rarely used.
42

Figure 13 Clustering by agglomerative algorithm where the dendrogram is built from the bottom up.
6.7 Statistical testing
Correcting for multiple testing
A test for statistical significance is a hypothesis testing. The hypothesis we are testing is
called null hypothesis and is rejected if our result is less likely to occur by chance,
relative to a significance level we have decided. With a significance level of 5%, we say
that if our observed outcome is less than 5% likely to occur under the null hypothesis, the
null hypothesis is rejected. That means that there is a 5% likelihood of falsely rejecting
the null-hypothesis for every test we perform. As we perform an increasing number of
tests, the likelihood that one of them will be an unlikely event, even under the null-
hypothesis, is growing. To avoid a large number of false positive results, we need to
adjust the p-value as we increase the number of tests.
One commonly used method is the Bonferroni-correction. The nominal p-value is
multiplied with the number of tests performed. This is a conservative method that is
suitable if it is important to control the number of false positives and will typically result
in a large number of false negative tests.
False discovery rate (FDR) is a less conservative method used to correct for multiple
testing. The FDR is set to the proportion of false positives among all positives that you
are willing to accept. Each of the tests performed returns a q-value, which indicates the
maximal FDR at which the test becomes significant (221). This is loosely analogous to
the p-value and is used in a similar way. FDR is used for correction of multiple testing in
our analyses for differentially expressed genes by significance analysis of microarrays
(SAM) and for gene ontology analyses by DAVID.
43

Significance Analysis of Microarrays
SAM identifies gene differentially expressed in two or multiple groups (two-class or
multiclass SAM) or according to a continuous variable (quantitative SAM) (222,223). In
SAM, each gene is tested for significant difference in expression separately. The test used
is a modified t-test. To correct for multiple testing, SAM calculates FDR by
permutations. In our study, two-class unpaired SAM was used for analysis of
differentially expressed genes between two groups of data. The data were not gene
centred for the SAM analysis. A total of 50permutations were used. Quantitative SAM
analysis was used to identify genes differentially expressed according to MD as a
continuous variable.
Regression models
Regression models can be used to identify the contribution of different independent
variables in predicting a dependent variable. Different types of regression models exist
which all aim at explaining the variation in a dependent variable Y as a function of one or
more independent variables (X1,…,Xp). Linear regression models are structured as
follows:
Y = �0 + �1X1 + �2X2 +…+ �iXi +�
Y is the dependent variable (eg: mammographic density). �0 is the constant that
represents the intercept with the y-axis if the equation is plotted in a two-dimensional
graph. �i is the factor to be multiplied with the explanatory variable Xi and indicates the
magnitude and direction of the influence of Xi on the dependent variable. Here, p is the
number of explanatory variables included in the model and � is an error added.
Envisage is a linear model for the analysis of microarray data developed by Sam Robson,
University of Warwick (224). The model can be used to perform variable selection but
can also be used to check the effect of including variables other than those of interest on
the gene expression. The model creates a regression equation for the expression (y) of
each of n genes (gi, i=1-n). The �i coefficient for each variable indicates how much that
variable influences the expression of a gene (ygi). The number of genes whose expression
is significantly associated with each covariate is estimated. In this study, Envisage was
44

used to look for effects of batch, experiment date, storage medium and hospital of
inclusion in the gene expression in healthy women. In a model including experiment date,
batch, hospital of inclusion and storage medium, experiment date seemed to be of a
certain importance of determining the expression (16% significantly changing genes). It
is, however a variable that is difficult to use in this model due to the large number of
degrees of freedom. In a model excluding experiment date, batch was affecting 29% of
the genes. The remaining variables seemed to be correlated with only a small percentage
of the genesHospital of inclusion (7%) and storage medium (0%). When the samples are
clustered, visual inspection does not identify an effect of these variables. We therefore
conclude that there might be an uncorrected effect of experiment date/batch. It does not
seem to affect the clustering. We cannot exclude a slight obfuscation of the results.
In order to find a model that suits the distribution of the data, the Akaike information
criterion can be used (225). Comparing the Akaike information criterion for different
models, the lower criterion indicates the model that best predicts the dependent variable.
In this study, we used the Akaike information criterion to select a linear regression model
as the model fitting the distribution of the data better than a gamma model. Stepwise
variable selection was performed, starting with all variables included in the model. For
every step, the variable with the highest p-value was rejected from the model and the
model was refitted. This was repeated until all variables included in the model had a p-
value <0.05.
Other tests for statistical significance
To test whether the mean of a parameter is different in two groups, a t-test can be used.
This test is suitable for continuous variables and for tests between two groups only, and
assumes normal distribution within each subgroup. The null hypothesis is that the mean is
equal for the two groups. Two-sided t-test accounts for the possibility of either group
having largest mean. We have used two-sided t-tests to test different continuous variables
(MD, age, BMI) for difference in mean between two clusters. When there are more than
two means to be compared (more than two groups/clusters) analysis of variance
(ANOVA) was applied. To test for difference between groups/clusters in categorical
variables (use of hormone therapy, parity and claudin-low status), the chi-squared ((2)
45

test was used. When the size of observations for eat least one subcategory was smaller
than 5, Fishers exact test was applied (226).
6.8 Bioinformatic Analyses
Gene ontology and KEGG pathway
Gene ontology analysis gives information about biological processes, molecular
pathways and cellular compartments overrepresented in a given gene list. The KEGG
pathway database has curated lists of genes involved in different pathways. The
bioinformatic tool, DAVID Bioinformatics Resources 2008 from the National Institute of
Allergy and Infectious Diseases, NIH (227) returns information about gene ontology-
terms and KEGG-pathways enriched in the gene list uploaded compared with a general
human background. In papers II and III, gene ontology-analysis was performed by the
use of DAVID. Functional annotation clustering was applied and the following gene
ontology categories were selected: Biological processes (all), molecular function (all) and
the KEGG pathway database. We included gene ontology terms with a p-value (FDR-
corrected) of <0.01 containing between 5 and 50genes.
UCSC browser
The UCSC browser (228) allows you to browse the genome and zoom in on areas of
interest. For all locations in the genome, information about genes, expressed sequence
tags (ESTs), microRNA, SNPs and several other trackd can be viewed. In this study, the
UCSC browser was used to map the different UGT-probes to the genome and to blast (by
use of the BLAT-tool) the probe sequences to verify the homology to the gene the probe
was expected to represent.
Gene set enrichment analysis (GSEA)
GSEA is used to test if gene sets (curated or entered by user) are significantly different in
two different sets of samples, usually determined by a phenotype of interest (229). The
software provided by the Broad Institute (230) rank each gene in the gene set according
to the enrichment these genes in each sample set. GSEA was used with user-defined gene
sets in paper I.
46

7. Brief summary of results
Paper I Gene expression profiles of breast biopsies from healthy women identify a group with claudin-low features
Studies of the normal breast are essential to understand the normal breast biology and to
identify biological mechanisms underlying breast cancer risk and initiation. In this paper,
we wanted to explore the biology in normal breasts, as representative as possible of the
women we meet in a diagnostic setting. The aim was to look for variation and to identify
differences in biology that can be used to generate hypotheses about biological risk
factors and initiation of breast cancer. Unsupervised hierarchical clustering of whole
genome expression microarrays from normal breast tissue from 79 healthy women
identified a group of twelve samples that consistently clustered tightly together (cluster
1). The standard epidemiologic data (age, BMI, hormone therapy use) or mammographic
density could not explain the difference between these clusters. We did, however, note
that none of these twelve samples were referred from the mammographic screening
programme, but rather from a doctor due to clinical findings or family history (as
opposed to 42% from mammographic screening for the remaining samples). Exploration
of the biology of the gene expression in the cluster 1 samples showed that the expression
profile resembled that of breast stroma and stem-like cells and shared features with the
newly diagnosed claudin-low breast cancer subtype with up-regulation of mesenhcymal
genes, down-regulation of cytokeratins and claudins. Biological mechanisms of breast
cancer risk and initiation related to these features should be studied in the future. With
longer follow-up, we will get true information about breast cancer risk in women
belonging to these two clusters.
47

Paper IIExpression levels of uridine 5�-diphosphoglucuronosyltransferase genes in breast tissue from healthy women are associated with mammographic density In paper II we identified genes associated with mammographic density in breasts of
healthy women. Of 24 genes significantly down-regulated in samples with high MD,
three were in the UGT-familiy, coding for enzymes inactivating estradiol by
glucuronidation. This down-regulation was seen in women under estrogen-influence;
younger women and women on hormone therapy. The UGT-expression in tumor samples
resembled the expression in samples from breasts with high mammographic density more
than the expression seen in samples from low-dense breasts. ESR1 was also down-
regulated, which may be due to a higher level of estradiol in the breasts with high
mammographic density. The hypothesis generated from this study is that a down-
regulation of UGT-expression in breasts under estrogen influence increases
mammographic density and may also be linked to increased risk for breast cancer. This
should be verified in future studies.
Paper III
Serum estradiol levels associated with specific gene expression patterns in normal breast tissue and in breast carcinomas
In paper III we identified genes associated with serum estradiol in normal breast tissue
from healthy women and in breast carcinomas. In normal breast tissue, three new genes
were differentially expressed according to circulating estradiol (used as a continuous
variable) were identified. SCGB3A1 (HIN1) and TLN2 were up-regulated and PTGS1
(COX1) down-regulated in samples from women with high estradiol levels. SCGB3A1 is
a tumor suppressor, TLN2 increases cell adhesion which may prevent migration and
invasion and PTGS1 is associated with carcinogenesis. In samples from women with high
serum estradiol, the high expression of SCGB3A1 and TLN2 alsong with the low
expression of PTGS1 indicates control of cellular growth, proliferation and migration. In
tumor tissue, SCGB3A1 and TLN2 are down-regulated and PTGS1 is up-regulated,
indicating an increased proliferation and migration.
48

In breast carcionomas, AREG and GREB1 were significantly up-regulated in samples
with higher levels of serum estradiol in quantitative SAM analysis. These genes have
previously been found estradiol-responsive in malignant(231) and normal(232) breast
tissue. The findings are discussed in relation to previous studies on serum estradiol levels
and breast biology.
Paper IV
Identification of SNP markers with putative influence on mammographic density and breast cancer risk In paper IV, we identified SNPs associated with MD and their association with gene
expression and serum estradiol levels. Twenty-eight unique SNPs were found associated
with MD in two separate datasets used (p<0.1). One of the 28 SNPs, residing in
HSD3D1, has previously been found associated with MD (233). Of the 28 SNPs
associated with MD at p<0.01, ten were significant at a standard significance level
(p�0.05). These ten SNPs were residing in EPOR, UGT2B28, SLC7A5, TBP, PTGER3,
SULT2A1 and UGT2B15 and have not previously been identified. Seven of these ten
SNPs associated with MD were correlated with the expression of genes in cis of the SNP.
Among the genes whose expression was associated with these ten SNPs were H2AFJ,
one of the genes found associated with MD in paper II. This gene was significant in all
stratifications (according to hormone therapy use) in the current study.
Of the 28 SNPs associated with MD at p<0.01, two SNPs, residing in CDK2 and
CYP17A1, were significantly associated with serum estradiol leves (p�0.05). The SNP in
CDK2 was also correlated with the expression of two genes (SCAMP1 and RPS26) which
were in themselves associated with serum estradiol levels.
49

50

8. Discussion
8.1 Sample collection and methodological considerations
“Finding the question is often more important than finding the answer” Tukey, 1980
Study design
Most normal breast tissue biopsies for research purposes are currently taken from
histologically normal tissue adjacent to tumor in breast cancer patients or from reduction
mammoplasties. Tumor adjacent normal tissue may be influenced by the presence of a
tumor in the same organ (234), and mammoplasty reductions tend to be very adipose-rich
and may therefore have different expression profiles from the population at risk. In some
cases, the source of the normal tissue may bias the results. This present study is a
prospective study of normal breast tissue from healthy women. The unique aspect of the
study is that the tissue analyzed is from tru-cut biopsies from healthy women who are not
subject to any surgery. They are not breast cancer patients with the cancerous effect on
the normal tissue and they are not mammoplasty reductions with a possible bias towards
an adipose-related biology. That does not, however, mean that there is no bias in our
normal samples. These biopsies are taken from women who are referred to a breast
diagnostic centre for examination either due to uncertainties in the screening
mammogram or due to a clinical finding/risk. This population is likely to have a higher
risk of developing breast cancer than the average women in the total population. Hence,
the selection of healthy women in this study is biased compared with women in the total
population. Our sample set is, however, representative of the population the radiologists
meet in the diagnostic setting in a breast diagnostic center.
In the future, representative breast tissue from healthy women may be more easily
available. The US National Cancer Institute is now launching a program to collect breast
tissue from all stages of breast cancer development, as well as healthy breasts (235).
Another issue is the problem of obtaining a biopsy representative of the breast it is taken
from. It is not known how homogenous gene expression is within one breast, and
therefore we are currently unable to determine how representative one single biopsy
51

would be. Further, obtaining a tru-cut biopsy is an invasive procedure and would not be
suitable for screening purposes. It could, however, be useful for high-risk groups of
women. Most importantly, we lack knowledge of the biology in high-risk breasts and
how to identify the earliest stages of breast carcinogenesis. In this study, the radiologists
were instructed to take a biopsy from an area of the breast with some density to avoid
purely fatty biopsies. This lead to a bias toward inclusion of women with high MD. This
is reflected in the fact that, in this study, the mean MD is higher in the healthy women
compared with the breast cancer patients. Therefore, direct comparison of the biology
underlying MD in the two populations included in the study is not possible.
The women answered questions about parity, height, weight, hormone use and family
history of breast cancer. Menopausal status was determined based on serum hormone
levels. Women with uncertain biochemical menopausal status were left out from the
stratified analyses.
Histopathology of biopsies
The biopsies in this study were taken with a 14 Gauge needle, which allows for large
amount of high-quality RNA from tumors, but more limited amounts from normal tissue
where the cellular density is lower. Two specific options of histopathologic evaluation of
the biopsies from normal breasts were discussed within the project group.
Immunohistochemical analysis of the biopsy would require almost the whole biopsy to be
cast in paraffin and we would not be able to extract RNA and DNA for the microarray
experiments. Imprint was not in routine use in the hospitals and would have made the
inclusion procedure more of a burden to the personnel. In addition, the intact adhesion of
normal epithelial and stromal cells prevents the cells of normal tissues to shed off the
biopsy to the glass slide. Test imprints showed mostly adipose tissue, a couple of stromal
cells and no epithelial cells; even if the macroscopic evaluation was that the biopsy was
not dominated by adipose tissue. Knowledge about the cellular content of the biopsies
would have improved our understanding of the biology greatly, but was, unfortunately
not possible to obtain. A third biopsy for histologic examination was refused for ethical
reasons. The inclusion was surprisingly smooth and at a later stage, both the health
52

personnel involved and the ethical committees agreed that we could sample a third biopsy
which is now done for our follow-up study.
Whole genome expression profiling
Gene expression is the process in which a gene is transcribed to RNA which subsequently
serves as a template for protein production. The pattern of gene expression reflects the
biological activity in the cells. We measured gene expression using Agilents 44K whole
genome arrays.
The mean RNA amount extracted from normal biopsies was considerably lower than that
extracted from tumor biopsies. Correspondingly, more normal samples (n=39) than tumor
samples (n=1) were excluded due to low RNA or poor RNA quality. Of the arrays
hybridized, three were excluded due to bad technical quality, one tumor sample and two
normal samples. The MD of the women whose breast biopsies resulted in successful gene
expression profiling (n=79) was significantly higher than the MD of women whose breast
biopsies did not yield enough high quality RNA to obtain profiling (n=42) (p=0.02, mean
MD=37 versus 29). Low density breasts with higher adipose component are likely to
yield less mRNA and this has contributed a certain bias. Both the inclusion criteria and
the biological study methods selected for samples with some epithelial and stromal
content. The observation that the healthy women had higher MD than the breast cancer
patients was true for the samples with successful gene expression profiling, and for the
whole cohort of women included and was therefore not only due to technical issues.
Gene expression from small amounts of RNA warrants amplification before
hybridization. The amplification step introduces an extra source of error to the
experiment. King and colleagues(236) tested the reliability and reproducibility of gene
expression experiments using small and larger tissue samples. They found a high
correlation between replicates and between small samples (with amplified RNA) and
moderate between small and larger tissue samples. They concluded that the biological
variability exceeded the technical variability in the gene expression studies (236). They
used microdissected epithelial tissue and Affymetrix arrays, but there is no reason to
believe that technical reliability and reproducibility should be less using whole tissue and
53

Agilent arrays. Biological variation between two whole tissue biopsies might off course
be greater, due to differences in cellular content of the biopsies.
To get a picture of the overall biology in the normal breast related to MD we decided to
extract RNA from the whole biopsy. Our aim was to get an overall picture of the biology
at a given point of time and the profiles obtained represent the collective contribution
from all cells in the sample. The last decade it has become evident that the carcinogenic
process involves not only the epithelial cells, but all its neighboring cells as well (199).
Using the whole biopsy for extraction and lacking histopathology, we do not have
information about the contribution to the final signature of individual cell types. This will
be the focus of future studies.
Mammographic density
Estimation of MD has been done in several different ways. When estimating MD in
breast cancer patients, some studies have preferred to use the breast contralateral to the
one with cancer for MD estimation (237,238). Estimation of MD in women with no
malignancy has followed different reasoning. If there is a lesion in one breast that is
diagnosed as benign, one could argue that the estimation should be made on the
contralateral breast (analogous to the studies mentioned above) assuming that the lesion
might influence the MD estimate. Some prefer to use the ipsilateral breast, arguing that
the MD estimation and the biopsy should be from the same breast in order to infer about
the biological associations. Bremnes and colleagues (239) preferred to use only the left
breast consistently, because the women are healthy and the MD assessment should not be
influenced by our more or less well founded suspicions. The same reasoning lies behind
the choice of randomly choosing the breast to use for MD estimation as done in Ursin et
al (128). Titus-Ernstoff and colleagues estimated MD from both breasts separately, and
used the estimation with the breast with highest density (240). Another approach is to
estimate MD for both breast and use an average of the two estimated figures. This
approach is, perhaps, more likely to embrace the totality of the biology influencing the
breast, although one could also argue for using the ipsilateral breast as best representation
of the biology in the specific biopsy. A study by Vachon and colleagues concluded that
54

the risk of breast cancer was predicted equally well regardless of which side was used for
density estimation (241).
In the current study, we decided to use an average of the MD estimation from both
breasts, whenever available. This was partly in order to encompass the wider aspects of
the biology influencing the breasts and partly because we lacked information about which
side some of the biopsies were taken from in the healthy women.
Statistical considerations
The gene expression dataset obtained from the microarray experiments of 79 healthy
women contained information about 40792 probes, a too high dimension for many of the
statistical tools used. A high number of probes included in statistical tests will also dilute
the power of the tests due to the problem of multiple testing. Filtering of the gene list is
therefore sensible. Using genes with no variation between samples will not help us
understand the differences and similarities in the biology of the samples in the study.
Therefore gene filtration based on variation (or standard deviation) was performed in
adittion to the removal of probes with low quality (a value in less than 80% of the arrays).
Exploratory data analysis differs from confirmatory data analysis in that it generates
rather than tests hypotheses. It is used to explore areas with little previous knowledge in
order to get an idea about the landscape and use this as a basis for hypothesis testing. The
concept of exploratory data analysis was introduced by John W Tukey. In 1980 he wrote
“Finding the question is often more important than finding the answer. Exploratory data
analysis is an attitude, a flexibility, and a reliance on display, NOT a bundle of
techniques” (242).
Exploratory data analysis is typically based on visualization of data. Methods of
visualization include commonly used box plots and scatterplots and more complex
methods such as multidimensional scaling and unsupervised hierarchical clustering. In
paper I, the main aim was an impartial exploration of the data to get a description of the
variation and to generate ideas for further studies in order to explore normal breast
biology and identify mechanisms contributing to breast cancer risk in healthy women.
The most important tool in this paper is therefore hierarchical clustering as an example of
unsupervised learning.
55

The complexity of high-dimension data is too great to grasp without reducing the number
of factors. The identification of separate clusters effectively reduces the complexity to
more graspable entities. In our case, study of the two sample clusters helped us point to
parity and referral source as parameters important in explaining the larger part of the
variation. Does this indicate that there is a difference between the clusters in breast
cancer risk? If so, what is the mechanism by which the risk increases? The exploration
has not given all answers, but shown us enough to enable us to make questions for further
analyses. Some of these will be pursued in future projects (se future perspectives).
Many tools exist for clustering and visualization of microarray data, both open source and
commercial products. Most researchers find a handful of tools that they like and use. R is
an open source language and platform widely used in medical research for
bioonformatics. Most new methods are published as R-scripts within a short time. The
two main limitations are the need to learn the programming language and the lack of
advanced options for visualization and browsing of visual output.
During this study, we developed a tool for exploratory data analysis with the advanced
visualization options of the commercial software MatLab (243). Special features needed
for publication have been added to the tool as well as statistical methods of determining
the number of sample clusters present.
56
8.2 Biological considerations
“The important thing in science is not so much to obtain new facts as to discover new
ways of thinking about them.” William Lawrence Bragg
Interpretation of gene expression profiles
Identifying gene expression profiles characteristic for subgroups of subjects is one of the
most common ways to analyze gene expression data. There is, however, great
inconsistency or instability in the profiles generated for the same traits in different studies
(244). One study found several different 70-gene signatures predicting breast cancer
survival with the same accuracy as the established signature published by vant Veer (245)
and there is most often little overlap between the lists (246).
Part of the inconsistency may be explained by use of different platform and technology.
In addition, the expression of many different genes is highly correlated and different
genes may therefore represent the same process in a signature. Roepman et al showed
how this may result in different gene lists with equally good predictive power and an
apparent inconsistency (247). In support of this, Yu and colleagues found
overrepresentation of the same pathways, represented by different genes, in five separate
gene signatures (246).
Another important cause of the inconsistency of different gene lists meant to predict the
same trait is, however, that the studies are based on too few samples (245). Ein-Dor and
colleagues found that several thousand samples was required to establish robust gene lists
for outcome for early breast cancers (248). Increased consistency of the signatures with
increasing sample sizes was indeed confirmed by a group that pooled data from different
studies and acquired a dataset of a total of 1372 samples (249). Such a pooling is feasible
only for traits and sample populations that are extensively studied. As classification of the
studied disease improves, the problem of not having large datasets increases. Prediction
of risk for each subtype of breast cancer needs inclusion of a large amount of women who
develop each subtype and this represents the main challenge in molecular prediction of
breast cancer risk. In the near future, increased predictive power may be achieved
57

through integration of information from different levels, eg micro-RNA, protein
expression, SNPs, metabolomics and epigenetics (244).
Variation in normal breast tissue
Whole genome expression profiling of normal breast tissue has previously been
performed as a control and reference for tumor tissue. However, during the last decade,
there has been increasing interest in the biology in normal breast tissue per se and in
relation to breast cancer risk and initiation. One line of interest has been to characterize
the gene expression profiles of different cells and tissues co-existing in the breast.
Another line of interest is to study gene expression profiles in normal breast tissue in
relation to a particular phenotypic trait, such as parity (250), the effect of radiotherapy
(56) or MD (55,251). Paper I is pursuing a third approach to the study of normal breast
tissue; unsupervised exploration of the variation in gene expression present in the dataset.
This exploration revealed that distinct subgroups exist in normal breast tissue. Supervised
analyses were included to interpret the initial results as described in the results section.
The biology underlying mammographic density
One study has previously looked at whole genome expression profiles related to MD
(55). The published a gene list of 73 genes found differentially expressed between high
and low MD. The gene ontology terms associated with the list of differentially expressed
genes in Yang et al included tissue morphology and many of the genes were involved in
cell-cell signaling. At the pathway level, the analyses pointed toward decreased TGF�-
signaling in breasts with high density. This pathway is important in many processes,
including tissue differentiation and apoptosis. There was no overlap between the genes
differentially expressed according to MD in Yang et al and in paper II and TGF�-pathwy
genes are not enriched in the genes differentially expressed in paper II. This is probably
due to the difference in tissues studied; normal tissue from breast cancer patients as
opposed to from healthy women. The relation between the biology in breasts with high
and low MD is probably affected by the presence of a tumor. The TGF�-pathway has a
dual role in breast cancer development with a tumor suppressor function in early stages
and a promoting role in later stages (252). The alterations in TGF�-signaling in the tumor
58

may also affect the surrounding tissue. The relatively high MD in the sample population
in paper II may have influenced the interrogation of biological processes related to MD.
MD increases the risk both for ER+ and ER- breast cancer (133). This is different from
many of the other risk factors (such as BMI and postmenopausal hormone therapy) which
increase the risk of ER+ breast cancer only (253). This suggests a different mechanism
for the increased risk of breast cancer from MD. Decreased expression of UGT-genes
could be one such mechanism. The function of the UGT-enzymes in inactivating estrogen
metabolites (254) suggests that it increases the risk of ER+ tumors only, but this is
currently unknown. Our data indicate an association with risk for breast cancer in that the
correlation between the UGT2B-probes and MD was low for samples from women who
never had breast cancer (-0.01 - -0.36), but high for samples from women with breast
cancer (0.3-0.95, particularly for UGT2B15/17 (0.95), UGT2B7 (0.91) and UGT2B17
(0.82). All these cancers were histologically ER+. Further studies are needed to confirm
the observed association between UGT-expression and MD and to explore any possible
relation to breast cancer risk and development.
High MD may result from a high proportion of cells (epithelial and/or stromal cells) or
from high proportions of collagen. There may be different biological processes resulting
in biological structures representing density on the mammogram. When percent or
absolute density is used, these different mechanisms are not taken into account and
information about underlying biological differences may be lost. One way of dissecting
the problem of differing types of MD is to use qualitative assessment of the
mammograms in addition to the quantitative measurements. The parenchymal pattern of
mammographically dense tissue may be classified into glandular/nodular or sheetlike.
The nodular pattern may represent a higher proportion of epithelial cells lining the ductal
tree, whereas the sheetlike pattern may represent more collagen and possibly other non-
glandular stromal structures. The mammograms in this study have been classified
according to parenchymal pattern by the epidemiologist, Giske Ursin. Initial analyses
identify differential expressed genes between the two growth patterns in dense breasts.
This will be analyzed further in the near future (see Future perspectives). Previously, a
nodular pattern has been linked with increased risk for breast cancer (255,256). In the
59

current study, the few women who developed breast cancer after inclusion in the study
did not have the same parenchymal patterns.
The genetic component probably account for more than 50% of the variation in MD (145)
(146)). Several studies have tried to identify SNPs responsible for this genetic
component. Some groups have identified SNPs associated with MD (7,153,156,233),
whereas others have found no association (155). A recent study reported that SNPs in the
estradiol metabolic pathway was associated with breast cancer, indicating the importance
of further studies of the SNPs in this pathway (171). Our study of estrogen-related SNPs
associated with MD identified seven new SNPs associated with MD and confirmed one
SNP previously reported. This strengthens the hypothesis that the estradiol pathway is
important for MD as well as for BC. One major issue of studies of genetic variation is the
vast number of SNPs existing in the human genome. Studying all these SNPs
simultaneously would result in a low statistical power due to correction for multiple
testing. The use of tag SNPs reduces the number of SNPs needed to obtain the biological
information somewhat. The number of tag SNPs is, however, vast and would require very
large study populations to achieve a reasonable statistical power. Most groups circumvent
this problem by selecting a smaller number of SNPs to study. The SNP selection is
frequently different for different studies resulting in a small overlap of SNPs from study
to study. Few SNPs are therefore verified. Of 281 SNPs included in the current study, we
found that five had been studied in relation to MD previously. Only one of these five
(rs1047303 residing in HSD3B1) had been found significantly associated with MD. We
reproduced the previous results in these five SNPs.
Four of the seven SNPs found significantly associated with MD in paper IV were
associated with the expression of H2AFJ, one of the genes found significantly associated
with MD in paper II. These associations may indicate that this gene is mediating a
significant proportion of the genetic component of MD. Over the last years, there have
been fewer than expected significant SNPs identified in relation to both breast cancer and
MD. A verification of the current findings along with an expansion of the SNP-panel
studied is warranted to get a complete picture of the biology responsible for the genetic
component of MD. Several genome-wide association studies and large epidemiologic
studies focusing on SNPs in relation to breast cancer have been launched and results have
60

started to be published (166,172,173). Some have information about MD (155), but most
of these studies do, however, lack breast biopsies for gene expression analysis.
Estrogen-related regulation of breast biology
The three genes whose expression was found associated with serum estradiol levels in
paper III (SCGB3A1, PTGS1 and TLN2) have all been linked to breast carcinogenesis
itself (257) and/or mechanisms possibly important in breast carcinogenesis (258). Much
is however unknown about their role in breast biology and breast carcinogenesis. The
current study strengthens the need for further exploration of the role of these genes and
suggests several studies that will be pursued in the future.
Aromatase (CYP19A1) is responsible for the final conversion of androgens to estrogens
in mammary adiopocytes. The expression levels of the enzyme are therefore expected to
reflect the level of local production of estradiol. PTGS1, in our study found to be down-
regulated in breast tissue from women with high serum estradiol, has been found to
increase production of prostaglandin E2 which in turn increases the expression of
aromatase (CYP19A1) (259) (Figure 15). We did, however, not find a correlation
between the expression of PTGS1 and CYP19A1 in our material. Nor did we find
CYP19A1-expression to be correlated to serum estradiol.
Figure 15 The cyxloocygenases increase prostaglandin E2 activity which induces aromatase and its conversion of androgens to estrogens in adipose cells. Estradiol binds to nuclear ER-receptors that act as transcription factors. From Richards et al (260).
Several UGT2B-genes were found down-regulated in breasts with high MD.These
enzymes inactivate estradiol. Samples with high expression of UGT2B10 tended to have
low expression of CYP19A1 (-0.73 versus -0.54, p=0.09) and come from women with
61
lower levels of serum estradiol (0.19 versus 0.35, p=0.09). They do, however, have a high
expression of ESR1 (1.95 versus 1.2, p=0.002). The UGT2B-genes do not seem to be up-
regulated as a response to high estradiol concentrations in the tissue as might be
expected. The anticorrelation of serum estradiol and local expression of ESR1 is
previously found in breast cancer (231), and in normal breast tissue in monkeys (36) and
in mice (261). Does the high level of ESR1 allow increased impact of the estradiol
present and hence reduce the estrogen production (locally and systemically) as well as the
inactivation of the hormone? Or is the high expression of ESR1 a result of the low
estradiol available in the breast tissue?
There is considereable uncertainty about the regulation of the expression of these genes
and this should be explored in future studies.
In this study, serum sex hormone levels have been studied and several estrogen-related
enzymes have revealed significant associations with the study parameters in the various
papers. Figure 16 gives a schematic and simpstic overview of human estrogen synthesis
and metabolism.
62

Figure 16 Androstendione and estrogen metabolism adapted form Yoshimura et al (262)
and KEGG. The presentation is not complete. Enzymes in blue and hormones/metabolites
in black. Enzymes/hormones figuring in the results of the current study are marked in red.
63

64

9. Main conclusions and future perspectives Main conclusions
This study has found that there are distinct subgroups of normal breast tissue and that one
subgroup shares features with stromal cells, stem cells and the claudin-low breast cancer
subtype.
We have also found that down-regulation of UGT2B-genes in breasts with high MD.
Reduced glucuronidation of estrogen and androgen metabolites by UGT2B-genes may
increase the stimulation of mammary cells leading to increased MD. This may be through
a high number of epithelial or stromal cells or increased production of collagens. Seven
SNPs associated with MD have been identified and H2AFJ has been put foreward as a
putative gene expression mediator of some of the genetic component of MD.
Gene expression of SCGB3A1 (HIN1) and TLN2 is up-regulated and that of PTGS1
(COX1) is down-regulated in samples from women with high levels of serum estradiol
indicating intactregulation of growth control. This regulation is lost in breast cancers
where the levels of the tumor suppressor SCGB3A1 are reduced and the expression of
PTGS1-expression is increased.
Major unknown issues
This is a small, explorative study and all results need to bee verified in other studies in
order to draw final conclusions. The study has, however, also pointed out specific
questions that we are unable to answer at this point in time.
1. What are the biological subgroups of high MD and how are they differentially regulated?
2. Is the association of UGT2B-genes with MD restricted to a specific biological mechanism of MD?
3. Is there a difference in risk for breast cancer for women with similar MD with varying local expression of UGT2B-genes?
4. Is the putative role of UGT2B-genes in breast carcinogenesis restricted to ER-positive tumors?
65

5. Is the cluser 1-phenotype (paper I) specific to the woman or representing traits present in all breasts to a certain degree?
6. Is the cluster 1-phenotype associated with increased risk of breast cancer?
7. Do claudin-low tumors arise from cells with a cluster 1-phenotype?
8. What are the regulatory mechanisms responsible for the cluster 1-phenotype?
9. What are the gene expression profiles associated with high risk for breast cancer?
10. Are there serum markers that may identify high risk for breast cancer or early breast carcinogenesis?
11. Why is SCGB3A1-expression reduced in basal-like tumors compared with other subtypes? Is it due to a myoepithelial cell of origin or transformation to a myoepithelial phenotype?
12. Are the alterations in gene expression according to serum estradiol levels caused by the circulation estradiol or associated due to a confounding factor?
13. Is there a direct regulation of local estradiol-production (measured by CYP19A1-expression) by the circulation estradiol?
14. What induces the increase in expression of PTGS1 seen during carcinogenesis?
15. Is there a relation between parenchymal mammographic patterns and biological features such as:
a. Expression of specific genes in the breast tissue
b. Overall gene expression profiles (such as the cluster 1 phenotype)
c. Serum levels of estradiol
16. ¨How can we combine information from different levels in the cell to characterize normal breast tissue and identify breast cancer risk?
17. Are the SNPs identified in paper IV also associated with breast cancer development?
66

Future perspectives
Technology capable of genome-wide analyses of human cells and tissue has opened new
possibilities for exploration of biological associations. The next few years we will see an
integration of genome-wide information from several cellular levels to a wider extent. It
has become evident that genomic alterations, methylation and histone acetylation at the
DNA-level and expression of mRNA, micro-RNA, non-coding RNA and proteins are
linked. The nature of the regulations is currently explored by many. Development of new
biostatistical methods may enable genome-wide profiles accounting for alterations at
several levels simultaneously.
The main challenges of the molecular sciences today is not obtaining biological
information, but rather to interpret the results achieved from the various laboratory
analyses. This is primarily a biostatistical challenge, but does also challenge our
biological understanding and ability to comprehend complex patterns.
This study has obtained valuable biological material that allows for many future studies.
As we have data from DNA and RNA both in breast tissue and blood, integration from
different cellular levels would be possible in this material and would provide new
information about the biology in normal breast tissue. Analyses of DNA methylation,
genomic variation and gene expression in blood are already under way. Exploration of
the biology related to different parenchymal mammographic patterns is an obvious line to
follow in order to explore the current results. Specifically, genes differentially expressed
in dense breasts with differing parenchymal patterns will be identified. The parenchymal
patterns will also be explored for differences in other phenotypic traits such as
epidemiologic data, serum hormone levels and breast cancer development.
With increasing observation time, the number of women in our cohort of healthy women
developing breast cancer is expected to increase. This will provide a unique opportunity
to explore the possibility of identifying molecular risk factors and predictors.
This study may be viewed as a pilot study generating hypotheses for future research in
new studies. We are currently sampling new biopsies, blood samples, mammograms and
questionnaires from a subgroup of the women included in this study. The main aims of
this follow-up study is to see how the gene expression pattern in the breast evolve over
67

time and to find out whether the cluster 1-phenotype (paper I) is specific for each woman
or for cellular compartments present in all breasts.
Comparison of gene expression from normal breast tissue from different parts of the
same breast will provide knowledge about the variation in gene expression within the
breast of each woman. This will be important in the search for local molecular profiles.
Such profiles are primarily important in the search for good serum markers. A breast
tissue molecular profile with high predictive power may, however, be a clinically
alternative for high-risk women.
Other future studies inspired by the questions raised by the current study include the
effects of high and low exogenous estradiol administration in the gene expression and
protein profiles of normal human cell lines and normal mouse breast tissue. The analysis
of further serum proteins such of leptin, adiponectin, IGF1 and IGFBP3 in relation to the
current findings is interesting and feasible in a short term perspective.
Breast cancer risk prediction
Breast cancer risk evaluation is only used to a limited extent in Norway today. Genetic
counseling is offered to those with known familial clustering of the disease, mainly
families with BRCA1 and 2-mutations. MD is one of the major risk factors for breast
cancer, but is hardly used clinically in Norway. Several risk prediction models are
developed and are used to a limited extent in the US. The main information incorporated
in these models is family history of breast cancer, epidemiologic parameters and some
times MD (175,178-181,263).
At present, mammographic screening every second year is offered to women aged 45/50-
69 in Norway. Critique of the one-size fits all approach to screening has emerged with the
call for more individualized risk assessment. Better risk prediction could tailor the
examinations offered to subgroups of women. The discriminatory power of the risk
predicors existing today is, however, limited and not able to identify high- or low risk
women with sufficient accuracy. Several alternative strategies for differentiated
recommendations according to risk have been suggested (264,265). The idea of assessing
an individual breast cancer risk and stratify into screening groups according to this risk is
alluring (particularly based on these studies of MD and variation in normal breast tissue).
68

This could reduce the harm and the cost of screening in the low-risk population and could
increase the detection of cancers in the high-risk population. However, predictive tools
with higher discriminatory power are needed before such strategies can be applied in
large scale.
There are a few examples where differentiated recommendations may be considered
based on epidemiologic evidence. Younger women more often develop more aggressive,
rapidly growing tumors, leading to a higher risk of interval cancers and late stage cancers
supporting annual screening (266). If the screening program is extended to include
women below 50 years of age, yearly screening chould be considered for this group. For
women older than 50, biennial screening seems sufficient (267). African-American
women generally have a lower MD, but a higher risk of developing breast cancer. They
also develop triple-negative, rapidly growing, and aggressive tumors more frequently.
Earlier entry into the screening program and/or more frequent screening could be
considered for this group. New diagnostic methods, such as gamma-imaging, are being
studied and may be introduced for improved sensitivity in women with high MD (268).
Breast cancer risk prediction will probably be improved the coming years, with the
identification of SNPs, methylation patterns and gene expression patterns in healthy
women associated with future breast cancer development. One of the main challenges
here is the heterogeneity of the disease combined with the difficulty of obtaining
representative normal breast tissue.
69

Reference List
1. Cancer Registry of Norway: Cancer in Norway 2008. Oslo: Cancer Registry of Norway; 2009.
2. Boyle P: Breast cancer control: signs of progress, but more work required. Breast 2005; 14: 429-438.
3. Brodersen J, Jorgensen KJ, Gotzsche PC: The benefits and harms of screening for cancer with a focus on breast screening. Pol Arch Med Wewn 2010; 120: 89-94.
4. van Gils CH, Otten JD, Verbeek AL, Hendriks JH: Mammographic breast density and risk of breast cancer: masking bias or causality? Eur J Epidemiol 1998; 14: 315-320.
5. Aaroe J, Lindahl T, Dumeaux V et al.: Gene expression profiling of peripheral blood cells for early detection of breast cancer. Breast Cancer Res 2010; 12: R7.
6. Lonneborg A, Aaroe J, Dumeaux V, Borresen-Dale AL: Found in transcription: gene expression and other novel blood biomarkers for the early detection of breast cancer. Expert Rev Anticancer Ther 2009; 9: 1115-1123.
7. Kelemen LE, Sellers TA, Vachon CM: Can genes for mammographic density inform cancer aetiology? Nat Rev Cancer 2008; 8: 812-823.
8. Eden JA: Breast cancer, stem cells and sex hormones Part 1. The impact of fetal life and infancy. Maturitas 2010.
9. Geddes DT: Inside the lactating breast: the latest anatomy research. J Midwifery Womens Health 2007; 52: 556-563.
10. Sternlicht MD, Kouros-Mehr H, Lu P, Werb Z: Hormonal and local control of mammary branching morphogenesis. Differentiation 2006; 74: 365-381.
11. Russo J, Russo IH: Development of the human breast. Maturitas 2004; 49: 2-15.
12. Gompel A, Chaouat M, Hugol D, Forgez P: Steroidal hormones and proliferation, differentiation and apoptosis in breast cells. Maturitas 2004; 49: 16-24.
13. Russo J, Gusterson BA, Rogers AE, Russo IH, Wellings SR, van Zwieten MJ: Comparative study of human and rat mammary tumorigenesis. Lab Invest 1990; 62: 244-278.
14. Villadsen R, Fridriksdottir AJ, Ronnov-Jessen L et al.: Evidence for a stem cell hierarchy in the adult human breast. J Cell Biol 2007; 177: 87-101.
15. Shay JW, Wright WE: Telomeres and telomerase in normal and cancer stem cells. FEBS Lett 2010; 584: 3819-3825.
16. Petersen OW, Polyak K: Stem cells in the human breast. Cold Spring Harb Perspect Biol 2010; 2: a003160.
17. Petersen OW, van DB: Growth factor control of myoepithelial-cell differentiation in cultures of human mammary gland. Differentiation 1988; 39: 197-215.
18. Kao CY, Nomata K, Oakley CS, Welsch CW, Chang CC: Two types of normal human breast epithelial cells derived from reduction mammoplasty: phenotypic characterization and response to SV40 transfection. Carcinogenesis 1995; 16: 531-538.
70

19. Shipitsin M, Campbell LL, Argani P et al.: Molecular definition of breast tumor heterogeneity. Cancer Cell 2007; 11: 259-273.
20. Asselin-Labat ML, Shackleton M, Stingl J et al.: Steroid hormone receptor status of mouse mammary stem cells. J Natl Cancer Inst 2006; 98: 1011-1014.
21. Joshi PA, Jackson HW, Beristain AG et al.: Progesterone induces adult mammary stem cell expansion. Nature 2010; 465: 803-807.
22. Asselin-Labat ML, Vaillant F, Sheridan JM et al.: Control of mammary stem cell function by steroid hormone signalling. Nature 2010; 465: 798-802.
23. Polyak K: Breast cancer: origins and evolution. J Clin Invest 2007; 117: 3155-3163.
24. Cooper AP: On the anatomy of the breast. Jefferson; 1840.
25. Deugnier MA, Teuliere J, Faraldo MM, Thiery JP, Glukhova MA: The importance of being a myoepithelial cell. Breast Cancer Res 2002; 4: 224-230.
26. Adriance MC, Inman JL, Petersen OW, Bissell MJ: Myoepithelial cells: good fences make good neighbors. Breast Cancer Res 2005; 7: 190-197.
27. O'Hare MJ, Ormerod MG, Monaghan P, Lane EB, Gusterson BA: Characterization in vitro of luminal and myoepithelial cells isolated from the human mammary gland by cell sorting. Differentiation 1991; 46: 209-221.
28. Asselin-Labat ML, Sutherland KD, Barker H et al.: Gata-3 is an essential regulator of mammary-gland morphogenesis and luminal-cell differentiation. Nat Cell Biol 2007; 9:201-209.
29. Clayton H, Titley I, Vivanco M: Growth and differentiation of progenitor/stem cells derived from the human mammary gland. Exp Cell Res 2004; 297: 444-460.
30. Gugliotta P, Sapino A, Macri L, Skalli O, Gabbiani G, Bussolati G: Specific demonstration of myoepithelial cells by anti-alpha smooth muscle actin antibody. J Histochem Cytochem 1988; 36: 659-663.
31. Shackleton M, Vaillant F, Simpson KJ et al.: Generation of a functional mammary gland from a single stem cell. Nature 2006; 439: 84-88.
32. Ginestier C, Hur MH, Charafe-Jauffret E et al.: ALDH1 is a marker of normal and malignant human mammary stem cells and a predictor of poor clinical outcome. Cell Stem Cell 2007; 1: 555-567.
33. Liu S, Dontu G, Wicha MS: Mammary stem cells, self-renewal pathways, and carcinogenesis. Breast Cancer Res 2005; 7: 86-95.
34. Stingl J, Eaves CJ, Kuusk U, Emerman JT: Phenotypic and functional characterization in vitro of a multipotent epithelial cell present in the normal adult human breast. Differentiation 1998; 63: 201-213.
35. Brisken C, O'Malley B: Hormone Action in the Mammary Gland. Cold Spring Harb Perspect Biol 2010.
36. Cheng G, Li Y, Omoto Y et al.: Differential regulation of estrogen receptor (ER)alpha and ERbeta in primate mammary gland. J Clin Endocrinol Metab 2005; 90: 435-444.
37. Smollich M, Gotte M, Fischgrabe J, Radke I, Kiesel L, Wulfing P: Differential effects of aromatase inhibitors and antiestrogens on estrogen receptor expression in breast cancer cells. Anticancer Res 2009; 29: 2167-2171.
71
38. Lange CA, Yee D: Progesterone and breast cancer. Womens Health (Lond Engl ) 2008; 4: 151-162.
39. Mulac-Jericevic B, Conneely OM: Reproductive tissue selective actions of progesterone receptors. Reproduction 2004; 128: 139-146.
40. Taylor D, Pearce CL, Hovanessian-Larsen L et al.: Progesterone and estrogen receptors in pregnant and premenopausal non-pregnant normal human breast. Breast Cancer Res Treat 2009; 118: 161-168.
41. Petersen OW, Hoyer PE, van DB: Frequency and distribution of estrogen receptor-positive cells in normal, nonlactating human breast tissue. Cancer Res 1987; 47: 5748-5751.
42. Speirs V, Skliris GP, Burdall SE, Carder PJ: Distinct expression patterns of ER alpha and ER beta in normal human mammary gland. J Clin Pathol 2002; 55: 371-374.
43. Saji S, Sakaguchi H, Andersson S, Warner M, Gustafsson J: Quantitative analysis of estrogen receptor proteins in rat mammary gland. Endocrinology 2001; 142: 3177-3186.
44. Clarke RB, Howell A, Potten CS, Anderson E: Dissociation between steroid receptor expression and cell proliferation in the human breast. Cancer Res 1997; 57: 4987-4991.
45. Zhang HZ, Bennett JM, Smith KT, Sunil N, Haslam SZ: Estrogen mediates mammary epithelial cell proliferation in serum-free culture indirectly via mammary stroma-derived hepatocyte growth factor. Endocrinology 2002; 143: 3427-3434.
46. Haslam SZ, Woodward TL: Host microenvironment in breast cancer development: epithelial-cell-stromal-cell interactions and steroid hormone action in normal and cancerous mammary gland. Breast Cancer Res 2003; 5: 208-215.
47. Burger H: The Menopausal Transition�ÇöEndocrinology. Journal of Sexual Medicine 2008; 5: 2266-2273.
48. RICHARDSON SJ, SENIKAS VYTA, NELSON JF: Follicular Depletion During the Menopausal Transition: Evidence for Accelerated Loss and Ultimate Exhaustion. J Clin Endocrinol Metab 1987; 65: 1231-1237.
49. Lane J, Martin TA, McGuigan C, Mason MD, Jiang WG: The differential expression of hCNT1 and hENT1 i n breast cancer and the possible impact on breast cancer therapy. J Exp Ther Oncol 2010; 8: 203-210.
50. Ding L, Erdmann C, Chinnaiyan AM, Merajver SD, Kleer CG: Identification of EZH2 as a molecular marker for a precancerous state in morphologically normal breast tissues. Cancer Res 2006; 66: 4095-4099.
51. Patani N, Douglas-Jones A, Mansel R, Jiang W, Mokbel K: Tumour suppressor function of MDA-7/IL-24 in human breast cancer. Cancer Cell Int 2010; 10: 29.
52. Andre F, Michiels S, Dessen P et al.: Exonic expression profiling of breast cancer and benign lesions: a retrospective analysis. Lancet Oncol 2009; 10: 381-390.
53. Liu R, Wang X, Chen GY et al.: The prognostic role of a gene signature from tumorigenic breast-cancer cells. N Engl J Med 2007; 356: 217-226.
54. Potapenko IO, Haakensen VD, Luders T et al.: Glycan gene expression signatures in normal and malignant breast tissue; possible role in diagnosis and progression. Mol Oncol 2009.
72

55. Yang WT, Lewis MT, Hess K et al.: Decreased TGFbeta signaling and increased COX2 expression in high risk women with increased mammographic breast density. Breast Cancer Res Treat 2009.
56. Westbury CB, Reis-Filho JS, Dexter T et al.: Genome-wide transcriptomic profiling of microdissected human breast tissue reveals differential expression of KIT (c-Kit, CD117) and oestrogen receptor-alpha (ERalpha) in response to therapeutic radiation. J Pathol 2009; 219: 131-140.
57. Allinen M, Beroukhim R, Cai L et al.: Molecular characterization of the tumor microenvironment in breast cancer. Cancer Cell 2004; 6: 17-32.
58. Jones C, Mackay A, Grigoriadis A et al.: Expression profiling of purified normal human luminal and myoepithelial breast cells: identification of novel prognostic markers for breast cancer. Cancer Res 2004; 64: 3037-3045.
59. Grigoriadis A, Mackay A, Reis-Filho JS et al.: Establishment of the epithelial-specific transcriptome of normal and malignant human breast cells based on MPSS and array expression data. Breast Cancer Res 2006; 8: R56.
60. Finak G, Sadekova S, Pepin F et al.: Gene expression signatures of morphologically normal breast tissue identify basal-like tumors. Breast Cancer Res 2006; 8: R58.
61. Casey T, Bond J, Tighe S et al.: Molecular signatures suggest a major role for stromal cells in development of invasive breast cancer. Breast Cancer Res Treat 2008.
62. Raouf A, Zhao Y, To K et al.: Transcriptome analysis of the normal human mammary cell commitment and differentiation process. Cell Stem Cell 2008; 3: 109-118.
63. Perou CM, Sorlie T, Eisen MB et al.: Molecular portraits of human breast tumours. Nature 2000; 406: 747-752.
64. Sorlie T, Perou CM, Tibshirani R et al.: Gene expression patterns of breast carcinomas distinguish tumor subclasses with clinical implications. Proc Natl Acad Sci U S A 2001; 98: 10869-10874.
65. Tripathi A, King C, de la MA et al.: Gene expression abnormalities in histologically normal breast epithelium of breast cancer patients. Int J Cancer 2008; 122: 1557-1566.
66. Graham K, de las MA, Tripathi A et al.: Gene expression in histologically normal epithelium from breast cancer patients and from cancer-free prophylactic mastectomy patients shares a similar profile. Br J Cancer 2010; 102: 1284-1293.
67. Deng G, Lu Y, Zlotnikov G, Thor AD, Smith HS: Loss of heterozygosity in normal tissue adjacent to breast carcinomas. Science 1996; 274: 2057-2059.
68. Teixeira MR, Pandis N, Gerdes AM et al.: Cytogenetic abnormalities in an in situ ductal carcinoma and five prophylactically removed breasts from members of a family with hereditary breast cancer. Breast Cancer Res Treat 1996; 38: 177-182.
69. Larson PS, de las MA, Cupples LA, Huang K, Rosenberg CL: Genetically abnormal clones in histologically normal breast tissue. Am J Pathol 1998; 152: 1591-1598.
70. Larson PS, Schlechter BL, de las MA, Garber JE, Cupples LA, Rosenberg CL: Allele imbalance, or loss of heterozygosity, in normal breast epithelium of sporadic breast cancer cases and BRCA1 gene mutation carriers is increased compared with reduction mammoplasty tissues. J Clin Oncol 2005; 23: 8613-8619.
73

71. Larson PS, de las MA, Bennett SR, Cupples LA, Rosenberg CL: Loss of heterozygosity or allele imbalance in histologically normal breast epithelium is distinct from loss of heterozygosity or allele imbalance in co-existing carcinomas. Am J Pathol 2002; 161:283-290.
72. Rennstam K, Ringberg A, Cunliffe HE, Olsson H, Landberg G, Hedenfalk I: Genomic alterations in histopathologically normal breast tissue from BRCA1 mutation carriers may be caused by BRCA1 haploinsufficiency. Genes Chromosomes Cancer 2010; 49:78-90.
73. Berstad P, Coates RJ, Bernstein L et al.: A Case-Control Study of Body Mass Index and Breast Cancer Risk in White and African-American Women. Cancer Epidemiol Biomarkers Prev 2010.
74. Beatson GT: On the Etiology of Cancer, with a Note of some Experiments. Br Med J 1899; 1: 399-400.
75. Grant: The Cancer Risk of Protracted Use of Steroid Hormones. CA A Cancer Journal for Clinicians 1968; 18: 97-100.
76. Key TJ: Serum oestradiol and breast cancer risk. Endocr Relat Cancer 1999; 6: 175-180.
77. Cavalieri EL, Stack DE, Devanesan PD et al.: Molecular origin of cancer: catechol estrogen-3,4-quinones as endogenous tumor initiators. Proc Natl Acad Sci U S A 1997; 94: 10937-10942.
78. Dorgan JF, Stanczyk FZ, Kahle LL, Brinton LA: Prospective case-control study of premenopausal serum estradiol and testosterone levels and breast cancer risk. Breast Cancer Res 2010; 12: R98.
79. Trichopoulos D, Adami HO, Ekbom A, Hsieh CC, Lagiou P: Early life events and conditions and breast cancer risk: from epidemiology to etiology. Int J Cancer 2008; 122:481-485.
80. Kelsey JL, Gammon MD, John EM: Reproductive factors and breast cancer. Epidemiol Rev 1993; 15: 36-47.
81. Liu CH, Chang SH, Narko K et al.: Overexpression of cyclooxygenase-2 is sufficient to induce tumorigenesis in transgenic mice. J Biol Chem 2001; 276: 18563-18569.
82. Nechuta S, Paneth N, Velie EM: Pregnancy characteristics and maternal breast cancer risk: a review of the epidemiologic literature. Cancer Causes Control 2010.
83. Thalib L, Doi SA, Hall P: Multiple births and breast cancer prognosis: a population based study. Eur J Epidemiol 2005; 20: 613-617.
84. Rosenberg L, Thalib L, Adami HO, Hall P: Childbirth and breast cancer prognosis. Int J Cancer 2004; 111: 772-776.
85. Tuma R: Mimicking pregnancy to reduce breast cancer risk. J Natl Cancer Inst 2010; 102: 517-518.
86. Layde PM, Webster LA, Baughman AL, Wingo PA, Rubin GL, Ory HW: The independent associations of parity, age at first full term pregnancy, and duration of breastfeeding with the risk of breast cancer. Cancer and Steroid Hormone Study Group. J Clin Epidemiol 1989; 42: 963-973.
87. MacMahon B, Cole P, Lin TM et al.: Age at first birth and breast cancer risk. Bull World Health Organ 1970; 43: 209-221.
74

88. Rosenberg LU, Einarsdottir K, Friman EI et al.: Risk factors for hormone receptor-defined breast cancer in postmenopausal women. Cancer Epidemiol Biomarkers Prev 2006; 15: 2482-2488.
89. Brinton LA, Hoover R, Fraumeni JF, Jr.: Reproductive factors in the aetiology of breast cancer. Br J Cancer 1983; 47: 757-762.
90. Negri E, La VC, Bruzzi P et al.: Risk factors for breast cancer: pooled results from three Italian case-control studies. Am J Epidemiol 1988; 128: 1207-1215.
91. Chlebowski RT, Hendrix SL, Langer RD et al.: Influence of estrogen plus progestin on breast cancer and mammography in healthy postmenopausal women: the Women's Health Initiative Randomized Trial. JAMA 2003; 289: 3243-3253.
92. Beral V: Breast cancer and hormone-replacement therapy in the Million Women Study. Lancet 2003; 362: 419-427.
93. Fisher B, Costantino JP, Wickerham DL et al.: Tamoxifen for prevention of breast cancer: report of the National Surgical Adjuvant Breast and Bowel Project P-1 Study. J Natl Cancer Inst 1998; 90: 1371-1388.
94. Fisher B, Costantino JP, Wickerham DL et al.: Tamoxifen for the prevention of breast cancer: current status of the National Surgical Adjuvant Breast and Bowel Project P-1 study. J Natl Cancer Inst 2005; 97: 1652-1662.
95. Hall P, Ploner A, Bjohle J et al.: Hormone-replacement therapy influences gene expression profiles and is associated with breast-cancer prognosis: a cohort study. BMC Med 2006; 4: 16.
96. Rosenberg LU, Granath F, Dickman PW et al.: Menopausal hormone therapy in relation to breast cancer characteristics and prognosis: a cohort study. Breast Cancer Res 2008; 10: R78.
97. Stuedal A, Ma H, Bjorndal H, Ursin G: Postmenopausal hormone therapy with estradiol and norethisterone acetate and mammographic density: findings from a cross-sectional study among Norwegian women. Climacteric 2009; 12: 248-258.
98. Persson I, Thurfjell E, Holmberg L: Effect of estrogen and estrogen-progestin replacement regimens on mammographic breast parenchymal density. J Clin Oncol 1997; 15: 3201-3207.
99. Noh JJ, Maskarinec G, Pagano I, Cheung LW, Stanczyk FZ: Mammographic densities and circulating hormones: a cross-sectional study in premenopausal women. Breast 2006; 15: 20-28.
100. Druckmann R: Progestins and their effects on the breast. Maturitas 2003; 46 Suppl 1:S59-S69.
101. Key TJ, Appleby PN, Reeves GK, Roddam AW: Insulin-like growth factor 1 (IGF1), IGF binding protein 3 (IGFBP3), and breast cancer risk: pooled individual data analysis of 17 prospective studies. Lancet Oncol 2010; 11: 530-542.
102. Kleinberg DL, Wood TL, Furth PA, Lee AV: Growth hormone and insulin-like growth factor-I in the transition from normal mammary development to preneoplastic mammary lesions. Endocr Rev 2009; 30: 51-74.
103. Pollak M, Blouin MJ, Zhang JC, Kopchick JJ: Reduced mammary gland carcinogenesis in transgenic mice expressing a growth hormone antagonist. Br J Cancer 2001; 85: 428-430.
75

104. van den Brandt PA, Spiegelman D, Yaun SS et al.: Pooled analysis of prospective cohort studies on height, weight, and breast cancer risk. Am J Epidemiol 2000; 152: 514-527.
105. Rosenberg LU, Magnusson C, Lindstrom E, Wedren S, Hall P, Dickman PW: Menopausal hormone therapy and other breast cancer risk factors in relation to the risk of different histological subtypes of breast cancer: a case-control study. Breast Cancer Res 2006; 8: R11.
106. Brennan SF, Cantwell MM, Cardwell CR, Velentzis LS, Woodside JV: Dietary patterns and breast cancer risk: a systematic review and meta-analysis. Am J Clin Nutr 2010; 91:1294-1302.
107. Monninkhof EM, Elias SG, Vlems FA et al.: Physical activity and breast cancer: a systematic review. Epidemiology 2007; 18: 137-157.
108. Thompson HJ, Wolfe P, McTiernan A, Jiang W, Zhu Z: Wheel Running-Induced Changes in Plasma Biomarkers and Carcinogenic Response in the 1-Methyl-1-Nitrosourea-Induced Rat Model for Breast Cancer. Cancer Prev Res (Phila) 2010.
109. Woolcott CG, Courneya KS, Boyd NF et al.: Mammographic density change with 1 year of aerobic exercise among postmenopausal women: a randomized controlled trial. Cancer Epidemiol Biomarkers Prev 2010; 19: 1112-1121.
110. Michels KB, Xue F: Role of birthweight in the etiology of breast cancer. Int J Cancer 2006; 119: 2007-2025.
111. Tamimi RM, Eriksson L, Lagiou P et al.: Birth weight and mammographic density among postmenopausal women in Sweden. Int J Cancer 2010; 126: 985-991.
112. Ahlgren M, Melbye M, Wohlfahrt J, Sorensen TI: Growth patterns and the risk of breast cancer in women. N Engl J Med 2004; 351: 1619-1626.
113. Lagiou P, Hsieh CC, Trichopoulos D et al.: Neonatal growth and breast cancer risk in adulthood. Br J Cancer 2008; 99: 1544-1548.
114. Oza AM, Boyd NF: Mammographic parenchymal patterns: a marker of breast cancer risk. Epidemiol Rev 1993; 15: 196-208.
115. Wolfe JN: Breast parenchymal patterns and their changes with age. Radiology 1976; 121:545-552.
116. Sickles EA: Wolfe mammographic parenchymal patterns and breast cancer risk. AJR Am J Roentgenol 2007; 188: 301-303.
117. Gram IT, Funkhouser E, Tabar L: The Tabar classification of mammographic parenchymal patterns. European Journal of Radiology Vol 24(2)()(pp 131-136), 1997 1997; 131-136.
118. Wolfe JN, Saftlas AF, Salane M: Mammographic parenchymal patterns and quantitative evaluation of mammographic densities: a case-control study. AJR Am J Roentgenol 1987; 148: 1087-1092.
119. Obenauer S, Hermann KP, Grabbe E: Applications and literature review of the BI-RADS classification. Eur Radiol 2005; 15: 1027-1036.
120. Boyd NF, Byng JW, Jong RA et al.: Quantitative classification of mammographic densities and breast cancer risk: results from the Canadian National Breast Screening Study. J Natl Cancer Inst 1995; 87: 670-675.
76

121. Ursin G, Astrahan MA, Salane M et al.: The detection of changes in mammographic densities. Cancer Epidemiol Biomarkers Prev 1998; 7: 43-47.
122. Gram IT, Bremnes Y, Ursin G, Maskarinec G, Bjurstam N, Lund E: Percentage density, Wolfe's and Tabar's mammographic patterns: agreement and association with risk factors for breast cancer. Breast Cancer Res 2005; 7: R854-R861.
123. Loehberg CR, Heusinger K, Jud SM et al.: Assessment of mammographic density before and after first full-term pregnancy. Eur J Cancer Prev 2010; 19: 405-412.
124. Boyd NF, Jensen HM, Cooke G, Han HL, Lockwood GA, Miller AB: Mammographic densities and the prevalence and incidence of histological types of benign breast disease. Reference Pathologists of the Canadian National Breast Screening Study. Eur J Cancer Prev 2000; 9: 15-24.
125. Yaffe MJ: Mammographic density. Measurement of mammographic density. Breast Cancer Res 2008; 10: 209.
126. Klifa C, Carballido-Gamio J, Wilmes L et al.: Magnetic resonance imaging for secondary assessment of breast density in a high-risk cohort. Magn Reson Imaging 2010; 28: 8-15.
127. Stone J, Ding J, Warren RM, Duffy SW, Hopper JL: Using mammographic density to predict breast cancer risk: dense area or percent dense area. Breast Cancer Res 2010; 12:R97.
128. Ursin G, Ma H, Wu AH et al.: Mammographic density and breast cancer in three ethnic groups. Cancer Epidemiol Biomarkers Prev 2003; 12: 332-338.
129. Martin LJ, Minkin S, Boyd NF: Hormone therapy, mammographic density, and breast cancer risk. Maturitas 2009; 64: 20-26.
130. Boyd NF, Guo H, Martin LJ et al.: Mammographic density and the risk and detection of breast cancer. N Engl J Med 2007; 356: 227-236.
131. Ma H, Luo J, Press MF, Wang Y, Bernstein L, Ursin G: Is There a Difference in the Association between Percent Mammographic Density and Subtypes of Breast Cancer? Luminal A and Triple-Negative Breast Cancer. Cancer Epidemiol Biomarkers Prev 2009; 18: 479-485.
132. Kerlikowske K, Cook AJ, Buist DS et al.: Breast cancer risk by breast density, menopause, and postmenopausal hormone therapy use. J Clin Oncol 2010; 28: 3830-3837.
133. Ziv E, Tice J, Smith-Bindman R, Shepherd J, Cummings S, Kerlikowske K: Mammographic density and estrogen receptor status of breast cancer. Cancer Epidemiol Biomarkers Prev 2004; 13: 2090-2095.
134. Olsen AH, Bihrmann K, Jensen MB, Vejborg I, Lynge E: Breast density and outcome of mammography screening: a cohort study. Br J Cancer 2009; 100: 1205-1208.
135. Guo YP, Martin LJ, Hanna W et al.: Growth factors and stromal matrix proteins associated with mammographic densities. Cancer Epidemiol Biomarkers Prev 2001; 10:243-248.
136. Alowami S, Troup S, Al-Haddad S, Kirkpatrick I, Watson PH: Mammographic density is related to stroma and stromal proteoglycan expression. Breast Cancer Res 2003; 5: R129-R135.
77

137. Li T, Sun L, Miller N et al.: The association of measured breast tissue characteristics with mammographic density and other risk factors for breast cancer. Cancer Epidemiol Biomarkers Prev 2005; 14: 343-349.
138. Hawes D, Downey S, Pearce CL et al.: Dense breast stromal tissue shows greatly increased concentration of breast epithelium but no increase in its proliferative activity. Breast Cancer Res 2006; 8: R24.
139. Gierach GL, Brinton LA, Sherman ME: Lobular Involution, Mammographic Density, and Breast Cancer Risk: Visualizing the Future? J Natl Cancer Inst 2010.
140. Vachon CM, Sasano H, Ghosh K et al.: Aromatase immunoreactivity is increased in mammographically dense regions of the breast. Breast Cancer Res Treat 2010.
141. Provenzano PP, Inman DR, Eliceiri KW, Keely PJ: Matrix density-induced mechanoregulation of breast cell phenotype, signaling and gene expression through a FAK-ERK linkage. Oncogene 2009; 28: 4326-4343.
142. Provenzano PP, Inman DR, Eliceiri KW et al.: Collagen density promotes mammary tumor initiation and progression. BMC Med 2008; 6: 11.
143. Levental KR, Yu H, Kass L et al.: Matrix crosslinking forces tumor progression by enhancing integrin signaling. Cell 2009; 139: 891-906.
144. Brower V: Homing in on mechanisms linking breast density to breast cancer risk. J Natl Cancer Inst 2010; 102: 843-845.
145. Ursin G, Lillie EO, Lee E et al.: The relative importance of genetics and environment on mammographic density. Cancer Epidemiol Biomarkers Prev 2009; 18: 102-112.
146. Boyd NF, Dite GS, Stone J et al.: Heritability of mammographic density, a risk factor for breast cancer. N Engl J Med 2002; 347: 886-894.
147. Bremnes Y, Ursin G, Bjurstam N, Gram IT: Different measures of smoking exposure and mammographic density in postmenopausal Norwegian women: a cross-sectional study. Breast Cancer Res 2007; 9: R73.
148. Butler LM, Gold EB, Conroy SM et al.: Active, but not passive cigarette smoking was inversely associated with mammographic density. Cancer Causes Control 2010; 21: 301-311.
149. Thomas HV, Reeves GK, Key TJ: Endogenous estrogen and postmenopausal breast cancer: a quantitative review. Cancer Causes Control 1997; 8: 922-928.
150. McCormack VA, Dowsett M, Folkerd E et al.: Sex steroids, growth factors and mammographic density: a cross-sectional study of UK postmenopausal Caucasian and Afro-Caribbean women. Breast Cancer Res 2009; 11: R38.
151. Greendale GA, Palla SL, Ursin G et al.: The association of endogenous sex steroids and sex steroid binding proteins with mammographic density: results from the Postmenopausal Estrogen/Progestin Interventions Mammographic Density Study. Am J Epidemiol 2005; 162: 826-834.
152. Nielsen M, Pettersen PC, Alexandersen P et al.: Breast density changes associated with postmenopausal hormone therapy: post hoc radiologist- and computer-based analyses. Menopause 2010; 17: 772-778.
78

153. Tamimi RM, Cox DG, Kraft P et al.: Common genetic variation in IGF1, IGFBP-1, and IGFBP-3 in relation to mammographic density: a cross-sectional study. Breast Cancer Res 2007; 9: R18.
154. Martin LJ, Boyd NF: Mammographic density. Potential mechanisms of breast cancer risk associated with mammographic density: hypotheses based on epidemiological evidence. Breast Cancer Res 2008; 10: 201.
155. Li J, Eriksson L, Humphreys K et al.: Genetic variation in the estrogen metabolic pathway and mammographic density as an intermediate phenotype of breast cancer. Breast Cancer Res 2010; 12: R19.
156. Biong M, Gram IT, Brill I et al.: Genotypes and haplotypes in the insulin-like growth factors, their receptors and binding proteins in relation to plasma metabolic levels and mammographic density. BMC Med Genomics 2010; 3: 9.
157. Tamimi RM, Cox D, Kraft P, Colditz GA, Hankinson SE, Hunter DJ: Breast cancer susceptibility loci and mammographic density. Breast Cancer Res 2008; 10: R66.
158. Leygue E, Snell L, Dotzlaw H et al.: Lumican and decorin are differentially expressed in human breast carcinoma. J Pathol 2000; 192: 313-320.
159. Steude JS, Maskarinec G, Erber E et al.: Mammographic Density and Matrix Metalloproteinases in Breast Tissue. Cancer Microenviron 2009.
160. Hall JM, Friedman L, Guenther C et al.: Closing in on a breast cancer gene on chromosome 17q. Am J Hum Genet 1992; 50: 1235-1242.
161. Wooster R, Neuhausen SL, Mangion J et al.: Localization of a breast cancer susceptibility gene, BRCA2, to chromosome 13q12-13. Science 1994; 265: 2088-2090.
162. Welcsh PL, King MC: BRCA1 and BRCA2 and the genetics of breast and ovarian cancer. Hum Mol Genet 2001; 10: 705-713.
163. Familial breast cancer: collaborative reanalysis of individual data from 52 epidemiological studies including 58,209 women with breast cancer and 101,986 women without the disease. Lancet 2001; 358: 1389-1399.
164. Mavaddat N, Antoniou AC, Easton DF, Garcia-Closas M: Genetic susceptibility to breast cancer. Mol Oncol 2010; 4: 174-191.
165. Ghoussaini M, Pharoah PD: Polygenic susceptibility to breast cancer: current state-of-the-art. Future Oncol 2009; 5: 689-701.
166. Easton DF, Pooley KA, Dunning AM et al.: Genome-wide association study identifies novel breast cancer susceptibility loci. Nature 2007; 447: 1087-1093.
167. Cox A, Dunning AM, Garcia-Closas M et al.: A common coding variant in CASP8 is associated with breast cancer risk. Nat Genet 2007; 39: 352-358.
168. Gaudet MM, Milne RL, Cox A et al.: Five polymorphisms and breast cancer risk: results from the Breast Cancer Association Consortium. Cancer Epidemiol Biomarkers Prev 2009; 18: 1610-1616.
169. Garcia-Closas M, Hall P, Nevanlinna H et al.: Heterogeneity of breast cancer associations with five susceptibility loci by clinical and pathological characteristics. PLoS Genet 2008; 4: e1000054.
170. Li J, Humphreys K, Heikkinen T et al.: A combined analysis of genome-wide association studies in breast cancer. Breast Cancer Res Treat 2010.
79

171. Low YL, Li Y, Humphreys K et al.: Multi-variant pathway association analysis reveals the importance of genetic determinants of estrogen metabolism in breast and endometrial cancer susceptibility. PLoS Genet 2010; 6: e1001012.
172. Milne RL, Gaudet MM, Spurdle AB et al.: Assessing interactions between the associations of common genetic susceptibility variants, reproductive history and body mass index with breast cancer risk in the Breast Cancer Association Consortium: a combined case-control study. Breast Cancer Res 2010; 12: R110.
173. Travis RC, Reeves GK, Green J et al.: Gene-environment interactions in 7610 women with breast cancer: prospective evidence from the Million Women Study. Lancet 2010; 375: 2143-2151.
174. Chen DT, Nasir A, Culhane A et al.: Proliferative genes dominate malignancy-risk gene signature in histologically-normal breast tissue. Breast Cancer Res Treat 2009.
175. Amir E, Freedman OC, Seruga B, Evans DG: Assessing women at high risk of breast cancer: a review of risk assessment models. J Natl Cancer Inst 2010; 102: 680-691.
176. Gail MH, Mai PL: Comparing breast cancer risk assessment models. J Natl Cancer Inst 2010; 102: 665-668.
177. Gao J, Warren R, Warren-Forward H, Forbes JF: Reproducibility of visual assessment on mammographic density. Breast Cancer Res Treat 2008; 108: 121-127.
178. Chen J, Pee D, Ayyagari R et al.: Projecting absolute invasive breast cancer risk in white women with a model that includes mammographic density. J Natl Cancer Inst 2006; 98:1215-1226.
179. Tice JA, Cummings SR, Smith-Bindman R, Ichikawa L, Barlow WE, Kerlikowske K: Using clinical factors and mammographic breast density to estimate breast cancer risk: development and validation of a new predictive model. Ann Intern Med 2008; 148: 337-347.
180. Cummings SR, Tice JA, Bauer S et al.: Prevention of breast cancer in postmenopausal women: approaches to estimating and reducing risk. J Natl Cancer Inst 2009; 101: 384-398.
181. Vachon CM, van Gils CH, Sellers TA et al.: Mammographic density, breast cancer risk and risk prediction. Breast Cancer Res 2007; 9: 217.
182. Carey LA: Through a glass darkly: advances in understanding breast cancer biology, 2000-2010. Clin Breast Cancer 2010; 10: 188-195.
183. Vanchieri C: Making breast cancer risk assessment personal. J Natl Cancer Inst 2010; 102: 924-926.
184. Devilee P, Rookus MA: A tiny step closer to personalized risk prediction for breast cancer. N Engl J Med 2010; 362: 1043-1045.
185. Hanahan D, Weinberg RA: The hallmarks of cancer. Cell 2000; 100: 57-70.
186. Campbell LL, Polyak K: Breast tumor heterogeneity: cancer stem cells or clonal evolution? Cell Cycle 2007; 6: 2332-2338.
187. Shackleton M, Quintana E, Fearon ER, Morrison SJ: Heterogeneity in cancer: cancer stem cells versus clonal evolution. Cell 2009; 138: 822-829.
188. Burness ML, Sipkins DA: The stem cell niche in health and malignancy. Semin Cancer Biol 2010; 20: 107-115.
80

189. Kai K, Arima Y, Kamiya T, Saya H: Breast cancer stem cells. Breast Cancer 2010; 17:80-85.
190. Passegue E, Jamieson CH, Ailles LE, Weissman IL: Normal and leukemic hematopoiesis: are leukemias a stem cell disorder or a reacquisition of stem cell characteristics? Proc Natl Acad Sci U S A 2003; 100 Suppl 1: 11842-11849.
191. Mani SA, Guo W, Liao MJ et al.: The epithelial-mesenchymal transition generates cells with properties of stem cells. Cell 2008; 133: 704-715.
192. Kelly PN, Dakic A, Adams JM, Nutt SL, Strasser A: Tumor growth need not be driven by rare cancer stem cells. Science 2007; 317: 337.
193. Park SY, Gonen M, Kim HJ, Michor F, Polyak K: Cellular and genetic diversity in the progression of in situ human breast carcinomas to an invasive phenotype. J Clin Invest 2010; 120: 636-644.
194. Nowell PC: The clonal evolution of tumor cell populations. Science 1976; 194: 23-28.
195. Bjerkvig R, Johansson M, Miletic H, Niclou SP: Cancer stem cells and angiogenesis. Semin Cancer Biol 2009; 19: 279-284.
196. DeCosse JJ, Gossens CL, Kuzma JF, Unsworth BR: Breast cancer: induction of differentiation by embryonic tissue. Science 1973; 181: 1057-1058.
197. Bissell MJ, Hall HG, Parry G: How does the extracellular matrix direct gene expression? J Theor Biol 1982; 99: 31-68.
198. Dvorak HF: Tumors: wounds that do not heal. Similarities between tumor stroma generation and wound healing. N Engl J Med 1986; 315: 1650-1659.
199. Ronnov-Jessen L, Bissell MJ: Breast cancer by proxy: can the microenvironment be both the cause and consequence? Trends Mol Med 2009; 15: 5-13.
200. Hu M, Polyak K: Molecular characterisation of the tumour microenvironment in breast cancer. Eur J Cancer 2008; 44: 2760-2765.
201. Arendt LM, Rudnick JA, Keller PJ, Kuperwasser C: Stroma in breast development and disease. Semin Cell Dev Biol 2010; 21: 11-18.
202. Troester MA, Lee MH, Carter M et al.: Activation of host wound responses in breast cancer microenvironment. Clin Cancer Res 2009; 15: 7020-7028.
203. Tlsty TD, Hein PW: Know thy neighbor: stromal cells can contribute oncogenic signals. Curr Opin Genet Dev 2001; 11: 54-59.
204. Bissell MJ, Radisky D: Putting tumours in context. Nat Rev Cancer 2001; 1: 46-54.
205. Bhowmick NA, Chytil A, Plieth D et al.: TGF-beta signaling in fibroblasts modulates the oncogenic potential of adjacent epithelia. Science 2004; 303: 848-851.
206. Kim JB, Stein R, O'Hare MJ: Tumour-stromal interactions in breast cancer: the role of stroma in tumourigenesis. Tumour Biol 2005; 26: 173-185.
207. Tysnes BB, Bjerkvig R: Cancer initiation and progression: involvement of stem cells and the microenvironment. Biochim Biophys Acta 2007; 1775: 283-297.
208. Sternlicht MD, Kedeshian P, Shao ZM, Safarians S, Barsky SH: The human myoepithelial cell is a natural tumor suppressor. Clin Cancer Res 1997; 3: 1949-1958.
81
209. Nguyen M, Lee MC, Wang JL et al.: The human myoepithelial cell displays a multifaceted anti-angiogenic phenotype. Oncogene 2000; 19: 3449-3459.
210. Shao ZM, Nguyen M, Alpaugh ML, O'Connell JT, Barsky SH: The human myoepithelial cell exerts antiproliferative effects on breast carcinoma cells characterized by p21WAF1/CIP1 induction, G2/M arrest, and apoptosis. Exp Cell Res 1998; 241: 394-403.
211. Hu M, Yao J, Carroll DK et al.: Regulation of in situ to invasive breast carcinoma transition. Cancer Cell 2008; 13: 394-406.
212. Zavadil J, Bottinger EP: TGF-beta and epithelial-to-mesenchymal transitions. Oncogene 2005; 24: 5764-5774.
213. Morel AP, Lievre M, Thomas C, Hinkal G, Ansieau S, Puisieux A: Generation of breast cancer stem cells through epithelial-mesenchymal transition. PLoS One 2008; 3: e2888.
214. Polyak K, Weinberg RA: Transitions between epithelial and mesenchymal states: acquisition of malignant and stem cell traits. Nat Rev Cancer 2009; 9: 265-273.
215. Hennessy BT, Gonzalez-Angulo AM, Stemke-Hale K et al.: Characterization of a naturally occurring breast cancer subset enriched in epithelial-to-mesenchymal transition and stem cell characteristics. Cancer Res 2009; 69: 4116-4124.
216. Creighton CJ, Chang JC, Rosen JM: Epithelial-mesenchymal transition (EMT) in tumor-initiating cells and its clinical implications in breast cancer. J Mammary Gland Biol Neoplasia 2010; 15: 253-260.
217. Wang H, Karesen R, Hervik A, Thoresen SO: Mammography screening in Norway: results from the first screening round in four counties and cost-effectiveness of a modeled nationwide screening. Cancer Causes Control 2001; 12: 39-45.
218. Yang YH, Dudoit S, Luu P et al.: Normalization for cDNA microarray data: a robust composite method addressing single and multiple slide systematic variation. Nucleic Acids Res 2002; 30: e15.
219. Quackenbush J: Microarray data normalization and transformation. Nat Genet 2002; 32 Suppl: 496-501.
220. Cleveland W, Devlin S. Locally-Weighted Regression: An Approach to Regression Analysis by Local Fitting. Journal of the American Statistical Association 83, 289-300. 1988. Ref Type: Journal (Full)
221. Benjamini Y, Hochberg Y: Controlling the false discovery rate: a practical and powerful approach to multiple testing. J Royal Stat Soc Ser B 1995; 57: 289-300.
222. Tusher VG, Tibshirani R, Chu G: Significance analysis of microarrays applied to the ionizing radiation response. Proc Natl Acad Sci U S A 2001; 98: 5116-5121.
223. Significance Analysis of Microarrays. http://www-stat.stanford.edu/~tibs/SAM/
224. Envisage: Linear Models for Microarray Analysis. http://www2.warwick.ac.uk/fac/sci/moac/students/2003/sam_robson/linear_models/
225. Akaike H: A new look at the statistical model identification, 19(6) edn. 1974.
226. Altman DG: Practical Statistics for Medical Research. Boca Raton: Chapman & Hall/CRC; 1999.
82

227. DAVID Bioinformatics Resources 6.7. http://david.abcc.ncifcrf.gov/
228. UCSC genome browser. http://genome.ucsc.edu/cgi-bin/hgGateway
229. Subramanian A, Tamayo P, Mootha VK et al.: Gene set enrichment analysis: a knowledge-based approach for interpreting genome-wide expression profiles. Proc Natl Acad Sci U S A 2005; 102: 15545-15550.
230. GSEA. http://www.broadinstitute.org/gsea/index.jsp
231. Dunbier AK, Anderson H, Ghazoui Z et al.: Relationship between plasma estradiol levels and estrogen-responsive gene expression in estrogen receptor-positive breast cancer in postmenopausal women. J Clin Oncol 2010; 28: 1161-1167.
232. Wilson CL, Sims AH, Howell A, Miller CJ, Clarke RB: Effects of oestrogen on gene expression in epithelium and stroma of normal human breast tissue. Endocr Relat Cancer 2006; 13: 617-628.
233. Stone J, Gurrin LC, Byrnes GB et al.: Mammographic density and candidate gene variants: a twins and sisters study. Cancer Epidemiol Biomarkers Prev 2007; 16: 1479-1484.
234. Heaphy C, Griffith J, Bisoffi M: Mammary field cancerization: molecular evidence and clinical importance. Breast Cancer Research and Treatment 2009; 118: 229-239.
235. Blackburn EH, Tlsty TD, Lippman SM: Unprecedented opportunities and promise for cancer prevention research. Cancer Prev Res (Phila) 2010; 3: 394-402.
236. King C, Guo N, Frampton GM, Gerry NP, Lenburg ME, Rosenberg CL: Reliability and reproducibility of gene expression measurements using amplified RNA from laser-microdissected primary breast tissue with oligonucleotide arrays. J Mol Diagn 2005; 7:57-64.
237. Boyd NF, Martin LJ, Sun L et al.: Body size, mammographic density, and breast cancer risk. Cancer Epidemiol Biomarkers Prev 2006; 15: 2086-2092.
238. Chiarelli AM, Kirsh VA, Klar NS et al.: Influence of patterns of hormone replacement therapy use and mammographic density on breast cancer detection. Cancer Epidemiol Biomarkers Prev 2006; 15: 1856-1862.
239. Bremnes Y, Ursin G, Bjurstam N, Rinaldi S, Kaaks R, Gram IT: Endogenous sex hormones, prolactin and mammographic density in postmenopausal Norwegian women. Int J Cancer 2007; 121: 2506-2511.
240. Titus-Ernstoff L, Tosteson AN, Kasales C et al.: Breast cancer risk factors in relation to breast density (United States). Cancer Causes Control 2006; 17: 1281-1290.
241. Vachon CM, Sellers TA, Carlson EE et al.: Strong evidence of a genetic determinant for mammographic density, a major risk factor for breast cancer. Cancer Res 2007; 67: 8412-8418.
242. Tukey J. We need both exploratory and confirmatory. The American Statistician 34[1], 23-25. 1980. Ref Type: Journal (Full)
243. MatLab. http://www.mathworks.com/
244. Xu JZ, Wong CW: Hunting for robust gene signature from cancer profiling data: sources of variability, different interpretations, and recent methodological developments. Cancer Lett 2010; 296: 9-16.
83

245. Ein-Dor L, Kela I, Getz G, Givol D, Domany E: Outcome signature genes in breast cancer: is there a unique set? Bioinformatics 2005; 21: 171-178.
246. Yu JX, Sieuwerts AM, Zhang Y et al.: Pathway analysis of gene signatures predicting metastasis of node-negative primary breast cancer. BMC Cancer 2007; 7: 182.
247. Roepman P, Kemmeren P, Wessels LF, Slootweg PJ, Holstege FC: Multiple robust signatures for detecting lymph node metastasis in head and neck cancer. Cancer Res 2006; 66: 2361-2366.
248. Ein-Dor L, Zuk O, Domany E: Thousands of samples are needed to generate a robust gene list for predicting outcome in cancer. Proc Natl Acad Sci U S A 2006; 103: 5923-5928.
249. Kim SY: Effects of sample size on robustness and prediction accuracy of a prognostic gene signature. BMC Bioinformatics 2009; 10: 147.
250. Asztalos S, Gann PH, Hayes MK et al.: Gene expression patterns in the human breast after pregnancy. Cancer Prev Res (Phila Pa) 2010; 3: 301-311.
251. Haakensen VD, Biong M, Lingjaerde OC et al.: Expression levels of uridine 5'-diphospho-glucuronosyltransferase genes in breast tissue from healthy women are associated with mammographic density. Breast Cancer Res 2010; 12: R65.
252. Barcellos-Hoff MH, Akhurst RJ: Transforming growth factor-beta in breast cancer: too much, too late. Breast Cancer Res 2009; 11: 202.
253. Colditz GA, Rosner BA, Chen WY, Holmes MD, Hankinson SE: Risk factors for breast cancer according to estrogen and progesterone receptor status. J Natl Cancer Inst 2004; 96: 218-228.
254. Turgeon D, Carrier JS, Levesque E, Hum DW, Belanger A: Relative enzymatic activity, protein stability, and tissue distribution of human steroid-metabolizing UGT2B subfamily members. Endocrinology 2001; 142: 778-787.
255. Brisson J, Merletti F, Sadowsky NL, Twaddle JA, Morrison AS, Cole P: Mammographic features of the breast and breast cancer risk. Am J Epidemiol 1982; 115: 428-437.
256. Brisson J: Family history of breast cancer, mammographic features of breast tissue, and breast cancer risk. Epidemiology 1991; 2: 440-444.
257. Krop I, Parker MT, Bloushtain-Qimron N et al.: HIN-1, an inhibitor of cell growth, invasion, and AKT activation. Cancer Res 2005; 65: 9659-9669.
258. Androulidaki A, Dermitzaki E, Venihaki M et al.: Corticotropin Releasing Factor promotes breast cancer cell motility and invasiveness. Mol Cancer 2009; 8: 30.
259. Zhao Y, Agarwal VR, Mendelson CR, Simpson ER: Estrogen biosynthesis proximal to a breast tumor is stimulated by PGE2 via cyclic AMP, leading to activation of promoter II of the CYP19 (aromatase) gene. Endocrinology 1996; 137: 5739-5742.
260. Richards JA, Petrel TA, Brueggemeier RW: Signaling pathways regulating aromatase and cyclooxygenases in normal and malignant breast cells. J Steroid Biochem Mol Biol 2002; 80: 203-212.
261. Saji S, Jensen EV, Nilsson S, Rylander T, Warner M, Gustafsson JA: Estrogen receptors alpha and beta in the rodent mammary gland. Proc Natl Acad Sci U S A 2000; 97: 337-342.
84
262. Yoshimura N, Harada N, Bukholm I, Karesen R, Borresen-Dale AL, Kristensen VN: Intratumoural mRNA expression of genes from the oestradiol metabolic pathway and clinical and histopathological parameters of breast cancer. Breast Cancer Res 2004; 6:R46-R55.
263. Gail MH, Costantino JP: Validating and improving models for projecting the absolute risk of breast cancer. J Natl Cancer Inst 2001; 93: 334-335.
264. Seewaldt VL: Comments and response on the USPSTF recommendation on screening for breast cancer. Ann Intern Med 2010; 152: 541-542.
265. Baum M: Should routine screening by mammography be replaced by a more selective service of risk assessment/risk management? Womens Health (Lond Engl ) 2010; 6: 71-76.
266. White E, Miglioretti DL, Yankaskas BC et al.: Biennial versus annual mammography and the risk of late-stage breast cancer. J Natl Cancer Inst 2004; 96: 1832-1839.
267. Mandelblatt JS, Cronin KA, Bailey S et al.: Effects of mammography screening under different screening schedules: model estimates of potential benefits and harms. Ann Intern Med 2009; 151: 738-747.
268. Rhodes DJ, Hruska CB, Phillips SW, Whaley DH, O'Connor MK: Dedicated dual-head gamma imaging for breast cancer screening in women with mammographically dense breasts. Radiology 2011; 258: 106-118.
85

86

Original papers
Paper I Gene expression profiles of breast biopsies from healthy women identify a group with claudin-low features


Gene expression profiles of breast biopsies from healthy women identify a group with claudin-low featuresVilde D Haakensen1,2, Ole Christian Lingjærde3,4, Torben Lüders5, Margit Riis5, 12, Aleix Prat6, Melissa A Troester7, Marit Muri Holmen8, Jan Ole Frantzen9, Linda Romundstad10,Dina Navjord11, Ida K Bukholm2, 12, Tom B Johannesen13, Charles M Perou6, Giske Ursin14, 15, Vessela N Kristensen1,2, 5Anne-Lise Børresen-Dale1,2, Åslaug Helland 1, 2, 16.1
Dept of Genetics, Institute for Cancer Research, Oslo University Hospital Radiumhospitalet, Oslo, Norway 2
Institute for Clinical Medicine, Faculty of Medicine, University of Oslo, Oslo, Norway 3
Biomedical Research Group, Department of Informatics, University of Oslo, Oslo, Norway 4
Center for Cancer Biomedicine, University of Oslo, Oslo, Norway 5
Dept for Clinical Molecular Biology (EpiGen), Institute for Clinical Medicine, Akershus University Hospital, University of Oslo,Lørenskog, Norway 8
Lineberger Comprehensive Cancer Center, University of North Carolina at Chapel Hill, Chapel Hill, USA 6
Dept of Epidemiology and Lineberger Comprehensive Cancer Center, University of North Carolina at Chapel Hill, Chapel Hill,, USA7
Dept of Radiology, Oslo University Hospital Radiumhospitalet, Oslo, Norway 9
Dept of Radiology, University Hospital of North Norway, Tromsø, Norway10
Dept of Radiology, Buskerud Hospital, Drammen, Norway 11
Dept of Radiology, Innlandet Hospital, Lillehammer, Norway 12
Dept of Surgery, Akerhus University Hospital, Lørenskog, Norway 13
The Norwegian Cancer Registry, Oslo, Norway 14
Dept of Nutrition, School of Medicine, University of Oslo, Oslo, Norway 15
Dept of Preventive Medicine, University of Southern California Keck School of Medicine, Los Angeles, USA 16
Dept of Oncology, Oslo University Hospital Radiumhospitalet, Oslo, Norway
Financial support:This study was funded primarily by The Research Council of Norway (VDH is on grant no SKO1378) and South-Eastern Norway Regional Health Authority. CMP and MT were supported by NCI RO1-CA138255 and a Breast SPORE grant P50-CA58223. Corresponding author:Åslaug HellandDept of Oncology Oslo University Hospital Radiumhospitalet 0310 Oslo NorwayPh: +47 22 93 40 00 Fax: +47 22 78 13 95 E-mail: [email protected] Conflict of interest: The authors claim no conflict of interest. Running title:Gene expression profiles in normal breasts
1

Keywords: Gene expression, normal breast tissue, hierarchical clustering, claudin-low,
2

AbstractIncreased understanding of the variability in normal breast biology will enable us to identify mechanisms of breast cancer initiation and the origin of different subtypes, and to better predict breast cancer risk. In this pilot study we have explored the variation in gene expression patterns in breast biopsies from 79 healthy women referred to breast diagnostic centers in Norway.
Unsupervised hierarchical clustering identified 12 samples consistently clustering tightly together (cluster 1) regardless of clustering algorithm and gene filtering used. Genes up-regulated in cluster 1 samples code for proteins involved in extracellular matrix, vascular development, response to hormones and metabolism. Proteins involved in cell-cell junction and plasma membrane were over-represented in the genes down-regulated in cluster 1. Validation in a separate dataset consisting of histologically normal tissue from both breasts harboring breast cancer and from mammoplasty reductions identified a similar cluster with up-regulation of the same functional categories. Comparison of the expression profile of the cluster 1 samples with several published gene lists describing breast cells showed that these samples share characteristics with stromal cells and stem cells, and to a certain degree with mesenchymal cells and myoepithelial cells. The samples in cluster 1 share many features with the newly identified claudin-low breast cancer intrinsic subtype, which also shows characteristics of stromal and stem cells.
Further studies are needed to fully elucidate the variation in the biology of normal breasts, its relation to breast cancer risk and possible link to the origin of the different molecular subtypes of breast cancer.
3

IntroductionEarly diagnosis of breast cancer is essential for reducing both mortality and morbidity of the disease. Knowledge of the initial steps of breast carcinogenesis is important for development of early detection strategies. Breast carcinogenesis, with the transition of normal breast epithelial cells through hyperplasia to invasive cancer, is increasingly well understood (1,2), but there is uncertainty as to the exact mechanisms of tumour initiation and in which cells these first steps occur (3). In order to obtain a better understanding of breast cancer biology, breast carcinogenesis and origin of the different molecular subtypes of breast cancer, information about normal breast biology and its variability among women is essential.
In breast carcinomas, the variability of gene expression is extensively studied. Several expression subtypes have been identified (4,5). These subtypes are partly believed to originate from different cell types of the breast, the luminal subtypes from luminal epithelial cells and the basal-like subtype from a myoepithelial or a possible luminal progenitor cell type (6). Recently, an additional subtype has been identified (7), the claudin-low subtype, which, based on gene its expression profile, is characterized by low expression of luminal markers and high expression of mesenchymal markers. This subtype is associated with bad prognosis and is thought to be derived from stem cells (8).
The normal breast consists of epithelial cells, extracellular matrix with stromal cells, adipose tissue and breast stem cells that reside in the stem cell niche (9). The stem cell niche prevents the epithelial stem cells from differentiating and is defined by stroma (10).Epithelial breast cells may be of luminal or myoepithelial type and they may undergo epithelial-mesenchymal transition and gain mesenchymal characteristics. Several groups have published lists of genes characterising these various cell-types (11-19).
Whole genome expression profiling of normal breast tissue (all cell types included) from women with no malignant disease has been performed to a limited extent in studies with other aims and with few samples included (5,20-22). In this study we explore the expression profiles of normal breast tissue from a series of healthy women in order to characterize the variability that exists and associate that to demographic data like age, body mass index, hormone therapy use and parity to improve our understanding of normal breast biology. The expression profiles obtained mirror the combined gene activity of the different cell types in the biopsy, reflecting a fingerprint of the breast tissue of that particular woman. Analyzing normal breast tissue may identify biological significant subtypes of normal breast tissue from healthy women. This could be of importance for understanding the different expression patterns seen in the various breast cancer subclasses (4,5).
4

Materials and methods Materials MDG – mammographic density and genetics The mammographic density and genetics (MDG) project was initiated to study the breast biology of healthy women and in particular the biological/genetic basis for mammographic density. Women included in the study were recruited from several mammographic centers in Norway between 2002 and 2007 as previously described (23). Most women were referred to the mammographic center after some irregular or questionable findings in an initial mammogram. A total of 120 women who were evaluated as cancer-free from routine diagnostic procedures were included in the study. Women with some visible areas of mammographic density were included in order to obtain biopsies from these areas with epithelial and stromal components. If there was a suspicious lesion in one breast, the study biopsy was taken from the breast contralateral to the lesion. Women who used anticoagulants, had breast implants, were pregnant or breast feeding were excluded. All women signed an informed consent and answered a questionnaire with information about parity, family history of breast cancer and hormone use. Breast biopsies and blood samples were collected. The hospital research protocol board and the regional ethical committee (ref: S-02036) approved the study. Data from the questionnaires was stored in a database organized by the Office for Clinical Research at the Oslo University Hospital; Radiumhospitalet.
Core biopsies were taken for RNA-extraction using a 14 gauge needle. The biopsies were taken from an area without pathology but with some mammographic density. Six healthy women included by one hospital, had the biopsy taken from a non-malignant lesion (five from fibroadenomas and one from a microcalcification). The biopsies from one hospital (77 women) were fresh frozen and stored at -80�C. The remaining hospitals placed the biopsies directly on RNAlater (Applied Biosystems/Ambion, Austin, TX) before transportation and storage at -80�C.
Mammographic density was estimated using the University of Southern California Madena assessment method (24) as previously described (23). Briefly, the total breast area was outlined by an operator. The area containing densities and excluding the pectoralis muscle and artifacts was marked and the threshold set to select the densities within this area. Percent density is the dense area divided by the total breast area and was used as a measure of mammographic density. Information about which of the included subjects that had developed breast cancer by April 2010 was collected from the Norwegian Cancer Registry.
Other datasets Gene expression profiles from breast biopsies of healthy women included in the MDG study were compared with one published and two unpublished gene expression datasets. The two unpublished dataset were from the AHUS hospital. The AHUS1-samples were histologically normal tissue collected from two different cohorts; breasts harboring breast cancer (hereafter called cancer normals) and mammoplasty reductions. The AHUS2-
5

samples were collected from different sources selected to different proportion of fatty and connective tissues. Breast tissue was sampled from mammoplasty reductions, fibroadenomas and normal tissue from breast cancer mastectomies. In addition, subcutaneous fat was collected from the abdominal area. The samples were grouped into biopsies with high and low fraction of fat tissue based on visual inspection. In both AHUS datasets, RNA was extracted from whole tissue. In addition, one published dataset containing reduction mammoplasties and cancer normals was used (20).
Previously published lists of genes differentially expressed between epithelial cells and stem-like/progenitor cells, stromal cells, myoepithelial cells or epithelial cells after epithelial-mesenchymal transition were used to describe our dataset. The genes from each publication are listed in Supplementary file 1.
Gene expression analysis RNA-extraction and hybridization to microarrays were done as previously described (23). Briefly, RNeasy Mini Protocol (Qiagen, Valencia, CA) was used for RNA-extraction. Agilent Low RNA input Fluorescent Linear Amplification Kit Protocol was used for cDNA-synthesis, transcription and labeling of RNA with cyanine 5 (Amersham Biosciences, Little Chalfont, England) for the samples and cyanine 3 (Amersham Biosciences, Little Chalfont, England) for the Universal Human total RNA reference (Stratagene, La Jolla, CA). After exclusion of 38 samples due to low amount of RNA or poor RNA-quality, 82 samples were hybridized onto two-channel 44K Agilent Human Whole Genome Oligo Microarrays (G4110A) (Agilent Technologies, Santa Clara, CA). Three arrays were excluded due to poor quality, and 79 samples were included in further analyses and are available in Gene Expression Omnibus (GEO) GSE18672.
Data processing An Agilent scanner (Agilent Technologies, Santa Clara, CA) was used for scanning and Feature Extraction 9.1.3.1 (Agilent Technologies, Santa Clara, CA) was used for data processing. Normalization was done by locally weighted scatterplot smoothing (lowess) and flagged spots were removed. The Stanford Microarray Database (SMD) (http://genome-www5.stanford.edu//, 8/31/2010) was used for data storage. For further analysis the log 2 transformed data were used. The genes were filtered so that only genes with 80% good data and a log2-value of more than 1.6 standard deviation away from the mean in three samples or more were included leaving 9767 probes. The data were gene-centered for cluster analysis, but not for other analyses. Missing values were imputed in R using the method impute.knn in the library impute (http://rss.acs.unt.edu/Rdoc/library/impute/html/impute.knn.html, 8/31/2010). The AHUS1-dataset was filtered to include the probes in the filtered MDG-dataset, leaving 8519 probes.
The data were checked for effect of handling (fresh frozen versus RNAlater) and batch using significance testing, Envisage (http://www2.warwick.ac.uk/fac/sci/moac/currentstudents/2003/sam_robson/linear_models/, 8/31/2010) and visualization by multidimensional scaling and single value decomposition. Samples with questionable array quality were re-run. The conclusion was
6

that a slight effect of batch and date of hybridization using uncorrected data is seen, but this did not affect the clustering. Fisher exact and chi-squared tests were used to analyze for difference between our two main clusters using batch, experiment date, storage medium, RNA-concentration and hospital of inclusion as variables. The results of these were all negative showing no effect of sample handling or collection site. Also, there was no correlation between sampling method/storage medium and RNA-amount or quality.
Statistical AnalysisClustering was performed in MatLab (version R2007b) (The MathWorks Inc., Natick, MA) using ward linkage and Euclidean distance measure. The gap statistic was used to determine the number of clusters (25). Two-sided t-tests (assuming equal variance) and chi-squared/Fisher’s exact tests were used to test for significance of different phenotypic variables between the different clusters. Significance Analysis of Microarrays (SAM) (version 3.02, http://www-stat.stanford.edu/~tibs/SAM/, 8/31/2010) (26) for Excel with 500 permutations was used for analysis of differentially expressed genes. The empirical null distribution was estimated to ensure that the genes identified as differentially expressed between the two clusters were not merely the tails of a wider null distribution. Unsupervised hierarchical clustering was performed using the complete gene list filtered as described above. Supervised analyses were performed using different published gene lists to look for similarities with the different cell types from which the respective gene sets were derived.
Prediction of the claudin-low subtype was done using the claudin-low predictor developed in Prat et al (27). An expression dataset with 807 genes and 52 cell line samples (described in Neve et al, (28)), of which 9 were classified as claudin-low, was merged with our data using Distance Weighted Discrimination (29) with the 52-sample dataset used as the training data. In the same software, the single sample prediction (SSP) function with Euclidean distance was applied on the adjusted datasets and then used to define claudin-low samples in the test set.
A similar predictor was developed for prediction of the previously identified intrinsic subtypes. A dataset containing both the original intrinsic subtypes and the claudin-low subtype (7) was merged with our data set as described above for the cell line data. The Herschkowitz-dataset was used as the training data. The single sample prediction was applied to assign expression subtypes to the samples.
Microsoft Access 2003 was used to limit our dataset to the gene lists of interest. Hierarchical clustering was performed to see whether the gene list of interest separated the cluster 1-samples from the remaining samples in our dataset. SAM of cluster 1 versus cluster 2 was performed to identify genes from the published gene list that were differentially expressed between cluster 1 and cluster 2. Tests for significance between the number of up- and down-regulated genes (false discovery rate (FDR)<10%) between the two clusters identified and the cell types in question were performed. Gene set enrichment analysis (GSEA) (version 2) (http://www.broadinstitute.org/gsea/, 8/31/2010) with 1000 permutations was used to check for significance of the gene lists in separating the clusters. DAVID 6.7 (http://david.abcc.ncifcrf.gov/home.jsp, 8/31/2010) was used to
7

identify gene ontology terms and KEGG pathways significantly enriched in the lists of genes differentially expressed between the two main clusters with an FDR<0.01 considered significant.
Clustering combining the MDG dataset with datasets containing biopsies from normal tissue containing different proportions of adipose tissue was performed to see whether samples in cluster 1 consistently clustered with samples with a high fraction of fat tissue and was driven by a high number of adipocytes.
8

Results
Unsupervised hierarchical clustering Unsupervised hierarchical clustering of the expression of 9767 genes in the 79 breast biopsies separated the samples into two main groups, confirmed by the gap statistic (25)(Figure 1). The smaller cluster (cluster 1, far right), consisting of twelve samples, consistently clustered tightly together regardless of clustering method and gene filtering used. There was a significantly higher proportion of women referred to mammography due to increased risk; family history of breast cancer (4) or a palpable breast lump (5) in cluster 1 compared to the remaining women (cluster 2) although no malignancy was found in any of the women included in the study by standard diagnostic procedures. There was a borderline significance that more women belonging to cluster 1 were nulliparous, compared to cluster 2. There was no difference in age, age at first birth, hormone use, body mass index or percent mammographic density between women belonging to the two clusters (Table 1).
Differentially expressed genes SAM revealed 2621 genes differentially expressed between cluster 1 and cluster 2 with an FDR=0, of which 1516 were up-regulated in cluster 1 (Supplementary file 2).
Genes up-regulated in cluster 1 were enriched for the gene ontology terms extracellular region, vascular development, response to hormone/insulin stimulus, glucose and triclyceride metabolism, plasma membrane, cell motion, protein dimerization, regulation of inflammatory response and mitochondrion. Genes down-regulated in cluster 1 were enriched for the terms of proteins involved in actin-binding, adherens junction, cytoskeleton and the plasma membrane (Supplementary file 3, Table S1). Gene ontology terms associated with subsets of genes in the various gene clusters (A-E) are shown in Figure 2.
Supervised analyses In order to explore the nature of the cells in the biopsies of cluster 1, we used previously published gene lists describing stroma (17,18), breast stem cells (15,19,30), myoepithelial cells (12,14), progenitor cells (14), mesenchymal cells (13), high-risk normal cells (16), epithelial cells from parous women (31), intrinsic genelist (5) and a genelist for prediction of the claudin-low subtype (27).
Both hierarchical clustering, SAM analysis and GSEA indicated that the expression in the cluster 1-biopsies resembled expression in stem-like cells and stromal cells (Table 2) (Supplementary file 3, Table S2). There were also certain shared expression characteristics with progenitor cells, mesenchymal cells and myoepithelial cells. More detailed information about the cells used when generating the gene lists, the samples used and the number of genes from the respective gene lists differentially expressed in our clusters are listed in Supplementary file 3, Table S3. The cluster 1 samples were not
9

associated with the expression profiles of any of the original breast cancer subtypes (5). However, when a gene list developed to classify the newly identified claudin-low subtype was used (27), we found that the cluster 1 samples were highly associated with the claudin-low gene expression profile (Table 2). This was confirmed when we used this method to create a predictor for one subtype at a time. All samples in cluster 1 were classified as claudin-low as opposed to only three samples from cluster 2 (Figure 1) and the cluster 1 samples were not assigned to any of the other subtypes tested using these predictors. In figure 2, selected genes associated with the claudin-low subtype, stem cells, mesenchymal cells, stroma and epithelial cells and their expression in cluster 1 are shown. Hierarchical clustering based on the various gene lists is shown in Supplementary file 3, Figure S1. These analyses could not confirm any association of cluster 1 with parity (31).
When the filtered expression dataset was clustered with three separate datasets including biopsies from breasts of healthy women with high and low content of fatty tissue (two unpublished and one published (20) dataset), the samples did not cluster according to fat-content (Supplementary file 3, Figure S2).
Four of the women from the cohort have been registered with a breast cancer diagnosis, one before she was included and four had developed the disease after inclusion, all in the breast contralateral to the biopsy. The samples from these five women did all belong to cluster 2. The observation time varied from 34 to 86 months with a mean of 59.1 and a median of 58. All five cancers were estrogen receptor positive. Two of the breast cancers developed after inclusion were infiltrating lobular carcinoma, the other three cancers had ductal histology.
ValidationUnsupervised hierarchical clustering of the AHUS1-dataset yielded two distinct clusters of samples (Figure 3). The smaller cluster (n= 18) includes 8 reduction mammoplasties, while the larger cluster (n=22) included 6. A total of 3102 of 8519 probes were differentially expressed between the two clusters using SAM. Of the 2045 genes up-regulated in the smaller cluster with an FDR of 2%, 1057 were also up-regulated in cluster 1 in the MDG dataset whereas none were down-regulated. Of the 2278 genes down-regulated in the smaller cluster with and FDR of 2%, 962 were down-regulated in cluster 1 and none were up-regulated.
Gene ontology terms enriched in the genes up- regulated in the smaller AHUS1-cluster was very similar to those found in the cluster 1 samples, including: response to hormone/insulin, glucose and triglyceride metabolism, vasculature development, mitochondrion, membrane, protein dimerization and regulation of inflammatory response. In addition, the gene ontology terms vitamin B6-binding , iron ion binding and aerobic respiration were enriched in the genes up-regulated in the smaller cluster of AHUS1. The genes down-regulated in this smaller cluster were enriched for adherens junction, acting binding, extracellular matrix and cytoskeleton – the majority of terms
10

being in common with those down-regulated in the cluster 1 samples. The full list of gene ontology terms for both datasets is available in Supplementary file 3, Table S1.
Application of the claudin-low predictor on the AHUS1-samples showed that no samples in the larger cluster were assigned claudin low as opposed to 14 of 15 in the smaller cluster.
11

DiscussionLittle is known about gene expression patterns in normal breasts. We have identified a cluster of twelve normal breast tissue samples (cluster 1) that cluster tightly together using different clustering algorithms and different gene lists and that share characteristics of stromal cells, stem cells and the claudin-low phenotype.
The cluster 1 samples have a reduced expression of the epithelial defining keratin genes and have an up-regulation of several mesenchymal markers such as TWIST1, SPARC and VIM. This may lead to the hypothesis that the cluster 1 samples represent more immature or dedifferentiated epithelial cells, and/or enrichment for stromal cells. This is supported by our findings that the cluster 1 samples have an expression of genes that resembles published gene lists characterizing stromal tissue and have an overrepresentation of gene ontology terms associated with the extracellular matrix. Reliable and specific stem cell markers are still unavailable (32), but cells in the cluster 1 samples show similarities with stem-like or progenitor-like cells.
The interindividual differences observed may reflect true differences between women with different risk or exposure histories, or may represent different normal tissue subtypes that are present within a single woman, at different sites in the breast, at different times during the lifespan or in different proportions. For example, stem cell niches may be oversampled in the cluster 1 biopsies.
Stem cell niches are thought to be present in the breasts of all women, but some women may have more than others. The immature breasts of nulliparous women may contain larger volumes of stem cell niches than the post-lactationally involuted breasts. This could explain why there are more nulliparous women in cluster 1 than in cluster 2. Understanding the intra- and inter-individual variation in normal breast tissue is important and this investigation raises the question as to whether the clustering patterns observed represent only a fraction of women or if all women have cells/niches with these characteristics, with some women having a higher fraction than others.
The stem cell niche refers to a zone of the breast epithelium where stem and progenitor cells reside. The microenvironment constitutes the niche and influences the stem cells (33)(for review, see (34)). This would explain the combined stem-like and stromal-like characteristics identified in cluster 1 samples. In breast cancer, the stem cell niche may contain mesenchymal cells derived from the normal breast stroma or recruited from the bone marrow (10) and the current results raise the hypothesis that mesenchymal cells may be present in normal breast stem cell-niches. The link between mesenchymal and stem cell traits is also made clear by Mani and colleagues who showed that immortalized breast cells undergoing epithelial-mesenchymal transition acquire stem-cell like characteristics and that normal mouse mammary stem cells express mesenchymal markers(35).
This study is not designed to predict risk of developing breast cancer. However, when we apply the Chen risk predictor (16), the cluster 1 samples tend to have a slightly decreased risk. There is no difference in mammographic density, one of the strongest risk factors for
12

breast cancer, between the two clusters (Table 1). The malignancy risk predictor is dominated by proliferative genes. The fact that the cluster 1 samples are associated with a low malignancy risk profile may be a reflection of the low expression of proliferative genes. Low proliferation rate is also seen in stem cells. Looking at the referral source, women in cluster 1 are mainly referred to the mammographic centers due to palpable breast lumps or positive family history and not from the screening program. There were, however, no breast cancers in cluster 1 as opposed to one previous and four developed breast cancers in cluster 2. This is not statistically significant, and we cannot conclude about the breast cancer risk in women belonging to these two clusters. It is, however, worth noting that all the cancers did arise in the breast contralateral to the biopsy. That may be explained by the fact that, if there was a lesion present in one of the breasts at the mammogram, the biopsies were taken from the breast contralateral to the lesion. All the breast cancers were estrogen receptor positive. Since the cluster 1 samples have a stem-like gene expression profile and have certain myoepithelial/basal characteristics, one may speculate that these women, if they develop breast cancer, will have a greater proportion of estrogen receptor negative cancers.
All the 12 samples in cluster 1 were classified as claudin-low, compared to only three of the remaining 67 samples. Similarly in the validation dataset, the claudin-low samples were exclusively in the smaller cluster. The claudin-low subtype is developed for classification of breast cancers and was not thought to be a group of normal breast samples. The claudin-low nature of the cluster 1 samples is, however, striking. Down-regulation of E-cadherin, occludin, claudin 3, 4, 7 as well as up-regulation of the mesenchymal genes and SNAI2 is in line with the features described in claudin-low tumor samples. The low expression of ESR1 corresponds with the estrogen receptor negative trend of the claudin-low subtype (7). The claudin-low tumours are thought to arise from mammary stem cells (8). The hypothesis that the cluster 1-samples are enriched for immature cells is further supported by the down-regulation of GATA3 seen in these samples compared to the cluster 2 samples (p=3.8E-9), a protein that is also down-regulated in claudin-low samples (27).
The biopsies used in this study are unique in that they represent the group of women that are examined at breast diagnostic centers. Since the sample size is small, the use of additional datasets may indicate if the current results represent a larger population. The AHUS1 dataset consists of two main types of samples; mammoplasty reductions and cancer normals. Mammoplasty reductions are widely used as representing normal breast tissue, although one can expect the biology to be slightly biased toward fat-related processes. Cancer normals may be influenced by the biology in the tumor (36) or they may represent normal tissue in high-risk breasts (37). A dataset consisting of these two tissue-types, therefore represent a variety of normal tissue, despite its’ obvious shortcomings. The fact that the AHUS1 dataset clusters into two clusters with biology similar to those seen in the MDG dataset is interesting and indicates that these results may be reproducible in similar populations.
The reduced expression of epithelial surface makers may be explained by a large component of adipocytes in the biopsies. This is, however, unlikely, as the biopsies were
13

taken from mammographic dense areas. In addition, when this dataset was clustered with other datasets containing biopsies from normal breast tissue with varying proportions of fatty tissue, the cluster 1 samples do not segregate with the adipocyte-rich biopsies (Supplementary file 3, Figure S2).
There was a greater proportion of nulliparous women in cluster 1. The association between cluster and parity was, however, not confirmed using a gene list describing post-pregnant epithelial cells (31)(Table 2 and Supplementary file 3, Table S2 and Figure S1). The breasts of nulliparous breasts are not fully matured and the fraction of differentiated epithelial cells is lower than in post-pregnant breasts. The genelist published by Asztalos et al is short and may not capture all parity-related gene expression alterations. The cluster 1 samples may represent more immature breasts with increased number of type 1 lobules, but this study does not give enough power to conclude, and the association between the cluster 1 type gene expression profile and parity needs to be elucidated further.
The difference between cluster 1 samples and the remaining normal samples could be due to difference in fractions of the cell types present in the biopsies. For ethical reasons, the number of biopsies pr woman was limited and we did not have enough tissue to do both RNA-extraction and get histology. The lack of histology of the biopsies prior to extraction prevents exact knowledge of the cell types contributing to the expression profiles. It has become evident that the development and progression of breast cancers are not limited to epithelial cells and that the total microenvironment is important. Approximately 95% of normal breast tissue may be composed of stroma, and therefore cell type differences in stroma are most likely captured rather than subtle differences in epithelial content. For evaluation of the putative interplay between all the cells at this location of the breast, expression analysis of the entire biopsy provides the most realistic picture of the situation. Previous studies have shown that different biopsies from whole one tumor share similar gene expression profile (4). The variability of gene expression from different locations of one breast is not known, but King and colleagues have shown that microdissected and bulk tissue samples from normal breasts have a high similarity in gene expression and that such technical differences are minor compared with biological differences (38).
This study is limited by the relatively low number of women included. Larger datasets with several biopsies representing different parts of the breast will be needed to allow further elaboration of the variation in the normal biology of the breast.
14

ConclusionGene expression analyses of biopsies from breasts of healthy women show two main groups of expression patterns. The samples of the smaller group of biopsies cluster tightly together independent of clustering algorithm and gene filtering used. These samples share characteristics with stromal cells and stem cells and are all classified as claudin-low. These findings are validated in a separate dataset of normal breast tissue. Whether these characteristics represent traits of the woman or cell niches present in all breasts is unknown. This cluster may represent the stem cell niche, defined by stromal tissue and containing stem-like cells. There are more nulliparous women in this cluster. The described signature may be a feature more prominent of the immature breasts of nulliparous women. We cannot conclude about breast cancer risk between the two clusters, although we see an overrepresentation of women a positive family history of breast cancer or a palpable breast lump in the smaller cluster. Further studies are needed to verify the hypotheses generated by this pilot study.
Acknowledgments We thank all the women who participated in the study and all the personnel in the hospitals who made the inclusion of these women possible, in particular the responsible radiologists: Einar Vigeland, Rolf O Næss and Else Berit Velken. We would also like to thank Lars Ottestad for help in the initiation of the project and Hilde Johnsen and Caroline Jevanord Frøyland for lab assistance.
AbbreviationsSAM: significance analysis of microarrays, FDR: false discovery rate. MDG: Mammographic density and genetics.
Reference List
1. Chin K, de Solorzano CO, Knowles D et al.: In situ analyses of genome instability in breast cancer. Nat Genet 2004; 36: 984-988.
2. Maser RS, DePinho RA: Connecting chromosomes, crisis, and cancer. Science 2002; 297: 565-569.
3. Tysnes BB, Bjerkvig R: Cancer initiation and progression: involvement of stem cells and the microenvironment. Biochim Biophys Acta 2007; 1775: 283-297.
4. Perou CM, Sorlie T, Eisen MB et al.: Molecular portraits of human breast tumours. Nature 2000; 406: 747-752.
15

5. Sorlie T, Perou CM, Tibshirani R et al.: Gene expression patterns of breast carcinomas distinguish tumor subclasses with clinical implications. Proc Natl Acad Sci U S A 2001; 98: 10869-10874.
6. Lim E, Vaillant F, Wu D et al.: Aberrant luminal progenitors as the candidate target population for basal tumor development in BRCA1 mutation carriers. Nat Med 2009; 15: 907-913.
7. Herschkowitz JI, Simin K, Weigman VJ et al.: Identification of conserved gene expression features between murine mammary carcinoma models and human breast tumors. Genome Biol 2007; 8: R76.
8. Prat A, Perou CM: Mammary development meets cancer genomics. Nat Med 2009; 15: 842-844.
9. Rizvi AZ, Wong MH: Epithelial stem cells and their niche: there's no place like home. Stem Cells 2005; 23: 150-165.
10. Liu S, Wicha MS: Targeting Breast Cancer Stem Cells. J Clin Oncol 2010.
11. Shipitsin M, Polyak K: The cancer stem cell hypothesis: in search of definitions, markers, and relevance. Lab Invest 2008.
12. Jones C, Mackay A, Grigoriadis A et al.: Expression profiling of purified normal human luminal and myoepithelial breast cells: identification of novel prognostic markers for breast cancer. Cancer Res 2004; 64: 3037-3045.
13. Jechlinger M, Grunert S, Tamir IH et al.: Expression profiling of epithelial plasticity in tumor progression. Oncogene 2003; 22: 7155-7169.
14. Raouf A, Zhao Y, To K et al.: Transcriptome analysis of the normal human mammary cell commitment and differentiation process. Cell Stem Cell 2008; 3:109-118.
15. Liu R, Wang X, Chen GY et al.: The prognostic role of a gene signature from tumorigenic breast-cancer cells. N Engl J Med 2007; 356: 217-226.
16. Chen DT, Nasir A, Culhane A et al.: Proliferative genes dominate malignancy-risk gene signature in histologically-normal breast tissue. Breast Cancer Res Treat 2009.
17. Finak G, Sadekova S, Pepin F et al.: Gene expression signatures of morphologically normal breast tissue identify basal-like tumors. Breast Cancer Res 2006; 8: R58.
18. Casey T, Bond J, Tighe S et al.: Molecular signatures suggest a major role for stromal cells in development of invasive breast cancer. Breast Cancer Res Treat 2008.
16
19. Villadsen R, Fridriksdottir AJ, Ronnov-Jessen L et al.: Evidence for a stem cell hierarchy in the adult human breast. J Cell Biol 2007; 177: 87-101.
20. Nicolau M, Tibshirani R, Borresen-Dale AL, Jeffrey SS: Disease-specific genomic analysis: identifying the signature of pathologic biology. Bioinformatics 2007; 23: 957-965.
21. Poola I, Abraham J, Marshalleck JJ et al.: Molecular constitution of breast but not other reproductive tissues is rich in growth promoting molecules: a possible link to highest incidence of tumor growths. FEBS Lett 2009; 583: 3069-3075.
22. Andre F, Michiels S, Dessen P et al.: Exonic expression profiling of breast cancer and benign lesions: a retrospective analysis. Lancet Oncol 2009; 10: 381-390.
23. Haakensen VD, Biong M, Lingjaerde OC et al.: Expression levels of uridine 5'-diphospho-glucuronosyltransferase genes in breast tissue from healthy women are associated with mammographic density. Breast Cancer Res 2010; 12: R65.
24. Ursin G, Astrahan MA, Salane M et al.: The detection of changes in mammographic densities. Cancer Epidemiol Biomarkers Prev 1998; 7: 43-47.
25. Tibshirani R, Walther G, Hastie T: Estimating the number of clusters in a data set via the gap statistic. J R Statist Soc B 2001; 63: 411-423.
26. Tusher VG, Tibshirani R, Chu G: Significance analysis of microarrays applied to the ionizing radiation response. Proc Natl Acad Sci U S A 2001; 98: 5116-5121.
27. Prat A, Parker JS, Karginova O et al.: Phenotypic and molecular characterization of the claudin-low intrinsic subtype of breast cancer. Breast Cancer Res 2010; 12:R68.
28. Neve RM, Chin K, Fridlyand J et al.: A collection of breast cancer cell lines for the study of functionally distinct cancer subtypes. Cancer Cell 2006; 10: 515-527.
29. Benito M, Parker J, Du Q et al.: Adjustment of systematic microarray data biases. Bioinformatics 2004; 20: 105-114.
30. Shipitsin M, Campbell LL, Argani P et al.: Molecular definition of breast tumor heterogeneity. Cancer Cell 2007; 11: 259-273.
31. Asztalos S, Gann PH, Hayes MK et al.: Gene expression patterns in the human breast after pregnancy. Cancer Prev Res (Phila Pa) 2010; 3: 301-311.
32. Hill RP, Perris R: "Destemming" cancer stem cells. J Natl Cancer Inst 2007; 99:1435-1440.
33. LaBarge MA, Petersen OW, Bissell MJ: Of microenvironments and mammary stem cells. Stem Cell Rev 2007; 3: 137-146.
17

34. Burness ML, Sipkins DA: The stem cell niche in health and malignancy. Semin Cancer Biol 2010; 20: 107-115.
35. Mani SA, Guo W, Liao MJ et al.: The epithelial-mesenchymal transition generates cells with properties of stem cells. Cell 2008; 133: 704-715.
36. Heaphy C, Griffith J, Bisoffi M: Mammary field cancerization: molecular evidence and clinical importance. Breast Cancer Research and Treatment 2009; 118: 229-239.
37. Graham K, de las MA, Tripathi A et al.: Gene expression in histologically normal epithelium from breast cancer patients and from cancer-free prophylactic mastectomy patients shares a similar profile. Br J Cancer 2010; 102: 1284-1293.
38. King C, Guo N, Frampton GM, Gerry NP, Lenburg ME, Rosenberg CL: Reliability and reproducibility of gene expression measurements using amplified RNA from laser-microdissected primary breast tissue with oligonucleotide arrays. J Mol Diagn 2005; 7: 57-64.
18

Table 1 Women included in the study, descriptive statistics all non-cancer (%) cluster 1 (%) cluster 2 (%)
p-value(cluster 1 vs 2)
Age mean 50.2 49.3 50.4 0.52 *)<50 31 (39) 5 (42) 26 (39) 50-69 45 (57) 7 (58) 38 (57) missing 3 (4) 0 (0) 3 (4)
Parity 0 10 (13) 4 (33) 6 (9) 0.05 †)1+ 65 (82) 8 (67) 57 (85) missing 4 (5) 0 (0) 4 (6)
Age at first mean 24.4 24 24.4 0.21 *) birth no children 10 (13) 4 (33) 6 (9)
<25 30 (38) 4 (33) 26 (39) 25+ 26 (33) 3 (25) 23 (34) missing 13 (16) 1 (8) 12 (18)
Hormone never 55 (70) 8 (67) 47 (70) 0.62 †)therapy current 11 (14) 2 (17) 9 (13) use past 6 (8) 0 (0) 6 (9)
missing 7 (9) 2 (17) 5 (7) Body mean 24 23 24 0.24 *)mass <20 5 (6) 2 (17) 3 (4) index 20-<25 44 (56) 6 (50) 38 (57)
25-<30 21 (27) 4 (33) 17 (25) 30+ 6 (8) 0 (0) 6 (9) missing 3 (4) 0 (0) 3 (4)
Mammographic mean 37 40 37 0.62 *) density 0-<23 19 (24) 2 (17) 17 (25)
23-<37 21 (27) 4 (33) 17 (25) 37-<52 19 ((24) 3 (25) 16 (24) 52+ 17 (22) 3 (25) 14 (21) missing 3 (4) 0 (0) 3 (4)
Serum mean 0.27 0.30 0.27 0.81*)estradiol 0-<0.1 27 (34) 3 (25) 24 (36)
0.1-<0.2 20 (25) 4 (33) 16 (24) 0.2+ 31 (39) 5 (42) 26 (39) missing 1 (1) 0 1 (1)
Referral risk/lump 32 (41) 9(75) 23 (33) 0.002 †) source screening 28 (36) 0 (0) 28 (42)
unknown 19 (24) 3 (25) 16 (24) *) Two-sided t-test for continuous variables†) Fisher exact test for categorical variables with <5 observations in certain cells

Table 2 Comparison of cluster 1 and cell types/subtypes from published gene lists. Chi-squared test is used to illustrate the extent to which genes describing different cell types are equally regulated in the two clusters. Significant p-values are in bold type. For more information on the publications and comparisons, see Supplemental file 1, Table S3. Comparison Reference Cluster 1 resembles p-value�Epithelial vs stem-like cell Shipitsin, 2007 Stem-like cell 2.20E-16 Stroma vs epithelium Finak, 2006 Stroma 2.20E-16 Mesenchymal vs epithelial Jechlinger, 2003 Mesen-chymal 6.90E-14 Revised subtypes Herschkowitz, 2007 Claudin-low 1.52E-12 Fibroblasts vs epithelial cells Casey, 2008 Fibroblasts 1.9E-12Risk predictor Chen, 2009 Low risk 1.30E-09 Stem-like cell vs epithelial Liu, 2007 Stem-like 1.30E-05 Myoepithelial vs progenitor Raouf, 2008 Progenitor 2.40E-05 Luminal vs progenitor Raouf, 2008 Progenitor 0.001Stem-like vs progenitor cells Villadsen, 2007 Lineage restricted progenitor 0.008Myoepithelial vs luminal Jones, 2004 (Myepithelial) 0.06Classical subtypes Sorlie, 2001 - 0.76
*) Chi squared test for significance

Figure 1: Unsupervised hierarchical clustering of 79 samples from healthy individuals and 9767 genes filtered on variation. Phenotypes with tests for significant difference in values between cluster 1 (blue) and cluster 2 (red). Continuous variables are categorized for the illustration, but significance tested as continuous variables. P-values from two-sided t-tests assuming equal variance for continuous variables (*) and chi-squared tests (†) for categorical variables are given. The numbers along the y-axis denotes the number of genes. Age= Age at time of inclusion. BMI: Body mass index. HT: Use of hormone therapy. MD: Mammographic density.
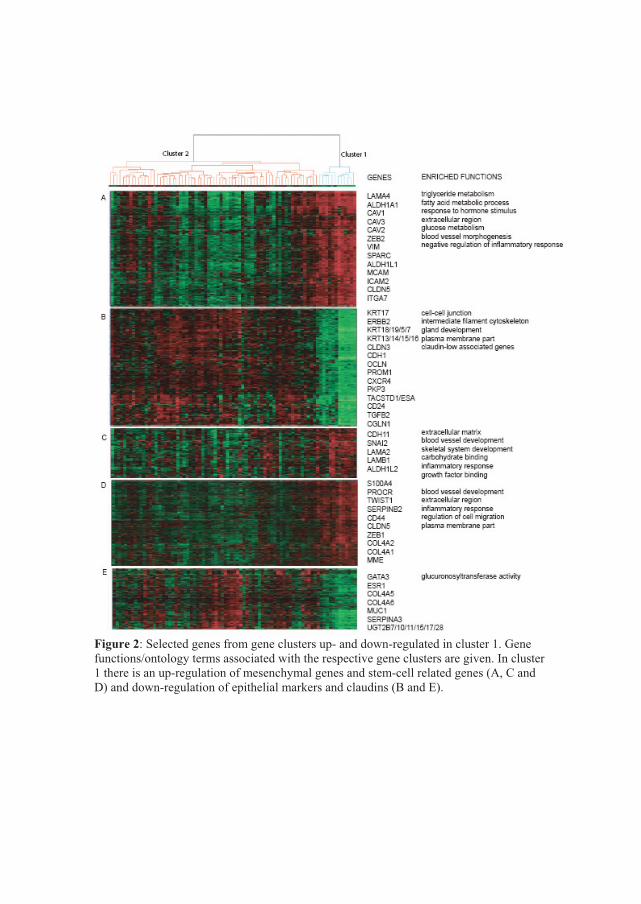
Figure 2: Selected genes from gene clusters up- and down-regulated in cluster 1. Gene functions/ontology terms associated with the respective gene clusters are given. In cluster 1 there is an up-regulation of mesenchymal genes and stem-cell related genes (A, C and D) and down-regulation of epithelial markers and claudins (B and E).

Figure 3: Unsupervised hierarchical clustering of 40 samples from the validation dataset AHUS1. Reduction mammoplasties and cancer normal samples are split between one larger and one smaller cluster, the smaller cluster containing slightly more mammoplasty reductions.

Supplementary material Table S1 Gene ontology termes enriched in the genes differentially expressed between the two main samples in the MDG dataset (cluster 1 and 2 in Figure 1) and the AHUS1 dataset (small and large cluster in Figure 2)
Cluster 1 AHUS1 small cluster up extracellular regioin mitochondrion
vascular development response to hormone/insulin signal peptide glucose metabolism regulation of lipid metabolism vasculature development response to hormone/insulin vitamin B6-binding glucose metabolic process regulation of lipid metabolism triglyceride metabolism carboxylic acid biosynthesis membrane organization triglyceride metabolism protein dimerization aerobic respiration regulation of inflammatory response regulation of lipid storage cell motion membrane organic acid biosynthesis protein dimerization regulation of catabolic process iron ion binding oxygen and reactive oxygen species regulation of inflammatory response mitochondrion
down actin binding adherens junction adherens junction actin binding cell-cell junction extracellular matrix cytoskeleton cytoskeleton plasma membrane cell-cell junction

Table S2 Gene set enrichment analysis (GSEA) of cluster 1 versus cluster 2 using selected gene lists from the literature. Significant FDR-values are marked red. Gene�list� FDR� Cluster�1�STROMA�(FINAK)� 0.00� Up�STROMA�(CASEY)� 0.02� Up�CD44+�(SHIPITSIN)� 0.01� Up�BIPOLAR�(VS�LUM)�(RAOUF)� 0.10� Up�BIPOTENT�(VS�MYO)�(RAOUF)� 0.08� Up�MYOEPITHELIAL�(JONES)� 0.13� Up�IGS/CD44+��(LIU)� 0.20� Up�EPITHIAL�(FINAK)� 0.00� Down�CD24+�(VS�CD44)�(SHIPITSIN)� 0.03� Down�IGS/CD10�(LIU)� 0.07� Down�RISK�(CHEN)� 0.24� Down�LUMINAL�(JONES)� 0.48� Down�EPITHIAL�(JECHLINGER)� 0.70� Down�MESENCHYMAL�(JECHLINGER)� 0.66� Down�
Table S3 Comparison of cluster 1 and cell types/subtypes from published gene lists. The number of genes up- and down-regulated is given for genes characterizing each cell type and each cluster. Chi-squared test is used to illustrate the extent to which genes describing different cell types are equally regulated in the two clusters. The right column shows samples correctly identified by hierarchical clustering of the normal breast samples based on the gene list from the corresponding publication (see Supplemental file 1, Figure S2)
Samples�correctly�identified�by�clustering�
Publication� Cell�type� Method��up�in�cluster�1�
down�in�cluster�1�
cluster�1�resembles� Cluster�1� Cluster�2�
Shipitsin,�� Epithelial� CD24+� 132 152 12/12 66/67�2007� Stem�cell�like� CD44+� 394 89
CD44+��
� Unchanged� �� 0 106 �� ��� Sum� � 526 347 � ��� � p�value� 2.2E�16 �� �� ��
Jechlinger,� Mesenchymal� 61 17 11/12 67/67�2003� Epithelial� 38 32 �
� Unchanged�
Before�and�after�TGFbeta�induced�EMT� 0 36
Mesen�chymal���
��� Sum� � 99 85 � ��� � p�value� 6.9E�14 �� �� ��

Samples�correctly�identified�by�clustering�
Table S3 cont
Publication�����Cell�type� Method��up�in�cluster�1�
down�in�cluster�1�
cluster�1�resembles� Cluster�1� Cluster�2�
Raouf,�2008� Luminal�
CD49flow/MUC1high/CD10low� 521 442
Progenitor�
12/12 67/67�
�Bipotent�progenitor�
CD49fhigh/MUC1low/�CD10high� 259 162
�
�� Unchanged� �� 343 338 �� ��� Sum� � 1123 942 � ��� � p�value� 0.001 �� �� ��
Raouf,�2008� Myoepithelial�
CD49flow/MUC1low/�CD10high� 139 88
Progenitor�
12/12 67/67�
�Bipotent�progenitor�
CD49fhigh/MUC1low/�CD10high� 232 128
�
�� Unchanged� �� 156 171 �� �� ��� Sum� � 527 387 � � ��� � p�value� 2.40E�05 �� �� ��Liu,�� Stem�cell�like� CD44+� 50 17 Stem�like� 11/12� 67/67�2007� Epithelial� CD10+� 34 58 Invasive� � �� Unchanged� �� 36 27 �cells� �� ��� Sum� � 120 102 � � ��� � p�value� 1.30E�05 � �� �� ��Jones,� Myoepithelial� MUC1+� 65 91 �� 12/12 66/67�2004� Luminal� CD10+� 21 47 � �� Unchanged� �� 30 28 �� ��� Sum� � 116 166 � ��� � p�value� 0.06 �� �� ��
Chen,�2009� IDC�like�normal�� 11 81 Low�risk� 11/12� 62/67�
� Other�normal�c�
Based�on�gene�expression� 17 4
��
� Unchanged� �� 0 0 �� ��� Sum� � 28 85 � ��� � p�value� 1.3E�09 �� �� ��Finak,�� Stroma� 457 91 12/12 67/67�2006� Epithelial�
Micro�dissection� 51 317
Stroma��
� Unchanged� �� 59 92 �� ��� Sum� � 567 500 � ��� � p�value� 2.2E�16 �� �� ��

Samples�correctly�identified�by�clustering�
Table S3 cont
Publication�����Cell�type� Method��up�in�cluster�1�
down�in�cluster�1�
cluster�1�resembles� Cluster�1� Cluster�2�
Casey,�� Fibroblasts� 330 140 11/12 64/67�2008� Epithelial�
Micro�dissection� 119 134
Fibroblasts��
� Unchanged� �� 224 228 �� ��
� Sum� � 673 502 � �
�� � p�value� 1.9E�12� �� ��
Villadsen,�� Stem�like�� K19+/�K14+� 71 104 7/12 29/67�2007� K19+/�K14�� 46 30 �� K19�/K14+� 4 5 ��
Lineage�����������restricted�progenitors� K19�/K14�� 48 81 �
� Unchanged� �� 0 0
Lineage�restricted�progenitor�K19+/K14��
�� ��� Sum� � 169 220 � � ��� � p�value� 0.008 � �� �� ��Asztalos,� nullipara� Micro�� 8 2 Post�� � �2010� postpregnant� dissection� 5 4 pregnant� � �� Unchanged� � 0 0 � � �� Fisher� � 0.34 � � �Sorlie,�� Basal�like� 62 66 �� 12/12� 67/67�2001� HER2�enriched� 72 69 � � �� Luminal�A�
Based�on�gene�expression� 73 80 � � �
� Luminal�B� � 70 60 � � �� Normal�like� � 80 91 � � �� Unchanged� �� 0 0 �� �� ��� Sum� � 357 366 � � ��� � p�value� �0.76 �� �� ��
Basal�like� 56 79 claudin�low� 12/12� 67/67�Claudin�low� 121 33 � � �
Hersch�kowitz,�2007� HER2�enriched� 76 98 � � �� Luminal�
Based�on�gene�expression� 70 95 � � �
� Normal�like� � 76 67 � � �� Unchanged� �� 163 116 �� �� ��� Sum� � 562 488 � � ��� � p�value� �1.52E�12 �� �� ��

Chen et al, 2008IDC-like normal cells vsother normal cells
Shiptisin et al, 2007Luminal (CD24+) vs stem-cell like (CD44+) cells
Jechlinger et al, 2003Epithelial cells before and after TGFbeta-induced EMT
Raouf et al, 2008Luminal (MUC1+ vs bipotent (CD49f+, CD10+) cells
Raouf et al, 2008Myoepithelial (CD10+) vs bipotent (CD49+, CD10) cells
Liu et al, 2007Stem-cell like (CD44+) vs luminal (CD10+) cells
Jones et al, 2004myoepithelial (MUC1+) vs luminal (CD10+) cells
Figure S1
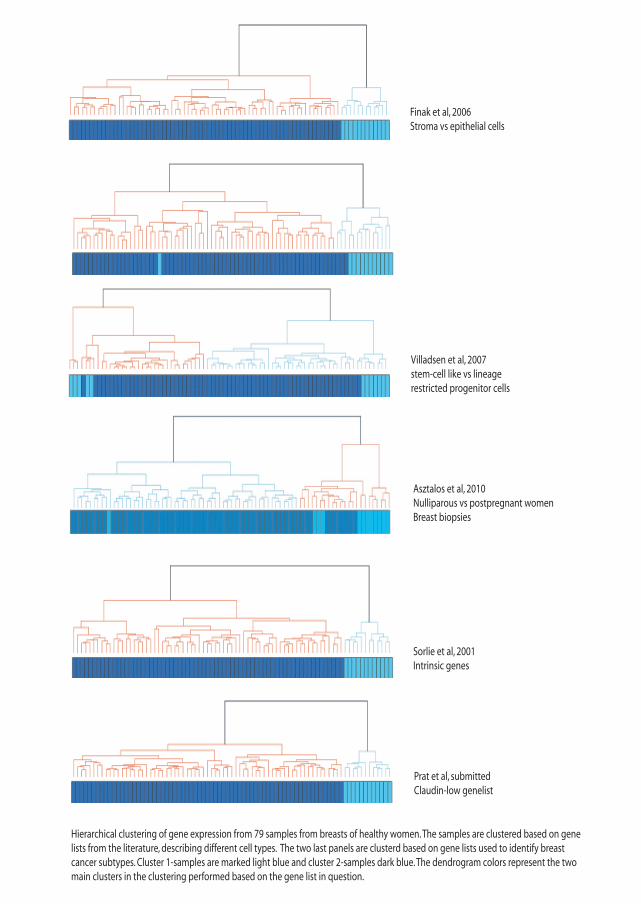
Finak et al, 2006Stroma vs epithelial cells
Villadsen et al, 2007stem-cell like vs lineagerestricted progenitor cells
Sorlie et al, 2001Intrinsic genes
Prat et al, submittedClaudin-low genelist
Hierarchical clustering of gene expression from 79 samples from breasts of healthy women. The samples are clustered based on genelists from the literature, describing different cell types. The two last panels are clusterd based on gene lists used to identify breast cancer subtypes. Cluster 1-samples are marked light blue and cluster 2-samples dark blue. The dendrogram colors represent the two main clusters in the clustering performed based on the gene list in question.
Asztalos et al, 2010Nulliparous vs postpregnant womenBreast biopsies

MDG cluster 1 MDG cluster 2 AHUS1 mammoplasty reductions AHUS1 tumor adjacent
A
C
MDG cluster 1 MDG cluster 2 Nicolau mammoplasty reductions Nicolau tumor adjacent
MDG cluster 1 MDG cluster 2 AHUS2 high fraction of fat AHUS2 low fraction of fat
B
Figure S2 Biopsies from healthy women (MDG) clustered with two unpublished datasets from the hospital AHUS A) AHUS1 with breast biopsies from mammoplasty reductions (yellow) and tumor adjacent (red) tissue and B) AHUS2 with breast biopsies containing different known proportions of fat tissue and C) a dataset previously published by Nicoalu et al(1) with breast biopsies from mammoplasty reductions (yellow) and tumor adjacent (red) breast tissue. In all cases, the two datasets are merged by use of Distance Weighted Discrimination (DWD). This resulted in datasets with A) 8520 genes, B) 10078 and C) 3555 genes. Hierarchical clustering with Eucledian distance and Ward linkage was performed as described.
Reference list
1. Nicolau M, Tibshirani R, Borresen-Dale AL, Jeffrey SS: Disease-specific genomic analysis: identifying the signature of pathologic biology. Bioinformatics 2007; 23: 957-965.

Paper II Expression levels of uridine 5�-diphosphoglucuronosyltransferase genes in breast tissue from healthy women are associated with mammographic density


RESEARCH ARTICLE Open Access
Expression levels of uridine 5′-diphospho-glucuronosyltransferase genes in breast tissuefrom healthy women are associated withmammographic densityVilde D Haakensen1,2, Margarethe Biong1, Ole Christian Lingjærde3,4, Marit Muri Holmen5, Jan Ole Frantzen6,Ying Chen7, Dina Navjord8, Linda Romundstad9, Torben Lüders10, Ida K Bukholm2,11, Hiroko K Solvang1,Vessela N Kristensen1,2,10, Giske Ursin12,13, Anne-Lise Børresen-Dale1,2, Åslaug Helland1,2,14*
Abstract
Introduction: Mammographic density (MD), as assessed from film screen mammograms, is determined by therelative content of adipose, connective and epithelial tissue in the female breast. In epidemiological studies, a highpercentage of MD confers a four to six fold risk elevation of developing breast cancer, even after adjustment forother known breast cancer risk factors. However, the biologic correlates of density are little known.
Methods: Gene expression analysis using whole genome arrays was performed on breast biopsies from 143women; 79 women with no malignancy (healthy women) and 64 newly diagnosed breast cancer patients, bothincluded from mammographic centres. Percent MD was determined using a previously validated, computerizedmethod on scanned mammograms. Significance analysis of microarrays (SAM) was performed to identify genesinfluencing MD and a linear regression model was used to assess the independent contribution from differentvariables to MD.
Results: SAM-analysis identified 24 genes differentially expressed between samples from breasts with high and lowMD. These genes included three uridine 5′-diphospho-glucuronosyltransferase (UGT) genes and the oestrogenreceptor gene (ESR1). These genes were down-regulated in samples with high MD compared to those with lowMD. The UGT gene products, which are known to inactivate oestrogen metabolites, were also down-regulated intumour samples compared to samples from healthy individuals. Several single nucleotide polymorphisms (SNPs) inthe UGT genes associated with the expression of UGT and other genes in their vicinity were identified.
Conclusions: Three UGT enzymes were lower expressed both in breast tissue biopsies from healthy women withhigh MD and in biopsies from newly diagnosed breast cancers. The association was strongest amongst youngwomen and women using hormonal therapy. UGT2B10 predicts MD independently of age, hormone therapy andparity. Our results indicate that down-regulation of UGT genes in women exposed to female sex hormones isassociated with high MD and might increase the risk of breast cancer.
* Correspondence: [email protected] of Genetics, Institute for Cancer Research, Oslo UniversityHospital Radiumhospitalet, Oslo, Montebello, NO-0310, NorwayFull list of author information is available at the end of the article
Haakensen et al. Breast Cancer Research 2010, 12:R65http://breast-cancer-research.com/content/12/4/R65
© 2010 Haakensen et al.; licensee BioMed Central Ltd. This is an open access article distributed under the terms of the CreativeCommons Attribution License (http://creativecommons.org/licenses/by/2.0), which permits unrestricted use, distribution, andreproduction in any medium, provided the original work is properly cited.

IntroductionBreast cancer is a common disease in women. Knowl-edge about the first steps in tumour initiation is impor-tant for early detection. However, the exact mechanismsof tumour initiation are still unknown.Mammographic density (MD), captured on film screen
mammograms, refers to the content and architecturalstructure of the adipose, connective and epithelial tissuesin the female breast [1]. In epidemiological studies, a highpercentage of MD confers a four to six fold elevated riskof developing breast cancer [1-3] and has been proposedas a possible surrogate marker for the disease [4]. Therelative risk associated with MDs remains at this magni-tude even after adjustment for all other known breast can-cer risk factors. Breasts with high MD have greater tissuecellularity and more tissue collagen [5]. Still, little isknown as to how MD confers the increased breast cancerrisk. MD is to a large degree an inherited trait, although itis also influenced by environmental factors, hormone ther-apy being an evident example [6]. The genetic factorsdetermining the inheritability are largely unknown.In order to elucidate how MD increases the risk of
breast cancer; we searched for the biological correlatesto MD. Gene expression analysis on biopsies frombreasts of healthy women with varying degrees of MDwas performed. The gene expression profiles representthe gene activity of the different cell types in the biopsy,producing a fingerprint of the breast tissue within thebiopsy of that particular woman.The breast is an oestrogen-sensitive organ. MD varies
with levels of female hormones, and is reduced after
menopause. The uridine 5′-diphospho-glucuronosyl-transferase (UGT) genes encode enzymes inactivatingseveral endogenous and exogenous compounds, includ-ing sex hormones (Figure 1) [7]. UGT1A1 is known tobe responsible for the glucuronidation of bilirubin, butis also shown to glucuronidate catechol oestrogens [8,9].Polymorphisms in this gene have previously been linkedto MD in premenopausal women [10]. UGT2B7 isknown to conjugate oestrone, one of the active oestra-diol metabolites. This enzyme has previously been foundto be down-regulated in tumour tissue compared withnon-malignant tissue, leading to the conclusion thatUGT expression could lead to the promotion of carcino-genesis [11] but there are no reports on this gene inrelation to MD in the literature. Less is known aboutthe other UGT2B genes, although there is extensivestructural homology. We will use the UGT genes as aterm describing three UGT2B genes significantly down-regulated in our analyses (UGT2B7, UGT2B10 andUGT2B11). Other UGT genes are specified in the text.In this study we analysed biopsies from breasts ofhealthy women and found genes whose expression isassociated with MD.
Materials and methodsSubjectsThe women included in this study had all attended oneof six breast diagnostic centres in Norway that are partof the governmentally funded National Breast CancerScreening Program between 2002 and 2007 [12].Women were eligible if they did not currently use
Figure 1 UGTs conjugate oestrogen-substrates into biologically inactive oestrogen glucuronides. The figure gives a schematic view withfocus on glucuronidation and not a complete picture of oestradiol metabolism. Androgens are also inactivated by uridine 5’-diphospho-glucuronosyltransferases (UGTs), but are not included in this illustration.
Haakensen et al. Breast Cancer Research 2010, 12:R65http://breast-cancer-research.com/content/12/4/R65
Page 2 of 11

anticoagulants, did not have breast implants and werenot currently pregnant or lactating. A total of 186women were recruited to the study; 120 healthy womenwith no malignant disease but some visible density inthe mammograms, referred to here as healthy women,and 66 women with a newly diagnosed breast cancer. Ofthese, quality tested expression data were obtained frombiopsies from 79 healthy women and 64 breast cancerpatients.The women were either referred to a breast diagnostic
centre for a second look due to some irregularity of theinitial screening mammogram (n = 69) or due to clinicalfindings (n = 83). For 34 women the type of referral wasunknown.The women provided information about height,
weight, parity, hormone therapy use and family historyof breast cancer. Two breast biopsies and three bloodsamples were collected from each woman. All womenprovided signed informed consent. The study wasapproved by the local ethical committee and localauthorities (IRB approval no S-02036).
Core biopsiesTwo breast biopsies were obtained from each womanwith a 14 gauge needle, for RNA- and DNA-extraction.In healthy women, the biopsies were taken from an areawith no visible pathology, but with some MD to ensurethat the biopsies did not contain only fatty tissue, whichyields little RNA. The sampling was guided by ultra-sound. At one hospital, six of the biopsies from breastsof healthy women were collected from a benign lesion(mostly fibroadenomas). For the cancer patients, allbiopsies were taken from the tumour. The tissue waseither fresh-frozen at -80°C or soaked in ethanol andRNAlater (Ambion, Austin, TX, USA), transported andsubsequently stored at -20°C.
PathologyThe haematoxylin eosinofil sections from the tumoursof the breast cancer patients were evaluated locally andthen re-evaluated by one pathologist (YC). Informationabout tumour size, histological grade and type, oestro-gen and progesterone receptor status, human epidermalgrowth factor receptor (HER) 2 status and sentinel nodestatus was recorded and entered into a database mana-ged by the Office for Clinical Research at Oslo Univer-sity Hospital, Radiumhospitalet. Pathology evaluationswere not available for the biopsies from breasts ofhealthy women.
RNA-expression analysisHomogenisation, cell lysis and RNA extraction wereperformed using the RNeasy Mini Protocol (Qiagen,Valencia, CA, USA). RNA quality was controlled by
Agilent 2100 Bioanalyzer (Agilent Technologies, PaloAlto, CA, USA) and concentration was determinedusing NanoDrop ND-1000 spectrophotometer (ThermoScientific, Wilmington, DE, USA). A total of 40 samples,mostly from normal breast tissue, were excluded fromfurther analyses due to a low RNA amount (< 10 ng) orpoor RNA quality. RNA was then amplified and labelledusing the Agilent Low RNA input Fluorescent LinearAmplification Kit Protocol. Amplified tumour RNA waslabelled by Cy5 (Amersham Biosciences, Little Chalfont,England, UK) and amplified RNA from UniversalHuman total RNA (Stratagene, La Jolla, CA, USA) waslabelled by Cy3 (Amersham Biosciences, Little Chalfont,England, UK). RNA from the remaining 146 biopsieswas further hybridised on Agilent Human WholeGenome Oligo Microarrays (G4110A) (Agilent Technol-ogies, Santa Clara, CA, USA). Three arrays had to beexcluded due to poor quality leaving data from 143 sub-jects (79 healthy individuals and 64 breast cancerpatients) for further analysis. Of the 79 biopsies fromhealthy women, 5 had been obtained from a benignlesion. By ultrasound and mammography these 5 weredescribed as fibroadenoma (n = 4) or microcalcification(n = 1).
RNA-data processingThe microarrays were scanned by an Agilent scanner(Agilent Technologies, Santa Clara, CA, USA) andprocessed in Feature Extraction 9.1.3.1 (Agilent Tech-nologies, Santa Clara, CA, USA). Locally weighted scat-terplot smoothing (lowess) was used to normalise thedata. The normalised and log2-transformed data werestored in the Stanford Microarray Database [13] andretrieved from the database for further statistical ana-lyses. Flagged spots were treated as missing values. Thedataset now counted 40,791 probes. Clone IDs with 20%or more missing values were excluded. Gene filteringwas performed to include only probes with variationacross samples, so that probes with less than threearrays being at least 1.6 standard deviations from themean were excluded. For the 79 healthy women, thisprobe filtration resulted in an expression dataset of9,767 probes and 79 arrays each representing one indivi-dual. For the breast cancer women, a dataset of 64 arraysand 10,153 probes were obtained after filtration, and forboth groups combined, a dataset of 143 arrays and13,699 probes were obtained. Missing values wereimputed in R using the method impute.knn in thelibrary impute [14].
GenotypingBlood DNA was extracted by phenol/chloroform extrac-tion followed by ethanol precipitation (Nuclear AcidExtractor 340A; Applied Biosystems, Foster City, CA,
Haakensen et al. Breast Cancer Research 2010, 12:R65http://breast-cancer-research.com/content/12/4/R65
Page 3 of 11

USA) according to standard procedures. UGT genotypedata was retrieved from two sources: genome wide asso-ciation studies (GWAS) using the Human-1 109K Bead-Chip (Illumina Inc, San Diego, CA, USA) and candidategene-based study using iPlex, Sequenom. For theGWAS, each sample was subject to whole genomeamplification using Illumina proprietary reagents [15].The amplified DNA was fragmented and hybridisedaccording to the protocol. The BeadArray reader(Illumina Inc, San Diego, CA, USA) with the BeadScansoftware (Illumina Inc, San Diego, CA, USA) was usedto image the beadchips. Non-polymorphic probes andprobes with more than 20% missing values and wereexcluded and data processed as described previously[16]. The candidate gene single nucleotide polymorph-ism (SNP) analyses were performed using the iPLEXassay in conjunction with the Sequenom MassARRAYplatform. Multiplexing was performed in 384 platesusing 1 ul DNA per well with one well containing up to29 reactions. The technology is described in detail onthe sequenom web-page [17].
MammogramsRoutine descriptions of mammograms by local radiolo-gists were collected. Craniocaudal mammograms of bothbreasts were digitised using a high-resolution KodakLumisys 85 scanner (Kodak, Rochester, NY, USA). Den-sity was quantified using the University of SouthernCalifornia Madena assessment method [18]. In brief, themethod works as follows: a reader (trained by GU) out-lines the total area of the breast using a computerisedtool, the software then counts the number of pixels.This represents the total breast area. MD is assessed (byGU), first by identifying a region of interest that incor-porates all dense areas except those representing thepectoralis muscle and scanning artifacts, and then byapplying a yellow tint to all pixels within the region ofinterest shaded at or above a threshold intensity of gray.The software then counts the tinted pixels, which repre-sents the area of absolute density. The percent density isthe absolute density area divided by the total breast areaand is the value used for these analyses. Test-retestreliability was 0.99 for absolute density.
Statistical analysisClustering was performed using MatLab (versionR2007b) (The MathWorks Inc., Natick, MA, USA) withWard linkage and Euclidean distances. Before clustering,the data were gene centred, that is, for every probe themean expression across all samples was calculated andwas subtracted from the log2-ratios for that gene. Thiswas performed for visualisation purposes only, clusteringwith uncentred data returns the same clusters. Signifi-cance analysis of microarrays (SAM, Stanford University,
CA, USA) (version 3.02) [19,20] for Excel (Microsoft,Redmond, WA, USA) was used for analysis of differen-tially expressed genes between two groups of data. Thedata were not gene centred for the SAM analysis. Atotal of 500 permutations were used. Quantitative SAManalysis was used to identify genes differentiallyexpressed according to MD as a continuous variable.Statistical significance tests and regression analysis wereperformed in R 2.9.0 [21]. To test for difference in themean of phenotypic variables (MD, age, body massindex (BMI)) in different clusters of women, we usedtwo-sided t-tests (assuming equal variance in thegroups) and analysis of variance (ANOVA) for continu-ous variables and chi-squared/Fisher’s exact tests forcategorical variables [22]. To investigate the similaritiesof distributions of UGT genes between tumour samplesand normal samples with low MD and high MD respec-tively, Kullback-Leibler distances between normaliseddistributions of the histograms of the data were calcu-lated by use of MatLab (The MathWorks Inc., Natick,MA, USA). The cancer samples in our study weregrouped into subtypes and assigned a risk group usingthe PAM50 gene list published by Parker et al [23].SNP-analysis was performed using R 2.9.0 [21]. Theassociation between gene expression and SNPs wasassessed using expression quantitative trait loci (eQTL)[24]in cis (106 bp on each side of the gene) using the Rpackage eMap v1.1 [25]. Comparing the akaike informa-tion criterion for different models predicting MD, thelower criterion singled out a linear regression model asthe model fitting the distribution of the data best. A lin-ear regression model was fitted in R 2.9.0 with MD as acontinuous response variable and the following covari-ates: UGT2B7, two probes for UGT2B10, UGT2B11,ESR1, age, BMI, current hormone therapy, age at firstbirth and parity. Gene expression, age, age at first birthand BMI were entered into the model as continuousvariables. Stepwise variable selection was performed,starting with all variables included in the model. Forevery step, the variable with the highest P value wasrejected from the model and the model was refitted.This was repeated until all variables included in themodel had a P value less than 0.05. To correct forthe influence of age, this variable was forced to stay inthe model. A sensitivity analysis was performed exclud-ing extreme ages (30 years or younger) to check therobustness of the data. We also fitted linear regressionstratified on age (younger or older than 50 years of age)and current use of hormone therapy. Gene ontologyanalysis was performed by the use of DAVID Bioinfor-matics Resources 2008 from the National Institute ofAllergy and Infectious Diseases, NIH [26]. Functionalannotation clustering was applied and the followinggene ontology categories were selected: biological
Haakensen et al. Breast Cancer Research 2010, 12:R65http://breast-cancer-research.com/content/12/4/R65
Page 4 of 11

processes (all), molecular function (all) and the KEGGpathway database. We included gene ontology termswith a P value (false discovery rate (FDR)-corrected) ofless than 0.01 containing between 5 and 500 genes.The normalised, log2-transformed data are available in
Gene Expression Omnibus with accession number[GEO:GSE18672]. The data are not gene centered orgene filtered.
ResultsGene expression and mammographic densityTo identify genes differentially expressed according to MDwe performed quantitative SAM with MD as a continuousvariable using gene expression data from the normal biop-sies. Of 9,767 probes, only 25 probes, representing 24genes, were differentially expressed according to MD, withreduced expression associated with higher MD (FDR <25%; Table 1) [see Additional file 1]. Gene ontology analy-sis revealed no significant terms and we found no pathwayassociated with this gene set. The UGT genes and oestro-gen receptor gene (ESR1) were among the genes signifi-cantly down-regulated in breasts with high MD. Thepercentage of samples with low UGT expression washigher in tumour samples than in normal samples with
low MD, whereas the percentage was more similarbetween tumour samples and normal samples with highMD [see Figure S1 in Additional file 2]. The function ofUGT-enzymes in oestradiol metabolism is illustrated inFigure 1. In healthy women, the expression of the differentUGT genes was highly correlated with each other and thefour probes clustered together [see Figures S2 and S3 andTable S1 in Additional file 2].MD was lower in women with BMI of 25 or more com-
pared with those with BMI of less than 25 (P = 0.01), butunrelated to other epidemiological variables. UGTexpression was not significantly associated with age, BMI,age at first birth or current hormone therapy use in thehealthy women [see Table S2 in Additional file 2].To dissect the impact of age and hormone therapy
use, we performed SAM analyses to identify differen-tially expressed genes according to MD, whereas strati-fying for age and postmenopausal hormone therapyuse. For healthy women younger than 50 years of age,the UGT genes were not significant at a FDR of 25%.For healthy women aged 50 years or older, 49 probeswere significantly down-regulated in breasts with MDof 30% or higher (FDR < 25%). Of these, 17 were over-lapping with those significantly down-regulated amonghealthy women in the unstratified analysis. The UGTgenes were not in this list. We then stratified thewomen aged 50 years or older on current hormonetherapy use. When only those currently using hormonetherapy were included in the analysis, UGT2B7 andUGT2B11 were among the six genes differentiallyexpressed with an FDR less than 10E-5 and UGT2B28with FDR less than 25%. For healthy women above 50years of age and not currently using hormone therapy,several of the 24 genes were differentially expressedaccording to MD with an FDR of less than 25%, butagain the UGT genes were not in this list [see Addi-tional file 3].These analyses were confirmed fitting a linear regres-
sion model. Although the other variables were excludedfrom the model with insignificant P values, age was keptin the model to control for the age-effect. After stepwisevariable selection, the only significant variables remain-ing in the model were UGT2B10 (A_23_P7342)(P =0.005) and BMI (P = 0.015). Sensitivity analysis exclud-ing extreme ages (30 years and younger) did not alterthe results (UGT2B10 P = 0.003, BMI P = 0.016) andindicates the robustness of the results. ESR1 was border-line significant in both these analyses. These resultswere not significantly altered when MD was log2-trans-formed. For further stratification see Table 2.Unsupervised hierarchical clustering of the 79 samples
from healthy women showed two main clusters. MDwas not significantly different between these two clus-ters [see Figure S3 in Additional file 2].
Table 1 Genes differentially expressed according tomammographic density in non-cancer samples
Gene symbol Agilent ID Cytogenetic band
729641 A_24_P932736 8p21.1
FLJ10404 A_23_P427472 5q35.3
VPS18 A_24_P18802 15q15.1
UGT2B10 A_23_P7342 4q13.2
CABP7 A_24_P177236 22q12.2
CD86 A_24_P131589 3q13.33
UGT2B11 A_23_P212968 4q13.2
580687 A_23_P152570 17p11.2
DIAPH2::RPA4 A_23_P254212 Xq21.33
LMOD1 A_32_P199824 1q32.1
UGT2B10 A_24_P521559 4q13.2
PIK3R5 A_23_P66543 17p13.1
ATG7 A_32_P107994 3p25.2
LRRC2 A_23_P155463 3p21.31
RBL1 A_23_P28733 20q11.23
NPY1R A_23_P69699 4q32.2
810781 A_23_P144244 3q13.33
593535 A_32_P80016 15q26.1
H2AFJ A_23_P204277 12p12.3
666399 A_32_P35668 20p12.3
Transcribed A_24_P640617 2p25.2
Transcribed A_32_P20997 20q13.13
UGT2B7 A_23_P136671 4q13
ESR1 A_23_P309739 6q25.1
SAPS1 A_23_P119448 19q13.42
Haakensen et al. Breast Cancer Research 2010, 12:R65http://breast-cancer-research.com/content/12/4/R65
Page 5 of 11

In the breast cancer group, MD was significantly asso-ciated with age and BMI, with higher MD in theyounger women and in those with BMI less than 25.Both MD and UGT expression tended to be higher inwomen with receptor positive tumours, but this was notsignificant for any type of receptor. UGT-expression intumours was unrelated to age, BMI, age at first birthand current hormone therapy (data not shown). Therewas a higher proportion of oestrogen receptor positivetumours among the breast cancer patients with high
MD (≥ 30%) compared with low (< 30%) MD (10 of 10vs 36 of 40, Fisher’s = 0.001). There was no significantassociation between tumour subtype and level of MD asassessed by ANOVA. There was no indication thatdegree of MD was associated with the risk of relapse asassessed by the method of Parker et al [23] [see FigureS4 of Additional file 2].Nine probes were differentially expressed according to
MD in cancer samples (FDR < 25%; Table 3). None ofthese were overlapping with the 24 genes differentially
Table 2 Linear regression analysis of factors predicting mammographic density in all women and stratified for ageand hormone therapy use
Women in model N Variables Beta value P value
All women 76 UGT2B101) -0.6 0.902
UGT2B7 1.8 0.631
UGT2B11 4.8 0.275
ESR1 -3.8 0.055
UGT2B102) -5.6 0.005
BMI -1.5 0.015
age -0.4 0.074
50 years or older 46 UGT2B11 0.2 0.987
UGT2B101) 1.0 0.946
UGT2B7 3.5 0.486
UGT2B102) -3.7 0.073
BMI -1.4 0.052
ESR1 -6.0 0.016
age -0.9 0.061
50 years or older, currently on hormone therapy 11 UGT2B101) 7.2 0.771
UGT2B11 -5.8 0.695
BMI -2.9 0.103
UGT2B7 6.8 0.418
UGT2B102) -27.0 0.000
ESR1 -8.1 0.011
age -0.9 0.103
50 years or older, never used hormone therapy 28 UGT2B11 -0.7 0.948
UGT2B101) 3.3 0.809
UGT2B7 3.1 0.555
UGT2B102) -1.4 0.607
BMI -0.9 0.348
ESR1 -6.0 0.033
Age -1.5 0.004
Younger than 50 years 30 UGT2B7 0.4 0.950
UGT2B101) -1.2 0.866
ESR1 -0.9 0.835
UGT2B11 8.4 0.225
BMI -1.4 0.216
UGT2B102) -6.2 0.040
Age -0.3 0.610
1) A_24_P521559, 2) A_23_P7342
Factors predicting mammographic density (MD) after stepwise exclusion of non-significant factors are shown. Variables listed in the order of exclusion from themodel. P value from the last equation including the variable is shown. Age is forced to stay in the model. UGT2B10 (A_23_P7342) is a significant, independentpredictor of MD in all analyses with a majority of women under influence of female hormones; women younger than 50 years of age and women currently onhormone therapy. BMI, body mass index.
Haakensen et al. Breast Cancer Research 2010, 12:R65http://breast-cancer-research.com/content/12/4/R65
Page 6 of 11

expressed in the samples from the breasts of healthywomen.
Genetic polymorphismsIn order to identify genetic determinants of the expressionof the UGT genes found to be associated with MD, weperformed eQTL analyses of SNPs in these genes as avail-able from an array based GWAS study and a candidategene study. Twenty one SNPs in UGT genes were presenton the 109 K array from Illumina, and 9 SNPs from thecandidate gene analysis. Of these, 5 SNPs were associatedwith the expression of UGT genes or other genes in theirvicinity at P = 0.05 [see Additional file 4]. Two of theseSNPs, both located in UGT2B10 (rs1828705, rs1828705),were significantly associated with gene expression ofanother UGT gene (UGT2B7 and UGT2B28).
DiscussionPreviously, whole genome expression profiling of normalbreast tissue (all cell types included) has been performedto a limited extent [27,28]. Yang et al recently per-formed a study of cancer-free breast tissue obtainedfrom mastectomies in breast cancer patients with highand low MD [29]. They identified a list of 73 genes dif-ferentially expressed between high and low MD samples.Specifically, this included the down-regulation of severaltransforming growth factor (TGF) b-related genes insamples with high MD. In the present study we analysedbreast biopsies from 79 healthy women and tumours of64 women with breast cancer. Twenty-four genes weredifferentially expressed according to MD in the healthysamples. In breast tumours, none of these 24 genes werefound differentially expressed according to MD.Tumour-specific deregulation of a large number ofmRNA transcripts may be expected to overshadow theMD signature. In addition, the sample size is limitedand the two sample sets (cases and controls) are notdirectly comparable with respect to MD [see Figure S5in Additional file 2].
In our study, three UGT genes (UGT2B11, UGT2B10and UGT2B7) were differentially expressed according toMD in the breasts of healthy women. All these threeenzymes had decreased expression in dense breasts. Pre-vious knowledge links the UGT enzymes to the metabo-lism of female hormones known to influence themammary glands (Figure 1). The over-representation ofUGT genes on the list of significant genes along with abiological link makes these genes particularly interesting.In a linear regression model with age as a confoundingfactor, BMI and one of two probes for UGT2B10 werethe only significant variables independently predictingMD, with ESR1 as a borderline significant covariate.The expression of these three UGT2B genes is highlycorrelated to each other and as expected only one proberemained in the regression model as an independentpredictor of MD. BMI is known to be the strongest andmost consistent epidemiological predictor of MD, and isexpected to remain in the model. It is noteworthy thatone of the UGT genes has an independent predictivevalue of a greater significance and magnitude than BMI.MD is determined by multiple factors. In a study of lim-ited sample size, we can only expect to identify thestrongest predictors.UGT2B7 is postulated to protect the breast tissue
from oestrogen metabolites locally [30], and this is con-sistent with our findings that breasts with higher MDhave reduced expression of this gene. The main metabo-lites of oestradiol and oestrone (hydroxyl- and methoxy-oestrogen compounds) bind to the oestrogen receptor,but with a reduced affinity compared with oestradiol.UGT2B10 and 11 are not yet reported to be associatedwith MD or breast cancer, but UGT2B10 is involved inthe metabolism of tobacco-related nitrosamines [31].Less is known about UGT2B11. The different UGT2Bgenes are located close to each other on chromosome 4and there is great homology between the genes [see Fig-ure S6 in Additional file 2]. UGT1A1, previously linkedto MD and breast cancer [32], is not represented on themicroarray used in this study.We have identified a set of genes differentially
expressed according to MD. Interestingly, the UGTgenes seem, to a greater extent than the other genes, tobe more similarly expressed between tumour samplesand normal samples from breasts with high MD as com-pared with normal samples from breasts with low MD[see Table S4 and Figure S7 in Additional file 2]. Theother differentially expressed genes generally express thesame levels in the tumours and in the biopsies from thehealthy women with low MD. We cannot exclude thatthe UGT genes confer risk for breast cancer develop-ment through increasing MD, but further studies wouldbe needed to investigate this.
Table 3 Genes differentially expressed according tomammographic density in cancer samples
Agilent ID Gene name FDR (%)
A_32_P171923 730402 0.00
A_32_P480177 TNN 0.00
A_23_P200298 AGL 0.00
A_24_P87036 TMEM16A 0.00
A_23_P312150 EDN2 14.87
A_23_P83388 EPPK1 14.87
A_32_P60065 F2RL2 19.82
A_32_P158272 MRNA 19.82
A_23_P105012 HRASLS2 19.82
FDR, false discovery rate.
Haakensen et al. Breast Cancer Research 2010, 12:R65http://breast-cancer-research.com/content/12/4/R65
Page 7 of 11

We found the UGT genes to be differentiallyexpressed in young women and women over 50 years ofage currently on hormone therapy. SAM analysis of MDin women younger than 50 years did not give any differ-entially expressed genes with an FDR of less than 25%.However, several UGT-probes are on the top of the listof genes down-regulated in samples from breasts withhigh MD. The lack of significance could be due to lowsample size (n = 30). As UGT enzymes conjugate oes-tradiol metabolites, its effect will be greater when thereis an increased level of oestradiol present, whether theoestradiol is endogenous or exogenous. The linearregression analysis showed that UGT2B10 was predict-ing MD independent of age in all women, youngerwomen and women older than 50 years currently usinghormones. This leads to the hypothesis that decreasedUGT expression in the breast of a woman withincreased levels of female hormones confers anincreased MD and possibly an increased risk of breastcancer.The biology in breasts with high and low MD may dif-
fer, partly due to differences in proportion of fatty tis-sue. Therefore, we looked for differentially expressedgenes in a subset of samples including only samplesfrom breasts with MD of more than 20%. The fact thatthe UGT2B gene family is so strongly representedamong the down-regulated genes (six probes represent-ing five different UGT2B genes are the only genes differ-entially expressed with an FDR < 10E-5) indicate thatreduced UGT expression is of greater significance inbreasts with higher MD and lower content of fattytissue.We find that ESR1 is down-regulated in biopsies from
healthy women with high MD compared with thosewith low MD. This is not consistent with previous find-ings [33] and contrary to what one would expectbecause ESR1 induces transcription and epithelialgrowth and high MD may contain increased amounts ofepithelial cells [34,35]. However, increased levels of oes-tradiol have been shown to decrease levels of ESR1 inbreast cancer [36], and in normal breast tissue in mon-keys [37] and in mice [38]. Increased levels of oestradiolmay increase MD. Elevated expression of ESR1 is com-mon postmenopausally [37] and represents non-prolifer-ating cells. The association between reduced levels ofESR1 and high MD may reflect high levels of oestradiol.We found that ESR1 was only a borderline significantpredictor of MD in models with stepwise exclusion ofcovariates. In a model including ESR1 with only age orage and UGT2B10, ESR1 was significantly predictingMD. The independent contribution of ESR1 in predict-ing MD was significant in older women, where the effectof UGT2B10 was not present. There could be a linkbetween UGT-expression and ESR1-expression in that
reduced metabolism of oestradiol-metabolites increasesthe levels of ESR1-ligands (oestradiol metabolites) andhence reduces ESR1-levels. The UGT-enzyme activitymay be the cause of the alterations leading to increasedMD by this mechanism. Reduced ESR1 is only border-line significant in predicting MD and could also be anintermediate factor.MD is the result of complex biological processes with-
out any single determining factor. BMI is the singlemost important factor found to date, and is also signifi-cant in this study. Age seems to have its effect mainlythrough hormonal influence, except for in postmeno-pausal women not taking hormones, where age has asignificant, independent effect on MD. MD is not signif-icantly different between the two main clusters fromunsupervised hierarchical clustering of the samples fromhealthy women. MD is hence not related to the mainvariation in the normal samples.The genes whose expression we have found to be
associated with MD do have a fairly high FDR in a SAManalysis and are not significant in all stratified analyses,suggesting that they may play a role in only subsets ofindividuals and other factors also have a significant con-tribution. Despite this, in linear regression modelsUGT2B10 is an independent predictor of MD alongwith BMI.There is a substantial heritable proportion of MD.
SNPs in UGT genes with influence on the UGT expres-sion have been described [8,39]. We identified twoUGT-SNPs associated with the expression of other UGTgenes. Due to their homology and co-localisation on thechromosome, they may share common control loci thataffect the expression of multiple UGT genes. It remainsto be investigated in larger and better powered epide-miological studies whether any of these SNPs are asso-ciated to MD per se.We do not know enough about the variability of
gene expression within normal breasts to know if thegenes relevant for MD are adequately represented byone biopsy taken from an area with some MD. It ispreviously shown that two biopsies from the samebreast tumour, before and after chemotherapy, clustertogether [40]. The tumours may, however, be morehomogenous than normal breast tissue. Variability ingene expression within each breast will make it diffi-cult to detect genes with only a minor influence onMD so that only the strongest factors are identified. Inan unpublished dataset we found no significant differ-ence between UGT-expression in tumours and normaladjacent tissue tested by paired t-test [see Table S5 inAdditional file 2]. This is merely an indication that theexpression in one breast might be similar for differentlocations in the breast and hence be used to look forassociations with MD.
Haakensen et al. Breast Cancer Research 2010, 12:R65http://breast-cancer-research.com/content/12/4/R65
Page 8 of 11

In this study, healthy individuals had higher MD thanthe breast cancer patients. The women recruited in thestudy had been referred to a breast diagnostic centre fora second look. As high MD confers an increased risk forbreast cancer and mammograms with high MD aremore difficult to interpret, they most likely had a higherMD. In addition, the inclusion criterion of some visibleMD for biopsy may have influenced the mean MD ofthe study population. The two populations are notdirectly comparable with respect to MD and relatedparameters. This lack of comparability on MD does notaffect the analyses of gene expression among the healthywomen only.We obtained good quality microarrays from only 79 of
120 healthy women and from 64 of 66 breast cancerpatients. This was due to low mRNA-yield or lowmRNA-quality. The biopsies from healthy women con-sistently yielded less mRNA than the tumour samples.There is significantly higher MD in the breasts ofhealthy women with successful microarrays than inthose with unsuccessful microarrays (37% vs 29%, P =0.03). As samples from breasts with low MD are under-represented in the microarray study, it is more difficultto identify genes that are differentially expressedbetween breast tissue with high and low MD. Despitethese limitations, we have identified differentiallyexpressed genes. These genes might have a greater sig-nificance than shown in this study.Normal breast tissue yields less RNA than tumour tis-
sue. The biopsies in this study were small and in agree-ment with the pathologist, all tissue from normalbreasts was prioritised for RNA-extraction rather thanhistological evaluation. Imprint was not in routine usein the hospitals where we started this study. In order tomake it possible for the staff to include women in thisstudy in a busy schedule we had to use proceduresalready established. We do therefore not have any infor-mation about the cell types of the normal biopsies.Knowledge about the cell types present in the biopsieswould have facilitated the analysis.The two UGT2B10-probes behave differently in our
dataset. Both probes map to the 3′end of the UGT2B10-gene by BLAT (98.4% homology for A_23_P7342 and100% homology for A_24_P521559). The discrepancy inUGT2B10-expression detected by the two probes maybe due to the fact that they both also share substantialsequence homology with other, but different UGT2B-genes.
ConclusionsWe have identified a set of genes that are differentiallyexpressed according to MD in breast samples fromhealthy women. Some of these genes are known toinfluence MD and breast cancer, such as ESR1 and
UGT2B7. Two less described UGT genes, UGT2B10 andUGT2B11, are also differentially expressed. The expres-sion of the three UGT genes is reduced in samples withhigh MD and also in tumour samples, but does not varybetween different tumour subtypes or risk groups. TheUGT enzymes are known to conjugate active oestrogen-metabolites. We show that UGT2B10 expression andBMI are independent predictors of MD. The influenceof reduced UGT expression was strongest in womenunder exposure of female hormones. Two candidateSNPs are associated with the UGT gene expression incis. We hypothesise that reduced expression of UGTgenes in women exposed to female sex hormones,increase MD and that this may be associated with anincreased risk of breast cancer. Further studies of thesegenes are needed to test the hypothesis that the geneproducts from these genes protect the breast from theoestrogen-induced MD and thereby reducing the risk ofbreast cancer.
Additional material
Additional file 1: Healthy SAM MD. Significance analysis of microarrays(SAM) for genes differentially expressed according to mammographicdensity (MD).
Additional file 2: Figures and tables. A collection of figures and tablesdescribing the data set and the uridine 5’-diphospho-glucuronosyltransferase (UGT) genes. The main text refers to individualfigures and tables in this file.
Additional file 3: Healthy SAM MD stratified. Significance analysis ofmicroarrays (SAM) for genes differentially expressed according tomammographic density (MD) stratified on age and use of hormonetherapy.
Additional file 4: eQTL. Expression quantitative trait loci (eQTL) analysisof single nucleotide polymorphism (SNPs) affecting the expression ofuridine 5’-diphospho-glucuronosyltransferase (UGT) genes in cis.
AbbreviationsANOVA: analysis of variance; BMI: body mass index; eQTL: expressionquantitative trait loci; ESR1: oestrogen receptor; FDR: false discovery rate;GWAS: genome wide association studies; HER: human epidermal growthreceptor; MD: mammographic density; SAM: significance analysis ofmicroarrays; SNP: single nucleotide polymorphism; UGT: uridine 5′-diphospho-glucuronosyltransferase.
AcknowledgementsThis study was funded primarily by The Research Council of Norway andSouth-Eastern Norway Regional Health Authority. We thank all the womenwho participated in the study and all the personnel in the hospitals whomade the inclusion of these women possible, in particular the responsibleradiologists: Einar Vigeland, Rolf O Næss and Else Berit Velken. We wouldalso like to thank Lars Ottestad for help in the initiation of the project, HildeJohnsen, Caroline Jevanord Frøyland and Marit Hilsen for lab assistance andto Eunjung Lee for statistical help. No medical writers were involved in thispaper.
Author details1Department of Genetics, Institute for Cancer Research, Oslo UniversityHospital Radiumhospitalet, Oslo, Montebello, NO-0310, Norway. 2Institute forClinical Medicine, Faculty of Medicine, University of Oslo, Oslo, NO-0315,
Haakensen et al. Breast Cancer Research 2010, 12:R65http://breast-cancer-research.com/content/12/4/R65
Page 9 of 11

Norway. 3Biomedical Research Group, Department of Informatics, Universityof Oslo, Oslo, NO-0315, Norway. 4Centre for Cancer Biomedicine, Universityof Oslo, Oslo, NO-0315, Norway. 5Department of Radiology, Oslo UniversityHospital Radiumhospitalet, Oslo, NO-0310, Norway. 6Department ofRadiology, University Hospital of North Norway, Tromsø, NO- 9038, Norway.7Department. of Pathology, Vestfold Hospital, Halfdan Wilhelmsens Alle’ 17,Tønsberg, NO-3103, Norway. 8Department of Radiology, Innlandet Hospital,Brummundal, NO-2381, Norway. 9Department of Radiology, BuskerudHospital, Drammen, NO-3004, Norway. 10Department for Clinical MolecularBiology (EpiGen), Institute for Clinical Medicine, Akershus University Hospital,University of Oslo, Oslo, NO-0315, Norway. 11Department of Surgery, AkerhusUniversity Hospital, Lørenskog, 1478, Norway. 12Department of Nutrition,School of Medicine, University of Oslo, Oslo, NO-0315, Norway. 13Departmentof Preventive Medicine, University of Southern California Keck School ofMedicine, Los Angeles, CA 90033, USA. 14Department of Oncology, OsloUniversity Hospital Radiumhospitalet, Oslo, NO-0310, Norway.
Authors’ contributionsThe trial was designed by ALBD, ÅH, GU, MMH and VNK. ALBD and ÅHensured funding. MMH, JOF, DN, LR, IKB and VDH assisted in data collection.MB and VNK are responsible for SNP analyses. VDH and TL contributed tothe laboratory work. GU estimated the amount of mammographic density.OCL, VDH, HKS and MB performed statistical analyses of the data. ÅH, ALBDand VDH interpreted the results and wrote the paper. All authors wereinvolved in reviewing the report.
Competing interestsThe authors declare that they have no competing interests.
Received: 5 August 2010 Revised: 5 August 2010Accepted: 27 August 2010 Published: 27 August 2010
References1. Oza AM, Boyd NF: Mammographic parenchymal patterns: a marker of
breast cancer risk. Epidemiol Rev 1993, 15:196-208.2. Boyd NF, Byng JW, Jong RA, Fishell EK, Little LE, Miller AB, Lockwood GA,
Tritchler DL, Yaffe MJ: Quantitative classification of mammographicdensities and breast cancer risk: results from the Canadian NationalBreast Screening Study. J Natl Cancer Inst 1995, 87:670-675.
3. Ursin G, Ma H, Wu AH, Bernstein L, Salane M, Parisky YR, Astrahan M,Siozon CC, Pike MC: Mammographic density and breast cancer in threeethnic groups. Cancer Epidemiol Biomarkers Prev 2003, 12:332-338.
4. Boyd NF, Lockwood GA, Martin LJ, Knight JA, Byng JW, Yaffe MJ,Tritchler DL: Mammographic densities and breast cancer risk. Breast Dis1998, 10:113-126.
5. Guo YP, Martin LJ, Hanna W, Banerjee D, Miller N, Fishell E, Khokha R,Boyd NF: Growth factors and stromal matrix proteins associated withmammographic densities. Cancer Epidemiol Biomarkers Prev 2001,10:243-248.
6. Ursin G, Lillie EO, Lee E, Cockburn M, Schork NJ, Cozen W, Parisky YR,Hamilton AS, Astrahan MA, Mack T: The relative importance of geneticsand environment on mammographic density. Cancer Epidemiol BiomarkersPrev 2009, 18:102-112.
7. Guillemette C, Levesque E, Harvey M, Bellemare J, Menard V: UGT genomicdiversity: beyond gene duplication. Drug Metab Rev 2010, 42(1):22-42.
8. Mackenzie PI, Gregory PA, Lewinsky RH, Yasmin SN, Height T, McKinnon RA,Gardner-Stephen DA: Polymorphic variations in the expression of thechemical detoxifying UDP glucuronosyltransferases. Toxicol ApplPharmacol 2005, 207:77-83.
9. Cheng Z, Rios GR, King CD, Coffman BL, Green MD, Mojarrabi B,Mackenzie PI, Tephly TR: Glucuronidation of catechol estrogens byexpressed human UDP-glucuronosyltransferases (UGTs) 1A1, 1A3, and2B7. Toxicol Sci 1998, 45:52-57.
10. Yong M, Schwartz SM, Atkinson C, Makar KW, Thomas SS, Newton KM, ielloBowles EJ, Holt VL, Leisenring WM, Lampe JW: Associations betweenpolymorphisms in glucuronidation and sulfation enzymes andmammographic breast density in premenopausal women in the UnitedStates. Cancer Epidemiol Biomarkers Prev 2010, 19:537-546.
11. Starlard-Davenport A, Lyn-Cook B, Radominska-Pandya A: Identification ofUDP-glucuronosyltransferase 1A10 in non-malignant and malignanthuman breast tissues. Steroids 2008, 73:611-620.
12. Wang H, Karesen R, Hervik A, Thoresen SO: Mammography screening inNorway: results from the first screening round in four counties and cost-effectiveness of a modeled nationwide screening. Cancer Causes Control2001, 12:39-45.
13. Stanford Microarray Database. [http://genome-www5.stanford.edu//].14. R library impute.knn. [http://rss.acs.unt.edu/Rdoc/library/impute/html/
impute.knn.html].15. Gunderson KL, Steemers FJ, Lee G, Mendoza LG, Chee MS: A genome-wide
scalable SNP genotyping assay using microarray technology. Nat Genet2005, 37:549-554.
16. Nordgard SH, Johansen FE, Alnaes GI, Bucher E, Syvanen AC, Naume B,Borresen-Dale AL, Kristensen VN: Genome-wide analysis identifies 16qdeletion associated with survival, molecular subtypes, mRNA expression,and germline haplotypes in breast cancer patients. Genes ChromosomesCancer 2008, 47:680-696.
17. Sequenom. [http://www.sequenom.com/].18. Ursin G, Astrahan MA, Salane M, Parisky YR, Pearce JG, Daniels JR, Pike MC,
Spicer DV: The detection of changes in mammographic densities. CancerEpidemiol Biomarkers Prev 1998, 7:43-47.
19. Tusher VG, Tibshirani R, Chu G: Significance analysis of microarraysapplied to the ionizing radiation response. Proc Natl Acad Sci USA 2001,98:5116-5121.
20. Significance Analysis of Microarrays. [http://www-stat.stanford.edu/~tibs/SAM/].
21. R project. [http://r-project.org].22. Altman DG: Practical Statistics for Medical Research Boca Raton: Chapman &
Hall/CRC 1999.23. Parker JS, Mullins M, Cheang MC, Leung S, Voduc D, Vickery T, Davies S,
Fauron C, He X, Hu Z, Quackenbush JF, Stijleman IJ, Palazzo J, Marron JS,Nobel AB, Mardis E, Nielsen TO, Ellis MJ, Perou CM, Bernard PS: Supervisedrisk predictor of breast cancer based on intrinsic subtypes. J Clin Oncol2009, 27:1160-1167.
24. Carlborg O, de Koning DJ, Manly KF, Chesler E, Williams RW, Haley CS:Methodological aspects of the genetic dissection of gene expression.Bioinformatics 2005, 21:2383-2393.
25. UNC Biostatistics Software Links. [http://www.bios.unc.edu/~wsun/software.htm].
26. DAVID Bioinformatics Resources 6.7. [http://david.abcc.ncifcrf.gov/].27. Sorlie T, Perou CM, Tibshirani R, Aas T, Geisler S, Johnsen H, Hastie T,
Eisen MB, van de RM, Jeffrey SS, Thorsen T, Quist H, Matese JC, Brown PO,Botstein D, Eystein Lønning P, Børresen-Dale AL: Gene expression patternsof breast carcinomas distinguish tumor subclasses with clinicalimplications. Proc Natl Acad Sci USA 2001, 98:10869-10874.
28. Nicolau M, Tibshirani R, Borresen-Dale AL, Jeffrey SS: Disease-specificgenomic analysis: identifying the signature of pathologic biology.Bioinformatics 2007, 23:957-965.
29. Yang WT, Lewis MT, Hess K, Wong H, Tsimelzon A, Karadag N, Cairo M,Wei C, Meric-Bernstam F, Brown P, Arun B, Hortobagyi GN, Sahin A,Chang JC: Decreased TGFbeta signaling and increased COX2 expressionin high risk women with increased mammographic breast density. BreastCancer Res Treat 2010, 119(2):305-314.
30. Guillemette C, Belanger A, Lepine J: Metabolic inactivation of estrogens inbreast tissue by UDP-glucuronosyltransferase enzymes: an overview.Breast Cancer Res 2004, 6:246-254.
31. Kaivosaari S, Toivonen P, Hesse LM, Koskinen M, Court MH, Finel M:Nicotine glucuronidation and the human UDP-glucuronosyltransferaseUGT2B10. Mol Pharmacol 2007, 72:761-768.
32. Dalhoff K, Buus JK, Enghusen PH: Cancer and molecular biomarkers ofphase 2. Methods Enzymol 2005, 400:618-627.
33. Verheus M, Maskarinec G, Erber E, Steude JS, Killeen J, Hernandez BY,Cline JM: Mammographic density and epithelial histopathologic markers.BMC Cancer 2009, 9:182.
34. Li T, Sun L, Miller N, Nicklee T, Woo J, Hulse-Smith L, Tsao MS, Khokha R,Martin L, Boyd N: The association of measured breast tissuecharacteristics with mammographic density and other risk factors forbreast cancer. Cancer Epidemiol Biomarkers Prev 2005, 14:343-349.
35. Rayter Z: Steroid receptors in breast cancer. Br J Surg 1991, 78:528-535.36. Dunbier AK, Anderson H, Ghazoui Z, Folkerd EJ, A’hern R, Crowder RJ,
Hoog J, Smith IE, Osin P, Nerurkar A, Parker JS, Perou CM, Ellis MJ,Dowsett M: Relationship between plasma estradiol levels and estrogen-
Haakensen et al. Breast Cancer Research 2010, 12:R65http://breast-cancer-research.com/content/12/4/R65
Page 10 of 11

responsive gene expression in estrogen receptor-positive breast cancerin postmenopausal women. J Clin Oncol 2010, 28:1161-1167.
37. Cheng G, Li Y, Omoto Y, Wang Y, Berg T, Nord M, Vihko P, Warner M,Piao YS, Gustafsson JA: Differential regulation of estrogen receptor (ER)alpha and ERbeta in primate mammary gland. J Clin Endocrinol Metab2005, 90:435-444.
38. Saji S, Jensen EV, Nilsson S, Rylander T, Warner M, Gustafsson JA: Estrogenreceptors alpha and beta in the rodent mammary gland. Proc Natl AcadSci USA 2000, 97:337-342.
39. Chen G, Dellinger RW, Gallagher CJ, Sun D, Lazarus P: Identification of aprevalent functional missense polymorphism in the UGT2B10 gene andits association with UGT2B10 inactivation against tobacco-specificnitrosamines. Pharmacogenet Genomics 2008, 18:181-191.
40. Perou CM, Sorlie T, Eisen MB, van de RM, Jeffrey SS, Rees CA, Pollack JR,Ross DT, Johnsen H, Akslen LA, Fluge O, Pergamenschikov A, Williams C,Zhu SX, Lønning PE, Børresen-Dale AL, Brown PO, Botstein D: Molecularportraits of human breast tumours. Nature 2000, 406:747-752.
41. Chen DT, Nasir A, Culhane A, Venkataramu C, Fulp W, Rubio R, Wang T,Agrawal D, McCarthy SM, Gruidl M, Bloom G, Anderson T, White J,Quackenbush J, Yeatman T: Proliferative genes dominate malignancy-riskgene signature in histologically-normal breast tissue. Breast Cancer ResTreat 2010, 119(2):335-346.
42. Showe MK, Vachani A, Kossenkov AV, Yousef M, Nichols C, Nikonova EV,Chang C, Kucharczuk J, Tran B, Wakeam E, Yie TA, Speicher D, Rom WN,Albelda S, Showe LC: Gene expression profiles in peripheral bloodmononuclear cells can distinguish patients with non-small cell lungcancer from patients with nonmalignant lung disease. Cancer Res 2009,69(24):9202-9210.
43. Jones C, Mackay A, Grigoriadis A, Cossu A, Reis-Filho JS, Fulford L, Dexter T,Davies S, Bulmer K, Ford E, Parry S, Budroni M, Palmieri G, Neville AM,O’Hare MJ, Lakhani SR: Expression profiling of purified normal humanluminal and myoepithelial breast cells: identification of novel prognosticmarkers for breast cancer. Cancer Res 2004, 64:3037-3045.
doi:10.1186/bcr2632Cite this article as: Haakensen et al.: Expression levels of uridine 5′-diphospho-glucuronosyltransferase genes in breast tissue from healthywomen are associated with mammographic density. Breast CancerResearch 2010 12:R65.
Submit your next manuscript to BioMed Centraland take full advantage of:
• Convenient online submission
• Thorough peer review
• No space constraints or color figure charges
• Immediate publication on acceptance
• Inclusion in PubMed, CAS, Scopus and Google Scholar
• Research which is freely available for redistribution
Submit your manuscript at www.biomedcentral.com/submit
Haakensen et al. Breast Cancer Research 2010, 12:R65http://breast-cancer-research.com/content/12/4/R65
Page 11 of 11

Additional file 1 - SAM MD, healthy women
QuantitativeUSANN
0.11282140
standardstandard
USANN500
Automatic10
1234567
0.99314020.0010565
050.528184
Row Gene ID Gene NameScore(d) Numerator Denominator(s+q-value(%)4650 A_24_P756 LOC730057 2.8605802 0.015238 0.005326743 34.050528807 A_24_P329 BTN3A1 2.8288494 0.011028 0.003898406 34.050529112 A_24_P311 BTN3A3 2.7601417 0.009886 0.00358167 34.05052
Row Gene ID Gene NameScore(d) Numerator Denominator(s+q-value(%) FDR<256760 A_24_P932 729641 -2.939794 -0.024561 0.008354769 06129 A_23_P427 FLJ10404 -2.898094 -0.017947 0.006192794 09647 A_24_P188 VPS18 -2.874372 -0.020757 0.007221398 04530 A_23_P734 UGT2B11 -2.870324 -0.020651 0.007194816 06993 A_24_P177 CABP7 -2.868285 -0.025244 0.008800965 09508 A_24_P131 CD86 -2.834444 -0.025353 0.00894473 02950 A_23_P212 UGT2B11 -2.791517 -0.029178 0.010452204 03485 A_23_P152 580687 -2.7432 -0.020484 0.007467054 07883 A_23_P254 DIAPH2::RP -2.68794 -0.020478 0.0076185 8.2761688366 A_32_P199 LMOD1 -2.675115 -0.023358 0.008731604 8.2761687637 A_24_P521 UGT2B10 -2.656355 -0.023386 0.008803889 8.2761682978 A_23_P665 PIK3R5 -2.655412 -0.017592 0.006625019 8.2761686371 A_32_P107 ATG7 -2.590986 -0.021892 0.008449193 8.2761685506 A_23_P155 LRRC2 -2.573214 -0.019142 0.007439063 15.6811614399 A_23_P287 RBL1 -2.537519 -0.009507 0.003746516 15.6811611537 A_23_P696 NPY1R -2.536482 -0.025025 0.009866086 15.6811618728 A_23_P144 810781 -2.511297 -0.018144 0.007224783 15.6811614605 A_32_P800 593535 -2.510476 -0.019579 0.007798728 15.6811614562 A_23_P204 H2AFJ -2.505133 -0.011728 0.00468148 15.6811615316 A_32_P356 666399 -2.481846 -0.016741 0.006745418 15.6811616564 A_24_P640 Transcribed -2.434159 -0.016788 0.006896857 18.9169566272 A_32_P209 Transcribed -2.418337 -0.011417 0.004721011 21.5900042288 A_23_P136 UGT2B7 -2.403406 -0.029123 0.012117417 21.5900043534 A_23_P309 ESR1 -2.388786 -0.017364 0.007268849 21.5900042471 A_23_P119 SAPS1 -2.365048 -0.016886 0.007139654 23.8353649547 A_24_P125 PPM1F -2.329502 -0.013608 0.00584143 26.738389
Number of neighbors for KNN
Current settingsInput parameters
Data type?Arrays centered?DeltaMinimum fold changeTest statisticRegression methodAre data are log scale?Number of permutationsInput percentile for exchangeability factor s0
List of Significant Genes for Delta = 0.113Positive genes (3)
Negative genes (54)
Seed for Random number generator
Computed valuesEstimate of pi0 (proportion of null genes)Exchangibility factor s0s0 percentileFalse Discovery Rate (%)

8792 A_24_P180 UGT2B28 -2.294363 -0.023268 0.010141551 28.3754337921 A_24_P693 ZNF552 -2.29271 -0.014196 0.006191895 28.3754339066 A_24_P368 RAP1GAP -2.277258 -0.014689 0.006450451 30.8215919523 A_24_P287 PLCB2 -2.264593 -0.013956 0.006162608 33.1046727706 A_24_P178 LOC132205 -2.251632 -0.010829 0.004809546 33.1046723043 A_23_P256 EEF1A2 -2.245056 -0.009618 0.004283879 33.1046724986 A_24_P176 UGT2B17 -2.191409 -0.017356 0.007920074 40.2624392186 A_23_P902 CHST8 -2.184548 -0.011603 0.00531145 40.2624393978 A_23_P436 OSTbeta -2.173318 -0.015595 0.007175527 40.2624396354 A_24_P844 710943 -2.154978 -0.010026 0.004652441 40.7442128645 A_24_P734 CDNA -2.139041 -0.011402 0.005330588 40.7442128396 A_24_P913 797019 -2.126743 -0.013371 0.006287243 40.7442124352 A_32_P163 NFE2L1 -2.122614 -0.00828 0.003900752 40.744212
27 A_32_P149 537146 -2.121891 -0.011736 0.005530906 40.7442128825 A_24_P872 HIST2H2AC -2.116853 -0.007738 0.003655275 40.7442129195 A_24_P315 825337 -2.103838 -0.011041 0.005248156 44.1395632652 A_32_P595 GFRA1 -2.089581 -0.010792 0.005164611 44.1395639608 A_24_P585 837185 -2.089248 -0.008928 0.004273281 44.1395639565 A_24_P575 835938 -2.085134 -0.013291 0.006374112 44.1395634339 A_23_P556 SLC14A1 -2.080633 -0.010976 0.005275552 44.1395633525 A_23_P140 KRT8 -2.073511 -0.0086 0.00414763 44.1395635841 A_24_P171 DKFZP547L -2.072369 -0.014788 0.007135751 44.1395636833 A_23_P102 A_23_P102 -2.066516 -0.012184 0.005895961 44.1395631659 A_23_P428 HIST1H2AD -2.062726 -0.009283 0.004500294 44.1395632325 A_23_P407 OSTalpha -2.060191 -0.009576 0.004648155 44.1395636618 A_23_P735 CITED1 -2.048192 -0.014632 0.007143821 47.8512997156 A_24_P464 RBM22 -2.039381 -0.015274 0.007489543 48.7702767002 A_23_P384 SLC45A4 -2.021144 -0.012841 0.006353311 50.528184
Quantiles Cutpoints Miss Rate(%)0 -> 0.05 -2.012 -> -1.228 00.05 -> 0.1 -1.228 -> -0.969 3,490.1 -> 0.15 -0.969 -> -0.783 00.15 -> 0.2 -0.783 -> -0.633 00.2 -> 0.25 -0.633 -> -0.5 00.25 -> 0.75 -0.5 -> 0.533 0,440.75 -> 0.8 0.533 -> 0.654 8,290.8 -> 0.85 0.654 -> 0.807 0,710.85 -> 0.9 0.807 -> 1.002 0,760.9 -> 0.95 1.002 -> 1.254 11,810.95 -> 1 1.254 -> 2.505 0
Estimated Miss rates for Delta=0.112821421147983
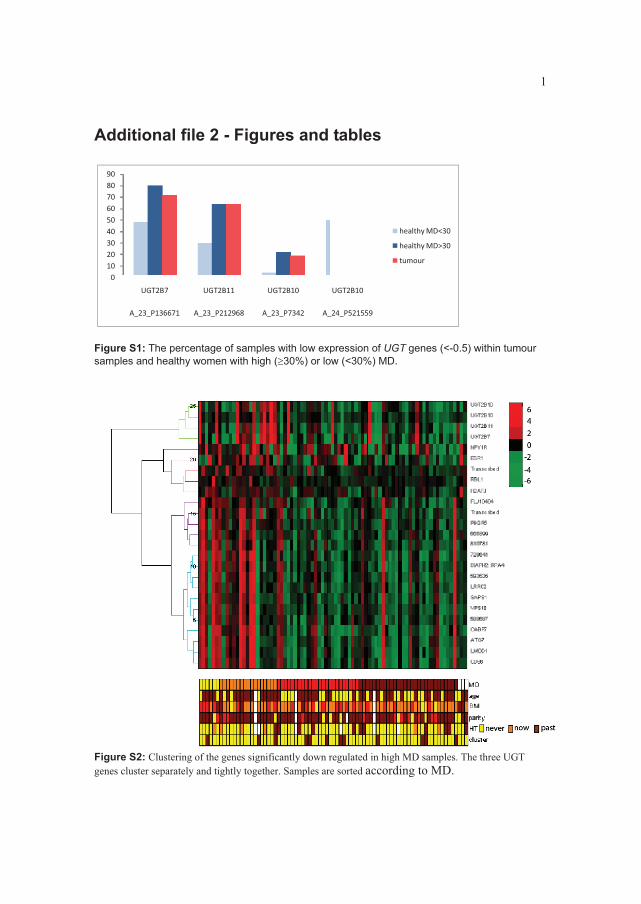
1
Additional file 2 - Figures and tables
0102030405060708090
UGT2B7 UGT2B11 UGT2B10 UGT2B10
A_23_P136671 A_23_P212968 A_23_P7342 A_24_P521559
healthy�MD<30
healthy�MD>30
tumour
Figure S1: The percentage of samples with low expression of UGT genes (<-0.5) within tumour samples and healthy women with high (�30%) or low (<30%) MD.
Figure S2: Clustering of the genes significantly down regulated in high MD samples. The three UGT genes cluster separately and tightly together. Samples are sorted according to MD.
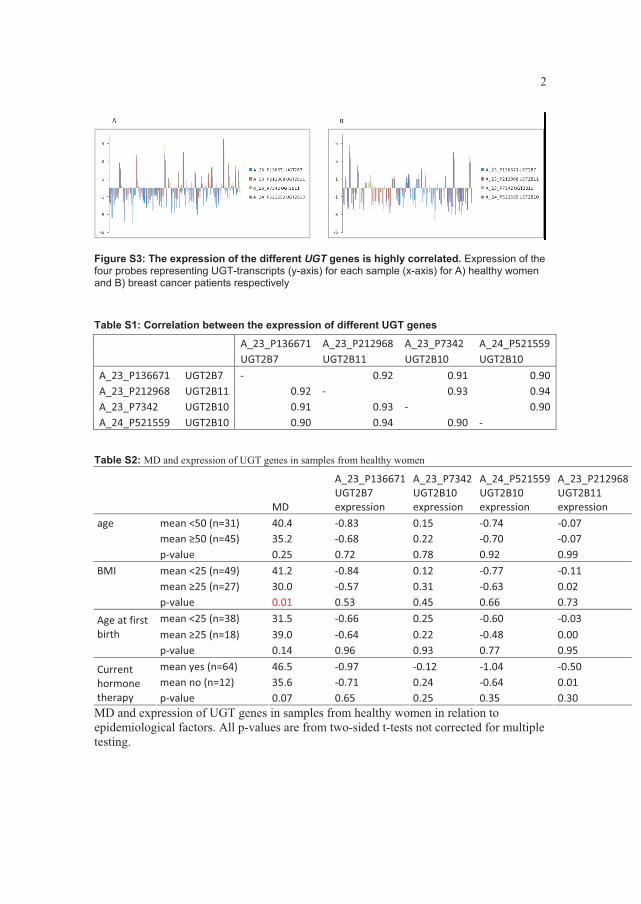
2
Figure S3: The expression of the different UGT genes is highly correlated. Expression of the four probes representing UGT-transcripts (y-axis) for each sample (x-axis) for A) healthy women and B) breast cancer patients respectively
Table S1: Correlation between the expression of different UGT genes
�� �� A_23_P136671 A_23_P212968� A_23_P7342� A_24_P521559��� �� UGT2B7� UGT2B11� UGT2B10� UGT2B10�A_23_P136671� UGT2B7� �� 0.92� 0.91� 0.90A_23_P212968� UGT2B11� 0.92 �� 0.93� 0.94A_23_P7342� UGT2B10� 0.91 0.93� �� 0.90A_24_P521559� UGT2B10� 0.90 0.94� 0.90� ��
Table S2: MD and expression of UGT genes in samples from healthy women
�� �� MD��
A_23_P136671�UGT2B7�expression�
A_23_P7342�UGT2B10�expression�
A_24_P521559��UGT2B10�expression�
A_23_P212968�UGT2B11�expression��
age� mean�<50�(n=31)� 40.4� �0.83� 0.15� �0.74� �0.07�� mean��50�(n=45)� 35.2� �0.68� 0.22� �0.70� �0.07�� p�value� 0.25� 0.72� 0.78� 0.92� 0.99�BMI� mean�<25�(n=49)� 41.2� �0.84� 0.12� �0.77� �0.11�� mean��25�(n=27)� 30.0� �0.57� 0.31� �0.63� 0.02�� p�value� 0.01� 0.53� 0.45� 0.66� 0.73�
mean�<25�(n=38)� 31.5� �0.66� 0.25� �0.60� �0.03�Age�at�first�birth� mean��25�(n=18)� 39.0� �0.64� 0.22� �0.48� 0.00�� p�value� 0.14� 0.96� 0.93� 0.77� 0.95�
mean�yes�(n=64)� 46.5� �0.97� �0.12� �1.04� �0.50�mean�no�(n=12)� 35.6� �0.71� 0.24� �0.64� 0.01�
Current�hormone�therapy� p�value� 0.07� 0.65� 0.25� 0.35� 0.30�MD and expression of UGT genes in samples from healthy women in relation to epidemiological factors. All p-values are from two-sided t-tests not corrected for multiple testing.

3
Figure S3: Unsupervised hierarchical clustering showed two main clusters. MD was not significantly different between these two clusters.
Figure S4: MD in relation to tumour subgroups a) Boxplot of MD vs subtypes b) Boxplot of MD for each pam50 risk
group (1=high, 3=medium, 5=low risk).

4
Figure S5: Distribution of MD in a) all samples (mean=), b) healthy women (mean=37%) and c) breast cancer patients (mean=16%)
a) MD frequency all women
b) MD frequency healthy women
Freq
uenc
y
0 20 40 60 80 100
02
46
810
0 20 40 60 80 100
02
46
810
1214
Freq
uenc
y
0 20 40 60 80 1000
24
68
c) MD frequency BC patients
Figure S6: Localisation of UGT genes on chromosome 4Fr
eque
ncy

5
Table S4: Gene expression in samples from healthy women with differing MD compared with tumour samples. A) MD < 30% vs MD>30%: The mean expression of all four probes representing UGT genes is not significantly different between tumour samples and normal samples from breasts with high MD. For three UGT probes, mean expression is significantly different between tumour samples and normal samples from breasts with low MD. This is not the case for most other genes.
Agilent�ID� SYMBOL�mean�t�
mean�n�MD�<30%�
mean�n�MD>30%
ttest�t�vs�MD<30%�
ttest�t�vs�n�MD>30%�
A_23_P119448� SAPS1� 0.87 0.98 0.13 0.693� 0.000�A_23_P136671� UGT2B7� �1.00 0.21 �1.24 0.005� 0.402�A_23_P144244� 810781� 1.16 1.12 0.28 0.889� 0.000�A_23_P152570� 580687� 1.53 1.78 0.87 0.430� 0.003�A_23_P155463� LRRC2� 1.39 1.60 0.65 0.478� 0.001�A_23_P204277� H2AFJ� 1.62 1.20 0.79 0.047� 0.000�A_23_P212968� UGT2B11� �0.43 0.77 �0.50 0.003� 0.768�A_23_P254212� DIAPH2::RPA4� 1.50 1.62 0.68 0.705� 0.000�A_23_P28733� RBL1� �0.90 �0.77 �1.12 0.306� 0.010�A_23_P309739� ESR1� 2.32 1.96 1.32 0.282� 0.000�A_23_P427472� FLJ10404� 1.21 1.44 0.51 0.466� 0.002�A_23_P66543� PIK3R5� 0.89 0.95 0.07 0.833� 0.000�A_23_P69699� NPY1R� 1.42 2.01 1.35 0.267� 0.902�A_23_P7342� UGT2B10� 0.16 0.79 �0.13 0.010� 0.054�A_24_P131589� CD86� 1.57 1.93 0.79 0.305� 0.002�A_24_P177236� CABP7� 1.63 1.95 0.68 0.378� 0.000�A_24_P18802� VPS18� 1.44 1.64 0.69 0.510� 0.000�A_24_P521559� UGT2B10� �0.70 0.07 �1.08 0.072� 0.148�A_24_P640617� Transcribed� 0.97 1.04 0.18 0.801� 0.000�A_24_P932736� 729641� 1.55 1.68 0.59 0.714� 0.000�A_32_P107994� ATG7� 1.51 1.78 0.74 0.413� 0.001�A_32_P199824� LMOD1� 1.55 1.91 0.77 0.320� 0.002�A_32_P20997� Transcribed� 0.25 0.56 0.10 0.008� 0.092�A_32_P35668� 666399� 1.31 1.51 0.62 0.499� 0.001�A_32_P80016� 593535� 1.59 1.72 0.75 0.676� 0.000�
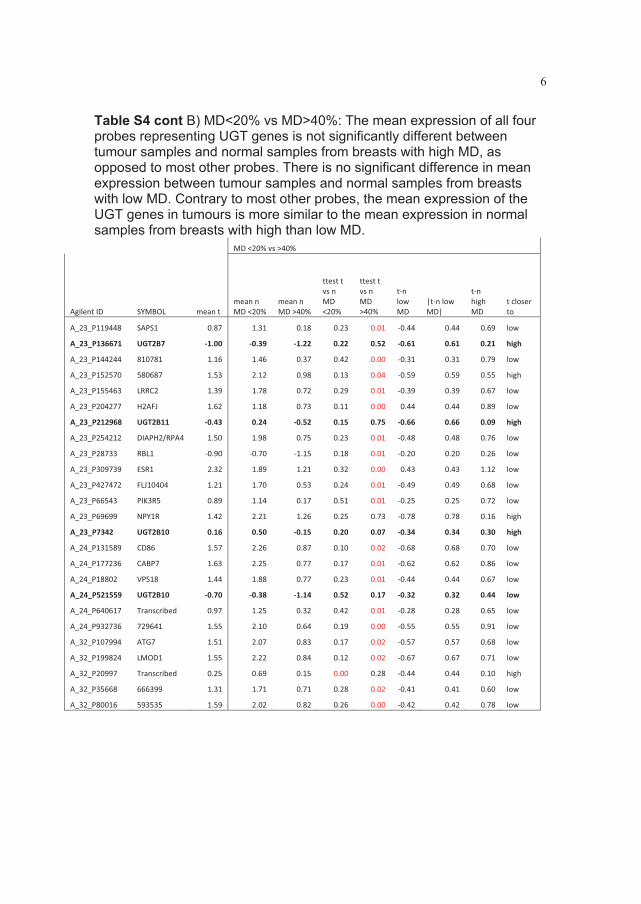
6
Table S4 cont B) MD<20% vs MD>40%: The mean expression of all four probes representing UGT genes is not significantly different between tumour samples and normal samples from breasts with high MD, as opposed to most other probes. There is no significant difference in mean expression between tumour samples and normal samples from breasts with low MD. Contrary to most other probes, the mean expression of the UGT genes in tumours is more similar to the mean expression in normal samples from breasts with high than low MD.
� � � MD�<20%�vs�>40%� � � � � ��
Agilent�ID� SYMBOL� mean�t�mean�n�MD�<20%�
mean�n�MD�>40%�
ttest�t�vs�n�MD�<20%�
ttest�t�vs�n�MD�>40%�
t�n�low�MD�
|t�n�low�MD|�
t�n�high�MD�
t�closer�to�
A_23_P119448� SAPS1� 0.87� 1.31� 0.18� 0.23� 0.01� �0.44� 0.44� 0.69� low�
A_23_P136671� UGT2B7� �1.00� �0.39� �1.22� 0.22� 0.52� �0.61� 0.61� 0.21� high�
A_23_P144244� 810781� 1.16� 1.46� 0.37� 0.42� 0.00� �0.31� 0.31� 0.79� low�
A_23_P152570� 580687� 1.53� 2.12� 0.98� 0.13� 0.04� �0.59� 0.59� 0.55� high�
A_23_P155463� LRRC2� 1.39� 1.78� 0.72� 0.29� 0.01� �0.39� 0.39� 0.67� low�
A_23_P204277� H2AFJ� 1.62� 1.18� 0.73� 0.11� 0.00� 0.44� 0.44� 0.89� low�
A_23_P212968� UGT2B11� �0.43� 0.24� �0.52� 0.15� 0.75� �0.66� 0.66� 0.09� high�
A_23_P254212� DIAPH2/RPA4� 1.50� 1.98� 0.75� 0.23� 0.01� �0.48� 0.48� 0.76� low�
A_23_P28733� RBL1� �0.90� �0.70� �1.15� 0.18� 0.01� �0.20� 0.20� 0.26� low�
A_23_P309739� ESR1� 2.32� 1.89� 1.21� 0.32� 0.00� 0.43� 0.43� 1.12� low�
A_23_P427472� FLJ10404� 1.21� 1.70� 0.53� 0.24� 0.01� �0.49� 0.49� 0.68� low�
A_23_P66543� PIK3R5� 0.89� 1.14� 0.17� 0.51� 0.01� �0.25� 0.25� 0.72� low�
A_23_P69699� NPY1R� 1.42� 2.21� 1.26� 0.25� 0.73� �0.78� 0.78� 0.16� high�
A_23_P7342� UGT2B10� 0.16� 0.50� �0.15� 0.20� 0.07� �0.34� 0.34� 0.30� high�
A_24_P131589� CD86� 1.57� 2.26� 0.87� 0.10� 0.02� �0.68� 0.68� 0.70� low�
A_24_P177236� CABP7� 1.63� 2.25� 0.77� 0.17� 0.01� �0.62� 0.62� 0.86� low�
A_24_P18802� VPS18� 1.44� 1.88� 0.77� 0.23� 0.01� �0.44� 0.44� 0.67� low�
A_24_P521559� UGT2B10� �0.70� �0.38� �1.14� 0.52� 0.17� �0.32� 0.32� 0.44� low�
A_24_P640617� Transcribed� 0.97� 1.25� 0.32� 0.42� 0.01� �0.28� 0.28� 0.65� low�
A_24_P932736� 729641� 1.55� 2.10� 0.64� 0.19� 0.00� �0.55� 0.55� 0.91� low�
A_32_P107994� ATG7� 1.51� 2.07� 0.83� 0.17� 0.02� �0.57� 0.57� 0.68� low�
A_32_P199824� LMOD1� 1.55� 2.22� 0.84� 0.12� 0.02� �0.67� 0.67� 0.71� low�
A_32_P20997� Transcribed� 0.25� 0.69� 0.15� 0.00� 0.28� �0.44� 0.44� 0.10� high�
A_32_P35668� 666399� 1.31� 1.71� 0.71� 0.28� 0.02� �0.41� 0.41� 0.60� low�
A_32_P80016� 593535� 1.59� 2.02� 0.82� 0.26� 0.00� �0.42� 0.42� 0.78� low�

7
Figure S7: The Kullback-Leibler divergence between UGT expression in tumours and healthy samples with high and low MD respectively. Small divergence means more similar distribution in the two populations tested. For three of four UGT probes, the distribution in tumour samples is more similar to the distribution in healthy individuals with high-MD than with low-MD. (The first UGT2B10-probe is A_23_P7342, the probe that is significant in the GLM-analysis, the second is A_24_P521559).

8
Table S5: Gene expression of UGT2B10 in tumour samples (T) and normal adjacent samples (N) from the same breast in an unpublished dataset. There is no significant difference in mean expression by pair wise t-test.
A_23_P7342 A_23_P7342UGT2B10 UGT2B10
CM 1N 9.75 CM 1T 7.52CM 9N 8.62 CM 9T 8.49CM 10N 8.77 CM 10T 7.27CM 11N 9.26 CM 11T 6.65CM 13N 10.32 CM 13T 7.43CM 18N 10.69 CM 18T 8.79CM 19N 9.12 CM 19T 9.11CM 26N 8.78 CM 26T 7.31CM 31N 8.00 CM 31T 8.07CM 32N 7.73 CM 32T 7.23CM 38N 10.96 CM 38T 7.32CM 41N 9.07 CM 41T 11.71CM 46N 8.74 CM 46T 11.21CM 47N 11.08 CM 47T 8.00CM 54N 7.80 CM 54T 13.14CM 56N 7.92 CM 56T 17.48CMG24N 6.66 CMG24T 13.89CMG43N 8.24 CMG43T 10.59CM 44N 8.89 CM 44T 7.75average 8.97 average 9.42p-value 0.60 (pair wise t-test)
Table S6: Range of MD in the breasts of healthy women max� 77.3133466�min� 1.28417454�mean� 28.1668549�median� 23.5504612�

9
Supplemental discussion
Gene expression microarray analyses using tissue adjacent to a breast tumour have previously been done [1,2]. The expression profile in these normal samples will be influenced by the neighbouring breast tumour [3]. Breast reduction mammoplasties have also been used in analysis of healthy breast tissue [4]. These samples are generally collected from large breasts with a higher than average proportion of fatty tissue which may also skew the analyses to some extent. Our study analysed a population more representative of the population of women at risk for developing breast cancer, since we have studied normal breast tissue from women with no malignant disease and not undergoing breast reduction mammoplasties.
Reference List
1. Chen DT, Nasir A, Culhane A, Venkataramu C, Fulp W, Rubio R, Wang T, Agrawal D, McCarthy SM, Gruidl M et al.: Proliferative genes dominate malignancy-risk gene signature in histologically-normal breast tissue. BreastCancer Res Treat 2009.
2. Yang WT, Lewis MT, Hess K, Wong H, Tsimelzon A, Karadag N, Cairo M, Wei C, Meric-Bernstam F, Brown P et al.: Decreased TGFbeta signaling and increased COX2 expression in high risk women with increased mammographic breast density. Breast Cancer Res Treat 2009.
3. Showe MK, Vachani A, Kossenkov AV, Yousef M, Nichols C, Nikonova EV, Chang C, Kucharczuk J, Tran B, Wakeam E et al.: Gene Expression Profiles in Peripheral Blood Mononuclear Cells Can Distinguish Patients with Non-Small Cell Lung Cancer from Patients with Nonmalignant Lung Disease. Cancer Res2009.
4. Jones C, Mackay A, Grigoriadis A, Cossu A, Reis-Filho JS, Fulford L, Dexter T, Davies S, Bulmer K, Ford E et al.: Expression profiling of purified normal human luminal and myoepithelial breast cells: identification of novel prognostic markers for breast cancer. Cancer Res 2004, 64:3037-3045.

Additional�File�3����SAM�MD,�healthy�women,�stratified�
Healthy�women�MD�20+ Healthy�women�age�<50n=�61 n=�30Down�regulated�in�high�MD Down�regulated�in�high�MDGene�ID Gene�Name Score(d) q�value(%) Gene�ID Gene�Name Score(d) q�value(%)A_23_P212968 UGT2B11 �2.7797 0 A_23_P31816 DEFA1 �2.42 108.98A_24_P521559 UGT2B10 �2.7043 0 A_24_P945408 A_24_P945408 �2.11 108.98A_24_P180243 UGT2B28 �2.492 0 A_23_P28485 GCA �2.09 108.98A_24_P17691 UGT2B17 �2.4912 0 A_23_P133606 SLC12A2 �1.96 108.98A_23_P7342 UGT2B11 �2.4377 0 A_23_P155666 ASAHL �1.85 108.98A_23_P136671 UGT2B7 �2.3951 0 A_24_P521559 UGT2B10 �1.85 108.98A_24_P575267 835938 �2.2204 16.580614 A_23_P57961 PLXNB1 �1.85 108.98A_23_P309739 ESR1 �2.119 29.016075 A_23_P251002 A_23_P251002 �1.76 108.98
A_24_P180243 UGT2B28 �1.73 108.98A_24_P682550 805257 �1.73 108.98
Healthy�women�age�50+ A_24_P926053 EEF1D �1.73 108.98n=�43 A_24_P234732 MXD4 �1.72 108.98Down�regulated�in�high�MD A_23_P7342 UGT2B10 �1.72 108.98Gene�ID Gene�Name Score(d) q�value(%) A_23_P218144 LTBP2 �1.68 108.98A_24_P932736 729641 �2.85 0 A_23_P136671 UGT2B7 �1.67 108.98A_23_P102071 A_23_P102071 �2.80 0 A_23_P55616 SLC14A1 �1.67 108.98A_24_P131589 CD86 �2.73 0 A_24_P649357 LOC153561::SMA3 �1.66 108.98A_24_P18802 VPS18 �2.68 0 A_24_P105913 660721 �1.64 108.98A_23_P144244 810781 �2.64 0 A_23_P1833 B3GAT1 �1.62 108.98A_23_P427472 FLJ10404 �2.58 0 A_23_P66481 RTN4RL1 �1.62 108.98A_23_P254212 DIAPH2::RPA4 �2.55 0 A_24_P942694 C10orf118 �1.62 108.98A_32_P199824 LMOD1 �2.54 0 A_23_P212968 UGT2B11 �1.61 108.98A_32_P107994 ATG7 �2.52 0A_24_P111096 PFKFB3 �2.50 0A_32_P35668 666399 �2.47 0 Healthy�women�currently�using�HTA_23_P152570 580687 �2.43 0 n=11A_32_P133840 TMCC2 �2.40 5.21 Down�regulated�in�high�MDA_24_P375205 MKL2 �2.40 5.21 Gene�ID Gene�Name Score(d) q�value(%)A_23_P69699 NPY1R �2.36 5.21 A_23_P150979 SBEM �2.02 0A_24_P177236 CABP7 �2.36 5.21 A_23_P8702 PIP �1.99 0A_32_P80016 593535 �2.35 5.21 A_23_P136671 UGT2B7 �1.77 0A_24_P693448 ZNF552 �2.35 5.21 A_23_P393099 TFF3 �1.73 0A_23_P155463 LRRC2 �2.31 5.21 A_24_P701582 755742 �1.71 0A_23_P366376 TDGF3 �2.29 5.21 A_23_P212968 UGT2B11 �1.70 0A_23_P66543 PIK3R5 �2.25 5.21 A_24_P180243 UGT2B28 �1.61 14.86A_24_P640617 Transcribed �2.25 5.21A_24_P913847 797019 �2.22 5.21A_24_P46484 RBM22 �2.21 5.21 Healthy�women���50�not�currently�using�HTA_23_P204277 H2AFJ �2.16 7.22 n=�32A_32_P111996 MGC39584 �2.16 7.22 Down�regulated�in�high�MDA_23_P39095 CGB::CGB1 �2.12 8.80 Gene�ID Gene�Name Score(d) q�value(%)A_23_P119448 SAPS1 �2.11 8.80 A_23_P39095 CGB::CGB1 �2.31 13.41A_32_P20997 Transcribed �2.11 8.80 A_24_P131589 CD86 �2.24 13.41A_24_P287664 PLCB2 �2.11 8.80 A_23_P102071 A_23_P102071 �2.24 13.41A_32_P77416 554489 �2.11 8.80 A_32_P199824 LMOD1 �2.16 13.41A_24_P919640 CD44 �2.10 8.80 A_24_P932736 729641 �2.14 13.41A_24_P125894 PPM1F �2.08 11.04 A_23_P144244 810781 �2.12 13.41A_24_P349633 FLJ32679::GOLGA8 �2.07 11.04 A_24_P640617 Transcribed �2.10 13.41A_23_P116694 RPS26 �2.06 11.04 A_24_P18802 VPS18 �2.09 13.41A_23_P436284 OSTbeta �2.01 13.03 A_23_P366376 TDGF3 �2.07 13.41A_24_P315014 825337 �2.01 13.03 A_23_P436284 OSTbeta �2.07 13.41A_24_P36890 RAP1GAP �1.99 14.81 A_24_P111096 PFKFB3 �2.06 13.41A_23_P44663 SERPINA1 �1.93 16.42 A_23_P254212 DIAPH2::RPA4 �2.06 13.41A_32_P149404 537146 �1.93 16.42 A_32_P80016 593535 �2.05 13.41A_32_P79313 FLJ45244 �1.92 18.31 A_23_P152570 580687 �2.04 13.41A_24_P110601 834483 �1.90 18.31 A_23_P155463 LRRC2 �2.03 13.41A_23_P414793 CP �1.90 18.31 A_24_P913847 797019 �2.02 13.41A_23_P38732 CDH2 �1.89 20.40 A_23_P66543 PIK3R5 �2.00 13.41A_24_P82880 TPM4 �1.89 20.40 A_24_P919640 CD44 �1.98 13.41A_32_P147241 PKM2 �1.88 20.40 A_32_P133840 TMCC2 �1.97 13.41A_32_P168431 RPS26 �1.85 23.46 A_32_P107994 ATG7 �1.97 13.41A_23_P428184 HIST1H2AD �1.85 23.46 A_32_P149404 537146 �1.89 20.43A_24_P719081 786677 �1.83 24.89

Additional�file�4���eQTL�
UGT�transcripts�the�expression�of�which�is�associated�to�SNPs�in�their�own�or�other�UGT�genes�in�cis
Probe_ID Gene�exp SNP_rs SNP_gene b1_p Probe_ID Gene�exp SNP_rs SNP_gene b1_pA_23_P41553 Ncaml rs1828705 UGT2B10 0.01 A_24_P521559 UGT2B10 rs1131878 UGT2B4 0.48A_24_P575267 835938 rs1828705 UGT2B10 0.02 A_23_P136671 UGT2B7 rs1560605 UGT2A1 0.48A_23_P136671 UGT2B7 rs1828705 UGT2B10 0.04 A_24_P521559 UGT2B10 rs903446 UGT2B4 0.49A_23_P41553 Ncaml rs941389 UGT2B4 0.05 A_24_P575267 835938 rs10026603 UGT2A1 0.49A_24_P180243 UGT2B28 rs1828705 UGT2B10 0.05 A_23_P41553 Ncaml rs13139888 UGT2B4 0.50A_24_P180243 UGT2B28 rs2288741 UGT2A1 0.07 A_23_P212968 UGT2B11 rs4554145 UGT2B4 0.51A_23_P7342 UGT2B11 rs2288741 UGT2A1 0.08 A_23_P212968 UGT2B11 rs2045100 UGT2B15 0.51A_23_P58407 UGT2B15 rs1828705 UGT2B10 0.08 A_24_P575267 835938 rs4694211 UGT2B4 0.51A_24_P180243 UGT2B28 rs4554145 UGT2B4 0.08 A_23_P58407 UGT2B15 rs1513559 UGT2B10 0.55A_24_P575267 835938 rs4554145 UGT2B4 0.08 A_23_P212968 UGT2B11 rs4557343 UGT2B4 0.57A_24_P575267 835938 rs13139888 UGT2B4 0.08 A_24_P521559 UGT2B10 rs7439366 UGT2B7 0.59A_23_P41553 Ncaml rs4557343 UGT2B4 0.08 A_23_P58407 UGT2B15 rs7668258 UGT2B7 0.59A_23_P7342 UGT2B11 rs1560605 UGT2A1 0.09 A_23_P58407 UGT2B15 rs4521414 UGT2B7 0.59A_24_P180243 UGT2B28 rs1560605 UGT2A1 0.09 A_23_P136671 UGT2B7 rs13139888 UGT2B4 0.59A_23_P212968 UGT2B11 rs1828705 UGT2B10 0.10 A_23_P136671 UGT2B7 rs4557343 UGT2B4 0.60A_24_P575267 835938 rs3775782 UGT2A1 0.10 A_23_P7342 UGT2B11 rs7668258 UGT2B7 0.60A_24_P180243 UGT2B28 rs10026603 UGT2A1 0.11 A_23_P7342 UGT2B11 rs4521414 UGT2B7 0.60A_24_P575267 835938 rs2288741 UGT2A1 0.13 A_23_P136671 UGT2B7 rs2045100 UGT2B15 0.61A_24_P180243 UGT2B28 rs1432329 UGT2A1 0.13 A_24_P180243 UGT2B28 rs7439366 UGT2B7 0.62A_24_P575267 835938 rs1560605 UGT2A1 0.15 A_23_P136671 UGT2B7 rs941389 UGT2B4 0.62A_24_P180243 UGT2B28 rs3775782 UGT2A1 0.15 A_24_P575267 835938 rs4148279 UGT2A1 0.63A_23_P58407 UGT2B15 rs1454254 UGT2B15 0.16 A_24_P17691 UGT2B17 rs1513559 UGT2B10 0.63A_24_P575267 835938 rs1131878 UGT2B4 0.16 A_24_P575267 835938 rs1513559 UGT2B10 0.64A_24_P521559 UGT2B10 rs10026603 UGT2A1 0.16 A_23_P136671 UGT2B7 rs1432329 UGT2A1 0.64A_23_P7342 UGT2B11 rs1432329 UGT2A1 0.19 A_24_P575267 835938 rs7668258 UGT2B7 0.65A_24_P575267 835938 rs1432329 UGT2A1 0.20 A_24_P575267 835938 rs4521414 UGT2B7 0.65A_23_P7342 UGT2B11 rs10026603 UGT2A1 0.21 A_24_P575267 835938 rs4235126 UGT2B28 0.65A_24_P180243 UGT2B28 rs13139888 UGT2B4 0.21 A_23_P136671 UGT2B7 rs4694211 UGT2B4 0.66A_24_P180243 UGT2B28 rs1131878 UGT2B4 0.21 A_23_P212968 UGT2B11 rs13139888 UGT2B4 0.67A_23_P212968 UGT2B11 rs2288741 UGT2A1 0.23 A_23_P136671 UGT2B7 rs1131878 UGT2B4 0.67A_23_P212968 UGT2B11 rs1560605 UGT2A1 0.23 A_24_P17691 UGT2B17 rs1454254 UGT2B15 0.68A_23_P7342 UGT2B11 rs1828705 UGT2B10 0.23 A_23_P7342 UGT2B11 rs7439366 UGT2B7 0.68A_24_P521559 UGT2B10 rs2288741 UGT2A1 0.24 A_24_P17691 UGT2B17 rs844342 UGT2B10 0.69A_24_P180243 UGT2B28 rs4557343 UGT2B4 0.25 A_23_P7342 UGT2B11 rs4148279 UGT2A1 0.69A_23_P7342 UGT2B11 rs4557343 UGT2B4 0.25 A_24_P521559 UGT2B10 rs4694211 UGT2B4 0.70A_24_P521559 UGT2B10 rs1560605 UGT2A1 0.28 A_23_P7342 UGT2B11 rs844342 UGT2B10 0.70A_23_P7342 UGT2B11 rs3775782 UGT2A1 0.29 A_24_P521559 UGT2B10 rs7668258 UGT2B7 0.71A_24_P521559 UGT2B10 rs1828705 UGT2B10 0.29 A_24_P521559 UGT2B10 rs4521414 UGT2B7 0.71A_24_P521559 UGT2B10 rs4554145 UGT2B4 0.29 A_24_P521559 UGT2B10 rs844342 UGT2B10 0.72A_23_P7342 UGT2B11 rs4554145 UGT2B4 0.30 A_23_P212968 UGT2B11 rs1131878 UGT2B4 0.73A_24_P17691 UGT2B17 rs1828705 UGT2B10 0.31 A_23_P41553 Ncaml rs4235126 UGT2B28 0.73A_23_P41553 Ncaml rs3775782 UGT2A1 0.31 A_24_P180243 UGT2B28 rs4235126 UGT2B28 0.73A_24_P521559 UGT2B10 rs4235126 UGT2B28 0.33 A_24_P180243 UGT2B28 rs844342 UGT2B10 0.74A_23_P212968 UGT2B11 rs7668258 UGT2B7 0.34 A_23_P7342 UGT2B11 rs903446 UGT2B4 0.74A_23_P212968 UGT2B11 rs4521414 UGT2B7 0.34 A_24_P521559 UGT2B10 rs941389 UGT2B4 0.75A_23_P41553 Ncaml rs1513559 UGT2B10 0.35 A_23_P136671 UGT2B7 rs4235126 UGT2B28 0.75A_23_P212968 UGT2B11 rs10026603 UGT2A1 0.35 A_24_P521559 UGT2B10 rs2045100 UGT2B15 0.76A_24_P575267 835938 rs4557343 UGT2B4 0.36 A_24_P575267 835938 rs7439366 UGT2B7 0.77A_23_P212968 UGT2B11 rs7439366 UGT2B7 0.36 A_23_P7342 UGT2B11 rs941389 UGT2B4 0.77A_23_P41553 Ncaml rs844342 UGT2B10 0.37 A_24_P575267 835938 rs844342 UGT2B10 0.78A_23_P136671 UGT2B7 rs4554145 UGT2B4 0.38 A_24_P180243 UGT2B28 rs7668258 UGT2B7 0.78A_23_P212968 UGT2B11 rs3775782 UGT2A1 0.38 A_24_P180243 UGT2B28 rs4521414 UGT2B7 0.78A_23_P136671 UGT2B7 rs10026603 UGT2A1 0.38 A_23_P136671 UGT2B7 rs4148279 UGT2A1 0.78A_24_P180243 UGT2B28 rs4694211 UGT2B4 0.40 A_23_P7342 UGT2B11 rs4235126 UGT2B28 0.79A_24_P521559 UGT2B10 rs3775782 UGT2A1 0.41 A_23_P212968 UGT2B11 rs4694211 UGT2B4 0.79A_24_P521559 UGT2B10 rs1432329 UGT2A1 0.41 A_23_P41553 Ncaml rs1131878 UGT2B4 0.79A_23_P7342 UGT2B11 rs13139888 UGT2B4 0.41 A_24_P575267 835938 rs1454254 UGT2B15 0.80A_23_P136671 UGT2B7 rs3775782 UGT2A1 0.42 A_23_P7342 UGT2B11 rs1513559 UGT2B10 0.80A_23_P136671 UGT2B7 rs2288741 UGT2A1 0.44 A_23_P58407 UGT2B15 rs7439366 UGT2B7 0.80A_23_P41553 Ncaml rs1454254 UGT2B15 0.44 A_23_P41553 Ncaml rs7439366 UGT2B7 0.82A_23_P41553 Ncaml rs4554145 UGT2B4 0.44 A_23_P41553 Ncaml rs7668258 UGT2B7 0.83A_23_P7342 UGT2B11 rs1131878 UGT2B4 0.45 A_23_P41553 Ncaml rs4521414 UGT2B7 0.83A_24_P575267 835938 rs2045100 UGT2B15 0.45 A_24_P521559 UGT2B10 rs4557343 UGT2B4 0.83A_24_P180243 UGT2B28 rs2045100 UGT2B15 0.46 A_23_P58407 UGT2B15 rs844342 UGT2B10 0.83A_23_P212968 UGT2B11 rs1432329 UGT2A1 0.46 A_23_P41553 Ncaml rs4694211 UGT2B4 0.83A_24_P521559 UGT2B10 rs13139888 UGT2B4 0.47 A_23_P7342 UGT2B11 rs2045100 UGT2B15 0.84A_23_P58407 UGT2B15 rs2045100 UGT2B15 0.47 A_23_P212968 UGT2B11 rs903446 UGT2B4 0.84

Probe_ID Gene�exp SNP_rs SNP_gene b1_p Probe_ID Gene�exp SNP_rs SNP_gene b1_pA_23_P212968 UGT2B11 rs4235126 UGT2B28 0.84 A_23_P41365 SMR3A rs2288741 UGT2A1 0.90A_23_P212968 UGT2B11 rs844342 UGT2B10 0.84 A_23_P41365 SMR3A rs10026603 UGT2A1 0.91A_24_P180243 UGT2B28 rs1454254 UGT2B15 0.85 A_23_P362694 C4orf7 rs13139888 UGT2B4 0.92A_24_P180243 UGT2B28 rs903446 UGT2B4 0.87 A_23_P110234 CSN1S1 rs903446 UGT2B4 0.92A_23_P212968 UGT2B11 rs1513559 UGT2B10 0.87 A_23_P41365 SMR3A rs1560605 UGT2A1 0.94A_23_P136671 UGT2B7 rs844342 UGT2B10 0.88 A_23_P41365 SMR3A rs4235126 UGT2B28 0.96A_24_P180243 UGT2B28 rs4148279 UGT2A1 0.90 A_23_P110234 CSN1S1 rs4148279 UGT2A1 0.98A_24_P521559 UGT2B10 rs4148279 UGT2A1 0.90A_24_P521559 UGT2B10 rs1513559 UGT2B10 0.90A_23_P41553 Ncaml rs903446 UGT2B4 0.90A_23_P136671 UGT2B7 rs7668258 UGT2B7 0.90A_23_P136671 UGT2B7 rs4521414 UGT2B7 0.90A_23_P212968 UGT2B11 rs941389 UGT2B4 0.91A_24_P521559 UGT2B10 rs1454254 UGT2B15 0.93A_23_P7342 UGT2B11 rs1454254 UGT2B15 0.93A_23_P212968 UGT2B11 rs1454254 UGT2B15 0.94A_23_P41553 Ncaml rs2045100 UGT2B15 0.95A_24_P17691 UGT2B17 rs2045100 UGT2B15 0.95A_24_P180243 UGT2B28 rs1513559 UGT2B10 0.96A_23_P136671 UGT2B7 rs903446 UGT2B4 0.96A_24_P575267 835938 rs941389 UGT2B4 0.97A_23_P136671 UGT2B7 rs1454254 UGT2B15 0.98A_23_P7342 UGT2B11 rs4694211 UGT2B4 0.98A_23_P212968 UGT2B11 rs4148279 UGT2A1 0.98A_23_P41553 Ncaml rs2288741 UGT2A1 0.98A_23_P136671 UGT2B7 rs1513559 UGT2B10 0.99A_23_P136671 UGT2B7 rs7439366 UGT2B7 0.99A_24_P180243 UGT2B28 rs941389 UGT2B4 1.00A_23_P362694 C4orf7 rs903446 UGT2B4 0.01A_23_P41365 SMR3A rs941389 UGT2B4 0.06A_23_P362694 C4orf7 rs7439366 UGT2B7 0.10A_23_P362694 C4orf7 rs4148279 UGT2A1 0.10A_23_P362694 C4orf7 rs7668258 UGT2B7 0.14A_23_P362694 C4orf7 rs4521414 UGT2B7 0.14A_23_P110234 CSN1S1 rs3775782 UGT2A1 0.18A_23_P110234 CSN1S1 rs13139888 UGT2B4 0.18A_23_P110234 CSN1S1 rs1131878 UGT2B4 0.19A_23_P362694 C4orf7 rs1131878 UGT2B4 0.22A_23_P362694 C4orf7 rs4554145 UGT2B4 0.23A_23_P110234 CSN1S1 rs4554145 UGT2B4 0.24A_23_P41365 SMR3A rs3775782 UGT2A1 0.27A_23_P362694 C4orf7 rs4235126 UGT2B28 0.33A_23_P110234 CSN1S1 rs4694211 UGT2B4 0.34A_23_P41365 SMR3A rs4557343 UGT2B4 0.40A_23_P362694 C4orf7 rs4694211 UGT2B4 0.43A_23_P110234 CSN1S1 rs1432329 UGT2A1 0.49A_23_P362694 C4orf7 rs3775782 UGT2A1 0.52A_23_P41365 SMR3A rs13139888 UGT2B4 0.52A_23_P362694 C4orf7 rs2288741 UGT2A1 0.58A_23_P110234 CSN1S1 rs4557343 UGT2B4 0.58A_23_P41365 SMR3A rs903446 UGT2B4 0.61A_23_P41365 SMR3A rs4554145 UGT2B4 0.64A_23_P110234 CSN1S1 rs4235126 UGT2B28 0.68A_23_P41365 SMR3A rs4148279 UGT2A1 0.70A_23_P110234 CSN1S1 rs941389 UGT2B4 0.75A_23_P362694 C4orf7 rs1432329 UGT2A1 0.75A_23_P362694 C4orf7 rs941389 UGT2B4 0.78A_23_P110234 CSN1S1 rs1560605 UGT2A1 0.78A_23_P110234 CSN1S1 rs2288741 UGT2A1 0.79A_23_P41365 SMR3A rs1131878 UGT2B4 0.81A_23_P110234 CSN1S1 rs844342 UGT2B10 0.81A_23_P362694 C4orf7 rs10026603 UGT2A1 0.81A_23_P41365 SMR3A rs4694211 UGT2B4 0.84A_23_P110234 CSN1S1 rs7439366 UGT2B7 0.85A_23_P41365 SMR3A rs1432329 UGT2A1 0.85A_23_P362694 C4orf7 rs1560605 UGT2A1 0.85A_23_P110234 CSN1S1 rs7668258 UGT2B7 0.86A_23_P110234 CSN1S1 rs4521414 UGT2B7 0.86A_23_P110234 CSN1S1 rs10026603 UGT2A1 0.88A_23_P362694 C4orf7 rs4557343 UGT2B4 0.89


Paper III Serum estradiol levels associated with specific gene expression patterns in normal breast tissue and in breast carcinomas


1
Serum estradiol levels associated with specific gene expression patterns in normal breast tissue and in breast carcinomas
Vilde D Haakensen1,2, Trine Bjøro3,2, Torben Lüders4, Margit Riis4,5, Ida K Bukholm2,5,Vessela N Kristensen1,2, 4, Melissa A Troester6, Marit Muri Homen7, Giske Ursin8,9,10,Anne-Lise Børresen-Dale1,2, Åslaug Helland1,2,11.
1Department of Genetics, Institute for Cancer Research, Oslo University Hospital Radiumhospitalet, Oslo, Norway
2Institute for Clinical Medicine, Faculty of Medicine, University of Oslo, Oslo, Norway
3 Deptartment of Medical Biochemistry and Institute of Clinical Biochemistry, Oslo University Hospital Radiumhospitalet, Oslo,
Norway4
Department of Clinical Molecular Biology, Division of Medicine and Laboratory Sciences, Institute for Clinical Medicine, AkershusUniversity Hospital, University of Oslo, Lørenskog, Norway 5 Department of Surgery, Akerhus University Hospital, Lørenskog, Norway 6
Department of Epidemiology and Lineberger Comprehensive Cancer Center, University of North Carolina at Chapel Hill, Chapel Hill,, USA 7
Department of Radiology, University Hospital of North Norway, Tromsø, Norway 8
Department of Nutrition, School of Medicine, University of Oslo, Oslo, Norway 9
Department of Preventive Medicine, University of Southern California Keck School of Medicine, Los Angeles, USA 10
Cancer Registry of Norway, Oslo, Norway 11
Department of Oncology, Oslo University Hospital Radiumhospitalet, Oslo, Norway
[email protected]@oslo-universitetssykehus.notorben.luders@[email protected]@[email protected]@[email protected]@[email protected]@rr-research.no
Corresponding author:Åslaug HellandDept of Oncology Oslo University Hospital Radiumhospitalet 0310 Oslo NorwayPh: +47 22 93 40 00 Fax: +47 22 78 13 95 E-mail: [email protected] Conflict of interest:

2
The authors claim no conflict of interest. Running title:Gene expression associated with serum estradiol in normal and malignant breast tissue
Keywords: Serum estradiol, SCGB3A1, HIN1, TLN2, PTGS1, COX1, AREG, GREB1, TFF, normal breast tissue, gene expression.

3
AbstractIntroduction High serum levels of estradiol are associated with increased risk of breast cancer. Little is known about the gene expression in normal breast tissue in relation to levels of circulating serum estradiol.
Methods We compared whole genome expression data of breast tissue samples with serum hormone levels using data from 79 healthy women and 64 breast cancer patients. Significance analysis of microarrays (SAM) was used to identify differentially expressed genes and multivariate linear regression was used to identify independent associations.
ResultsSix genes (SCGB3A1, RSPO1, TLN2, SLITRK4, DCLK1, PTGS1) were found differentially expressed according to serum estradiol levels (FDR=0). Three of these were independent predictors of estradiol levels in a multivariate model: SCGB3A1 (HIN1) and TLN2 were up-regulated and PTGS1 (COX1) was down-regulated in samples form women with high serum estradiol. SCGB3A1 is a suggested tumor suppressor gene that inhibits cell growth and invasion and is methylated and down-regulated in many epithelial cancers. PTGS1 induces prostaglandin E2 (PGE2) production which in turn stimulates aromatase expression and hence increases the local production of estradiol. Serum estradiol, but none of the differentially expressed genes were significantly associated with mammographic density, another strong breast cancer risk factor. In breast carcinomas, expression of GREB1 and AREG was associated with serum estradiol in all cancers and in the subgroup of estrogen receptor positive cases.
Conclusion We have identified genes associated with serum estradiol levels in normal breast tissue and in breast carcinomas. This is the firs report studying such associations in normal breast tissue in humans. Serum estradiol, but none of the differentially expressed genes, was found to be an independent predictor of mammographic density.

4
Introduction Influence of estradiol on breast development [1], the menopausal transition [2] and on the breast epithelial cells [3] is widely studied. However, little is known about the effect of serum estradiol on gene expression in the normal breast tissue. For post-menopausal women, high serum estradiol levels are associated with increased risk of breast cancer [4-6]. The results are less conclusive for premenopausal women, but epidemiologic evidence indicates an increased risk from higher exposure to female hormones [7].
In estrogen receptor (ER) positive breast carcinomas, the proliferating tumor cells express ER while in normal breast tissue the proliferating epithelial cells are ER negative (ER-) [8,9]. Both normal and malignant breast epithelial cells are influenced by estradiol but through different mechanisms. In the lack of ER, normal breast epithelial cells receive proliferating paracrine signals from ER+ fibroblasts [3]. The importance of estrogen stimuli in the proliferation of ER+ breast cancer cells is evident from the effect of anti-estrogen treatment. Previously, several studies have identified genes whose expression is regulated by estradiol in breast cancer cell lines. Recently, a study reported an association between serum levels of estradiol and gene expression of TFF1, GREB1, PDZK1 and PGR in ER+ breast carcinomas [10]. Functional studies on breast cancer cell lines have described that estradiol induces expression of c-fos [11] and that exposure to physiologic doses of estradiol is necessary for malignant transformation [12]. Intratumoral levels of estrogens have also been measured and were found correlated with tumor gene expression of estradiol-metabolizing enzymes and ESR1 [13] and of proliferation markers [14]. A recent study did, however, conclude that the intratumoral estradiol levels were mainly determined by its binding to ER (associated with ESR1-expression). The intratumoral estradiol levels were not found to be associated with local estradiol production [15]. Serum estradiol levels were found to be associated with local estradiol levels in normal breast tissue of breast cancer patients in a recent study [16]. This strengthens the hypothesis that serum estradiol levels influence the gene expression in breast tissue.
Wilson and colleagues studied the effect of estradiol on normal human breast tissue transplanted into athymic nude mice. They identified a list of genes associated with estradiol treatment, including TFF1, AREG, SCGB2A2, GREB1 and GATA3. The normal tissues used in the xenografts were from breasts with benign breast disease and from mammoplasty reductions [17].
Studies describing associations between serum estradiol levels and gene expression of normal human breast tissue in its natural milieu are lacking. Knowledge about gene expression changes associated with high serum estradiol may reveal biological mechanisms underlying the increased risk for both elevated mammographic density and for developing breast cancer as seen in women with high estradiol levels. We have identified genes differentially expressed between normal breast tissue samples according to serum estradiol levels. Several genes identified in previous studies using normal breast tissue or breast carcinomas are confirmed, but additional genes were identified making important contributions to our previous knowledge.

5
Materials and methods SubjectsTwo cohorts of women were recruited to the study from different breast diagnostic centers in Norway in the period 2002-2007 as described previously [18]. Exclusion criteria were pregnancy and use of anticoagulant therapy. The first cohort consisted of women referred to the breast diagnostic centers who were cancer-free after further evaluation. Breast biopsies were taken from an area with some mammographic density in the breast contralateral to any suspect lesion. The second cohort consisted of women who were diagnosed with breast cancer. For this cohort, study biopsies were taken from the breast carcinoma after the diagnostic biopsies were obtained. Fourteen gauge needles were used for the biopsies and sampling was guided by ultrasound. The biopsies were either soaked in RNAlater (Ambion, Austin, TX) and sent to the Oslo University Hospital, Radiumhospitalet, before storage at -20�C or directly snap-frozen in liquid nitrogen and stored at -80�C.
All women provided information about height, weight, parity, hormone therapy use and family history of breast cancer and provided a signed informed consent. The study was approved by the regional ethical committee (IRB approval no S-02036). In total, 120 healthy women with no malignant disease were recruited in the first cohort. These are in the following referred to as ‘healthy women’. In the second cohort, 66 women with a newly diagnosed breast cancer were recruited.
Three additional datasets were used to explore the regulation of identified genes in breast cancer. One unpublished dataset from the Akershus University Hospital (AHUS), Norway, included normal breast tissue from 42 reduction mammoplasties and both tumor and normal adjacent tissue from 48 breast cancer patients (referred to as the AHUS dataset). Another unpublished dataset from University of North Carolina (UNC), USA, included breast cancer and adjacent normal breast tissue from 55 breast cancer patients (referred to as the UNC dataset). The third dataset is previously published and consists of biopsies from 31 pure ductal carcinoma in situ (DCIS), 36 pure invasive breast cancers and 42 tumours with mixed histology, both DCIS and invasive [19].
Serum hormone analysis Serum hormone levels (LH, FSH, prolactin, estradiol, progesterone, SHBG and testosterone) were measured with electrochemiluminescence immunoassays (ECLIA) on a Roche Modular E instrument (Roche, Basel, Switzerland) by Department of Medical Biochemistry, Oslo University Hospital, Rikshospitalet. The menopausal status was determined based on serum levels of hormones, age and hormone use. The criteria used can be found in Supplementary Table S1. Biochemically perimenopausal women or women with uncertain menopausal status were excluded from analyses stratified on menopause. These hormone assays are tested through an external quality assessment scheme, Labquality, and the laboratory is accredited according to ISO–ES 17025. Serum estradiol values are given as picograms per milliliter (pg/ml).

6
Gene expression analysis RNA extraction and hybridization were performed as previously described [18]. Briefly, RNeasy Mini Protocol (Qiagen, Valencia, CA) was used for RNA extraction. Forty samples (38 from healthy women) were excluded from further analysis due to low RNA amount (<10ng) or poor RNA quality (measured by Agilent Bioanalyzer, Agilent Technologies, Palo Alto, CA). Agilent Low RNA input Fluorescent Linear Amplification Kit Protocol was used for amplification and labelling with Cy5 (Amersham Biosciences, Little Chalfont, England) for sample RNA and Cy3 (Amersham Biosciences, Little Chalfont, England) for the reference (Universal Human total RNA (Stratagene, La Jolla, CA)). Labelled RNA was hybridized onto Agilent Human Whole Genome Oligo Microarrays (G4110A) (Agilent Technologies, Santa Clara, CA). Three arrays were excluded due to poor quality leaving data from 79 healthy women and 64 breast cancer patients.
The scanned data was processed in Feature Extraction 9.1.3.1 (Agilent Technologies, Santa Clara, CA). Locally weighted scatterplot smoothing (lowess) was used to normalize the data. The normalized and log2-transformed data was stored in the Stanford Microarray Database (SMD)[20] and retrieved for further analysis. Gene filtering excluded probes with �20% missing values and probes with less than three arrays being at least 1.6 standard deviation away from the mean. This reduced the dataset from 40791 probes to 9767 for the healthy women and to 10153 for the breast cancer patients. Missing values were imputed in R using the method impute.knn in the library impute [21].
Mammographic densityMammographic density was estimated from digitized craniocaudal mammograms as previously described [18] using the University of Southern California Madena assessment method [22]. First, the total breast area was outlined using a computerized tool and the area was represented as number of pixels. One of the co-authors, GU, identified a region of interest that incorporated all dense areas of density excluding those representing the pectoralis muscle and scanning artifacts. All densities above a certain threshold were tinted yellow, and the tinted pixles converted to cm2 representing the absolute density and was available for 108 of 120 healthy women. Percent mammographic density is calculated as the absolute density divided by the total breast area and was available for 114 of 120 healthy women. Test-retest reliability was 0.99 for absolute density.
Statistical Analysis Quantitative significance Analysis of Microarrays (SAM) [23,24] was used for analysis of differentially expressed genes, by the library samr in R 2.12.0. Serum estradiol (nmol/L) was used as dependent variable. The distribution of serum levels is skewed and therefore the non-parametric Wilcoxon test-statistic was used. Probes with an FDR<50% were included for gene ontology analyses.
DAVID Bioinformatics Resources 2008 from the National Institute of Allergy and Infectious Diseases, NIH [25] was used for gene ontology analysis. Functional annotation clustering was applied and the following annotation categories were selected: biological processes, molecular function, cellular compartment and KEGG pathways. We included

7
annotation terms with a p-value (FDR-corrected) of <0.01 containing between 5 and 500 genes.
For multivariate analysis, linear regression was fitted in R 2.12.0 to identify independent associations. Stepwise selection was performed to determine which variables had an independent contribution to the response variable. In the first step, all variables were included in the model. The variable with the highest p-value was rejected from the model in each step, before the model was refitted. This was repeated until all variables in the model had a p-value smaller than 0.05.
Linear regression was used to determine the independent association between serum estradiol and the differentially expressed genes in healthy women. Age, menopause and current hormone use were included in the model and forced to stay throughout the stepwise selection to correct for confounding by these factors. Linear regression was also fitted in two analyses with mammographic density in healthy women as a dependent variable. In one set of analyses serum hormone levels were included as the independent covariates, and in the other analysis, variables representing gene expression associated with serum estradiol were included as covariates. Epidemiologic covariates, such as age, BMI, parity and use of hormone therapy were included in the mammographic density analyses and forced to stay throughout the stepwise selection to control for potential confounding by these factors.
Tumor subtypes were calculated using the intrinsic subtypes published by Sørlie et al in 2001 [26]. The total gene set was filtered for the intrinsic genes. The correlation between gene expression profiles for the intrinsic genes for each sample with each subtype was calculated. Each sample was assigned to the subtype with which it had the highest correlation. Samples with all correlations <0.1 were not assigned to any subtype. Two-sided t-tests were used to check for difference in expression for single genes between two categories of variables (eg: pre- and postmenopausal).

8
ResultsGene expression in normal breast tissue according to serum estradiol levels Genes differentially expressed in normal breast tissue from healthy women according to serum estradiol levels with FDR=0 are listed in Table 1. The gene ontology terms extracellular region and skeletal system development were significantly enriched in the top 80 up-regulated genes (FDR<50%). There were no significant gene ontology terms enriched in the down-regulated genes with FDR<50 (n=8), although response to steroid hormone stimulus was the most enriched term with three observed genes (PTGS1, ESR1and GATA3).
The genes differentially expressed in normal breast tissue according to serum estradiol with an FDR=0 (from Table 1) were tested for differential expression between breast cancer tissue and normal breast tissue from healthy women. All six genes were differentially expressed between carcinomas and normal tissue. Interestingly, the expression in breast carcinomas was similar to that in normal tissue from women with lower levels of circulating estradiol and opposite to that found in normal samples from women with higher levels of serum estradiol (Table 1). Comparing the expression of these genes in normal breast tissue with the expression in ER+ and ER- carcinomas respectively revealed similar results (Table 1).
In tumors, SCGB3A1 tended to be expressed at a lower level in basal-like tumors compared with all other tumors or compared with luminal A tumors, but this did not reach statistical significance (both p-values=0.2). However in two other datasets (AHUS and UNC), SCGB3A1 was expressed at significantly lower levels in basal-like tumors compared with all other subtypes (p=0.04 and 0.003 respectively). There was no consistent significant difference in SCGB3A1 expression in ER+ and ER- tumors.
Of the six genes differentially expressed according to serum estradiol in normal breast tissue, three were differentially expressed between DCIS and early invasive breast carcinomas based on a previously published dataset [19](Table 1). SCGB3A1 was down-regulated in invasive compared with DCIS, whereas TLN2 and PTGS1 were up-regulated in invasive compared with DCIS.
A linear regression was fitted with all differentially expressed genes as covariates and controlling for age, menopause and current hormone therapy use. After leave-one-out elimination of insignificant covariates, SCGB3A1, TLN2 and PTGS1 were still significant (Table 2).

9
Serum estradiol related to mammographic density in healthy women Regression analysis in postmenopausal women showed that serum estradiol was independently associated with both absolute and percent mammographic density when controlling for age, BMI and current use of hormone therapy (Table 3). None of the genes differentially expressed in normal breast tissue according to serum estradiol levels were independently associated with mammographic density (data not shown).
Gene expression in breast carcinomas according to serum estradiol levels In breast carcinomas, quantitative SAM revealed two genes, AREG and GREB1, as differentially expressed according to serum estradiol levels with FDR=0 (Table 4). Both genes were up-regulated in samples from women with high serum estradiol (estradiol was used as a continuous response variable in the analysis). Of 16 probes up-regulated in samples from women with high serum estradiol, there were three probes for TFF3 and one for TFF1, although these did not reach statistical significance (Table 4). No genes were significantly down-regulated. In ER+ samples (n=53), we also found AREG and GREB1 up-regulated in samples from women with high serum estradiol (FDR=0), but the TFF-genes were not up-regulated. Among the ER- samples (n=8) there was very little variation in serum estradiol levels and a search for genes differentially expressed according to serum estradiol is not feasible.
Looking at normal breast tissue from healthy women, both AREG and GREB1 are up-regulated in samples from women with high estradiol levels without reaching significance. Neither AREG nor GREB1 are differentially expressed between normal breast tissue and breast carcinomas. All the probes for TFF-genes are, however, significantly down-regulated in normal breast tissue compared with breast carcinomas (Supplementary Table 3).

10
DiscussionGene expression in normal breast tissue according to serum estradiol levels We have identified genes differentially expressed according to serum estradiol in normal breast tissue of healthy women.
The genes up-regulated in normal breast tissue under influence of high serum estradiol are enriched for the gene ontology terms extracellular matrix and skeletal system development. Both ER isoforms � and � are expressed in the stromal cells [27]. The proliferating epithelial cells are not found to be ER�+ [8] and most often negative to both ER isoforms [9]. In normal breast tissue, the estrogen-induced epithelial proliferation is, at least partly, caused by paracrine signals from ER+ fibroblasts [3]. The enrichment of gene ontology terms related to extracellular matrix may be linked to the effect of estradiol on the ER+ stromal cells.
Three genes were independently associated with serum estradiol levels in normal breast tissue in a linear regression model after controlling for age, menopause and current hormone therapy. The two genes SCBG3A1 (HIN1) and TLN2 were positively associated with serum estradiol and PTGS1 (COX1) negatively.
SCBG3A1 is a secretoglobin transcribed in luminal, but not in myoepithelial breast cells and is secreted from the cell [28]. The protein is a tumor suppressor and inhibits cell growth, migration and invasion acting through the AKT-pathway. SCBG3A1 inhibitsAkt-phosphorylation, which reduces the Akt-funtion in promoting cell cycle progression (transition from the G1 to the S-phase) and preventing apoptosis (through inhibition of the TGF�-pathway) [29] (Figure 1).
The SCBG3A1 promoter was found to be hypermethylated with down-regulated expression of the gene in breast carcinomas compared with normal breast tissue, where it is referred to as “high in normal 1” (HIN1)[30,31]. Interestingly, the gene is not methylated in BRCA-mutated and BRCA-like breast cancer [32]. Methylation of the gene is suggested to be an early event in non-BRCA-associated breast cancer [33].
We found SCBG3A1 down-regulated in basal-like cancers compared to other subtypes. At first glance, this may seem contradictory to the observation that the gene is not methylated in BRCA-like breast cancers. However, Krop and colleagues found that the gene is expressed in luminal epithelial cell lines, but not in myoepithelial cell lines. The reduced expression seen in basal-like cancer could be due to a myoepithelial phenotype arising from a myoepithelial cell of origin or from phenotypic changes acquired during carcinogensis. This could also be linked to the lack of methylation in BRCA-associated breast cancers, which are often basal-like. An a priori low gene expression would make methylation unnecessary. The increased Akt-activity seen in basal-like cancers[34] is consistent with the low levels of SCBG3A1 expression observed in the basal-like cancers in this study leading to increased Akt-phosphorylation and thereby Akt-activity.
PTGS1 (prostaglandin-endoperoxide synthase 1) is synonymous with cyclooxygenase 1 (COX1) and codes for an enzyme important in prostaglandin production. Studies of normal human adiopocytes have shown that the enzyme induces production of prostaglandin E2 (PGE2) which in turn increases the expression of aromatase (CYP19A1)[35]. Aromatase is the enzyme responsible for the last step in the conversion of

11
androgens to estrogens in adipose tissue. Hence, the expression of PTGS1 may lead to an increased production of estradiol locally (Figure 2). In normal breast tissue, we observed that the expression of PTGS1 was lower in samples from women with higher levels of serum estradiol. This may be due to negative feedback. High systemic levels of estradiol make local production unnecessary and PTGS1-induced aromatase production is abolished.
The up-regulation of PTGS1 in breast carcinomas compared to normal tissue is expected from current knowledge. Several studies have suggested that PTGS1 has a carcinogenic role in different epithelial cancers [36-40]. The gene has also previously been found over-expressed in tumors compared with tumor adjacent normal tissue [41].
Talin 2 (TLN2) is less known and less studied than Talin 1 (TLN1). Both talins are believed to connect integrins to the actin cytoskeleton and are involved in integrin-associated cell adhesion [42,43]. TLN2 is located on chromosome 15q15-21, close to CYP19A1 coding for aromatase. A study on aromatase-excess syndrome found that certain minor chromosomal rearrangements may cause cryptic transcription of the CYP19A1 gene through the TLN2-promoter [44]. We found that TLN2 was up-regulated in breasts of healthy women with high levels of serum estradiol. This could indicate an activation of cell adhesion. This gene was the only gene significantly up-regulated according to serum estradiol in normal breast tissue of premenopausal women. The down-regulation observed in breast cancers compared with normal breast tissue indicates a loss of cell adhesion. The expression of the gene is lower in DCIS than in invasive carcinomas, which is contrary to expected, but the data set is small.
A previous study report on the gene expression in normal human breast tissue transplanted into two groups of athymic mice treated with different levels of estradiol [17]. Neither SCGB3A1, TLN2 nor PTGS1 was significantly differentially expressed in their study. They did, however, identify many of the genes found to be significantly differentially expressed according to serum estradiol in breast carcinomas in the current study, such as AREG (amphiregulin), GREB1 (growth regulation by estrogen in breast cancer 1), TFF1 (Trefoil factor 1) and TFF3 (Trefoil factor 3). Going back to our normal samples, we see that several of their genes (including AREG, GREB1, TFF1 and TFF3,GATA3 and two SERPIN-genes) are differentially expressed in our normal breast tissue, but did not reach statistical significance (Supplementary table S3).
The differences observed between our study and that of Wilson and colleagues may be due to chance and due to the presence of different residual confounding in the two studies. Wilson and colleagues studied the effects of estradiol treatment, which may act differently upon the breast tissue than endogenous estradiol. Normal human breast tissue transplanted into mice may react differently to varying levels of estradiol than it does in its natural milieu in humans. The genes that were significant in the Wilson-study and differentially expressed but not significant in our study (eg: AREG, GREB1, TFF1, TFF3and GATA3) may be associated with serum estradiol levels in normal tissues as well as in tumor tissues where we and others have observed significant associations. Our study is the first study to identify the expression of SCGB3A1, TLN2 and PTGS1 in normal breast tissue to be significantly associated with serum estradiol levels. These findings are biologically reasonable and may have been missed in previous studies due to lack of representative study material.

12
Serum estradiol associated with mammographic density in healthy women Serum estradiol levels were independently associated with mammographic density controlling for age, BMI and current use of hormone therapy, and the magnitude of the association was substantial (Table 3). The high beta-value in the regression equation implies a large magnitude of impact which supports the hypothesis that high serum estradiol levels increases mammographic density with both statistical and biological significance.
Gene expression in breast carcinomas according to serum estradiol levels The expression of genes found to be differentially expressed in normal breast tissue according to serum estradiol levels was examined in breast carcinomas. We found that the expression was all opposite of that in normal breast tissue from women with high serum estrogen (Table 1). This may be due to lack of negative feedback of growth regulation in breast tumors. In breast cancer cell lines, estrogen induced up-regulation of positive proliferation regulators and down-regulation of anti-proliferative and pro-apoptotic genes, resulting in a net positive proliferative drive [45]. This is in line with our findings. In normal breast tissue from women with high serum estradiol, SCGB3A1,which regulate proliferation negatively, and TLN2, which prevents invasion, are up-regulated. PTGS1, which induce local production of estradiol-stimulated proliferation, is down-regulated. All three genes are expressed to maintain control and regulation of the epithelial cells. In breast cancers the expression of these genes favors growth, migration and proliferation. This supports the hypothesis that high serum estradiol increases the proliferative pressure in normal breasts, which leads to an activation of mechanisms counter-acting this proliferative pressure. In carcinomas, growth regulation is lost, and these hormone-related growth-promoting mechanisms are turned on simultaneously.
Interestingly, both AREG and GREB1 were up-regulated in ER+ breast carcinomas of younger (<45 years) compared with older (>70 years) women in a previous publication. The increased expression of these genes was proposed as a mechanism responsible for the observed increase in proliferation seen in the tumors of younger compared with older women [46]
The genes differentially expressed according to serum estradiol levels in tumors confirmed many of the findings from the Dunbier-study of ER+ tumors [10]. The previously published list of genes positively correlated with serum estradiol included three TFF-genes and GREB1. These genes were also found significant in the analysis of all tumors in this study, although TFF1 and TFF3 did not reach statistical significance (Table 4). In addition to the previously published genes, we identified the gene AREG, an EGFR-ligand essential for breast development, as up-regulated in tumors from patients with high serum estradiol.
GREB1 is previously found to be an important estrogen-induced stimulator of growth in ER+ breast cancer cell lines[47]. AREG binds to and stimulates EGFR and hence epithelial cell growth. The up-regulation of these two genes in breast carcinomas of women with high estradiol levels may indicate a loss of regulation of growth associated with cancer development. This corresponds well with the interpretation our findings in normal breast tissue referred above and confirms the results indicated by the cell line studies by Frasor and colleagues [45]. These two genes are not differentially expressed

13
between normal breast tissue and breast cancers. Both are, however, higher expressed in ER+ than ER- breast carcinomas.
Overall strengths and limitations of the study The currently used method for detection of serum estradiol has a limited sensitivity in the lower serum levels often seen in postmenopausal women. Despite the limited sample size we found several biologically plausible associations. However, due to limited power, there may be other associations that we could not reveal. We have included women with and without hormone therapy in the study. There may be differences in action between endogenous and exogenous estradiol that will not be revealed in this study.
One important strength of this study is the unique material with normal human tissue in its natural mileu, not influenced by an adjacent tumor[48-50] or by an adipose-dominated biology that may bias the study of reduction mammoplasties.
ConclusionIn conclusion we report a list of genes whose gene expression is associated with serum estradiol levels. This list includes genes with known relation to estradiol-signaling, mammary proliferation and breast carcinogenesis. All these genes were expressed differently in tumor and normal breast tissue. The gene expression in tumors resembled that in normal breast tissue from women with low serum estradiol. Associations between serum estradiol and the expression in breast carcinomas confirmed previous findings and revealed new associations. The comparison of results between normal breast tissue from healthy women and breast carcinomas indicate the difference in biological impact of estradiol in normal and cancerous breast tissue.
AbbreviationsER: Estrogen receptor. SCGB3A1: Secretoglobin 3A1, HIN1: High in normal 1, TLN2:Talin 2. PTGS1: prostaglandin-endoperoxide synthase 1. COX1: cyclooxygenase 1. AREG: Amphiregulin. GREB1: Growth regulation by estrogen in breast cancer 1. TFF:Trefoil factor. GATA3: GATA binding protein 3. MDG: Mammographic density and genetics. AHUS: Akershus University Hospital. UNC: University of North Carolina. MCF-7: Michigan Cancer Foundation – 7.
Competing interests The authors declared no competing interests.
Authors’ contributions The trial was designed by ALBD, ÅH, GU, MMH and VNK. ALBD and ÅH ensured funding. MMH, IKB, MR, MAT and VDH assisted in data collection. TB was responsible for serum hormone analyses. VDH and TL contributed to the laboratory work. GU estimated mammographic density. VDH did statistical analyses of the data. ÅH, ALBD and VDH interpreted the results and wrote the paper. All authors were involved in reviewing the report. No medical writers were involved in this paper.

14
Acknowledgments This study was funded primarily by The Research Council of Norway and South-Eastern Norway Regional Health Authority. We thank all the women who participated in the study and all the personnel in the hospitals who made the inclusion of these women possible, in particular the responsible radiologists: Jan Ole Frantzen, Linda Romundstad, Dina Navjord, Einar Vigeland, Rolf O Næss and Else Berit Velken. We would also like to thank Lars Ottestad for help in the initiation of the project and Hilde Johnsen and Caroline Jevanord Frøyland for lab assistance.
15
Reference List
1. Russo J, Russo IH: Development of the human breast. Maturitas 2004, 49:2-15.
2. Burger H: The Menopausal Transition�ÇöEndocrinology. Journal of Sexual Medicine 2008, 5:2266-2273.
3. Zhang HZ, Bennett JM, Smith KT, Sunil N, Haslam SZ: Estrogen mediates mammary epithelial cell proliferation in serum-free culture indirectly via mammary stroma-derived hepatocyte growth factor. Endocrinology 2002, 143:3427-3434.
4. Key TJ: Serum oestradiol and breast cancer risk. Endocr Relat Cancer 1999, 6:175-180.
5. Cavalieri EL, Stack DE, Devanesan PD, Todorovic R, Dwivedy I, Higginbotham S, Johansson SL, Patil KD, Gross ML, Gooden JK et al.: Molecular origin of cancer: catechol estrogen-3,4-quinones as endogenous tumor initiators. ProcNatl Acad Sci U S A 1997, 94:10937-10942.
6. Hankinson SE: Endogenous hormones and risk of breast cancer in postmenopausal women. Breast Dis 2005, 24:3-15.
7. Tuma R: Mimicking pregnancy to reduce breast cancer risk. J Natl Cancer Inst 2010, 102:517-518.
8. Clarke RB, Howell A, Potten CS, Anderson E: Dissociation between steroid receptor expression and cell proliferation in the human breast. Cancer Res1997, 57:4987-4991.
9. Saji S, Sakaguchi H, Andersson S, Warner M, Gustafsson J: Quantitativeanalysis of estrogen receptor proteins in rat mammary gland. Endocrinology2001, 142:3177-3186.
10. Dunbier AK, Anderson H, Ghazoui Z, Folkerd EJ, A'hern R, Crowder RJ, Hoog J, Smith IE, Osin P, Nerurkar A et al.: Relationship between plasma estradiol levels and estrogen-responsive gene expression in estrogen receptor-positive breast cancer in postmenopausal women. J Clin Oncol 2010, 28:1161-1167.
11. Duan R, Xie W, Li X, McDougal A, Safe S: Estrogen regulation of c-fos gene expression through phosphatidylinositol-3-kinase-dependent activation of serum response factor in MCF-7 breast cancer cells. Biochem Biophys Res Commun 2002, 294:384-394.

16
12. Yusuf R, Frenkel K: Morphologic transformation of human breast epithelial cells MCF-10A: dependence on an oxidative microenvironment and estrogen/epidermal growth factor receptors. Cancer Cell Int 2010, 10:30.
13. Kristensen VN, Sorlie T, Geisler J, Yoshimura N, Linegjaerde OC, Glad I, Frigessi A, Harada N, Lonning PE, Borresen-Dale AL: Effects of anastrozole on the intratumoral gene expression in locally advanced breast cancer. J Steroid Biochem Mol Biol 2005, 95:105-111.
14. Geisler J, Detre S, Berntsen H, Ottestad L, Lindtjorn B, Dowsett M, Einstein LP: Influence of neoadjuvant anastrozole (Arimidex) on intratumoral estrogen levels and proliferation markers in patients with locally advanced breast cancer. Clin Cancer Res 2001, 7:1230-1236.
15. Haynes BP, Straume AH, Geisler J, A'hern R, Helle H, Smith IE, Lonning PE, Dowsett M: Intratumoral estrogen disposition in breast cancer. Clin Cancer Res 2010, 16:1790-1801.
16. Lonning PE, Helle H, Duong NK, Ekse D, Aas T, Geisler J: Tissue estradiol is selectively elevated in receptor positive breast cancers while tumour estrone is reduced independent of receptor status. J Steroid Biochem Mol Biol 2009, 117:31-41.
17. Wilson CL, Sims AH, Howell A, Miller CJ, Clarke RB: Effects of oestrogen on gene expression in epithelium and stroma of normal human breast tissue.Endocr Relat Cancer 2006, 13:617-628.
18. Haakensen VD, Biong M, Lingjaerde OC, Holmen MM, Frantzen JO, Chen Y, Navjord D, Romundstad L, Luders T, Bukholm IK et al.: Expression levels of uridine 5'-diphospho-glucuronosyltransferase genes in breast tissue from healthy women are associated with mammographic density. Breast Cancer Res 2010, 12:R65.
19. Muggerud AA, Hallett M, Johnsen H, Kleivi K, Zhou W, Tahmasebpoor S, Amini RM, Botling J, Borresen-Dale AL, Sorlie T et al.: Molecular diversity in ductal carcinoma in situ (DCIS) and early invasive breast cancer. Mol Oncol 2010, 4:357-368.
20. Stanford Microarray Database [http://genome-www5.stanford.edu//]
21. R library impute.knn[http://rss.acs.unt.edu/Rdoc/library/impute/html/impute.knn.html]
22. Ursin G, Astrahan MA, Salane M, Parisky YR, Pearce JG, Daniels JR, Pike MC, Spicer DV: The detection of changes in mammographic densities. CancerEpidemiol Biomarkers Prev 1998, 7:43-47.

17
23. Tusher VG, Tibshirani R, Chu G: Significance analysis of microarrays applied to the ionizing radiation response. Proc Natl Acad Sci U S A 2001, 98:5116-5121.
24. Significance Analysis of Microarrays [http://www-stat.stanford.edu/~tibs/SAM/]
25. DAVID Bioinformatics Resources 6.7 [http://david.abcc.ncifcrf.gov/]
26. Sorlie T, Perou CM, Tibshirani R, Aas T, Geisler S, Johnsen H, Hastie T, Eisen MB, van de RM, Jeffrey SS et al.: Gene expression patterns of breast carcinomas distinguish tumor subclasses with clinical implications. Proc Natl Acad Sci U S A 2001, 98:10869-10874.
27. Cheng G, Li Y, Omoto Y, Wang Y, Berg T, Nord M, Vihko P, Warner M, Piao YS, Gustafsson JA: Differential regulation of estrogen receptor (ER)alpha and ERbeta in primate mammary gland. J Clin Endocrinol Metab 2005, 90:435-444.
28. Krop IE, Sgroi D, Porter DA, Lunetta KL, LeVangie R, Seth P, Kaelin CM, Rhei E, Bosenberg M, Schnitt S et al.: HIN-1, a putative cytokine highly expressed in normal but not cancerous mammary epithelial cells. Proc Natl Acad Sci U S A 2001, 98:9796-9801.
29. Krop I, Parker MT, Bloushtain-Qimron N, Porter D, Gelman R, Sasaki H, Maurer M, Terry MB, Parsons R, Polyak K: HIN-1, an inhibitor of cell growth, invasion, and AKT activation. Cancer Res 2005, 65:9659-9669.
30. Park SY, Kwon HJ, Lee HE, Ryu HS, Kim SW, Kim JH, Kim IA, Jung N, Cho NY, Kang GH: Promoter CpG island hypermethylation during breast cancer progression. Virchows Arch 2010.
31. Krop I, Player A, Tablante A, Taylor-Parker M, Lahti-Domenici J, Fukuoka J, Batra SK, Papadopoulos N, Richards WG, Sugarbaker DJ et al.: Frequent HIN-1 promoter methylation and lack of expression in multiple human tumor types.Mol Cancer Res 2004, 2:489-494.
32. Krop I, Maguire P, Lahti-Domenici J, Lodeiro G, Richardson A, Johannsdottir HK, Nevanlinna H, Borg A, Gelman R, Barkardottir RB et al.: Lack of HIN-1 methylation in BRCA1-linked and "BRCA1-like" breast tumors. Cancer Res2003, 63:2024-2027.
33. Vasilatos SN, Broadwater G, Barry WT, Baker JC, Jr., Lem S, Dietze EC, Bean GR, Bryson AD, Pilie PG, Goldenberg V et al.: CpG island tumor suppressor promoter methylation in non-BRCA-associated early mammary carcinogenesis. Cancer Epidemiol Biomarkers Prev 2009, 18:901-914.

18
34. Moulder SL: Does the PI3K Pathway Play a Role in Basal Breast Cancer?Clin Breast Cancer 2010, 10:S66-S71.
35. Zhao Y, Agarwal VR, Mendelson CR, Simpson ER: Estrogen biosynthesis proximal to a breast tumor is stimulated by PGE2 via cyclic AMP, leading to activation of promoter II of the CYP19 (aromatase) gene. Endocrinology1996, 137:5739-5742.
36. Kino Y, Kojima F, Kiguchi K, Igarashi R, Ishizuka B, Kawai S: ProstaglandinE2 production in ovarian cancer cell lines is regulated by cyclooxygenase-1, not cyclooxygenase-2. Prostaglandins Leukot Essent Fatty Acids 2005, 73:103-111.
37. Daikoku T, Wang D, Tranguch S, Morrow JD, Orsulic S, DuBois RN, Dey SK: Cyclooxygenase-1 is a potential target for prevention and treatment of ovarian epithelial cancer. Cancer Res 2005, 65:3735-3744.
38. Chulada PC, Thompson MB, Mahler JF, Doyle CM, Gaul BW, Lee C, Tiano HF, Morham SG, Smithies O, Langenbach R: Genetic disruption of Ptgs-1, as well as Ptgs-2, reduces intestinal tumorigenesis in Min mice. Cancer Res 2000, 60:4705-4708.
39. Frank B, Hoffmeister M, Klopp N, Llig T, Chang-Claude J, Brenner H: Polymorphisms in inflammatory pathway genes and their association with colorectal cancer risk. Int J Cancer 2010.
40. Androulidaki A, Dermitzaki E, Venihaki M, Karagianni E, Rassouli O, Andreakou E, Stournaras C, Margioris AN, Tsatsanis C: Corticotropin Releasing Factor promotes breast cancer cell motility and invasiveness. MolCancer 2009, 8:30.
41. Hwang D, Scollard D, Byrne J, Levine E: Expression of cyclooxygenase-1 and cyclooxygenase-2 in human breast cancer. J Natl Cancer Inst 1998, 90:455-460.
42. Debrand E, El JY, Spence L, Bate N, Praekelt U, Pritchard CA, Monkley SJ, Critchley DR: Talin 2 is a large and complex gene encoding multiple transcripts and protein isoforms. FEBS J 2009, 276:1610-1628.
43. Conti FJ, Monkley SJ, Wood MR, Critchley DR, Muller U: Talin 1 and 2 are required for myoblast fusion, sarcomere assembly and the maintenance of myotendinous junctions. Development 2009, 136:3597-3606.
44. Demura M, Martin RM, Shozu M, Sebastian S, Takayama K, Hsu WT, Schultz RA, Neely K, Bryant M, Mendonca BB et al.: Regional rearrangements in chromosome 15q21 cause formation of cryptic promoters for the CYP19 (aromatase) gene. Hum Mol Genet 2007, 16:2529-2541.

19
45. Frasor J, Danes JM, Komm B, Chang KC, Lyttle CR, Katzenellenbogen BS: Profiling of estrogen up- and down-regulated gene expression in human breast cancer cells: insights into gene networks and pathways underlying estrogenic control of proliferation and cell phenotype. Endocrinology 2003, 144:4562-4574.
46. Yau C, Fedele V, Roydasgupta R, Fridlyand J, Hubbard A, Gray JW, Chew K, Dairkee SH, Moore DH, Schittulli F et al.: Aging impacts transcriptomes but not genomes of hormone-dependent breast cancers. Breast Cancer Res 2007, 9:R59.
47. Rae JM, Johnson MD, Scheys JO, Cordero KE, Larios JM, Lippman ME: GREB1 is a critical regulator of hormone dependent breast cancer growth. BreastCancer Res Treat 2005, 92:141-149.
48. Heaphy C, Griffith J, Bisoffi M: Mammary field cancerization: molecular evidence and clinical importance. Breast Cancer Research and Treatment 2009, 118:229-239.
49. Graham K, de las MA, Tripathi A, King C, Kavanah M, Mendez J, Stone M, Slama J, Miller M, Antoine G et al.: Gene expression in histologically normal epithelium from breast cancer patients and from cancer-free prophylactic mastectomy patients shares a similar profile. Br J Cancer 2010, 102:1284-1293.
50. Troester MA, Lee MH, Carter M, Fan C, Cowan DW, Perez ER, Pirone JR, Perou CM, Jerry DJ, Schneider SS: Activation of host wound responses in breast cancer microenvironment. Clin Cancer Res 2009, 15:7020-7028.

20
Table 1 Genes significantly differentially expressed in normal breast tissue of healthy women according to serum estradiol. A) Q-values and regulation of gene expression from quantitative SAM analysis of gene expression according to serum estradiol. B) Significance testing of difference in gene expression of the genes identified in A) in different sample cohorts.
�� Gene�Name� SCGB3A1� SLITRK4� TLN2� DCLK1� RSPO1� PTGS1�Chromosomal�location�of�the�gene� 5q35.3� Xq27.3� 15q15�q21 13q13� 1p34.3� 9q32�q33.3�
q�value�(%)�SAM�1)� 0� 0� 0� 0� 0� 0�
Gene�expression�in�high�s�est2)���
A�
(compared�with�low�s�est)� up� up� up� up� up� down�
B� BC3)�vs�normal�breast�tissue�(p�value)4)� 5.00E�15� 1.50E�03� 2.60E�04� 6.00E�04� 4.90E�12� 0.02�� Gene�expression�n�BC3)�� (compared�with�normal�tissue)� down� down� down� down� down� up�
� Normal�tissue�vs�ER+�BC5)�4)�� 2.20E�13� 0.01� 1.30E�03� 4.20E�03� 3.30E�12� 0.05�� Gene�expression�in�ER+�BC��� (compared�with�normal�tissue)� down� down� down� down� down� up�
� Normal�tissue�vs�ER��BC6)�4)�� 1.10E�04� 0.03� 0.01� 0.01� 0.02� 0.05�� Gene�expression�in�ER��BC�� (compared�with�normal�tissue)� down� down� down� down� down� up�
� DCIS�vs�invasive�BC3)�4)� 0.04� 0.12� 0.01� 0.66� 0.24� 0.001�� Gene�expression�in�invasive��� (compared�with�DCIS)� down� �� up� �� �� up�
1) Q�value�from�SAM�of�gene�expression�in�normal�breast�tissue�according�to�serum�estradiol�2) s�est�=�serum�estradiol3) BC�=�breast�cancer4) P-value from two-sided t-test 5) ER+�BC�=�estrogen�recepor�positive�breast�cancer�(n=53)6) ER��BC�=�estrogen�recepor�negative�breast�cancer�(n=8)

21
Table 2 Genes independently associated with serum estradiol in a linear regression modell. All genes differentially expressed according to serum estradiol (Table 1) were included. Values shown are corrected for age, menopause and current hormone therapy. After leave-one-out stepwise selection the following covariates remained: Covariate� Estimate1)� Std�error� p�value�SCGB3A1� 0.068� 0.025� 0.009�TLN2� 0.142� 0.061� 0.024�PTGS1� �0.145� 0.066� 0.030�SLITRK4� 0.086� 0.075� 0.252)�RSPO1� 0.045� 0.045� 0.322)�DCLK1� 0.023� 0.063� 0.712)�
1) Estimate denotes the beta-value corresponding to each covariate in the regression equation.
2) Values for the non-significant genes are from the last model before they were excluded.
Table 3 Serum hormones independently associated with mammographic density in linear regression models. Values shown are corrected for age, HT and BMI. Through leave-one-out stepwise elimination of covariates, prolactin, SHBG and testosterone were excluded and the following variables remained. �� Absolute�density� Percent�density��Covariate� Estimate1)� p�value� Estimate� p�value�Parity� �8.18� 0.01� �� ��Serum�estradiol� 95.55� 7.1E�05� 51.31� 9.3E�03�
1) Estimate denotes the beta-value corresponding to each covariate in the regression equation.

22
Table 4 Genes significantly differentially expressed according to serum estradiol levels in breast carcinomas. A) Quantitativ SAM analysis for differential expression according to serum estradiol with q-values and direction of regulation indicated. B) Significance testing of difference in gene expression of the genes identified in A) in different sample cohorts.�� Gene�Name� AREG� GREB1� TFF3� TFF3� TFF1�A� Chromosomal�location�� 4q13�21� 2p25.1� 21q22.3� 21q22.3� 21q22.3�
� q�value�(%)�SAM�all�tumors1)� 0� 0� 20.5� 20.5� 20.5�
� Gene�expression�in�high�s�est��
� (compared�with�low�s�est)�2)� up� up� up� up� up�
� q�value�(%)�SAM�ER+�BC1)3)� 0� 0� ��� �� ��� Gene�expression�in�high�s�est��
�� (compared�with�low�s�est)�2)� up� up� �� �� ��
B� BC4)�vs�normal�breast�tissue5� 0.38� 0.18� 4.80E�05� 2.60E�04� 1.20E�07�
� Gene�expression�in�BC�4)�� (compared�with�normal)� ��� ���� up� up� up�
� ER+�vs�ER��BC4)�5� 0.08� 4.80E�08� 2.00E�06� 2.40E�07� 0.002�� Gene�expression�in�ER+�BC��
�� (compared�with�ER��BC6))� up� up� up� up� up�1) Q�value�from�SAM�of�gene�expression�according�to�serum�estradiol�2) Gene�expression�in�samples�from�patients�with�high�compared�with�low�serum�estradiol�3) ER+�BC�=�Estrogen�receptor�positive�breast�cancer�(n=53)4) BC�=�breast�cancer5) P-value from two-sided t-test 6) ER��BC�=�Estrogen�receptor�negative�breast�cancer�(n=8)

Figure 1 Simplified illustration of the cellular mechanisms of SCGB3A1. SCGB3A1 inhibits the phosphorylation of Akt leading to reduced cell cycle division and increased apoptosis. Molecules in red are increased/stimulated as result of SCGB3A1-action, whereas molecules in blue are decreased/inhibited.
Figure 2 Schematic illustration of mechanism of PTGS1. PTGS1 induces PGE2-production. PGE2 increases the expression of aromatase (CYP19A1) which in turn converts androgens to estrogens in adipose tissue. 17�HSD1= 17bhydroxysteroid dehydrogenase.

Supplementary tables and figures
Table S1: Criteria for estimation of menopausal status.
FSH>20 LH>15 FSH>LHs-est1)
<0.1menopausal status criteria
1 1 1 1 post1 1 1 0 post s-est<0.31 1 1 0 peri s-est>0.31 0 1 1 post1 1 0 0 peri s-est>0.3 without HT2)
1 1 0 0 post s-est <0.3 or HT 1 0 1 0 post s-est >0.3 without HT 1 0 1 0 peri s-est <0.3 or HT 0 0 1 1 peri FSH>15 0 0 1 1 pre FSH<150 1 0 0 pre Age>50=peri0 0 1 0 peri s-est <0.3 0 0 1 0 pre s-est >0.3 0 0 0 0 preAny Any Any Any post/peri HT-use
1) serum estradiol 2) HT: hormone therapy
Table S2: Genes differentially expressed according to serum estradiol in breast carciomas and their expression in normal breast tissue
�� AREG� GREB1� TFF3� TFF3� TFF1�Agilent�ID� A_23_P259071� A_23_P329768� A_23_P257296� A_23_P393099� A_24_P322771p�value��(normal�vs�tumor)1) 0.38� 0.18� 4.8E�05� 2.6E�04� 1.2E�07�Mean�normal� �0.35� �1.29� 1.45� 1.44� �2.76�Mean�tumor� �0.61� �1.02� 2.74� 2.65� �1.13�p�value�(ER+�vs�ER�)1) 0.08� 4.8E�08� 2.0E�06� 2.4E�07� 2.3E�03�Mean�ER+�tumors�(n=53)� �0.44� �0.60� 3.21� 3.19� �0.81�Mean�ER��tumors�(n=8)� �1.54� �3.17� �0.17� �0.51� �3.32�q�value�(%)�SAM2)�� 52.9� 28.4� 52.9� 39.5� 75.3�1) Two-sided t-test 2) Q-value for genes up-regulated in samples from women with high serum estradiol (SAM
on samples from normal breast tissue according to serum estradiol).

Table S3: Genes differentially expressed according to estradiol treatment in Wilson et al and according to serum estradiol in the current study Genes�differentially�expressed�between�
mice�treated�and�not�treated�with�estradiol�in�Wilson�et�al,�2006�
Quantitativ�SAM�according�to�serum�estradiol�levels�in�the�current�study.�Gene�
expression�in�high�serum�estradiol.�
Symbol�
gene�experession�in�estradiol�treated�mice�
Normal�breast�tisssue��
Breast�carcinomas�
ER+�breast�carcinomas�
TFF1� up� up� up� ����MYBPC1� up� up� ���� ����AREG� up� up� up� up�SCGB2D2� up� ���� ���� ����TFF3� up� up� up� ����SCGB2A2� up� ���� ���� ����GREB1� up� up� up� up�SERPINA1� up� up� ���� ����C1orf34� up� up� ���� ����PIP� up� ���� down� down�AGR2� up� ���� ���� down�SERPINA3� up� up� ���� ����PRR4� up� ���� ���� ����HBE1� up� ���� ���� ����EEF1A2� up� ���� ���� ����DSU� up� ���� ���� ����MYB�� up� ���� ���� ����AZGP1� up� ���� ���� down�TACSTD1� up� ���� ���� down�KRT19� up� ���� down� down�CELSR2� up� ���� ���� ����FXYD3� up� ���� ���� ����XBP1� up� ���� ���� down�PRG4� up� ���� down� down�MMP� up� ���� ���� ����MMP12� down� ���� down� down�ME1� down� up� down� down�CXCL11� down� ���� ���� ����COL6A� down� ���� ���� ����CXCL11� down� ���� ���� ����GATA3� down� down� ���� ����HSPG2� down� ���� ���� ����CCl2� down� ���� down� down�EMILIN� down� ���� ���� ����CXCL10� down� ���� ���� ����

Tabls�S3�cont���Genes�differentially�expressed�between�
mice�treated�and�not�treated�with�estradiol�in�Wilson�et�al,�2006�
�Quantitativ�SAM�according�to�serum�
estradiol�levels.�Gene�expression�in�high�serum�estradiol����
Symbol�gene�expression�in�treated�mice�
Normal�breast�tisssue��
Breast�cancers�
ER+�breast�cancers�
RARRES1� down� up� down� ����S100A8� down� ���� down� down�IGJ� down� up� ���� ����CXCL9� down� ���� down� down�FN1� down� ���� ���� ����DPT� down� ���� down� ����RGS5� down� ���� down� down�CCL19� down� ���� down� down�DPT� down� ���� down� ����TPSAB1� down� ���� ���� ����CSPG2� down� up� ���� ����ENPEP� down� ���� ���� ����SERPINH1� down� up� ���� ����RGS5� down� ���� down� down�IL8� down� ���� ���� ����IGHA1� down� ���� down� ����BGN� down� ���� ���� ����

Paper IV Identification of SNP markers with putative influence on mammographic density and breast cancer risk
