biology teaching assistants inquiry-based training …...inquiry-based training improves teaching...
TRANSCRIPT

Inquiry-based training improves teaching effectiveness ofbiology teaching assistantsP. William Hughes1,2*, Michelle R. Ellefson2
1 Department of Biology, Carleton University, Ottawa, Ontario, Canada, 2 Faculty of Education, University of Cambridge, Cambridge, United Kingdom
Abstract
Graduate teaching assistants (GTAs) are used extensively as undergraduate science lab instructors at universities,yet they often have having minimal instructional training and little is known about effective training methods. Thisblind randomized control trial study assessed the impact of two training regimens on GTA teaching effectiveness.GTAs teaching undergraduate biology labs (n = 52) completed five hours of training in either inquiry-based learningpedagogy or general instructional “best practices”. GTA teaching effectiveness was evaluated using: (1) a nine-factorstudent evaluation of educational quality; (2) a six-factor questionnaire for student learning; and (3) course grades.Ratings from both GTAs and undergraduates indicated that indicated that the inquiry-based learning pedagogytraining has a positive effect on GTA teaching effectiveness.
Citation: Hughes PW, Ellefson MR (2013) Inquiry-based training improves teaching effectiveness of biology teaching assistants . PLoS ONE 8(10):e78540. doi:10.1371/journal.pone.0078540
Editor: Manuel João Costa, University of Minho, Portugal
Received May 24, 2013; Accepted September 20, 2013; Published October 11, 2013
Copyright: © 2013 Huges, Ellefson. This is an open-access article distributed under the terms of the Creative Commons Attribution License, which permitsunrestricted use, distribution, and reproduction in any medium, provided the original author and source are credited.
Funding: This project was supported by a grant from the Opportunities for Innovation Fund, awarded by the Higher Education Quality Council of Ontario(HEQCO grant OIFM-004-12-13; Funding Body URL: www.heqco.ca). The funders had no role in study design, data collection and analysis, decision topublish, or preparation of the manuscript.
Competing interests: The authors have declared that no competing interests exist.
* E-mail: [email protected]
Introduction
Graduate teaching assistant (GTA)-run introductory sciencecourses are the norm at higher education institutions in NorthAmerica, Australia and New Zealand, and are becoming moreprevalent elsewhere [1]. GTAs are part-time employees (oftenresearch students) hired to lead lab sessions, grade papers,and provide assistance to course instructors, and account formany of the contact hours undergraduates have with thedepartment. GTAs have a powerful influence on undergraduatestudent learning, but not without cost [2,3]. Graduate studentsgain income and teaching experience, and sciencedepartments gain a pool of inexpensive laborers versed indiscipline-specific content, but because GTA teaching can beinconsistent, and students find it difficult to learn frominexperienced teachers, ensuring that undergraduates receivehigh-quality teaching from GTAs is one of the main teachingissues facing science departments [4–7].
One solution includes general teaching training for GTAs, butthe effectiveness of this training is mixed [2–4,8,9]. The trainingcontent is not standardized, as it is for schoolteachers, andattendance is not compulsory. A 1997 survey of 153 biologydepartments in the United States indicated that 49% of GTAprograms required no formal training whatsoever [10]. Forthose programs that do require formalized GTA training, theform that training takes can vary widely, from university-wide
mass orientation workshops to subject-based instruction frominstructors, supervisors or peers [4]. Content might be asimportant as format – a 2004 study cited the lack of adequatepreparation for facilitating open inquiry labs as a major difficultyboth for undergraduate students and the GTAs themselves [5].
Well-constructed science lab activities are powerful learningtools; through guided inquiry, undergraduates gain first-personexperience of scientific principles and phenomena learned inlectures, and learn to employ experimental methods to solvediscrete problems [11]. As such, training that exposes GTAs tothe inquiry process may improve teaching effectiveness.Common misperceptions about undergraduate labs include: (a)that the purpose of lab activity is to recapitulate content learnedthrough lectures or from readings; or (b) that the purpose is tofamiliarize students with cutting-edge experimental techniques.Such objections ignore what is unique about the lab experience– the opportunity to practice applying the scientific method.Many introductory labs deliberately use older, highlypredictable experimental setups to teach students basicscientific inquiry skills.
Inquiry-based learning is a pedagogical approach rooted inconstructivist learning theories that advocates teachingcognitive skills through open-ended exploration by the learner([12,13]). Inquiry activities commonly include designingprotocols, developing procedures and proposing unifiedexplanations for experimental or anecdotal phenomena.
PLOS ONE | www.plosone.org 1 October 2013 | Volume 8 | Issue 10 | e78540

Structured-inquiry activities, which are commonly used asundergraduate lab exercises, typically ask students to proposespecific explanations, rooted in relevant course content, fordata gathered from experimental trials [14,15]. Teaching“facts”, “knowledge” or “content” is only the secondary objectiveof such activities: the main goal is to develop the reasoningskills that are required to plan, execute and interpret scientificexperiments.
Successful inquiry-oriented initiatives such as POGIL(Process Oriented Guided Inquiry Learning) emphasize thecoordination of content and methodological skills duringscience learning activities [16–18], but implementing large-scale reorganization of teaching materials and curricularcontent calls for substantial investment in time and money, andmay be beyond the capability of many course instructors.Moreover, reorienting major introductory course lecture contenttoward inquiry learning is a considerable effort, and requiresdepartmental consensus to implement effectively. The currentstudy investigated whether it is possible to increase learningeffectiveness in an inquiry-based activity without taking onlarge-scale curricular redesign.
Previous studies have suggested that training GTAs on theuse of inquiry-based methods will improve GTA teachingeffectiveness in undergraduate labs [19,20]. Although fewempirical studies have identified which kinds of GTA trainingcontent actually improve general lab GTA teachingeffectiveness, and none have specifically focused on inquiry-based methods, some authors have used correlational data ormade general recommendations regarding GTA teaching[7,13,21]. Inquiry-based methods may be of particular value toGTAs teaching introductory labs, since labs are designed toteach scientific enquiry as well as course content [22–24].
Here, our aim was to test whether grounding GTA training ininquiry-based learning theory would measurably improveteaching effectiveness in undergraduate biology labs, asassessed by undergraduate and GTA responses to onlinequestionnaires, as well as standardized student grades. Wepredict that explaining inquiry-based methods would improvelab GTA teaching performance, although it might also bereasonable to argue that the limited time allotted might bebetter spent if allocated to practical teaching activities ratherthan theoretical ones because GTA training is extremely brief(typically less than five hours per year). In order to test thishypothesis, we conducted a semi-randomized control trial tocompare two training regimens for GTAs of introductory biologylabs: a control regimen that is taught various “best practices”associated with lab teaching; and an experimental regimen thatexplained inquiry-oriented pedagogy to GTAs.
Methods
i) ParticipantsThis study took place during the first semester of the
academic year at a large research-intensive North Americanuniversity with about 25,000 students. Of a total number of 126GTAs, 54 GTAs volunteered to take part in the study and metthe study inclusion criteria. Each of these GTAs was employedas a GTA in a single lab section of an introductory biology
course in the Fall 2012 semester, and was a graduate studentregistered in an MSc or PhD programme in the Department ofBiology during the same semester. An online pre-assignmentquestionnaire recorded experience and program data for eachGTA two weeks before the onset of the training. On the basisof the data collected in this questionnaire, participants weredivided into two groups based on academic program (Mastersor PhD). GTAs were allocated to either a “best practice”(Control) or inquiry-based learning pedagogy (Inquiry) traininggroup. This allocation was semi-random; the proportion ofGTAs in either academic program was held constant betweentraining groups to balance the experimental design and avoid aconfounding factor of academic program, but was otherwiserandom. Two participants from the control group discontinuedthe study after the first training session; 52 GTAs finished thetraining sessions (24 control and 28 inquiry GTAs) and all ofthese 52 participants completed an online survey conducted atthe end of the semester.
GTAs were blind to their training group assignment and werenot given specific details about the experimental design.Details about their lab section were collected during the traininggroup workshops and from the online survey. This informationallowed for pre-training responses to be matched with latersurvey responses as well as matching undergraduate studentsto their lab section GTA while protecting participantconfidentiality.
Undergraduate students were recruited to rate their GTAsthrough advertisement posters, email invitations, and socialmedia announcements. Undergraduates were told that GTAswere part of a training experiment, and were part of more thanone GTA training group, but were not told: (a) what the traininggroups were, or (b) which training group their GTA had beenallocated to. A total of 602 undergraduates providedresponses, with 352 (58.5%) completing the entire onlinesurvey. Approximately 1,250 undergraduate students wereenrolled in undergraduate biology during this semester. AllGTA lab groups were represented by at least oneundergraduate.
At the end of the academic semester, all 16 courseprofessors were contacted by email and notified of the natureof the training experiment (i.e. that GTA training was beingmanipulated in a controlled experiment – although the traininggroups, training regimens and the GTAs involved were notrevealed), then asked to provide average course grades.Average course marks for 49 of the 52 sections taught byGTAs taking part in the experiment were collected.
ii) Training WorkshopsThe general format of the training for both groups was the
same and the same instructor taught all sessions. Each traininggroup attended a pair of workshops; each workshop lasted 2.5hours for a total of 5 hours of training. The two workshops wereheld one week apart. The first workshop was oriented towardteaching and the second was oriented toward grading. Allworkshops involved a mix of PowerPoint® slides, groupdiscussions, peer-led problem-solving sessions and question-and-answer sessions. Both training groups included the samecore topics. The first session included information on: lecturing,
Inquiry-Based Training Boosts Biology TA Teaching
PLOS ONE | www.plosone.org 2 October 2013 | Volume 8 | Issue 10 | e78540

moderating group discussions, facilitating lab activities,diagnosing problems in student understanding, giving effectiveprelab talks, dealing with student questions, and encouraging/motivating students in the lab. The second session includedmaterial related to marking: grading lab reports, providinguseful feedback, rubric design, and speed grading tips.
Because our aim was to investigate whether inquirypedagogy training improved GTA teaching effectiveness, thetraining groups mainly differed in terms of whether inquiry-based learning was explained as a theory of learning to beused in the science lab. Content for both GTA training groupswas drawn from previous recommendations [9,25,26] and wascommon between the two training groups.
The areas of teaching focus for the control (“best practices”)training group seminars were: (1) to identify effective andefficient strategies for GTAs to teach content knowledge toundergraduates during lab activities; and (2) to ensure that labactivity assessments were marked fairly. In general, thematerial taught to this group was designed to reflect the statusquo GTA training curriculum at North American universities,and so “best practices” identified in GTA training materials oreducational studies were provided to GTAs [26–28]. Thetraining group focused on specific teaching practices of theGTAs themselves rather than explaining how to teach scientificenquiry; because many of the “best practices” for GTAs relatedto the teaching of content knowledge (i.e. “tips for teachingundergraduate students to use a light microscope”) rather thanthe scientific method, this training group did not explicitly teachGTAs how to teach higher-order cognitive skills. A full list of theactivities that took place in the two control training groupseminars (teaching and assessment) is given in Tables 1 and2.
For the inquiry pedagogy training group, teaching andgrading were presented from a constructivist perspective:learning objectives were explained using the revised Bloom’staxonomy, scaffolding and inquiry facilitation were explained asteaching methods that help students learn methodologicalskills, and giving feedback was oriented toward encouragingfurther inquiry [13,20,21,29–33]. The areas of teaching focusfor the inquiry pedagogy training group seminars were: (1) toteach GTAs how inquiry-based practices teach students toreason independently and apply the scientific method; (2) toteach GTAs how to facilitate structured inquiry and open-endedlearning as lab activities; and (3) to teach GTAs how to assessinquiry. Instead of teaching GTAs to teach undergraduates howto use a light microscope, GTAs were told instead how tofacilitate and evaluate student-centered inquiry with respect tousing a light microscope to ask scientific questions. A full list ofthe activities that took place in the two inquiry-based learningpedagogy training group seminars (teaching and assessment)is given in Tables 3 and 4.
The common two-seminar format meant that both traininggroups used the same peer-led learning activities. Forexample, GTAs of both training groups paired up to spend timepracticing answering common student questions – but thesetook different forms based on the learning goals of therespective training group. For example, GTAs in the controltraining group practiced answering questions about lab protocol
by answering common questions about the relevant section ofthe lab manual. GTAs in the inquiry pedagogy training grouppracticed answering questions about lab protocol by learning todesign questions to help students figure out the next steps inthe protocol for themselves. Extensive efforts were made toensure the consistency and reliability of the workshops for bothtraining groups. GTAs in both training groups were instructednot to discuss the content of their GTA training sessions withone another or with undergraduates.
iii) MeasuresWe assessed teaching effectiveness for the GTAs in the two
training groups using three measures: (a) a 32-item, nine-factorstudent evaluation of educational quality (SEEQ) [34–36]; (b) a6-item cognitive learning evaluation (CLE) questionnaire; and(c) standardized mean student grade.
a) Student Evaluation of Educational Quality. TheStudent Evaluation of Educational Quality (SEEQ) inventory isa nine-factor, 32-item validated survey instrument that hasbeen widely used to evaluate undergraduate instruction atNorth American universities. The original SEEQ inventory [34]was written to appraise course instructors, but for this study wemodified it to evaluate GTAs by simple modifications of the text(see Table 5). Nine identifiable dimensions of teaching qualitycan be evaluated using SEEQ: (1) learning/academic value; (2)
Table 1. Teaching Seminar Activity Chart for Control GTATraining Group.
ItemTimeAllocated Activity
Desired LearningOutcome Teaching Method
1 30 minGTA GeneralOrientation
- understanding therole of GTAs
Instructor lecture(Powerpoint)
2 15 minBrainstormingActivity: LaboratoryLearning Outcomes
- identification ofdeterminants of lablearning success
Student-led smallgroups, answersshared with classand discussed
3 45 minLab teaching bestpractices
- understanding ofevidence-basedmethods for teachingeffectively
Instructor lecture(Powerpoint)
- understandingspecific teaching skills,learning styles andlearning outcomes
4 30 min
Mini-microteachingActivity - SampleLab Scenarios (lightmicroscope)
- understanding of howto apply best practiceteaching techniques inlab activity situations
Microteaching,large groupactivity
5 15 minTroubleshootinginquiry-learningactivities
- how to handleunexpected problemsin lab activities
Instructor lecture(Powerpoint)
6 15 min Questions- clear up unresolvedquestions
Student-ledquestion andanswer
doi: 10.1371/journal.pone.0078540.t001
Inquiry-Based Training Boosts Biology TA Teaching
PLOS ONE | www.plosone.org 3 October 2013 | Volume 8 | Issue 10 | e78540

instructor enthusiasm; (3) organization; (4) group interaction;(5) individual rapport; (6) breadth of coverage; (7) examinationand grading; (8) assignments; and (9) overall instructionalability.
We used the first eight factors from Marsh’s original SEEQinventory to create two SEEQ instruments (available from theoriginal papers [28,30]). We changed Factor 9 from its original(1982) version. Marsh’s 1982 version of the SEEQ inventorydid not use “overall instructional ability” but rather “coursedifficulty” as the ninth SEEQ factor [34,36]. GTAs do not havecontrol over course difficulty because they do not design thecourse. As such, we opted to use a newer version of SEEQdeveloped by the University of Saskatchewan, which includes“overall instructional ability” as factor 9. After thesemodifications, two SEEQ instruments were created: one wasused by GTAs for self-evaluation, and the other byundergraduates to rate their GTA (see Table 5 for examples)
Table 2. Assessment Seminar Activity Chart for ControlGTA Training Group.
ItemTimeAllocated Activity
Desired LearningOutcome
TeachingMethod
1 30 minHistory andPurpose ofAssessment
- understanding of role ofassessment in thelearning process
Lecture(Powerpoint)
2 15 min
BrainstormingActivity:LaboratoryAssessmentMethods
- GTA identification ofpurpose of assessment inlabs; criteria determiningsuccessful assessmentmethods for labs
Student-led smallgroups, answersshared with classand discussed
3 30 minGrading BestPractices
- understanding ofevidence-based methodsfor grading effectively
Instructor Lecture(Powerpoint)
- understanding specificgrading requirements forin-lab and lab reportactivities
4 45 minSmall GroupRubric Design
- how rubrics areinterpreted
Student-led smallgroups, answersshared with classand discussed
- understanding rubricinclusion criteria
- understanding howfeedback is different in-lab versus on lab reports
5 15 minHow to GradeEquitably andQuickly
- how to maintain gradingconsistency
Instructor Lecture(Powerpoint)
- how to grade labfeedback quickly
6 15 min Questions- clear up unresolvedquestions
Student-ledquestion andanswer
doi: 10.1371/journal.pone.0078540.t002
SEEQ responses were given using a five-point Likert scaleand scored as: “strongly disagree” = 1; “disagree” = 2;“neutral”= 3; “agree”= 4; and “strongly agree”= 5. Whenparticipants selected “not applicable”, then that question wasgiven a null value and excluded from further analyses.
b) Cognitive Learning Evaluation. The cognitive learningevaluation (CLE) instrument is a short six-factor questionnaireevaluating individual learning outcomes derived from Bloom’srevised taxonomy of learning [37]. The six factors assessedwere: (1) knowledge; (2) comprehension; (3) problem-solving;(4) conceptual-analytic; (5) planning; and (6) evaluation (Table6). Factors occur in a hierarchical order of increasing learningdepth and difficulty of instruction that assumed that higherfactors represent more in-depth learning. Each CLE factor wasassessed by a single item. Responses were collected using afive-point Likert scale and scored as: “strongly disagree”= 1;“disagree” = 2; “neutral”= 3; “agree”= 4; and “strongly agree”=5. When participants selected “not applicable”, then thatquestion was given a null value and excluded from furtheranalyses.
c) Grades. Undergraduates self-reported their final gradesfor the course. Final grades reflected contributions from bothlab and lecture components, although GTAs graded only labassignments. Grading frameworks differed amongst course
Table 3. Teaching Seminar Activity Chart for Inquiry-basedLearning Pedagogy GTA Training Group.
ItemTimeAllocated Activity
Desired LearningOutcome
TeachingMethod
1 30 minGTA GeneralOrientation
- understanding the roleof GTAs
Instructor lecture(Powerpoint)
2 15 minBrainstormingActivity: LaboratoryLearning Outcomes
- identification ofdeterminants of lablearning success
Student-ledsmall groups,answers sharedwith class anddiscussed
3 45 minIntroduction toInquiry-basedLearning
- understanding of theRevised Bloom’sTaxonomy of learning
Instructor lecture(Powerpoint)
- how scientific enquiryis taught using inquiry
- understanding offacilitation as a teachingmethod
4 30 min
FacilitationSituation Activity -Sample LabScenarios
- understanding of howto apply facilitationtechniques in teachingsituations
Large groupactivity
5 15 minTroubleshootinginquiry-learningactivities
- how to handleunexpected problems ininquiry-based labactivities
Instructor lecture(Powerpoint)
6 15 min Questions- clear up unresolvedquestions
Student-ledquestion andanswer session
doi: 10.1371/journal.pone.0078540.t003
Inquiry-Based Training Boosts Biology TA Teaching
PLOS ONE | www.plosone.org 4 October 2013 | Volume 8 | Issue 10 | e78540

professors, with the lab component accounting for 25-50% ofthe final grade. Final exams were the largest single othercontribution to final grades, ranging 30-75% of the final gradeand usually included multiple-choice, objectively gradedquestions (i.e., by Scantron). The objective nature of the finalcourse grades should mitigate the likelihood that GTA gradingstandards differed between training groups (influenced by aHawthorne effect), or that common examinations and syllabiwere not used by course professors.
Reported final grades fell on the 12-point GPA (grade pointaverage) scale used by the university where this study tookplace. Using this scale, student work is graded by percentilescore (0-100%), which is linked to a corresponding letter andGPA grade (e.g., 90-100% = A+ or 12.0; GPA 73-76.9% = B or8.0 GPA; 60-62.9% = C- or 4.0 GPA; 53-56.9% = D or 2.0GPA). Global course mean GPA values were collected fromcourse professors, and grades were standardized by
Table 4. Assessment Seminar Activity Chart for Inquiry-based Learning Pedagogy GTA Training Group.
ItemTimeAllocated Activity
Desired LearningOutcome
TeachingMethod
1 30 minHistory andPurpose ofAssessment
- understanding the roleof assessment in thelearning process
Instructor lecture(Powerpoint)
2 15 min
BrainstormingActivity:LaboratoryassessmentMethods
- identification of: (1)purpose of assessment inlabs; (2) criteriadetermining successfulassessment methods forlabs
Student-led smallgroups, answersshared with classand discussed
3 30 minHow to AssessScientific Inquiry
- understanding of thedistinction betweenlower- and higher-ordercognitive skills
Instructor lecture(Powerpoint)
- understanding how touse assessment tolls togive feedback oncognitive skilldevelopment
4 15 minAssessmentRubric Examples
- how rubrics areinterpreted
Student-ledquestion andanswer
5 45 minSmall GroupRubric Design
- how rubrics areinterpreted
Student-led smallgroups, answersshared with classand discussed
- understanding rubricinclusion criteria
- understanding howfeedback can assessdifferent cognitive skills
6 15 min Questions- clear up unresolvedquestions
Student-ledquestion andanswer
doi: 10.1371/journal.pone.0078540.t004
subtracting course mean GPA scores (calculated by averagingundergraduate self-reported grades per course) from individualGTA lab group GPA scores. The resulting standardized gradesranged from 3.7 to -3.1, and represented how much better (i.e.,positive values) or worse (i.e., negative values) a given GTAlab group mean grade was than the average grade for anygroup in that course (in terms of GPA). Standardized gradeswere used instead of raw grades to account for the variationbetween courses, professors and lab material.
iv) ProceduresGTAs completed the pre-assignment questionnaires during
the first week of a 13-week university semester. Trainingsessions were held on the third and fifth weeks of that samesemester.
The SEEQ, CLE, and other demographic measures werecollected from GTAs and undergraduates using a 116-itemonline survey hosted by Qualtrics Inc. The surveys for GTAsand undergraduate students were nearly identical, with onlyminor modifications relevant to the their roles. (e.g., referencesto “me (the GTA)” for the GTA survey were “my GTA” in theundergraduate survey). GTAs completed the surveys near theend of the semester. Approximately 7 weeks elapsed betweenthe first GTA training session and the completion of the survey.Undergraduates were surveyed during a 45-day periodbeginning on the last day of exams for that semester. Datafrom course professors were collected during this same 45-dayperiod.
v) AnalysesA pretest logistic regression of program distribution indicated
that there were no significant differences in the ratio of Mastersto PhD students between training groups (R2= .0003, χ2
1,1 =0.02, p = .895). A similar pretest one-way ANOVA showed nosignificant difference in GTA experience (in years of teaching)between the two training groups (F(1,50) = 0.01, p= .933).Shapiro-Wilks tests indicated that all of the dependentvariables were normally distributed.
For the SEEQ and CLE questionnaires, we ran multivariateanalyses because the responses were composed of multiplenon-independent subscales. Responses for these instrumentswere analyzed using a 2x2 between-subjects MANCOVA, andfollow-up ANCOVA tests were performed where themultivariate response was significantly predicted by traininggroup (similar to the analyses suggested in other studies[38,39]. For follow-up tests, Type I error was controlled forusing a Bonferroni-corrected alpha value (e.g., the SEEQinventory had 9 factors, so we used α = .0056). We ranseparate MANCOVAs for GTA self-evaluation (n = 52 for bothSEEQ and CLE) and for undergraduate evaluation (n = 47 forSEEQ, n = 50 for CLE). Two independent variables wereincluded in our MANCOVAs: training group (control or inquiry)and GTA academic program (Masters or PhD), while previousGTA experience (in years of teaching) was included as acovariate. The dependent variables were all of the nine SEEQand six CLE factors. GTA self-responses are analyzed as rawratings. Undergraduate responses were pooled for each GTAlab section and analyzed as a mean rating for each GTA. We
Inquiry-Based Training Boosts Biology TA Teaching
PLOS ONE | www.plosone.org 5 October 2013 | Volume 8 | Issue 10 | e78540

assessed significance of training group as a multivariate effectusing the Pillai’s Trace statistic, since Pillai’s Trace is themultivariate measure which is both: (1) most robust tomultivariate non-normality; and (2) conservative when thesample size is small (<100) [40].
We ran each MANCOVA without the covariate (i.e., as aMANOVA) to see if the significance levels of any multivariate orunivariate effects depended on its inclusion. These analysesindicated that this was not the case, and as such, we thereforepresent only the MANCOVA results here.
To analyze grade data, we used a two-factor ANCOVA (n =49) to examine standardized grade scores, again with traininggroup (control or inquiry) and GTA academic program (Mastersor PhD) as independent variables and GTA experience (inyears of teaching) as a covariate. Again, the analysis was re-run without the covariate (i.e., as an ANOVA) and the overallfindings were consistent with the ANCOVA results. As such,only the ANCOVA results are reported here.
All statistical analyses were performed using SPSS 20.Effect sizes are reported using partial η2 for multivariate testsand r for univariate tests. Partial η2 indicates the estimatedamount of the total variation in the response due to variation inan individual predictor [41].
vi) Research EthicsThis study was examined and approved by the Carleton
University Research Ethics Board (Project Number 13-0563).Written informed consent was obtained from all humansubjects – both GTA participants and undergraduate surveyrespondents – involved in this study. Subjects were specificallyinformed that: (1) they were under no obligation to continuetheir participation in the research project; (2) that there were noknown risks associated with participation; and (3) no identifyinginformation would be collected, responses would be keptanonymous, and results would be reported only in aggregate.
Results
a) Student Evaluation of Educational Quality ResultsThere was not a significant effect of the covariate - GTA
experience (in years) - on the undergraduate responses to theSEEQ questionnaire (see Table 3 for a list of SEEQ Factors)(Pillai’s trace = 0.18, F(9,34) = 0.81, p = .61, partial η2 = 0.18,observed power = .33). There was a significant multivariatemain effect for training group, (Pillai’s trace = 0.51, F(9,34) =3.93, p = .002, partial η2 = 0.51, observed power = .98; Table7). However, there was neither a significant effect of GTA
Table 5. Student Evaluation of Educational Quality Factor Descriptions and Example Items.
SEEQ Factor ItemsDescription Sample Item
(1) Learning/Academic Value
4Refers to the feeling of achievement and academic success that students obtain from participation in acourse. High instructor ratings indicate that the instructor is successfully imparting useful information tostudents, and helping them feel that what they have learned is worthwhile and challenging.
“Through my GTA, I have learnedand understood the subject materialsin this course”
(2) InstructorEnthusiasm
4Refers to the instructor’s ability to created attentiveness and interest in the educational material onbehalf of the student. High instructor ratings indicate that the instructor is creating engagement throughdynamic presentation, and relating course material in a way that evokes interest.
“My GTA was energized anddynamic in conducting the course”
(3) Organization 4Refers to the structure and transparency of the instructor’s explanation of subject matter. Highinstructor ratings indicate that the instructor is relating information clearly and precisely, in a way that iseasy for students to understand.
“GTA explanations were clear”
(4) Group Interaction 4Refers to the ability to foster academically useful social interactions within the classroom. Highinstructor ratings indicate that the instructor is encouraging group work in a positive way, and ismotivating students to share knowledge effectively.
“Students were invited to expresstheir own ideas and/or question theGTA”
(5) IndividualRapport
4Refers to the capacity to engage personally with individual learners and provide academicallysignificant help and encouragement. High instructor ratings indicate that the instructor is able to relateto students on a personal level and provide meaningful guidance.
“My GTA had a genuine interest inindividual students”
(6) Breadth ofCoverage
4Refers to the ability to explain and compare alternative ideas, theories and techniques in a way thathighlights essential features. High instructor ratings indicate that the instructor is able to relateknowledge to students effectively through contrasting specific ideas.
“My GTA contrasted the implicationsof various theories”
(7) Examination andGrading
3Refers to the ability to provide fair and useful evaluative feedback. High instructor ratings indicate thatthe instructor equitably assesses student work and provides meaningful correction to students.
“My GTA’s feedback onexaminations/graded materials wasvaluable”
(8) Assignments 2Refers to the ability to create or use assignments to relate material to students. High instructor ratingsindicate that the instructor is capable of designing or implementing assessments in such a way thatnew subject matter is taught or that errors are corrected.
“Readings/texts/referencessuggested by my GTA werevaluable”
(9) OverallInstructional Ability
2 A general evaluation of teaching effectiveness.“Overall, my GTA was a goodteacher”
Note: sample items shown refer to the undergraduate survey; GTA survey contained the same items, but replaced “my GTA” with “I” (e.g., “Overall, I am a good teacher”).Items were rated on a five-point Likert scale (strongly disagree, disagree, neutral, agree, strongly agree) with a “NA/Don’t Know” null response included.doi: 10.1371/journal.pone.0078540.t005
Inquiry-Based Training Boosts Biology TA Teaching
PLOS ONE | www.plosone.org 6 October 2013 | Volume 8 | Issue 10 | e78540

academic program (Pillai’s trace = 0.16, F(9,34) = 0.70, p = .71,partial η2 = 0.16, observed power = .28) nor a significantinteraction between training group and GTA academic program(Pillai’s trace = 0.29, F(9,34) = 1.57, p = .16, partial η2 = 0.29,observed power = .63).
For the undergraduate responses, there were significantunivariate main effects for training group (using a Bonferroni-corrected α = .0056) on six of the nine SEEQ factors: learning(SEEQ Factor 1), F(1,42) = 26.47, p < .0005, r = .62;enthusiasm (SEEQ Factor 2), F(1,42) = 10.30, p < .003, r = .44;organization (SEEQ Factor 3), F(1,42) = 12.09, p < .001, r = .47; rapport (SEEQ Factor 5), F(1,42) = 14.47, p < .0005, r = .51; assignments (SEEQ Factor 7), F(1,42) = 25.79, p < .0005, r= .62; and overall instructional ability (SEEQ Factor 9), F(1,42)= 18.64, p < .0005, r = .55 (Figure 1, Table 8). A follow-upMANOVA revealed no difference in the significance level of anymultivariate or univariate effects.
There was not a significant effect of GTA experience (inyears) on the GTA responses to the SEEQ questions (Pillai’strace = 0.22, F(9,39) = 1.22, p = .31, partial η2 = 0.22, observed
Table 6. Cognitive Learning Evaluation Factor Descriptionsand Example Items.
CLE Factor Abstract Example Concrete Example Item
(1) KnowledgeRecallinginformation
Learning exactmolecular weightsfrom the periodictable
“My GTA helped melearn knowledgeskills.”
(2)Comprehension
Comparing orcontrasting twoideas
Learning to restatea word problemusing equations
“My GTA helped melearncomprehensionskills.”
(3) Application/Problem-solving
Applyingknowledge to finda solution to aspecific question
Learning to selectthe appropriatestatistical test foran analysis
“My GTA helped melearn problem-solving skills.”
(4) ConceptualAnalysis
Determiningcauses andidentifyingrelationships
Learning totroubleshoot a labprotocol
“My GTA helped melearn conceptual-analytic skills.”
(5) Planning
Creating astrategy by usingideas in a newway
Learning to designa new lab protocolusing firstprinciples
“My GTA helped melearn planningskills.”
(6) Evaluation
Using criticalreasoning tomake specificjudgments aboutideas
Learning to identifythe most relevanttheoreticalapproach to designa set ofexperiments
“My GTA helped melearn evaluationskills.”
Note: sample items shown refer to undergraduate survey; GTA survey containedthe same items, but replaced “my GTA” with “I” and “me” with “undergraduatestudents” (e.g., “I helped undergraduate students learn problem-solving skills”).Items were rated on a five-point Likert scale (strongly disagree, disagree, neutral,agree, strongly agree) with a “NA/Don’t Know” null response included.doi: 10.1371/journal.pone.0078540.t006
power = .51). There was a significant multivariate main effectfor training group, (Pillai’s trace = 0.38, F(9,39) = 1.68, p = .017, partial η2 = 0.38, observed power = .89; Table 9).However, there was neither a significant main effect of GTAacademic program (Pillai’s trace = 0.15, F(9,39) = 0.74, p = .67,partial η2 = 0.15, observed power = .31) nor a significantinteraction between training group and GTA academic program(Pillai’s trace = 0.22, F(9,39) = 1.19, p = .33, partial η2 = 0.22,observed power = .50).
For the GTA responses, there were significant univariatemain effects for training group (using a Bonferroni-corrected α= .0056) for three of the nine SEEQ factors: learning (SEEQFactor 1), F(1,47) = 11.86, p < .001, r = .45; group interaction(SEEQ Factor 4), F(1,47) = 11.86, p < .001, r = .48; and overallinstructional ability (SEEQ Factor 9), F(1,47) = 15.34, p < .0005, r = .50 (Figure 1, Table 10). A follow-up MANOVArevealed no difference in the significance level of anymultivariate or univariate effects.
b) Cognitive Learning Evaluation ResultsThere was not a significant effect of GTA experience (in
years) on the undergraduate responses to the CLE questions(see Table 4 for a list of CLE Factors) (Pillai’s trace = 0.08,F(6,40) = 0.60, p = .73, partial η2 = 0.08, observed power = .21). There was a significant multivariate main effect for traininggroup, (Pillai’s trace = 0.41, F(6,40) = 4.71, p < .001, partial η2
= 0.41, observed power = .98; Table 11). However, there wasnot a significant effect for GTA academic program (Pillai’s trace= 0.03, F(6,40) = 0.17, p = .98, partial η2 = 0.03, observedpower = .09) or a significant interaction between training groupand program (Pillai’s trace = 0.03, F(6,40) = 0.22, p = .97,partial η2 = 0.03, observed power = .10).
For the undergraduate responses, there was a significantunivariate main effect for training group (using a Bonferroni-corrected α = .0083) for four of the six CLE factors, including:comprehension skills (CLE Factor 2), F(1,45) = 9.68, p < .003, r= .42; problem-solving/application skills (CLE Factor 3), F(1,45)= 9.76, p < .003, r = .42; synthesis skills (CLE Factor 5),F(1,45) = 11.22, p < .001, r = .48; and evaluation skills (CLEFactor 6), F(1,45) = 26.12, p < .0005, r = .61 (Figure 2, Table
Table 7. MANCOVA test results for undergraduate StudentEvaluation of Educational Quality evaluation ratings (n = 47,α = .05).
Effect / InteractionPillai'sTrace F df p partial η2power
GTA Experience (in yearsteaching)
0.18 0.81 9, 34 .609 0.18 .33
Training Group 0.51 3.93 9, 34 .002* 0.51 .98GTA Academic Program 0.16 0.70 9, 34 .705 0.16 .28Training Group × GTAAcademic Program
0.29 1.57 9, 34 .163 0.29 .63
*. p<.05, two-tailed.doi: 10.1371/journal.pone.0078540.t007
Inquiry-Based Training Boosts Biology TA Teaching
PLOS ONE | www.plosone.org 7 October 2013 | Volume 8 | Issue 10 | e78540
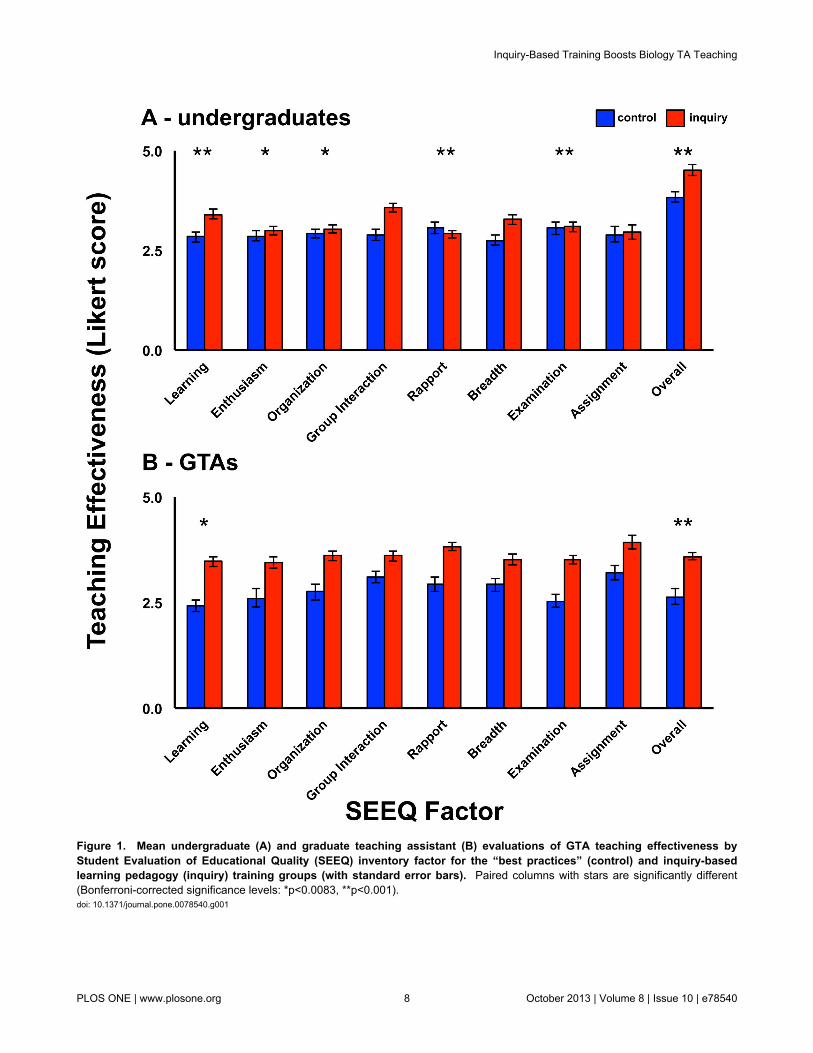
Figure 1. Mean undergraduate (A) and graduate teaching assistant (B) evaluations of GTA teaching effectiveness byStudent Evaluation of Educational Quality (SEEQ) inventory factor for the “best practices” (control) and inquiry-basedlearning pedagogy (inquiry) training groups (with standard error bars). Paired columns with stars are significantly different(Bonferroni-corrected significance levels: *p<0.0083, **p<0.001).doi: 10.1371/journal.pone.0078540.g001
Inquiry-Based Training Boosts Biology TA Teaching
PLOS ONE | www.plosone.org 8 October 2013 | Volume 8 | Issue 10 | e78540

12). A follow-up MANOVA revealed no difference in thesignificance level of any multivariate or univariate effects.
There was not a significant effect of GTA experience (inyears), on the GTA responses to the CLE questions (Pillai’strace = 0.14, F(6,42) = 1.14, p = .36, partial η2 = 0.14, observedpower = .40; Table 13). There was not a significant multivariatemain effect for training group, (Pillai’s trace = 0.19, F(6,42) =1.68, p = .15, partial η2 = 0.19, observed power = .57) or GTAacademic program (Pillai’s trace = 0.10, F(6,42) = 0.79, p = .58,partial η2 = 0.10, observed power = .28). In addition, there wasnot a significant interaction between training group andprogram (Pillai’s trace = 0.09, F(6,42) = 0.69, p = .66, partial η2
Table 8. ANCOVA test results for undergraduate StudentEvaluation of Educational Quality evaluation ratings (n = 47,α = .0056).
SEEQ Factor F df p rTrainingGroup Mean SE
(1) Learning 26.47 1, 42 <.001** .62 control 2.83 0.13 inquiry 3.41 0.12(2) InstructorEnthusiasm
10.30 1, 42 .003* .44 control 2.86 0.13
inquiry 3.00 0.11(3) Organization 12.09 1, 42 .001* .47 control 2.92 0.12 inquiry 3.04 0.11(4) Group Interaction 7.45 1, 42 .009 .39 control 2.89 0.14 inquiry 3.57 0.12(5) Individual Rapport 14.47 1, 42 <.001** .51 control 3.06 0.15 inquiry 2.91 0.10(6) Breadth of Coverage 6.81 1, 42 .013 .37 control 2.76 0.13 inquiry 3.28 0.13(7) Examination 25.79 1, 42 <.001** .62 control 3.06 0.16 inquiry 3.10 0.13(8) Assignments 5.86 1, 42 .020 .35 control 2.90 0.19 inquiry 2.96 0.19(9) Overall InstructionalAbility
18.64 1, 42 <.001** .55 control 3.84 0.14
inquiry 4.52 0.14
* p<.0056, two-tailed. ** p <.0001, two-tailed.doi: 10.1371/journal.pone.0078540.t008
Table 9. MANCOVA test results for GTA StudentEvaluation of Educational Quality ratings (n = 52, α = .05).
Effect / InteractionPillai'sTrace F df p partial η2power
GTA Experience (in yearsteaching)
0.22 1.22 9, 39 .312 0.22 .51
Training Group 0.38 2.65 9, 39 .017* 0.38 .89GTA Academic Program 0.15 0.74 9, 39 .670 0.15 .31Training Group × GTAAcademic Program
0.22 1.19 9, 39 .328 0.22 .50
*. p<.05, two-tailed.doi: 10.1371/journal.pone.0078540.t009
= 0.09, observed power = .24). Given these results, univariatetests were not performed (Figure 2, Table 14). A follow-upMANOVA revealed no difference in the significance level of anymultivariate or univariate effects.
c) GradesThere was a significant univariate main effect of training
group on undergraduate grades in their biology courses,F(1,44) = 26.31, p < .022, r = .34, but not for program, F(1,44)= 1.66, p = .56, r = .19 ,or an interaction between training groupand GTA academic program, F(1,44) = 0.53, p =.47, r = .11(Figure 3, Table 15).
Table 10. ANCOVA test results for GTA Student Evaluationof Educational Quality ratings (n = 52, α = .0056).
SEEQ Factor F df p rTrainingGroup Mean SE
(1) Learning 11.86 1, 47 .001* .45 control 2.42 0.14 inquiry 3.47 0.11(2) InstructorEnthusiasm
1.98 1, 47 .17 .20 control 2.61 0.21
inquiry 3.44 0.13(3) Organization 1.20 1, 47 .280 .16 control 2.75 0.19 inquiry 3.61 0.12(4) Group Interaction 14.04 1, 47 <.001** .48 control 3.09 0.14 inquiry 3.60 0.12(5) Individual Rapport 0.43 1, 47 .52 .10 control 2.94 0.18 inquiry 3.83 0.10(6) Breadth of Coverage 7.19 1, 47 .01 .36 control 2.92 0.16 inquiry 3.52 0.13(7) Examination 0.12 1, 47 .73 .05 control 2.54 0.16 inquiry 3.52 0.10(8) Assignments 0.01 1, 47 .91 .01 control 3.21 0.17 inquiry 3.94 0.17(9) Overall InstructionalAbility
15.34 1, 47 <.001** .50 control 2.63 0.19
inquiry 3.59 0.09
* p< .0056, two-tailed. ** p < .0001, two-tailed.doi: 10.1371/journal.pone.0078540.t010
Table 11. MANCOVA test results for undergraduateCognitive Learning Evaluation ratings (n = 50, α =.05).
Effect / InteractionPillai'sTrace F df p partial η2power
GTA Experience (in yearsteaching)
0.08 0.60 6, 40 .732 0.08 .21
Training Group 0.41 4.71 6, 40 .001* 0.41 .98GTA Academic Program 0.03 0.17 6, 40 .984 0.03 .09Training Group × GTAAcademic Program
0.03 0.22 6, 40 .968 0.03 .10
*. p<.05, two-tailed.doi: 10.1371/journal.pone.0078540.t011
Inquiry-Based Training Boosts Biology TA Teaching
PLOS ONE | www.plosone.org 9 October 2013 | Volume 8 | Issue 10 | e78540

Figure 2. Mean undergraduate (A) and graduate teaching assistant (B) evaluations of GTA teaching effectiveness byCognitive Learning Evaluation (CLE) questionnaire factor for the “best practices” (control) and inquiry-based learningpedagogy (inquiry) training groups (with standard error bars). Paired columns with stars are significantly different (Bonferroni-corrected significance levels: *p<0.0083, **p<0.001).doi: 10.1371/journal.pone.0078540.g002
Inquiry-Based Training Boosts Biology TA Teaching
PLOS ONE | www.plosone.org 10 October 2013 | Volume 8 | Issue 10 | e78540

Discussion
These results suggest that offering inquiry-orientedpedagogy GTA training can yield gains in academicperformance in undergraduate science labs and improve GTAteaching (as evaluated by both undergraduates and GTAs),particularly with respect to scientific reasoning. Inquirypedagogy training group GTAs outperformed control traininggroup GTAs, both with respect to SEEQ/CLE questionnairesand to self-reported undergraduate grades, and there were noitems on either survey in which control training group GTAsreceived significantly higher ratings than inquiry pedagogytraining group GTAs (this was true for both undergraduateevaluations and GTA self-evaluations).
From the student- and self-evaluation data, GTAs whocompleted the inquiry pedagogy training received higherratings than those in the control training group in two mainareas: enthusiasm and interpersonal skills, and organizationand academic value. This first result is fairly straightforward –the inquiry pedagogy training group was rated significantly
Table 12. ANCOVA test results for undergraduateCognitive Learning Evaluation ratings (n = 50, α =.0083).
CLE Factor F df p rTrainingGroup Mean SE
(1) Knowledge 5.37 1, 45 .025 .33 control 3.04 0.16 inquiry 3.54 0.11(2) Comprehension 9.68 1, 45 <.001** .42 control 2.88 0.18 inquiry 3.61 0.12(3) Application /Problem-solving
9.76 1, 45 <.001** .42 control 2.77 0.14
inquiry 3.47 0.13(4) Analysis 7.68 1, 45 .008* .38 control 2.95 0.17 inquiry 3.52 0.10(5) Synthesis 13.82 1, 45 <.001** .48 control 2.85 0.23 inquiry 3.82 0.12(6) Evaluation 26.12 1, 45 <.001** .61 control 2.63 0.17 inquiry 3.72 0.12
* p < .0083, two-tailed. ** p < .0001, two-tailed.doi: 10.1371/journal.pone.0078540.t012
Table 13. MANCOVA test results for GTA CognitiveLearning Evaluation ratings (n = 52, α = .05).
Effect / InteractionPillai'sTrace F df p partial η2power
GTA Experience (in yearsteaching)
0.14 1.14 6, 42 .359 0.14 .40
Training Group 0.19 1.68 6, 42 .149 0.19 .57GTA Academic Program 0.10 0.79 6, 42 .583 0.10 .28Training Group × GTAAcademic Program
0.09 0.69 6, 42 .660 0.09 .24
*p<.05, two-tailed.doi: 10.1371/journal.pone.0078540.t013
higher than control training group GTAs for enthusiasm (SEEQfactor 2) and individual rapport (SEEQ factor 5), both of whichare important skills in an interactive role such as a labfacilitator. The second result was that inquiry pedagogy traininggroup GTAs received higher student ratings for organization(SEEQ factor 3) and assignments (SEEQ factor 7), both areasof the lab in which the GTA has only partial control, suggestingimprovement in general teaching ability and planning skill.More specifically, undergraduates rated GTAs who completedthe inquiry pedagogy training higher than those who completedthe control training regimen for lower-order cognitive skills(e.g., SEEQ factor 1, CLE factors 2 and 3), higher-ordercognitive skills (CLE factors 5 and 6) and overall measures ofteaching ability (SEEQ factor 9). Taken together, these resultsindicate that GTAs who completed the inquiry pedagogytraining were rated as better organized, provided betterfeedback on assignments, and were better overall teachers ofboth higher- and lower-order skills than the control traininggroup GTAs.
We note that the differences between mean Likert scores forthe two treatments are small in some cases. Likert scores,which have a limited range given that only five responses arepossible (i.e. a score of 1-5), required consistently lower orhigher values to register as significantly differing from the valueof the other GTA training group. Since our analysis used afairly conservative Bonferroni correction to decrease thelikelihood of Type I errors, small but statistically significantdifferences between training groups for a specific SEEQ orCLE factor likely indicate improvements that are real but small.
Our results indicated that self-reported grade data confirmedthe advantage of inquiry pedagogy training, with the lab groupsof GTAs who completed the inquiry-based learning pedagogytraining reporting significantly higher standardized grades thanGTAs who completed the control training regimen. Theseresults suggest that undergraduate students in the lab sectionsof experimental group GTAs had higher overall course gradesthan did students in the lab sections of control training group
Table 14. ANCOVA test results for undergraduateCognitive Learning Evaluation ratings (n = 52, α =.0083).
CLE Factor F df p r Training GroupMean SE(1) Knowledge 0.75 1, 51 .39 .12 control 3.57 0.14 inquiry 3.49 0.10(2) Comprehension 0.15 1, 51 .71 .05 control 3.27 0.78 inquiry 3.40 0.42(3) Application / Problem-solving
1.07 1, 51 .31 .14 control 3.20 0.14
inquiry 3.42 0.12(4) Analysis 5.98 1, 51 .02 .32 control 3.13 0.14 inquiry 3.54 0.10(5) Synthesis 4.41 1, 51 .04 .28 control 2.95 0.22 inquiry 3.46 0.11(6) Evaluation 6.45 1, 51 .01 .34 control 2.76 0.27 inquiry 3.52 0.11
*p < .0083, two-tailed. ** p < .0001, two-tailed.doi: 10.1371/journal.pone.0078540.t014
Inquiry-Based Training Boosts Biology TA Teaching
PLOS ONE | www.plosone.org 11 October 2013 | Volume 8 | Issue 10 | e78540

GTAs. Because course grades include both a lab and a lecturecomponent, higher overall grades may not be due entirely toinfluence of lab GTA, although it may be that effective labteaching (from the GTA) may have additional in-lecture benefitsthat we did not quantify. Both training groups outperformed theaverage grade of the course, perhaps because some GTAs inthe course did not have any training whatsoever. The findingthat the grades of both GTA groups were higher than thecourse mean indicates that there might be some benefit to thecontrol “best practice” training. The best practice trainingfocused on practical skills and did use elements deemedsuccessful in other studies (5). This type of GTA training mightimprove the academic value of lab activities for undergraduatestudents, but that GTAs, who are not expert teachers, may notbe able to identify how or why.
We conclude that the recorded differences in(undergraduate- and GTA-rated) teaching ability betweeninquiry pedagogy training group GTAs and control traininggroup GTAs are due to the fact that inquiry pedagogy GTAtraining improves GTAs’ ability to facilitate guided-inquiryactivities related to scientific reasoning. While many methodscan be used to teach undergraduates content, structured-inquiry activities (i.e. labs) are specifically designed to askstudents to use higher-order cognitive skills as they employ thescientific method to solve problems. GTAs are evidently betterable to teach undergraduates to “reason like scientists” after
inquiry-based learning pedagogy training. We note thatstudents rated inquiry pedagogy training group GTAs as betterteachers of both the particular SEEQ factors related to inquiryfacilitation (including academic value, enthusiasm, groupinteraction and rapport) as well as higher-order cognitive skills(i.e. higher CLE factors). We suggest that inquiry pedagogytraining, which encourages GTAs to use active feedback as thelab activity is performed, has enabled inquiry GTAs to betterteach using guided inquiry.
There are several limitations related to this study. Firstly, oursample size was small (52 GTAs), and the trial had only twotraining groups. Second, although there was a highly significantpredictive relationship between training group and mean
Table 15. ANCOVA test results for standardized studentgrades (n = 49).
F df p rGTA Experience (in years teaching) 0.72 1,44 .407 0.11Training Group 0.90 1,44 .347 0.45GTA Academic Program 12.29 1,44 .001* 0.12Training Group × GTA Academic Program 0.05 1,44 .818 0.03
*. p<.05, two-tailed.doi: 10.1371/journal.pone.0078540.t015
Figure 3. Mean standardized grade differences (in 12-point CGPA) for the “best practices” (control) and inquiry-basedlearning pedagogy (inquiry) training groups (with standard error bars). doi: 10.1371/journal.pone.0078540.g003
Inquiry-Based Training Boosts Biology TA Teaching
PLOS ONE | www.plosone.org 12 October 2013 | Volume 8 | Issue 10 | e78540

standardized grade for GTA lab section, lab grades were onlypart of the total grade; it is therefore unclear to what degreethis treatment might predict improvement in student grades.Third, we note that we did not directly assess GTA teachingskills, and instead used student and GTA evaluations—alongwith self-reported student grades—to estimate actual GTAteaching ability. We also assume that the students whoparticipated in our survey were representative of the largerundergraduate population. Further study, on a larger scale, ofinquiry-based learning pedagogy training for science lab GTAsis our main recommendation for further studies. Although webelieve our conclusions are supported by the data collected, alarge, hierarchically-designed intervention experiment,involving a greater number of replicate training groups, wouldprovide a more powerful test of our hypothesis. Further study ofthe reason of the differences between undergraduate and GTAquestionnaire responses with respect to individual SEEQ andCLE factors might also be valuable; it is unclear whyundergraduates seem better able to identify differencesbetween training groups than the GTAs themselves.
Conclusion
In conclusion, our data indicate that providing GTAs with atheoretical understanding of the guided-inquiry methods that
underpin lab activities increases the quality of GTA teaching inintroductory science labs, especially in areas related toscientific reasoning. Across all measures, inquiry-basedlearning pedagogical training for GTAs seems to improveteaching, even when training is limited to only five hours. Webelieve that our data indicate that there is value in includinginformation on inquiry-oriented teaching methodologies infuture GTA training regimens, especially where those GTAsteach inquiry-oriented activities such as teaching labs.
Acknowledgements
The authors would like to thank the course professors, labcoordinators, graduate teaching assistants and undergraduatesurvey respondents that made this research possible.
Author Contributions
Conceived and designed the experiments: PWH MRE.Performed the experiments: PWH. Analyzed the data: PWHMRE. Contributed reagents/materials/analysis tools: PWH.Wrote the manuscript: PWH MRE.
References
1. Park C (2004) The graduate teaching assistant (GTA): lessons fromNorth American experience. Teach Higher Educ 9: 349–361. Available:http://www.tandfonline.com/doi/abs/10.1080/1356251042000216660.Accessed 11 February 2013. doi:10.1080/1356251042000216660.
2. Meyers S, Prieto L (2000) Training in the Teaching of Psychology: whatis done and examining the differences. Teach Psychol 27: 258–261.Available: http://www.tandfonline.com/doi/full/10.1207/S15328023TOP2704_03. Accessed 2013 April 8. doi:10.1207/S15328023TOP2704_03.
3. Prieto LR, Altmaier EM (1994) The relationship of prior training andprevious teaching experience to self-efficacy among graduate teachingassistants. Research in Higher Education 35: 481–497. Available:http://link.springer.com/10.1007/BF02496384. Accessed 2013 April 2.doi:10.1007/BF02496384.
4. Shannon D, Twale D, Moore M (1998) TA Teaching Effectiveness: theimpact of training and teaching experience. J Higher Educ 69: 440–466. Available: http://www.jstor.org/stable/10.2307/2649274. Accessed2013 March 3. doi:10.2307/2649274.
5. Luft JA, Kurdziel JP, Roehrig GH, Turner J (2004) Growing a gardenwithout water: Graduate teaching assistants in introductory sciencelaboratories at a doctoral/research university. J Res Sci Teach 41: 211–233. Available: http://doi.wiley.com/10.1002/tea.20004. Accessed 2013February 15. doi:10.1002/tea.20004.
6. Rodriques RAB, Bond-Robinson J (2006) Comparing Faculty andStudent Perspectives of Graduate Teaching Assistants’ Teaching. JChem Educ 83: 305. Available: http://pubs.acs.org/doi/abs/10.1021/ed083p305. Accessed 2013 March 6. doi:10.1021/ed083p305.
7. Kendall KD, Schussler EE (2012) Does instructor type matter?Undergraduate student perception of graduate teaching assistants andprofessors. CBE Life. Sci Educ 11: 187–199. Available: http://www.pubmedcentral.nih.gov/articlerender.fcgi?artid=3366904&tool=pmcentrez&rendertype=abstract. Accessed 2013March 7.
8. Koenig KM, Endorf RJ, Braun GA (2007) Effectiveness of differenttutorial recitation teaching methods and its implications for TA training.Phys Rev St Per 3: 10104. Available: http://link.aps.org/doi/10.1103/PhysRevSTPER.3.010104. Accessed 2013 February 27.
9. Hardré PL, Burris AO (2010) What contributes to teaching assistantdevelopment: differential responses to key design features. Instr Sci 40:93–118. Available: http://www.springerlink.com/index/10.1007/s11251-010-9163-0. Accessed 2013 February 15.
10. Rushin J, Saix J-D, Lumsden A, Streubel D, Summers G et al. (1997)Graduate Teaching Assistant Training: A Basis for Improvement ofCollege Biology Teaching & Faculty Development? Am Biol Teach 59:86–90. Available: http://www.jstor.org/stable/10.2307/4450255.Accessed 2013 February 15. doi:10.2307/4450255.
11. Rissing S, Cogan J (2009) Can an Inquiry Approach Improve CollegeStudent Learning in a Teaching Laboratory? CBE Life. Sci Educ 8: 55–61. Available: http://w.lifescied.org/content/8/1/55.short. Accessed 2013February 16.
12. Edelson DC, Gordin DN, Pea RD (1999) Addressing the challenges ofinquiry-based learning through technology and curriculum design. JLearn Sci 8: 391–450. doi:10.1080/10508406.1999.9672075.
13. Windschitl M (2003) Inquiry projects in science teacher education:What can investigative experiences reveal about teacher thinking andeventual classroom practice? Sci Educ 87: 112–143. Available: http://doi.wiley.com/10.1002/sce.10044. Accessed 2013 February 10. doi:10.1002/sce.10044.
14. Banchi H, Bell R (2008) The many levels of inquiry. Sci Child 46: 26–29.
15. Henige K (2011) Undergraduate student attitudes and perceptionstoward low- and high-level inquiry exercise physiology teachinglaboratory experiences. Adv Physiol Educ 35: 197–205. Available:http://www.ncbi.nlm.nih.gov/pubmed/21652505. Accessed 2013 March4. doi:10.1152/advan.00086.2010. PubMed: 21652505.
16. Farrell JJ, Moog RS, Spencer JN (1999) A Guided-Inquiry GeneralChemistry Course. J Chem Educ 76: 570. Available: http://pubs.acs.org/doi/abs/10.1021/ed076p570. Accessed 2013 April 2. doi:10.1021/ed076p570.
17. Schoffstall AM, Gaddis BA (2007) Incorporating Guided-InquiryLearning into the Organic Chemistry Laboratory. J Chem Educ 84: 848.Available: http://pubs.acs.org/doi/abs/10.1021/ed084p848. Accessed2013 April 2. doi:10.1021/ed084p848.
18. Iler H, Justice D (2012) Discovering 13C NMR, 1H NMR, and IRSpectroscopy in the General Chemistry Laboratory through aSequence of Guided-Inquiry Exercises. J Chem Educ 89: 1178–1182.Available: http://pubs.acs.org/doi/abs/10.1021/ed2005664. Accessed2013 March 7. doi:10.1021/ed2005664.
19. Bohrer K, Stegenga BD, Ferrier A (2007) Training and Mentoring TAsin Inquiry-Based Methods. Tested Studies for Laboratory Teaching.Proceedings of the 28th Workshop/Conference of the Association forBiology Laboratory Education 28. pp. 335–346.
Inquiry-Based Training Boosts Biology TA Teaching
PLOS ONE | www.plosone.org 13 October 2013 | Volume 8 | Issue 10 | e78540

20. Roehrig GH, Turner JA, Kurdziel JP, Luft JA (2003) Graduate TeachingAssistants and Inquiry-Based Instruction: Implications for GraduateTeaching Assistant Training. J Chem Educ 80: 1206. Available: http://pubs.acs.org/doi/abs/10.1021/ed080p1206. Accessed 2013 April 2. doi:10.1021/ed080p1206.
21. Apedoe X, Walker S, Reeves T (2006) Integrating inquiry-basedlearning into undergraduate geology. J Geosci Educ 54: 414–421.Available: http://citeseerx.ist.psu.edu/viewdoc/download?doi=10.1.1.117.1751&rep=rep1&type=pdf. Accessed 2013 March 4.
22. Weaver GC, Russell CB, Wink DJ (2008) Inquiry-based and research-based laboratory pedagogies in undergraduate science. Nat Chem Biol4: 577–580. Available: http://www.ncbi.nlm.nih.gov/pubmed/18800041.Accessed 2013 March 4. doi:10.1038/nchembio1008-577. PubMed:18800041.
23. Pickering M (1980) Are lab courses a waste of time? Chronlicle ofHigher Education 45: 80.
24. Vale RD, DeRisi J, Phillips R (2012) Graduate education.Interdisciplinary graduate training in teaching labs. Science 338: 1542–1543. Available: http://authors.library.caltech.edu/36473/. Accessed2013 February 27. doi:10.1126/science.1216570. PubMed: 23258877.
25. Marbach-Ad G, Schaefer KL, Kumi BC, Friedman la Thompson KV etal. (2012) Development and Evaluation of a Prep Course for ChemistryGraduate Teaching Assistants at a Research University. J Chem Educ89: 865–872. Available: http://pubs.acs.org/doi/abs/10.1021/ed200563b. Accessed 2013 April 2. doi:10.1021/ed200563b.
26. Lowman J, Mathie VA (1993) What Should Graduate TeachingAssistants know about Teaching? Teach Psychol 20: 84–88. doi:10.1207/s15328023top2002_4.
27. Wood WB (2009) Innovations in teaching undergraduate biology andwhy we need them. Annu Rev Cell Dev Biol 25: 93–112. Available:http://www.ncbi.nlm.nih.gov/pubmed/19575638. Accessed 2013 March4. doi:10.1146/annurev.cellbio.24.110707.175306. PubMed: 19575638.
28. Vale RD, DeRisi J, Phillips R, Mullins RD, Waterman C et al. (2012)Graduate education. Interdisciplinary graduate training in teaching labs.Science 338: 1542–1543. Available: http://www.ncbi.nlm.nih.gov/pubmed/23258877. Accessed 2013 February 14. doi:10.1126/science.1216570. PubMed: 23258877.
29. Luckie DB, Maleszewski JJ, Loznak SD, Krha M (2004) Infusion ofcollaborative inquiry throughout a biology curriculum increases studentlearning: a four-year study of "Teams and Streams" Adv Physiol Educ28: 199–209. Available: http://www.ncbi.nlm.nih.gov/pubmed/15545349.. doi:10.1152/advan.00025.2004 PubMed: 15545349
30. French D, Russell C (2002) Do Graduate Teaching Assistants Benefitfrom Teaching Inquiry-Based Laboratories? BioScience 52: 1036.Available: http://www.jstor.org/stable/1314349.
31. Hanauer DI, Jacobs-Sera D, Pedulla ML, Cresawn SG, Hendrix RW etal. (2006) Inquiry learning. Teaching scientific inquiry. Science 314:1880–1881. doi:10.1126/science.1136796. PubMed: 17185586.
32. Goldey ES, Abercrombie CL, Ivy TM, Kusher DI, Moeller JF, RaynerDA, Smith CF, Spivey NW (2012) Biological inquiry: a new course andassessment plan in response to the call to transform undergraduatebiology. CBE Life. Sci Educ 11: 353–363. Available: http://www.pubmedcentral.nih.gov/articlerender.fcgi?artid=3516791&tool=pmcentrez&rendertype=abstract. Accessed 2013March 4.
33. Wilke RR, Straits WJ (2005) Practical Advice for Teaching Inquiry-Based Science Process Skills in the Biological Sciences. Am BiolTeach 67: 534–540. Available: http://www.bioone.org/doi/abs/10.1662/0002-7685(2005)067[0534:PAFTIS]2.0.CO;2. Accessed 2013April 2. doi:10.1662/0002-7685(2005)067[0534:PAFTIS]2.0.CO;2.
34. Marsh HW (1982) SEEQ: a reliable, valid and useful instrument forcollecting students’ evaluations of university teaching. Br J EducPsychol 52: 77–95. doi:10.1111/j.2044-8279.1982.tb02505.x.
35. Coffey M, Gibbs G (2001) The Evaluation of the Student Evaluation ofEducational Quality Questionnaire (SEEQ) in UK Higher Education.Assess Eval HIGH Educ 26: 37–41. Available: http://www.tandfonline.com/doi/abs/10.1080/02602930020022318. Accessed2013 February 16.
36. Marsh H, Bailey M (1993) Multidimensional Students’ Evaluations ofTeaching Effectiveness: A Profile Analysis. J Higher Educ 64: 1–18.Available: http://www.jstor.org/stable/10.2307/2959975. Accessed 2013February 16. doi:10.2307/2959975.
37. Krathwohl DR (2002) A Revision of Bloom’s Taxonomy: An Overview.Theory into Practice 41: 212–218. Available: http://www.tandfonline.com/doi/abs/10.1207/s15430421tip4104_2. Accessed2013 April 3. doi:10.1207/s15430421tip4104_2.
38. Camodeca M, Goossens FA (2005) Children’s opinions on effective.Educ Res 47: 93–105. doi:10.1080/0013188042000337587.
39. Meyers LS, Gamst GC, Guarino AJ (2005) Applied MultivariateResearch: Design and Interpretation 6th Edition. London: SagePublications. 1104 pp.
40. Olson CL (1976) On choosing a test statistic in multivariate analysis ofvariance. Psychol Bull 83: 579–586. doi:10.1037/0033-2909.83.4.579.
41. Levine TR, Hullett CR (2002) Eta squared, partial eta squared, andmisreporting of effect size in communication research. Hum CommunRes 28: 612–625. doi:10.1111/j.1468-2958.2002.tb00828.x.
Inquiry-Based Training Boosts Biology TA Teaching
PLOS ONE | www.plosone.org 14 October 2013 | Volume 8 | Issue 10 | e78540