biomarkers of infection for the differential diagnosis of ... · uppe, a multivariate analysis...
TRANSCRIPT

Biomarkers of infection for the differential diagnosis
of pleural effusions
J. M. Porcel*, M. Vives+, G. Cao#, S. Bielsa*, A. Ruiz-González*, A.
Martínez-Iribarren# and A. Esquerda#
AFFILIATIONS
*Pleural Disease Unit, Department of Internal Medicine,
#Department of Laboratory Medicine, Arnau de Vilanova University Hospital,
IRBLLEIDA, Lleida, Spain.
+Service of Internal Medicine, Clinica Recoletas, Albacete, Spain.
CORRESPONDENCE
José M. Porcel, Dept of Internal Medicine, Arnau de Vilanova University
Hospital, Avda Alcalde Rovira Roure 80, 25198 Lleida, Spain.
Fax: 34 973 248754
E-mail: [email protected]
SUPPORT STATEMENT
This study was supported by a grant from the Instituto de Salud Carlos III (FIS
06/0725). Dr. Bielsa is a Research Fellow supported by a grant from the Fondo
de Investigación Sanitaria (FIS CM07/00020).
STATEMENT OF INTEREST
The authors have no conflicts of interest to disclose.
. Published on June 18, 2009 as doi: 10.1183/09031936.00197208ERJ Express
Copyright 2009 by the European Respiratory Society.

Short title: Infectious biomarkers in pleural effusions

ABSTRACT: We aimed to investigate whether pleural fluid concentrations
of biomarkers for bacterial infection, namely triggering receptor
expressed on myeloid cells (sTREM-1), procalcitonin (PCT),
lipopolysaccharide-binding protein (LBP) and C-reactive protein (CRP)
might identify infectious effusions and discriminate between complicated
(CPPE) and uncomplicated parapneumonic effusions (UPPE).
Stored pleural fluid samples from 308 patients with different causes of
pleural effusion were used to measure the four biomarkers. ROC analysis
determined the accuracy of the new tests.
Median pleural fluid levels of CRP, sTREM-1 and LBP were significantly
higher in CPPE compared with those in other etiologies. The AUC for
distinguishing infectious (parapneumonics and tuberculosis) from non-
infectious effusions was 0.87 for CRP, 0.86 for sTREM-1, 0.57 for PCT and
0.87 for LBP. Regarding the discrimination of non-purulent CPPE vs.
UPPE, a multivariate analysis found that pleural fluid glucose ≤ 60 mg/dL,
LBP ≥ 17 µg/mL and CRP ≥ 80 mg/L were the best parameters.
Individually, none of the new biomarkers achieved better performance
characteristics than pH, glucose or lactate dehydrogenase in labeling
CPPE.
In conclusion, elevated pleural fluid levels of CRP, sTREM and LBP
identify patients with infectious effusions, particularly those with CPPE.
PCT has no value for the differential diagnosis of pleural effusions.

KEY WORDS: C-reactive protein, empyema, lipopolysaccharide-binding
protein, pleural effusion, procalcitonin, triggering receptor expressed on
myeloid cells

Rapid and accurate diagnosis remains the major clinical challenge in patients
with suspected pleural infection. Since clinical data may be elusive,
measurement of biomarkers in pleural fluids might provide a reliable tool for
estimating the probability of an infection [1]. In addition, the search for
biomarkers of poor prognosis in parapneumonic effusions (PPE) is critical for
better identifying patients in which drainage of the pleural space is mandatory
[2].
In general, C-reactive protein (CRP) is considered the biomarker of choice to
detect an inflammatory state, whether or not it is triggered by an infection.
Newer circulating markers such as soluble triggering receptor expressed on
myeloid cells (sTREM-1), procalcitonin (PCT), and lipopolysaccharide binding
protein (LBP) seem to have a pivotal role in the inflammatory host response to
microbial infections [3,4]. Therefore, we hypothesized that when measured in
pleural fluid, they might be useful for diagnosing or ruling out infectious
effusions and for identifying complicated parapneumonic effusions (CPPE).
The aims of the present study were to measure the pleural fluid concentrations
of CRP, sTREM, PCT and LBP in patients with different causes of pleural
effusions and to explore their usefulness in both predicting an infectious
etiology and discriminating between subgroups of PPE.
METHODS
Study population
Since 1994, we have been prospectively maintaining a database on all patients
who undergo diagnostic thoracentesis at the Arnau de Vilanova University
Hospital (Lleida, Spain), as well as a pleural bank of fluid specimens that are
processed and stored at -80ºC. The indication for diagnostic thoracentesis was
the presence of a clinically significant pleural effusion of uncertain origin. In
patients submitted to more than one thoracentesis, during the hospitalization
period, only the results of the first tap were considered. Samples of pleural fluid
were immediately analyzed for routine biochemistries (e.g., pH, glucose, lactate
dehydrogenase –LDH-) while supernatants were frozen within 4 hours of
collection until the measurement of the biomarkers at the end of the study.
For the present study, 308 pleural fluid samples collected from 2004 to 2008
were randomly selected for biomarkers determination. Patients were classified
into 7 groups according to the cause of the pleural effusion: transudates (40
patients), malignant effusions (40 patients), tuberculous pleurisy (50 patients),
uncomplicated parapneumonics -UPPE- (60 patients), non-purulent CPPE (68
patients), empyemas (30 patients) and miscellaneous exudates (20 patients).
Primary tumors in malignant effusions were lung (14), breast (8), unknown
primary (6), lymphoma (4), ovary (3), gastrointestinal (3) and mesothelioma (2).
Among the miscellaneous exudates, there were 5 post-traumatic, 3 idiopathic, 3
post-coronary artery bypass surgery, 2 pericarditis, 2 pulmonary embolism, 2
abdominal abscess, 1 pancreatitis, 1 post-abdominal surgery and 1 systemic
lupus erythematosus.

The local Ethics Committee approved this study, and all patients gave informed
consent for the analysis of stored specimens for future research.
Diagnostic criteria
A pleural effusion was categorized as malignant if malignant cells were detected
on cytologic examination of the pleural fluid or biopsy specimen. Tuberculous
pleuritis was diagnosed if Löwenstein cultures of pleural fluid, sputum or pleural
biopsy tissue samples were positive (26 patients), a pleural biopsy specimen
showed granulomas in the parietal pleura (5 patients) or an exudative
lymphocytic effusion with high adenosine deaminase levels (> 40 U/L) cleared
in response to antituberculous therapy (19 patients). Transudates were
effusions secondary to heart failure (30 patients), cirrhosis (6 patients),
nephrotic syndrome (2 patients) or atelectasis (2 patients). PPEs referred to
those associated with bacterial pneumonia and were classified into three
groups: UPPE (resolution with antibiotic treatment alone), non-purulent CPPE
(requirement of an invasive procedure such as tube thoracostomy for cure) and
empyema (pus into the pleural space). Other causes of pleural effusions were
determined by well-established clinical criteria.
Measurement of biomarkers
Assays for the four inflammatory markers, namely CRP, sTREM, PCT and LBP,
were performed on the stored cell-free supernatants of pleural fluid samples. All
samples were tested in random order and by technicians who were blinded to
the clinical diagnosis of patients at the end of the study.

Pleural fluid CRP was measured using a particle-enhanced immunoturbidimetric
assay (CRPLX, Tina-quant, Roche Diagnostics GmbH, Mannheim, Germany)
on Roche automated clinical chemistry analyzers. The sTREM-1 concentrations
in pleural fluid were measured by a sandwich ELISA (DuoSet ELISA, R&D
Systems Europe, Abingdon, UK), PCT by a two-site immunoluminometric assay
(Liaison Brahms PCT, DiaSorin, Saluggia, Italy) and LBP with a solid-phase,
enzyme-labeled chemiluminescent immunometric assay (Immulite 2000 LBP,
Siemens, Los Angeles, USA), according to the manufacturer’s instructions. The
samples for sTREM-1 were assayed in duplicate.
Data analysis
Continuous data are presented as medians (quartiles). Between-group
comparisons were performed with Kruskal-Wallis tests and Dunn’s multiple
comparison post-hoc tests for continuous variables, and Chi square tests with
post-hoc analysis of adjusted residuals for categorical variables. Receiver-
operating characteristic (ROC) curves were constructed to illustrate the
predictive value of various cutoff points of CRP, sTREM-1, PCT and LBP. The
point with the largest sum of sensitivity and specificity was chosen as a
threshold. We compared the performances of the four pleural fluid inflammatory
biomarkers for discriminating infectious (bacterial and mycobacterial) vs. non-
infectious effusions, tuberculosis vs. malignancy, PPE vs. non-PPE, and CPPE
vs. UPPE. Measures of test efficacy included sensitivity, specificity and
likelihood ratios. To adjust for confounders, a backward conditional step-wise
logistic regression model estimated the simultaneous impact of each biomarker,
along with other biochemical fluid findings, in the prediction of non-purulent
CPPE. The level of significance was set at P<0.05 using two-tailed tests. Data

were analyzed using a statistical software package (SPSS version 13.0; SPSS
Inc, Chicago, IL).
RESULTS
Pleural fluid levels of the biomarkers
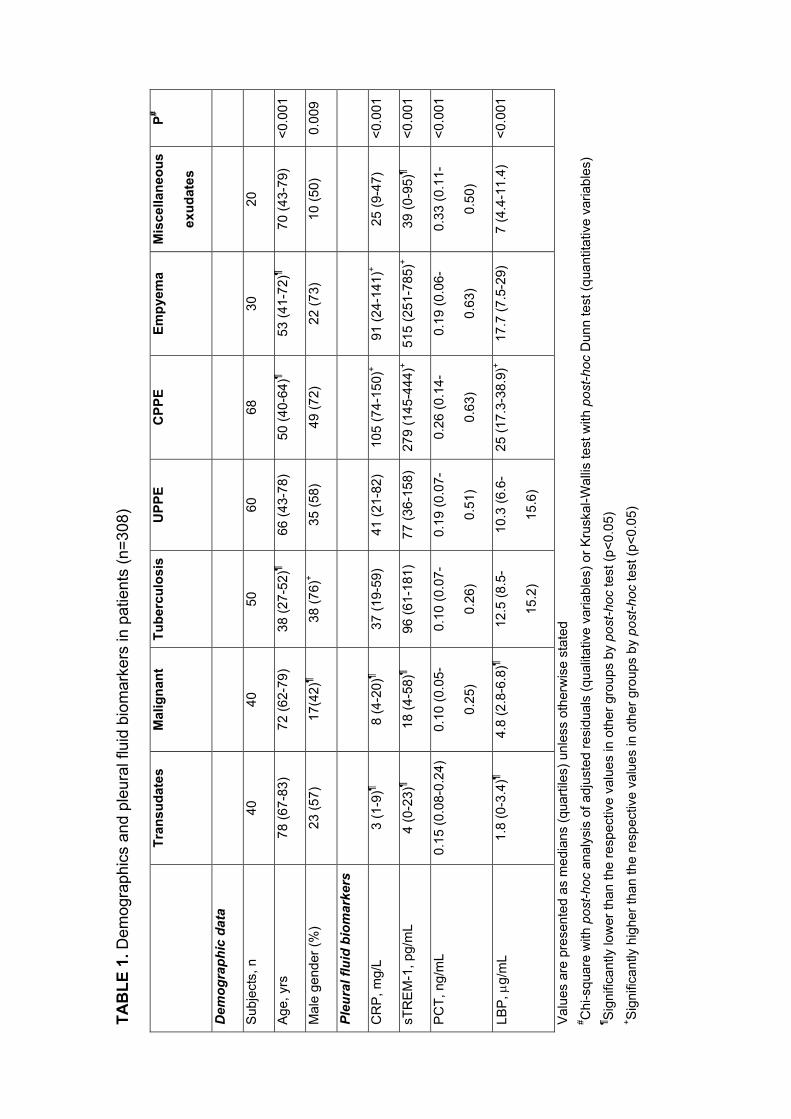
The demographic data and the median pleural fluid levels of CRP, sTREM-1,
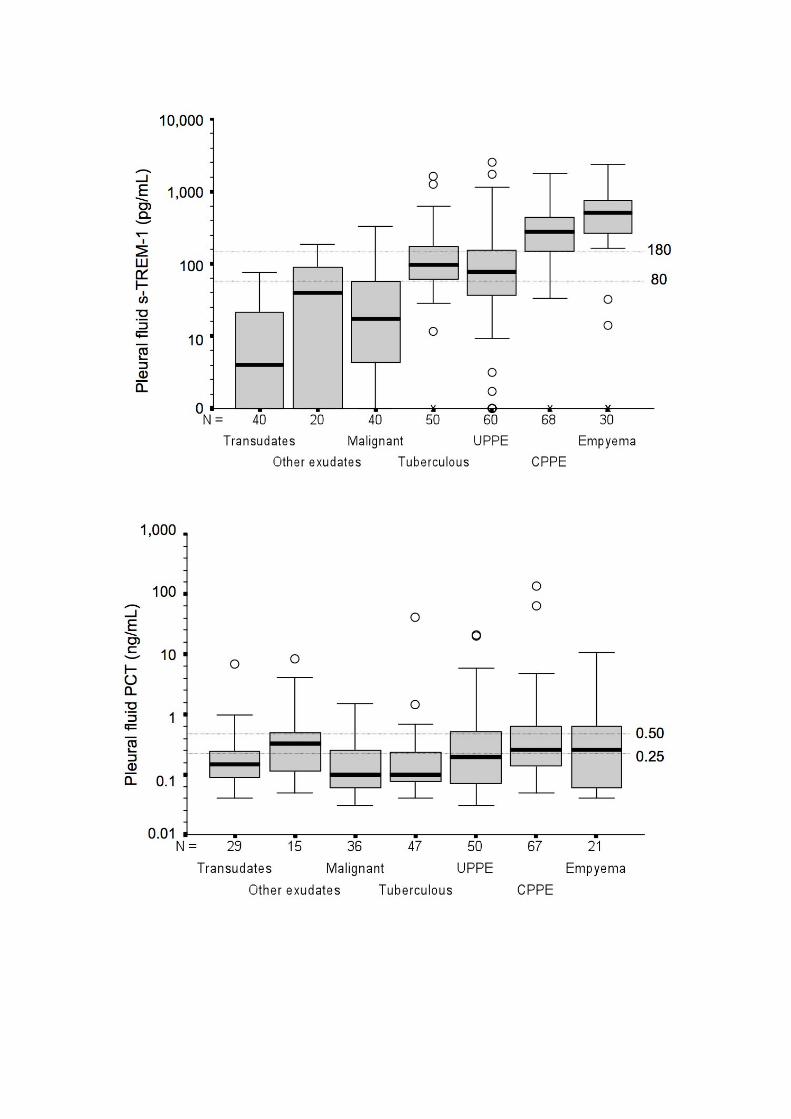
PCT and LBP in each of the 7 groups are shown in table 1. The levels of CRP,
sTREM-1 and LBP were significantly higher in the pleural fluid from patients
with CPPE and lower in the transudate and malignant groups (fig. 1). The levels
of PCT showed the same trend but with a large overlap of values.
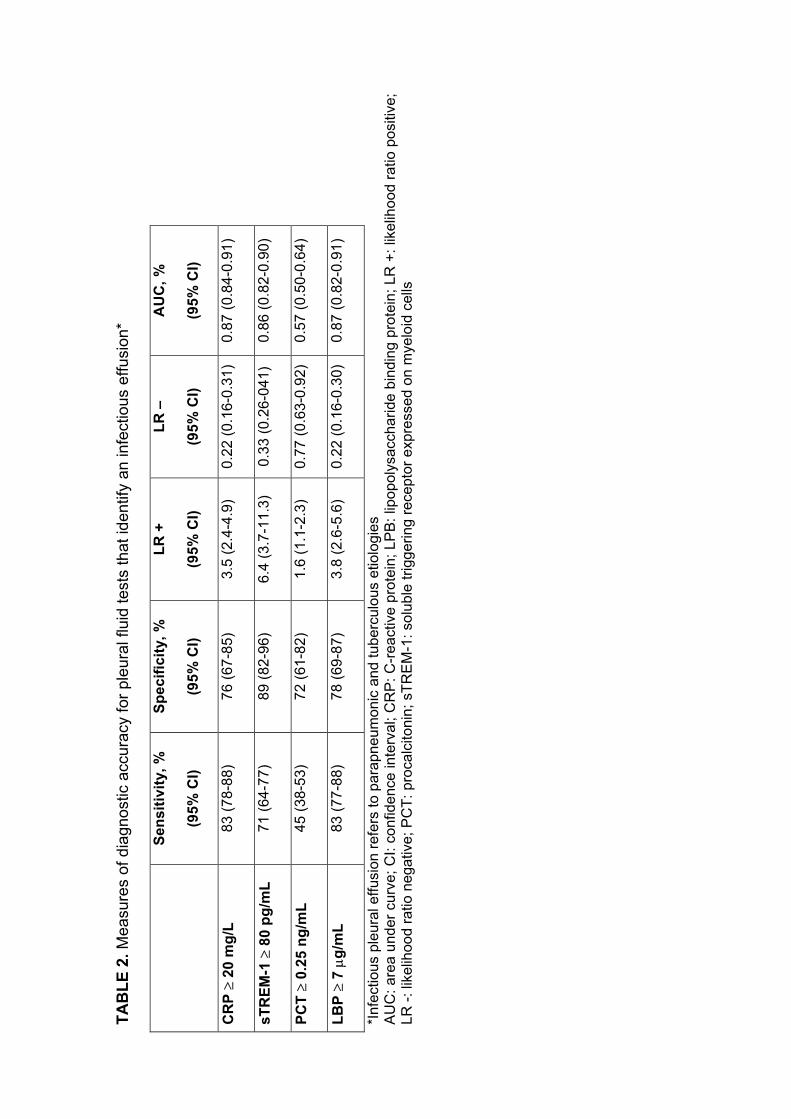
Discriminating infectious from non-infectious effusions
The thresholds of the four biomarkers that best discriminate between infectious
(PPE and tuberculosis) and non-infectious effusions were as follows: CRP ≥ 20
mg/L, sTREM-1 ≥ 80 pg/mL, PCT ≥ 0.25 ng/mL and LPB ≥ 7 µg/mL (table 2).
While PCT had no discriminative properties (AUC = 0.57), sTREM-1 (AUC =
0.86), CRP and LBP (both AUCs = 0.87) showed good abilities to separate
infectious from non-infectious states. However, the overlapping 95% confidence
interval values for these three biomarkers indicated that no single one could be
identified as being superior to the others.
Discriminating tuberculous from malignant effusions
The AUCs for each pleural fluid biomarker (calculated with the cutoffs described
above) in differentiating between tuberculous and malignant effusions are
displayed in table 3. In contrast to the PCT (AUC = 0.52), which was not useful,
CRP, sTREM-1 and LPB had better AUCs that were similar in value (all AUCs >
0.80).

Discriminating PPE from other etiologies
In discriminating PPE from the other etiologies, the respective AUCs generated
from the use of CRP, sTREM-1, PCT and LBP were 0.83, 0.79, 0.63 and 0.80
(table 4). Therefore, PCT lacked efficacy as a marker of PPE.
Discriminating UPPE from non-purulent CPPE
Table 5 shows the diagnostic accuracies of the four biomarkers in the
differentiation of UPPE and non-purulent CPPE at the optimum cutoff points.
They were compared with the performances of pH, glucose and LDH at the
cutoff values recommended in the literature. All parameters, with the exception
of PCT (AUC = 0.59), performed well in discriminating between groups (AUCs
about 0.80). Nevertheless, the overlap of the 95% CI values for the AUC and
likelihood ratios did not allow for a selection of a superior test that clearly had
the highest discriminative properties for non-purulent CPPE.
When all the variables listed in table 5 were entered into a multivariate stepwise
logistic regression model, glucose (adjusted likelihood ratio (LR) + 5.2, 95% CI
2.1-8; adjusted LR - 0.10, 95% CI 0.02-0.44), LBP (adjusted LR + 4.6, 95% CI
2.1-7.1; adjusted LR – 0.14, 95% CI 0.04-0.44) and CRP (adjusted LR + 3.4,
95% CI 1.4-6.1; adjusted LR - 0.22, 95% CI 0.07-0.69) were the parameters
that best discriminated non-purulent CPPE from UPPE. This model had an AUC
of 0.88 (95% CI 0.82-0.94).

DISCUSSION
A number of biochemical markers of bacterial infection have been identified,
though the validity of their measurement in pleural fluid remains unclear. Our
findings in a large series of patients provide data on the value and accuracy of
some of these biomarkers (i.e., CRP, sTREM and LBP) measured in the pleural
fluid to diagnose infectious effusions, particularly from CPPE.
C-reactive protein
CRP, an acute-phase reactant released from the liver, is a common diagnostic
test within hospital laboratories for the screening or monitoring of infections and
non-infectious inflammatory diseases. CRP levels have been studied in pleural
fluid and have been found to be higher in PPE than in other types of exudative
or transudative effusions [5-7]. We showed that a pleural fluid CRP level above
80 mg/L argues for the presence of a PPE (LR + = 7.4), whereas CRP levels
below 20 mg/L are a strong indicator against an infectious pleural effusion,
whether of bacterial or mycobacterial nature (LR - = 0.22). Indeed, a number of
studies provide support for the use of CRP as a diagnostic aid in tuberculous
pleuritis; low pleural CRP levels (< 30 mg/L) make this diagnosis unlikely while
being more indicative of a malignancy in patients with exudates [8-10]. In
addition, our findings complement the scarce previous literature on the
application of CRP for identifying CPPE [11-12]. This biomarker emerged as an
independent predictor of non-purulent CPPE in the multivariate analysis,
although its adjusted LR + was lower than those for glucose and LBP.
Soluble triggering receptor expressed on myeloid cells-1

TREM-1, a receptor of the immunoglobulin superfamily, amplifies the
inflammatory response through its over-expression and subsequent activation
of neutrophils and monocytes/macrophages in response to microbial products.
TREM-1 is also shed by the membrane of activated phagocytes and can be
found in a soluble form in body fluids.
Few studies have investigated the clinical significance of sTREM-1 in pleural
effusions [13-18]. All included small sample sizes (45 to 109 patients),
measured sTREM-1 by ELISA or other techniques and found that patients with
PPE or empyema exhibited the highest pleural fluid concentrations of this
biomarker. However, there were discrepancies regarding its discriminative
properties as well as its optimal cutoff point. For example, in one study, a
sTREM-1 cutoff value of 768.1 pg/mL had a sensitivity of 86%, specificity of
93% and AUC of 0.93 in differentiating 23 bacterial effusions (including 17
empyemas) from 88 effusions with other etiologies [17]. In contrast, our findings
yielded an AUC of 0.79 for identifying PPE at the best cutoff of 80 pg/mL. The
over-representation of empyemas in the first series (74% vs. 19% of PPE) may
help explain these discrepancies, while different sTREM-1 concentrations and
cutoffs probably reflect the lack of standardization of the ELISA technique. In a
second study, a cutoff value of 114 pg/mL for pleural sTREM-1 achieved a
sensitivity of 94% and a specificity of 93% (AUC = 0.966) in differentiating 17
empyemas from 72 pleural effusions of other etiologies [18]. We think there is
no point in trying to identify empyema by measuring sTREM-1, because this
diagnosis is easily achieved by simple inspection. Finally, in another study,
pleural sTREM-1 at a cutoff value of 374 pg/mL yielded a sensitivity of 93.8%, a
specificity of 90.9% and an AUC of 0.93 in discriminating bacterial pleural

infection (n = 22) from tuberculous pleuritis (n = 16) [14]. Based on our results
(sensitivity 80%, specificity 56% at a cutoff of 180 pg/mL, AUC 0.64; data not
shown), we do not support the use of sTREM-1 measurements for this
particular indication. In addition, the ability to differentiate between PPE and
tuberculous effusions does not normally pose a problem in clinical practice.
Taken together, our data indicate that pleural fluid levels of sTREM-1 may be
accurate enough to help differentiate between infectious and non-infectious
effusions (AUC = 0.86). Notably, two studies demonstrated that the levels of
sTREM-1 in pleural fluid greatly exceeded those in serum [16-17], suggesting
that recruited inflammatory cells in the pleural space produce the sTREM-1
locally.
Procalcitonin
PCT, an acute-phase hormokine, has been reported to be more accurate for
differentiating between bacterial infections and non-infectious causes of
inflammation than other biomarkers [19]. Serum levels of PCT increase in
severe bacterial infections. A PCT serum concentration of 0.5 ng/mL has been
recommended in clinical practice guidelines to rule out bacterial infection [1].
There is little useful information on PCT levels in pleural fluid. One study found
that the median pleural fluid PCT levels were significantly higher in 26 patients
with bacterial infection (0.67 ng/mL) than in 80 malignant effusions (0.14
ng/mL), 33 cardiac effusions (0.06 ng/mL) and 17 viral effusions (0.007 ng/mL)
[20]. However, the authors did not fully describe the diagnostic criteria of the
study population or calculate any discriminatory cutoff values for PCT. A recent
investigation showed that pleural fluid PCT levels greater than 0.18 ng/mL

discriminated 45 PPE from 37 non-PPE with a sensitivity of 67%, a specificity of
77% and an AUC of 0.752 [21]. Interestingly, serum PCT had better diagnostic
accuracy than pleural PCT and both correlated with the severity of pneumonia.
Our study failed to demonstrate any firm relationship between pleural fluid
levels of PCT and the specific cause of the pleural effusion. These
disappointing results could be explained by considering PCT as a potential
biomarker of a state or a syndrome (e.g., severe sepsis) rather than an indicator
of a disease. In fact, some studies have reported that, as a marker of bacterial
infection, PCT was no better than CRP [22]. However, in itself, it was
considered quite useful as a marker regarding the severity of infection.
Lipopolysaccharide-binding protein
LBP, a glycosylated 58-kDa protein produced predominantly in hepatocytes,
has recently been described as a promising novel diagnostic marker of bacterial
infection [22]. To the best of our knowledge, pleural fluid LBP concentrations
have not been previously evaluated. We observed that pleural fluid LBP levels
of less than 7 µg/mL substantially reduced the probability of an infectious
etiology (LR – 0.22). This may have implications, for instance, in the differential
diagnosis of tuberculous and malignant effusions. Moreover, a LBP greater than
17 µg/mL conferred an adjusted LR + of 4.6 in identifying non-purulent CPPE, a
performance which was similar to the currently used tests, such as glucose or
pH.
Selecting tests
The choice of one among different diagnostic tests depends not only on its
accuracy, but also on the financial costs and technical considerations. The cost
of one measurement for CRP, sTREM-1, PCT and LBP is about 1, 4, 14 and 6
euros, respectively. On the other hand, CRP and LBP are less labor-intensive
than PCT and sTREM-1 measurements. Therefore, given the lack of utility of
measuring PCT and the similarity in the accuracy of the other three tests, cost-
effectiveness and technical reasons would argue for the diagnostic use of CRP,
if a selection needs to be done.
Study limitations
This study should be interpreted in the context of certain limitations. First, the
use of physician judgment as the gold standard for indicating the need for
pleural drainage in CPPE may have resulted in patients’ misclassifications, thus
compromising the diagnostic accuracy of the pleural fluid tests. However,
satisfactory correction for the bias introduced by an imperfect gold standard
does not exist. Second, except for the identification of non-purulent CPPE, we
have not compared the advantages of the new tests over alternative tests; that
is, we have not answered the question of whether the new tests are better than
the current diagnostic standard. Nevertheless, our primary goal was just to
determine whether the new biomarkers accurately and reliably identified cases
of obvious infectious pathology in a well-defined population. Whether these
biomarkers offer additional information beyond that which is normally available
is a matter of speculation. Finally, our findings, which are based on a
retrospective analysis, deserve further prospective evaluation in an independent
validation cohort.

CONCLUSIONS
In summary, CRP, sTREM-1 and LBP measurements may be useful as an
additional tool in the assessment of pleural effusions to support the differential
diagnosis between infectious and non-infectious etiologies. However, in the
most challenging clinical setting, such as the identification of a non-purulent
PPE needing a tube thoracostomy, the accuracy of the three biomarkers is
comparable with that of the classical pleural fluid biochemistries, such as pH,
glucose or LDH. For this reason, we predict that even if these new tests are
adopted, they will not have a major impact on clinical practice.

REFERENCES
1. Christ-Crain M, Müller B. Biomarkers in respiratory tract infections:
diagnostic guides to antibiotic prescription, prognostic markers and
mediators. Eur Respir J 2007; 30: 556-573.
2. Rahman NM, Davies RJO. Effusions from infections: parapneumonic
effusion and empyema. In: Light RW, Gary Lee YC, eds. Textbook of
Pleural Diseases. Hodder Arnold, London, 2008; pp. 341-366.
3. Herzum I, Renz H. Inflammatory markers in SIRS, sepsis and septic
shock. Curr Med Chem 2008; 15: 581-587.
4. Sharif O, Knapp S. From expression to signaling: roles of TREM-1 and
TREM-2 in innate immunity and bacterial infection. Immunobiology 2008;
213: 701-713.
5. Yilmaz Turay U, Yildirim Z, Türköz Y, et al. Use of pleural fluid C-reactive
protein in diagnosis of pleural effusions. Respir Med 2000; 94: 432-435.
6. García-Pachon E, Llorca I. Diagnostic value of C-reactive protein in
exudative pleural effusions. Eur J Intern Med 2002; 13: 246-249.
7. Kiropoulos TS, Kostikas K, Oikonomidi S, et al. Acute phase markers for
the differentiation of infectious and malignant pleural effusions. Respir
Med 2007; 101: 910-918.
8. Chierakul N, Kanitsap A, Chaiprasert A, Viriyataveekul R. A simple C-
reactive protein measurement for the differentiation between tuberculous
and malignant pleural effusion. Respirology 2004; 9: 66-69.
9. Garcia-Pachon E, Soler MJ, Padilla-Navas I, Romero V, Shum C. C-
reactive protein in lymphocytic pleural effusions: a diagnostic aid in
tuberculous pleuritis. Respiration 2005; 72: 486-489.
10. Daniil ZD, Zintzaras E, Kiropoulos T, et al. Discrimination of exudative
pleural effusions based on multiple biological parameters. Eur Respir J
2007; 30: 957-964.
11. Chen SC, Chen W, Hsu WH, Yu YH, Shih CM. Role of pleural fluid C-
reactive protein concentration in discriminating uncomplicated
parapneumonic pleural effusions from complicated parapneumonic
effusion and empyema. Lung 2006; 184: 141-145.
12. Porcel JM, Galindo C, Esquerda A, et al. Pleural fluid interleukin-8 and
C-reactive protein for discriminating complicated non-purulent from
uncomplicated parapneumonic effusions. Respirology 2008; 13: 58-62.
13. Liu CL, Hsieh WY, Wu CL, Kuo HT, Lu YT. Triggering receptor
expressed on myeloid cells-1 in pleural effusions: a marker of
inflammatory disease. Respir Med 2007; 101: 903-909.
14. Chan MC, Chang KM, Chao WC, et al. Evaluation of a new inflammatory
molecule (triggering receptor expressed on myeloid cells-1) in the
diagnosis of pleural effusion. Respirology 2007; 12: 333-338.
15. Kim JH, Park EY, Kim WH, et al. Soluble triggering receptor expressed
on myeloid cells-1: role in the diagnosis of pleural effusions. Tuberc
Respir Dis 2007; 62: 290-298.
16. Sim YS, Lee JH, Chun EM, Chang JH. Diagnostic utility of pleural fluid
soluble triggering receptor expressed on myeloid cells 1 in patients with
exudative pleural effusion. Tuberc Respir Dis 2007; 62: 499-505.
17. Huang LY, Shi HZ, Liang QL, Wu YB, Qin XJ, Chen YQ. Expression of
soluble triggering receptor expression on myeloid cells-1 in pleural
effusion. Chin Med J (Engl) 2008; 121: 1656-1661.
18. Bishara J, Goldberg E, Ashkenazi S, et al. Soluble triggering receptor
expressed on myeloid cells-1 for diagnosing empyema. Ann Thorac Surg
2009; 87: 251-254.
19. Becker KL, Snider R, Nylen ES. Procalcitonin assay in systemic
inflammation, infection, and sepsis: clinical utility and limitations. Crit
Care Med 2008; 36: 941-952.
20. Topolcan O, Holubec L, Polivkova V, et al. Tumor markers in pleural
effusions. Anticancer Res 2007; 27: 1921-1924.
21. Lin MC, Chen YC, Wu JT, Ko YC, Wang CC. Diagnostic and prognostic
values of pleural fluid procalcitonin in parapneumonic pleural effusions.
Chest 2009 Mar 2. [Epub ahead of print]
22. Gaïni S, Koldkjaer OG, Pedersen C, Pedersen SS. Procalcitonin,
lipopolysaccharide-binding protein, interleukin-6 and C-reactive protein in
community-acquired infections and sepsis: a prospective study. Crit Care
2006; 10: R53.

FIGURE LEGENDS
Figure 1. Box plots of pleural fluid CRP (A), sTREM-1 (B), PCT (C) and LBP
(D) concentrations in different etiologies of pleural effusion. Pleural sTREM-1
and PCT levels are plotted on a log scale. Horizontal dotted lines represent
cutoff values with discriminatory properties.

TAB
LE 1
. Dem
ogra
phic
s an
d pl
eura
l flu
id b
iom
arke
rs in
pat
ient
s (n
=308
)
Tr
ansu
date
s M
alig
nant
Tu
berc
ulos
is
UPP
E
CPP
E
Empy
ema
M
isce
llane
ous
exud
ates
P#
Dem
ogra
phic
dat
a
Sub
ject
s, n
40
40
50
60
68
30
20
Age
, yrs
78
(67-
83)
72 (6
2-79
) 38
(27-
52)
66 (4
3-78
) 50
(40-
64)
53 (4
1-72
)¶ 70
(43-
79)
<0.0
01
Mal
e ge
nder
(%)
23 (5
7)
17(4
2)
38 (7
6)+
35 (5
8)
49 (7
2)
22 (7
3)
10 (5
0)
0.00
9
Pleu
ral f
luid
bio
mar
kers
CR
P, m
g/L
3 (1
-9)
8 (4
-20)
¶ 37
(19-
59)
41 (2
1-82
) 10
5 (7
4-15
0)+
91 (2
4-14
1)+
25 (9
-47)
<0
.001
sTR
EM
-1, p
g/m
L 4
(0-2
3)
18 (4
-58)
¶ 96
(61-
181)
77
(36-
158)
27
9 (1
45-4
44)+
515
(251
-785
)+ 39
(0-9
5)
<0.0
01
PC
T, n
g/m
L 0.
15 (0
.08-
0.24
) 0.
10 (0
.05-
0.25
)
0.10
(0.0
7-
0.26
)
0.19
(0.0
7-
0.51
)
0.26
(0.1
4-
0.63
)
0.19
(0.0
6-
0.63
)
0.33
(0.1
1-
0.50
)
<0.0
01
LBP,
µg/
mL
1.8
(0-3
.4)
4.8
(2.8
-6.8
)¶ 12
.5 (8
.5-
15.2
)
10.3
(6.6
-
15.6
)
25 (1
7.3-
38.9
)+ 17
.7 (7
.5-2
9)
7 (4
.4-1
1.4)
<0
.001
Val
ues
are
pres
ente
d as
med
ians
(qua
rtile
s) u
nles
s ot
herw
ise
stat
ed
# Chi
-squ
are
with
pos
t-hoc
ana
lysi
s of
adj
uste
d re
sidu
als
(qua
litat
ive
varia
bles
) or K
rusk
al-W
allis
test
with
pos
t-hoc
Dun
n te
st (q
uant
itativ
e va
riabl
es)
¶ Sig
nific
antly
low
er th
an th
e re
spec
tive
valu
es in
oth
er g
roup
s by
pos
t-hoc
test
(p<0
.05)
+ S
igni
fican
tly h
ighe
r tha
n th
e re
spec
tive
valu
es in
oth
er g
roup
s by
pos
t-hoc
test
(p<0
.05)

CP
PE
: co
mpl
icat
ed p
arap
neum
onic
effu
sion
; C
RP
: C
-reac
tive
prot
ein;
LP
B:
lipop
olys
acch
arid
e bi
ndin
g pr
otei
n; P
CT:
pro
calc
itoni
n; s
TRE
M-1
: so
lubl
e
trigg
erin
g re
cept
or e
xpre
ssed
on
mye
loid
cel
ls; U
PP
E: u
ncom
plic
ated
par
apne
umon
ic e
ffusi
on
TAB
LE 2
. Mea
sure
s of
dia
gnos
tic a
ccur
acy
for p
leur
al fl
uid
test
s th
at id
entif
y an
infe
ctio
us e
ffusi
on*
Se
nsiti
vity
, %
(95%
CI)
Spec
ifici
ty, %
(95%
CI)
LR +
(95%
CI)
LR –
(95%
CI)
AU
C, %
(95%
CI)
CR
P ≥
20 m
g/L
83 (7
8-88
) 76
(67-
85)
3.5
(2.4
-4.9
) 0.
22 (0
.16-
0.31
) 0.
87 (0
.84-
0.91
)
sTR
EM-1
≥ 8
0 pg
/mL
71 (6
4-77
) 89
(82-
96)
6.4
(3.7
-11.
3)
0.33
(0.2
6-04
1)
0.86
(0.8
2-0.
90)
PCT ≥
0.25
ng/
mL
45 (3
8-53
) 72
(61-
82)
1.6
(1.1
-2.3
) 0.
77 (0
.63-
0.92
) 0.
57 (0
.50-
0.64
)
LBP ≥
7 µg
/mL
83
(77-
88)
78 (6
9-87
) 3.
8 (2
.6-5
.6)
0.22
(0.1
6-0.
30)
0.87
(0.8
2-0.
91)
*Inf
ectio
us p
leur
al e
ffusi
on re
fers
to p
arap
neum
onic
and
tube
rcul
ous
etio
logi
es
AU
C: a
rea
unde
r cur
ve; C
I: co
nfid
ence
inte
rval
; CR
P: C
-rea
ctiv
e pr
otei
n; L
PB
: lip
opol
ysac
char
ide
bind
ing
prot
ein;
LR
+: l
ikel
ihoo
d ra
tio p
ositi
ve;
LR -:
like
lihoo
d ra
tio n
egat
ive;
PC
T: p
roca
lcito
nin;
sTR
EM
-1: s
olub
le tr
igge
ring
rece
ptor
exp
ress
ed o
n m
yelo
id c
ells

TAB
LE 3
. Dia
gnos
tic a
ccur
acy
of in
divi
dual
ple
ural
flui
d te
sts
for i
dent
ifyin
g tu
berc
ulou
s as
com
pare
d w
ith m
alig
nant
effu
sion
s
Se
nsiti
vity
, %
(95%
CI)
Spec
ifici
ty, %
(95%
CI)
LR +
(95%
CI)
LR –
(95%
CI)
AU
C, %
(95%
CI)
CR
P ≥
20 m
g/L
74 (6
1-87
) 77
(63-
92)
3.3
(1.8
-6)
0.34
(0.2
0-0.
55)
0.81
(0.7
2-0.
90)
sTR
EM-1
≥ 8
0 pg
/mL
62 (4
7-76
) 85
(73-
97)
4.1
(1.9
-8.9
) 0.
45 (0
.31-
0.65
) 0.
83 (0
.74-
0.92
)
PCT ≥
0.25
ng/
mL
25
(12-
39)
76 (6
0-91
) 1
(0.5
-2.2
) 0.
98 (0
.77-
1.26
) 0.
52 (0
.39-
0.65
)
LBP ≥
7 µg
/mL
79
(67-
92)
77 (6
3-92
) 3.
5 (1
.9-6
.4)
0.27
(0.1
5-0.
48)
0.83
(0.7
4-0.
92)
AU
C: a
rea
unde
r cur
ve; C
I: co
nfid
ence
inte
rval
; CR
P: C
-rea
ctiv
e pr
otei
n; L
PB
: lip
opol
ysac
char
ide
bind
ing
prot
ein;
LR
+: l
ikel
ihoo
d ra
tio p
ositi
ve;
LR -:
like
lihoo
d ra
tio n
egat
ive;
PC
T: p
roca
lcito
nin;
sTR
EM
-1: s
olub
le tr
igge
ring
rece
ptor
exp
ress
ed o
n m
yelo
id c
ells

TAB
LE 4
. Dia
gnos
tic a
ccur
acy
of in
divi
dual
ple
ural
flui
d te
sts
for i
dent
ifyin
g pa
rapn
eum
onic
effu
sion
s
Se
nsiti
vity
, %
(95%
CI)
Spec
ifici
ty, %
(95%
CI)
LR +
(95%
CI)
LR –
(95%
CI)
AU
C, %
(95%
CI)
CR
P ≥
80 m
g/L
49 (4
1-57
) 93
(89-
98)
7.4
(4-1
3.8)
0.
54 (0
.46-
0.64
) 0.
83 (0
.78-
0.87
)
sTR
EM-1
≥ 8
0 pg
/mL
73 (6
6-81
) 72
(64-
79)
2.6
(2-3
.4)
0.37
(0.2
8-0.
49)
0.79
(0.7
4-0.
84)
PCT ≥
0.25
ng/
mL
52 (4
3-60
) 73
(64-
81)
1.9
(1.4
-2.6
) 0.
66 (0
.54-
0.81
) 0.
63 (0
.56-
0.70
)
LBP ≥
17 µ
g/m
L
49 (4
0-57
) 90
(84-
95)
4.7
(2.8
-7.8
) 0.
57 (0
.49-
0.68
) 0.
80 (0
.75-
0.85
)
AU
C: a
rea
unde
r cur
ve; C
I: co
nfid
ence
inte
rval
; CR
P: C
-rea
ctiv
e pr
otei
n; L
PB
: lip
opol
ysac
char
ide
bind
ing
prot
ein;
LR
+: l
ikel
ihoo
d ra
tio p
ositi
ve;
LR -:
like
lihoo
d ra
tio n
egat
ive;
PC
T: p
roca
lcito
nin;
sTR
EM
-1: s
olub
le tr
igge
ring
rece
ptor
exp
ress
ed o
n m
yelo
id c
ells

TAB
LE 5
. Ope
ratin
g ch
arac
teris
tics
of p
leur
al fl
uid
test
s fo
r dis
tingu
ishi
ng n
on-p
urul
ent C
PP
E fr
om U
PP
E
Se
nsiti
vity
, %
(95%
CI)
Spec
ifici
ty, %
(95%
CI)
LR +
(95%
CI)
LR –
(95%
CI)
AU
C, %
(95%
CI)
pH ≤
7.2
0 57
(44-
70)
93 (8
5-10
0)
8.1
(3.1
-21.
5)
0.46
(0.3
4-0.
62)
0.83
(0.7
5-0.
91)
Glu
cose
≤ 6
0 m
g/dL
59
(46-
71)
90 (8
2-98
) 5.
9 (2
.7-1
2.9)
0.
46 (0
.34-
0.62
) 0.
80 (0
.72-
0.88
)
LDH
≥ 1
,000
U/L
* 75
(63-
86)
82 (7
1-92
) 4.
1 (2
.3-7
.1)
0.31
(0.2
0-0.
48)
0.82
(0.7
5-0.
90)
CR
P ≥
80 m
g/L
68 (5
6-79
) 75
(63-
87)
2.7
(1.7
-4.3
) 0.
43 (0
.30-
0.63
) 0.
81 (0
.63-
0.88
)
sTR
EM-1
≥ 1
80 p
g/m
L 72
(61-
83)
82 (7
1-92
) 3.
9 (2
.3-6
.8)
0.34
(0.2
3-0.
51)
0.79
(0.7
0-0.
86)
PCT ≥
0.50
ng/
mL
33 (2
1-45
) 72
(59-
86)
1.2
(0.7
-2.1
) 0.
93 (0
.73-
1.17
) 0.
59 (0
.49-
0.70
)
LBP ≥
17 µ
g/m
L
76 (6
4-87
) 81
(70-
92)
4 (2
.3-6
.9)
0.30
(0.1
9-0.
47)
0.84
(0.7
6-0.
91)
*In
our l
abor
ator
y, th
e no
rmal
upp
er li
mit
for s
erum
LD
H is
470
U/L
A
UC
: are
a un
der c
urve
; CI:
conf
iden
ce in
terv
al; C
RP
: C-r
eact
ive
prot
ein;
LD
H: l
acta
te d
ehyd
roge
nase
; LP
B: l
ipop
olys
acch
arid
e bi
ndin
g pr
otei
n;
LR +
: lik
elih
ood
ratio
pos
itive
; LR
-: l
ikel
ihoo
d ra
tio n
egat
ive;
PC
T: p
roca
lcito
nin;
sTR
EM
-1: s
olub
le tr
igge
ring
rece
ptor
exp
ress
ed o
n m
yelo
id
cells